the Creative Commons Attribution 4.0 License.
the Creative Commons Attribution 4.0 License.
 | 26 Mar 2024
Solar FTIR measurements of NOx vertical distributions – Part 1: First observational evidence of a seasonal variation in the diurnal increasing rates of stratospheric NO2 and NO
Pinchas Nürnberg
Markus Rettinger
Observations of nitrogen dioxide (NO2) and nitrogen oxide (NO) in the stratosphere are relevant to understand long-term changes and variabilities in stratospheric nitrogen oxide (NOx) and ozone (O3) concentrations. Due to the versatile role of NO2 and NO in stratospheric O3 photochemistry, they are important for recovery and build-up of O3 holes in the stratosphere and therefore can indirectly affect human life. Thus, we present in this work the evaluation of NO2 and NO stratospheric partial columns (> 16 km altitude) retrieved from ground-based Fourier-transform infrared (FTIR) measurements of over 25 years at Zugspitze (47.42° N, 10.98° E; 2964 m a.s.l.) and 18 years at Garmisch (47.47° N, 11.06° E; 745 m a.s.l.), Germany. The obtained stratospheric columns are only weakly influenced by tropospheric pollution and show only a very small bias of 2.5 ± 0.2 % when comparing NO2 above Zugspitze and Garmisch. Stratospheric columns of both NO2 and NO show a diurnal increase that depends on local solar time (LST). We quantified this behavior by calculating diurnal increasing rates. Here, we find mean values for the NO2 diurnal increasing rate of (0.89 ± 0.14) × 1014 and (0.94 ± 0.14) × 1014 cm−2 h−1 at Zugspitze and Garmisch, respectively. The mean NO morning diurnal increasing rate above Zugspitze is found to be (1.42 ± 0.12) × 1014 cm−2 h−1. Regarding the seasonal dependency of these increasing rates, for the first time, we were able to experimentally detect a significant seasonal variation in both NO2 diurnal increasing rates and NO morning diurnal increasing rates with a maximum of (1.13 ± 0.04) × 1014 cm−1 h−1 for NO2 and (1.76 ± 0.25) × 1014 cm−1 h−1 for NO in September and a minimum of (0.71 ± 0.18) × 1014 cm−1 h−1 in December for NO2 and a minimum of (1.18 ± 0.41) × 1014 cm−1 h−1 in November for NO. This similar behavior may be explained by the interconnection of both species in stratospheric photochemistry. The outcome of this work is a retrieval and analysis strategy of FTIR data for NOx stratospheric columns, which can help to further validate photochemical models or improve satellite validations. The first use of this data set is shown in the companion paper (Nürnberg et al., 2023) wherein experiment-based NOx scaling factors describing the diurnal increase in the retrieved partial columns are extracted and recently published model-based scaling factors are validated.
Please read the corrigendum first before continuing.
-
Notice on corrigendum
The requested paper has a corresponding corrigendum published. Please read the corrigendum first before downloading the article.
-
Article
(3830 KB)
- Corrigendum
- Companion paper
-
Supplement
(3222 KB)
-
The requested paper has a corresponding corrigendum published. Please read the corrigendum first before downloading the article.
- Article
(3830 KB) - Full-text XML
- Corrigendum
- Companion paper
-
Supplement
(3222 KB) - BibTeX
- EndNote


Reactive nitrogen oxides (NOx) as nitrogen monoxide (NO) and nitrogen dioxide (NO2) play a crucial role in atmospheric photochemistry both in the troposphere and in the stratosphere (Crutzen, 1970). In the tropospheric boundary layer, the NOx origin is mainly anthropogenic from the combustion of fuels and the use of nitrogen-based fertilizers. To a lower extent, biomass burning and biological processes in soils contribute to NOx production (Crutzen, 1979). In the upper troposphere near the tropopause, NOx concentration is mainly controlled by lightning events and air traffic (Grewe et al., 2001). As a precursor to several harmful air pollutants, e.g., ozone (O3) and nitric acid (HNO3), the build-up of NOx in the troposphere directly affects human health (World Health Organization Regional Office for Europe, 2003). In the stratosphere, NOx is produced by the photolysis of nitrous oxide (N2O), which has been transported through the tropopause and is part of the biospheric nitrogen cycle (Johnston, 1992). As an important part of the O3-destroying catalytic cycle, NOx controls the abundance of O3 in the stratosphere (Murphy et al., 1993). Consequently, since the Montreal Protocol was passed in 1987 with the aim to protect the stratospheric O3 layer, the monitoring of both O3 and NOx had become the focus of attention of much research (Tripp, 1987).
The global distributions of atmospheric NO2 and NO have been monitored by satellite missions since 1967 in various operational modes (Godin-Beekmann, 2010; Rusch, 1973): NOx data products are available from nadir-looking instruments like TROPOMI, GOME, and SCIAMACHY (Griffin et al., 2019; Richter and Burrows, 2002; Sierk et al., 2006); limb-viewing instruments like MIPAS and OSIRIS (Funke et al., 2005; Haley et al., 2004); and solar occultation measurements namely ACE-FTS and SAGE III/ISS (Fussen et al., 2005; Cisewski et al., 2014). The validation and correction of these data with ground-based measurements are still an ongoing process which has significantly reduced statistical and systematic errors between different satellite and ground-based measurements in the past few decades (Van Geffen et al., 2022; Verhoelst et al., 2021; Kerzenmacher et al., 2008; Wetzel et al., 2007; Brohede et al., 2007; Heue et al., 2005). However, when comparing data (satellite vs. ground) which are in general recorded during different times of the day, a major problem arises: there is a strong diurnal variation in stratospheric NOx due to a complex photochemistry (Solomon et al., 1986), so biases arise just due to time mismatch.
Facing this mismatch, a common method is the use of correction factors calculated from photochemical models to extrapolate retrieved data to the same time of the day. By now these models have a high accuracy, giving information about NOx concentration that is dependent on altitude, latitude, and the time of the day (Dubé et al., 2020; Strode et al., 2022). However, to the best of the authors' knowledge, a reliable analysis of long-term observations of NOx stratospheric partial columns and their diurnal variations, which could be used for validation of model data, does not exist. This is due to the lack of measurements able to record stratospheric NOx as a function of the time of the day.
For the ground-based observation of NOx, several different measurement techniques are well established, such as microwave radiometers (MRs), zenith sky (ZS) and multi-axis (MAX) differential optical absorption spectroscopy (DOAS), and Fourier-transform infrared (FTIR) spectrometry. The MR technique is sensitive at high altitudes and offers the possibility to obtain NO2 columns independent of night- and daytime (Ricaud et al., 2004). ZS-DOAS or Système d'Analyse par Observations Zénithales (SAOZ) instruments are well established at many stations all over the globe and provide long-term information about trace gas columns (e.g., NO2) in the stratosphere (Platt and Stutz, 2008; Vandaele et al., 2005; Pommereau and Goutail, 1988; Solomon et al., 1987). However, these instruments have good sensitivity especially at high solar zenith angles (SZAs) near sunrise or sunset (Tack et al., 2015). To get information at lower SZAs, MAX-DOAS measurements are performed, providing information about tropospheric trace gas concentrations at different times of the day (Dimitropoulou et al., 2020; Hönninger et al., 2004). However, these measurements do not provide information about trace gas concentrations at the tropopause and in the lower stratosphere.
Accurate information on NO2 and NO columns is accessible via FTIR solar absorption spectrometry, which can cover the whole diurnal variation in NOx (Fischer, 1993). Since the first ground-based FTIR measurements of NO2 (Camy-Peyret et al., 1983) and NO (Hanst et al., 1982), some progress has been made in monitoring seasonal trends and diurnal variation in stratospheric and tropospheric NOx (Zhou et al., 2021; Yin et al., 2019; Virolainen et al., 2014; Hendrick et al., 2012; Flaud et al., 1988; Rinsland et al., 1988). However, the majority of these studies investigated time periods covering only a few days up to several months. An examination of reliable long-term FTIR measurements with regard to stratospheric NO2 columns was done by Hendrick et al. (2012). Even though the NO2 diurnal variation is not discussed, the evaluation of 20 years of measurements above Jungfraujoch depicts a consistent picture of (1) the seasonal variability of stratospheric NO2 columns, which undergo a maximum in summer and a minimum in winter, and (2) a long-term trend which seems to show a slight decrease in stratospheric NO2 of the order of 3.6 % over 20 years from 1990–2010, before the study by Sussmann et al. (2005) had quantified the NO2 diurnal variation from ground-based FTIR measurements at Zugspitze. This study successfully showed that the stratospheric NO2 diurnal variation can be measured at a high-altitude site without the strong influence of tropospheric pollution events (Sussmann et al., 2005). However, due to the comparably short time period analyzed in this earlier study (2.5 years), a seasonal dependency could not be retrieved. A reliable long-term study from Zhou et al. (2021) analyzed NO tropospheric and stratospheric partial columns retrieved from FTIR measurements above Xianghe and Le Maïdo. This study comprises both the seasonal variability of stratospheric NO with a maximum in winter and a minimum in summer and the diurnal variation that is dependent on the local time (Zhou et al., 2021). However, a quantification regarding the seasonal dependence of the diurnal increase was not discussed.
Therefore the goal of this work is (i) to analyze the full Zugspitze and Garmisch FTIR time series covering more than 25 years (1995–2022) and 18 years (2004–2022) of measurements, respectively, in order to derive the slope of the linear fit of NO2 and NO stratospheric columns that depend on the local solar time (LST) – namely the diurnal increase – above our mid-latitude sites while eliminating the impact of tropospheric pollution or tropopause variabilities; (ii) to investigate whether a significant seasonal variation in the NO2 diurnal increase can be inferred; and (iii) to perform a comparison with NO stratospheric columns to further validate the analysis method and the reliability of the obtained data. The measurement data set published along with this paper will be a solid basis for validating current and upcoming photochemistry model simulations and improving satellite validation.
This paper is Part 1 of two companion papers dealing with the experimental description of the diurnal NOx variability above Zugspitze by means of ground-based FTIR measurements. Our paper first discusses the stratospheric NOx photochemistry and the consequences for the diurnal behavior of NO2 and NO in Sect. 2. In Sect. 3 we describe the retrieval strategy for NO2 and NO from solar FTIR measurements at Zugspitze and Garmisch. Section 4 focuses on the retrieval results, the separation of the retrieved columns into stratospheric and tropospheric contributions, and the introduction of a pollution filter for the obtained stratospheric columns. The calculation of NO2 diurnal increasing rates and their seasonal variation is made in Sect. 5 followed by a comparison to NO morning diurnal increasing rates, validating the analysis method in Sect. 6. Section 7 gives the summary and conclusions.
As the background for our FTIR data interpretation later, we present a short overview of the model understanding of NOx stratospheric photochemistry. More details can be found in the literature (Crutzen, 1970; Crutzen, 1979; Coffey et al., 1981; Cariolle, 1983; Jaeglé et al., 1994; Lary, 1997; Cohen and Murphy, 2003; Brasseur and Solomon, 2005).
During daytime the main NO2 source is the photolysis of the reservoir species HNO3 and N2O5, see Reactions (R1) and (R2), resulting in a continuous increase in NO2 during the day.
Both reactions take place on a timescale of minutes to hours between sunrise and sunset, and the kinetics depend on solar elevation.
The main NO source is the reaction of nitrous oxide (N2O) with excited oxygen (O(1D)) resulting from the photolysis of O3 given in Reactions (R3) and (R4). This leads to a similar continuous increase in NO during the day as seen for NO2.
According to the model understanding, the reaction rate of Reactions (R1) to (R4) decreases after noon, leading to a lower NO2 and NO increase in the afternoon than observed in the morning.
Additionally, both NOx species are interconverted into each other on timescales of seconds within the O3-destroying nitrogen catalytic cycle,
and via the photolysis of NO2 (Reaction R8), resulting in an equilibrium during daytime:
This equilibrium is reached very fast after sunrise and is nearly constant in the morning where the concentration increase in both species follows in a good approximation a linear behavior. In the afternoon, the equilibrium changes due to the strong solar elevation dependency of Reaction (R8) and due to the increasing abundance of O3 with daylight (Wang et al., 2020; Strode et al., 2022). Consequently, after noon, the NO increase slows down, whereas NO2 continues to increase with a similar rate. Between an SZA of 80–90° the trace gas concentrations are still influenced by the thermally driven reactions taking place at night, leading to a strong deviation from a linear behavior during very early morning.
3.1 Measurement
All data of this study are retrieved from long-term ground-based FTIR solar absorption measurements at Zugspitze, Germany (47.42° N, 10.98° E; 2964 m a.s.l.) and Garmisch, Germany (47.47° N, 11.06° E; 745 m a.s.l.). The high-altitude observatory at Zugspitze is located in the German Alps and can be treated as a clean site without strong influences from pollution events in the boundary layer. The observatory at Garmisch is located in the direct vicinity of Zugspitze but is 2219 m below Zugspitze in the countryside and is influenced by urban pollution events from, e.g., Munich. The Bruker IFS 125HR spectrometers used have been operated continuously since 1995 at Zugspitze and since 2004 at Garmisch. They operate with an actively controlled solar tracker and liquid-nitrogen-cooled MCT (HgCdTe) and InSb detectors. The instrument and measurement details are described elsewhere in detail (Sussmann and Schäfer, 1997; Sussmann, 1999). The data set used for Zugspitze comprises all available measurements from 1995 to the present, namely 19 552 spectra on 2579 measurement days (7.58 measurements per measurement day on average) for the micro-window (MW) used for the NO2 retrieval and 7513 spectra on 2247 measurement days (3.34 measurements per measurement day on average) for the NO retrieval. The maximum optical path difference is 175 and 250 cm, respectively. The data set used for Garmisch comprises all available measurements from 2004 to the present, namely 15 801 spectra on 2114 measurement days (7.47 measurements per measurement day on average) for the MW used for the NO2 retrieval.
3.2 Retrieval strategy
In this paper, NO2 and NO volume mixing ratio (VMR) profiles and column amounts are derived from measured spectra using version 9.6 of the retrieval code PROFFIT (Hase et al., 2004). The parameters used of the two described retrievals are summarized in detail in Table S1 in the Supplement. They are all optimized, leading to minimum values of the resulting spectral residuals (measured minus calculated) and physically meaningful vertical VMR profiles. The main quality selection criterion after a successful retrieval (< 20 iterations) was a ratio of the noise-to-signal ratio (NSR) to the degrees of freedom for signal (DOFSs) of ≤ 0.125 for NO2 and ≤ 0.2 for NO. These settings have been determined by a tradeoff between data quality and data amount. The DOFS is a measure of the information content that can be attained on the vertical profile from the retrieval (Rodgers, 1998). Additionally, all spectra recorded at SZA > 80° were dropped because of the influence of the thermally driven reactions taking place at night, which can be dominant already near the terminator (SZA of 90°; see Sect. 2). However, these dropped data are available from the corresponding author upon request. The resulting mean calculated spectra for the NO2 and NO retrievals, their spectral residuals, and the NSR are shown in Figs. S1a and b and S2, respectively. The NSR is 0.0694 % (NO2) and 0.1603 % (NO) at Zugspitze and 0.0631 % (NO2) at Garmisch.
3.2.1 NO2
For retrieval of NO2 above Zugspitze and above Garmisch, a prominent infrared absorption line first suggested for atmospheric retrievals by Camy-Peyret et al. (1983) was used, utilizing a spectral MW ranging from 2914.3 to 2914.85 cm−1. This MW includes a strong absorption of CH4 at 2914.5 cm−1, which is retrieved simultaneously. For both species (NO2 and CH4) we applied a simple first-derivative (L1) smoothness constraint (Tikhonov, 1963). Vertical a priori profiles of the interfering species, H2O, O3, H2CO, OCS, and C2H6, were iteratively scaled within the retrieval. For NO2 one single averaged a priori profile was taken from the Whole Atmosphere Community Climate Model (WACCM) version 6 generated by NCAR (Lamarque et al., 2013). Daily profiles from the GGG2020 software (Laughner et al., 2022) were used for the interfering species. The spectroscopy for all species is taken from ATMOS version 20200512 (Brown et al., 1996).
3.2.2 NO
For retrieval of NO above Zugspitze, the prominent doublet located at 1900.075 cm−1 was used, utilizing a spectral MW ranging from 1899.900 to 1900.100 cm−1. This MW was also used in previous studies (Zhou et al., 2021; Wiacek et al., 2006; Notholt et al., 1995). This MW includes an absorption line of CO2 at 1899.995 cm−1, which is retrieved simultaneously. For both species (NO and CO2) we applied an L1 Tikhonov regularization. A vertical a priori profile of O3 was iteratively scaled within the retrieval. For the other interfering species, H2O and N2O, only a forward calculation was used along with a retrieval of the other species. For NO, one single averaged a priori profile was taken from the Whole Atmosphere Community Climate Model (WACCM) version 6 generated by NCAR (Lamarque et al., 2013). Daily profiles from the GGG2020 software were used for the interfering species (Laughner et al., 2022). The spectroscopy for all species is taken from HITRAN2020 (Gordon et al., 2022).
Following the retrieval strategy and the quality control described in Sect. 3, NOx vertical profiles are derived above Zugspitze (NO2 and NO) and above Garmisch (NO2) for each spectrum and are shown in Fig. S3a (Zugspitze) and b (Garmisch) for NO2 and in Fig. S4a and b for NO (red lines). From the remaining 16 023 (Zugspitze, NO2), 14 460 (Garmisch, NO2), and 6213 (NO) spectra, mean DOFSs of 1.38, 1.49, and 2.14, respectively, are derived.
4.1 Separation of the tropospheric and stratospheric column contributions
As mentioned in the Introduction, one main issue of this work is the reduction in error sources influencing the reliability of the interpreted data. To avoid the influence of NOx variability in the troposphere and near the tropopause on the retrieved stratospheric NOx columns, in this section we describe the separation of the derived columns into two partial columns, even though the obtained DOFSs for the NO2 retrieval are only 1.38 (Zugspitze) and 1.49 (Garmisch) and not 2.0. The lower partial column covers the troposphere and the lower stratosphere up to 16 km. The upper partial column covers the middle and upper stratosphere above 16 km.
4.1.1 NOx partial column averaging kernels above Zugspitze and Garmisch
Figure 1a depicts the retrieved number density (mean over all measured spectra) of NO2 as a function of altitude z at Zugspitze (continuous gray line) and Garmisch (broken line) normalized to its maximum value in the stratosphere. Additionally, the partial column averaging kernels (PCKs; sum of the rows of the averaging kernel matrix over the respective altitude range of the partial column of interest) for both retrievals below (red line) and above (blue line) 16 km altitude are shown. For both stations, a nearly identical profile (gray) is obtained, confirming the retrieval method. The first local maximum extends over the lower troposphere up to 8 km altitude. This maximum reflects the mainly anthropogenic NOx sources in the boundary layer. Although the measurements are performed on a high-altitude site (Zugspitze), the influence of anthropogenic NOx sources from the boundary layer on the profile cannot be excluded. Another contribution certainly results from the a priori profiles (given the shape of the a priori profiles used as depicted in Fig. S3 (green line) along with the weak sensitivity of the PCK < 16 km (continuous red line) for the 2.964–8 km range). Near the tropopause between 5 and 15 km another local maximum is visible. This accumulation is typical for mid-latitudes and can mainly be explained by the influence of lightning in summer, the vertical transport of NOx from surface emissions, and air traffic (Grewe et al., 2001). Above 16 km a large peak is apparent in the profiles with a maximum at ∼ 30 km. Here, the stratospheric NO photochemistry takes place, which is the focus of this work.
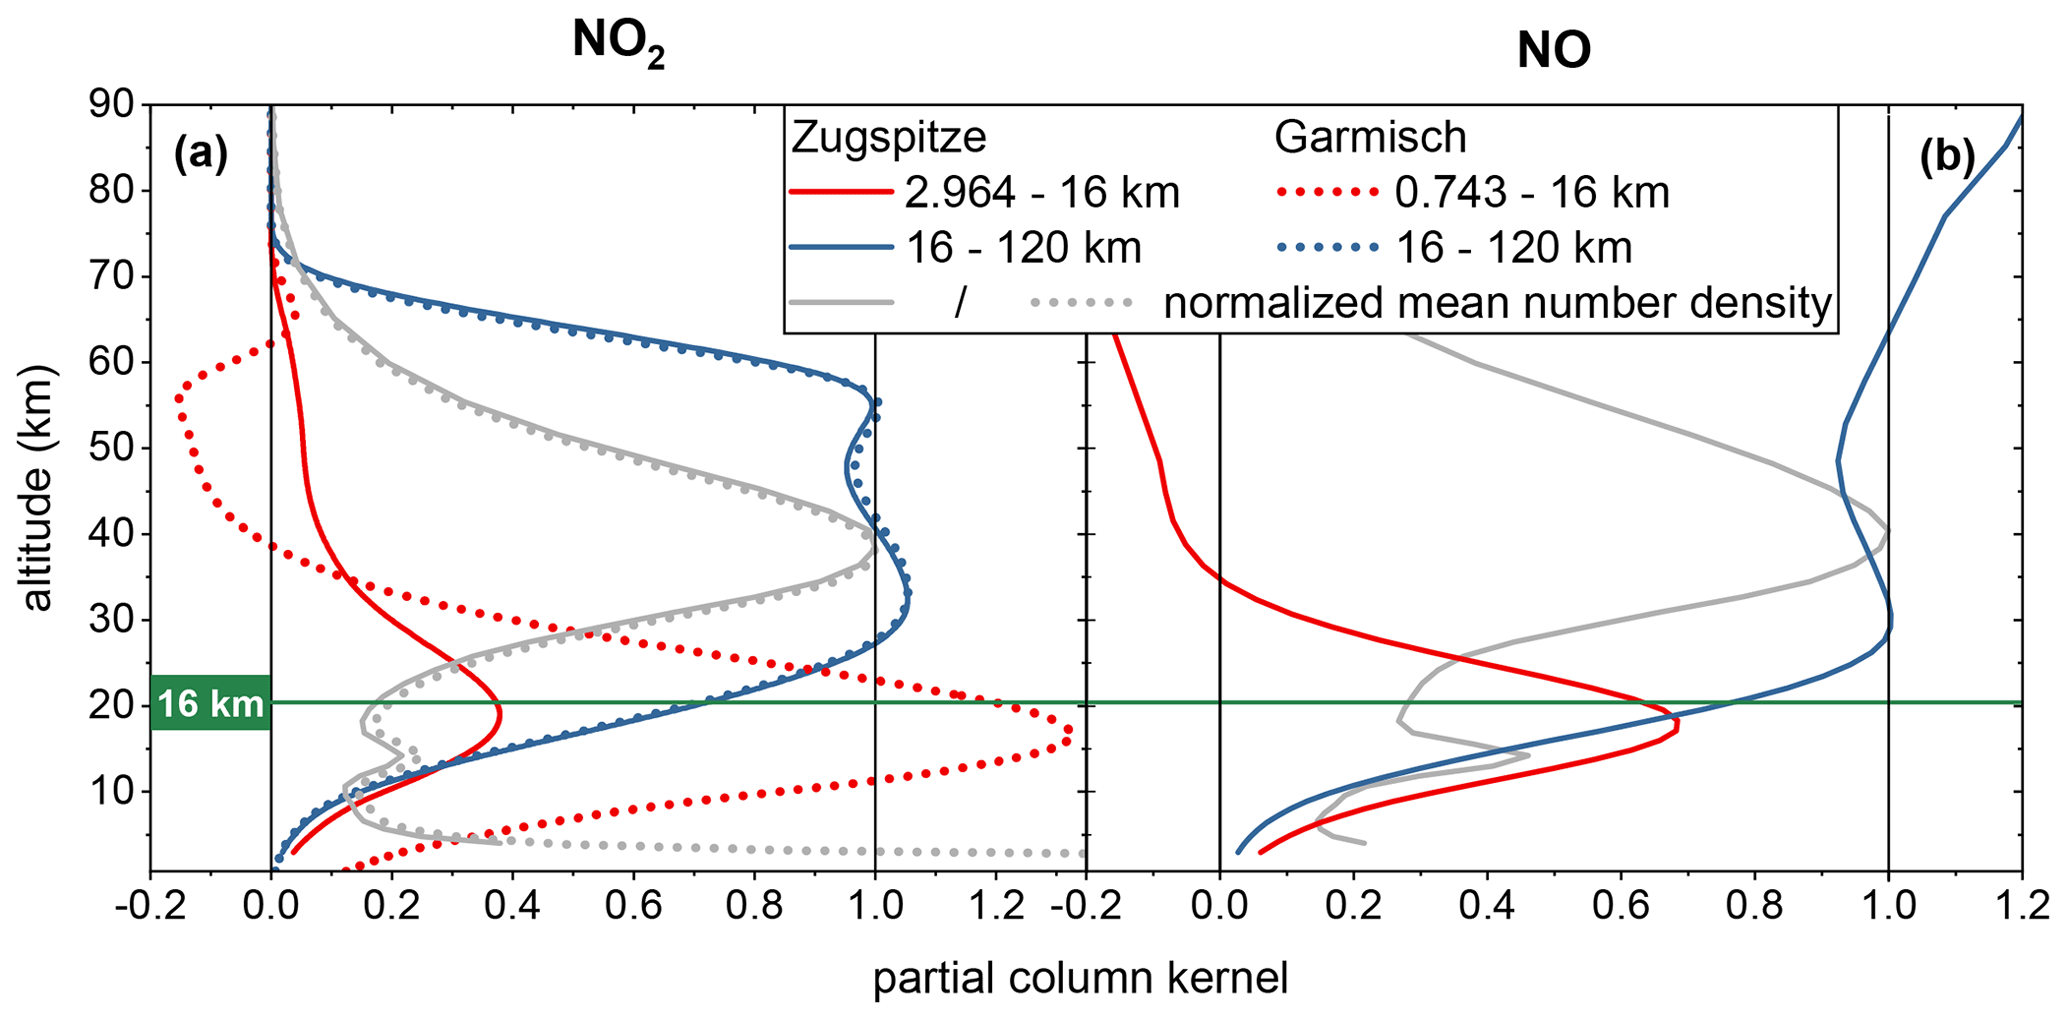
Figure 1Retrieved partial column averaging kernels for below 16 km altitude (red lines) and above 16 km altitude (blue lines) of (a) NO2 measured at Zugspitze (continuous lines) and Garmisch (dotted lines) and (b) NO measured at Zugspitze, both depending on the altitude. Additionally, the respective normalized mean number density that depends on the altitude (gray lines) is shown. The green line indicates the splitting altitude of 16 km.
Figure 1b depicts in the same manner the retrieved mean number density for NO normalized to its maximum value in the stratosphere against z (gray line) and the PCK below (red line) and above (blue line) 16 km altitude. The NO profile (gray) shows analogous maxima as described above for NO2. The lowest maximum results from anthropogenic emissions in the boundary layer; the maximum near the tropopause results from lightning events, vertical NOx transport, and air traffic; and the maximum at 30 km altitude reflects NO photochemistry in the stratosphere.
To give a reason for the separation of the stratospheric columns from the lower ones, the PCKs for < 16 km (red lines) and > 16 km (blue lines) altitudes are depicted in Fig. 1a and b too.
The lower PCK of the NO2 retrieval at Zugspitze (continuous red line, Fig. 1a) shows a moderate sensitivity in the altitude region between 2.964 and 16 km with a maximum of 0.38 at 18 km. In contrast, the lower PCK of the NO2 retrieval at Garmisch (dotted red line, Fig. 1a) shows a strong sensitivity in the lower-altitude region with a maximum of 1.33 at 17 km. However, for both retrievals the sensitivity of the lower PCK at high altitudes of 30 km is very low with 0.18 and 0.35, respectively. Here, both stratospheric PCKs (blue line), which are very similar for the retrievals at Zugspitze (continuous line) and Garmisch (dotted line), show a high retrieval sensitivity of ca. 1 above 30 km and a comparably low sensitivity below 16 km.
For the NO retrieval at Zugspitze (Fig. 1b) a similar pattern is achieved. The sensitivity of the lower PCK (red line) is rather high above the tropopause with a maximum of 0.69 at 18 km, but it decreases strongly at higher altitudes (0.11 at 30 km). In comparison, the stratospheric PCK (blue line) as seen for NO2 shows a continuous high sensitivity to stratospheric variabilities with a value of ∼ 1 above 30 km.
These findings make it reasonable to split up the obtained NO2 and NO profiles into partial columns above and below 16 km altitude to avoid influences of variabilities near the tropopause and in the boundary layer on the stratospheric partial column, although the resulting DOFSs of the NO2 retrieval are only 1.38 (Zugspitze) and 1.49 (Garmisch).
4.2 Pollution filter
In a next step the obtained NOx lower partial columns should be used to account for pollution events in the boundary layer, which also could affect the data retrieved for the stratospheric partial column and especially its diurnal variability. Figure S5a–d show the retrieved NO2 partial columns above Zugspitze (Fig. S5a–b) and above Garmisch (Fig. S5c–d) below (Fig. S5c) and above (Fig. S5d) 16 km altitude that depend on LST and partitioned into monthly data sets for the whole measurement period (blue to yellow symbols from January to December; see legend). To account for pollution events, the evidently visible positive outliers of the lower partial columns (Fig. S5c) are identified via the interquartile range (IQR). All dates on which the retrieved lower partial column is above 1.5 ⋅ IQR of the respective month are removed from the data set and, consequently, will not show up in the stratospheric column too. The resulting pollution-filtered NO2 partial columns are shown in Fig. 2 for the measurements at Zugspitze (Fig. 2a, b) and Garmisch (Fig. 2c, d) and are discussed in the next section. In the same manner we filtered the retrieved NO data set (see Fig. S6a, b, raw data, and Fig. S6c, d, pollution filtered) to account for tropospheric pollution events.
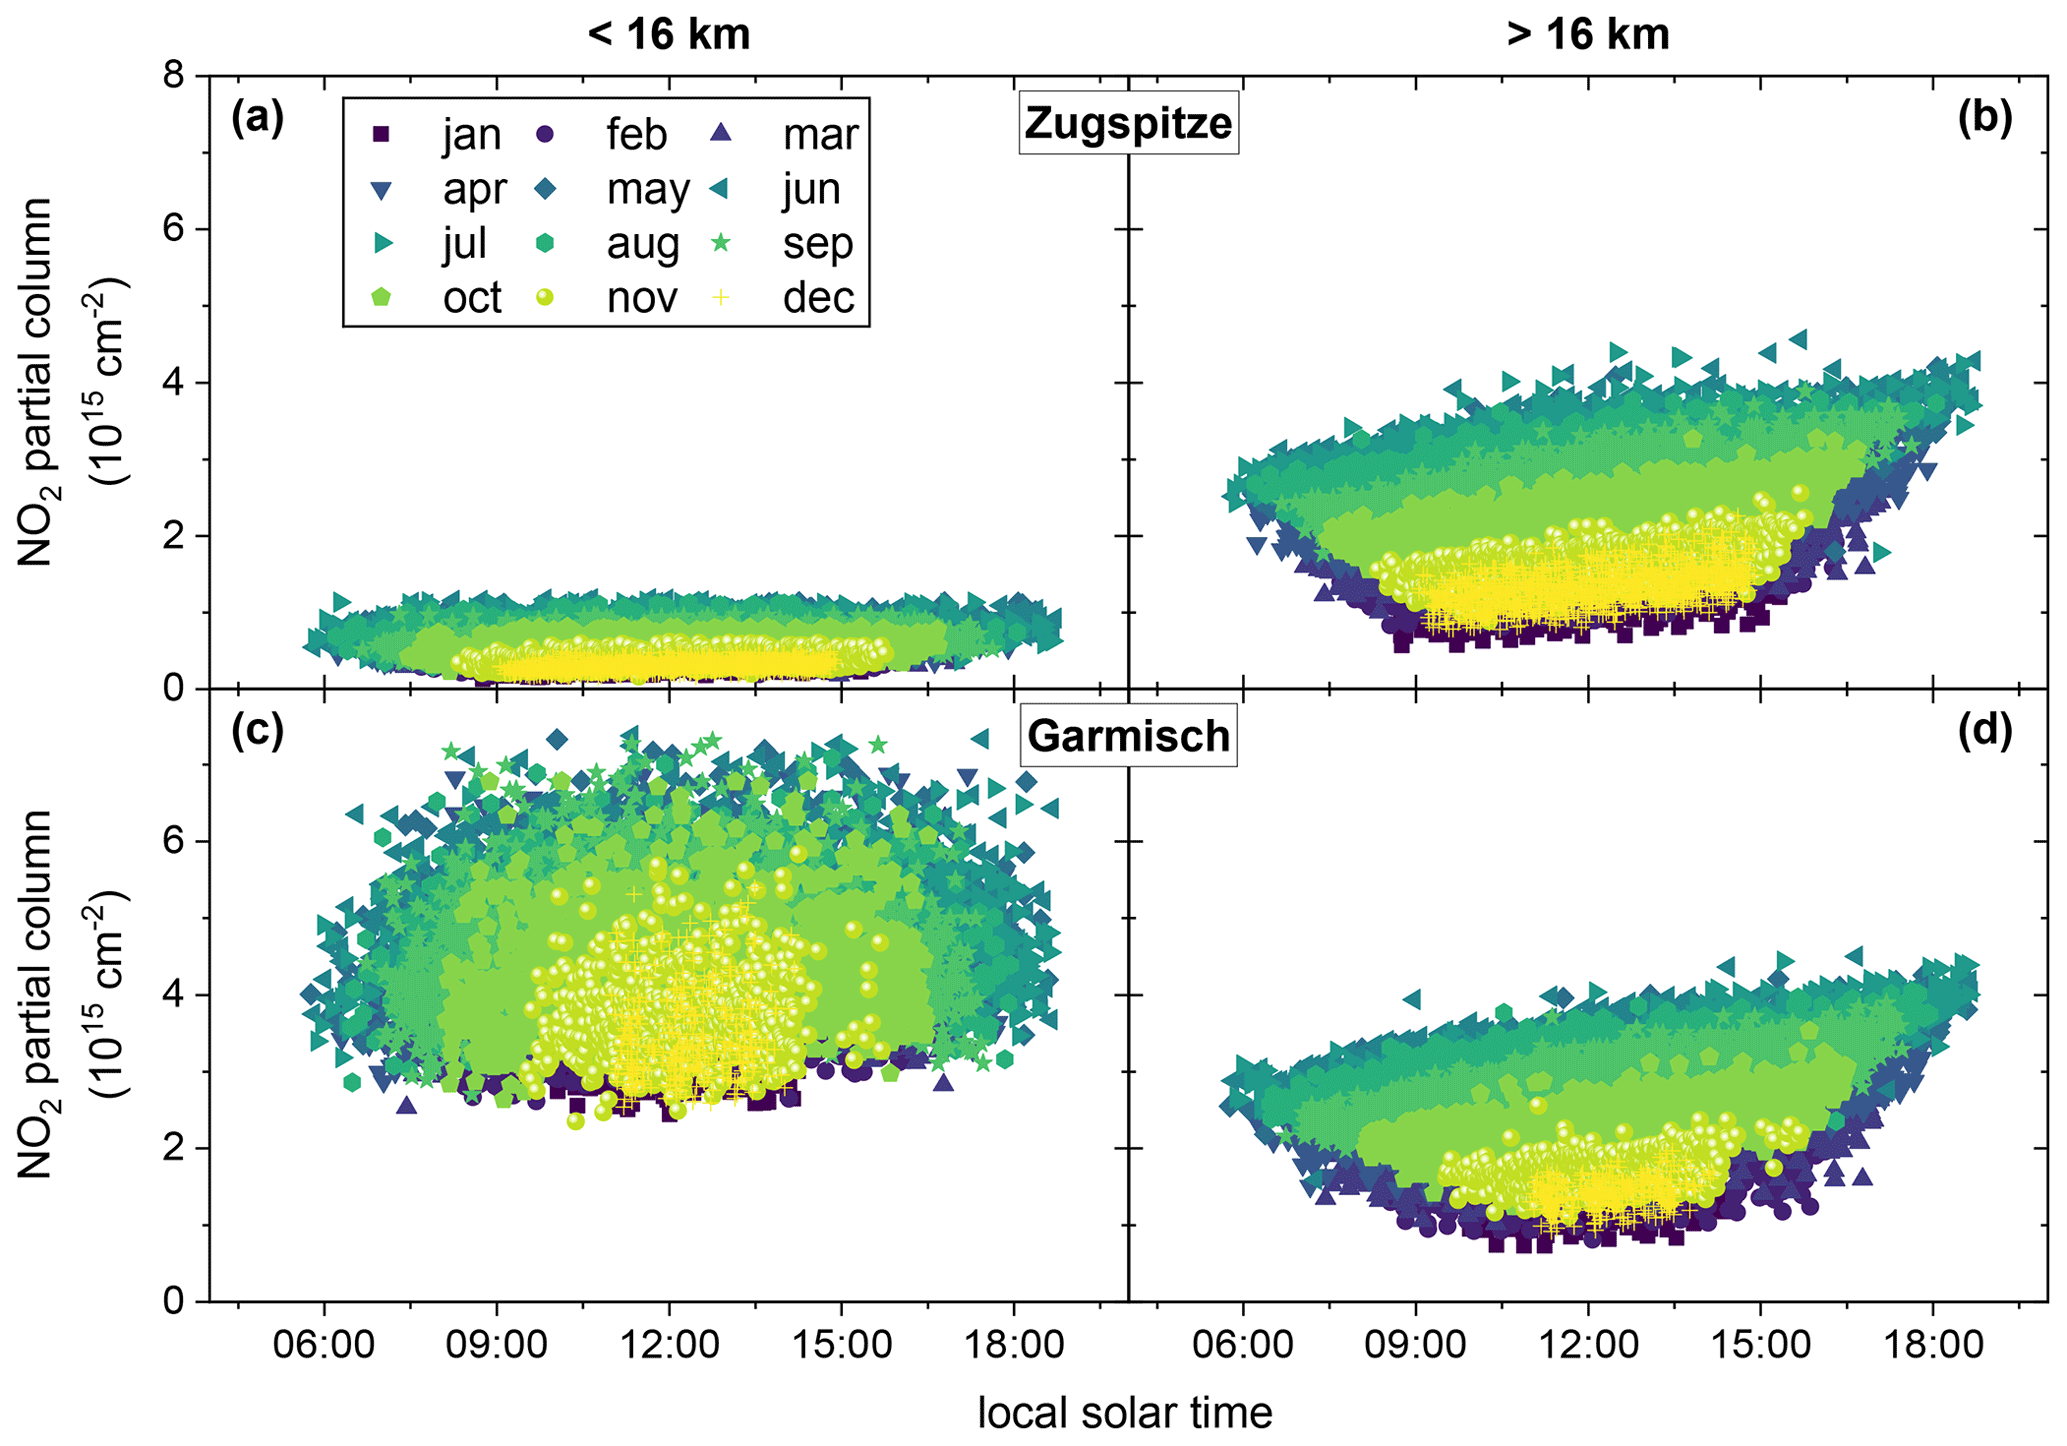
Figure 2Retrieved pollution-filtered NO2 partial columns for every month below (a) and above (b) 16 km altitude measured at Zugspitze and below (c) and above (d) 16 km altitude measured at Garmisch that depend on the local solar time (blue to yellow symbols from January to December; see legend).
4.3 NO2 partial columns above Zugspitze and Garmisch
In Fig. 2, the pollution-filtered NO2 partial columns below (Fig. 2c) and above (Fig. 2b) 16 km altitude measured at Zugspitze (top row) and Garmisch (bottom row) are shown. In comparison to the uncorrected data, the monthly data sets for both NO2 partial columns are smooth. In the troposphere and near the tropopause (lower partial column, Fig. 2a and c), the NO2 concentration does not show a diurnal variation that is dependent on the LST. This behavior agrees with the literature and underlines the weak influence of photochemistry in the lower atmosphere (Li et al., 2021). Comparing the lower partial column above Zugspitze (Fig. 2a) and Garmisch (Fig. 2c), the difference in altitude (2219 m) of both observatories is directly visible. Due to the influence of anthropogenic emissions in the boundary layer, the lower partial column measured at Garmisch shows 7–10 times higher values than that measured at Zugspitze; see also Fig. S7a.
Contrary to this, both stratospheric partial columns (> 16 km) above Zugspitze (Fig. 2b) and Garmisch (Fig. 2d) have very similar values; see also Fig. S7b for a direct comparison. Due to the vicinity of both observatories (ca. 10 km), it is to be expected that the stratospheric partial columns are practically identical. However, the question is whether the data retrievals can reflect this expectation because of the extremely differing station altitudes, with tropospheric NO2 potentially impacting the Garmisch stratospheric retrievals more than in the Zugspitze case. When quantitatively comparing both time series, the mean bias of both partial columns over the whole period between 2004 and 2022 can be found to be only 2.5 %. The standard error of the bias is lower (2 = 0.28 %), indicating that the 2.5 % difference between the stratospheric NO2 partial columns measured at Zugspitze and Garmisch is small but significant. However, the very low mean bias between both data sets validates the retrieval method used and confirms the data evaluation up to this point. Additionally, both stratospheric partial columns show a strong diurnal variation with LST. Here, the discussed diurnal increase from sunrise to sunset is well pronounced for every month. The influence of the stratospheric NO2 seasonal cycle can be seen when comparing the different months (blue to yellow symbols from January to December; see legend). The NO2 concentration in summer (greenish symbols) is ∼ 3.5 times higher than in wintertime (blueish and yellowish symbols), which can be seen clearly when comparing summer and winter months in Fig. 3. This is in good agreement with long-term literature data from Jungfraujoch, which is a high-altitude site at mid-latitudes (Hendrick et al., 2012).
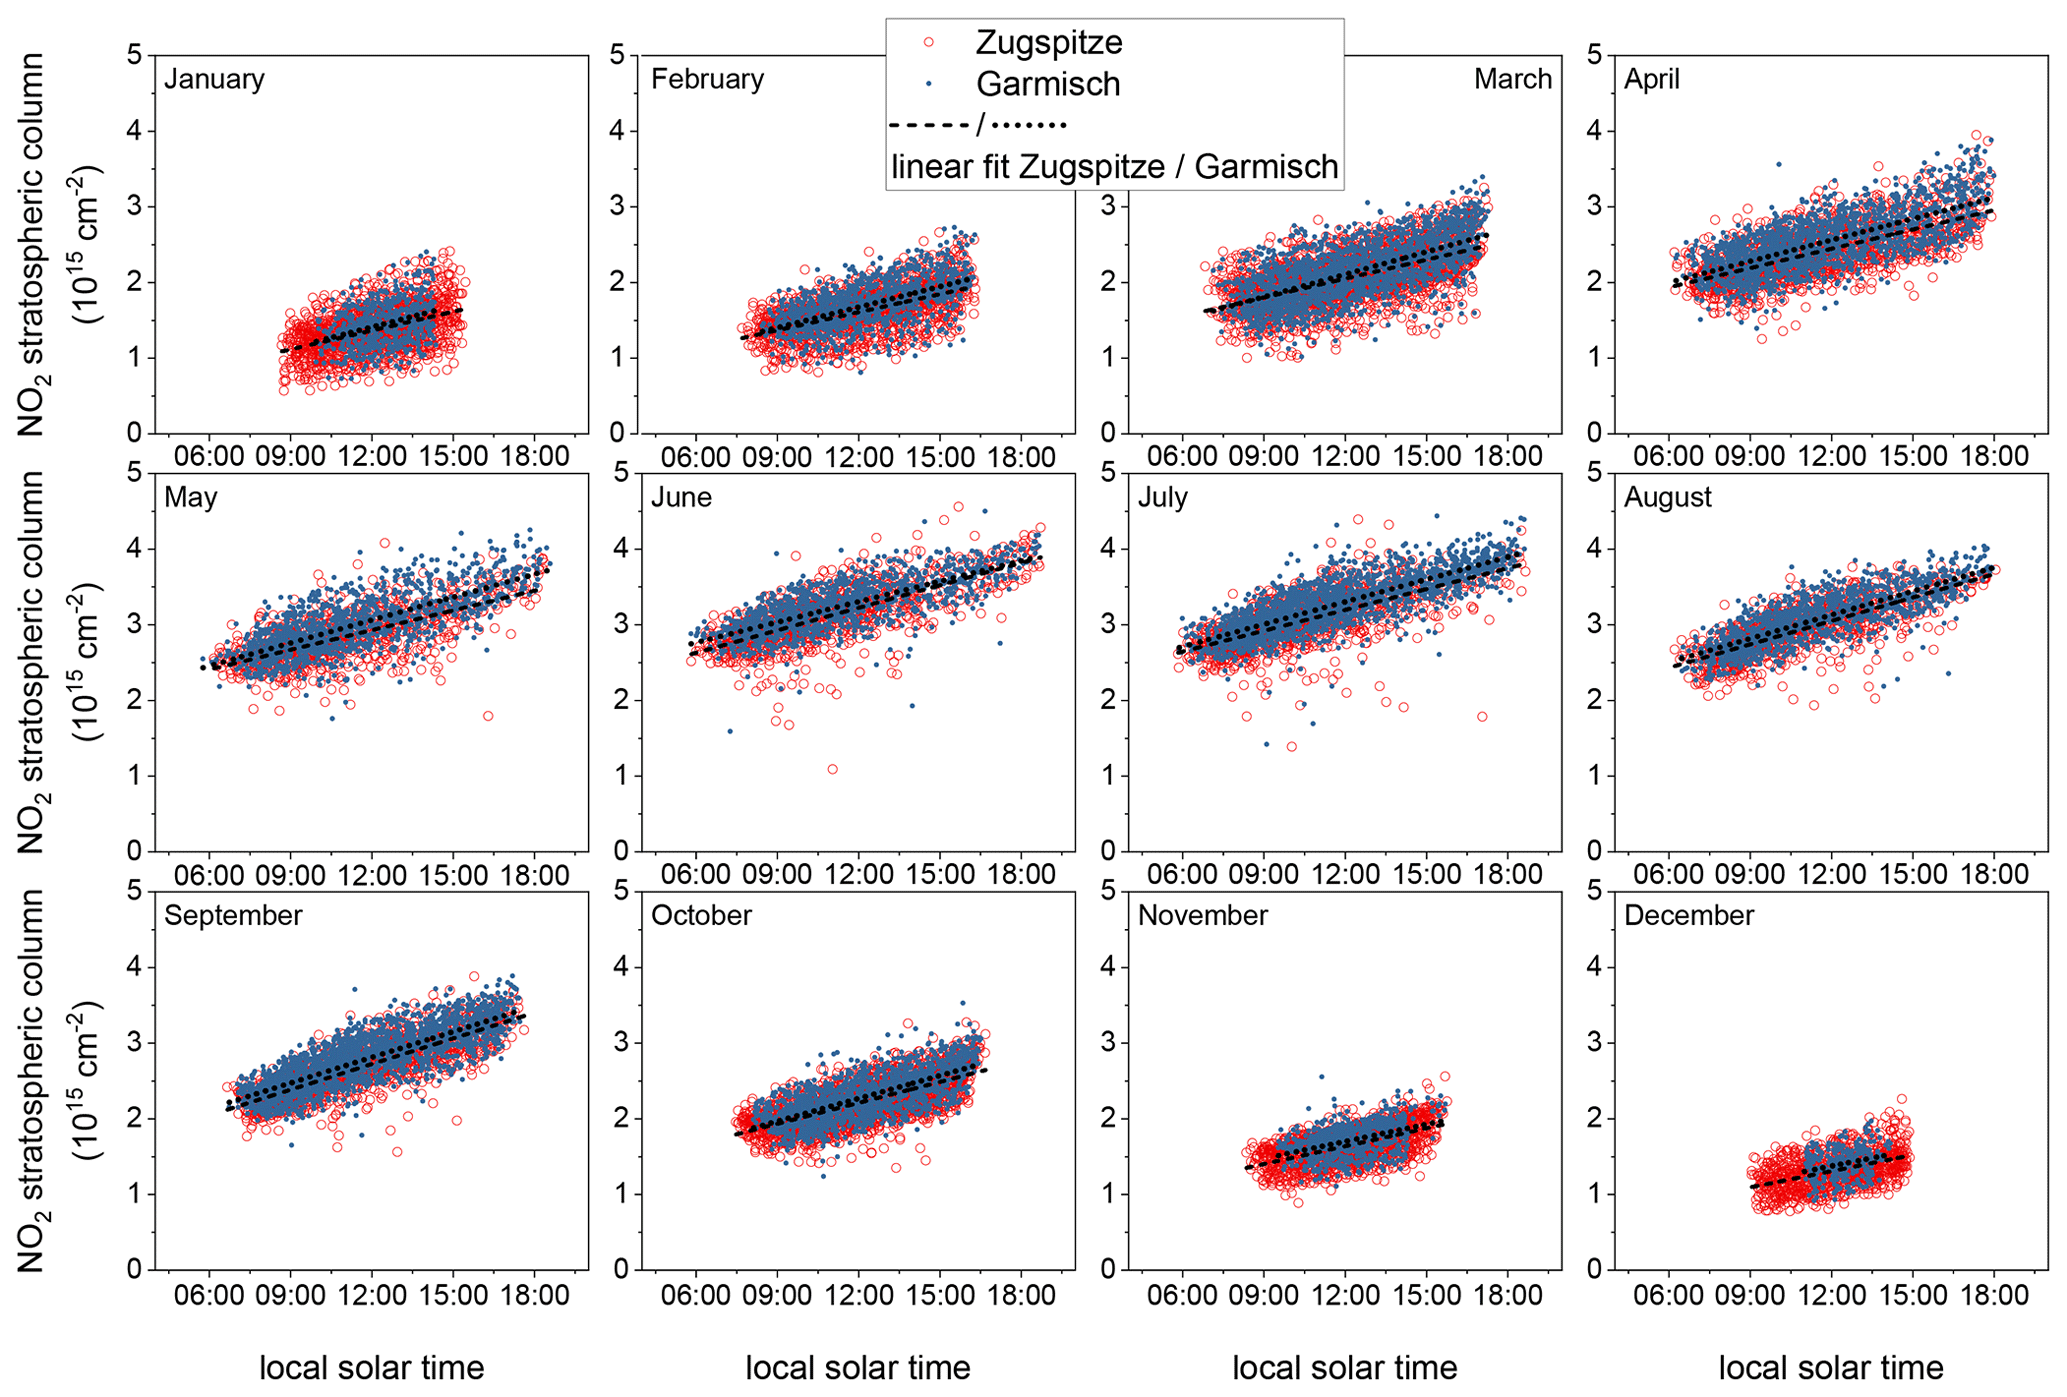
Figure 3Retrieved pollution-filtered NO2 stratospheric columns (> 16 km) above Zugspitze (empty red symbols) and Garmisch (filled blue symbols) for every month that depend on the local solar time and linear fit over the whole data range (dashed black and dotted lines for Zugspitze and Garmisch, respectively).
In this section we use the pollution-filtered NO2 stratospheric partial columns measured at Zugspitze and Garmisch to calculate diurnal increasing rates that depend on the month. The latter quantitatively describes the seasonal variation in diurnal stratospheric NO2 concentrations. For validation of the observed behavior and the retrieval method used, we furthermore correlate the NO2 diurnal increasing rates obtained from both observatories (Zugspitze and Garmisch).
5.1 Calculation of monthly NO2 diurnal increasing rates
Figure 3 shows the NO2 stratospheric partial columns measured at Zugspitze (empty red symbols) and Garmisch (filled blue symbols) for every month, showing their dependance on the LST. As discussed before, the data of both observatories are very similar when comparing data of the same time of the day. Note that especially in winter, the data range measured at Garmisch is smaller due to the combination of low solar altitude angle and the location of the observatory in the valley, leading to a higher uncertainty in the resulting data in the winter compared to Zugspitze.
Within our observational data scatter, we cannot confirm from Fig. 3 any non-linear behavior of the NO2 diurnal increase after noon as forecasted by some models (Dubé et al., 2020; McLinden et al., 2000). Instead, the measured NO2 column appears to increase linearly over the whole day for every time of the year. One reason for this deviation can be the altitude dependence of the non-linearity of the NO2 concentration discussed by Dubé et al. (2021), which cannot be addressed with the NO2 column data available in this work. However, we decided to extract NO2 diurnal increasing rates from the observed data by the determination of the slope of a linear fit over the whole day for every month at Zugspitze (dashed black lines) and Garmisch (dotted black lines). A similar method for the determination of NO2 diurnal increasing rates was applied in earlier work (Sussmann et al., 2005; Li et al., 2021).
The results of the linear fits that depend on the month are shown in Fig. 4a for the measurements at Zugspitze (empty red symbols) and Garmisch (filled blue symbols). The calculated mean values are also indicated in the figure and are (0.89 ± 0.14) × 1014 and (0.94 ± 0.14) × 1014 cm−2 h−1 for Zugspitze and Garmisch, respectively. The errors are 2 times the standard error of the mean (2; i.e., the mean values agree perfectly within error bars. Both increasing rates also agree within error bars with the value of (1.02 ± 0.12) × 1014 cm−2 h−1 obtained in our earlier work for Zugspitze (Sussmann et al., 2005), where a smaller data set (only 2 years) and a simpler retrieval approach had been utilized (using a total column retrieval with a 0 a priori below 10 km altitude instead of a full profile retrieval). Furthermore, Li et al. (2021) published for an even smaller time span (only 1 week in October 2018) a value of (1.34 ± 0.24) × 1014 cm−2 h−1 for the NO2 diurnal increasing rate above Table Mountain, California (34.38° N). This value roughly agrees with the values measured in this work for October, which are (0.92 ± 0.04) × 1014 and (1.01 ± 0.05) × 1014 cm−2 h−1 for Zugspitze and Garmisch, respectively. Here, the even smaller database but also the differing latitude (∼ 13°) could explain the difference.
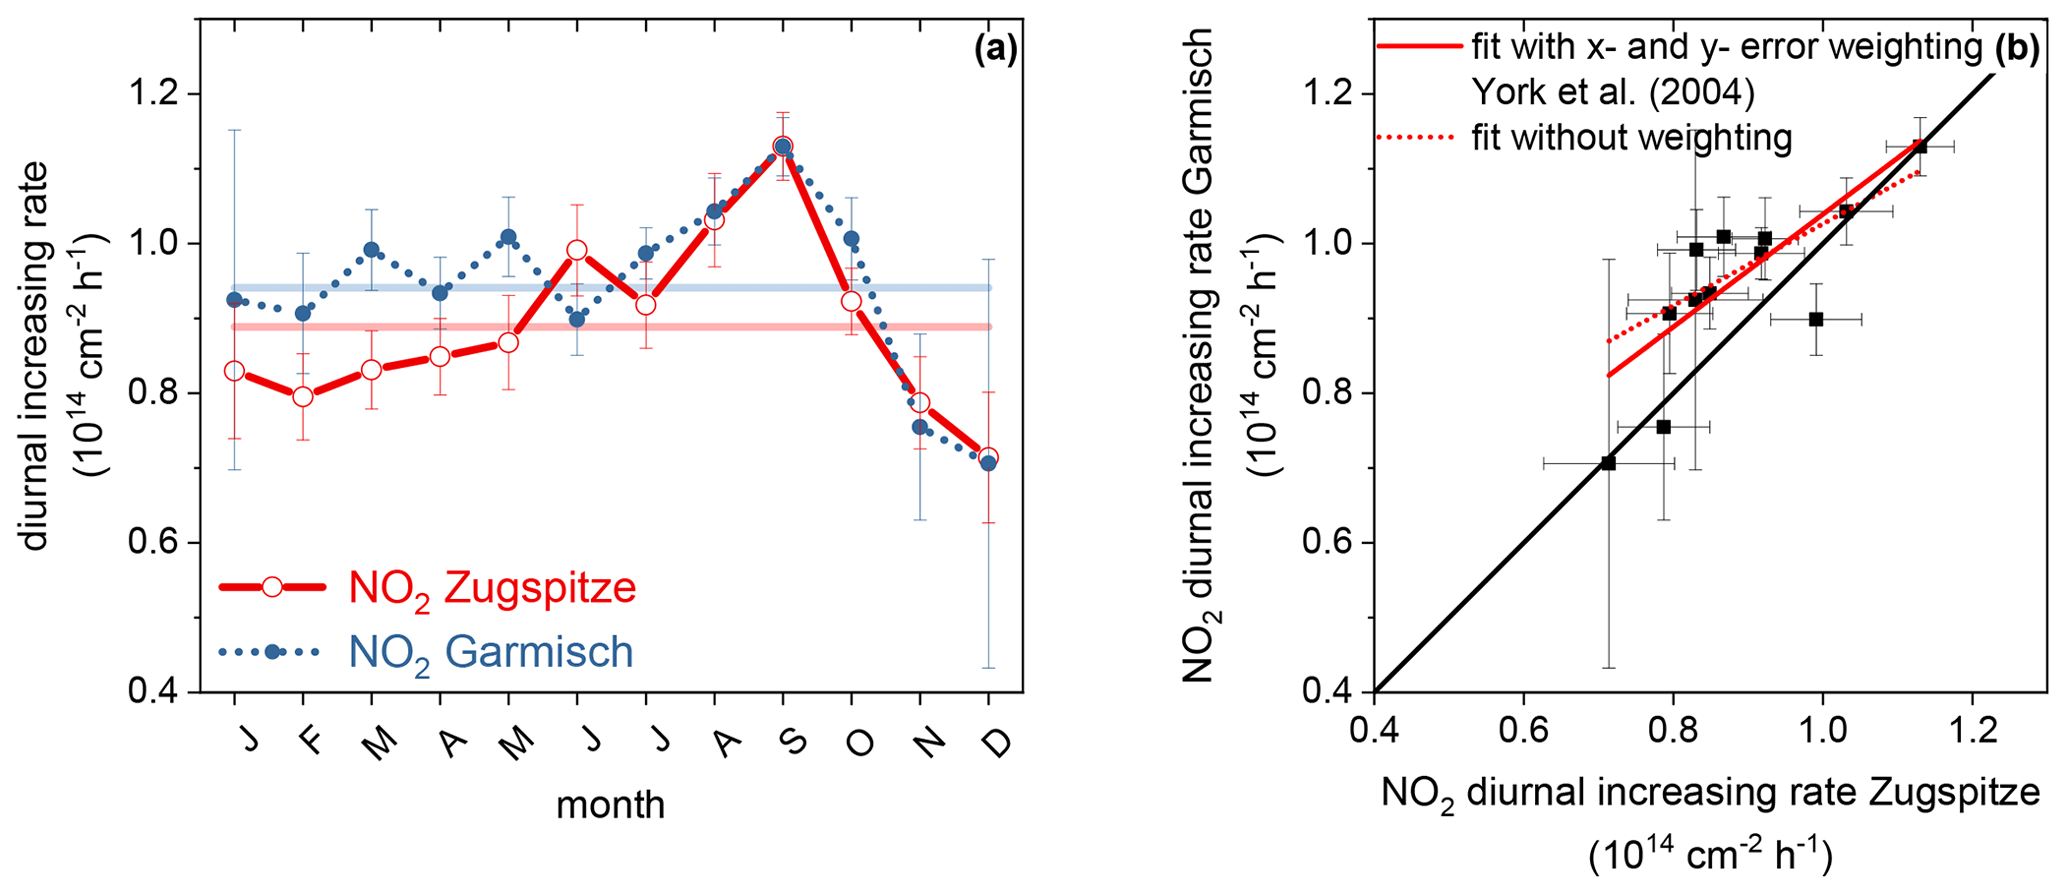
Figure 4NO2 diurnal increasing rates measured at Zugspitze and Garmisch. The error bars are ±2σ (standard deviation) from the linear fit. (a) Data for Zugspitze (empty red symbols) and Garmisch (filled blue symbols) that depend on the month. The lines are visual guides only. (b) Scatterplot of the data measured at Garmisch against the data measured at Zugspitze (black data points). Additionally, the linear regression with x- and y-error weighting using the method of York et al. (2004) (continuous line red) and without weighting (dotted red line) is shown. The 1:1 line is given in black.
Besides the discussion of averaged NO2 diurnal increasing rates and single monthly values, in Fig. 4a a clear seasonal variability of the diurnal increasing rate obtained at Zugspitze and at Garmisch is visible. As reflected by the small error bars of the calculated monthly mean values in Fig. 4a, for both observatories a seasonal cycle with a maximum of (1.13 ± 0.04) × 1014 cm−1 h−1 in September and a minimum of (0.71 ± 0.18) × 1014 cm−1 h−1 in December can be shown experimentally for the first time. For the quantitative validation of this new finding we directly correlate the obtained monthly NO2 diurnal increasing rates measured at Zugspitze and Garmisch in the next section, expecting both to have the same origin in stratospheric photochemistry and to therefore be correlated.
5.1.1 Correlation analysis of extracted diurnal increasing rates
Figure 4b shows the scatterplot of monthly NO2 diurnal increasing rates measured at Garmisch against the ones measured at Zugspitze. The error bars are ±2σ (standard deviation) from the linear fit. The continuous red line is the linear regression with x- and y-error weighting using the method by York et al. (2004). With the assumption that x and y errors are not correlated, the regression analysis results in the values given in Table 1. Additionally, the regression without error weighting is shown (dotted red line). While the correlation coefficient r is independent of the errors, the t value strongly depends on the error. If the t value exceeds the critical t value tcrit (95 % = 2.23), a significant correlation within 95 % confidence is given. In this case, with a high correlation coefficient r = 0.7899 and with a t value of 3.96 and 3.37 with and without error weighting, respectively, it is very likely that the data are correlated. This result confirms that the seasonal variation shown in the NO2 diurnal increasing rates is a real effect, which probably originates from the stratospheric photochemistry at mid-latitudes.
Table 1Results of Garmisch–Zugspitze diurnal increasing rate correlation analysis. The correlation coefficient r, r2, and the calculated t values from the linear regression with x- and y-error weighting and without. Significant correlation is achieved if the t value exceeds the critical t value tcrit for the given confidence level.

In this section we analyze the retrieved NO stratospheric columns above Zugspitze. This analysis is motivated by the question of whether the observed seasonal dependence of the NO2 diurnal increasing rate originates from stratospheric photochemistry and consequently can be seen in the NO data too.
6.1 Calculation of monthly NO morning diurnal increasing rate
Figure 5 shows the stratospheric NO partial columns measured at Zugspitze (empty yellow symbols) as a function of the LST for every month. Unlike what is observed for NO2, the non-linear behavior of the diurnal increase in NO is well pronounced, particularly in summertime (middle row), where after local solar noon, the slope of the diurnal increase decreases significantly. As described in Sect. 2, this behavior can be attributed on the one hand to the strong solar elevation dependency of Reaction (R8). On the other hand, the increasing abundance of O3 with daytime influences the kinetics of Reaction (R7). Both effects lead to a change in the chemical equilibrium between NO2 and NO after local solar noon and explain the different afternoon behavior of both trace gases.

Figure 5Retrieved pollution-filtered NO stratospheric columns (> 16 km) above Zugspitze (yellow symbols) for every month that depend on the local solar time and linear fit before local solar noon (dashed black line).
For the quantification of the diurnal increase in the NO stratospheric partial column and a good comparability to NO2, here we only make a monthly linear fit before noon (Fig. 5, dashed black line) to extract a NO morning diurnal increasing rate for every month.
The results of the linear fits that depend on the month are shown in Fig. 6 (empty yellow symbols) together with the NO2 diurnal increasing rates measured at Zugspitze (empty red symbols). It can be seen that the NO morning diurnal increasing rate shows a similar seasonal variation to the NO2 diurnal increasing rate with a maximum of (1.76 ± 0.25) × 1014 cm−1 h−1 in September and a minimum of (1.18 ± 0.41) × 1014 cm−1 h−1 in November. Here, a correlation of NO2 and NO diurnal increasing rates is likely.
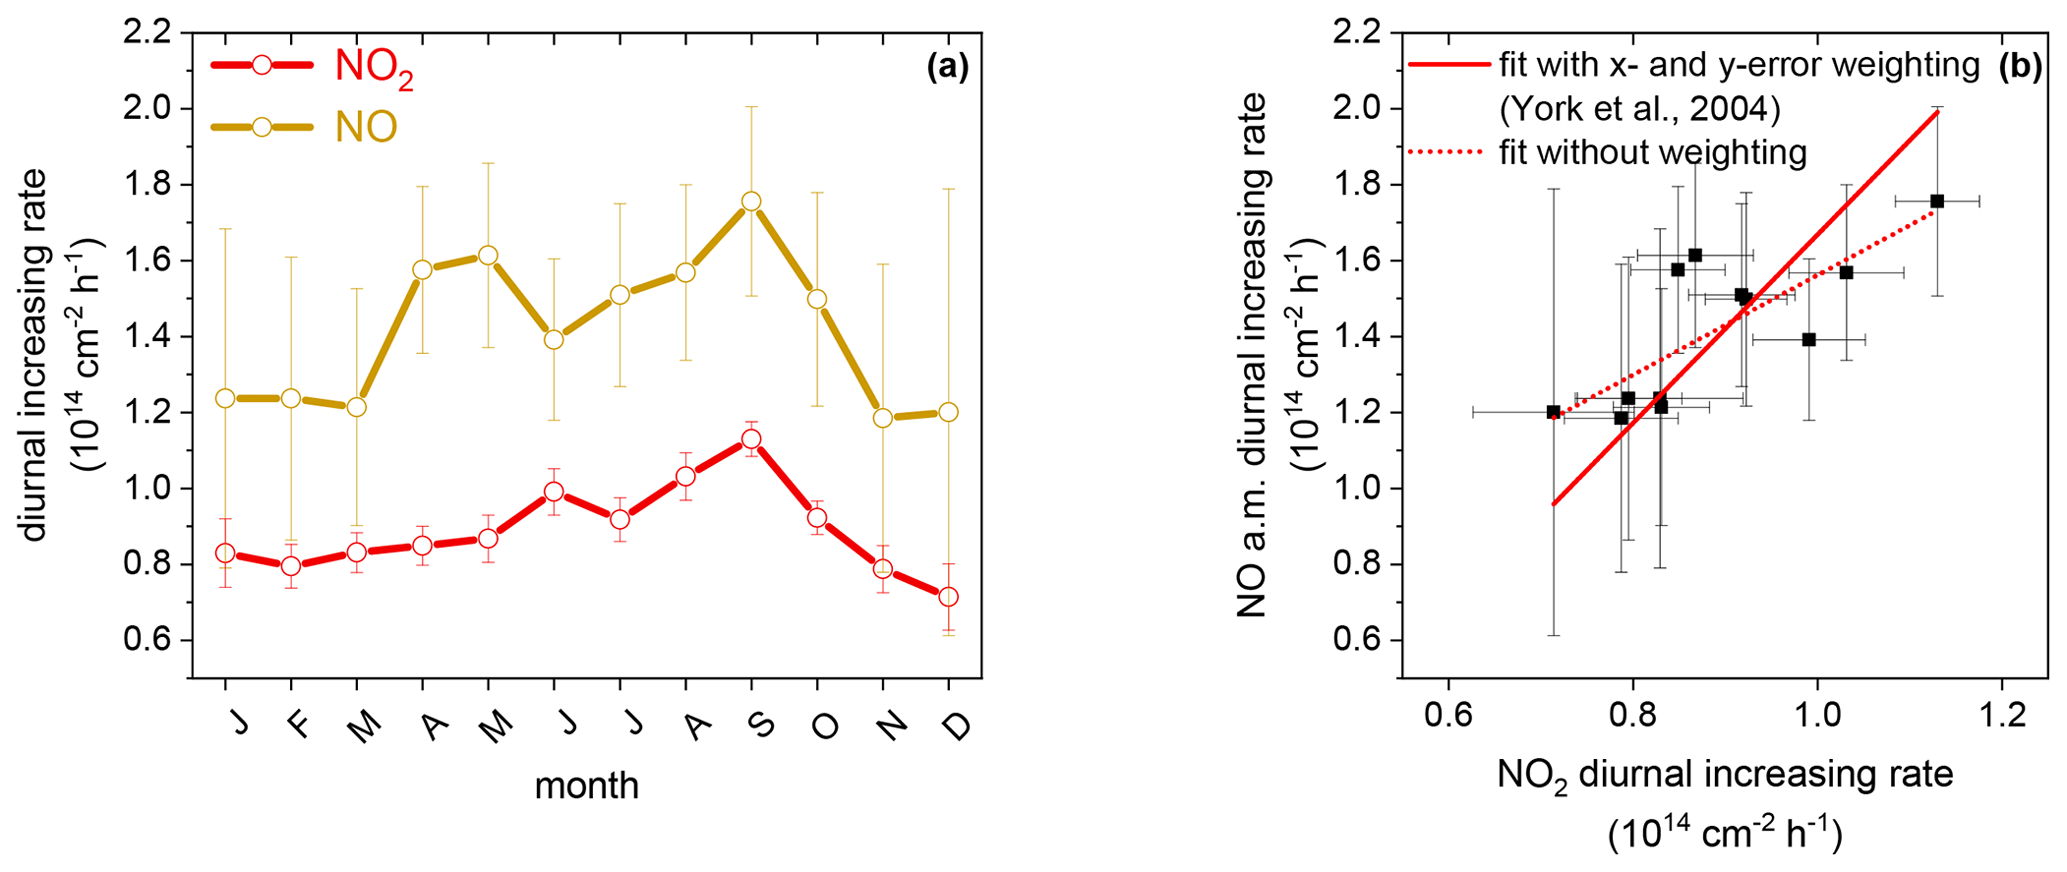
Figure 6NO2 diurnal increasing rates and NO morning diurnal increasing rates measured at Zugspitze. The error bars are ±2σ (standard deviation) from the linear fit. (a) Data for NO2 (red symbols) and NO (yellow symbols) that depend on the month. The lines are visual guides only. (b) Scatterplot of the NO data against the NO2 data, both measured at Zugspitze (black data points). Additionally, the linear regression with x- and y-error weighting using the method of York et al. (2004) (continuous red line) and without weighting (dotted red line) is shown.
However, the error bars of the linear fits of NO are significantly larger compared to NO2. One main reason, among others, for this effect is the smaller database for the NO retrieval with less than one half of the spectra compared to NO2 (16 023 vs. 6213 spectra). This difference originates from the use of another MW for the NO retrieval. Nevertheless, in the next section we perform a correlation analysis of both diurnal increasing rates to quantify the relationship between stratospheric NO2 and NO.
6.1.1 NO2–NO correlation analysis
In Fig. 6b a scatterplot of monthly NO morning diurnal increasing rates against the NO2 diurnal increasing rates is shown, both measured at Zugspitze. The error bars are ±2σ from the linear fit. The continuous red line is the linear regression with x- and y-error weighting using the method of York et al. (2004) as described in Sect. 5.1.1. The dotted red line represents the fit without weighting. The results of the correlation analysis are given in Table 2.
Table 2Results of NO–NO2 diurnal increasing rate correlation analysis. The correlation coefficient r, r2, and the calculated t values from the linear regression with x- and y-error weighting and without weighting. Significant correlation is achieved if the t value exceeds the critical t value tcrit for the given confidence level.
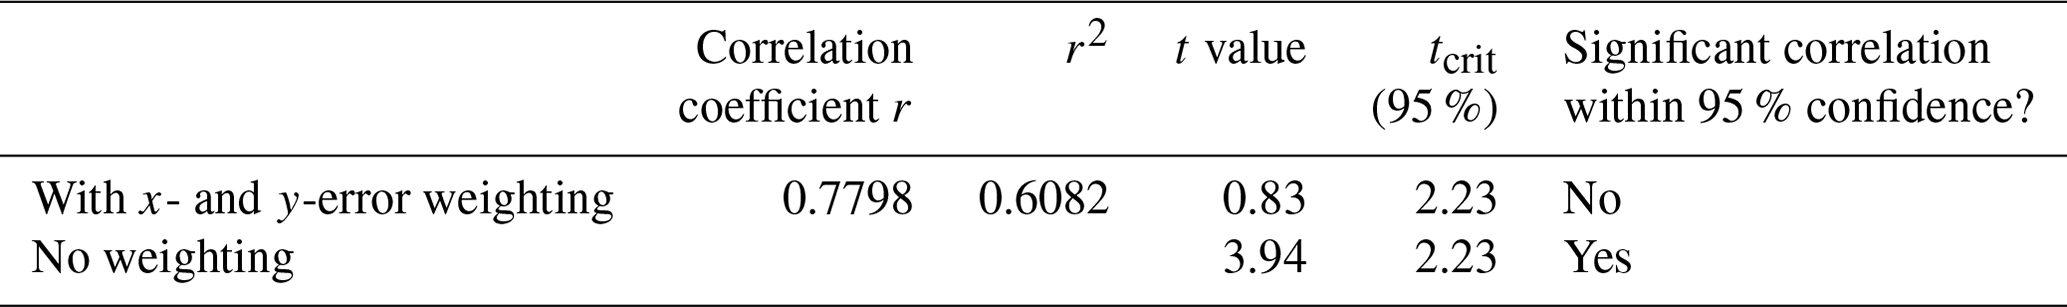
The high correlation coefficient of r = 0.7798 shows that it is likely that the given data are related. Without considering the error bars, the t value (3.94) exceeds tcrit (2.23) for a confidence level of 95 %, reflecting a significant correlation of the data within 95 % confidence. However, due to the larger error bars of the NO morning diurnal increasing rates, the application of error weighting leads to an even smaller t value of 0.83, resulting in no statistical correlation of both data sets within 95 % confidence. Nonetheless, we would like to argue that the obvious similarity between the seasonality of the NO2 and NO morning diurnal increasing rate observed in Fig. 6a is not accidental. If this is the case, this observation would confirm our model understanding of an interconnection of both trace gases in the stratospheric photochemistry.
In this study, we analyzed long-term FTIR data recorded within the last 25 years at Zugspitze (47.42° N, 10.98° E; 2964 m a.s.l.) and Garmisch (47.47° N, 11.06° E; 745 m a.s.l.), Germany. We present a retrieval and analysis strategy for the given FTIR data, which provides NO2 and NO stratospheric partial columns (> 16 km altitude) that are only weakly influenced by the tropospheric partial column and by pollution events. The obtained NO2 stratospheric partial columns have a bias of only 2.5 ± 0.2 %, very similar above Zugspitze and Garmisch, reflecting the reliability of the given analysis. The observed diurnal behavior of both the NO2 and the NO stratospheric partial columns that depend on the local solar time (LST) reflects the expected behavior described in the literature via photochemical model simulations: the NO2 stratospheric partial column follows a linear increase from sunrise to sunset, independently of the season. In a similar way, the NO stratospheric partial column increases linearly before local solar noon. In the afternoon, the increase in the NO stratospheric partial column slows down significantly, especially in summertime. Besides these basic observations, we quantified the described diurnal increase in NO2 and NO that depends on the LST by calculating monthly NO2 diurnal increasing rates above Zugspitze and Garmisch with mean values of (0.89 ± 0.07) × 1014 and (0.94 ± 0.07) × 1014 cm−2 h−1, respectively, and monthly NO morning diurnal increasing rates above Zugspitze with a mean value of (1.42 ± 0.06) × 1014 cm−2 h−1. Here, the mean NO2 diurnal increasing rates fit together perfectly with the literature value published by Sussmann et al. (2005). Additionally, for the first time we could experimentally show a significant seasonal variation in both the NO2 diurnal increasing rate and the NO morning diurnal increasing rate with a maximum of (1.13 ± 0.04) × 1014 cm−1 h−1 for NO2 and (1.76 ± 0.25) × 1014 cm−1 h−1 for NO in September and a minimum of (0.71 ± 0.18) × 1014 cm−1 h−1 in December for NO2 and a minimum of (1.18 ± 0.41) × 1014 cm−1 h−1 in November for NO. Although the correlation analysis of both NO2 and NO diurnal increasing rates gives quantitative evidence of their interconnection in the stratospheric photochemistry only within 85 % confidence, both diurnal increasing rates follow the same seasonal cycle.
Part 2 of the companion paper (Nürnberg et al., 2023) will show the generalization of the observed NOx partial columns (> 16 km) by converting them into experiment-based NOx scaling factors describing the NOx diurnal variability that depends on the SZA and will give a first comparison to recently published model-based scaling factors.
The data and analysis method given in this paper (Part 1) can be the first step for a latitude-dependent (multi-station) data set reflecting the diurnal behavior of the stratospheric NOx column that depends on the season. Furthermore, the measurements with its high time resolution can serve as a basis for the validation of future photochemistry models and the improvement of satellite validation.
The data underlying this publication can be obtained at any time from the corresponding author on request.
The supplement related to this article is available online at: https://doi.org/10.5194/acp-24-3743-2024-supplement.
PN optimized and performed the FTIR retrievals, performed the scientific analysis, and wrote the manuscript. RS suggested this research, contributed to the design of the study, and supported editing of the manuscript. MR performed the measurements.
The contact author has declared that none of the authors has any competing interests.
Publisher's note: Copernicus Publications remains neutral with regard to jurisdictional claims made in the text, published maps, institutional affiliations, or any other geographical representation in this paper. While Copernicus Publications makes every effort to include appropriate place names, the final responsibility lies with the authors.
We would like to thank Sarah A. Strode for carefully reading the paper.
This work was funded by the Federal Ministry of Education and Research of Germany within the ACTRIS-D project (grant no. 01LK2001B) and by the Helmholtz Changing Earth – Sustaining our Future research program within the Earth and Environment research field.
The article processing charges for this open-access publication were covered by the Karlsruhe Institute of Technology (KIT).
This paper was edited by Michel Van Roozendael and reviewed by two anonymous referees.
Brasseur, G. P. and Solomon, S.: Aeronomy of the Middle Atmosphere, 3, Aeronomy of the Middle Atmosphere: Chemistry and Physics of the Stratosphere and Mesosphere, Springer Dordrecht, Dordrecht, 646 pp., https://doi.org/10.1007/1-4020-3824-0, 2005.
Brohede, S. M., Haley, C. S., McLinden, C. A., Sioris, C. E., Murtagh, D. P., Petelina, S. V., Llewellyn, E. J., Bazureau, A., Goutail, F., Randall, C. E., Lumpe, J. D., Taha, G., Thomasson, L. W., and Gordley, L. L.: Validation of Odin/OSIRIS stratospheric NO2 profiles, J. Geophys. Res.-Atmos., 112, D07310, https://doi.org/10.1029/2006JD007586, 2007.
Brown, L. R., Gunson, M. R., Toth, R. A., Irion, F. W., Rinsland, C. P., and Goldman, A.: 1995 Atmospheric Trace Molecule Spectroscopy (ATMOS) linelist, Appl. Opt., 35, 2828–2848, https://doi.org/10.1364/AO.35.002828, 1996.
Camy-Peyret, C., Flaud, J. M., Laurent, J., and Stokes, G. M.: First infrared measurement of atmospheric NO2 from the ground, Geophys. Res. Lett., 10, 35–38, https://doi.org/10.1029/GL010i001p00035, 1983.
Cariolle, D.: The ozone budget in the stratosphere: Results of a one-dimensional photochemical model, Planet. Space Sci., 31, 1033–1052, https://doi.org/10.1016/0032-0633(83)90093-4, 1983.
Cisewski, M., Zawodny, J., Gasbarre, J., Eckman, R., Topiwala, N., Rodriguez-Alvarez, O., Cheek, D., and Hall, S.: The Strato- spheric Aerosol and Gas Experiment (SAGE III) on the In- ternational Space Station (ISS) Mission, in: Sensors, Sys- tems, and Next-Generation Satellites XVIII, SPIE, 924107, https://doi.org/10.1117/12.2073131, 2014.
Coffey, M. T., Mankin, W. G., and Goldman, A.: Simultaneous spectroscopic determination of the latitudinal, seasonal, and diurnal variability of stratospheric N2O, NO, NO2, and HNO3, J. Geophys. Res., 86, 7331–7341, https://doi.org/10.1029/JC086iC08p07331, 1981.
Cohen, R. C. and Murphy, J. G.: Photochemistry of NO2 in Earth's stratosphere: constraints from observations, Chem. Rev., 103, 4985–4998, https://doi.org/10.1021/cr020647x, 2003.
Crutzen, P. J.: The influence of nitrogen oxides on the atmospheric ozone content, Q. J. Roy. Meteor. Soc., 96, 320–325, https://doi.org/10.1002/qj.49709640815, 1970.
Crutzen, P. J.: The Role of NO and NO2 in the Chemistry of the Troposphere and Stratosphere, Annu. Rev. Earth Pl. Sc., 7, 443–472, https://doi.org/10.1146/annurev.ea.07.050179.002303, 1979.
Dimitropoulou, E., Hendrick, F., Pinardi, G., Friedrich, M. M., Merlaud, A., Tack, F., De Longueville, H., Fayt, C., Hermans, C., Laffineur, Q., Fierens, F., and Van Roozendael, M.: Validation of TROPOMI tropospheric NO2 columns using dual-scan multi-axis differential optical absorption spectroscopy (MAX-DOAS) measurements in Uccle, Brussels, Atmos. Meas. Tech., 13, 5165–5191, https://doi.org/10.5194/amt-13-5165-2020, 2020.
Dubé, K., Randel, W., Bourassa, A., Zawada, D., McLinden, C., and Degenstein, D.: Trends and Variability in Stratospheric NOx Derived From Merged SAGE II and OSIRIS Satellite Observations, J. Geophys. Res.-Atmos., 125, e2019JD031798, https://doi.org/10.1029/2019jd031798, 2020.
Dubé, K., Bourassa, A., Zawada, D., Degenstein, D., Damadeo, R., Flittner, D., and Randel, W.: Accounting for the photochemical variation in stratospheric NO2 in the SAGE III/ISS solar occultation retrieval, Atmos. Meas. Tech., 14, 557–566, https://doi.org/10.5194/amt-14-557-2021, 2021.
Fischer, H.: Remote Sensing of Atmospheric Trace Gases, Interdiscipl. Sci. Rev., 18, 185–191, https://doi.org/10.1179/isr.1993.18.3.185, 1993.
Flaud, J. M., Camy-Peyret, C., Brault, J. W., Rinsland, C. P., and Cariolle, D.: Nighttime and daytime variation of atmospheric NO from ground-based infrared measurements, Geophys. Res. Lett., 15, 261–264, https://doi.org/10.1029/GL015i003p00261, 1988.
Funke, B., López-Puertas, M., von Clarmann, T., Stiller, G. P., Fischer, H., Glatthor, N., Grabowski, U., Höpfner, M., Kellmann, S., Kiefer, M., Linden, A., Mengistu Tsidu, G., Milz, M., Steck, T., and Wang, D. Y.: Retrieval of stratospheric NOx from 5.3 and 6.2 µm nonlocal thermodynamic equilibrium emissions measured by Michelson Interferometer for Passive Atmospheric Sounding (MIPAS) on Envisat, J. Geophys. Res.-Atmos., 110, D09302, https://doi.org/10.1029/2004jd005225, 2005.
Fussen, D., Vanhellemont, F., Dodion, J., Bingen, C., Walker, K. A., Boone, C. D., McLeod, S. D., and Bernath, P. F.: Initial intercomparison of ozone and nitrogen dioxide number density profiles retrieved by the ACE-FTS and GOMOS occultation experiments, Geophys. Res. Lett., 32, L16S02, https://doi.org/10.1029/2005gl022468, 2005.
Godin-Beekmann, S.: Spatial observation of the ozone layer, CR Geosci., 342, 339–348, https://doi.org/10.1016/j.crte.2009.10.012, 2010.
Gordon, I. E., Rothman, L. S., Hargreaves, R. J., Hashemi, R., Karlovets, E. V., Skinner, F. M., Conway, E. K., Hill, C., Kochanov, R. V., Tan, Y., Wcisło, P., Finenko, A. A., Nelson, K., Bernath, P. F., Birk, M., Boudon, V., Campargue, A., Chance, K. V., Coustenis, A., Drouin, B. J., Flaud, J. M., Gamache, R. R., Hodges, J. T., Jacquemart, D., Mlawer, E. J., Nikitin, A. V., Perevalov, V. I., Rotger, M., Tennyson, J., Toon, G. C., Tran, H., Tyuterev, V. G., Adkins, E. M., Baker, A., Barbe, A., Canè, E., Császár, A. G., Dudaryonok, A., Egorov, O., Fleisher, A. J., Fleurbaey, H., Foltynowicz, A., Furtenbacher, T., Harrison, J. J., Hartmann, J. M., Horneman, V. M., Huang, X., Karman, T., Karns, J., Kassi, S., Kleiner, I., Kofman, V., Kwabia–Tchana, F., Lavrentieva, N. N., Lee, T. J., Long, D. A., Lukashevskaya, A. A., Lyulin, O. M., Makhnev, V. Y., Matt, W., Massie, S. T., Melosso, M., Mikhailenko, S. N., Mondelain, D., Müller, H. S. P., Naumenko, O. V., Perrin, A., Polyansky, O. L., Raddaoui, E., Raston, P. L., Reed, Z. D., Rey, M., Richard, C., Tóbiás, R., Sadiek, I., Schwenke, D. W., Starikova, E., Sung, K., Tamassia, F., Tashkun, S. A., Vander Auwera, J., Vasilenko, I. A., Vigasin, A. A., Villanueva, G. L., Vispoel, B., Wagner, G., Yachmenev, A., and Yurchenko, S. N.: The HITRAN2020 molecular spectroscopic database, J. Quant. Spectrosc. Ra., 277, 107949, https://doi.org/10.1016/j.jqsrt.2021.107949, 2022.
Grewe, V., Brunner, D., Dameris, M., Grenfell, J. L., Hein, R., Shindell, D., and Staehelin, J.: Origin and variability of upper tropospheric nitrogen oxides and ozone at northern mid-latitudes, Atmos. Environ., 35, 3421–3433, https://doi.org/10.1016/s1352-2310(01)00134-0, 2001.
Griffin, D., McLinden, C. A., Boersma, F., Bourassa, A., Dammers, E., Degenstein, D., Eskes, H., Fehr, L., Fioletov, V., Hayden, K., Kharol, S. K., Li, S. M., Makar, P., Martin, R. V., Mihele, C., Mittermeier, R. L., Krotkov, N., Sneep, M., Lamsal, L. N., Ter Linden, M., van Geffen, J., Veefkind, P., Wolde, M., and Zhao, X.: High resolution mapping of nitrogen dioxide with TROPOMI: First results and validation over the Canadian oil sands, Geophys. Res. Lett., 46, 1049–1060, https://doi.org/10.1029/2018GL081095, 2019.
Haley, C. S., Brohede, S. M., Sioris, C. E., Griffioen, E., Murtagh, D. P., McDade, I. C., Eriksson, P., Llewellyn, E. J., Bazureau, A., and Goutail, F.: Retrieval of stratospheric O3 and NO2 profiles from Odin Optical Spectrograph and Infrared Imager System (OSIRIS) limb-scattered sunlight measurements, J. Geophys. Res.-Atmos., 109, D16303, https://doi.org/10.1029/2004jd004588, 2004.
Hanst, P. L., Wong, N. W., and Bragin, J.: A long-path infra-red study of Los Angeles smog, Atmos. Environ., 16, 969–981, 1982.
Hase, F., Hannigan, J. W., Coffey, M. T., Goldman, A., Höpfner, M., Jones, N. B., Rinsland, C. P., and Wood, S. W.: Intercomparison of retrieval codes used for the analysis of high-resolution, ground-based FTIR measurements, J. Quant. Spectrosc. Ra., 87, 25–52, https://doi.org/10.1016/j.jqsrt.2003.12.008, 2004.
Hendrick, F., Mahieu, E., Bodeker, G. E., Boersma, K. F., Chipperfield, M. P., De Mazière, M., De Smedt, I., Demoulin, P., Fayt, C., Hermans, C., Kreher, K., Lejeune, B., Pinardi, G., Servais, C., Stübi, R., van der A, R., Vernier, J.-P., and Van Roozendael, M.: Analysis of stratospheric NO2 trends above Jungfraujoch using ground-based UV-visible, FTIR, and satellite nadir observations, Atmos. Chem. Phys., 12, 8851–8864, https://doi.org/10.5194/acp-12-8851-2012, 2012.
Heue, K.-P., Richter, A., Bruns, M., Burrows, J. P., v. Friedeburg, C., Platt, U., Pundt, I., Wang, P., and Wagner, T.: Validation of SCIAMACHY tropospheric NO2-columns with AMAXDOAS measurements, Atmos. Chem. Phys., 5, 1039–1051, https://doi.org/10.5194/acp-5-1039-2005, 2005.
Hönninger, G., von Friedeburg, C., and Platt, U.: Multi axis differential optical absorption spectroscopy (MAX-DOAS), Atmos. Chem. Phys., 4, 231–254, https://doi.org/10.5194/acp-4-231-2004, 2004.
Jaeglé, L., Webster, C. R., May, R. D., Fahey, D. W., Woodbridge, E. L., Keim, E. R., Gao, R. S., Proffitt, M. H., Stimpfle, R. M., Salawitch, R. J., Wofsy, S. C., and Pfister, L.: In situ measurements of the NO ratio for testing atmospheric photochemical models, Geophys. Res. Lett., 21, 2555–2558, https://doi.org/10.1029/94gl02717, 1994.
Johnston, H. S.: Atmospheric ozone, Annu. Rev. Phys. Chem., 43, 1–31, https://doi.org/10.1146/annurev.pc.43.100192.000245, 1992.
Kerzenmacher, T., Wolff, M. A., Strong, K., Dupuy, E., Walker, K. A., Amekudzi, L. K., Batchelor, R. L., Bernath, P. F., Berthet, G., Blumenstock, T., Boone, C. D., Bramstedt, K., Brogniez, C., Brohede, S., Burrows, J. P., Catoire, V., Dodion, J., Drummond, J. R., Dufour, D. G., Funke, B., Fussen, D., Goutail, F., Griffith, D. W. T., Haley, C. S., Hendrick, F., Höpfner, M., Huret, N., Jones, N., Kar, J., Kramer, I., Llewellyn, E. J., López-Puertas, M., Manney, G., McElroy, C. T., McLinden, C. A., Melo, S., Mikuteit, S., Murtagh, D., Nichitiu, F., Notholt, J., Nowlan, C., Piccolo, C., Pommereau, J.-P., Randall, C., Raspollini, P., Ridolfi, M., Richter, A., Schneider, M., Schrems, O., Silicani, M., Stiller, G. P., Taylor, J., Tétard, C., Toohey, M., Vanhellemont, F., Warneke, T., Zawodny, J. M., and Zou, J.: Validation of NO2 and NO from the Atmospheric Chemistry Experiment (ACE), Atmos. Chem. Phys., 8, 5801–5841, https://doi.org/10.5194/acp-8-5801-2008, 2008.
Lamarque, J.-F., Kinnison, D. E., Mills, M. J., Marsh, D. R., Calvo, N., and Polvani, L. M.: Climate Change from 1850 to 2005 Simulated in CESM1(WACCM), J. Climate, 26, 7372–7391, https://doi.org/10.1175/jcli-d-12-00558.1, 2013.
Lary, D. J.: Catalytic destruction of stratospheric ozone, J. Geophys. Res.-Atmos., 102, 21515–21526, https://doi.org/10.1029/97jd00912, 1997.
Laughner, J., Andrews, A., Roche, S., Kiel, M., and Toon, G. C.: ginput v1.1.15: GGG2020 prior profile software, CaltechDATA [code], https://doi.org/10.22002/D1.8974, 2022.
Li, K.-F., Khoury, R., Pongetti, T. J., Sander, S. P., Mills, F. P., and Yung, Y. L.: Diurnal variability of stratospheric column NO2 measured using direct solar and lunar spectra over Table Mountain, California (34.38° N), Atmos. Meas. Tech., 14, 7495–7510, https://doi.org/10.5194/amt-14-7495-2021, 2021.
McLinden, C. A., Olsen, S. C., Hannegan, B., Wild, O., Prather, M. J., and Sundet, J.: Stratospheric ozone in 3-D models: A simple chemistry and the cross-tropopause flux, J. Geophys. Res.-Atmos., 105, 14653–14665, https://doi.org/10.1029/2000jd900124, 2000.
Murphy, D. M., Fahey, D. W., Proffitt, M. H., Liu, S. C., Chan, K. R., Eubank, C. S., Kawa, S. R., and Kelly, K. K.: Reactive nitrogen and its correlation with ozone in the lower stratosphere and upper troposphere, J. Geophys. Res.-Atmos., 98, 8751–8773, https://doi.org/10.1029/92jd00681, 1993.
Notholt, J., Meier, A., and Peil, S.: Total column densities of tropospheric and stratospheric trace gases in the undisturbed Arctic summer atmosphere, J. Atmos. Chem., 20, 311–332, https://doi.org/10.1007/bf00694500, 1995.
Nürnberg, P., Strode, S. A., and Sussmann, R.: Solar FTIR measurements of NOx vertical distributions: Part II) Experiment-based scaling factors describing the diurnal increase of stratospheric NO2 and NO, EGUsphere [preprint], https://doi.org/10.5194/egusphere-2023-1437, 2023.
Platt, U. and Stutz, J.: Differential Absorption Spectroscopy, in: Differential Optical Absorption Spectroscopy: Principles and Applications, Physics of Earth and Space Environments, Springer Berlin Heidelberg, Berlin, Heidelberg, 135–174, https://doi.org/10.1007/978-3-540-75776-4_6, 2008.
Pommereau, J. P. and Goutail, F.: Stratospheric O3 and NO2 observations at the southern polar circle in summer and fall 1988, Geophys. Res. Lett., 15, 895–897, https://doi.org/10.1029/GL015i008p00895, 1988.
Ricaud, P., Baron, P., and de La Noë, J.: Quality assessment of ground-based microwave measurements of chlorine monoxide, ozone, and nitrogen dioxide from the NDSC radiometer at the Plateau de Bure, Ann. Geophys., 22, 1903–1915, https://doi.org/10.5194/angeo-22-1903-2004, 2004.
Richter, A. and Burrows, J. P.: Tropospheric NO2 from GOME measurements, Adv. Space Res., 29, 1673–1683, https://doi.org/10.1016/s0273-1177(02)00100-x, 2002.
Rinsland, C. P., Goldman, A., Murcray, F. J., Murcray, F. H., Blatherwick, R. D., and Murcray, D. G.: Infrared measurements of atmospheric gases above Mauna Loa, Hawaii, in February 1987, J. Geophys. Res., 93, 12607–12626, https://doi.org/10.1029/JD093iD10p12607, 1988.
Rodgers, C. D.: Information content and optimisation of high spectral resolution remote measurements, Adv. Space Res., 21, 361–367, https://doi.org/10.1016/s0273-1177(97)00915-0, 1998.
Rusch, D. W.: Satellite ultraviolet measurements of nitric oxide fluorescence with a diffusive transport model, J. Geophys. Res., 78, 5676–5686, https://doi.org/10.1029/JA078i025p05676, 1973.
Sierk, B., Richter, A., Rozanov, A., Von Savigny, C., Schmoltner, A. M., Buchwitz, M., Bovensmann, H., and Burrows, J. P.: Retrieval and monitoring of atmospheric trace gas concentrations in nadir and limb geometry using the space-borne SCIAMACHY instrument, Environ. Monit. Assess., 120, 65–77, https://doi.org/10.1007/s10661-005-9049-9, 2006.
Solomon, S., Russell III, J. M., and Gordley, L. L.: Observations of the diurnal variation of nitrogen dioxide in the stratosphere, J. Geophys. Res.-Atmos., 91, 5455–5464, https://doi.org/10.1029/JD091iD05p05455, 1986.
Solomon, S., Schmeltekopf, A. L., and Sanders, R. W.: On the interpretation of zenith sky absorption measurements, J. Geophys. Res., 92, 8311–8319, https://doi.org/10.1029/JD092iD07p08311, 1987.
Strode, S. A., Taha, G., Oman, L. D., Damadeo, R., Flittner, D., Schoeberl, M., Sioris, C. E., and Stauffer, R.: SAGE III/ISS ozone and NO2 validation using diurnal scaling factors, Atmos. Meas. Tech., 15, 6145–6161, https://doi.org/10.5194/amt-15-6145-2022, 2022.
Sussmann, R.: Ground-based Fourier transform spectrometry at the NDSC site Zugspitze: Geophysical products for satellite validation, Proceedings of the European Symposium on Atmospheric Measurements from Space, ESTEC, Noordwijk, the Netherlands, 18–22 January, WPP-161, 2, 661–664, 1999.
Sussmann, R. and Schäfer, K.: Infrared spectroscopy of tropospheric trace gases: combined analysis of horizontal and vertical column abundances, Appl. Opt., 36, 735–741, https://doi.org/10.1364/AO.36.000735, 1997.
Sussmann, R., Stremme, W., Burrows, J. P., Richter, A., Seiler, W., and Rettinger, M.: Stratospheric and tropospheric NO2 variability on the diurnal and annual scale: a combined retrieval from ENVISAT/SCIAMACHY and solar FTIR at the Permanent Ground-Truthing Facility Zugspitze/Garmisch, Atmos. Chem. Phys., 5, 2657–2677, https://doi.org/10.5194/acp-5-2657-2005, 2005.
Tack, F., Hendrick, F., Goutail, F., Fayt, C., Merlaud, A., Pinardi, G., Hermans, C., Pommereau, J.-P., and Van Roozendael, M.: Tropospheric nitrogen dioxide column retrieval from ground-based zenith–sky DOAS observations, Atmos. Meas. Tech., 8, 2417–2435, https://doi.org/10.5194/amt-8-2417-2015, 2015.
Tikhonov, A. N.: On the solution of ill-posed problems and the method of regularization, Dokl. Akad. Nauk SSSR+, 151, 501–504, 1963.
Tripp, J. T.: The UNEP montreal protocol: Industrialized and developing countries sharing the responsibility for protecting the stratospheric ozone layer, NYUJ Int'l L. & Pol., 20, 733 pp., https://heinonline.org/HOL/LandingPage?handle=hein.journals/nyuilp20&div=33&id=&page= (last access: 17 March 2024), 1987.
van Geffen, J., Eskes, H., Compernolle, S., Pinardi, G., Verhoelst, T., Lambert, J.-C., Sneep, M., ter Linden, M., Ludewig, A., Boersma, K. F., and Veefkind, J. P.: Sentinel-5P TROPOMI NO2 retrieval: impact of version v2.2 improvements and comparisons with OMI and ground-based data, Atmos. Meas. Tech., 15, 2037–2060, https://doi.org/10.5194/amt-15-2037-2022, 2022.
Vandaele, A. C., Fayt, C., Hendrick, F., Hermans, C., Humbled, F., Van Roozendael, M., Gil, M., Navarro, M., Puentedura, O., Yela, M., Braathen, G., Stebel, K., Tørnkvist, K., Johnston, P., Kreher, K., Goutail, F., Mieville, A., Pommereau, J.-P., Khaikine, S., Richter, A., Oetjen, H., Wittrock, F., Bugarski, S., Frieß, U., Pfeilsticker, K., Sinreich, R., Wagner, T., Corlett, G., and Leigh, R.: An intercomparison campaign of ground-based UV-visible measurements of NO2, BrO, and OClO slant columns: Methods of analysis and results for NO2, J. Geophys. Res.-Atmos., 110, D08305, https://doi.org/10.1029/2004jd005423, 2005.
Verhoelst, T., Compernolle, S., Pinardi, G., Lambert, J.-C., Eskes, H. J., Eichmann, K.-U., Fjæraa, A. M., Granville, J., Niemeijer, S., Cede, A., Tiefengraber, M., Hendrick, F., Pazmiño, A., Bais, A., Bazureau, A., Boersma, K. F., Bognar, K., Dehn, A., Donner, S., Elokhov, A., Gebetsberger, M., Goutail, F., Grutter de la Mora, M., Gruzdev, A., Gratsea, M., Hansen, G. H., Irie, H., Jepsen, N., Kanaya, Y., Karagkiozidis, D., Kivi, R., Kreher, K., Levelt, P. F., Liu, C., Müller, M., Navarro Comas, M., Piters, A. J. M., Pommereau, J.-P., Portafaix, T., Prados-Roman, C., Puentedura, O., Querel, R., Remmers, J., Richter, A., Rimmer, J., Rivera Cárdenas, C., Saavedra de Miguel, L., Sinyakov, V. P., Stremme, W., Strong, K., Van Roozendael, M., Veefkind, J. P., Wagner, T., Wittrock, F., Yela González, M., and Zehner, C.: Ground-based validation of the Copernicus Sentinel-5P TROPOMI NO2 measurements with the NDACC ZSL-DOAS, MAX-DOAS and Pandonia global networks, Atmos. Meas. Tech., 14, 481–510, https://doi.org/10.5194/amt-14-481-2021, 2021.
Virolainen, Y., Timofeyev, Y., Polyakov, A., Ionov, D., and Poberovsky, A.: Intercomparison of satellite and ground-based measurements of ozone, NO2, HF, and HCl near Saint Petersburg, Russia, Int. J. Remote Sens., 35, 5677–5697, https://www.tandfonline.com/doi/full/10.1080/01431161.2014.945009 (last access: 17 March 2024), 2014.
Wang, S., Li, K.-F., Zhu, D., Sander, S. P., Yung, Y. L., Pazmino, A., and Querel, R.: Solar 11-Year Cycle Signal in Stratospheric Nitrogen Dioxide – Similarities and Discrepancies Between Model and NDACC Observations, Sol. Phys., 295, 117, https://doi.org/10.1007/s11207-020-01685-1, 2020.
Wetzel, G., Bracher, A., Funke, B., Goutail, F., Hendrick, F., Lambert, J.-C., Mikuteit, S., Piccolo, C., Pirre, M., Bazureau, A., Belotti, C., Blumenstock, T., De Mazière, M., Fischer, H., Huret, N., Ionov, D., López-Puertas, M., Maucher, G., Oelhaf, H., Pommereau, J.-P., Ruhnke, R., Sinnhuber, M., Stiller, G., Van Roozendael, M., and Zhang, G.: Validation of MIPAS-ENVISAT NO2 operational data, Atmos. Chem. Phys., 7, 3261–3284, https://doi.org/10.5194/acp-7-3261-2007, 2007.
Wiacek, A., Jones, N. B., Strong, K., Taylor, J. R., Mittermeier, R. L., and Fast, H.: First detection of meso-thermospheric Nitric Oxide (NO) by ground-based FTIR solar absorption spectroscopy, Geophys. Res. Lett., 33, L03811, https://doi.org/10.1029/2005gl024897, 2006.
World Health Organization. Regional Office for Europe: Health aspects of air pollution with particulate matter, ozone and nitrogen dioxide: report on a WHO working group, Bonn, Germany, 13–15 January 2003, Copenhagen, WHO Regional Office for Europe, https://apps.who.int/iris/handle/10665/107478 (last access: 17 March 2024), 2003.
Yin, H., Sun, Y., Liu, C., Zhang, L., Lu, X., Wang, W., Shan, C., Hu, Q., Tian, Y., Zhang, C., Su, W., Zhang, H., Palm, M., Notholt, J., and Liu, J.: FTIR time series of stratospheric NO2 over Hefei, China, and comparisons with OMI and GEOS-Chem model data, Opt. Express, 27, A1225–A1240, https://doi.org/10.1364/OE.27.0A1225, 2019.
York, D., Evensen, N. M., Martıìnez, M. L., and Delgado, J. D. B.: Unified equations for the slope, intercept, and standard errors of the best straight line, Am. J. Phys., 72, 367–375, https://doi.org/10.1119/1.1632486, 2004.
Zhou, M., Langerock, B., Vigouroux, C., Dils, B., Hermans, C., Kumps, N., Nan, W., Metzger, J.-M., Mahieu, E., Wang, T., Wang, P., and De Mazière, M.: Tropospheric and stratospheric NO retrieved from ground-based Fourier-transform infrared (FTIR) measurements, Atmos. Meas. Tech., 14, 6233–6247, https://doi.org/10.5194/amt-14-6233-2021, 2021.
- Abstract
- Introduction
- Photochemistry of stratospheric NOx
- FTIR measurement and retrieval strategy
- NOx vertical profiles and pollution filter
- NO2 diurnal increasing rate
- NO increasing rate
- Summary and conclusions
- Data availability
- Author contributions
- Competing interests
- Disclaimer
- Acknowledgements
- Financial support
- Review statement
- References
- Supplement
The requested paper has a corresponding corrigendum published. Please read the corrigendum first before downloading the article.
- Article
(3830 KB) - Full-text XML
- Corrigendum
- Companion paper
-
Supplement
(3222 KB) - BibTeX
- EndNote
- Abstract
- Introduction
- Photochemistry of stratospheric NOx
- FTIR measurement and retrieval strategy
- NOx vertical profiles and pollution filter
- NO2 diurnal increasing rate
- NO increasing rate
- Summary and conclusions
- Data availability
- Author contributions
- Competing interests
- Disclaimer
- Acknowledgements
- Financial support
- Review statement
- References
- Supplement