the Creative Commons Attribution 4.0 License.
the Creative Commons Attribution 4.0 License.
 | 26 Mar 2024
Production of oxygenated volatile organic compounds from the ozonolysis of coastal seawater
Delaney B. Kilgour
Gordon A. Novak
Megan S. Claflin
Brian M. Lerner
Timothy H. Bertram
Dry deposition of ozone (O3) to the ocean surface and the ozonolysis of organics in the sea surface microlayer (SSML) are potential sources of volatile organic compounds (VOCs) to the marine atmosphere. We use a gas chromatography system coupled to a Vocus proton-transfer-reaction time-of-flight mass spectrometer to determine the chemical composition and product yield of select VOCs formed from ozonolysis of coastal seawater collected from Scripps Pier in La Jolla, California. Laboratory-derived results are interpreted in the context of direct VOC vertical flux measurements made at Scripps Pier. The dominant products of laboratory ozonolysis experiments and the largest non-sulfur emission fluxes measured in the field correspond to Vocus CxH and CxHyO ions. Gas chromatography (GC) analysis suggests that C5–C11 oxygenated VOCs, primarily aldehydes, are the largest contributors to these ion signals. In the laboratory, using a flow reactor experiment, we determine a VOC yield of 0.43–0.62. In the field at Scripps Pier, we determine a maximum VOC yield of 0.04–0.06. Scaling the field and lab VOC yields for an average O3 deposition flux and an average VOC structure results in an emission source of 10.7 to 167 Tg C yr−1, competitive with the DMS source of approximately 20.3 Tg C yr−1. This study reveals that O3 reactivity to dissolved organic carbon can be a significant carbon source to the marine atmosphere and warrants further investigation into the speciated VOC composition from different seawater samples and the reactivities and secondary organic aerosol (SOA) yields of these molecules in marine-relevant, low NOx conditions.
- Article
(1122 KB) - Full-text XML
-
Supplement
(1186 KB) - BibTeX
- EndNote


The ocean surface acts as a source of volatile organic compounds (VOCs) to the atmosphere (Carpenter et al., 2012), with subsequent impacts on oxidant concentrations and the production of secondary organic aerosol (SOA) (Donahue and Prinn, 1990; Meskhidze et al., 2011; Rinaldi et al., 2010). Three marine VOC production pathways have been proposed: (1) biogenic production controlled by marine biological processes (Carpenter et al., 2012) and abiotic production via (2) photochemical processes (Brüggemann et al., 2018; Carpenter and Nightingale, 2015; Ciuraru et al., 2015a; Novak and Bertram, 2020) or (3) multiphase oxidation reactions at the ocean surface (Carpenter and Nightingale, 2015; Novak and Bertram, 2020; Zhou et al., 2014).
To date, marine VOC research has largely focused on biogenic VOCs (BVOCs), with primary attention given to dimethyl sulfide (DMS) and, to a lesser extent, isoprene and monoterpenes (Lana et al., 2011; Shaw et al., 2010). Marine DMS emissions are estimated to be roughly 20.3 Tg C yr−1 (Hulswar et al., 2022), while marine isoprene and monoterpene emissions are estimated to be 0.1–12 and 0.01–29.5 Tg C yr−1 (Luo and Yu, 2010), respectively, but are generally considered to be on the lower end of these estimates. DMS, isoprene, and monoterpenes have well-established biological production pathways and impacts on secondary marine aerosol production and cloud properties (Bates et al., 1992; Charlson et al., 1987; Kiene and Linn, 2000; Shaw et al., 2010). While isoprene and monoterpene emissions of carbon are much smaller than DMS emissions, they have high SOA yields and much faster bimolecular reaction rate constants with ozone (O3) and hydroxyl radicals (OH) than DMS does, leading to outsized atmospheric impacts despite their smaller emission rates (Griffin et al., 1999; Kroll et al., 2006; Burkholder et al., 2015).
Within the last 10 years, several laboratory experiments and field campaigns have provided evidence that marine VOCs can be formed through abiotic mechanisms at the air–sea interface sea surface microlayer (SSML) (Chiu et al., 2017; Ciuraru et al., 2015a, b; Coburn et al., 2014; Fu et al., 2015; Mungall et al., 2017; Penezić et al., 2023; Schneider et al., 2019; Zhou et al., 2014). Measurements of the SSML have shown it is enriched in unsaturated organics that can undergo photochemical or multiphase oxidation reactions with oxidants like O3 deposited to the ocean surface, and its presence is widespread across the global ocean at wind speeds up to 10 m s−1 (Wurl et al., 2011). Laboratory experiments using model and authentic SSML monolayers have shown photochemical production of a collection of saturated and unsaturated reactive compounds (Chiu et al., 2017; Ciuraru et al., 2015a, b; Fu et al., 2015). Modeling studies suggest interfacial photochemistry could source up to 91.9 Tg C yr−1 (Brüggemann et al., 2018).
The deposition velocity of O3 to the ocean surface is thought to be controlled by the reaction rates of O3 with dissolved iodide (I−) and dissolved organic carbon (DOC). The reaction of O3 with I− leads to the production of iodine (I2) and hypoiodous acid (HOI) (Carpenter et al., 2021), while the reaction of O3 with DOC can lead to the production of VOCs and oxygenated VOCs (OVOCs) (Chang et al., 2004; Schneider et al., 2019; Wang et al., 2023; Zhou et al., 2014). However, the concentration and composition of DOC in the SSML and the reaction kinetics for O3 + DOC species are not well-constrained (Clifford et al., 2008). It is estimated that the reaction rate constant for O3 + I− is orders of magnitude faster than for the O3 + DOC reaction, where M−1 s−1 at 293 K (Shaw and Carpenter, 2013), leading to an O3 reactivity on the order of 60–170 s−1 for representative oceanic I− concentrations (40–120 nM) (Chance et al., 2019), and M−1 s−1 for a marine DOC sample (Shaw and Carpenter, 2013). Due to the paucity of authentic marine kDOC measurements, estimates for O3 reactivity to DOC are relatively unknown, with the only measurement on authentic marine DOC reporting a value of 1820 ± 560 s−1 for 7 × 10⁻⁵ M DOC (Shaw and Carpenter, 2013). In coastal regions, it is thought that O3 reactivity to DOC is large enough to be competitive with I−, whereas I− dominates O3 reactivity in the open ocean (Shaw and Carpenter, 2013; Ganzeveld et al., 2009). Despite uncertainties in the reactivity of O3 with DOC, laboratory studies have shown it is high enough to support the production of a variety of VOCs. Zhou et al. (2014) showed that model SSMLs containing linoleic acid and authentic SSML samples, when exposed to > 350 ppb O3, resulted in prompt emission of a variety of aldehydes at high yield via reaction at the substrate's carbon–carbon double bond and subsequent decomposition of the primary ozonide (Zhou et al., 2014). Similarly, Schneider et al. (2019) measured C1, C5, and C7–C10 carbonyl products from ozonolysis (at 8.5 ppm) of an authentic SSML created from a phytoplankton culture (Schneider et al., 2019). Most recently, Wang et al. (2023) performed ozonolysis experiments with roughly 100 ppb O3 on 10 SSML samples from the South China Sea and reported production rates of acetaldehyde, acetone and/or propanal, and C6–C9 saturated aldehydes.
Using an average O3 deposition flux (1.5 × 10¹⁰ molec. cm−2 s−1 corresponding to an O3 concentration of 30 ppb and deposition velocity of 0.02 cm s−1), Novak and Bertram (2020) estimated the carbon mass flux of VOCs from ozonolysis of the seawater surface to be 17.5–87.3 Tg C yr−1 (for φVOC ranging 0.1–0.5) (Novak and Bertram, 2020), competitive with the carbon mass flux from BVOCs (e.g., DMS flux estimated at 20.3 Tg C yr−1) (Hulswar et al., 2022) and a proposed photochemical source (23.2–91.9 Tg C yr−1) (Brüggemann et al., 2018). It is important to note that each estimate represents an average over large spatiotemporal variability and comes with limitations and uncertainties. For example, the BVOC DMS estimate is based on the dataset of dissolved DMS concentrations available, the non-DMS BVOC estimate is not well-constrained due to limited measurements, and the proposed photochemical and ozonolysis terms are based on meteorological estimates and scaling of laboratory yields. Nonetheless, the set of molecules produced from the ozonolysis of seawater can be larger, more oxygenated, and unsaturated compared to common marine BVOCs, like DMS and isoprene (Schneider et al., 2019; Wang et al., 2023; Zhou et al., 2014). These properties can enable these molecules to be efficient precursors of SOA and cloud condensation nuclei (CCN) (Lim et al., 2019; Zhao et al., 2015). However, our ability to determine the extent to which this abiotic pathway is active over the ocean and its corresponding atmospheric impacts is limited by uncertainty in how to bridge the gap between fundamental laboratory experiments of ozonolysis with model SSMLs and the significantly more complex and spatially variable seawater surface in ambient environments.
Here we present field measurements of direct eddy covariance VOC vertical fluxes at Ellen Browning Scripps Memorial Pier (herein Scripps Pier) in La Jolla, California, collected with a high-resolution Vocus proton-transfer-reaction time-of-flight mass spectrometer. We assess the contribution of abiotic multiphase oxidation from ozonolysis to the measured carbon mass emission flux at Scripps Pier through controlled laboratory seawater ozonolysis experiments sampled with a coupled gas chromatography system.
Our results indicate that the yield of VOCs from seawater ozonolysis at the ocean surface (φVOC) is at maximum 0.06, while the yield determined in flow reactor experiments in the laboratory is as large as 0.62. Even at the low yield limit (φVOC = 0.04), the ozonolysis of surface seawater is expected to be a significant source of reactive carbon to the marine atmosphere.
2.1 Seawater collection, storage, and measurements
Seawater used in the laboratory experiments was pumped from below Scripps Pier in La Jolla, California (32°52′00′′ N, 117°15′21′′ W), on 11 November 2020. Collected seawater was filtered through 50 µm Nitex nylon mesh (Flystuff, Cat # 57–106) and stored in amber 1 L Nalgene HDPE bottles. The water was shipped frozen and stored in a −20 °C freezer before and after shipping on 16 November 2020. Individual aliquots of seawater were defrosted to room temperature immediately prior to use in experiments, with all ozonolysis experiments completed within 1 year of sample collection. Seawater I− and DOC concentrations were measured by ion chromatography inductively coupled plasma mass spectrometry (IC-ICP-MS; Thermo Scientific ICS-2100 IC and Thermo Scientific iCAP RQ ICP-MS) and a total organic carbon analyzer (Sievers M5310 C), respectively.
2.2 Flow tube experimental design
All laboratory experiments were performed in a flow tube assembled from a quartz glass tube (Technical Glass Products) and 316 stainless-steel end plates. The flow tube had an inner diameter of 135 mm and a length of 122 cm, providing a total internal volume of 17.4 L. Each stainless-steel end cap was made with Swagelok fittings for headspace gas flow (Fig. S1).
Prior to filling with seawater, O3 was passed through the flow tube for 60 min to oxidize residual contaminants adhered to the walls and provide a clean headspace for the seawater experiments. O3 was generated by passing 100 sccm ultrahigh-purity (UHP) O2 (OX UHP300, Airgas) and 3900 sccm UHP N2 (NI UHP300, Airgas) over a UV lamp (254 nm Pen-Ray Lamp; Jelight, Inc.), producing an O3 concentration of 90 ppb measured with a commercial ozone monitor (Model 49i Ozone Analyzer, Thermo Fisher Scientific).
Once the flow tube was cleaned, it was filled with 1 L of water for each experiment. After filling with water, 4000 sccm UHP air (3200 sccm UHP N2 and 800 sccm UHP O2) and 1.4 sccm UHP CO2 (CD UP300, Airgas), resulting in 350 ppm CO2, flowed through the headspace for approximately 45 min, allowing for BVOCs to degas and the SSML to establish. CO2 was added to improve O3 detection by the chemical ionization mass spectrometer (Novak et al., 2020) described in Sect. 2.3. After 45 min, flow switched to 4000 sccm 90 ppb O3 in N2 to probe VOCs produced from ozonolysis of the surface water, shown in the schematic in Fig. S2. Both setups led to an average residence time of air in the flow tube of 4.3 min. These experiments were also performed using Milli-Q water, which served as a blank for VOC emissions and O3 deposition. Details of the experimental configuration are presented in Table S1 of the Supplement.
2.3 Laboratory VOC and O3 measurements
A high-resolution Vocus proton-transfer-reaction time-of-flight mass spectrometer (PTR-TOF-MS) (herein referred to as RT-Vocus to denote its real-time (RT) operation) (TOFWERK and Aerodyne Research, Inc.) made continuous measurements of VOCs (19–500 ) at 1 Hz time resolution and with a mass resolution of (Krechmer et al., 2018). The focusing ion–molecule reactor had a temperature of 100 °C, a pressure of 1.5 mbar, and an axial electric field gradient of 36.5 V cm−1, leading to a reduced electric field strength () of 125 Td.
A gas chromatography (GC) system equipped with in situ thermal desorption preconcentration (Aerodyne Research, Inc.) was used in tandem with the Vocus, referred to as GC-Vocus, to speciate isomers and determine parent molecules of observed fragment ions (Claflin et al., 2021; Vermeuel et al., 2023). The GC-Vocus preconcentrated analytes by collecting 1 L of air over a 10 min sampling period through a heated sodium sulfite (Na2SO3) oxidant trap at 35 °C and into a thermal desorption preconcentrator (TDPC). The oxidant trap served to remove O3 from the sample air to prevent degradation of the adsorbent traps and column. In the TDPC, the sample is first collected onto a multi-bed adsorbent trap (Tenax TA/Graphitized Carbon/Carboxen 1000, Markes International) and then is transferred to a multi-bed cold trap (Tenax TA/Carbopack X/Carboxen 1003, Markes International), both held at a temperature of 20 °C. The sample flow is next injected onto the GC column (MXT-624, Restek) which follows a programmed temperature ramp from 35–225 °C. This combination of adsorbents and column allows for the detection of a wide range of VOCs and OVOCs, with the system optimized for the analysis of C5–C12 VOCs and C2–C10 OVOCs. The GC was operated on a 30 min total cycle which included a 10 min sample collection period and a 20 min chromatographic separation, recorded by the GC-Vocus at 5 Hz.
Both the GC-Vocus and RT-Vocus subsampled 100 sccm from approximately 3 m of 0.25 in. (6.35 mm) OD PFA tubing that pushed 4000 sccm from the flow tube. Since the long times required for preconcentration and elution from the column are challenging for fast-changing experiments such as these, individual experiments consisting of the entire sequence in Table S1 were sampled by either the RT-Vocus or by the GC-Vocus. Because the GC-Vocus and RT-Vocus did not sample simultaneously during these experiments, we use the GC measurements to qualitatively identify molecules rather than quantify molecules. The collection of RT-Vocus ions that responded to ozonolysis and their temporal signal response to ozonolysis was consistent with total VOCs peaking within 6.5 and 7.5 min in all RT-Vocus experiments, lending confidence that the experiments were reproducible; thus reproducibility was also assumed for comparison between RT-Vocus and GC-Vocus results.
A chemical ionization time-of-flight mass spectrometer (CIMS) (TOFWERK and Aerodyne Research, Inc.) was operated with oxygen anion reagent ion chemistry (Ox-CIMS) to measure O3 at 1 Hz (Bertram et al., 2011; Novak et al., 2020). The high precision and time resolution of the Ox-CIMS was required to measure quick and small fluctuations in O3 during the ozonolysis experiments. A brief explanation of the Ox-CIMS is reported below, with more details on the instrument and ionization scheme available in Novak et al. (2020). Oxygen anions were generated by flowing 2200 sccm UHP N2 and 400 sccm UHP O2 through a polonium-210 α-particle source (P-2021 ionizer, NRD). Oxygen anions reacted with sample air in an ion–molecule reaction (IMR) chamber held at 95 mbar. The product ions then passed through three stages of differential pressure before reaching the ToF mass analyzer. In the experimental conditions used for this study (85 % RH, 350 ppm CO2), O3 was primarily detected at the CO product ( 60) (Novak et al., 2020). As a result, O3 was measured as CO normalized to the sum of the reagent ion (O) and first reagent ion water cluster (O(H2O)). Since the detection of O3 as the CO product is dependent on the CO2 concentration in the experimental flow (Novak et al., 2020), a Los Gatos Research carbonyl sulfide analyzer was placed in-line to continuously measure CO2 (Berkelhammer et al., 2016).
Peak fitting and integration of GC-Vocus, RT-Vocus, and Ox-CIMS data were completed in Tofware v3.2.3 (TOFWERK and Aerodyne Research, Inc.). Chromatogram peak areas were determined using TERN v2.2.18 (Aerodyne Research, Inc.). A collection of non-methane VOCs was calibrated on the RT-Vocus and GC-Vocus using a custom 14-component VOC calibration cylinder (Apel-Riemer Environmental, Inc.). Aldehyde molecules, including pentanal, hexanal, heptanal, octanal, and nonanal (all MilliporeSigma, > 95 % purity), were calibrated on the RT-Vocus by direct injection of aldehyde molecules diluted in methanol into UHP air carrier gas flow. All calibration factors were assumed to be insensitive to specific humidity (Krechmer et al., 2018). Because multiple molecules contributed to individual CxH ions, the average calibration factor (1.29 cps ppt−1) of molecules to their largest product ions was applied to all RT-Vocus ions in Table S3. O3 measured by the Ox-CIMS was quantified through humidity-dependent calibrations using a calibrated ozone source (Model 306 Ozone Calibration Source, 2B Technologies) and an ozone monitor (Model 49i Ozone Analyzer, Thermo Fisher Scientific).
2.4 Scripps Pier VOC and O3 flux measurements
Continuous measurements of O3 (via the Ox-CIMS) (Novak et al., 2020) and of VOC (via the RT-Vocus) (Novak et al., 2022) concentrations and eddy covariance vertical fluxes were made from the coast at Scripps Pier during summer 2018 and September 2019, respectively. In both deployments, the instruments were contained in a temperature-controlled trailer at the end of the 330 m long pier extending 100 m beyond the wave-breaking zone, and their sampling inlets were mounted on a 6.1 m long boom that extended beyond the pier. Details of the Ox-CIMS and RT-Vocus operations and inlet configurations are available in Novak et al. (2020, 2022). Resolvable fluxes above the flux limits of detection were made for 43 ions corresponding to VOCs in the RT-Vocus mass spectra, where the flux limit of detection was equivalent to an 80 % confidence level. Of these 43 ions, 36 had a campaign average positive flux, indicative of emission. The mean flux and flux limit of detection for the largest ion, C5H, were 0.12 and 0.08 ppt m s−1, respectively.
3.1 Flux measurements of VOC emissions at Scripps Pier field site
Figure 1 presents hourly binned campaign diel averages of wind speed and fluxes for all 36 ions recorded on the RT-Vocus with a campaign average positive flux. For this analysis, we only utilize data collected with onshore winds (200–360 °). The number of flux measurements made during the night and early morning were limited and more variable due to wind being primarily from the land during these times (Novak et al., 2022). Wind speeds showed a clear diel profile, peaking at 4 m s−1 at 12:00 PDT (local time), with the total carbon mass emission flux closely following wind speed throughout the day and night. The emission flux of molecules measured as ions on the RT-Vocus is translated to a carbon mass emission flux using the calibration factor for the expected molecule at each ion. Each ion is treated as a unique molecule; thus the total carbon mass emission flux should be interpreted as an upper limit. Ions without a known contributing molecule or calibration factor are quantified using the calibration factor of aldehydes in lab scaled to field sensitivities, using the DMS calibration factor as a transfer standard. Details on the assignment of field calibration factors and a discussion of the introduced uncertainties are in Tables S2 and S3 and Sect. S1, respectively. We note that several ions, including the C5H ion, often had a positive zero, and we have chosen not to background correct the data. The calculation of their emission fluxes, reported below, is unaffected.
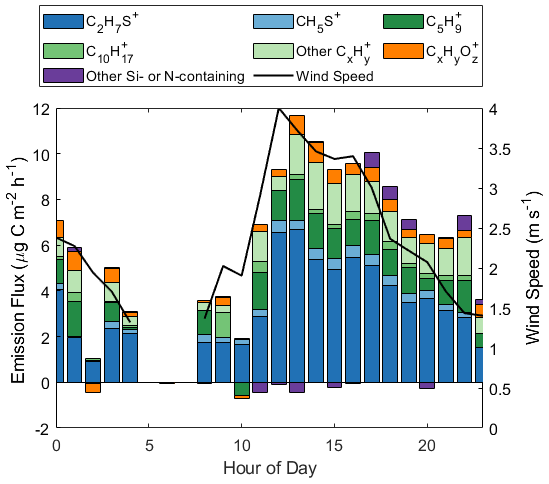
Figure 1Hourly binned wind speed and emission flux of all ions on the RT-Vocus with a campaign average positive flux, reported in units of µg C m−2 h−1. Ions are grouped by chemical formula, where CxH includes all ions with the formula CxH, excluding C5H and C10H.
We show that approximately half of the carbon mass emission flux at the site is carried by organic material, primarily measured at ions with the formula CxH, including C5H and C10H, as well as CxHyO. C5H is the molecular ion of isoprene and a potential fragment for several larger molecules (Ruzsanyi et al., 2013; Pagonis et al., 2019), and C10H is the molecular ion of monoterpene isomers (Pagonis et al., 2019). Other ions with the formula CxH could represent hydrocarbons or dehydrated products of alcohols or carbonyls, which could have biogenic or abiotic sources (Kim et al., 2010). CxHyO ions similarly represent oxygenated organic products of either biogenic or abiotic origin. The remaining half of the carbon flux is composed of sulfur-containing molecules measured at C2H7S+, corresponding to DMS, and CH5S+, corresponding to methanethiol (Novak et al., 2022). The small observed emission flux of Si- and N-containing ions is attributed to the coastal nature and urban influence of this flux site (Coggon et al., 2018; Franklin et al., 2021).
C5H is the ion carrying the largest fraction of organic material. Furthermore, this ion accounted for up to 30 % of the total carbon mass emission flux (at 08:00 PDT) and 12 % on average for the campaign. The hourly binned isoprene-equivalent flux of C5H ranged between −0.56 and 1.8 µg C m−2 h−1, with a campaign average of 1.1 µg C m−2 h−1 or 0.12 ppt m s−1. Other CxH ions (excluding C5H and C10H) comprised a maximum of 23 % of the total carbon mass emission flux (at 22:00 PDT) and 14 % on average for the campaign.
Motivated by the large contribution of C5H ions to the total carbon emission flux at this site, we further investigated the likely molecular composition of this ion and its sources. Utilizing the Johnson and Nightingale parameterizations for transfer velocity with the measured wind speeds and emission fluxes at Scripps Pier, we can calculate what dissolved VOC concentration is needed to sustain observed fluxes (Johnson, 2010; Nightingale et al., 2000). For a wind speed of 3 m s−1 and an emission flux of 0.12 ppt m s−1, we calculate a dissolved isoprene concentration of 0.74 nM is needed to sustain the observed C5H emission flux if this ion is solely isoprene. This dissolved concentration is at least 1 order of magnitude larger than typical oceanic dissolved isoprene concentrations of 1–100 pM (Shaw et al., 2010; Hackenberg et al., 2017; Li et al., 2022). Furthermore, in GC-Vocus experiments measuring the headspace of degassing seawater collected from this site, no isoprene was observed despite observations of other degassing BVOCs, like DMS (Fig. S3).
It has also been suggested that large isoprene fluxes could be driven by photochemistry in the SSML (Brüggemann et al., 2018; Ciuraru et al., 2015b), which would not require a dissolved isoprene concentration. Our observations do not support a photochemical source of C5H, as no correlation between C5H flux and solar irradiance was observed (Fig. 2). This follows observations in the North Atlantic (Kim et al., 2017), where the same finding was shown but for a more limited irradiance range (0–500 W m−2). However, the averaged O3 deposition flux at this site is large enough that even a small product yield from ozonolysis could support these observations. While no clear dependence of the C5H flux on O3 concentrations is measured (Fig. S4), we hypothesize this could be a result of (1) lack of simultaneous C5H emission flux and O3 deposition flux measurements during this study; (2) the site exhibiting little variability in O3 concentrations (31–42 ppb 20th–80th percentile during 2019 study) and O3 deposition velocities (−0.0011–0.027 cm s−1 20th–80th percentile during 2018 study) (Novak et al., 2020), which makes any additional VOC flux from ozonolysis challenging to measure; and (3) the site being coastal near an urban center, which complicates analysis of abiotic emission sources. Thus, the lack of correlation is not necessarily indicative of a lack of a marine abiotic multiphase oxidation VOC source. As a result, we use laboratory experiments to assess whether O3 deposition to the seawater surface and multiphase oxidation of the SSML can resolve a portion of this unexplained C5H and, more broadly, CxH and CxHyOz+ emission flux of organic material.
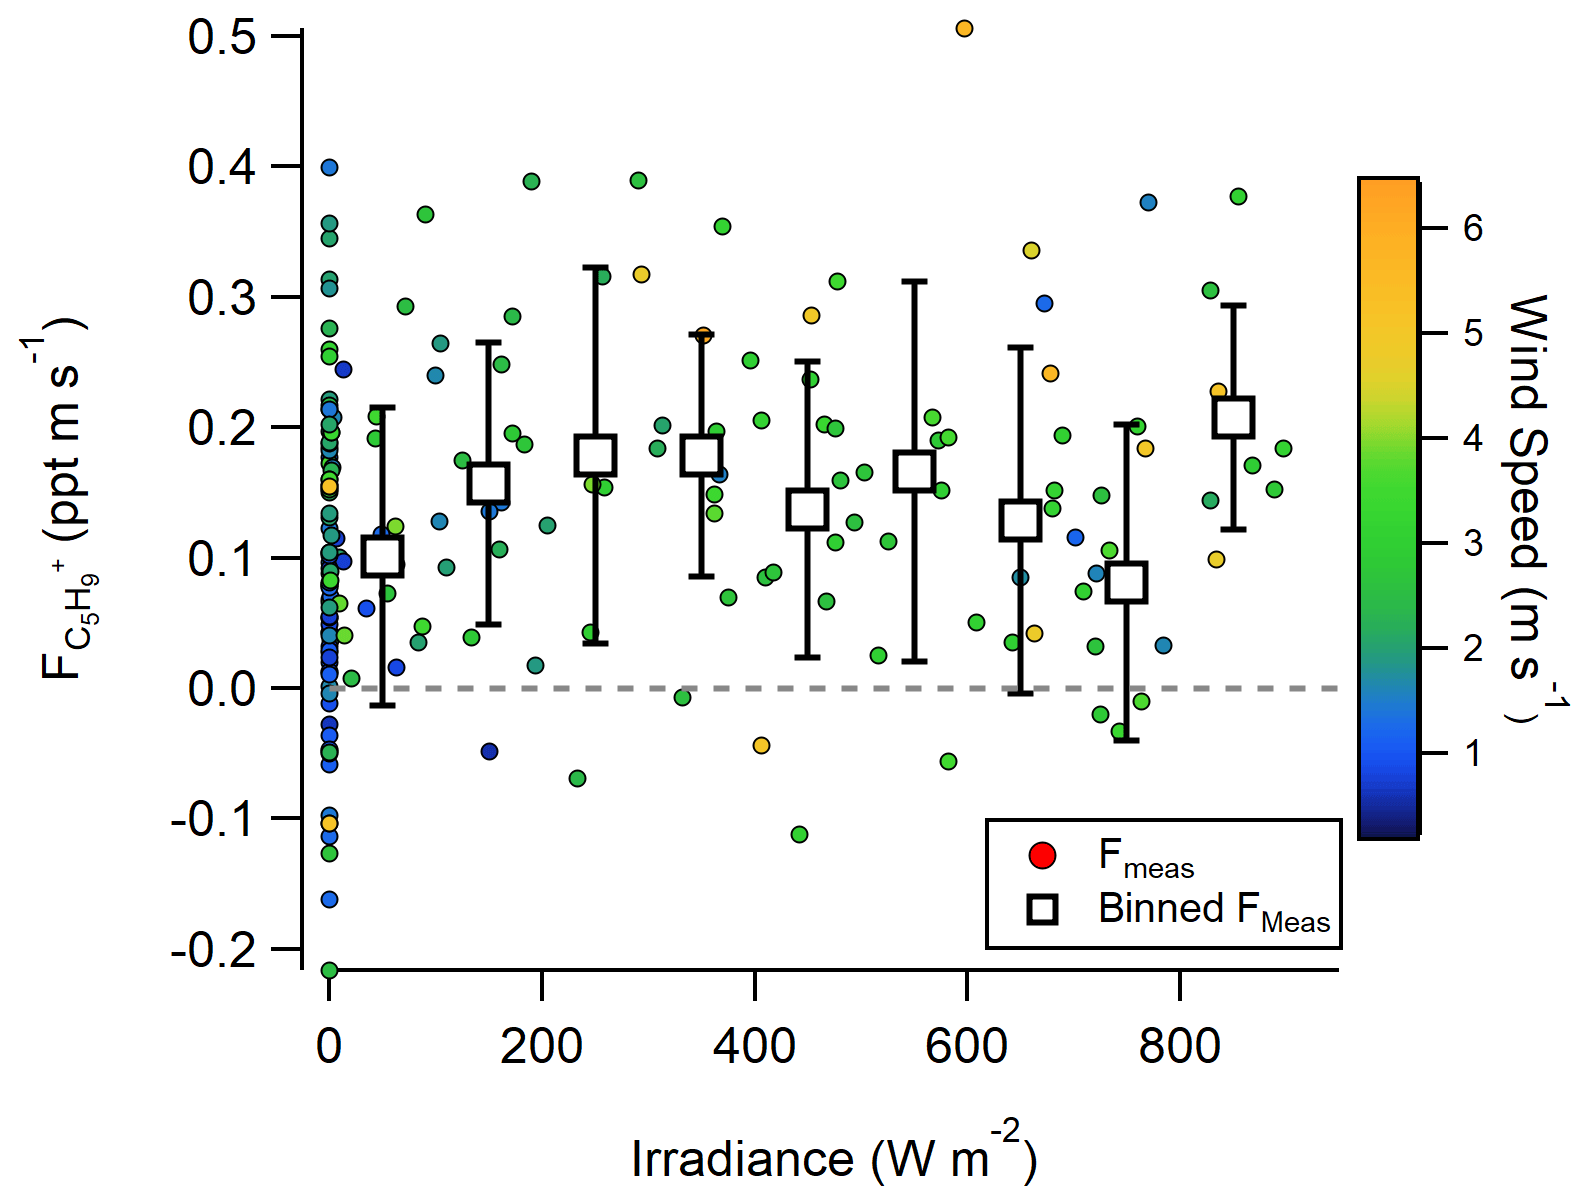
Figure 2Flux of C5H as a function of irradiance measured at Scripps Pier in 2019. C5H flux is calibrated with the isoprene calibration factor in this figure.
3.2 Assessing the contribution of SSML ozonolysis to marine VOC production in laboratory experiments
A typical experiment followed the sequence presented in Table S1, and, for the purpose of this paper, we will focus on results from step 4 of the sequence, corresponding to ozonolysis of a water surface. A total of 13 ions measured on the RT-Vocus, all with the ion formula of either CxHyO or CxH, including C5H, showed a prompt response to ozonolysis of the seawater surface above a minimum threshold value, as explained by and listed in Table S3. For the rest of the paper, we will prioritize discussion of the five ions with the largest ozonolysis yields and group the remaining ions with an ozonolysis response into “other ions”. Given that the proton transfer reaction is favorable for the majority of VOCs and the expected oxygenated products of ozonolysis reactions, we take this collection of ions to represent the total VOCs produced from SSML ozonolysis (Pagonis et al., 2019). Experiments were completed using both seawater and Milli-Q separately. Since Milli-Q should have no I− or DOC to drive O3 deposition and VOC production, it served to capture the instrument and flow tube background (Fig. S5). As a result, abiotic VOC production from O3 deposition to seawater, ΔVOC and ΔO3, respectively, are defined according to Eqs. (1) and (2).
The average ΔVOC and ΔO3 for the experiments are shown in Fig. 3, where the different ions detected correspond to the RT-Vocus detection of molecules produced from reactions of O3 with DOC constituents. Abiotic VOC production is prompt, with total VOCs peaking at 2.4 ppb after 6.6 min of 90 ppb O3 exposure, representing an 831 % increase in VOC emissions from 0 min of O3 exposure. A test where O3 addition bypassed the flow tube confirmed that the prompt VOC response observed in Fig. 3 was a product of O3 deposition to the seawater surface rather than reactions between O3 and VOCs in tubing (Fig. S6). The non-zero VOC at 0 min suggests that the abiotic VOCs studied may also be dissolved, either from biogenic or anthropogenic sources, leading to a small residual signal from the surface degassing. After peaking, total VOC decays to within 50 % of its maximum within 5 min, and, after 60 min of O3 exposure, a residual 0.49 ppb VOC remains. This represents an increase of 0.23 ppb from the initial VOC at 0 min, implying that the VOC peak at 6.6 min and the sustained low VOC at 60 min are produced from different reactant molecules in the DOC with varying reaction rates with O3, or this is on the timescale of surface renewal replenishing the SSML with reactive DOC. Utilizing ΔVOC over 60 min, a DOC measurement of 32 µM, and assuming 8 carbons based on the median carbon number of molecules in these experiments (Sect. 3.4), we calculate the fraction of organic carbon going to the gas phase in the experiment to be < 0.001 %.
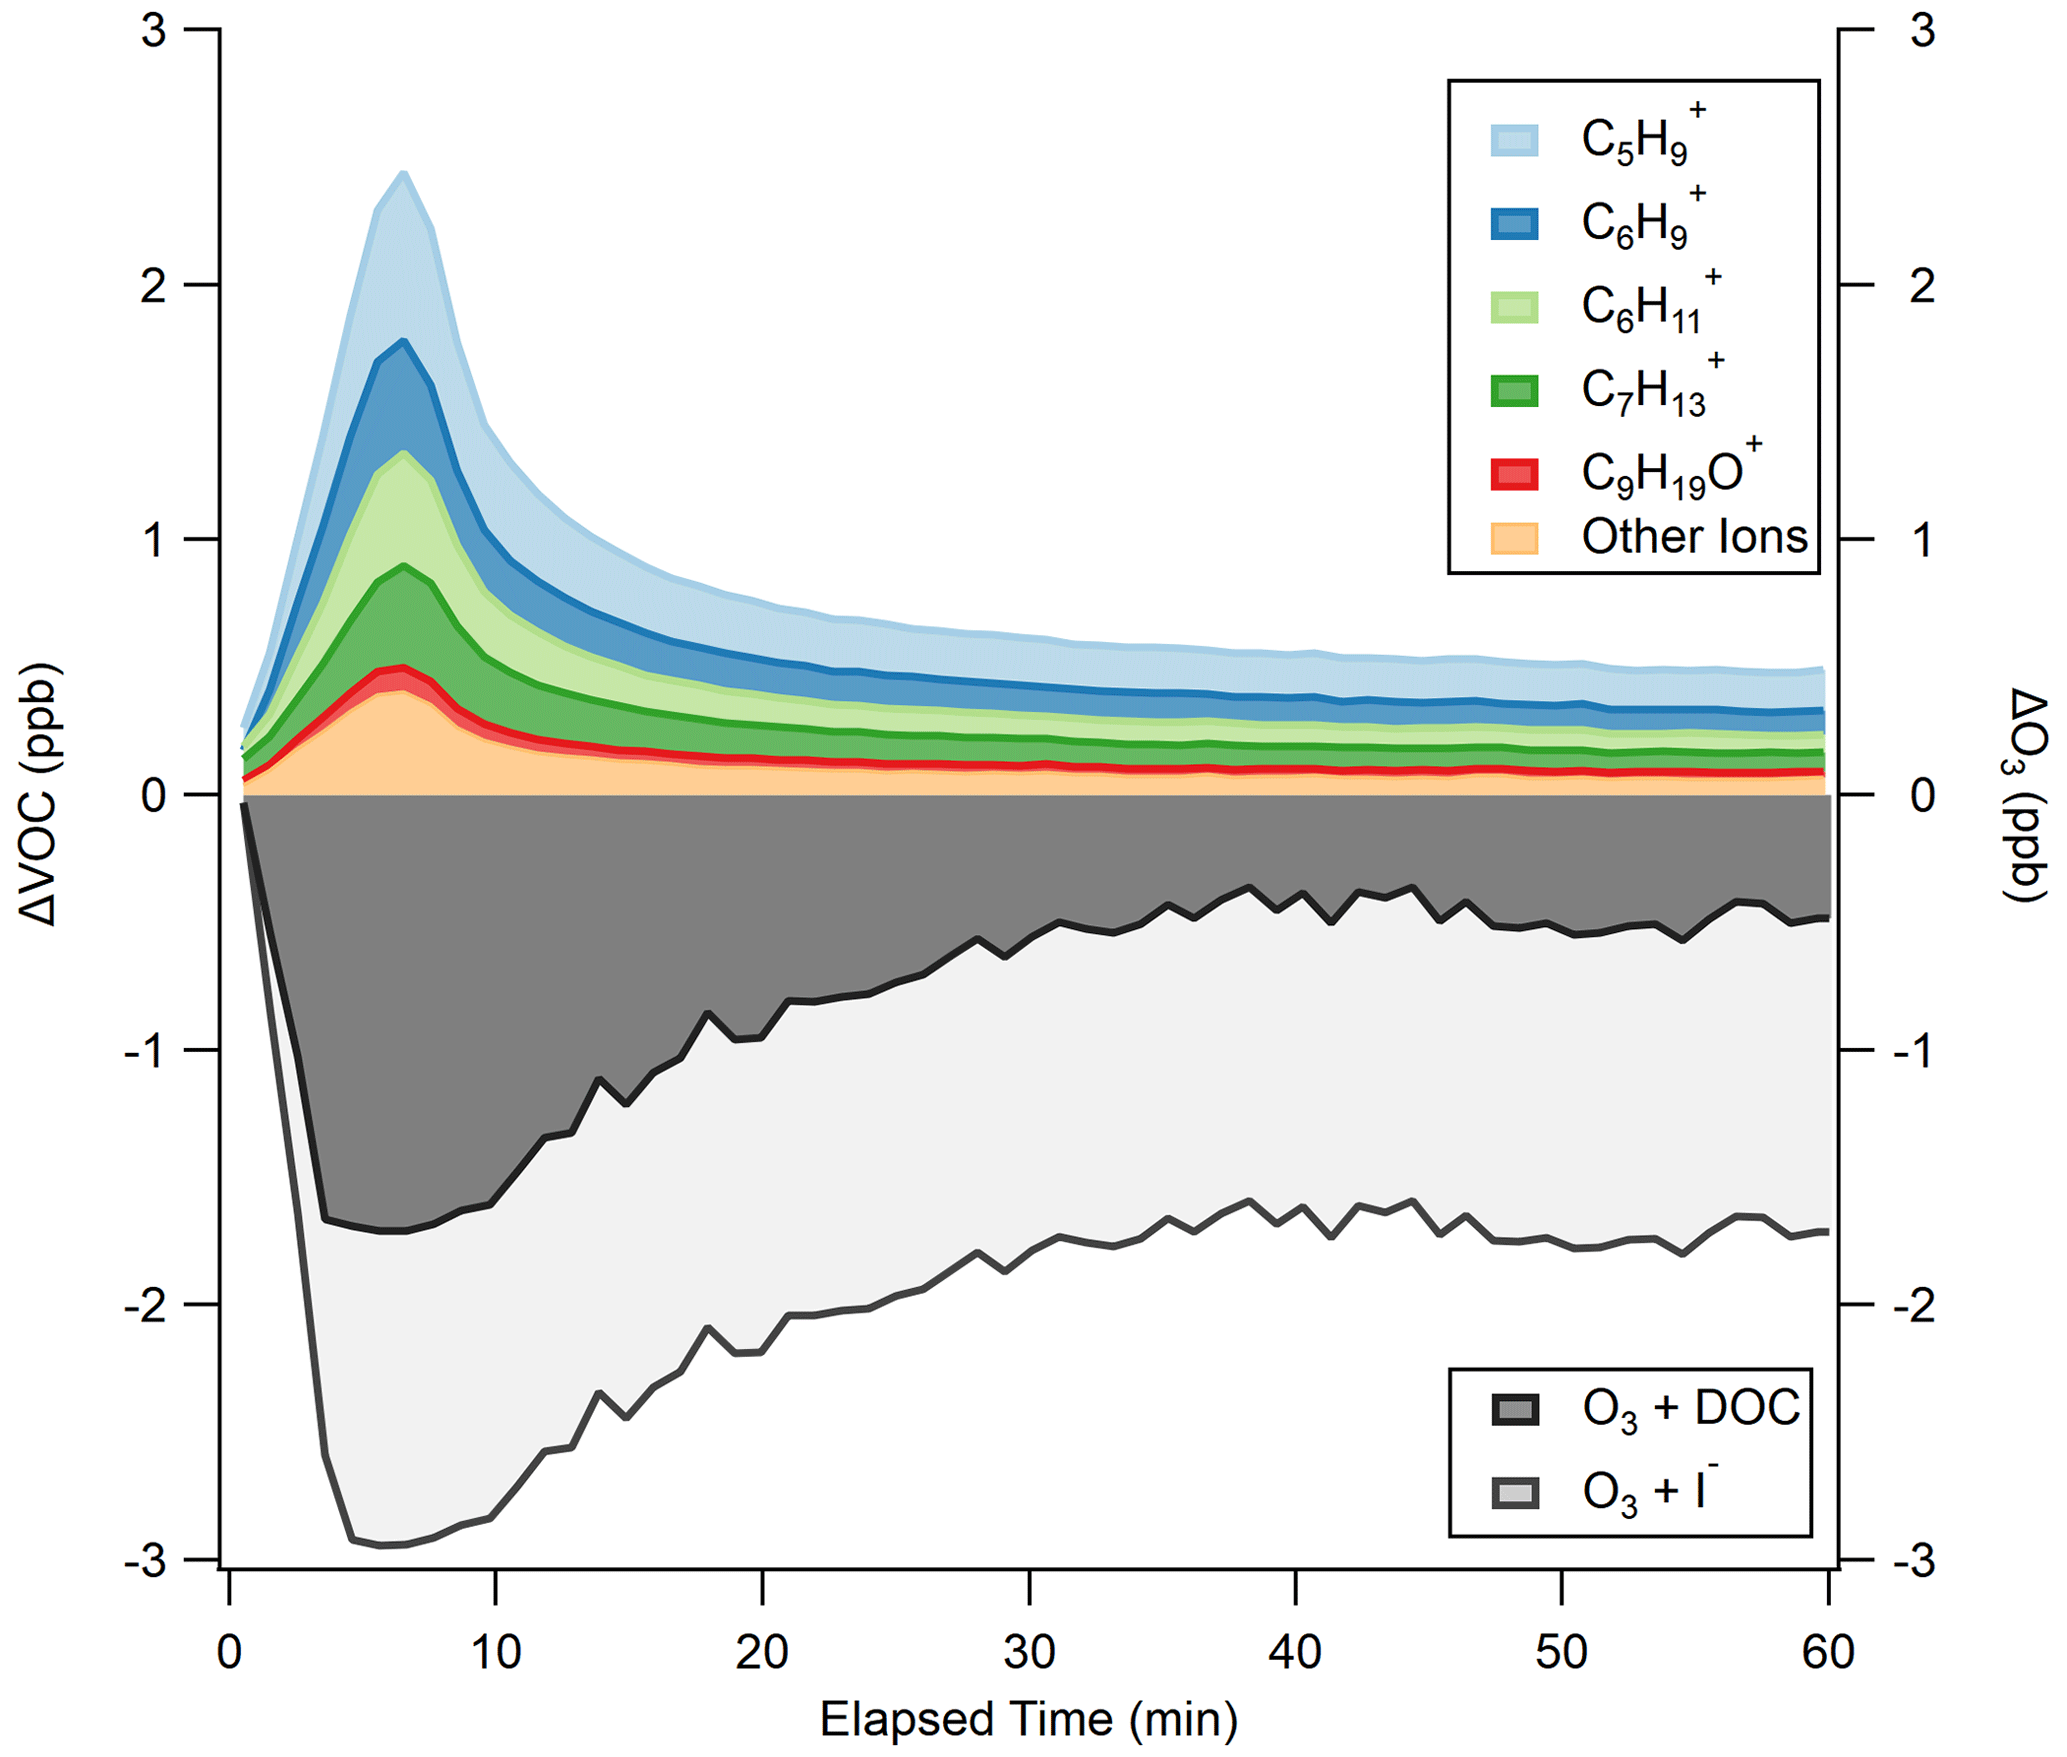
Figure 3ΔVOC as measured by the RT-Vocus, with individual ion contributions calibrated with an average sensitivity of 1.29 cps ppt−1 stacked to sum to the total. ΔO3 as measured by the Ox-CIMS is partitioned into calculated contributions from I− (light gray) and DOC (dark gray) using the measured [I−] of 110.9 nM and an O3 + I− rate constant determined experimentally (Fig. S8).
O3 deposition closely follows VOC production (R2 = 0.69; Fig. S7), with the largest O3 loss to the surface (2.9 ppb) occurring at 6.6 min of O3 exposure, in line with peak VOC production. ΔO3 changes quickly during the first 25 min of O3 exposure and then stabilizes around −1.7 ppb for the remaining experiment time. The measured ΔO3 by the Ox-CIMS is a total O3 loss to the surface, driven by both I− and DOC. We partition the measured ΔO3 to I− using the measured I− concentration of 110.9 nM, which is on the higher side of reported [I−] but still typical for coastal regions (Chance et al., 2019), and our experimentally measured loss rate for the O3 + I− reaction (Fig. S8). For this calculation, we assume that the near-surface [I−] is equal to the measured bulk [I−] concentration; that the surface and bulk I− + O3 rate constants are equal; and that iodide is not depleted by O3, which could happen at high O3 concentrations (Schneider et al., 2020). While this is an oversimplification of the near-surface chemistry of this reaction, as discussed in Prophet et al. (2024), a more detailed treatment of this chemistry is beyond the scope of this analysis. In the absence of a chemical reaction, it is possible that the near-surface iodide concentration is slightly different than the bulk iodide concentration (dos Santos et al., 2008). If we assume the remaining measured ΔO3 is lost to the O3 + DOC reaction, on average, I− contributes 60 % and DOC 40 % of O3 loss during the full experimental duration in Fig. 3. The uncertainty in the apportionment of O3 reactivity between I− and DOC is dependent on the measurement of O3 loss to solutions containing only I− (at equivalent [I−] found in the seawater samples), as presented in Fig. S8. Using [I−] = 110.9 nM and M−1 s−1, the calculated partitioning of O3 loss corresponds to a bulk I− reactivity of 155 s−1 ± 20 % and a bulk DOC reactivity of 104 s−1 ± 35 %. The uncertainty in the absolute magnitude of I− reactivity is propagated from uncertainty in the chosen bulk rate constant ( M−1 s−1) (14 %) (Shaw and Carpenter, 2013) and in the measurement of I− concentration (5 %). The uncertainty in the absolute magnitude of DOC reactivity is propagated from the I− reactivity (∼ 20 %) and from uncertainty in the fraction of O3 that reacts with DOC (14 %), giving a total uncertainty of ∼ 35 %. The bulk I− reactivity is within a typical range for oceanic conditions (60–170 s−1) (Chance et al., 2019; Shaw and Carpenter, 2013). Bulk DOC reactivity is 1 order of magnitude lower than what was experimentally determined in Shaw and Carpenter (2013). However, the DOC reactivity in Shaw and Carpenter (2013) is caveated as being anomalously high, as they suspect their DOC extract used for analysis was biased toward the more O3-reactive fraction; thus their rate constant might not be representative of true marine DOC.
3.3 Comparison of laboratory and field yields of VOC and O3 deposition
Table 1 presents total VOC and ion-specific VOC yields (φVOC) for lab and field experiments. Molecules which can contribute to the individual ions on the RT-Vocus were determined through GC-Vocus measurements of laboratory ozonolysis experiments and are presented alongside yields in Table 1. GC-Vocus results will be discussed in Sect. 3.4.
Table 1Laboratory and field VOC yields from ozonolysis using measurements from the RT-Vocus and Ox-CIMS. Molecules that can contribute to ions with ozonolysis responses are provided by the GC-Vocus.
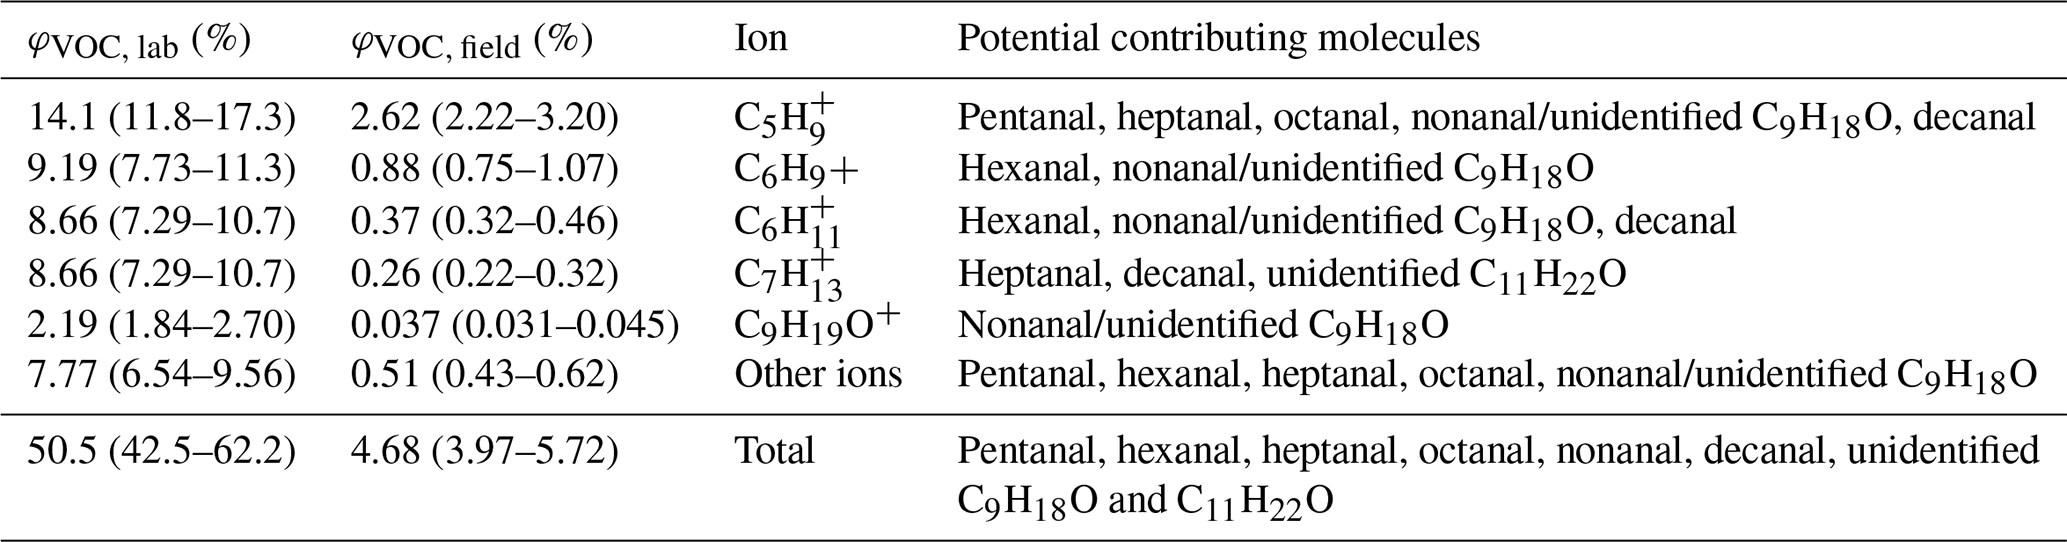
VOC yields from laboratory experiments (φVOC, lab), speciated by ions contributing to the total signal, were calculated from Fig. 3 according to Eq. (3), where areas refer to the integrated area under the curve for the ΔVOC and ΔO3 time series. VOCs were quantified based on the average aldehyde calibration factor and the range in yield reflects 1σ standard deviations in O3.
In order to compare φVOC, lab with VOC yields from the Scripps Pier field flux measurements, where we do not have DOC measurements to be able to partition O3 loss to organics, ΔO3 is taken as the total measured O3 loss to both DOC and I− in Fig. 3. Areas were calculated by integrating from 0 to 25 min, marked by the time point when ΔO3 was within 15 % of steady-state ΔO3, to capture the VOC production from prompt ozonolysis. This resulted in an average φVOC, lab of 0.51 (0.430–0.62). If we instead integrate the full 0 to 60 min of the experiment, φVOC, lab decreases to an average of 0.41 (0.34–0.52). However, the distribution of RT-Vocus ions contributing to the total VOC yield is very similar between prompt (0–25 min) and steady-state (25–60 min) ozonolysis (Fig. S9). The decrease in yield, but largely unchanged composition of RT-Vocus ions, implies the surface concentration of reactive organics is being depleted over time and is not being replenished on the timescale of O3 deposition.
VOC yields from field flux measurements at Scripps Pier (φVOC, field) were calculated according to Eq. (4).
For the purpose of comparison, we investigate the subset of RT-Vocus ions with statistically significant responses during lab ozonolysis experiments (Tables 1 and S3). FVOC is the mean VOC flux measured at Scripps Pier in 2019 using the isoprene calibration factor for C5H and an average aldehyde calibration factor of 4.1 cps ppt−1 for other VOCs. is calculated from the mean measured O3 deposition velocity (vd) at Scripps Pier in 2018 (0.013 cm s−1) (Novak et al., 2020) and from the mean measured O3 mixing ratios during the VOC flux study in 2019 (Novak et al., 2022), according to Eq. (5). The range in φVOC, field reported below is based on the standard deviation of O3 mixing ratios measured in 2019. However, we note that the uncertainty in calibration factors (Sect. S1) and VOC fluxes would drive a much larger uncertainty than just O3 variability. This additional uncertainty from VOC fluxes is estimated at 60 % from the combination of sensor noise and sampling uncertainty. The calculated total φVOC, field represents an upper limit for a field VOC yield from O3 deposition: without GC measurements for the field data, we cannot definitively rule out biogenic molecules detected at these RT-Vocus ions, and the calculation assumes all VOC flux is abiotic.
We find that laboratory measurements of the VOC yield from seawater ozonolysis are a factor of 10 larger than those estimated from eddy covariance field measurements. There are several reasons why we might expect the laboratory measurements to overpredict the actual VOC yield:
-
Laboratory experiments were conducted using quiescent seawater with an established SSML, allowing for organic material to concentrate at the surface, thus enhancing surface multiphase reactions that can produce VOCs (Donaldson and Vaida, 2006; Wurl et al., 2011). In contrast, the SSML at the ocean surface is continually disrupted, reducing the likelihood that O3 can react with a stagnant, concentrated organic surface (Wurl et al., 2011). Because of this turbulence at the ambient ocean surface, it is possible that any oxidized products could also get vertically mixed downward and sequestered in the bulk ocean, which would further reduce the field yield relative to the laboratory yield. Similarly, the ambient ocean has vertical gradients in biological processes that could act as sinks for VOC products and contribute to the reduced field yield (Halsey and Giovannoni, 2023).
-
Ambient photochemistry is inactive in laboratory experiments, reducing the possibility for photochemical DOC transformations in the flow tube and for a seawater sink of VOCs due to photochemical reactions. In the ocean, produced VOCs might be lost photochemically in the seawater before emission, resulting in a measured field yield lower than the comparable lab yield (Chiu et al., 2017).
-
O3 concentrations in lab experiments were roughly twice as high as in the field, allowing for the possibility that we observed reaction products in the lab that are only facilitated at high O3. Additionally, any O3 source variability was not directly measured simultaneously during experiments, meaning that quicker O3 fluctuations than what occur in the ambient could have heightened laboratory yields.
-
Assumptions were made for the intention of lab and field comparisons that may contribute to the divergence between these measurements, including the comparison of lab data to field data that have a factor of 3 lower [I−] (measured 42 ± 5.3 nM) and unknown [DOC]. If we were to subtract the fraction of O3 lost to the extra I− in lab experiments, the VOC yield would be even larger, making the results diverge further. Closing φVOC, lab and φVOC, field would require φVOC, field to be higher, which is possible if the O3 deposition flux during the 2019 field study was smaller than the value used based on O3 flux measurements at this site in 2018, potentially due to lower [I−] and [DOC] in 2019 than in 2018.
The reasons for the disagreement between total φVOC, lab and φVOC, field highlight unique challenges in doing these experiments and complicate our ability to scale laboratory-derived ozonolysis yields to the field. Future work would be improved by doing lab and field experiments at the same time, using the same water with equivalent [DOC] and [I−].
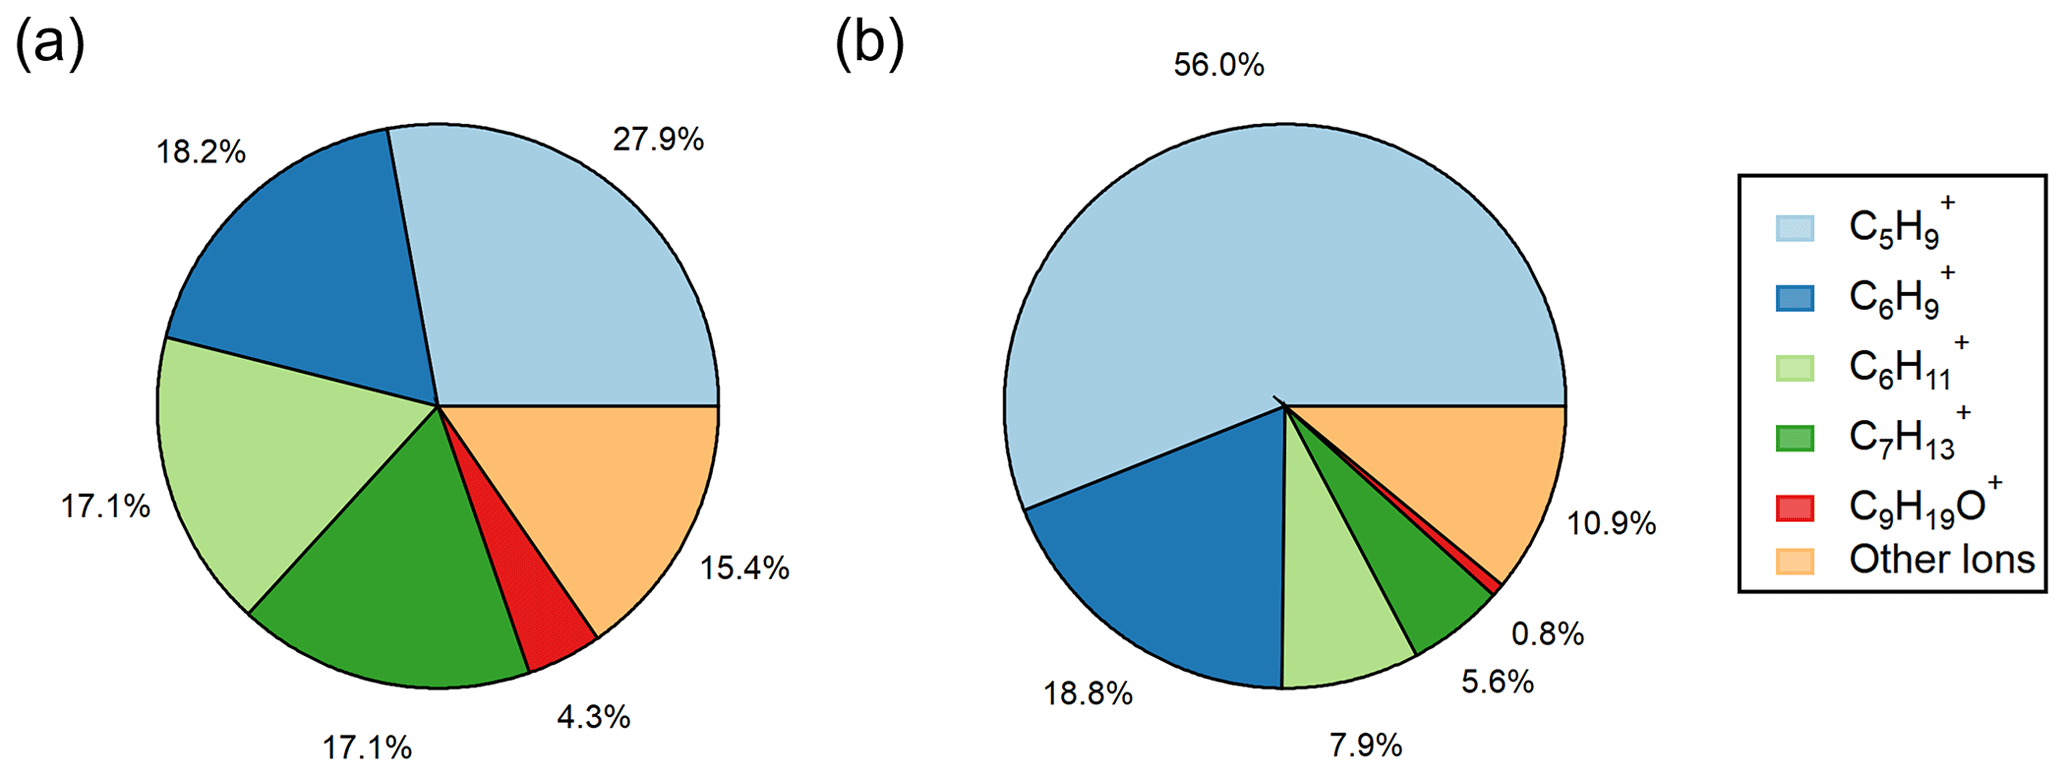
Figure 4Pie figures showing the ions contributing to the total VOC yield from (a) ozonolysis observed in laboratory experiments calculated using Eq. (3) and (b) ozonolysis at Scripps Pier calculated using Eq. (4). The collection of “other ions” refers to the sum of the ions in Table S3 that had minor laboratory ozonolysis VOC yields.
While φVOC, lab and φVOC, field differ in total magnitude, we show that the distribution of measured ions on the RT-Vocus share a similar trend, with C5H being the largest contributor and C9H19O+ being the smallest contributor to the total VOC yields (Figs. 4 and 5). It is worth noting that the two largest contributors to φVOC, field, C5H and C6H, are two RT-Vocus ions where marine BVOCs can be detected, namely isoprene at C5H and monoterpenes at C6H (Kim et al., 2010; Phillips et al., 2021). Without field GC measurements, it is possible that these numbers could be inflated by incorrectly assigning some BVOCs to an abiotic source, since the ocean surface is continually being replenished and influenced by ocean biological dynamics. Additionally, some of the “other ions” that show the smallest ozonolysis response in lab experiments are under the flux limit of detection in the field, meaning that the ion distribution in Fig. 4b may actually be more similar to the ion distribution in Fig. 4a as represented currently.
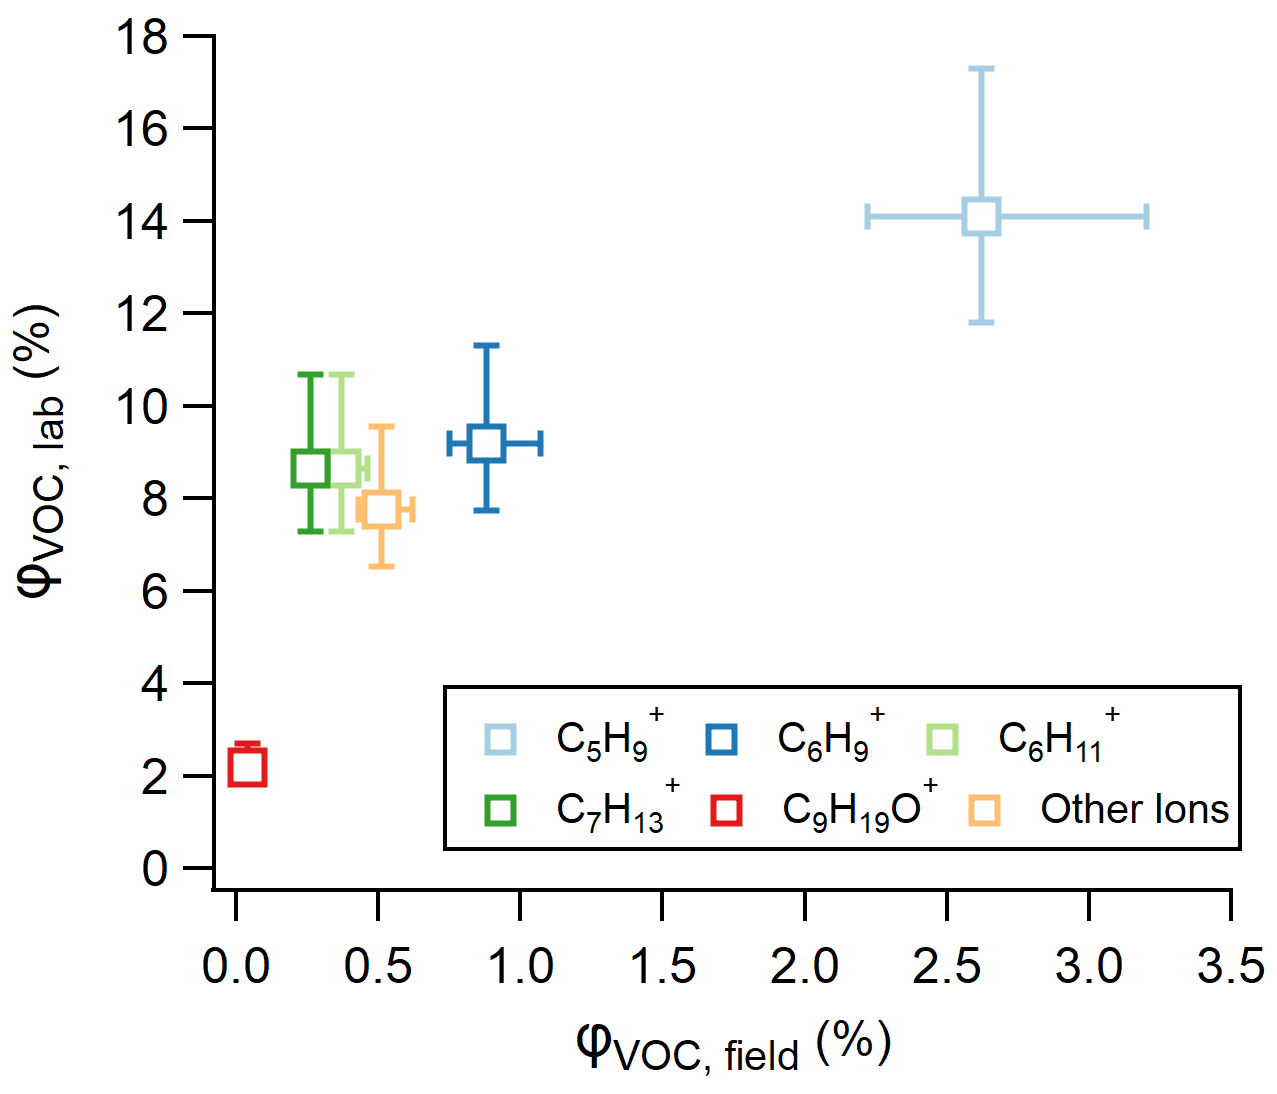
Figure 5Relationship between VOC yields derived from laboratory and field experiments, calculated using Eqs. (3) and (4), respectively.
3.4 Molecular contributions to VOC yields
We use GC-Vocus measurements to qualitatively assess which molecules contribute to RT-Vocus ions. GC-Vocus measurements taken during these laboratory ozonolysis experiments indicate that RT-Vocus CxH and CxHyO ions in Table 1 are comprised of C5–C11 OVOCs, primarily aldehydes. In instances where an identified peak was not resolvable from the elution of another molecule (e.g., C9H18O; Fig. S10) or if a standard was not available to confirm an identification (e.g., C11H22O, possibly undecanal), we report the molecular formula and designate the molecule eluting at an RT-Vocus ion as unidentified. The presence of these aldehydes in the Milli-Q ozonolysis chromatograms that were intended to serve as blanks made quantifications of the molecular contributions to each ion difficult, but we note that the larger molecules, including nonanal, decanal, and C11H22O, showed the largest and least ambiguous enhancement over background (Fig. S11). These measurements demonstrate that RT-Vocus CxH ions in this study's conditions ( = 125 Td) consist of dehydrated aldehyde products (–H2O) or fragments of aldehydes with a higher carbon number. The findings in this work are consistent with prior observations of C8–C10 aldehydes in coastal regions influenced by macroalgal species (Tokarek et al., 2019). To our best current knowledge, three prior laboratory studies have measured VOC products from SSML ozonolysis, namely Zhou et al. (2014), Schneider et al. (2019), and Wang et al. (2023). Despite different SSML sources and experimental conditions, our results also broadly align with the previously measured distribution of molecules based on carbon number and inclusion of carbonyl moieties. One noted difference is the lack of acetone, propanal, or acetaldehyde production in these experiments, compared to Wang et al. (2023).
Importantly, this study reveals that the RT-Vocus C5H signal from ozonolysis of coastal seawater has no contribution from isoprene but rather is a fragment of larger oxygenated VOCs. A test where isoprene was added to the headspace of the flow tube containing seawater confirmed that isoprene can be measured by the GC-Vocus as configured in this study with a detection limit of 8 ppt, calculated according to Claflin et al. (2021), implying that any abiotic isoprene or residual degassing biogenic isoprene from the seawater samples is either not present or below the detection limit (Fig. S12). This confirms that O3 deposition to the seawater surface can resolve a portion of the unexplained C5H emission flux at Scripps Pier. The detection of long-chain aldehydes at C5H is not new (Ruzsanyi et al., 2013; Vermeuel et al., 2023; Wang et al., 2023), and the findings of this work are qualitatively consistent with those in the fragmentation library from Pagonis et al. (2019), where C5H made large contributions to the total detected signals of pentanal, octanal, and nonanal in some PTR-MS studies. This study now demonstrates fragmentation of long-chain aldehydes to C5H is also an important consideration for marine atmospheric chemistry, where C5H has long been interpreted as isoprene within the PTR-MS community (Ciuraru et al., 2015b; Pagonis et al., 2019). Our results suggest that one should proceed with caution when interpreting RT-Vocus C5H signals in regions where isoprene concentrations are low, such as in marine environments, and where aldehyde concentrations could be large, such as in urban centers (Coggon et al., 2024).
Results of this study show that the reactivity of O3 to marine DOC can be large, can be comparable to I− reactivity, and can lead to the production of VOCs from O3 deposition to seawater. Taking φVOC, field and φVOC, lab as lower and upper limits, respectively, on VOC yields from ozonolysis, this study suggests that for an O3 deposition rate of 0.04 ppb h−1 (based on an O3 concentration of 30 ppb, a deposition velocity of 0.02 cm s−1, and a marine boundary layer height of 500 m), the instantaneous marine boundary layer VOC production rate from the surface of coastal seawater is 2–20 ppt h−1. Given marine biogenic DMS or isoprene mixing ratios are typically less than 300 ppt in coastal areas (Novak et al., 2022; Shaw et al., 2010), this range of VOCs from ozonolysis can be a significant unaccounted-for marine VOC source in coastal regions. For the average O3 deposition flux of 1.5 × 10¹⁰ molec. cm−2 s−1 ([O3] = 30 ppb, vd = 0.02 cm s−1) and scaling by an average VOC structure containing eight carbons (based on the median carbon number of molecules in these experiments) and a range of yields between φVOC, field and φVOC, lab, this analysis indicates ozonolysis could source 10.7 to 167 Tg C yr−1, competitive with the DMS source estimated at 20.3 Tg C yr−1 (Hulswar et al., 2022). Since laboratory experiments favor a stable SSML that is not representative of oceanic conditions, we suggest that actual yields are closer to the lower limit of this study.
Furthermore, we encourage additional work quantifying the speciated abiotic VOC composition from ozonolysis to help clarify the C5–C11 OVOC observations in this study. C5–C11 aldehydes react with OH roughly 1 order of magnitude faster than DMS ( and, for one example, cm3 molec.−1 s−1) (Atkinson et al., 2004; Bowman et al., 2003; Jiménez et al., 2007; Papagni et al., 2000), suggesting this collection of molecules could have a significant influence on marine atmospheric oxidative capacity, even if their emissions are at the lower limit of our study. While mechanistic aldehyde–OH oxidation has been studied in high NOx cases, to our best current knowledge, this has not been studied under marine-relevant conditions where NOx < 50 ppt (Lee et al., 2009). Similarly, much of the research investigating SOA yields of individual primary-emitted aldehydes is completed under high NOx conditions (Chhabra et al., 2011; Chacon-Madrid et al., 2010; Chacon-Madrid and Donahue, 2011), with the only studies in the low NOx regime focused on aldehydes like pinonaldehyde that are intermediates in the oxidation of common BVOCs (Chacon-Madrid et al., 2013). The long-chain acyclic aldehydes that contribute to measured RT-Vocus ions in this study have fast reaction rates with OH, are susceptible to photolysis, and are expected to form SOA based on observed new particle formation and growth during ozonolysis of an SSML in Schneider et al. (2019). As a result, we recommend future work to investigate the oxidation and SOA yields of C5–C11 aldehydes under marine-relevant, low-NOx conditions, as they have the potential to be a significant abiotic marine VOC emission source in coastal regions.
Field measurements of eddy covariance VOC fluxes, O3 concentrations, and irradiance and time series of laboratory seawater ozonolysis experiments are available at http://digital.library.wisc.edu/1793/84597 (Kilgour et al., 2023).
Additional discussion of calibration factors, uncertainties, calculation of dissolved isoprene concentrations, and supporting figures and tables. The supplement related to this article is available online at: https://doi.org/10.5194/acp-24-3729-2024-supplement.
DBK, GAN, and THB designed the research. DBK conducted laboratory experiments and analyzed the data. MSC and BML provided instrumentation support and feedback. GAN conducted the field study and analyzed the data. DBK and THB wrote the paper. All authors edited and reviewed the paper.
MSC and BML work for Aerodyne Research, Inc., which developed the GC-Vocus instrument used in this study.
Publisher's note: Copernicus Publications remains neutral with regard to jurisdictional claims made in the text, published maps, institutional affiliations, or any other geographical representation in this paper. While Copernicus Publications makes every effort to include appropriate place names, the final responsibility lies with the authors.
The authors gratefully acknowledge the contributions of Steve Myers and Blaise Thompson at University of Wisconsin–Madison Chemistry in building the flow tube used for the laboratory experiments. The authors thank the staff at the Scripps Institution of Oceanography, Scripps Pier, for their support of the flux study; Alexia Moore at University of California, San Diego, for seawater collection; Christopher Jernigan at the University of Wisconsin–Madison for help with the Ox-CIMS; Neal Arakawa with the Environmental and Complex Analysis Laboratory at the University of California, San Diego, for measuring iodide in the seawater samples; and James Lazarcik at the University of Wisconsin–Madison Water Science and Engineering Laboratory for support with measuring DOC in seawater samples.
This research has been supported by the National Science Foundation (grant no. AGS 1829667) and the Center for Aerosol Impacts on Chemistry of the Environment (grant no. CHE 1801971), which is a National Science Foundation Center for Chemical Innovation.
This paper was edited by Lisa Whalley and reviewed by two anonymous referees.
Atkinson, R., Baulch, D. L., Cox, R. A., Crowley, J. N., Hampson, R. F., Hynes, R. G., Jenkin, M. E., Rossi, M. J., and Troe, J.: Evaluated kinetic and photochemical data for atmospheric chemistry: Volume I - gas phase reactions of Ox, HOx, NOx and SOx species, Atmos. Chem. Phys., 4, 1461–1738, https://doi.org/10.5194/acp-4-1461-2004, 2004.
Bates, T. S., Lamb, B. K., Guenther, A., Dignon, J., and Stoiber, R. E.: Sulfur emissions to the atmosphere from natural sourees, J. Atmos. Chem., 14, 315–337, https://doi.org/10.1007/BF00115242, 1992.
Berkelhammer, M., Steen-Larsen, H. C., Cosgrove, A., Peters, A. J., Johnson, R., Hayden, M., and Montzka, S. A.: Radiation and atmospheric circulation controls on carbonyl sulfide concentrations in the marine boundary layer, J. Geophys. Res.-Atmos., 121, 13113–13128, https://doi.org/10.1002/2016JD025437, 2016.
Bertram, T. H., Kimmel, J. R., Crisp, T. A., Ryder, O. S., Yatavelli, R. L. N., Thornton, J. A., Cubison, M. J., Gonin, M., and Worsnop, D. R.: A field-deployable, chemical ionization time-of-flight mass spectrometer, Atmos. Meas. Tech., 4, 1471–1479, https://doi.org/10.5194/amt-4-1471-2011, 2011.
Bowman, J. H., Barket, D. J., and Shepson, P. B.: Atmospheric Chemistry of Nonanal, Environ. Sci. Technol., 37, 2218–2225, https://doi.org/10.1021/es026220p, 2003.
Brüggemann, M., Hayeck, N., and George, C.: Interfacial photochemistry at the ocean surface is a global source of organic vapors and aerosols, Nat. Commun., 9, 2101, https://doi.org/10.1038/s41467-018-04528-7, 2018.
Burkholder, J. B., Sander, S. P., Abbatt, J., Barker, J. R., Huie, R. E., Kolb, C. E., Kurylo, M. J., Orkin, V. L., Wilmouth, D. M., and Wine, P. H.: Chemical Kinetics and Photochemical Data for Use in Atmospheric Studies, Evaluation No. 18, JPL Publication 15-10, Jet Propulsion Laboratory, Pasadena, http://jpldataeval.jpl.nasa.gov (last access: 27 September 2023), 2015.
Carpenter, L. J. and Nightingale, P. D.: Chemistry and Release of Gases from the Surface Ocean, Chem. Rev., 115, 4015–4034, https://doi.org/10.1021/cr5007123, 2015.
Carpenter, L. J., Archer, S. D., and Beale, R.: Ocean-atmosphere trace gas exchange, Chem. Soc. Rev., 41, 6473, https://doi.org/10.1039/c2cs35121h, 2012.
Carpenter, L. J., Chance, R. J., Sherwen, T., Adams, T. J., Ball, S. M., Evans, M. J., Hepach, H., Hollis, L. D. J., Hughes, C., Jickells, T. D., Mahajan, A., Stevens, D. P., Tinel, L., and Wadley, M. R.: Marine iodine emissions in a changing world, Proc. R. Soc. A., 477, 20200824, https://doi.org/10.1098/rspa.2020.0824, 2021.
Chacon-Madrid, H. J. and Donahue, N. M.: Fragmentation vs. functionalization: chemical aging and organic aerosol formation, Atmos. Chem. Phys., 11, 10553–10563, https://doi.org/10.5194/acp-11-10553-2011, 2011.
Chacon-Madrid, H. J., Presto, A. A., and Donahue, N. M.: Functionalization vs. fragmentation: n-aldehyde oxidation mechanisms and secondary organic aerosol formation, Phys. Chem. Chem. Phys., 12, 13975, https://doi.org/10.1039/c0cp00200c, 2010.
Chacon-Madrid, H. J., Henry, K. M., and Donahue, N. M.: Photo-oxidation of pinonaldehyde at low NOx: from chemistry to organic aerosol formation, Atmos. Chem. Phys., 13, 3227–3236, https://doi.org/10.5194/acp-13-3227-2013, 2013.
Chance, R. J., Tinel, L., Sherwen, T., Baker, A. R., Bell, T., Brindle, J., Campos, M. L. A. M., Croot, P., Ducklow, H., Peng, H., Hopkins, F., Hoogakker, B., Hughes, C., Jickells, T. D., Loades, D., Macaya, D. A. R., Mahajan, A. S., Malin, G., Phillips, D., Roberts, I., Roy, R., Sarkar, A., Sinha, A. K., Song, X., Winkelbauer, H., Wuttig, K., Yang, M., Peng, Z., and Carpenter, L. J.: Global sea-surface iodide observations, 1967–2018, Sci. Data, 6, 286, https://doi.org/10.1038/s41597-019-0288-y, 2019.
Chang, W., Heikes, B. G., and Lee, M.: Ozone deposition to the sea surface: chemical enhancement and wind speed dependence, Atmos. Environ., 38, 1053–1059, https://doi.org/10.1016/j.atmosenv.2003.10.050, 2004.
Charlson, R. J., Lovelock, J. E., Andreae, M. O., and Warren, S. G.: Oceanic phytoplankton, atmospheric sulphur, cloud albedo and climate, Nature, 326, 655–661, https://doi.org/10.1038/326655a0, 1987.
Chhabra, P. S., Ng, N. L., Canagaratna, M. R., Corrigan, A. L., Russell, L. M., Worsnop, D. R., Flagan, R. C., and Seinfeld, J. H.: Elemental composition and oxidation of chamber organic aerosol, Atmos. Chem. Phys., 11, 8827–8845, https://doi.org/10.5194/acp-11-8827-2011, 2011.
Chiu, R., Tinel, L., Gonzalez, L., Ciuraru, R., Bernard, F., George, C., and Volkamer, R.: UV photochemistry of carboxylic acids at the air-sea boundary: A relevant source of glyoxal and other oxygenated VOC in the marine atmosphere: Glyoxal Source From Carboxylic Acids, Geophys. Res. Lett., 44, 1079–1087, https://doi.org/10.1002/2016GL071240, 2017.
Ciuraru, R., Fine, L., van Pinxteren, M., D'Anna, B., Herrmann, H., and George, C.: Photosensitized production of functionalized and unsaturated organic compounds at the air-sea interface, Sci. Rep., 5, 12741, https://doi.org/10.1038/srep12741, 2015a.
Ciuraru, R., Fine, L., van Pinxteren, M., D'Anna, B., Herrmann, H., and George, C.: Unravelling New Processes at Interfaces: Photochemical Isoprene Production at the Sea Surface, Environ. Sci. Technol., 49, 13199–13205, https://doi.org/10.1021/acs.est.5b02388, 2015b.
Claflin, M. S., Pagonis, D., Finewax, Z., Handschy, A. V., Day, D. A., Brown, W. L., Jayne, J. T., Worsnop, D. R., Jimenez, J. L., Ziemann, P. J., de Gouw, J., and Lerner, B. M.: An in situ gas chromatograph with automatic detector switching between PTR- and EI-TOF-MS: isomer-resolved measurements of indoor air, Atmos. Meas. Tech., 14, 133–152, https://doi.org/10.5194/amt-14-133-2021, 2021.
Clifford, D., Donaldson, D. J., Brigante, M., D'Anna, B., and George, C.: Reactive Uptake of Ozone by Chlorophyll at Aqueous Surfaces, Environ. Sci. Technol., 42, 1138–1143, https://doi.org/10.1021/es0718220, 2008.
Coburn, S., Ortega, I., Thalman, R., Blomquist, B., Fairall, C. W., and Volkamer, R.: Measurements of diurnal variations and eddy covariance (EC) fluxes of glyoxal in the tropical marine boundary layer: description of the Fast LED-CE-DOAS instrument, Atmos. Meas. Tech., 7, 3579–3595, https://doi.org/10.5194/amt-7-3579-2014, 2014.
Coggon, M. M., McDonald, B. C., Vlasenko, A., Veres, P. R., Bernard, F., Koss, A. R., Yuan, B., Gilman, J. B., Peischl, J., Aikin, K. C., DuRant, J., Warneke, C., Li, S.-M., and de Gouw, J. A.: Diurnal Variability and Emission Pattern of Decamethylcyclopentasiloxane (D5) from the Application of Personal Care Products in Two North American Cities, Environ. Sci. Technol., 52, 5610–5618, https://doi.org/10.1021/acs.est.8b00506, 2018.
Coggon, M. M., Stockwell, C. E., Claflin, M. S., Pfannerstill, E. Y., Xu, L., Gilman, J. B., Marcantonio, J., Cao, C., Bates, K., Gkatzelis, G. I., Lamplugh, A., Katz, E. F., Arata, C., Apel, E. C., Hornbrook, R. S., Piel, F., Majluf, F., Blake, D. R., Wisthaler, A., Canagaratna, M., Lerner, B. M., Goldstein, A. H., Mak, J. E., and Warneke, C.: Identifying and correcting interferences to PTR-ToF-MS measurements of isoprene and other urban volatile organic compounds, Atmos. Meas. Tech., 17, 801–825, https://doi.org/10.5194/amt-17-801-2024, 2024.
Donahue, N. M. and Prinn, R. G.: Nonmethane hydrocarbon chemistry in the remote marine boundary layer, J. Geophys. Res., 95, 18387, https://doi.org/10.1029/JD095iD11p18387, 1990.
Donaldson, D. J. and Vaida, V.: The Influence of Organic Films at the Air-Aqueous Boundary on Atmospheric Processes, Chem. Rev., 106, 1445–1461, https://doi.org/10.1021/cr040367c, 2006.
dos Santos, D. J. V. A., Müller-Plathe, F., and Weiss, V. C.: Consistency of Ion Adsorption and Excess Surface Tension in Molecular Dynamics Simulations of Aqueous Salt Solutions, J. Phys. Chem. C, 112, 19431–19442, https://doi.org/10.1021/jp804811u, 2008.
Franklin, E. B., Alves, M. R., Moore, A. N., Kilgour, D. B., Novak, G. A., Mayer, K., Sauer, J. S., Weber, R. J., Dang, D., Winter, M., Lee, C., Cappa, C. D., Bertram, T. H., Prather, K. A., Grassian, V. H., and Goldstein, A. H.: Atmospheric Benzothiazoles in a Coastal Marine Environment, Environ. Sci. Technol., 55, 15705–15714, https://doi.org/10.1021/acs.est.1c04422, 2021.
Fu, H., Ciuraru, R., Dupart, Y., Passananti, M., Tinel, L., Rossignol, S., Perrier, S., Donaldson, D. J., Chen, J., and George, C.: Photosensitized Production of Atmospherically Reactive Organic Compounds at the Air/Aqueous Interface, J. Am. Chem. Soc., 137, 8348–8351, https://doi.org/10.1021/jacs.5b04051, 2015.
Ganzeveld, L., Helmig, D., Fairall, C. W., Hare, J., and Pozzer, A.: Atmosphere-ocean ozone exchange: A global modeling study of biogeochemical, atmospheric, and waterside turbulence dependencies: Global Oceanic Ozone Deposition, Global Biogeochem. Cy., 23, GB4021, https://doi.org/10.1029/2008GB003301, 2009.
Griffin, R. J., Cocker III, D. R., Flagan, R. C., and Seinfeld, J. H.: Organic aerosol formation from the oxidation of biogenic hydrocarbons, J. Geophys. Res.-Atmos., 104, 3555–3567, https://doi.org/10.1029/1998JD100049, 1999.
Hackenberg, S. C., Andrews, S. J., Airs, R., Arnold, S. R., Bouman, H. A., Brewin, R. J. W., Chance, R. J., Cummings, D., Dall'Olmo, G., Lewis, A. C., Minaeian, J. K., Reifel, K. M., Small, A., Tarran, G. A., Tilstone, G. H., and Carpenter, L. J.: Potential controls of isoprene in the surface ocean, Global Biogeochem. Cy., 31, 644–662, https://doi.org/10.1002/2016GB005531, 2017.
Halsey, K. H. and Giovannoni, S. J.: Biological controls on marine volatile organic compound emissions: A balancing act at the sea-air interface, Earth-Sci. Rev., 240, 104360, https://doi.org/10.1016/j.earscirev.2023.104360, 2023.
Hulswar, S., Simó, R., Galí, M., Bell, T. G., Lana, A., Inamdar, S., Halloran, P. R., Manville, G., and Mahajan, A. S.: Third revision of the global surface seawater dimethyl sulfide climatology (DMS-Rev3), Earth Syst. Sci. Data, 14, 2963–2987, https://doi.org/10.5194/essd-14-2963-2022, 2022.
Jiménez, E., Lanza, B., Martínez, E., and Albaladejo, J.: Daytime tropospheric loss of hexanal and trans-2-hexenal: OH kinetics and UV photolysis, Atmos. Chem. Phys., 7, 1565–1574, https://doi.org/10.5194/acp-7-1565-2007, 2007.
Johnson, M. T.: A numerical scheme to calculate temperature and salinity dependent air-water transfer velocities for any gas, Ocean Sci., 6, 913–932, https://doi.org/10.5194/os-6-913-2010, 2010.
Kiene, R. P. and Linn, L. J.: The fate of dissolved dimethylsulfoniopropionate (DMSP) in seawater: tracer studies using 35S-DMSP, Geochim. Cosmochim. Ac., 64, 2797–2810, https://doi.org/10.1016/S0016-7037(00)00399-9, 2000.
Kilgour, D. B., Novak, G. A., and Bertram, T. H.: Production of oxygenated volatile organic compounds from the ozonolysis of coastal seawater, MINDS@UW [data set], http://digital.library.wisc.edu/1793/84597, 2023.
Kim, M. J., Novak, G. A., Zoerb, M. C., Yang, M., Blomquist, B. W., Huebert, B. J., Cappa, C. D., and Bertram, T. H.: Air-Sea exchange of biogenic volatile organic compounds and the impact on aerosol particle size distributions: Air-Sea Exchange of Biogenic VOCs, Geophys. Res. Lett., 44, 3887–3896, https://doi.org/10.1002/2017GL072975, 2017.
Kim, S., Karl, T., Guenther, A., Tyndall, G., Orlando, J., Harley, P., Rasmussen, R., and Apel, E.: Emissions and ambient distributions of Biogenic Volatile Organic Compounds (BVOC) in a ponderosa pine ecosystem: interpretation of PTR-MS mass spectra, Atmos. Chem. Phys., 10, 1759–1771, https://doi.org/10.5194/acp-10-1759-2010, 2010.
Krechmer, J., Lopez-Hilfiker, F., Koss, A., Hutterli, M., Stoermer, C., Deming, B., Kimmel, J., Warneke, C., Holzinger, R., Jayne, J., Worsnop, D., Fuhrer, K., Gonin, M., and de Gouw, J.: Evaluation of a New Reagent-Ion Source and Focusing Ion–Molecule Reactor for Use in Proton-Transfer-Reaction Mass Spectrometry, Anal. Chem., 90, 12011–12018, https://doi.org/10.1021/acs.analchem.8b02641, 2018.
Kroll, J. H., Ng, N. L., Murphy, S. M., Flagan, R. C., and Seinfeld, J. H.: Secondary Organic Aerosol Formation from Isoprene Photooxidation, Environ. Sci. Technol., 40, 1869–1877, https://doi.org/10.1021/es0524301, 2006.
Lana, A., Bell, T. G., Simó, R., Vallina, S. M., Ballabrera-Poy, J., Kettle, A. J., Dachs, J., Bopp, L., Saltzman, E. S., Stefels, J., Johnson, J. E., and Liss, P. S.: An updated climatology of surface dimethlysulfide concentrations and emission fluxes in the global ocean, Global Biogeochem. Cy., 25, GB1004, https://doi.org/10.1029/2010GB003850, 2011.
Lee, J. D., Moller, S. J., Read, K. A., Lewis, A. C., Mendes, L., and Carpenter, L. J.: Year-round measurements of nitrogen oxides and ozone in the tropical North Atlantic marine boundary layer, J. Geophys. Res.-Atmos., 114, D21302, https://doi.org/10.1029/2009JD011878, 2009.
Li, X.-J., Liang, H.-R., Zhuang, G.-C., Wu, Y.-C., Li, S.-T., Zhang, H.-H., Montgomery, A., and Yang, G.-P.: Annual Variations of Isoprene and Other Non-Methane Hydrocarbons in the Jiaozhou Bay on the East Coast of North China, J. Geophys. Res.-Biogeo., 127, e2021JG006531, https://doi.org/10.1029/2021JG006531, 2022.
Lim, C. Y., Hagan, D. H., Coggon, M. M., Koss, A. R., Sekimoto, K., de Gouw, J., Warneke, C., Cappa, C. D., and Kroll, J. H.: Secondary organic aerosol formation from the laboratory oxidation of biomass burning emissions, Atmos. Chem. Phys., 19, 12797–12809, https://doi.org/10.5194/acp-19-12797-2019, 2019.
Luo, G. and Yu, F.: A numerical evaluation of global oceanic emissions of α-pinene and isoprene, Atmos. Chem. Phys., 10, 2007–2015, https://doi.org/10.5194/acp-10-2007-2010, 2010.
Meskhidze, N., Xu, J., Gantt, B., Zhang, Y., Nenes, A., Ghan, S. J., Liu, X., Easter, R., and Zaveri, R.: Global distribution and climate forcing of marine organic aerosol: 1. Model improvements and evaluation, Atmos. Chem. Phys., 11, 11689–11705, https://doi.org/10.5194/acp-11-11689-2011, 2011.
Mungall, E. L., Abbatt, J. P. D., Wentzell, J. J. B., Lee, A. K. Y., Thomas, J. L., Blais, M., Gosselin, M., Miller, L. A., Papakyriakou, T., Willis, M. D., and Liggio, J.: Microlayer source of oxygenated volatile organic compounds in the summertime marine Arctic boundary layer, P. Natl. Acad. Sci. USA, 114, 6203–6208, https://doi.org/10.1073/pnas.1620571114, 2017.
Nightingale, P. D., Malin, G., Law, C. S., Watson, A. J., Liss, P. S., Liddicoat, M. I., Boutin, J., and Upstill-Goddard, R. C.: In situ evaluation of air-sea gas exchange parameterizations using novel conservative and volatile tracers, Global Biogeochem. Cy., 14, 373–387, https://doi.org/10.1029/1999GB900091, 2000.
Novak, G. A. and Bertram, T. H.: Reactive VOC Production from Photochemical and Heterogeneous Reactions Occurring at the Air–Ocean Interface, Acc. Chem. Res., 53, 1014–1023, https://doi.org/10.1021/acs.accounts.0c00095, 2020.
Novak, G. A., Vermeuel, M. P., and Bertram, T. H.: Simultaneous detection of ozone and nitrogen dioxide by oxygen anion chemical ionization mass spectrometry: a fast-time-response sensor suitable for eddy covariance measurements, Atmos. Meas. Tech., 13, 1887–1907, https://doi.org/10.5194/amt-13-1887-2020, 2020.
Novak, G. A., Kilgour, D. B., Jernigan, C. M., Vermeuel, M. P., and Bertram, T. H.: Oceanic emissions of dimethyl sulfide and methanethiol and their contribution to sulfur dioxide production in the marine atmosphere, Atmos. Chem. Phys., 22, 6309–6325, https://doi.org/10.5194/acp-22-6309-2022, 2022.
Pagonis, D., Sekimoto, K., and de Gouw, J.: A Library of Proton-Transfer Reactions of H3O+ Ions Used for Trace Gas Detection, J. Am. Soc. Mass Spectr., 30, 1330–1335, https://doi.org/10.1007/s13361-019-02209-3, 2019.
Papagni, C., Arey, J., and Atkinson, R.: Rate constants for the gas-phase reactions of a series of C3–C6 aldehydes with OH and NO3 radicals, Int. J. Chem. Kinet., 32, 79–84, https://doi.org/10.1002/(SICI)1097-4601(2000)32:2<79::AID-KIN2>3.0.CO;2-A, 2000.
Penezić, A., Wang, X., Perrier, S., George, C., and Frka, S.: Interfacial photochemistry of marine diatom lipids: Abiotic production of volatile organic compounds and new particle formation, Chemosphere, 313, 137510, https://doi.org/10.1016/j.chemosphere.2022.137510, 2023.
Phillips, D. P., Hopkins, F. E., Bell, T. G., Liss, P. S., Nightingale, P. D., Reeves, C. E., Wohl, C., and Yang, M.: Air–sea exchange of acetone, acetaldehyde, DMS and isoprene at a UK coastal site, Atmos. Chem. Phys., 21, 10111–10132, https://doi.org/10.5194/acp-21-10111-2021, 2021.
Prophet, A. M., Polley, K., Van Berkel, G. J., Limmer, D. T., and Wilson, K. R.: Iodide oxidation by ozone at the surface of aqueous microdroplets, Chem. Sci., 15, 736–756, https://doi.org/10.1039/D3SC04254E, 2024.
Rinaldi, M., Decesari, S., Finessi, E., Giulianelli, L., Carbone, C., Fuzzi, S., O'Dowd, C. D., Ceburnis, D., and Facchini, M. C.: Primary and Secondary Organic Marine Aerosol and Oceanic Biological Activity: Recent Results and New Perspectives for Future Studies, Adv. Meteorol., 2010, 1–10, https://doi.org/10.1155/2010/310682, 2010.
Ruzsanyi, V., Fischer, L., Herbig, J., Ager, C., and Amann, A.: Multi-capillary-column proton-transfer-reaction time-of-flight mass spectrometry, J. Chromatogr. A, 1316, 112–118, https://doi.org/10.1016/j.chroma.2013.09.072, 2013.
Schneider, S. R., Collins, D. B., Lim, C. Y., Zhu, L., and Abbatt, J. P. D.: Formation of Secondary Organic Aerosol from the Heterogeneous Oxidation by Ozone of a Phytoplankton Culture, ACS Earth Space Chem., 3, 2298–2306, https://doi.org/10.1021/acsearthspacechem.9b00201, 2019.
Schneider, S. R., Lakey, P. S. J., Shiraiwa, M., and Abbatt, J. P. D.: Reactive Uptake of Ozone to Simulated Seawater: Evidence for Iodide Depletion, J. Phys. Chem. A, 124, 9844–9853, https://doi.org/10.1021/acs.jpca.0c08917, 2020.
Shaw, M. D. and Carpenter, L. J.: Modification of Ozone Deposition and I 2 Emissions at the Air–Aqueous Interface by Dissolved Organic Carbon of Marine Origin, Environ. Sci. Technol., 47, 10947–10954, https://doi.org/10.1021/es4011459, 2013.
Shaw, S. L., Gantt, B., and Meskhidze, N.: Production and Emissions of Marine Isoprene and Monoterpenes: A Review, Adv. Meteorol., 2010, 1–24, https://doi.org/10.1155/2010/408696, 2010.
Tokarek, T. W., Brownsey, D. K., Jordan, N., Garner, N. M., Ye, C. Z., and Osthoff, H. D.: Emissions of C9–C16 hydrocarbons from kelp species on Vancouver Island: Alaria marginata (winged kelp) and Nereocystis luetkeana (bull kelp) as an atmospheric source of limonene, Atmos. Environ. X, 2, 100007, https://doi.org/10.1016/j.aeaoa.2019.100007, 2019.
Vermeuel, M. P., Novak, G. A., Kilgour, D. B., Claflin, M. S., Lerner, B. M., Trowbridge, A. M., Thom, J., Cleary, P. A., Desai, A. R., and Bertram, T. H.: Observations of biogenic volatile organic compounds over a mixed temperate forest during the summer to autumn transition, Atmos. Chem. Phys., 23, 4123–4148, https://doi.org/10.5194/acp-23-4123-2023, 2023.
Wang, Y., Zeng, J., Wu, B., Song, W., Hu, W., Liu, J., Yang, Y., Yu, Z., Wang, X., and Gligorovski, S.: Production of Volatile Organic Compounds by Ozone Oxidation Chemistry at the South China Sea Surface Microlayer, ACS Earth Space Chem., 7, 1306–1313, https://doi.org/10.1021/acsearthspacechem.3c00102, 2023.
Wurl, O., Wurl, E., Miller, L., Johnson, K., and Vagle, S.: Formation and global distribution of sea-surface microlayers, Biogeosciences, 8, 121–135, https://doi.org/10.5194/bg-8-121-2011, 2011.
Zhao, D. F., Buchholz, A., Kortner, B., Schlag, P., Rubach, F., Kiendler-Scharr, A., Tillmann, R., Wahner, A., Flores, J. M., Rudich, Y., Watne, Å. K., Hallquist, M., Wildt, J., and Mentel, T. F.: Size-dependent hygroscopicity parameter (κ) and chemical composition of secondary organic cloud condensation nuclei, Geophys. Res. Lett., 42, 10920–10928, https://doi.org/10.1002/2015GL066497, 2015.
Zhou, S., Gonzalez, L., Leithead, A., Finewax, Z., Thalman, R., Vlasenko, A., Vagle, S., Miller, L. A., Li, S.-M., Bureekul, S., Furutani, H., Uematsu, M., Volkamer, R., and Abbatt, J.: Formation of gas-phase carbonyls from heterogeneous oxidation of polyunsaturated fatty acids at the air–water interface and of the sea surface microlayer, Atmos. Chem. Phys., 14, 1371–1384, https://doi.org/10.5194/acp-14-1371-2014, 2014.