the Creative Commons Attribution 4.0 License.
the Creative Commons Attribution 4.0 License.
 | 22 Mar 2024
Measurement report: Hygroscopicity of size-selected aerosol particles in the heavily polluted urban atmosphere of Delhi: impacts of chloride aerosol
Anil Kumar Mandariya
Ajit Ahlawat
Mohammed Haneef
Nisar Ali Baig
Kanan Patel
Joshua Apte
Lea Hildebrandt Ruiz
Gazala Habib
Recent research has revealed the crucial role of wintertime, episodic high chloride (H-Cl) emissions in the Delhi region, which significantly impact aerosol hygroscopicity and aerosol-bound liquid water, thus contributing to the initiation of Delhi fog episodes. However, these findings have primarily relied on modeled aerosol hygroscopicity, necessitating validation through direct hygroscopicity measurements. This study presents the measurements of non-refractory bulk aerosol composition of PM1 from an Aerodyne aerosol chemical speciation monitor and for first-time size-resolved hygroscopic growth factors (nucleation, Aitken, and accumulated mode particles) along with their associated hygroscopicity parameters at 90 % relative humidity using a hygroscopic tandem differential mobility analyzer at the Delhi Aerosol Supersite. Our observations demonstrate that the hygroscopicity parameter for aerosol particles varies from 0.00 to 0.11 (with an average of 0.03 ± 0.02) for 20 nm particles, 0.05 to 0.22 (0.11 ± 0.03) for 50 nm particles, 0.05 to 0.30 (0.14 ± 0.04) for 100 nm particles, 0.05 to 0.41 (0.18 ± 0.06) for 150 nm particles, and 0.05 to 0.56 (0.22 ± 0.07) for 200 nm particles. Surprisingly, our findings demonstrate that the period with H-Cl emissions displays notably greater hygroscopicity (0.35 ± 0.06) in comparison to spans marked by high biomass burning (0.18 ± 0.04) and high hydrocarbon-like organic aerosol (0.17 ± 0.05) and relatively cleaner periods (0.27 ± 0.07). This research presents initial observational proof that ammonium chloride is the main factor behind aerosol hygroscopic growth and aerosol-bound liquid water content in Delhi. The finding emphasizes ammonium chloride's role in aerosol–water interaction and related haze/fog development. Moreover, the high chloride levels in aerosols seem to prevent the adverse impact of high organic aerosol concentrations on cloud condensation nuclei activity.
- Article
(3970 KB) - Full-text XML
-
Supplement
(2286 KB) - BibTeX
- EndNote


The Intergovernmental Panel on Climate Change (IPCC) (Forster et al., 2021) reported that the interaction between aerosols and clouds is not completely comprehended, and there are significant uncertainties in gauging global radiative budgets. In order to overcome and elucidate these uncertainties, the role of aerosol hygroscopicity is crucial. Hygroscopicity is a critical factor in comprehending how aerosol particles function as cloud condensation nuclei (CCN) and create fog droplets/haze under subsaturated/nearly saturated conditions, as well as forming cloud droplets at atmospheric supersaturation levels (McFiggans et al., 2006; Topping and McFiggans, 2012). Its comprehension is vital to better predicting the aerosol size distribution and scattering properties with more accuracy in global models under varying atmospheric relative humidity (RH) conditions (Forster et al., 2021). Hygroscopicity at higher RH results in an increase in the cross-sectional area of the aerosol, leading to efficient light scattering by the aerosol particles (Tang and Munkelwitz, 1994). This phenomenon is primarily dependent on the chemical composition and particle size. Generally, ammonium salts of sulfate, nitrate, and chloride, which are inorganic salts, exhibit high hygroscopicity (Hu et al., 2011; Petters and Kreidenweis, 2007). In contrast, organic aerosols (OAs) have relatively lower hygroscopicity (Jimenez et al., 2009; Kroll et al., 2011), and dust particles and black/elemental carbon particles are known to be hydrophobic (Seinfeld and Pandis, 2006). The increased atmospheric humidity during winter and monsoon seasons promotes the development of more oxidized secondary organic aerosol (SOA) through aqueous-phase (Ervens et al., 2011) and heterogeneous reactions (McNeill, 2015). This process leads to a heightened organic aerosol hygroscopicity (Jimenez et al., 2009; Mei et al., 2013), which negatively impacts the local visibility (Li et al., 2016; Liu et al., 2012). Conversely, aerosol loading has an inverse effect on aerosol hygroscopicity (Mandariya et al., 2020). In addition, aerosol loading plays a critical role in determining cloud lifetime, which impacts the amount of rainfall in the region (Albrecht, 1989; Lohmann and Feichter, 2005).
Over the past few decades, researchers have extensively measured aerosol hygroscopicity using hygroscopic tandem differential mobility analyzer (HTDMA) (Massling et al., 2005; Gysel et al., 2007; Mandariya et al., 2020; Swietlicki et al., 2008; Yeung et al., 2014; Kecorius et al., 2019) and a CCN counter (Bhattu and Tripathi, 2015; Gunthe et al., 2011; Massoli et al., 2010; Ogawa et al., 2016) under sub- and supersaturated conditions, respectively. Petters and Kreidenweis (2007) introduced the hygroscopicity parameter, kappa (κ), to correlate aerosol hygroscopicity with its chemical composition. The hygroscopicity of OA may differ according to its chemical properties such as solubility, the extent of dissociation in aerosol water, and surface activity, which can pose challenges in quantifying OA hygroscopicity (Hallquist et al., 2009; Jimenez et al., 2009). As a result, this introduces further discrepancies in predicted and measured aerosol hygroscopicity. Therefore, there is a requirement to investigate the measurement-based aerosol hygroscopicity of Delhi's atmosphere to gain a better understanding of the recurring occurrences of haze and cloud formations.
In recent decades, rapid economic growth and industrialization in the Indo-Gangetic Plain (IGP) have resulted in significantly poor air quality during the winter season (Wester et al., 2019). Local and regional air pollution issues may potentially affect Delhi during this time (Arub et al., 2020; Bhandari et al., 2020; Gani et al., 2019; Prakash et al., 2018). Recent studies have indicated that chloride significantly contributes to the degradation of air quality in the Delhi region and favors haze/fog formation during winter (Gunthe et al., 2021). Gani et al. (2019) and Rai et al. (2020) support these findings. Trash and biomass burning for heating and waste degradation have been identified as major sources of chloride in Delhi (Rai et al., 2020). A recent study conducted in Delhi revealed that frequent events of high chloride promote high levels of aerosol liquid water content under elevated humid conditions. This leads to haze and poor visibility in the city (Chen et al., 2022). Additionally, Gunthe et al. (2021) found that higher chloride levels also enhance aerosol hygroscopicity. However, it is important to note that this particular study was based on theoretical hygroscopicity. Therefore, it is crucial to study the effects of chloride on aerosol hygroscopicity and its ability to increase the amount of aerosol-bound liquid water based on field measurements. In addition, the heavily polluted urban atmosphere, with its highly complex composition, severely limits the hygroscopicity of the aerosol particles. This is particularly evident in cities like Delhi, located in the IGP of India, where air quality deteriorates significantly during haze-/fog-dominated periods. To the authors' best knowledge, this study is the first to explore the complex atmosphere of the IGP in Delhi, India, using aerosol hygroscopicity measured by an HTDMA.
2.1 Aerosol measurements
Real-time measurements of atmospheric aerosols were conducted during winter (1 February to 20 March 2020) at Block 5 of the Indian Institute of Technology Delhi (IIT Delhi). An HTDMA; a TROPOS-type mobility particle size spectrometer (MPSS); an aethalometer (AE33, Magee Scientific); a nephelometer (IN102Ex, Air Photon); and an Aerodyne aerosol chemical speciation monitor (ACSM) from Aerodyne Research in Billerica, MA, were used simultaneously at a height of approximately 15 m a.g.l. (above ground level) as depicted in the Fig. 1. Nafion dryers were used to dry the atmospheric air (RH <30 %) before conducting the HTDMA, MPSS, and ACSM measurements. Nafion dryers were used to dry the atmospheric air (RH <30 %) before conducting the HTDMA, MPSS, and ACSM measurements. Lab 2 is located 50 m away from Lab 1. The ACSM is utilized to quantify mass concentrations of organic aerosol (OA), ammonium (NH4), sulfate (SO4), nitrate (NO3), and chloride (Cl) in non-refractory particulate matter of less than 1 µm (NR-PM1).
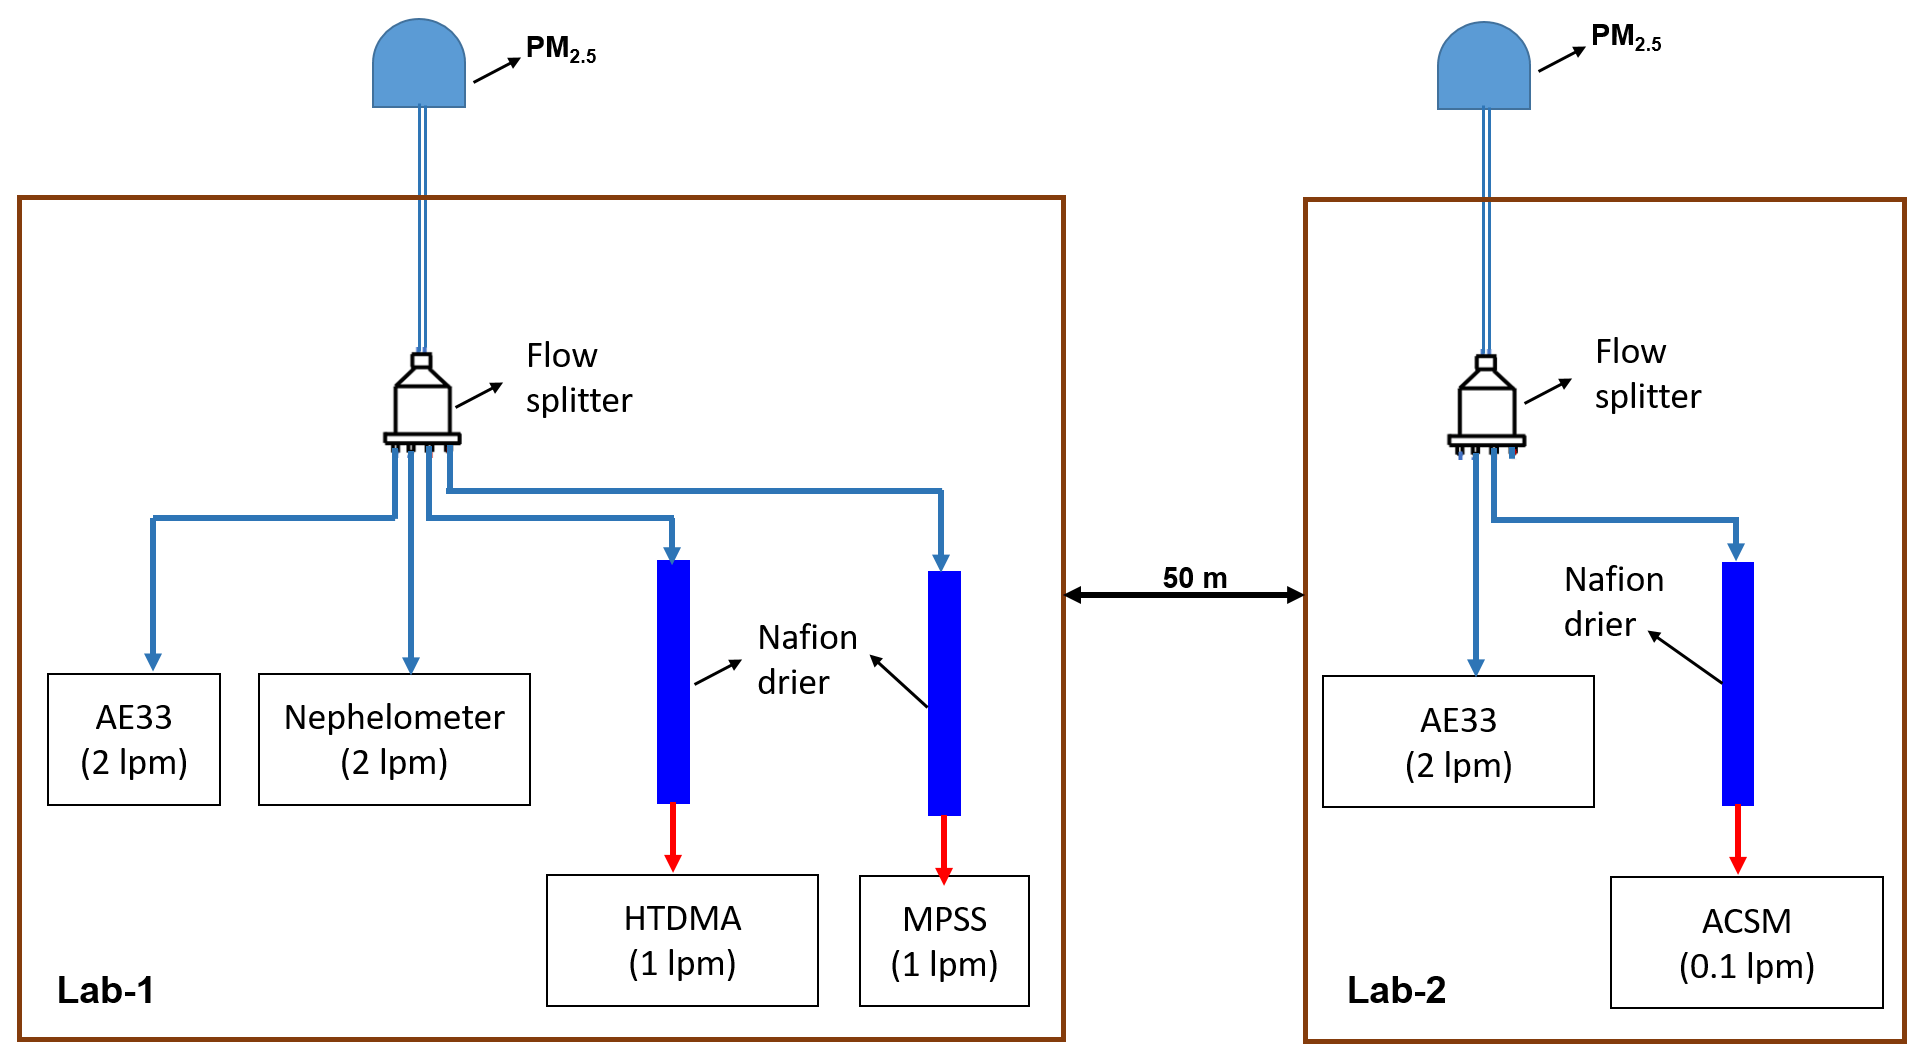
Figure 1Schematic diagram of the inlet systems for aerosol sampling instruments. The blue and red sampling lines indicate the ambient air and dehumidified (RH <25 %) ambient air, respectively. lpm: liters per minute.
The hygroscopic growth of size-resolved particles at 90 % RH was investigated using the HTDMA system in this study. The HTDMA system has been utilized in numerous field campaigns before (Massling et al., 2007; Wu et al., 2013; Zhang et al., 2016). The HTDMA system (TROPOS, Germany) consists of two differential mobility analyzers (DMAs) of the Hauke median type (TROPOS, Germany), along with a condensation particle counter (CPC; model 3772, TSI Inc., USA) and a humidifier system situated between the two DMAs. The initial DMA's function is to choose quasi-monodisperse particles at a dry diameter (Dp, dry) of 30 % RH. Technical abbreviations will be explicated at their first usage. After passing through a humidity conditioner, the humidity of the size-selected particles can be adjusted from 30 % to 90 % RH by mixing dry air with <5 % RH and moist air with ∼ 95 % RH via regulating aerosol and sheath airflow (Maßling et al., 2003). The associated uncertainties with RH measurements at 90 % RH are 1.0 %. The particle hygroscopic growth distribution at a specific humidity and dry size (Dp, dry) can be conveniently determined through the CPC. There are two humidity sensors (Vaisala) in the system for aerosol flow and sheath flow, respectively. The sensors in the second DMA were calibrated automatically every 30 min at 90 % RH using 100 nm ammonium sulfate ((NH4)2SO4) particles to analyze stability at high RH. The measurement error in the HTDMA depends mainly on RH measurement and control uncertainties within the system (Su et al., 2010). All RH sensors were calibrated using the Vaisala salt kit containing LiCl, NaCl, KCl, and so forth before the measurement campaign. Size calibration for both DMAs involved the application of latex particles of a standard size, 200 nm prior to measurement. The number concentration peak occurred at 203 nm, which attests to the accuracy of the DMAs' size selection at 1.5 %. The HTDMA system was used to measure the hygroscopic growth factors (HGFs) of particles with a Dp, dry, of five different sizes (20, 50, 100, 150 and 200 nm), at 90 % RH. The full scan covering all five sizes had a time resolution of approximately 30 min.
Particle number size distributions (PNSDs) and particle volume size distributions (PVSDs) were measured using an MPSS.
2.2 Meteorological and gas data
The gas data were obtained from the R K Puram Delhi Pollution Control Committee (DPCC) monitoring station, a continuous ambient air quality monitoring station managed by the central control room for air quality management (Delhi NCR, National Capital Region). The data were downloaded from the Central Pollution Control Board (CPCB) website (https://app.cpcbccr.com/ccr/#/caaqm-dashboard/caaqm-landing/data, last access: 15 April 2021). R K Puram is situated 3.5 km northwest of IIT Delhi. The automatic weather station (WatchDog 2000 series) continuously measured wind speed (WS), wind direction (WD), temperature (T), and relative humidity (RH). The station is installed on the rooftop of a ninth-floor building at IIT Delhi.
2.3 Data analysis
2.3.1 HTDMA
Overall, we conducted 1483 cycles of HTDMA scans. After each cycle, we calculated the percentage difference between the measured and theoretical growth factors (Δq) for 100 nm ammonium sulfate particles. Only those cycles with % were included for further data analysis, while the remaining cycles were discarded (Kecorius et al., 2019). As a result, we obtained 1102 HTDMA scan cycles that passed this data quality check. Regarding good scan cycles, we conducted 1449, 1431, 1438, 1470, and 1420 successful HTDMA scans for particles of sizes 20, 50, 100, 150, and 200 nm, respectively, for further analysis. Subsequently, we applied the TDMAinv toolkit, a piecewise linear TDMAinv algorithm developed by Gysel et al. (2009) and written in Igor Pro, to perform data postprocessing on the raw HGF data. The measured distribution function is a smoothed and skewed integral transformation of actual probability density functions for growth factors (GF-PDFs). Gysel et al. (2009) provide a detailed account of the raw data processing in the TDMAinv toolkit for the measurement of real HGFs. The TDMAinv toolkit was successfully employed in various studies across the globe (Gysel et al., 2007; Liu et al., 2012; Sjogren et al., 2007; X. Wang et al., 2018), including Kanpur, India (Mandariya et al., 2020). Furthermore, the RH in DMA2 generally reached the designated 90 % value and remained stable within ±1 %. However, on occasion, it experienced significant drifts. To address this issue, all growth factors measured between 88 % and 92 % RH were adjusted to the target value of 90 % (HGF_90 %) (Gysel et al., 2007) with the kappa model recommended in the TDMAinv toolkit (Gysel et al., 2009). This approach effectively minimized the RH drifts in DMA2. After conducting scans at the target RH for aerosol particles of 20, 50, 100, 150, and 200 nm, 979, 957, 972, 969, and 966 of these scans were corrected, respectively. The corrected scans were then averaged for a 60 min time resolution, resulting in 425, 429, 419, 424, and 417 scans.
Furthermore, using the kappa-Köhler theory (Mandariya et al., 2020; Petters and Kreidenweis, 2007), we calculated the size-resolved hygroscopicity factors (kappa, κ, of say κHTDMA_90 %) from the corresponding size-resolved target-RH-corrected HGFs, based on Eq. (1):
where κHTDMA_90 % represents the hygroscopicity factor at 90 % RH, while HGF_90 % is the size-resolved HGF at 90 % RH. RH stands for atmospheric relative humidity expressed as a fraction, and σ denotes the surface tension of the aerosol liquid droplet–air interface at the droplet surface measured in N m−1, assumed to be nearly that of pure water. R represents the universal gas constant, expressed in units of . Mw denotes the molecular mass of water, while T signifies the ambient temperature in kelvin (K). ρw signifies the density of water in kg m−3. Do denotes the dry mobility diameter of the particle in meters (m).
2.3.2 MPSS
The electrical mobility distribution is measured by an MPSS and then converted to PNSD in the mobility diameter range of 8 to approximately 800 nm. This is achieved by utilizing an inversion algorithm to correct for multiple charged aerosol particles (Wiedensohler, 1988; Pfeifer et al., 2014) and diffusional losses (Wiedensohler et al., 2012, 2018).
2.3.3 ACSM
For a detailed account of the ACSM setup, please refer to Arub et al. (2020). The ACSM operated in a temperature-controlled laboratory at almost 0.1 L min−1 and a 1 min time resolution. It was set to measure the mass-to-charge ratio () from 10 to 140. The PM1 aerosol beam was concentrated and directed towards the vaporizer at 600 °C. The flash-vaporized compounds were then ionized through impact ionization at 70 eV (electronvolt) electrons and detected using a quadrupole mass spectrometer (Ng et al., 2011). The study employed a 200 ms amu−1 (atomic mass unit) scan speed and a pause setting of 125 for a sampling duration of 64 s to collect aerosol mass spectra using the ACSM technique. Refer to Gani et al. (2019) for comprehensive guidance on the ACSM operational procedures. For ACSM calibration and data processing, please refer to Patel et al. (2021). Positive matrix factorization (PMF) was conducted on the data, resulting in a four-factor solution – hydrocarbon-like OA (HOA), biomass burning OA (BBOA), less oxidized oxygenated OA (LO-OOA), and more oxidized oxygenated OA (MO-OOA) – as shown in Fig. S1 in the Supplement. More information regarding PMF analysis can be found in Sect. S1 and Fig. S2 in the Supplement. Three different events were identified based on the temporal variation in mass concentration peaks of BBOA, HOA, and Cl (see Fig. 2): (1) a period of high residential or biomass burning (H-BB), (2) a period of high hydrocarbon-like OA (H-HOA), and (3) a period of high chloride (H-Cl). Additionally, the “clean period” was defined as a period where the PM1 loading was less than the 25th percentile (≤38.7 µg m−3) of the sampling period. The event's starting and ending times were determined by the initial increase in concentration and subsequent return to the starting values as the concentration decreased.
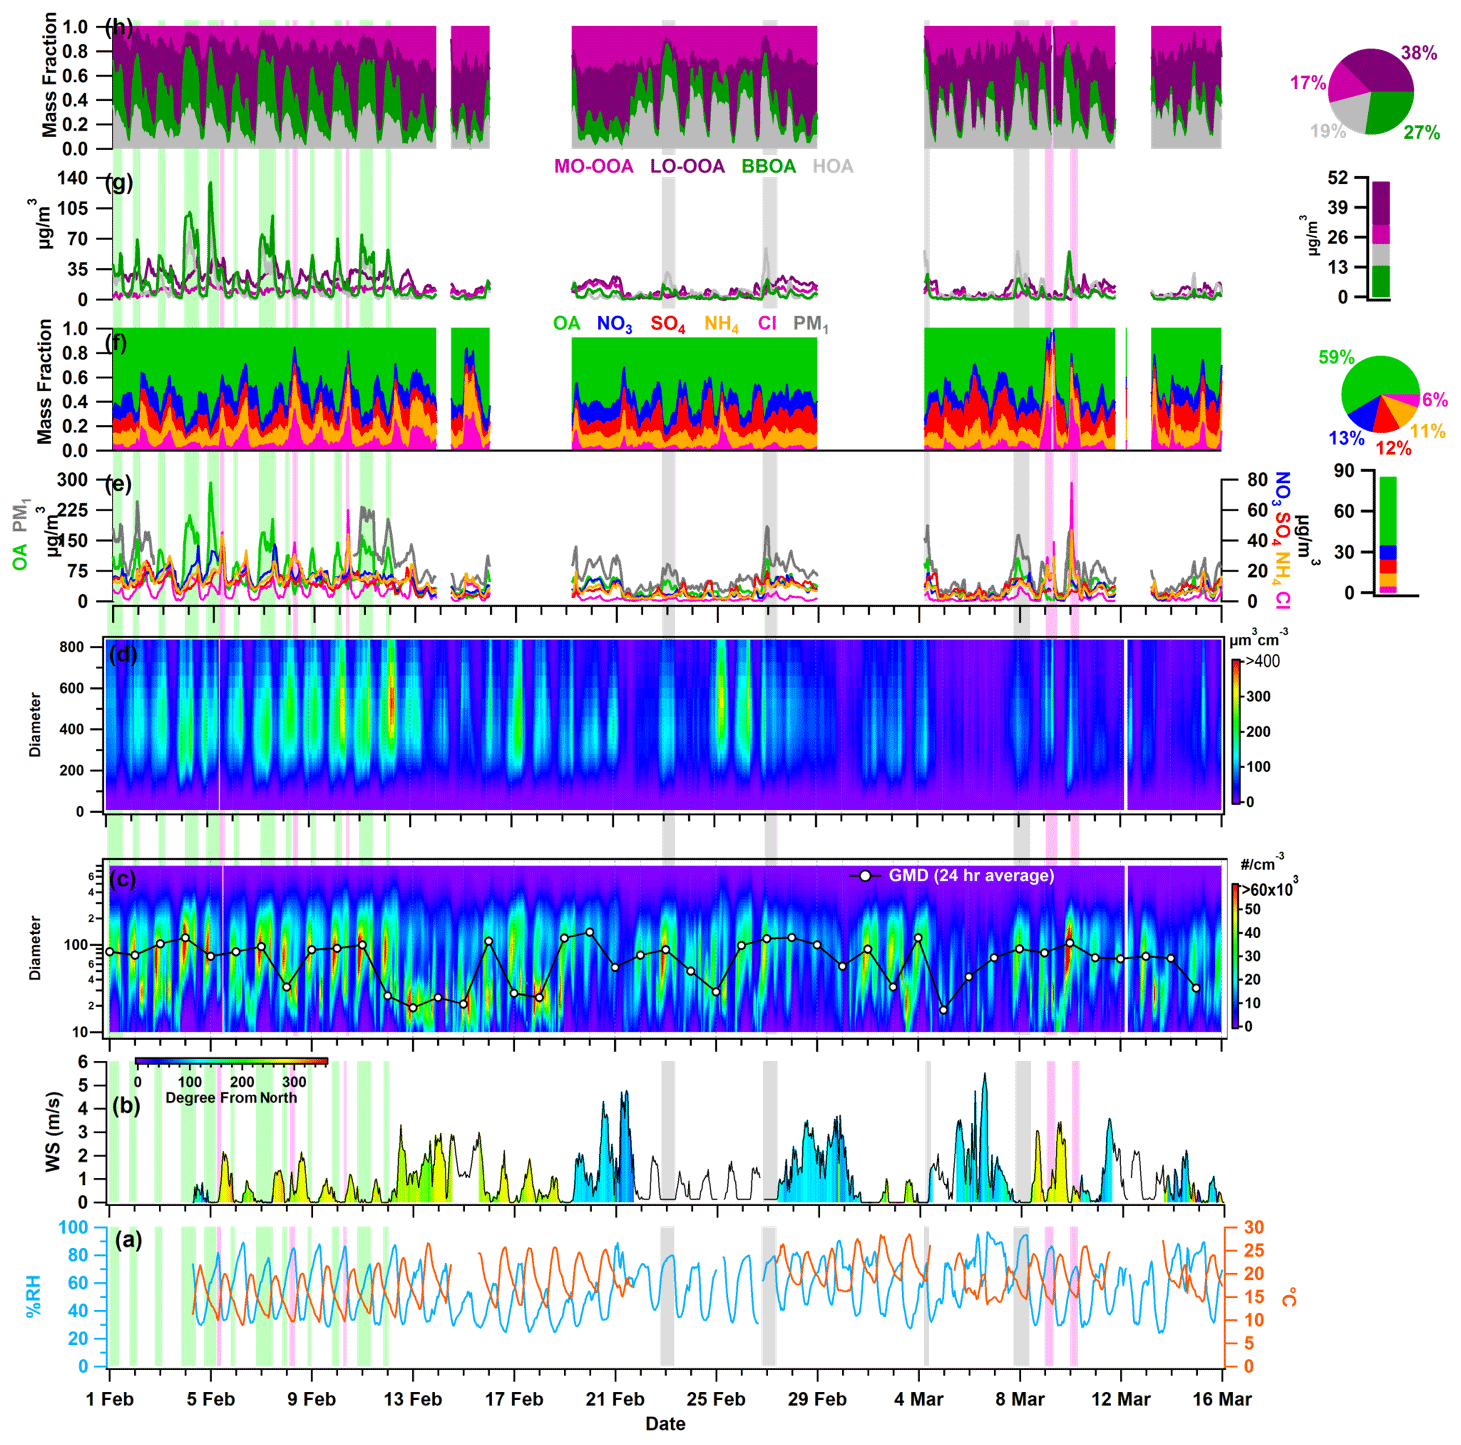
Figure 2Temporal variability in (a) ambient relative humidity (RH) and temperature (T); (b) wind speed (WS) and wind direction (WD); (c) particle number size distribution (PNSD) and 24 h average geometric mean diameter (GMD); (d) particle volume size distribution (PVSD); (e) particulate matter (PM1), organic aerosol (OA), nitrate (NO3), sulfate (SO4), ammonium (NH4), and chloride (Cl); (f) fractional contribution of OA, NO3, SO4, NH4, and Cl in PM1; (g) more oxidized oxygenated OA (MO-OOA), less oxidized oxygenated OA (LO-OOA), biomass burning OA (BBOA), and hydrocarbon-like OA (HOA); and (h) fractional contribution of MO-OOA, LO-OOA, BBOA, and HOA in OA. The pie chart subplot represents the overall average contribution of species, and the bar chart subplot represents the overall campaign average value of different species. All other species are represented with the specific color coding mentioned in the legends. The light-green-, grey-, and pink-shaded vertical lines indicate the events of high BBOA (H-BB), high HOA (H-HOA), and high Cl (H-Cl), respectively. The discontinuity in the data points marks the missing data or non-sampling time.
2.3.4 Derived secondary inorganic salts
The ACSM measures OA, NO3, SO4, NH4, and Cl. A simplified ion-pairing scheme from Gysel et al. (2007) was adopted. However, NH4Cl was not included in their ion-pairing scheme; therefore, we modified it to integrate ammonium chloride into the calculation. Thus, our modified ion-pairing scheme includes NH4Cl (ACl, ammonium chloride), NH4NO3 (AN, ammonium nitrate), (NH4)2SO4 (AS, ammonium sulfate), NH4HSO4 (ABS, ammonium bisulfate), and H2SO4 (SA, sulfuric acid) as shown below.
Case 1: (NH4 to SO4) ≤1
Case 2:
Case 3:
Here, “n” represents the number of moles, while “A”, “N”, “S”, and “C” represents the species NH4, NO3, SO4, and Cl. Inorganic salt concentrations were also predicted using the NH4, SO4, NO3, and Cl components of the ISORROPIA v2.1 model. Our results show a strong linear correlation with an almost unit slope (0.9999) between the calculated and modeled inorganic salts, as presented in Fig. S3. This strongly justifies the new ion-pairing scheme utilized in this study.
2.3.5 Wind rose and potential source contribution function (PSCF)
The wind rose plot was generated using the openair package in R (http://www.r-project.org, last access: 5 May 2021; http://www.openair-project.org, last access: 5 May 2021). The offline-based HYbrid Single-Particle Lagrangian Integrated Trajectory (HYSPLIT4) model developed by the NOAA Air Resources Laboratory (ARL) (Draxler and Hess, 1997) was used to estimate the 48 h back trajectory of air masses that reached the Delhi Aerosol Supersite (DSL) at 500 m a.g.l. for the entire study period at hourly intervals. The meteorological data used for back trajectories were obtained from ARL's Global Data Assimilation System archive, specifically the GDAS 0.5° archive (https://www.ready.noaa.gov/archives.php, last access: 30 May 2021). We used these estimated back trajectories and the measured mass fraction of chemical species of bulk aerosol as input in conducting potential source contribution function (PSCF) analysis. This analysis was carried out with the aid of ZeFir (version 3.7), a tool written in Igor Pro (WaveMetrics). The ZeFir tool is described in detail elsewhere (Petit et al., 2017). Additionally, this tool was used to create the box plots discussed in the following section. To calculate the aerosol liquid water content (ALWC) as a function of inorganic species mass concentration, ambient T, and RH, the ISORROPIA II model (Fountoukis and Nenes, 2007) was utilized.
3.1 Overview of meteorology, trace gases, and aerosol characterization
Figure 2 depicts the hourly resolved temporal changes in various meteorological parameters, including RH, T, WD and WS, PNSD, PVSD, principal components of non-refractory PM1, and OA with corresponding fractional mass contributions. In addition, Fig. S4 exhibits the temporal fluctuations in atmospheric gases, specifically nitrogen oxides (NOx), carbon monoxide (CO), and sulfur dioxide (SO2). Delhi's winter climate is mainly affected by a depression caused by western disturbances, resulting in cold waves in the region. The ambient RH and T vary within the range of 24.2 % to 96.6 % and 9.0 to 28.5 °C, respectively. The average values of RH and T are 56.0 ± 18.2 % and 18.7 ± 4.2 °C, respectively. These fluctuations indicate a shift in Delhi's atmosphere transitions from being damp and chilly in February to dry and relatively warm in March. Nighttime conditions are consistently cooler and more humid than daytime conditions throughout the sampling period. Ambient RH exhibits a diurnal pattern, with a peak occurring during the early morning hours (06:00–07:00 local time (LT; the time zone for all instances in the text is LT)) and a valley appearing around midday (13:00–15:00). Conversely, ambient temperature follows an opposing trend, increasing at midday, which can be correlated with higher solar radiation during those hours (refer to Fig. 3a and b). The high ambient temperature and peak O3 concentration observed during midday (see Fig. 3i) indicate the possibility of daytime photooxidation processes according to research carried out by Nelson et al. (2023). Figure S5 displays the variation in WS and WD, ranging from 0.0 to 5.6 m s−1 (with an average of 1.0 ± 1.0 m s−1) and 4.0 to 345.7° (with an average of 197.1 ± 84.4°) from the north, respectively. The majority of wind directions were in the WNW–WSW and E–ESE direction. These patterns indicate that the air quality in Delhi remained relatively stagnant throughout the study period. The measured aerosols are likely to be a result of local emissions and aerosol chemistry.
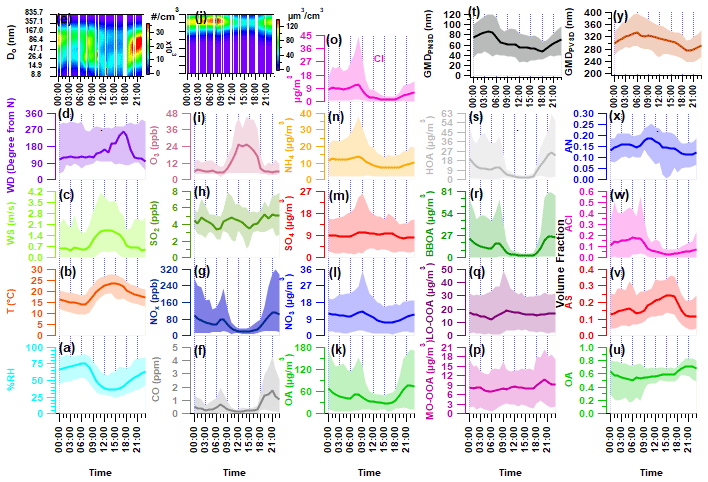
Figure 3Diurnal variation in ambient meteorological parameters: (a) ambient relative humidity (RH) in percent, (b) temperature (T), (c) wind speed (WS), (d) wind direction (WD), and (e) particle number size distribution (PNSD); (f–i) mass concentration of ambient trace gases (f) carbon monoxide (CO), (g) nitrogen oxides (NOx), (h) sulfur dioxide (SO2), and (i) ozone (O3); (j) particle volume size distribution (PVSD); (k–o) mass concentration of aerosol constituents (k) organic aerosol (OA), (l) nitrate (NO3), (m) sulfate (SO4), (n) ammonia (NH4), and (o) chloride (Cl); (p–s) mass concentration of organic aerosol species (p) more oxidized oxygenated OA (MO-OOA), (q) less oxidized oxygenated OA (LO-OOA), (r) biomass burning OA (BBOA), and (s) hydrocarbon-like OA (HOA); (t) geometric mean diameter of particle number size distribution (GMDPNSD) and (u–x) volume fractional contribution of (u) organic aerosol (OA), (v) ammonium sulfate (AS), (w) ammonium chloride (ACl), and (x) ammonium nitrate (AN) in PM1; and (y) geometric mean diameter of particle volume size distribution (GMDPVSD). The upper and lower boundaries of the shaded area represent the 95th and 5th percentile values of the respective species.
Throughout the sampling period, ambient trace gases NOx and CO demonstrate notable variability, peaking from local burning activities. During intense biomass burning activities, ambient NOx levels reach a maximum of 421.2 ppb (58.4 ± 61.9). CO concentrations also reach maximum levels during periods similar to those of NOx, varying from 0.0 to 7.66 ppm (0.58 ± 0.79), as illustrated in Fig. S4. The time-specific changes in the levels of these trace gases are illustrated in Fig. 3f–i. The graph indicates two crests (06:00–08:00 and 17:00–20:00), which are attributed to local biomass/trash burning emissions that happen in the morning and heavy traffic during nighttime rush hours. Conversely, SO2 demonstrates a distinct pattern, with varying concentrations ranging from 0.46 to 9.55 ppb (4.41 ± 1.20). Notably, it exhibits peaks during the morning (09:00–12:00) and at midnight (21:00–02:00), which are connected to local industrial stack emissions.
The PM1 particle number concentration ranges from 408 to 29 845 particles cm−3 (11 319 ± 5552). Elevated particle number concentrations are commonly linked to local burning incidents. The particle concentration sees a rise in the evening (at 18:00) and peaks at midnight, implying an increase in residential burning activity and traffic exhaust emissions. These activities likely contribute to the decrease in the geometric mean diameter (GMD) of the PNSD, which is around 47 nm. However, this value increases to nearly 87 nm, as shown in Fig. 3t, indicating the organic aerosol's nighttime aging. Figure 3y depicts that the hourly averaged mean diurnal GMD of PVSD varies from about 274 to 324 nm, with a mean value of 309.1 ± 33.1 nm. This average is similar to the higher-end particle size of the 200 nm hygroscopicity measurement used in this study. Therefore, the ACSM bulk aerosol composition is the most appropriate option for discussing the hygroscopicity of these particles.
The PM1 concentration, also known as hourly time-resolved NR-PM1, ranged from 9.0 to 357.9 µg m−3 with an average of 81.2 ± 56.6 µg m−3. This range is consistent with the 12.7–392 µg m−3 (NR-PM1) boundary previously reported by Gani et al. (2019) at the same sampling location. Prakash et al. (2018) found that PM1 mass concentration accounts for 83 % of PM2.5, indicating the prevalence of combustion-based particles. Additionally, we observed a high correlation (r2=0.83, p<0.05) between PM1 measured by the ACSM and MPSS, assuming an effective aerosol density of 1.6 g cm−3 (refer to Fig. S6). The OA ranged from 1 and 293 µg m−3 (46.5 ± 39.6 µg m−3), with PM1 being the predominant fraction. These findings are consistent with the range of 53.3 to 166 µg m−3 (112 µg m−3) observed during the winter months (December–February) at the same location (Gani et al., 2019). However, the decrease in the average OA concentration during the measuring period of February–March can be explained by the reduction in aerosol loading after its peak in December–January (Gupta and Mandariya, 2013). The campaign average fractional contribution of OA to PM1 was 56 %, with a range of 1 % to 84 %. This high OA concentration in fine particulate matter (PM1) aligns with findings from prior studies in the IGP, including those conducted by Chakraborty et al. (2016), Gani et al. (2019), and Mandariya et al. (2019), as well as those conducted worldwide, such as by Jimenez et al. (2009) and Zhang et al. (2007). Peak OA mass concentrations were observed between 21:00 and 23:00 (Fig. 2k), which is in line with observations made at the same site by Gani et al. (2019) and Rai et al. (2020). The average mass concentration of NO3 during the campaign was 10.1 ± 7.0 µg m−3, exhibiting diurnal variation with distinct peaks in the morning and at midnight (Fig. 3l). Additionally, SO4 demonstrated a slight enhancement at 08:00, and its concentration remained relatively stable from noon to 17:00 (Fig. 3m). Conversely, Cl experienced significant fluctuations, ranging from 0.13 to 77.83 µg m−3, with higher concentrations of Cl occurring episodically throughout the campaign. The Cl concentration aligns with the previously reported value of Gani et al. (2019) of 0.1–66.6 µg m−3 at the same location. Figure 2g and h illustrate the temporal variation in various OA factors. The mass concentration of BBOA peaks during the nighttime and morning hours (Fig. 3r). On the other hand, LO-OOA exhibits a peak in the morning and remains relatively stable at noontime, indicating a steady formation. Meanwhile, MO-OOA exhibited a slight rise around midday, suggesting daytime photooxidation formation (Mandariya et al., 2019; Sun et al., 2016). During the sampling period, oxygenated organic aerosol (OOA) comprised the majority of OA. The BBOA mass concentration during H-BB events varied dynamically, ranging from 16.3 to 134.7 µg m−3, with an average of 50.7 ± 24.0 µg m−3. Concurrently, these events displayed higher levels of HOA, ranging from 9.6 to 109.4 µg m−3, indicating a likely similarity in the sources of HOA during this particular incident. However, during H-HOA events, concentrations of HOA were higher, ranging from 4.8 to 58.9 µg m−3, although these amounts were notably lower than those observed during H-BB events. Nonetheless, the fractional mass contribution of HOA to OA was the largest of all OA categories. Additionally, during H-Cl events, there were increased concentrations of both primary organic aerosol HOA and BBOA. BBOA accounted for about 40.0 %, 21.1 %, 32.5 %, and 13.1 % of OA during H-BB, H-HOA, H-Cl, and relatively clean events, respectively, indicating varied sources of BBOA. Furthermore, the average contribution of H-HOA was the highest during the H-HOA event, at 41.6 %. During the H-Cl event, Cl's contribution to the fractional mass in PM1 peaked at 44.9 %, which was higher than the contributions of 21.2 % in H-BB events and 7.3 % in H-HOA events.
3.2 Hygroscopicity of nucleation, Aitken, and accumulation mode particles
3.2.1 Temporal variability
Figure 4 displays the hourly averaged dynamic variability in HGF90 % and κHTDMA_90 % (kappa) for aerosol particles in the nucleation, Aitken, and accumulation modes at 90 % ambient relative humidity. The hygroscopic growth factors of particles sized at 20 (HGF90 %_20 nm), 50 (HGF90 %_50 nm), 100 (HGF90 %_100 nm), 150 (HGF90 %_150 nm), and 200 nm (HGF90 %_200 nm) varied between 1.00–1.41, 1.05–1.39, 1.11–1.49, 1.12–1.63, and 1.12–1.79. The averaged hygroscopic growth factors of the 20, 50, 100, 150, and 200 nm aerosol particles were 1.14 ± 0.09 (average ± standard deviation), 1.16 ± 0.06, 1.27 ± 0.07, 1.35 ± 0.09, and 1.41 ± 0.09, respectively. These values indicate statistical significance (p<0.05) between the different hygroscopic growth factors. Moreover, the hygroscopicity values (κ20 nm_90 % and κ50 nm_90 %) of the aerosol particles were found to range between 0.00–0.11 and 0.02–0.25 for the 20 and 50 nm particle sizes, respectively, with an average of 0.03 ± 0.02 and 0.09 ± 0.03. Nucleation mode particles, consisting mainly of monomodal GF-PDFs (Fig. 4a), consisted of approximately 74 ± 24 % nearly hydrophobic particles (HGF<1.2). However, this percentage increased to 100 % and was associated with nighttime local burning activities, as demonstrated in Fig. 4a. The nucleation mode particles (κ20 nm_90 %) exhibited significantly (p<0.05) lower hygroscopicity than the Aitken mode particles (κ50 nm_90 %). Hong et al. (2015) found that nucleation mode particles have higher susceptibility to condensable vapors such as newly emitted volatile organic compounds (VOCs), H2SO4, and HCl. Nevertheless, the study at hand did not measure these substances. The κ value of Aitken-sized particles was comparable to 0.24 ± 0.08 of the 52.6 ± 6.9 size particles reported by Gunthe et al. (2011) for Beijing, which, like Delhi, is one of the most polluted urban areas. Gunthe et al. (2011) conducted this study on CCN at supersaturation levels, justifying the comparison. The campaign average hygroscopicity parameter (kappa, κ90 %) increased significantly (p<0.05) with particle size, which attributed to the Kelvin effect (X. Wang et al., 2018). In the accumulation size range of 100, 150, and 200 nm, κ90 % increased to approximately 0.56. The mean values for κ100 nm_90 %, κ150 nm_90 %, and κ200 nm_90 % were 0.14 ± 0.04, 0.18 ± 0.06, and 0.22 ± 0.07, respectively. The range for κ200 nm_90 % was between 0.05 and 0.56. Similar variations in κ with particle size have been observed globally (Cerully et al., 2015; Enroth et al., 2018; Fan et al., 2020; Kawana et al., 2016; Kim et al., 2020; Kitamori et al., 2009; Ogawa et al., 2016; Sjogren et al., 2008; X. Wang et al., 2018), including in Kanpur, India, situated in the center of the IGP (Mandariya et al., 2020). These variations have been attributed to the prevalent increase in inorganic to organic aerosol fraction in particles with a size increment. Furthermore, Arub et al. (2020) reported that κHTDMA_90 % was approximately in the range of 0.13–0.77 for PM1 in Delhi, without considering black carbon (BC). However, their theoretical prediction of particles' hygroscopicity took into account a particle's chemical composition, leading to more precise results. Arub et al. (2020) thus provided a theoretical prediction of particles' hygroscopicity by considering a particle's chemical composition. A value of 10 % in the κ calculation was observed when considering BC in the aerosol chemical composition. Additionally, the κHTDMA_90 % measured in this study aligned with the global average value of 0.27 ± 0.21 for continental aerosols (Petters and Kreidenweis, 2007; Pringle et al., 2010). Subsequent sections will discuss the impact of a particle's chemical composition, local meteorology, and air mass trajectories on κHTDMA_90 % for accumulation mode particles.
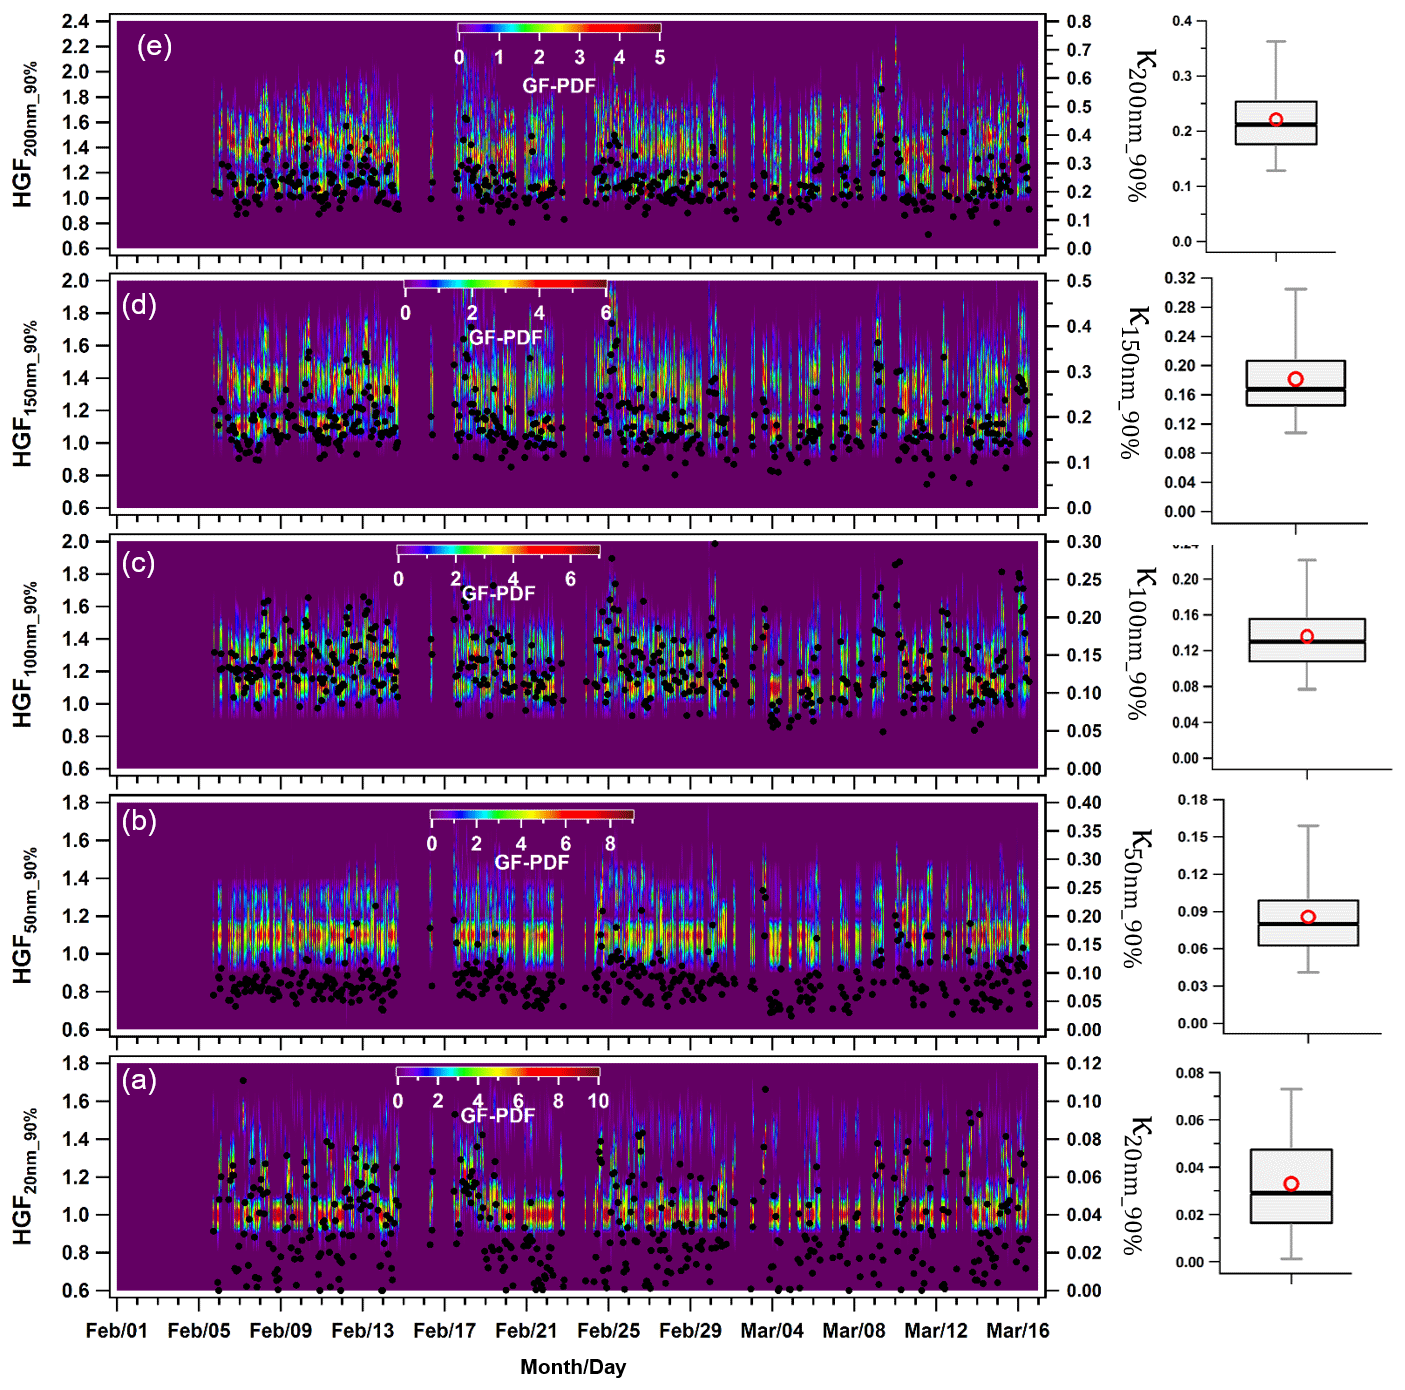
Figure 4Temporal variability in the hygroscopicity parameter kappa (κ) of (a) 20 nm (κ20 nm_90 %) nucleation mode particles; (b) 50 nm (κ50 nm_90 %) Aitken mode particles; and (c) 100 nm (κ100 nm_90 %), (d) 150 nm (κ150 nm_90 %), and (e) 200 nm (κ200 nm_90 %) accumulation mode particles. The box plots represent the variability in the hygroscopicity of respective sizes of particles in which low and high whisker traces represent the 5th and 95th percentile, respectively. The red marker indicates the average of the data, whereas the upper and lower sides of the boxes indicate the 75th and 25th percentile of the data, respectively.
3.2.2 Diurnal variability
The diurnal variation in κHTDMA_90 % differed for nucleation (κ20 nm_90 %), Aitken (κ50 nm_90 %), and accumulation (κ100 nm_90 %, κ150 nm_90 %, and κ200 nm_90 %) mode particles. Figure 5 illustrates the hourly resolved average κ for each particle size, showing a diel trend. The larger particles displayed higher κ values than the smaller ones, consistent with trends observed in Kanpur, India (Mandariya et al., 2020), and other locations worldwide (Fan et al., 2020; Hong et al., 2015). Overall, all particle sizes exhibited a “late-night hump” (02:00–05:00) in κHTDMA_90 %. Only κ20 nm_90 % displayed a diurnal variation with two peaks: one occurring late at night (02:00–04:00) and the other at noon (14:00–16:00). Additionally, two valleys were observed during the morning (07:00–10:00) and night (19:00–22:00), which indicate the strong influence of local burning and traffic activities (Pringle et al., 2010). Furthermore, nucleation-sized particles were potentially contributed by nearly hydrophobic particles (HGF<1.2) from evening to midnight. Monomodal GF-PDF was exhibited around a unit hygroscopic growth factor, potentially suggesting the presence of locally emitted particles. The 20 nm particles are of a sufficiently small size to be classified as nucleation mode particles. Similar diurnal trends of nucleation and Aitken mode particles have been observed by Achtert et al. (2009), who attributed the lower values to the emission of hydrophobic aerosol particles during the local burning emissions. The daytime hump in aerosol particle composition can be attributed to the intensity of the photochemical oxidation process, resulting in the amplification of more oxidized species. Moreover, the gaseous condensation of H2SO4, HNO3, and VOCs predominantly controls their chemical makeup (Hong et al., 2015). The variability in κHTDMA_90 % can be addressed by taking into account the chemical composition of the aerosol. Although κ50 nm_90 % exhibited less variation, it follows a diurnal pattern similar to κ20 nm_90 %. Furthermore, when the dry size of the aerosol particles increased to the accumulated mode, the diurnal variation shifted towards being nearly constant for the rest of the day. Hong et al. (2018) found no discernible diurnal variation in 100 and 150 nm particles of organic-dominated aerosols in China's Pearl River Delta region.
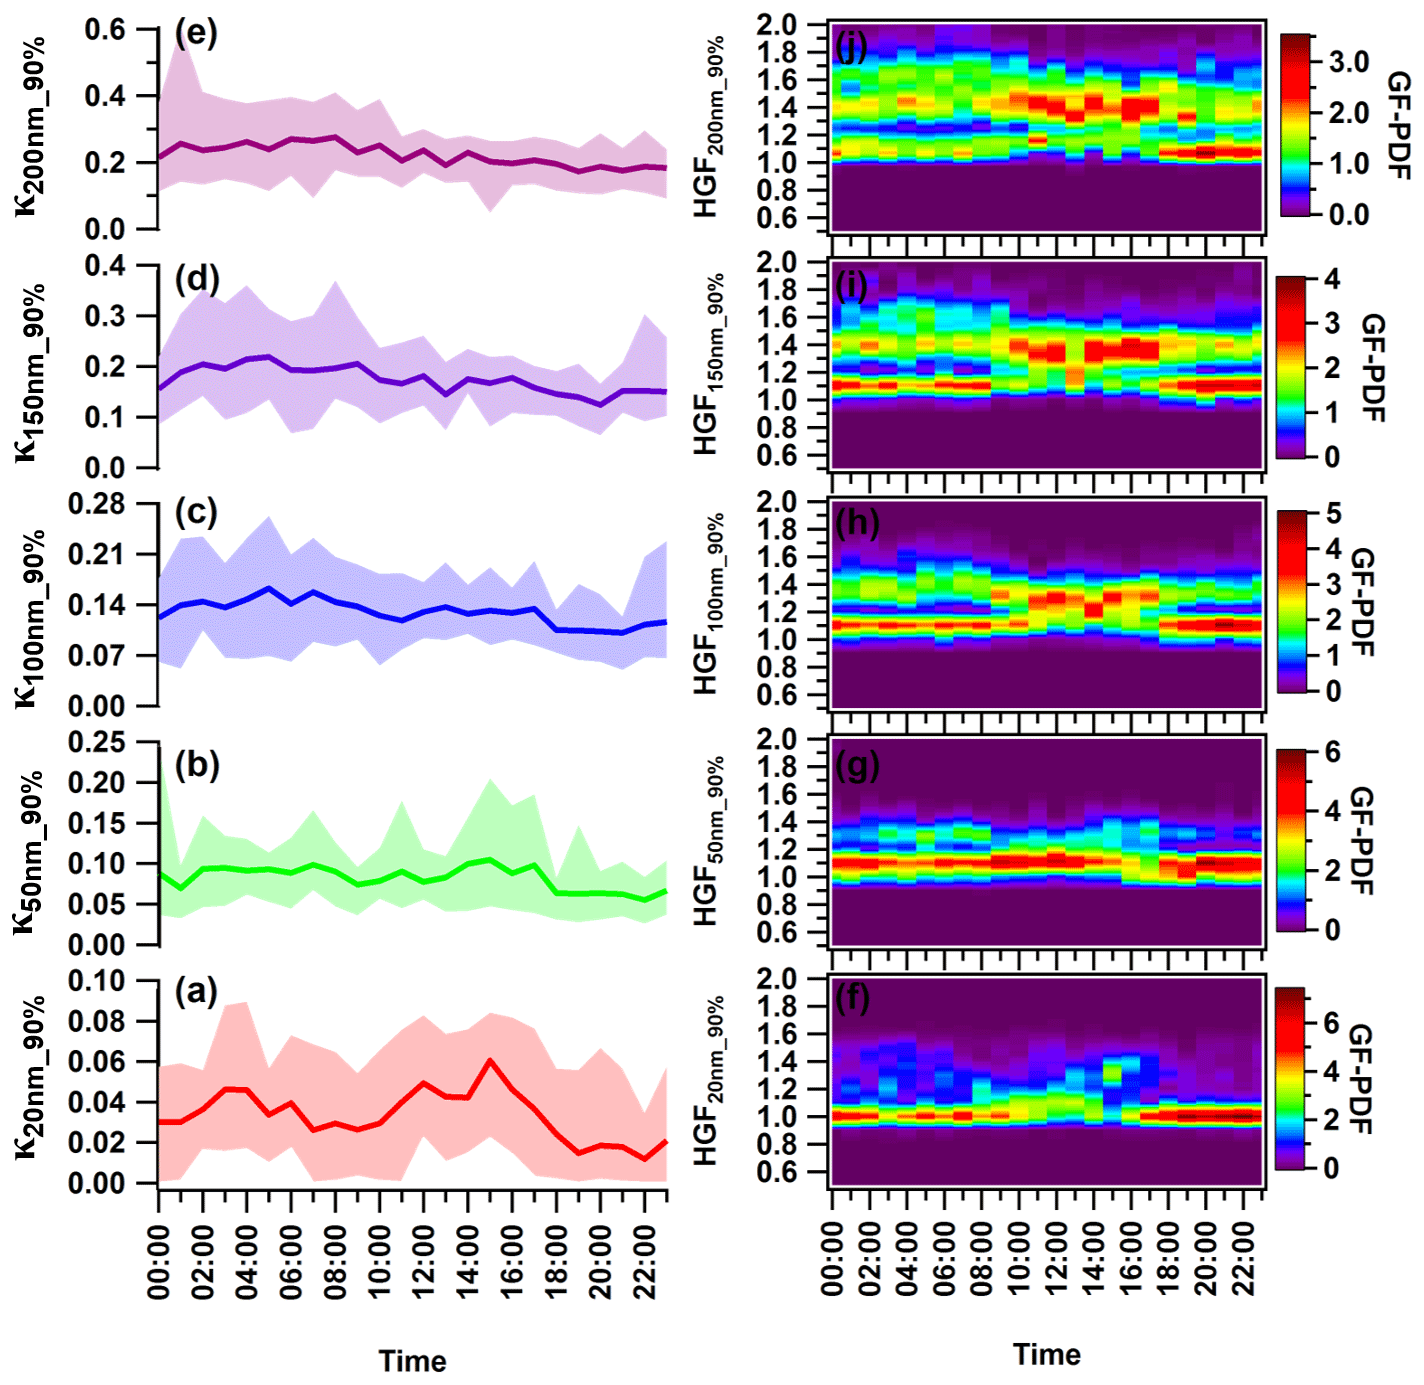
Figure 5(a–e) Diurnal variance in the hygroscopic parameter kappa (κ) of (a) 20 nm (κ20 nm_90 %) nucleation mode particles; (b) 50 nm (κ50 nm_90 %) Aitken mode particles; and (c) 100 nm (κ100 nm_90 %), (d) 150 nm (κ150 nm_90 %), and (e) 200 nm (κ200 nm_90 %) accumulation mode particles. (f–j) Hygroscopic growth factor of (f) 20 nm (HGF20 nm_90 %), (g) 50 nm (HGF50 nm_90 %), (h) 100 nm (HGF200 nm_90 %), (i) 150 nm (HGF150 nm_90 %), and (j) 200 nm (κ200 nm_90 %) aerosol particles. The solid line represents diurnal average values, and the upper and lower shaded areas represent the 95th and 5th percentile values of corresponding average values. Different color coding has been used to represent various size-specific kappa values. The color scale represents the growth factor probability density function of the hygroscopic growth factor.
Furthermore, the diurnal cycles of aerosol physicochemical properties also reflect the dynamic diurnal variation in the planetary boundary layer (PBL), leading to particle accumulation during the night. The study only addressed trend variability using bulk aerosol composition, as size-resolved chemical composition was not quantified. However, the daily average aerosol PNSD ranged from 18.0–140.0 nm, with a mean of 73.1 ± 33.8 nm. The shift in the PVSD mode occurred in the 300–600 nm range, making it appropriate to analyze the κ200 nm_90 % variation in association with the bulk chemical properties of aerosols. Fan et al. (2020) demonstrated in Fig. 3r–v that the increase in the ratio of the inorganic volume fraction to OA volume fractions is responsible for the peak in hygroscopicity observed in the early morning hours. Additionally, in the winter at midnight and during early morning, water-soluble organic and inorganic gases undergo partitioning and/or coagulation/condensation on the surface of pre-existing particles. Furthermore, at high RH and lower temperatures, primary and secondary less oxidized organic aerosols engage in the aging process. This leads to improved oxidation through aqueous/heterogeneous reactions, thereby increasing the hygroscopicity of the particles (Jimenez et al., 2009; Wu et al., 2016). Similar findings were reported by Fan et al. (2020) for winter in urban Beijing. They have attributed this to the increase in hygroscopic particles due to the aqueous-oxidation and/or condensation process on the pre-existing particles. Generally, stronger noontime solar radiation promotes more intense photooxidation processes. The process promotes the distribution of fairly more oxidized and less volatile organics on the surface of particles, thus augmenting the hygroscopic nature of particles that belong to the accumulation mode (Duplissy et al., 2011; Massoli et al., 2010; Tritscher et al., 2011). κHTDMA_90 % exhibited a noontime flattening pattern, which was due to a combination of the positive and negative effects resulting from an increase in the volume fraction of OA and more hygroscopic ammonium sulfate and a decrease in ACl and AN's volume fraction. A potential factor that modulates the hygroscopicity of accumulation mode particles is the lower volume fraction contribution of highly volatile ACl. This correlation is strongly supported by κHTDMA_90 % and the volume fraction of ACl (εACl) in the corresponding size particles.
3.2.3 Driving factor of hygroscopicity
A correlation analysis was conducted between the measured chemical species and aerosol hygroscopicity to investigate the factors governing aerosol hygroscopicity, as presented in Fig. 6. It was found that organic aerosol negatively affected κ, as evidenced by a negative correlation (Fig. S7a). The negative correlation between OA and κ has been noted in India (Bhattu et al., 2016; Mandariya et al., 2020) and globally (Enroth et al., 2018; Hong et al., 2014; Kawana et al., 2016; Kitamori et al., 2009; Y Wang et al., 2018; Wu et al., 2013). These findings suggest that primary constituents were predominant during high loading and may have been nearly hydrophobic or less hygroscopic. The present study found that a 10 % increase in the volume of OA in 200 nm aerosol particles led to a 4 % reduction in their ability to attract water (hygroscopicity) (Fig. S7a). It is noteworthy that ammonium sulfate and nitrate exhibited a weak positive correlation with hygroscopicity (Fig. 7b and c). This may be attributed to sulfate and nitrate aerosols dominant in larger particles (>200 nm). However, increasing the volume of AN and AS by 10 % resulted in a 3.2 % and 1.6 % increase in hygroscopicity, respectively. This demonstrates that even small changes can have a significant impact on the final product, highlighting the importance of careful consideration and attention to detail. If the aerosol composition had an increased AN and AS contribution, the water-bound capacity of the aerosol would have been positively and negatively affected, respectively (refer to Fig. S8). Additionally, as shown in Fig. 6a, there was an increase in the volume fraction of ACl in PM1 with an increase in aerosol hygroscopicity. This strong positive correlation was responsible for a 4.2 % increase in kappa over the increment of 10 % ACl by volume. This was the highest among all chemical species. Furthermore, ammonium chloride has a greater capacity for water absorption (Chen et al., 2022; Zhao et al., 2020), which is supported by the strong correlation between ALWC and the mass fraction of ACl in PM1 as demonstrated in Fig. 6b. The increasing fraction of ACl in PM1 may therefore be attributed to the higher water uptake potential of ammonium chloride. This implies that particles with a higher proportion of ammonium chloride absorb more water vapor, resulting in larger hygroscopic aerosol particles. It is evident that the rise in the ammonium chloride proportion amplifies the aerosol liquid water content, resulting in greater aerosol particle hygroscopicity. A recent study conducted in Delhi by Chen et al. (2022) revealed that the fraction of ammonium chloride in PM1 aerosol increases significantly during higher relative humidity conditions in the winter season. This is due to the co-condensation of semivolatile ammonium chloride with water vapor on particles, leading to enhanced water uptake and severe winter haze in Delhi. The high volume fractions (over 30 %) of ACl in atmospheric PM1 were observed sporadically, leading to the conclusion that the high chloride fraction in the particle phase heavily relies on excess ammonia in the atmosphere. These findings suggest that ammonia plays a crucial role in determining chloride partitioning in the particle phase, leading to increased aerosol water content in high relative humidity conditions and at lower temperature. The concentration of ACl relies heavily on both RH and temperature.
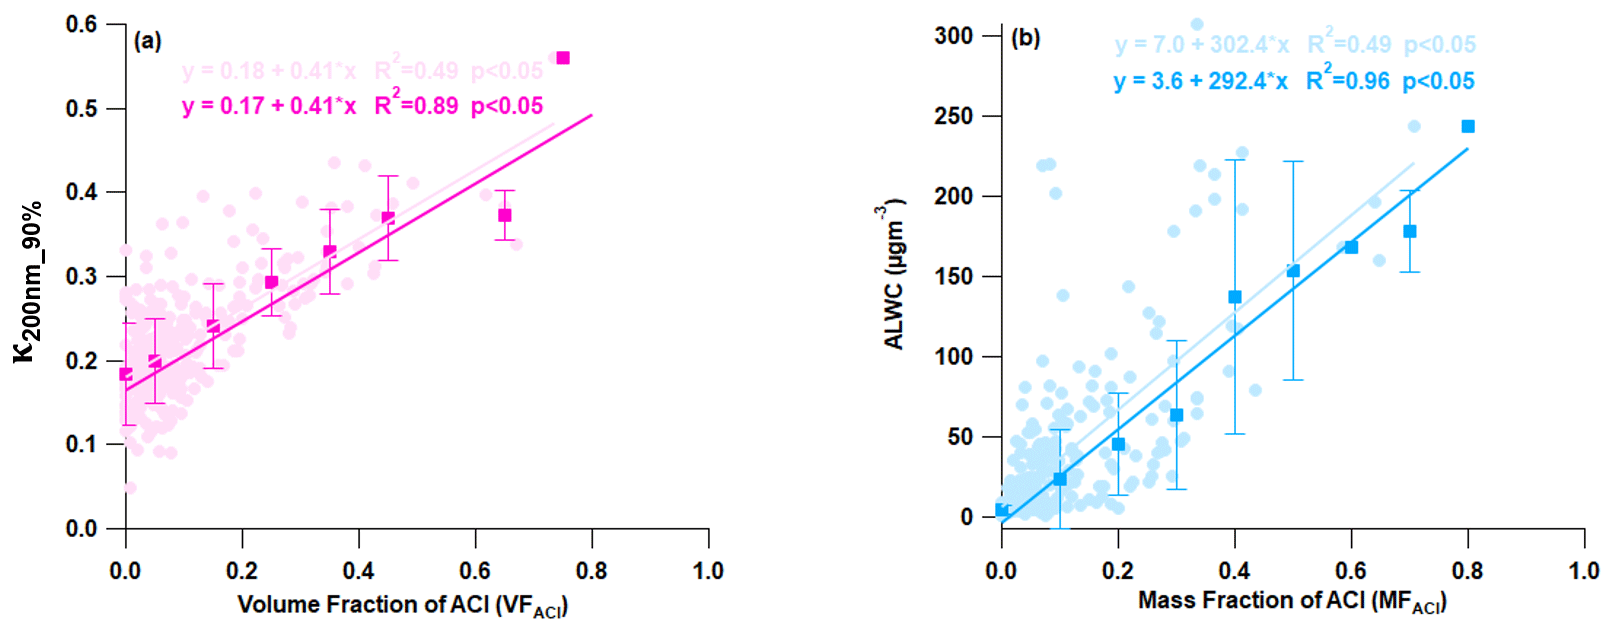
Figure 6Correlation plot for (a) κ200 nm_90 % vs. the volume fraction of ammonium chloride aerosol (VFACl) and (b) aerosol liquid water content (ALWC) vs. the mass fraction of ammonium chloride (MFACl). The solid circle and square markers represent the individual data points and the average of 10 % volume and mass fraction increment of ACl data points, respectively. The light and dark regression lines and equations indicate the overall and average (10 % volume and mass fraction increment) correlation, respectively. The error bars indicate the standard deviation of the data points within the 10 % mass and volume fractional bins.
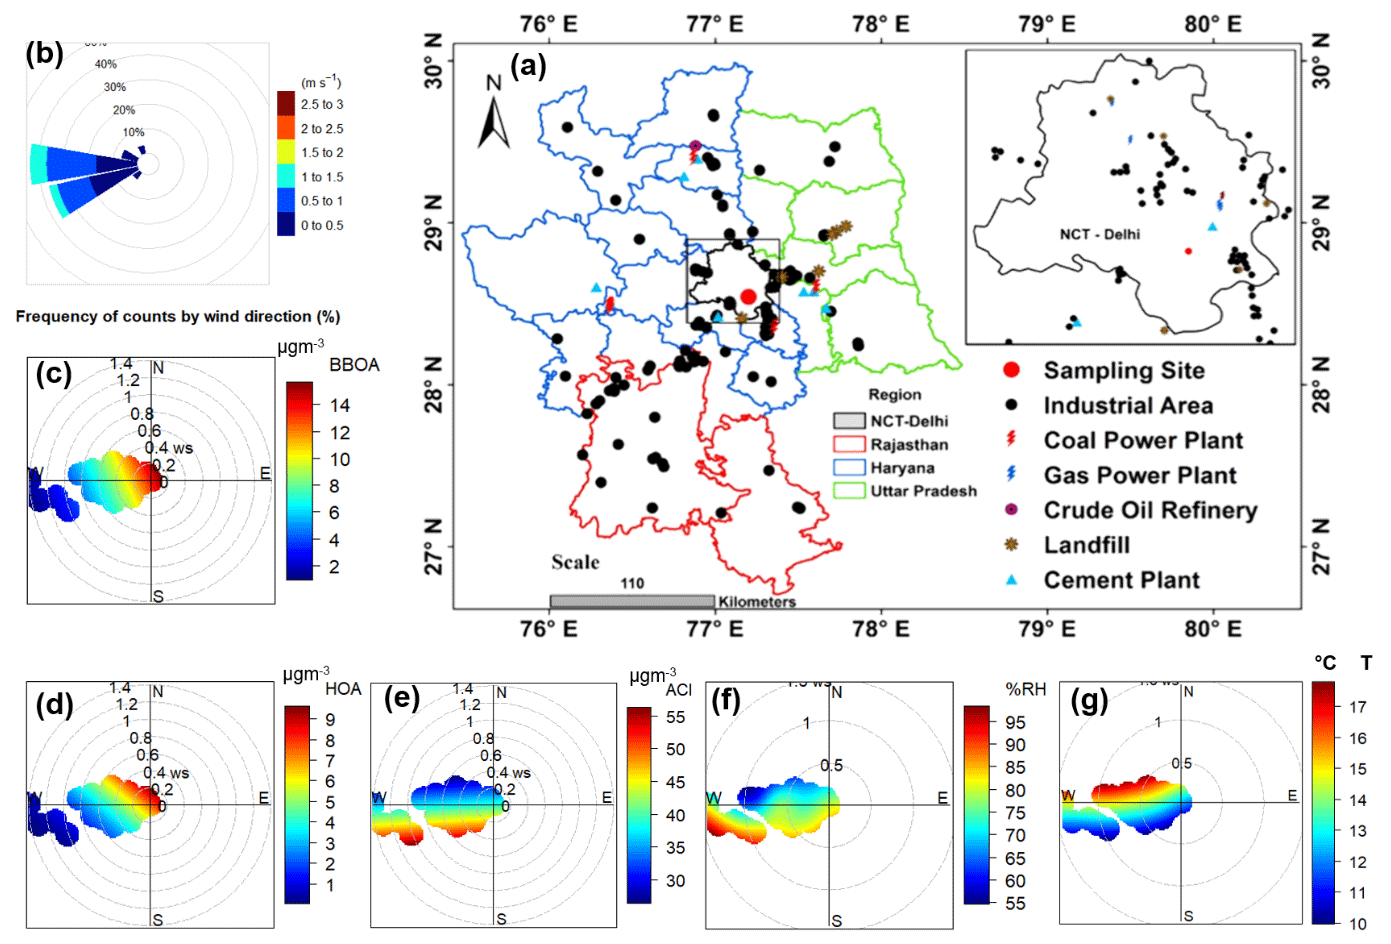
Figure 7(a) Map of Delhi showing various types of industries located in the region and nearby locations; (b) wind rose diagram; and (c–g) conditional bipolar plots showing variation in the mass concentration of (c) biomass burning OA (BBOA), (d) hydrocarbon-like OA (HOA), (e) ammonium chloride (ACl), (f) ambient relative humidity (RH) in percent, and (g) ambient temperature (T), with wind direction (WD) and wind speed (WS) during H-Cl events. A background map showing various industrial locations was adapted from Rai et al. (2020). NCT Delhi: National Capital Territory Delhi.
3.2.4 Hygroscopicity during periods of high biomass burning (H-BB), high hydrocarbon-like OA (H-HOA), and high Cl (H-Cl) and the relatively clean period
Delhi's atmosphere is a complex mixture of chloride and organic aerosol sources resulting from combustion (crop residue, agriculture waste, medical waste, municipal waste, plastic, etc.) and industrial activity. To examine the influence of chloride and OA on aerosol hygroscopicity, all episodic events were categorized into three groups. The first group was H-BB events, the second group was H-HOA events, and the third group was H-Cl events. Aerosol chemical composition data were filtered based on hygroscopic parameter data for subsequent analysis. This facilitates the retrieval of data specific to local emissions and atmospheric chemistry, as well as the effects of various potential transported air masses. Extracting any conceivable information pertaining to aerosol sources and transformation processes is valuable in interpreting their impact on aerosol hygroscopicity.
Events of high Cl (H-Cl)
H-Cl events were selected as they correspond to a significant increase (>20 %) in the fractional volume contribution of NH4Cl (εACl) in the PM1 aerosol at the receptor site. During this period, the surface wind mainly came from the west, although it was also influenced by wind from the west-northwest, west-southwest, and southeast, as illustrated in Fig. 7b. The average geometric mean diameter of the PNSD was almost 64 nm, indicating that nearby fresh emission sources impact the particles. In addition, the average concentration of SO2, NOx, and CO concentrations were at 3.6 ppb, 51.9 ppb, and 0.4 ppm, respectively. The potential contributors to BBOA and HOA were from the WNW and SE directions, as demonstrated in the bipolar plot Fig. 7c and d, and appeared to originate from a local source. Among the inorganic species, ACl displayed a strong correlation with ambient RH, as illustrated in Fig. 7e and f, suggesting that atmospheric gaseous HCl was neutralized by NH3 gas in the presence of atmospheric water content. HCl sources may include coal power plants, solid waste dumping sites with burning trash, and industries in the W–WSW direction (Gani et al., 2019), as depicted in Fig. 7a. Trash burning in Delhi during winter may potentially dominate atmospheric events of high Cl (Shukla et al., 2021; Tobler et al., 2020). In addition, the bipolar plots (Fig. 7e and f) indicate that ACl formation occurs under high relative humidity conditions associated with a relatively calm atmosphere, thereby triggering particle hygroscopicity. This hypothesis is supported by the strong correlation with ALWC, as discussed in the previous section. Moreover, as shown in Fig. 8a, the GF-PDF of particles of all sizes shows a relatively higher fraction of secondary mode particles contributing. More hygroscopic particles (HGF90 %>1.2) accounted for higher percentage of 42 %, 47 %, 50 %, 74 %, and 83 % in particles ranging from 20 to 200 nm in size, respectively. Therefore, ACl plays a significant role in increasing aerosol hygroscopicity, leading to the formation of fog/haze under higher RH and colder atmospheric conditions.
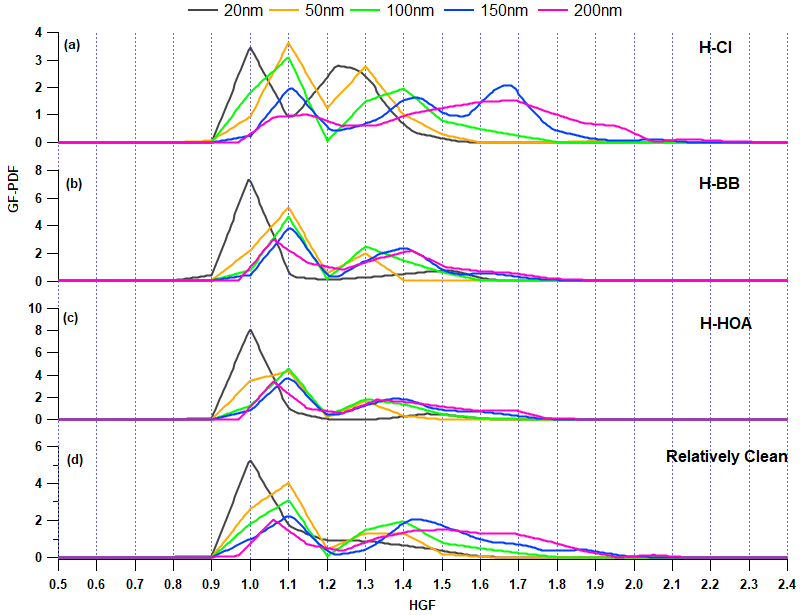
Figure 8Growth factor probability density function (GF-PDF) of 20, 50, 100, 150, and 200 nm aerosol particles for the (a) H-Cl, (b) H-BB, (c) H-HOA, and (d) relatively clean periods.
Gunthe et al. (2021) observed that high local emissions of hydrochloric acid in Delhi during February–March are partitioned into aerosol liquid water under high humidity conditions. This enhances the water uptake capacity of aerosols, sustaining particle hygroscopic growth and resulting in fog/haze formation. Additionally, studies worldwide on size-resolved hygroscopicity have observed Cl to be less than 1 %, leading to the omission of ACl as an aerosol constituent in the discussion. The current study did not find a strong correlation between κ and AS or AN, which may be due to their association with larger particle sizes. Additionally, ACl may be associated with particles of a comparatively smaller size (≤200 nm). Furthermore, in the context of examining the influence of air mass trajectories, we mapped the constituents of aerosols in association with air mass back trajectories using PSCF to determine the potential area source contribution that may be influencing the aerosol evaluation processes, specifically the aerosol's hygroscopicity. However, we did not find any back trajectories that influenced the receptor site, as all trajectory endpoints were observed above the height of the planetary boundary layer.
Events of high biomass burning (H-BB)
During the initial period of the field campaign (1–12 February), there were instances of events of high BB. However, H-BB events were generally observed during the periods of midnight (01:00) to morning (08:00) or evening (20:00) to midnight (01:00) and occasionally from evening (21:00) to morning (11:00). The surface wind circulations were predominantly from the W, W–WNW, and W–WSW directions (refer to Fig. S9b). The aerosol in this study was primarily sourced from local emissions. The aerosol constituents were mainly associated with slower wind circulations from landfill sites, industrial areas, and coal power plants, as shown in Fig. S9a. The PSCF analysis was justified by considering 48 h air mass back trajectories, as shown in Fig. S10. The average GMD of the PNSD was nearly 87 nm. Additionally, the mean concentrations of SO2, NOx, and CO were at 4.7 ppb, 124.1 ppb, and 1.5 ppm, respectively. Therefore, it is possible that BBOA was contributed from the open local biomass burning activities at landfill sites or others sources. The H-BB event showed that organic aerosol confined the largest fraction of BBOA, at 39 %, followed by HOA at 28 %. Figure S9b–d clearly show that BBOA and HOA have similar local source profiles but differ from the ACl source. Additionally, ACl was not found to have a strong association with ambient RH, but it was associated with emissions from a nearby coal power plant. However, the 48 h air mass back trajectories indicate that the current city is also influenced by air masses from certain parts of Uttar Pradesh, Punjab, and Haryana. These states are potential hubs for crop residue burning, industrial activities, and brick kilns, which contribute significantly to the presence of organic aerosols in PM1, particularly during winter. The H-BB event captured a significant volume fraction, 71 %, of OA in PM1. BBOA contributed almost 39 %, as shown in Fig. 9. A lower inorganic-to-organic ratio was a potential factor in decreasing the aerosol hygroscopicity during H-BB events. Additionally, the contribution of primary organic aerosol was enhanced during this event and, on average, increased to 67 %. The hygroscopicity of the aerosol is inversely affected by organic aerosol loading. This observation was also reported by Mandariya et al. (2020) in Kanpur. The authors suggested that the hygroscopicity of the aerosol is adversely affected by primary biomass burning (BBOA) and hydrocarbon-like OA. BBOA was found to have a strong negative correlation with the hygroscopicity of 200 nm particles, supporting the conclusion. Apart from this, the nucleation-sized particle (20 nm) exhibited a hygroscopicity parameter of 0.02 ± 0.02 with a monomodal GF-PDF with the unit mode (Fig. 8b) and consisted of 83.7 ± 18.6 % nearly hydrophobic particles. Additionally, as the aerosol size increased, the hygroscopicity parameter (κHTDMA_90 %) significantly (p<0.05) increased due to the contribution of relatively secondary aerosol particles (GF>1.2) with increasing aerosol size. Approximately 54 % of the accumulation-sized aerosol with a diameter of 100 nm is contributed by nearly hydrophobic particles (GF<1.2), while the remaining 46 % is contributed by more hygroscopic particles (GF>1.2).
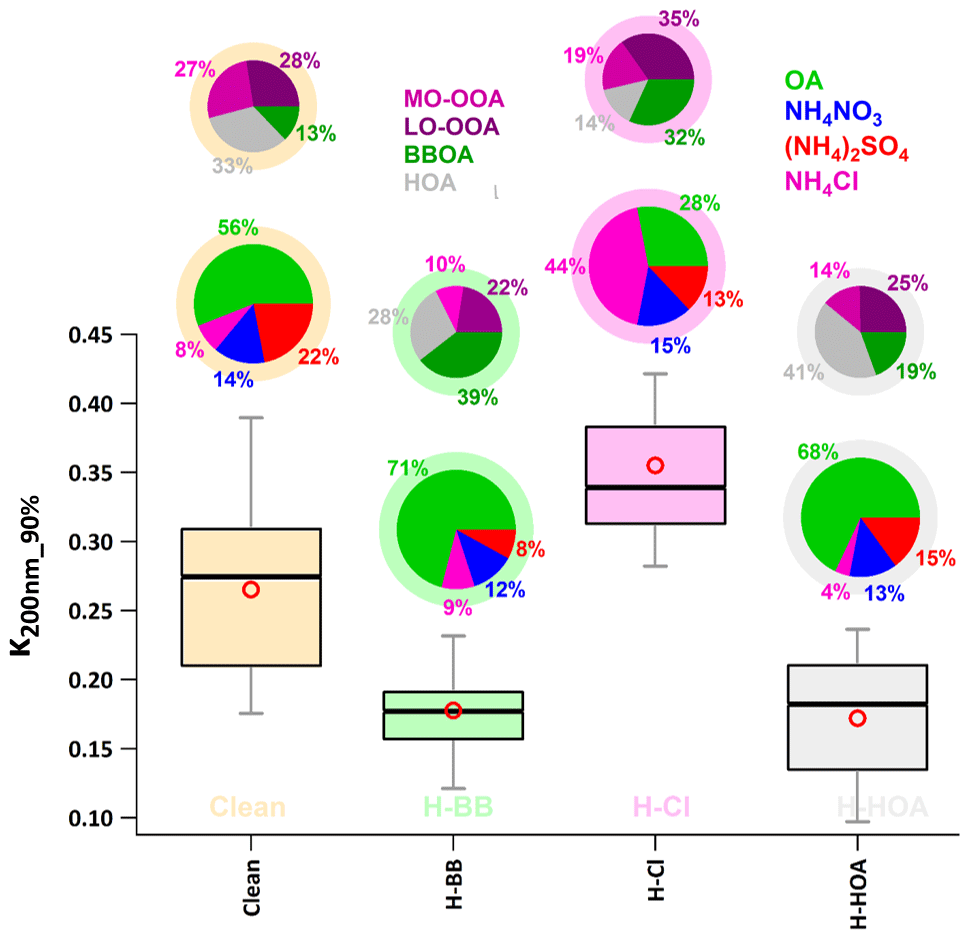
Figure 9Box plot showing variation in the HTDMA-measured hygroscopic parameter of 200 nm size particles κHTDMA (κ200 nm_90 %) in events of high biomass burning (H-BB), high chloride (H-Cl), and high hydrocarbon-like organic aerosol (H-HOA). Different colors represent respective events in the plot. A bigger pie chart represents the overall average volume fractional contribution of various aerosol species indicated by color coding. In addition, minor pie charts described the event average mass fractional contribution of different OA species in OA. Diffused ring color of the pie chart displays the respective event.
Events of high HOA (H-HOA)
H-HOA events were identified based on the considerable mass concentration and fraction of HOA in the organic aerosol. These periods were generally noted from 19:00 to 09:00 the following morning on 22–23 February, 26–27 February, 4 March, and 7–8 March, as indicated in Fig. 2. The average geometric mean diameter of the particle number size distribution was nearly 80 nm. Additionally, the mean concentrations of SO2, NOx, and CO were 4.3 ppb, 136.7 ppb, and 1.1 ppm, respectively. The potential impact of long-range transported aerosol was explored using PSCF. Air masses over Delhi, Haryana, and Uttar Pradesh were found to be potentially associated with hydrocarbon-like organic aerosols (Fig. S11). BBOA also followed a similar path as HOA. However, the potential area source of ACl was the nearby region of Delhi and Haryana. The loading of HOA was significantly (p<0.05) higher than in H-BB, H-Cl, and clean periods. However, emission sources were different during both H-HOA and H-BB periods. HOA may be a critical constituent in modulating aerosol hygroscopicity during these events, as it has been identified as a potential contributor to OA. HOA is typically considered hydrophobic (Duplissy et al., 2011), and therefore, its elevated contribution (41 %) to OA could be responsible for the lower κ observed during these events. The overall hygroscopicity of particles with sizes of 20, 50, 100, 150, and 200 nm was recorded as 0.01 ± 0.01, 0.06 ± 0.03, 0.11 ± 0.03, 0.14 ± 0.04, and 0.17 ± 0.05, respectively. The lower hygroscopicity of particles may be attributed to the predominant fractional contribution of primary aerosol particles (GF<1.2), as illustrated in Fig. 8c. In general, OA constitutes the majority of the PM1, with primary OA accounting for approximately 60 % of OA. However, the relative increase in the contribution of other more hygroscopic constituents, such as secondary organic aerosol (LO-OOA and MO-OOA), ACl, and AS, in the aerosol may help to balance the negative impact of high HOA, which is limited by κ.
Relatively clean period
Clean events were recorded on 24 and 25 February and 5–7 March. The clean duration was from 21:00 to 11:00. E and SE winds dominated the relatively clean period, but pollution was associated with calm winds, as shown in Fig. S12. The average GMD of the PNSD was nearly 54 nm. Additionally, the mean concentrations of SO2, NOx, and CO concentrations were at 4.2 ppb, 43.2 ppb, and 0.4 ppm, respectively. Similar sources were found for BBOA, HOA, and ACl, and they were all strongly associated with ambient relative humidity. The mean concentrations of organic aerosol, ACl, AN, and AS were 11.0 ± 6.4, 1.4 ± 1.1, 3.0 ± 1.5, and 4.4 ± 2.2 µg m−3, respectively. These mass concentrations were significantly lower than in other specified periods. However, OA was still the dominant species, comprising 56 % of the PM1 volume, as shown in Fig. 9. Of all the factors contributing to OA, HOA was the dominant one, accounting for 33 %. However, secondary organic aerosol accounted for the majority of OA at 54.4 %. Secondary OA is characterized by a relatively higher degree of oxidation, which positively affects OA hygroscopicity (Kim et al., 2017; Richard et al., 2011; Wu et al., 2013). The mean hygroscopicity of particles with diameters of 20, 50, 100, 150, and 200 nm during the clean period were observed to be 0.03 ± 0.02, 0.09 ± 0.04, 0.14 ± 0.06, 0.22 ± 0.09, and 0.27 ± 0.07, respectively. These values were significantly (p<0.05) different from each other. However, the hygroscopicity of the 200 nm accumulation particles was not significantly (p>0.05) higher than that of the 150 nm particles. The increase in hygroscopicity as the particle size increases from 20 to 200 nm can also be attributed to the greater proportion of more hygroscopic particles (GF>1.2) compared to nearly hydrophobic or less hygroscopic particles (GF<1.2) (refer Fig. 8d). The nucleation particles, with a size of 20 nm, were mostly composed of less hygroscopic particles (76.8 ± 21.7 %). This indicates that there was an influence from fresh emission sources. On the other hand, Aitken- (50 nm) and accumulation-sized (200 nm) aerosols had a lower percentage of less hygroscopic particles, with 69.3 ± 14.7 and 25.4 ± 10.8, respectively. These results suggest that accumulation-sized aerosols dominated secondary aerosols, which is also supported by their GF-PDF as shown in Fig. 8d. Aerosol particles of nucleation size (20 nm) exhibited a nearly monomodal GF-PDF with a mode of the unit growth factor. In contrast, as the aerosol size increased, the mode shifted towards the higher end and the GF-PDF shifted from unit to multimode.
Comparison of κ for different events
We compared the hygroscopicity of aerosols during different periods using a 200 nm particle size that represents the bulk aerosol chemical composition. Additionally, in this study, the mode of the particle volume size distribution ranged from 400 to 600 nm in dry mobility diameter. Therefore, 200 nm particles are the best choice for comparing hygroscopicity parameters among different periods, considering bulk aerosol composition. Additionally, a good Pearson's r value of 0.76 was found between κ200 nm_90 % and κchem_90 %, which were derived from the chemical composition of dry PM1 particles measured by the ACSM using the Zdanovskii–Stokes–Robinson (ZSR) mixing rule (Stokes and Robinson, 1966). This supports our decision to consider 200 particles for comparison.
The event labeled H-Cl exhibited the highest value (0.36 ± 0.06) of κ200 nm_90 % compared to the events labeled H-BB (0.18 ± 0.04), H-HOA (0.17 ± 0.05), and relatively clean (0.27 ± 0.07), as shown in Fig. 9. Additionally, the average κ200 nm_90 % value for the H-Cl event was significantly (p<0.05) higher than that of the other events. A significant increase in Cl emissions in the Delhi region could lead to a substantial increase in the aerosol liquid water content. This increase in the water content could result in higher aerosol hygroscopicity, which could further enhance cloud condensation nuclei formation. This, in turn, could potentially trigger haze/fog events in the Delhi NCR (Gunthe et al., 2021). Controlling open trash/waste burning in the region could help minimize Cl emissions, which in turn could reduce the possibility of haze/fog formation in high-atmospheric conditions. However, there was no significant difference (p>0.05) in κ200 nm_90 % values between H-BB and H-HOA events, possibly due to relative changes in primary and secondary OA and inorganic species. In H-HOA events, the negative effect of a significantly higher fractional contribution of HOA to OA (41 %) possibly balances with a positive impact of a 7 % increase in secondary OA relative to H-BB. Several worldwide studies (Jimenez et al., 2009; Mandariya et al., 2019; Sun et al., 2013) have reported that secondary organic aerosol is associated with a higher ratio. Additionally, several studies have found a positive correlation between the ratio and κ (Jimenez et al., 2009; Kim et al., 2020), as described earlier. Furthermore, a 5 % decrease in ACl during H-HOA events may be offset by a 7 % increase in the AS fraction during H-BB events. Overall, the relative changes in aerosol constituents resulted in insignificant changes in κ during H-BB and H-HOA periods. However, H-BB and H-HOA events showed significantly (p<0.05) lower hygroscopicity compared to a relatively cleaner atmosphere. The aerosol associated with relatively cleaner events had a higher inorganic-to-organic ratio. Additionally, during clean periods, the aerosol consisted of a significantly higher fraction of secondary organic aerosol. This could be the reason for the higher hygroscopicity associated with organic aerosol compared to other events. Studies worldwide (Aiken et al., 2008; Cerully et al., 2015; Chakraborty et al., 2016; Mandariya et al., 2019) have reported that organic aerosol loading has an inverse impact on the oxidation/aging process of OA. This results in higher hygroscopicity during relatively cleaner periods.
The study examined the hygroscopicity of aerosol particles of various sizes (nucleation, 20 nm; Aitken, 50 nm; and accumulation, 150 and 200 nm) in Delhi during the winter months of February–March 2020. The research also identified differences in hygroscopicity, particularly in aerosols with higher levels of chloride, biomass burning, and hydrocarbon-like organic components. Delhi is known as one of the most polluted cities, particularly during winter haze and fog events when it often experiences high levels of chloride pollution. This study reports on the temporal variations in size-specific hygroscopic parameters (κHTDMA_90 %) under subsaturated conditions (90 % RH) in Delhi for the first time. Additionally, it presents the hygroscopicity of nucleation and Aitken mode particles using HTDMA for the first time in India.
The κHTDMA_90 % values observed for aerosol particles of 20, 50, 100, 150, and 200 nm ranged from 0.00 to 0.11 (with an average of 0.03 ± 0.02), 0.05 to 0.22 (0.11 ± 0.03), 0.05 to 0.30 (0.14 ± 0.04), 0.05 to 0.41 (0.18 ± 0.06), and 0.05 to 0.56 (0.22 ± 0.07), respectively. During the study period, it was observed that the average hygroscopicity parameter increased significantly with the size of the particles (p<0.05). The diurnal variations in κ20 nm_90 % and κ50 nm_90 % were dynamic, while larger accumulation mode particles showed a flatter diurnal pattern. This was due to the positive and negative effects of changes in the volume fraction of NH4Cl and organic aerosol in the aerosol with increasing particle size. The variation in κ200 nm_90 % was primarily associated with fluctuations in NH4Cl and OA, rather than (NH4)2SO4.
Pollution episodes were mainly linked to local biomass burning and industrial and waste burning emissions in Delhi and nearby regions. The study primarily focused on the impacts of emissions of high biomass burning (H-BB), high hydrocarbon-like OA (H-HOA), and high chloride (H-Cl) on aerosol hygroscopicity and compared them to cleaner periods. The period with H-Cl exhibited significantly higher hygroscopicity (0.35 ± 0.06) compared to the periods with H-BB (0.18 ± 0.04) and H-HOA (0.17 ± 0.05) and the relatively cleaner period (0.27 ± 0.07). However, H-BB and H-HOA showed no significant difference in hygroscopicity but displayed lower hygroscopicity compared to the cleaner periods. This could be attributed to lower levels of organic aerosols and a higher ratio of inorganic to organic aerosol in the aerosol. The study found that an increase of 10 % in chloride aerosol (ammonium chloride) significantly increased hygroscopicity, resulting in approximately 3 µg m−3 higher aerosol liquid water content during events of high chloride. This 10 % increase in a high volume fraction of ammonium chloride in aerosol significantly (p<0.05) enhanced aerosol hygroscopicity by 0.0041. The research indicates that chloride emissions are a significant concern in Delhi. These emissions enhance aerosol hygroscopicity, promote cloud formation during winter days, and contribute to fog and haze in the region. High levels of chloride in aerosols counteract the negative impact of high organic aerosol loading on cloud condensation nuclei activity. The study suggests that controlling the open burning of waste materials could help reduce haze and fog events in Delhi during the winter months.
Data can be accessed at https://doi.org/10.5281/zenodo.10803190 (Habib, 2024).
The supplement related to this article is available online at: https://doi.org/10.5194/acp-24-3627-2024-supplement.
AKM: conceptualization, HTDMA data analysis, investigation, methodology, writing (original draft and review and editing). AA: operation of aerosol instrumentation and collection of onboard data in Delhi, analysis of MPSS data, conceptualization, review and editing. MH: assistance in data collection. NAB: ACSM operation, data collection. KP: ACSM data analysis, PMF analysis. JA: ACSM, review and editing. LHR: ACSM, review and editing. AW: experiment design, project administration, supervision, review and editing. GH: operation of aerosol instrumentation and collection of onboard data in Delhi, data analysis, methodology, funding acquisition, project administration, supervision, review and editing.
At least one of the (co-)authors is a member of the editorial board of Atmospheric Chemistry and Physics. The peer-review process was guided by an independent editor, and the authors also have no other competing interests to declare.
Publisher's note: Copernicus Publications remains neutral with regard to jurisdictional claims made in the text, published maps, institutional affiliations, or any other geographical representation in this paper. While Copernicus Publications makes every effort to include appropriate place names, the final responsibility lies with the authors.
The authors express their gratitude to Martin Gysel Beer of the Aerosol Physics and Optics Group at the Paul Scherrer Institut in Switzerland for providing the TDMAinv toolkit for HTDMA data correction.
This paper was edited by Luis A. Ladino and reviewed by three anonymous referees.
Achtert, P., Birmili, W., Nowak, A., Wehner, B., Wiedensohler, A., Takegawa, N., Kondo, Y., Miyazaki, Y., Hu, M., and Zhu, T.: Hygroscopic growth of tropospheric particle number size distributions over the North China Plain, J. Geophys. Res., 114, D00G07, https://doi.org/10.1029/2008JD010921, 2009.
Aiken, A. C., Decarlo, P. F., Kroll, J. H., Worsnop, D. R., Huffman, J. A., Docherty, K. S., Ulbrich, I. M., Mohr, C., Kimmel, J. R., Sueper, D., Sun, Y., Zhang, Q., Trimborn, A., Northway, M., Ziemann, P. J., Canagaratna, M. R., Onasch, T. B., Alfarra, M. R., Prevot, A. S. H., Dommen, J., Duplissy, J., Metzger, A., Baltensperger, U., and Jimenez, J. L.: and ratios of primary, secondary, and ambient organic aerosols with high-resolution time-of-flight aerosol mass spectrometry, Environ. Sci. Technol., 42, 4478–4485, https://doi.org/10.1021/es703009q, 2008.
Albrecht, B. A.: Aerosols, Cloud Microphysics, and Fractional Cloudiness, Science, 245, 1227–1230, https://doi.org/10.1126/science.245.4923.1227, 1989.
Arub, Z., Bhandari, S., Gani, S., Apte, J. S., Hildebrandt Ruiz, L., and Habib, G.: Air mass physiochemical characteristics over New Delhi: impacts on aerosol hygroscopicity and cloud condensation nuclei (CCN) formation, Atmos. Chem. Phys., 20, 6953–6971, https://doi.org/10.5194/acp-20-6953-2020, 2020.
Bhandari, S., Gani, S., Patel, K., Wang, D. S., Soni, P., Arub, Z., Habib, G., Apte, J. S., and Hildebrandt Ruiz, L.: Sources and atmospheric dynamics of organic aerosol in New Delhi, India: insights from receptor modeling, Atmos. Chem. Phys., 20, 735–752, https://doi.org/10.5194/acp-20-735-2020, 2020.
Bhattu, D. and Tripathi, S. N.: CCN closure study: Effects of aerosol chemical composition andmixing state, J. Geophys. Res., 120, 766–783, https://doi.org/10.1002/2014JD021978, 2015.
Bhattu, D., Tripathi, S. N., and Chakraborty, A.: Deriving aerosol hygroscopic mixing state from size-resolved CCN activity and HR-ToF-AMS measurements, Atmos. Environ., 142, 57–70, https://doi.org/10.1016/j.atmosenv.2016.07.032, 2016.
Cerully, K. M., Bougiatioti, A., Hite Jr., J. R., Guo, H., Xu, L., Ng, N. L., Weber, R., and Nenes, A.: On the link between hygroscopicity, volatility, and oxidation state of ambient and water-soluble aerosols in the southeastern United States, Atmos. Chem. Phys., 15, 8679–8694, https://doi.org/10.5194/acp-15-8679-2015, 2015.
Chakraborty, A., Gupta, T., and Tripathi, S. N.: Combined effects of organic aerosol loading and fog processing on organic aerosols oxidation, composition, and evolution, Sci. Total Environ., 573, 690–698, https://doi.org/10.1016/j.scitotenv.2016.08.156, 2016.
Chen, Y., Wang, Y., Nenes, A., Wild, O., Song, S., Hu, D., Liu, D., He, J., Hildebrandt Ruiz, L., Apte, J. S., Gunthe, S. S., and Liu, P.: Ammonium Chloride Associated Aerosol Liquid Water Enhances Haze in Delhi, India, Environ. Sci. Technol., 56, 7163–7173, https://doi.org/10.1021/ACS.EST.2C00650, 2022.
Draxler, R. R. and Hess, G. D.: Descrpition of the HYSPLIT_4 Modeling System, NOAA Techincal Memo, ERL ARL-224, 28,–31 October 2004, https://www.arl.noaa.gov/documents/reports/arl-224.pdf (last access: 30 May 2021), 1997.
Duplissy, J., DeCarlo, P. F., Dommen, J., Alfarra, M. R., Metzger, A., Barmpadimos, I., Prevot, A. S. H., Weingartner, E., Tritscher, T., Gysel, M., Aiken, A. C., Jimenez, J. L., Canagaratna, M. R., Worsnop, D. R., Collins, D. R., Tomlinson, J., and Baltensperger, U.: Relating hygroscopicity and composition of organic aerosol particulate matter, Atmos. Chem. Phys., 11, 1155–1165, https://doi.org/10.5194/acp-11-1155-2011, 2011.
Enroth, J., Mikkilä, J., Németh, Z., Kulmala, M., and Salma, I.: Wintertime hygroscopicity and volatility of ambient urban aerosol particles, Atmos. Chem. Phys., 18, 4533–4548, https://doi.org/10.5194/acp-18-4533-2018, 2018.
Ervens, B., Turpin, B. J., and Weber, R. J.: Secondary organic aerosol formation in cloud droplets and aqueous particles (aqSOA): a review of laboratory, field and model studies, Atmos. Chem. Phys., 11, 11069–11102, https://doi.org/10.5194/acp-11-11069-2011, 2011.
Fan, X., Liu, J., Zhang, F., Chen, L., Collins, D., Xu, W., Jin, X., Ren, J., Wang, Y., Wu, H., Li, S., Sun, Y., and Li, Z.: Contrasting size-resolved hygroscopicity of fine particles derived by HTDMA and HR-ToF-AMS measurements between summer and winter in Beijing: the impacts of aerosol aging and local emissions, Atmos. Chem. Phys., 20, 915–929, https://doi.org/10.5194/acp-20-915-2020, 2020.
Forster, P., Storelvmo, T., Armour, K., Collins, W., Dufresne, J.-L., Frame, D., Lunt, D. J., Mauritsen, T., Palmer, M. D., Watanabe, M., Wild, M., and Zhang, H.: The Earth’s Energy Budget, Climate Feedbacks, and Climate Sensitivity, in: Climate Change 2021: The Physical Science Basis. Contribution of Working Group I to the Sixth Assessment Report of the Intergovernmental Panel on Climate Change, edited by: Masson-Delmotte, V., Zhai, P., Pirani, A., Connors, S. L., Péan, C., Berger, S., Caud, N., Chen, Y., Goldfarb, L., Gomis, M. I., Huang, M., Leitzell, K., Lonnoy, E., Matthews, J. B. R., Maycock, T. K., Waterfield, T., Yelekçi, O., Yu, R., and Zhou, B.,Cambridge University Press, Cambridge, United Kingdom and New York, NY, USA, 923–1054, https://doi.org/10.1017/9781009157896.009, 2021.
Fountoukis, C. and Nenes, A.: ISORROPIA II: a computationally efficient thermodynamic equilibrium model for K+–Ca2+–Mg2+––Na+–––Cl−–H2O aerosols, Atmos. Chem. Phys., 7, 4639–4659, https://doi.org/10.5194/acp-7-4639-2007, 2007.
Gani, S., Bhandari, S., Seraj, S., Wang, D. S., Patel, K., Soni, P., Arub, Z., Habib, G., Hildebrandt Ruiz, L., and Apte, J. S.: Submicron aerosol composition in the world's most polluted megacity: the Delhi Aerosol Supersite study, Atmos. Chem. Phys., 19, 6843–6859, https://doi.org/10.5194/acp-19-6843-2019, 2019.
Gunthe, S. S., Rose, D., Su, H., Garland, R. M., Achtert, P., Nowak, A., Wiedensohler, A., Kuwata, M., Takegawa, N., Kondo, Y., Hu, M., Shao, M., Zhu, T., Andreae, M. O., and Pöschl, U.: Cloud condensation nuclei (CCN) from fresh and aged air pollution in the megacity region of Beijing, Atmos. Chem. Phys., 11, 11023–11039, https://doi.org/10.5194/acp-11-11023-2011, 2011.
Gunthe, S. S., Liu, P., Panda, U., Raj, S. S., Sharma, A., Darbyshire, E., Reyes-Villegas, E., Allan, J., Chen, Y., Wang, X., Song, S., Pöhlker, M. L., Shi, L., Wang, Y., Kommula, S. M., Liu, T., Ravikrishna, R., McFiggans, G., Mickley, L. J., Martin, S. T., Pöschl, U., Andreae, M. O., and Coe, H.: Enhanced aerosol particle growth sustained by high continental chlorine emission in India, Nat. Geosci., 14, 77–84, https://doi.org/10.1038/s41561-020-00677-x, 2021.
Gupta, T. and Mandariya, A.: Sources of submicron aerosol during fog-dominated wintertime at Kanpur, Environ. Sci. Pollut. R., 20, 5615–5629, https://doi.org/10.1007/s11356-013-1580-6, 2013.
Gysel, M., Crosier, J., Topping, D. O., Whitehead, J. D., Bower, K. N., Cubison, M. J., Williams, P. I., Flynn, M. J., McFiggans, G. B., and Coe, H.: Closure study between chemical composition and hygroscopic growth of aerosol particles during TORCH2, Atmos. Chem. Phys., 7, 6131–6144, https://doi.org/10.5194/acp-7-6131-2007, 2007.
Gysel, M., McFiggans, G. B., and Coe, H.: Inversion of tandem differential mobility analyser (TDMA) measurements, J. Aerosol Sci., 40, 134–151, https://doi.org/10.1016/j.jaerosci.2008.07.013, 2009.
Habib, G.: Mandariya et al. 2024, Version v1, Zenodo [data set], https://doi.org/10.5281/zenodo.10803190, 2024.
Hallquist, M., Wenger, J. C., Baltensperger, U., Rudich, Y., Simpson, D., Claeys, M., Dommen, J., Donahue, N. M., George, C., Goldstein, A. H., Hamilton, J. F., Herrmann, H., Hoffmann, T., Linuma, Y., Jang, M., Jenkin, M. E., Jimenez, J. L., Kiendler-Scharr, A., Maenhaut, W., McFiggans, G., Mentel, T. F., Monod, A., Prìev?ot, A. S. H., Seinfeld, J. H., Surratt, J. D., Szmigielski, R., and Wildt, J.: The formation, properties and impact of secondary organic aerosol: current and emerging issues, Atmos. Chem. Phys., 9, 5155–5236, 2009.
Hong, J., Häkkinen, S. A. K., Paramonov, M., Äijälä, M., Hakala, J., Nieminen, T., Mikkilä, J., Prisle, N. L., Kulmala, M., Riipinen, I., Bilde, M., Kerminen, V.-M., and Petäjä, T.: Hygroscopicity, CCN and volatility properties of submicron atmospheric aerosol in a boreal forest environment during the summer of 2010, Atmos. Chem. Phys., 14, 4733–4748, https://doi.org/10.5194/acp-14-4733-2014, 2014.
Hong, J., Kim, J., Nieminen, T., Duplissy, J., Ehn, M., Äijälä, M., Hao, L. Q., Nie, W., Sarnela, N., Prisle, N. L., Kulmala, M., Virtanen, A., Petäjä, T., and Kerminen, V.-M.: Relating the hygroscopic properties of submicron aerosol to both gas- and particle-phase chemical composition in a boreal forest environment, Atmos. Chem. Phys., 15, 11999–12009, https://doi.org/10.5194/acp-15-11999-2015, 2015.
Hong, J., Xu, H., Tan, H., Yin, C., Hao, L., Li, F., Cai, M., Deng, X., Wang, N., Su, H., Cheng, Y., Wang, L., Petäjä, T., and Kerminen, V.-M.: Mixing state and particle hygroscopicity of organic-dominated aerosols over the Pearl River Delta region in China, Atmos. Chem. Phys., 18, 14079–14094, https://doi.org/10.5194/acp-18-14079-2018, 2018.
Hu, D., Chen, J., Ye, X., Li, L., and Yang, X.: Hygroscopicity and evaporation of ammonium chloride and ammonium nitrate: Relative humidity and size effects on the growth factor, Atmos. Environ., 45, 2349–2355, https://doi.org/10.1016/j.atmosenv.2011.02.024, 2011.
Jimenez, J. L., Canagaratna, M. R., Donahue, N. M., Prevot, A. S. H., Zhang, Q., Kroll, J. H., DeCarlo, P. F., Allan, J. D., Coe, H., Ng, N. L., Aiken, A. C., Docherty, K. S., Ulbrich, I. M., Grieshop, A. P., Robinson, A. L., Duplissy, J., Smith, J. D., Wilson, K. R., Lanz, V. A., Hueglin, C., Sun, Y. L., Tian, J., Laaksonen, A., Raatikainen, T., Rautiainen, J., Vaattovaara, P., Ehn, M., Kulmala, M., Tomlinson, J. M., Collins, D. R., Cubison, M. J., Dunlea, E. J., Huffman, J. A., Onasch, T. B., Alfarra, M. R., Williams, P. I., Bower, K., Kondo, Y., Schneider, J., Drewnick, F., Borrmann, S., Weimer, S., Demerjian, K., Salcedo, D., Cottrell, L., Griffin, R., Takami, A., Miyoshi, T., Hatakeyama, S., Shimono, A., Sun, J. Y., Zhang, Y. M., Dzepina, K., Kimmel, J. R., Sueper, D., Jayne, J. T., Herndon, S. C., Trimborn, A. M., Williams, L. R., Wood, E. C., Middlebrook, A. M., Kolb, C. E., Baltensperger, U., and Worsnop, D. R.: Evolution of organic aerosols in the atmosphere, Science, 326, 1525–1529, https://doi.org/10.1126/science.1180353, 2009.
Kawana, K., Nakayama, T., and Mochida, M.: Hygroscopicity and CCN activity of atmospheric aerosol particles and their relation to organics: Characteristics of urban aerosols in Nagoya, Japan, J. Geophys. Res.-Atmos., 121, 4100–4121, https://doi.org/10.1002/2015JD023213, 2016.
Kecorius, S., Vogl, T., Paasonen, P., Lampilahti, J., Rothenberg, D., Wex, H., Zeppenfeld, S., van Pinxteren, M., Hartmann, M., Henning, S., Gong, X., Welti, A., Kulmala, M., Stratmann, F., Herrmann, H., and Wiedensohler, A.: New particle formation and its effect on cloud condensation nuclei abundance in the summer Arctic: a case study in the Fram Strait and Barents Sea, Atmos. Chem. Phys., 19, 14339–14364, https://doi.org/10.5194/acp-19-14339-2019, 2019.
Kim, N., Park, M., Yum, S. S., Park, J. S., Song, I. H., Shin, H. J., Ahn, J. Y., Kwak, K. H., Kim, H., Bae, G. N., and Lee, G.: Hygroscopic properties of urban aerosols and their cloud condensation nuclei activities measured in Seoul during the MAPS-Seoul campaign, Atmos. Environ., 153, 217–232, https://doi.org/10.1016/j.atmosenv.2017.01.034, 2017.
Kim, N., Yum, S. S., Park, M., Park, J. S., Shin, H. J., and Ahn, J. Y.: Hygroscopicity of urban aerosols and its link to size-resolved chemical composition during spring and summer in Seoul, Korea, Atmos. Chem. Phys., 20, 11245–11262, https://doi.org/10.5194/acp-20-11245-2020, 2020.
Kitamori, Y., Mochida, M., and Kawamura, K.: Assessment of the aerosol water content in urban atmospheric particles by the hygroscopic growth measurements in Sapporo, Japan, Atmos. Environ., 43, 3416–3423, https://doi.org/10.1016/j.atmosenv.2009.03.037, 2009.
Kroll, J. H., Donahue, N. M., Jimenez, J. L., Kessler, S. H., Canagaratna, M. R., Wilson, K. R., Altieri, K. E., Mazzoleni, L. R., Wozniak, A. S., Bluhm, H., Mysak, E. R., Smith, J. D., Kolb, C. E., and Worsnop, D. R.: Carbon oxidation state as a metric for describing the chemistry of atmospheric organic aerosol, Nat. Chem., 3, 133–139, https://doi.org/10.1038/nchem.948, 2011.
Li, H., Wang, Q., Shao, M., Wang, J., Wang, C., Sun, Y., Qian, X., Wu, H., Yang, M., and Li, F.: Fractionation of airborne particulate-bound elements in haze-fog episode and associated health risks in a megacity of southeast China, Environ. Pollut., 208, 655–662, https://doi.org/10.1016/j.envpol.2015.10.042, 2016.
Liu, J., Horowitz, L. W., Fan, S., Carlton, A. G., and Levy, H.: Global in-cloud production of secondary organic aerosols: Implementation of a detailed chemical mechanism in the GFDL atmospheric model AM3, J. Geophys. Res.-Atmos., 117, D15303, https://doi.org/10.1029/2012JD017838, 2012.
Lohmann, U. and Feichter, J.: Global indirect aerosol effects: a review, Atmos. Chem. Phys., 5, 715–737, https://doi.org/10.5194/acp-5-715-2005, 2005.
Mandariya, A. K., Gupta, T., and Tripathi, S. N.: Effect of aqueous-phase processing on the formation and evolution of organic aerosol (OA) under different stages of fog life cycles, Atmos. Environ., 206, 60–71, https://doi.org/10.1016/j.atmosenv.2019.02.047, 2019.
Mandariya, A. K., Tripathi, S. N., Gupta, T., and Mishra, G.: Wintertime hygroscopic growth factors (HGFs) of accumulation mode particles and their linkage to chemical composition in a heavily polluted urban atmosphere of Kanpur at the Centre of IGP, India: Impact of ambient relative humidity, Sci. Total Environ., 704, 135363, https://doi.org/10.1016/j.scitotenv.2019.135363, 2020.
Maßling, A., Wiedensohler, A., Busch, B., Neusüß, C., Quinn, P., Bates, T., and Covert, D.: Hygroscopic properties of different aerosol types over the Atlantic and Indian Oceans, Atmos. Chem. Phys., 3, 1377–1397, https://doi.org/10.5194/acp-3-1377-2003, 2003.
Massling, A., Stock, M., and Wiedensohler, A.: Diurnal, weekly, and seasonal variation of hygroscopic properties of submicrometer urban aerosol particles, Atmos. Environ., 39, 3911–3922, https://doi.org/10.1016/j.atmosenv.2005.03.020, 2005.
Massling, A., Leinert, S., Wiedensohler, A., and Covert, D.: Hygroscopic growth of sub-micrometer and one-micrometer aerosol particles measured during ACE-Asia, Atmos. Chem. Phys., 7, 3249–3259, https://doi.org/10.5194/acp-7-3249-2007, 2007.
Massoli, P., Lambe, A. T., Ahern, A. T., Williams, L. R., Ehn, M., Mikkilä, J., Canagaratna, M. R., Brune, W. H., Onasch, T. B., Jayne, J. T., Petäjä, T., Kulmala, M., Laaksonen, A., Kolb, C. E., Davidovits, P., and Worsnop, D. R.: Relationship between aerosol oxidation level and hygroscopic properties of laboratory generated secondary organic aerosol (SOA) particles, Geophys. Res. Lett., 37, 1–5, https://doi.org/10.1029/2010GL045258, 2010.
McFiggans, G., Artaxo, P., Baltensperger, U., Coe, H., Facchini, M. C., Feingold, G., Fuzzi, S., Gysel, M., Laaksonen, A., Lohmann, U., Mentel, T. F., Murphy, D. M., O'Dowd, C. D., Snider, J. R., and Weingartner, E.: The effect of physical and chemical aerosol properties on warm cloud droplet activation, Atmos. Chem. Phys., 6, 2593–2649, https://doi.org/10.5194/acp-6-2593-2006, 2006.
McNeill, V. F.: Aqueous organic chemistry in the atmosphere: Sources and chemical processing of organic aerosols, Environ. Sci. Technol., 49, 1237–1244, https://doi.org/10.1021/es5043707, 2015.
Mei, F., Setyan, A., Zhang, Q., and Wang, J.: CCN activity of organic aerosols observed downwind of urban emissions during CARES, Atmos. Chem. Phys., 13, 12155–12169, https://doi.org/10.5194/acp-13-12155-2013, 2013.
Nelson, B. S., Bryant, D. J., Alam, M. S., Sommariva, R., Bloss, W. J., Newland, M. J., Drysdale, W. S., Vaughan, A. R., Acton, W. J. F., Hewitt, C. N., Crilley, L. R., Swift, S. J., Edwards, P. M., Lewis, A. C., Langford, B., Nemitz, E., Shivani, Gadi, R., Gurjar, B. R., Heard, D. E., Whalley, L. K., Şahin, Ü. A., Beddows, D. C. S., Hopkins, J. R., Lee, J. D., Rickard, A. R., and Hamilton, J. F.: Extreme Concentrations of Nitric Oxide Control Daytime Oxidation and Quench Nocturnal Oxidation Chemistry in Delhi during Highly Polluted Episodes, Environ. Sci. Tech. Let., 10, 520–527, https://doi.org/10.1021/acs.estlett.3c00171, 2023.
Ng, N. L., Herndon, S. C., Trimborn, A., Canagaratna, M. R., Croteau, P. L., Onasch, T. B., Sueper, D., Worsnop, D. R., Zhang, Q., Sun, Y. L., and Jayne, J. T.: An Aerosol Chemical Speciation Monitor (ACSM) for routine monitoring of the composition and mass concentrations of ambient aerosol, Aerosol Sci. Tech., 45, 780–794, https://doi.org/10.1080/02786826.2011.560211, 2011.
Ogawa, S., Setoguchi, Y., Kawana, K., Nakayama, T., Ikeda, Y., Sawada, Y., Matsumi, Y., and Mochida, M.: Hygroscopicity of aerosol particles and CCN activity of nearly hydrophobic particles in the urban atmosphere over Japan during summer, J. Geophys. Res., 121, 7215–7234, https://doi.org/10.1002/2015JD024636, 2016.
Patel, K., Bhandari, S., Gani, S., Campmier, M. J., Kumar, P., Habib, G., Apte, J., and Ruiz, L. H.: Sources and Dynamics of Submicron Aerosol during the Autumn Onset of the Air Pollution Season in Delhi, India, ACS Earth Space Chem., 5, 118–128, https://doi.org/10.1021/acsearthspacechem.0c00340, 2021.
Pfeifer, S., Birmili, W., Schladitz, A., Müller, T., Nowak, A., and Wiedensohler, A.: A fast and easy-to-implement inversion algorithm for mobility particle size spectrometers considering particle number size distribution information outside of the detection range, Atmos. Meas. Tech., 7, 95–105, https://doi.org/10.5194/amt-7-95-2014, 2014.
Petit, J. E., Favez, O., Albinet, A., and Canonaco, F.: A user-friendly tool for comprehensive evaluation of the geographical origins of atmospheric pollution: Wind and trajectory analyses, Environ. Modell. Softw., 88, 183–187, https://doi.org/10.1016/j.envsoft.2016.11.022, 2017.
Petters, M. D. and Kreidenweis, S. M.: A single parameter representation of hygroscopic growth and cloud condensation nucleus activity, Atmos. Chem. Phys., 7, 1961–1971, https://doi.org/10.5194/acp-7-1961-2007, 2007.
Prakash, J., Lohia, T., Mandariya, A. K., Habib, G., Gupta, T., and Gupta, S. K.: Chemical characterization and quantitativ e assessment of source-specific health risk of trace metals in PM1.0 at a road site of Delhi, India, Environ. Sci. Pollut. R., 25, 8747–8764, https://doi.org/10.1007/s11356-017-1174-9, 2018.
Pringle, K. J., Tost, H., Pozzer, A., Pöschl, U., and Lelieveld, J.: Global distribution of the effective aerosol hygroscopicity parameter for CCN activation, Atmos. Chem. Phys., 10, 5241–5255, https://doi.org/10.5194/acp-10-5241-2010, 2010.
Rai, P., Furger, M., El Haddad, I., Kumar, V., Wang, L., Singh, A., Dixit, K., Bhattu, D., Petit, J.-E., Ganguly, D., Rastogi, N., Baltensperger, U., Tripathi, S. N., Slowik, J. G., and Prévôt, A. S. H.: Real-time measurement and source apportionment of elements in Delhi's atmosphere, Sci. Total Environ., 742, 140332, https://doi.org/10.1016/j.scitotenv.2020.140332, 2020.
Richard, A., Gianini, M. F. D., Mohr, C., Furger, M., Bukowiecki, N., Minguillón, M. C., Lienemann, P., Flechsig, U., Appel, K., DeCarlo, P. F., Heringa, M. F., Chirico, R., Baltensperger, U., and Prévôt, A. S. H.: Source apportionment of size and time resolved trace elements and organic aerosols from an urban courtyard site in Switzerland, Atmos. Chem. Phys., 11, 8945–8963, https://doi.org/10.5194/acp-11-8945-2011, 2011.
Seinfeld, J. H. and Pandis, S. N.: Atmospheric cemistry and physics: From air pollution to climate change, 2nd edn., John Wiley & Sons, Inc., ISBN-10: 0-471-72018-6, 2006.
Shukla, A. K., Lalchandani, V., Bhattu, D., Dave, J. S., Rai, P., Thamban, N. M., Mishra, S., Gaddamidi, S., Tripathi, N., Vats, P., Rastogi, N., Sahu, L., Ganguly, D., Kumar, M., Singh, V., Gargava, P., and Tripathi, S. N.: Real-time quantification and source apportionment of fine particulate matter including organics and elements in Delhi during summertime, Atmos. Environ., 261, 118598, https://doi.org/10.1016/J.ATMOSENV.2021.118598, 2021.
Sjogren, S., Gysel, M., Weingartner, E., Baltensperger, U., Cubison, M. J., and Coe, H.: Hygroscopic growth and water uptake kinetics of two-phase aerosol particles consisting of ammonium sulfate, adipic and humic acid mixtures, J. Aerosol Sci., 38, 157–171, https://doi.org/10.1016/j.jaerosci.2006.11.005, 2007.
Sjogren, S., Gysel, M., Weingartner, E., Alfarra, M. R., Duplissy, J., Cozic, J., Crosier, J., Coe, H., and Baltensperger, U.: Hygroscopicity of the submicrometer aerosol at the high-alpine site Jungfraujoch, 3580 m a.s.l., Switzerland, Atmos. Chem. Phys., 8, 5715–5729, https://doi.org/10.5194/acp-8-5715-2008, 2008.
Stokes, R. H. and Robinson, R. A.: Interactions in Aqueous Nonelectrolyte Solutions. I. Solute-Solvent Equilibria, J. Phys. Chem., 70, 2126–2131, https://doi.org/10.1021/j100879a010, 1966.
Su, H., Rose, D., Cheng, Y. F., Gunthe, S. S., Massling, A., Stock, M., Wiedensohler, A., Andreae, M. O., and Pöschl, U.: Hygroscopicity distribution concept for measurement data analysis and modeling of aerosol particle mixing state with regard to hygroscopic growth and CCN activation, Atmos. Chem. Phys., 10, 7489–7503, https://doi.org/10.5194/acp-10-7489-2010, 2010.
Sun, Y., Wang, Z., Fu, P., Jiang, Q., Yang, T., Li, J., and Ge, X.: The impact of relative humidity on aerosol composition and evolution processes during wintertime in Beijing, China, Atmos. Environ., 77, 927–934, https://doi.org/10.1016/j.atmosenv.2013.06.019, 2013.
Sun, Y., Du, W., Fu, P., Wang, Q., Li, J., Ge, X., Zhang, Q., Zhu, C., Ren, L., Xu, W., Zhao, J., Han, T., Worsnop, D. R., and Wang, Z.: Primary and secondary aerosols in Beijing in winter: sources, variations and processes, Atmos. Chem. Phys., 16, 8309–8329, https://doi.org/10.5194/acp-16-8309-2016, 2016.
Swietlicki, E., Hansson, H. C., Hämeri, K., Svenningsson, B., Massling, A., Mcfiggans, G., Mcmurry, P. H., Petäjä, T., Tunved, P., Gysel, M., Topping, D., Weingartner, E., Baltensperger, U., Rissler, J., Wiedensohler, A., and Kulmala, M.: Hygroscopic properties of submicrometer atmospheric aerosol particles measured with H-TDMA instruments in various environments – a review, Tellus B, 60, 432–469, https://doi.org/10.1111/j.1600-0889.2008.00350.x, 2008.
Tang, I. N. and Munkelwitz, H. R.: Water activities, densities, and refractive indices of aqueous sulfates and sodium nitrate droplets of atmospheric importance, J. Geophys. Res., 99, 18801, https://doi.org/10.1029/94JD01345, 1994.
Tobler, A., Bhattu, D., Canonaco, F., Lalchandani, V., Shukla, A., Thamban, N. M., Mishra, S., Srivastava, A. K., Bisht, D. S., Tiwari, S., Singh, S., Moènik, G., Baltensperger, U., Tripathi, S. N., Slowik, J. G., and Prévôt, A. S. H.: Chemical characterization of PM2.5 and source apportionment of organic aerosol in New Delhi, India, Sci. Total Environ., 745, 140924, https://doi.org/10.1016/J.SCITOTENV.2020.140924, 2020.
Topping, D. O. and McFiggans, G.: Tight coupling of particle size, number and composition in atmospheric cloud droplet activation, Atmos. Chem. Phys., 12, 3253–3260, https://doi.org/10.5194/acp-12-3253-2012, 2012.
Tritscher, T., Jurnyi, Z., Martin, M., Chirico, R., Gysel, M., Heringa, M. F., Decarlo, P. F., Sierau, B., Prévt, A. S. H., Weingartner, E., and Baltensperger, U.: Changes of hygroscopicity and morphology during ageing of diesel soot, Environ. Res. Lett., 6, 034026, https://doi.org/10.1088/1748-9326/6/3/034026, 2011.
Wang, X., Shen, X. J., Sun, J. Y., Zhang, X. Y., Wang, Y. Q., Zhang, Y. M., Wang, P., Xia, C., Qi, X. F., and Zhong, J. T.: Size-resolved hygroscopic behavior of atmospheric aerosols during heavy aerosol pollution episodes in Beijing in December 2016, Atmos. Environ., 194, 188–197, https://doi.org/10.1016/j.atmosenv.2018.09.041, 2018.
Wang, Y., Wu, Z., Ma, N., Wu, Y., Zeng, L., Zhao, C., and Wiedensohler, A.: Statistical analysis and parameterization of the hygroscopic growth of the sub-micrometer urban background aerosol in Beijing, Atmos. Environ., 175, 184–191, https://doi.org/10.1016/j.atmosenv.2017.12.003, 2018.
Wester, P., Mishra, A., Mukherji, A., Shrestha, A. B., and Change, C.: The Hindu Kush Himalaya Assessment, edited by: Wester, P., Mishra, A., Mukherji, A., and Shrestha, A. B., Springer International Publishing, Cham, https://doi.org/10.1007/978-3-319-92288-1, ISBN 978-3-319-92288-1, 2019.
Wiedensohler, A.: An approximation of the bipolar charge distribution for particles in the submicron size range, J. Aerosol Sci., 19, 387–389, https://doi.org/10.1016/0021-8502(88)90278-9, 1988.
Wiedensohler, A., Birmili, W., Nowak, A., Sonntag, A., Weinhold, K., Merkel, M., Wehner, B., Tuch, T., Pfeifer, S., Fiebig, M., Fjäraa, A. M., Asmi, E., Sellegri, K., Depuy, R., Venzac, H., Villani, P., Laj, P., Aalto, P., Ogren, J. A., Swietlicki, E., Williams, P., Roldin, P., Quincey, P., Hüglin, C., Fierz-Schmidhauser, R., Gysel, M., Weingartner, E., Riccobono, F., Santos, S., Grüning, C., Faloon, K., Beddows, D., Harrison, R., Monahan, C., Jennings, S. G., O'Dowd, C. D., Marinoni, A., Horn, H.-G., Keck, L., Jiang, J., Scheckman, J., McMurry, P. H., Deng, Z., Zhao, C. S., Moerman, M., Henzing, B., de Leeuw, G., Löschau, G., and Bastian, S.: Mobility particle size spectrometers: harmonization of technical standards and data structure to facilitate high quality long-term observations of atmospheric particle number size distributions, Atmos. Meas. Tech., 5, 657–685, https://doi.org/10.5194/amt-5-657-2012, 2012.
Wiedensohler, A., Wiesner, A., Weinhold, K., Birmili, W., Hermann, M., Merkel, M., Müller, T., Pfeifer, S., Schmidt, A., Tuch, T., Velarde, F., Quincey, P., Seeger, S. and Nowak, A.: Mobility Particle Size Spectrometers: Calibration Procedures and Measurement Uncertainties, Aerosol Sci. Tech., 52, 146–164, https://doi.org/10.1080/02786826.2017.1387229, 2018.
Wu, Z. J., Poulain, L., Henning, S., Dieckmann, K., Birmili, W., Merkel, M., van Pinxteren, D., Spindler, G., Müller, K., Stratmann, F., Herrmann, H., and Wiedensohler, A.: Relating particle hygroscopicity and CCN activity to chemical composition during the HCCT-2010 field campaign, Atmos. Chem. Phys., 13, 7983–7996, https://doi.org/10.5194/acp-13-7983-2013, 2013.
Wu, Z. J., Zheng, J., Shang, D. J., Du, Z. F., Wu, Y. S., Zeng, L. M., Wiedensohler, A., and Hu, M.: Particle hygroscopicity and its link to chemical composition in the urban atmosphere of Beijing, China, during summertime, Atmos. Chem. Phys., 16, 1123–1138, https://doi.org/10.5194/acp-16-1123-2016, 2016.
Yeung, M. C., Lee, B. P., Li, Y. J., and Chan, C. K.: Simultaneous HTDMA and HR-ToF-AMS measurements at the HKUST supersite in Hong Kong in 2011, J. Geophys. Res., 119, 9864–9883, https://doi.org/10.1002/2013JD021146, 2014.
Zhang, Q., Jimenez, J. L., Worsnop, D. R., and Canagaratna, M.: A Case Study of Urban Particle Acidity and Its Influence on Secondary Organic Aerosol, Environ. Sci. Technol., 41, 3213–3219, https://doi.org/10.1021/es061812j, 2007.
Zhang, S. L., Ma, N., Kecorius, S., Wang, P. C., Hu, M., Wang, Z. B., Größ, J., Wu, Z. J., and Wiedensohler, A.: Mixing state of atmospheric particles over the North China Plain, Atmos. Environ., 125, 152–164, https://doi.org/10.1016/J.ATMOSENV.2015.10.053, 2016.
Zhao, P., Du, X., Su, J., Ding, J., and Dong, Q.: Aerosol hygroscopicity based on size-resolved chemical compositions in Beijing, Sci. Total Environ., 716, 137074, https://doi.org/10.1016/J.SCITOTENV.2020.137074, 2020.