the Creative Commons Attribution 4.0 License.
the Creative Commons Attribution 4.0 License.
 | 22 Mar 2024
Quantifying the tropospheric ozone radiative effect and its temporal evolution in the satellite era
Richard J. Pope
Alexandru Rap
Matilda A. Pimlott
Brice Barret
Eric Le Flochmoen
Brian J. Kerridge
Richard Siddans
Barry G. Latter
Lucy J. Ventress
Anne Boynard
Christian Retscher
Wuhu Feng
Richard Rigby
Sandip S. Dhomse
Catherine Wespes
Martyn P. Chipperfield
Using state-of-the-art satellite ozone profile products, and a chemical transport model, we provide an updated estimate of the tropospheric ozone radiative effect (TO3RE) and observational constraint on its variability over the decade 2008–2017. Previous studies have shown the short-term (i.e. a few years) globally weighted average TO3RE to be 1.17 ± 0.03 W m−2. However, from our analysis, using decadal (2008–2017) ozone profile datasets from the Infrared Atmospheric Sounding Interferometer, average TO3RE ranges between 1.21 and 1.26 W m−2. Over this decade, the modelled and observational TO3RE linear trends show a negligible change (e.g. ± 0.1 % yr−1). Two model sensitivity experiments fixing emissions and meteorology to 1 year (i.e. start year – 2008) show that temporal changes in ozone precursor emissions (increasing contribution) and meteorological factors (decreasing contribution) have counteracting tendencies, leading to a negligible globally weighted average TO3RE trend.
- Article
(4526 KB) - Full-text XML
-
Supplement
(1174 KB) - BibTeX
- EndNote


Tropospheric ozone (TO3) is a short-lived climate forcer (SLCF; Forster et al., 2021; Szopa et al., 2021). It is the third-most-important greenhouse gas (GHG; Forster et al., 2021; Myhre et al., 2013) and a hazardous air pollutant with adverse impacts on human health (WHO, 2018; Fleming et al., 2018) and the biosphere (e.g. agricultural and natural vegetation; Mills et al., 2018; Sitch et al., 2007). Since the pre-industrial (PI) period, anthropogenic activities have increased the atmospheric loading of ozone (O3) precursor gases, most notably nitrogen oxides (NOx) and methane (CH4), resulting in an increase in TO3 of 25 %–50 % since 1900 (Gauss et al., 2006; Lamarque et al., 2010; Szopa et al., 2021; Young et al., 2013). More recently, since the mid-twentieth century, northern hemispheric TO3 has increased by 30 %–70 %. The PI to present-day (PD) radiative forcing (RF) from TO3 is estimated by the Intergovernmental Panel on Climate Change (IPCC) to be 0.47 W m−2 (Forster et al., 2021) with an uncertainty range of 0.24–0.70 W m−2. While models provide a valuable framework to quantify the TO3RF, observations are required to validate the models' representation of TO3 and TO3RF. Observations are not available for the PI, but multiple satellite products of TO3 are readily available in the PD (e.g. Richards et al., 2008; Boynard et al., 2018; Barret et al., 2020). The tropospheric ozone radiative effect (TO3RE) is defined as the radiative flux imbalance at the tropopause between the incoming short-wave solar radiation and the outgoing long-wave radiation due to the presence of TO3 (Rap et al., 2015). Therefore, satellite ozone profile datasets from infrared instruments, in combination with offline ozone radiative kernels (e.g. Bowman et al., 2013; Rap et al., 2015), can be used to quantify the PD TO3RE. This can then either constrain model estimates of PD TO3RE or be used directly with modelled PI TO3RE to derive the TO3RF.
Several studies have previously used satellite data to derive short-term estimates of the TO3RE (i.e. from a few months of data). Joiner et al. (2009) used tropospheric column ozone (TCO3) data based on two satellite instruments, Ozone Monitoring Instrument (OMI) and Microwave Limb Sounder (MLS) measurements, also known as the OMI-MLS product, for January and July 2005, to estimate the resultant instantaneous TO3RE at the tropopause to be 1.53 W m−2. Worden et al. (2008) used ozone profile data for 2006 from the Tropospheric Emissions Spectrometer (TES), on board NASA's Aura satellite, to estimate the average instantaneous long-wave TO3RE at the top of the atmosphere (TOA) over the oceans (45° S–45° N) to be 0.48 ± 0.14 W m−2. Worden et al. (2011), using TES data for August 2006, estimated the instantaneous long-wave TO3RE at TOA to be 0.33 W m−2. Later, Bowman et al. (2013) also used TES data (averaged between 2005 and 2009) to constrain the simulated instantaneous long-wave TO3RE from an ensemble model average. They found that seasonally, TES long-wave TO3RE peaks in northern Africa, the Mediterranean, and the Middle East in June–July–August over 1.0 W m−2, with minimum values (0.0–0.2 W m−2) over the wintertime high latitudes. Overall, the ensemble average long-wave TO3RE low bias was 0.12 W m−2. Doniki et al. (2015) took this further by calculating the instantaneous long-wave TO3RE from the Infrared Atmospheric Sounding Interferometer (IASI), though using a small subset of the data, and found estimates from Worden et al. (2008), using TES, had a low bias of ∼25 %. Rap et al. (2015) also used TES satellite ozone profile observations (2005–2008) in combination with the TOMCAT chemical transport model (CTM) and provided the first robust satellite constraint on annual globally weighted resultant TO3RE (after stratospheric temperature adjustment), with a range of 1.17 ± 0.03 W m−2.
Following the methodology adopted in Rap et al. (2015), we exploit satellite ozone profile data from IASI, on the MetOp-A satellite, which has a longer-term record and considerably denser spatial coverage than TES, in combination with the TOMCAT CTM, to improve the TO3RE estimate and provide the first quantification of its decadal variability. The satellite data, radiation model, and CTM used are discussed in Sect. 2; our results are presented in Sect. 3; and Sect. 4 summarizes our conclusions.
2.1 Satellite observations
IASI is a Michelson interferometer with a nadir-viewing spectral range between 645 and 2760 cm−1 with spectral sampling of 0.25 cm−1 (Illingworth et al., 2011). It measures simultaneously in four fields of view (FOV; each circular at nadir with a diameter of 12 km) in a 50 × 50 km square which are scanned across track to sample a 2200 km wide swath (Clerbaux et al., 2009). IASI, on EUMETSAT's MetOp-A satellite, is in a sun-synchronous polar orbit with Equator crossing local times of 09.30 and 21.30. However, we only use IASI daytime data in this study.
The three IASI products we use in this study are the IASI-FORLI product (vn 20151001, IASI-FORLI, 2020; Boynard et al., 2018; Wespes et al., 2018), the IASI-SOFRID product (vn 3.5, IASI-SOFRID, 2022; Barret et al., 2020), and the RAL IASI-IMS product (IASI-IMS, 2022; Pope et al., 2021; Pimlott et al., 2022) between 2008 and 2017 (i.e. period of consistent data coverage for all the IASI products). All three products use an optimal estimation method (OEM, Rogers, 2000) to retrieve ozone. Both IASI-SOFRID and IASI-IMS use the RTTOV radiative transfer model (Saunders et al., 1999), while the IASI-FORLI product uses look-up tables to speed up its radiative transfer calculations (Hurtmans et al., 2012). Meteorological inputs (pressure, water vapour, temperature, and clouds) for IASI-FORLI come from EUMETSAT level-2 data, while IASI-SOFRID uses ECMWF operational analyses, and IASI-IMS uses ECMWF surface pressures and co-retrieves other meteorological and surface variables. For the ozone a priori profile, IASI-FORLI and IASI-IMS use the ozone climatology of McPeters et al. (2007), while IASI-SOFRID uses the dynamical ozone climatology described in Sofieva et al. (2014).
The IASI-FORLI level-2 data are filtered for a geometric cloud fraction <0.13, degrees of freedom >2.0, O3 values >0.0, solar zenith angle <80.0°, and the surface to 450 hPa sub-column O3/total column O3 <0.085. The IASI-SOFRID data were provided on a 1.0°×1.0° horizontal grid (i.e. level-3 product but daily temporal resolution) with filtering already applied as in Barret et al. (2020). Here, only O3 values >0.0 were used. For IASI-IMS level-2, the data are filtered for a geometric cloud fraction <0.5, O3 values >0.0, solar zenith angle <80.0°, and a cost function <1000.0. For IASI-IMS, we relaxed the geometric cloud fraction threshold to 0.5 as it retains more data as the data product in this study has only been processed for 1 in 10 d and 1 in 4 pixels.
Overall, IASI provides substantially denser spatial sampling and a longer-term record than its predecessor instruments. For instance, TES provided homogenous global coverage, albeit with sparse spatial sampling, every 16 d (Rap et al., 2013), over a 6-year period (2005–2010), while IASI on MetOp-A provided comparatively dense global coverage twice per day between 2008 and 2020 (though we focus on 2008–20217 where the IASI products have consistent records). Thus, making it suitable to investigate decadal average spatial patterns in TO3RE and decadal-scale interannual variability.
2.2 Ozonesondes
Despite the three IASI ozone profile products using the same radiance data, the three retrieval schemes produced systematic differences between the products in the long-term TCO3 average (e.g. Sect. S1 and Figs. S2 and S3 from the Supplement). However, the spatial structure in the three products compares well. Therefore, to harmonize the three IASI TCO3 datasets (i.e. absolute values but not long-term variability) we use ozonesonde data from the World Ozone and Ultraviolet Radiation Data Centre (WOUDC; WOUDC, 2023), the Southern Hemisphere ADditional OZonesondes (SHADOZ; SHADOZ, 2023) project and the Global Monitoring Laboratory, National Oceanic and Atmospheric Administration (NOAA; NOAA, 2023). Here, O3 measurements were rejected if the O3 or pressure values were unphysical (i.e. <0.0), if the O3 partial pressure >2000.0 mPa, or if the O3 value was set to 99.9, and whole ozonesonde profiles were rejected if least 50 % of the measurements did not meet these criteria. These criteria are similar to those applied by Keppins et al. (2018) and Hubert et al. (2016). To allow for direct like-for-like comparisons between the two quantities, accounting for the vertical sensitivity of the satellite, the instrument averaging kernels (AKs) are applied to the ozonesonde profiles as
where sondeAK is the modified ozonesonde sub-column profile, AK is the averaging kernel matrix, sondeint is the ozonesonde sub-column profile interpolated on the satellite pressure grid, and apr is the a priori profile for the satellite retrieval. For the application of the AKs to the ozonesonde profiles, the full ozone profile is required which is not available from the ozonesondes (i.e. mid-stratosphere and above). Therefore, the ozonesonde profile above its minimum pressure level is extended using the a priori profile from the corresponding satellite product. The profile is smoothed vertically across the joining pressure level to avoid a profile discontinuity.
Once the ozonesondes had been co-located with the satellite data (i.e. within 6 h and 500 km) and the AKs applied, the two datasets were compared across the full 2008–2017 period. We typically find a global annual TCO3 systematic bias of 14.9 %, 2.7 %, and 17.4 % for IASI-FORLI, IASI-SOFRID, and IASI-IMS, respectively, which is consistent with Boynard et al. (2018), Barret et al. (2020), and Pimlott et al. (2022). Here, we generated annual-latitude (30° bins) bias correction factors (BCFs) which were applied to the gridded satellite records (see Fig. S2) to harmonize the retrieved TCO3 (i.e. remove the systematic errors) and scale the derived TO3RE. This is an important exercise as it provides a more accurate absolute range in satellite-retrieved TCO3 (and the ozone values used to derive the TO3RE) but as the ozonesondes generally have poor spatial coverage, the global coverage and spatial distribution of the satellite data are critical in our analysis. Note that as a climatology was used, the systematic biases in the satellite records were affected, but their long-term temporal variability remained.
2.3 TOMCAT
In this study, we use the 3D global chemical transport model TOMCAT (Chipperfield, 2006), which has a detailed tropospheric chemistry scheme including 229 gas-phase reactions and 82 advected tracers (Monks et al., 2017). Model heterogeneous chemistry uses size-resolved aerosol from the GLOMAP module (Mann et al., 2010). The model was run between 2008 and 2017 at a 2.8°×2.8° spatial resolution with 31 vertical levels between the surface and 10 hPa. Here, climatological fields of trace gases/aerosols are used as the vertical boundary conditions (including stratospheric ozone). The model is forced by meteorological reanalyses (ERA-Interim) from the European Centre for Medium-Range Weather Forecasts (ECMWF; Dee et al., 2011) including reanalysis cloud fields and mass fluxes (e.g. as in Rowlinson et al., 2020; Pimlott et al., 2022). Annually varying anthropogenic emissions come from the Coupled Model Intercomparison Project Phase 6 (CMIP6; Feng et al., 2020). Climatological biogenic emissions are from the Chemistry-Climate Model Initiative (CCMI; Morgenstern et al., 2017), but isoprene and monoterpene emissions vary annually from the Joint UK Land Environment Simulator (JULES; Pacifico et al., 2011) within the free-running UK Earth System Model (UKESM; Sellar et al., 2019) from a CMIP6 historical setup. Other natural emissions come from the Precursors of Ozone and their Effects in the Troposphere (POET; Olivier et al., 2003) and biomass burning emissions from the Global Fire Emissions Database (GFED) version 4 (van der Werf et al., 2017). For methane (CH4), the model tracer is scaled to the annually varying global averaged surface CH4 value from NOAA (Dlugokencky, 2020). The model was spun up for 1 year (2007), and the model tracers were output daily at 09:30 local time (LT) globally to match the MetOp-A daytime overpass time. When comparing with IASI, the satellite AKs are applied to the TOMCAT vertical ozone profiles in the same way as the ozonesondes (i.e. Eq. 1). Here, the TOMCAT ozone profile (already temporally co-located) is co-located from the model grid box the retrieval sits in. To investigate the importance of emissions and meteorology on TO3 and TO3RE, two sensitivity experiments were run between 2008 and 2017 using repeating emissions and meteorology for 2008 (i.e. start of the time series) annually in the model simulation over the time period.
2.4 Radiative transfer model and kernel
The TO3RE was calculated using a radiative kernel, derived from the SOCRATES offline radiative transfer model (Edwards and Slingo, 1996), in combination with TOMCAT and the three IASI ozone products. SOCRATES has six bands in the short wave and nine in the long wave. Meteorological inputs (temperature, water vapour, surface albedo) into SOCRATES to derive the radiative kernel are based on climatological ECMWF ERA-Interim reanalysis. Cloud fields are based on 2000 data from International Satellite Cloud Climatology Project data (Rossow and Schiffer, 1999), while aerosols have been ignored. To account for stratospheric temperature adjustments, Rap et al. (2015) used the dynamical heating approximation (Fels et al., 1980). This involved accounting for changes in the stratospheric heating rate determined from the model due to the O3 perturbation, which were applied to the temperature field, with the model run iteratively until stratospheric temperatures reached equilibrium (Rap et al., 2015). This approach of using the SOCRATES offline radiative kernel with output from model simulations to derive the TO3 radiative effect has been used in several studies, for example, Rap et al. (2015), Scott et al. (2018), Iglesias-Suarez et al. (2018), and Rowlinson et al. (2020).
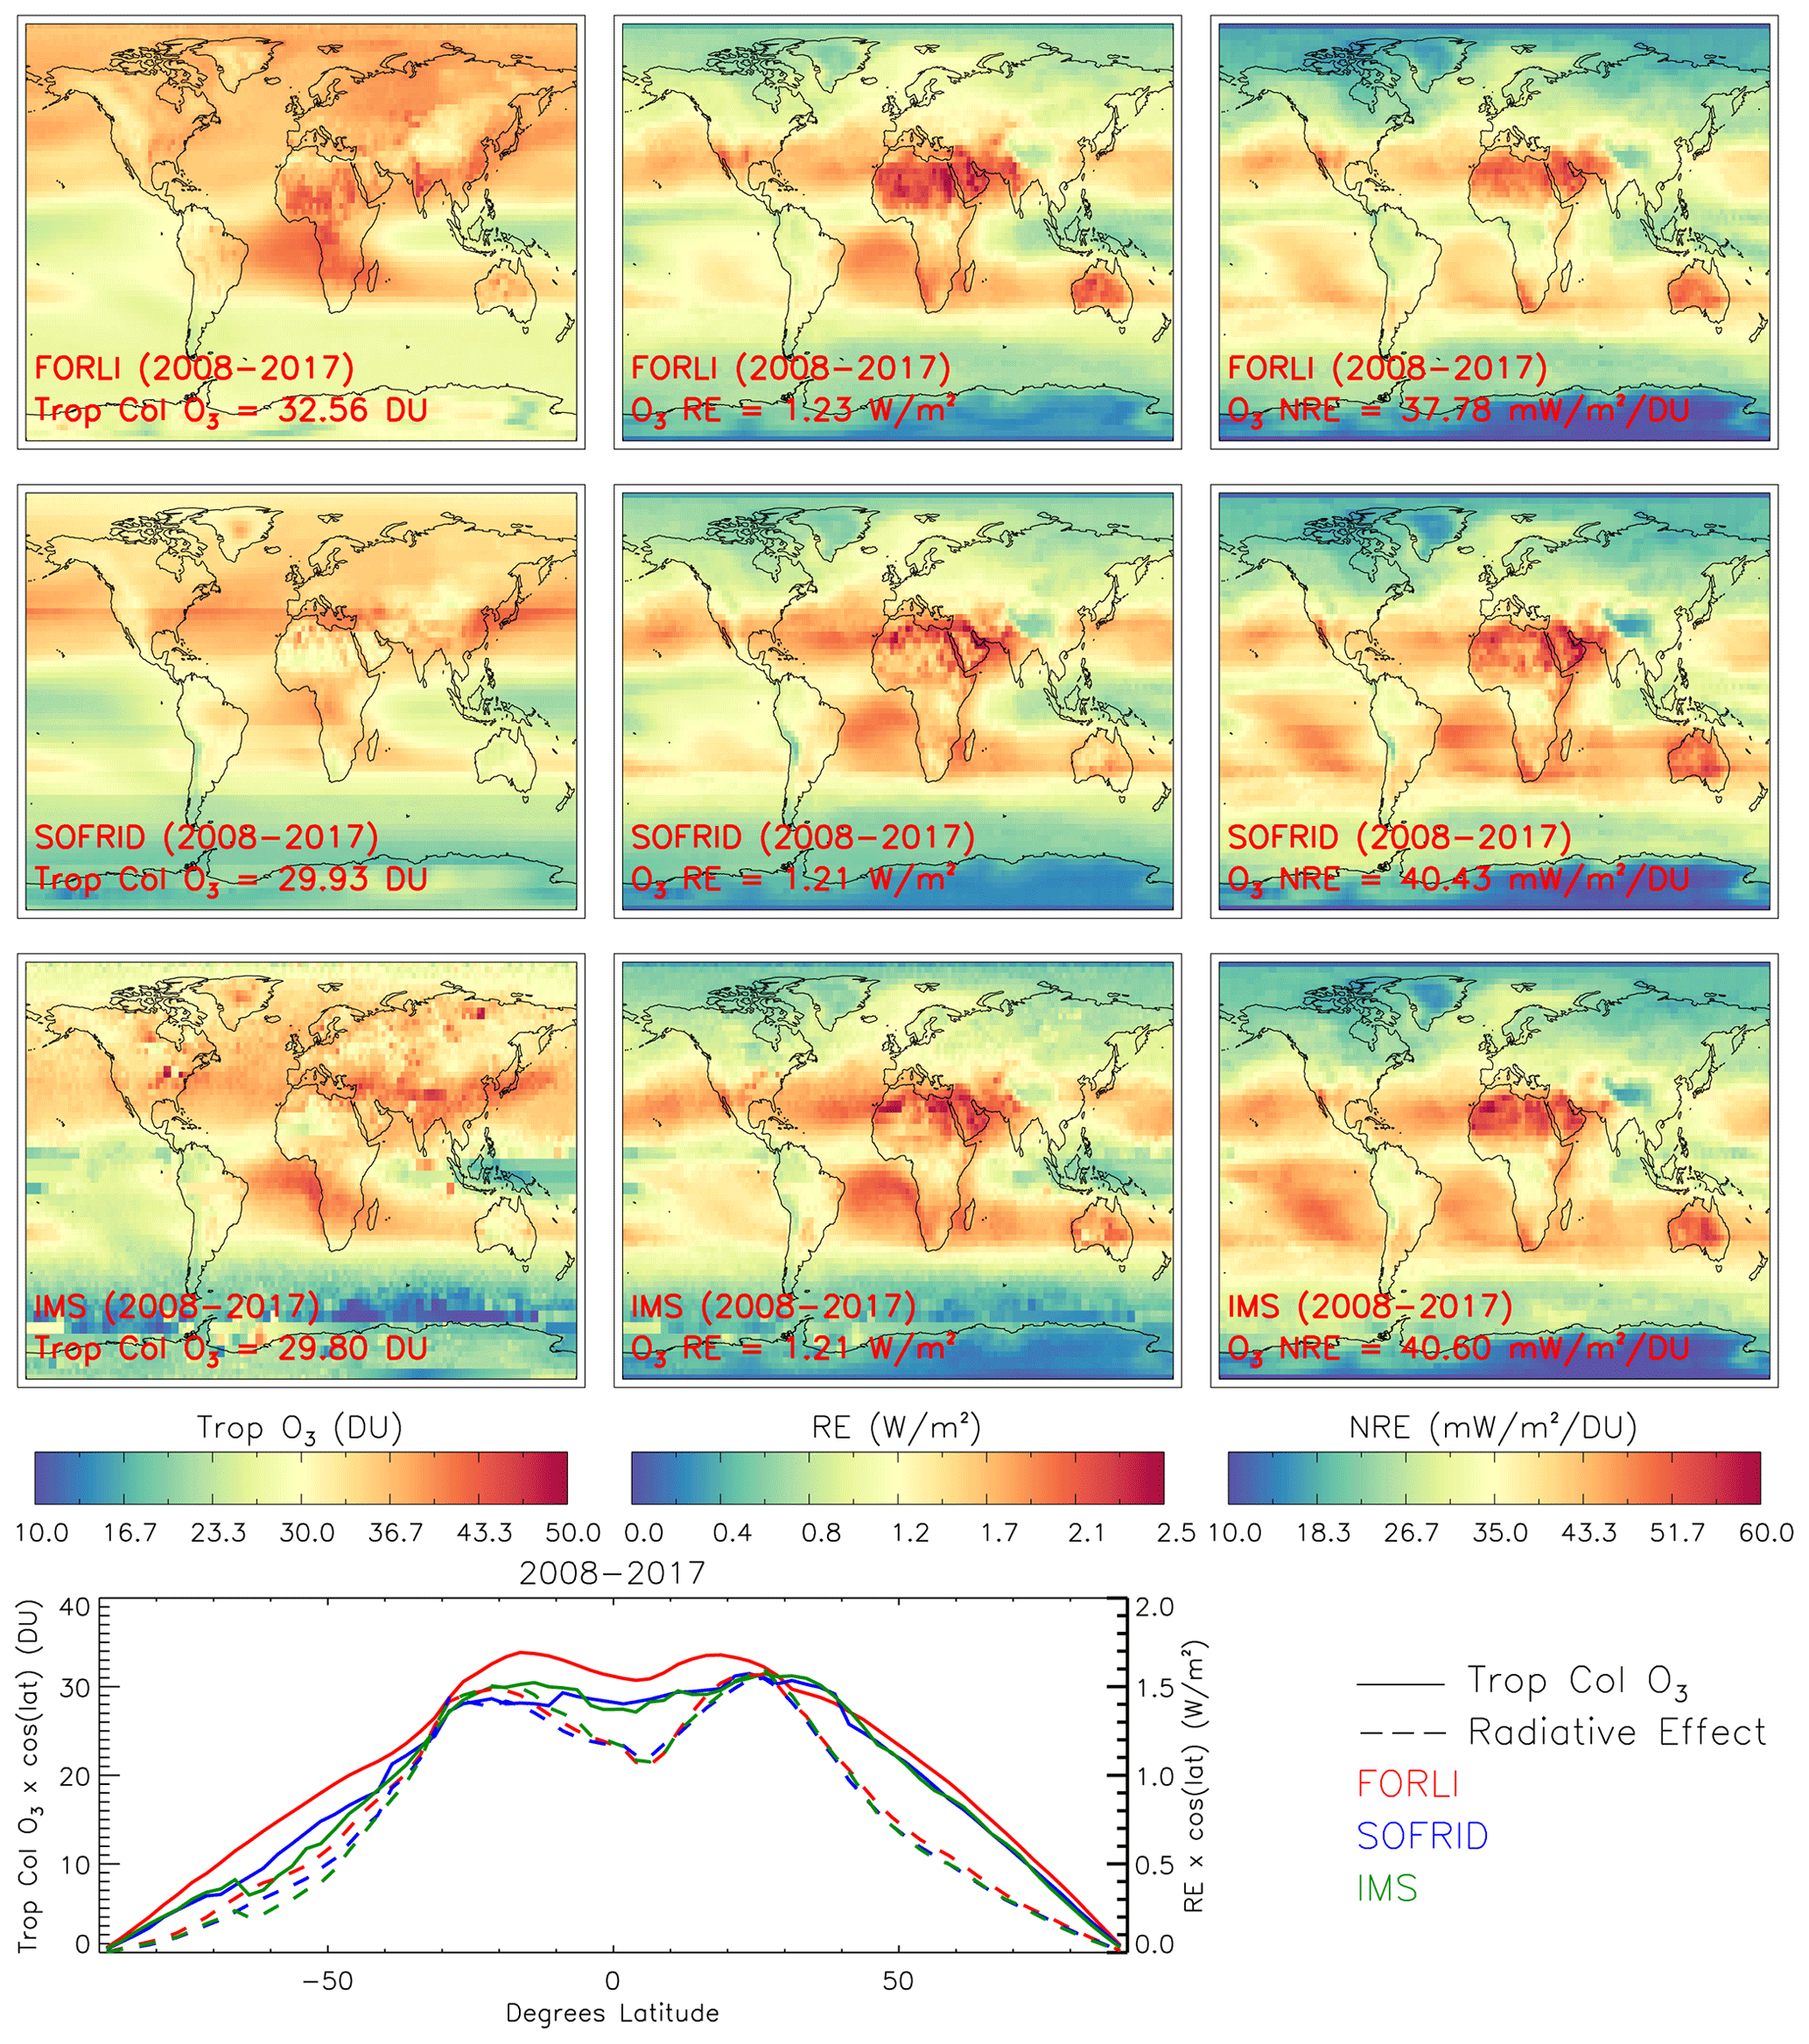
Figure 1Tropospheric column O3 (TCO3; DU), tropospheric O3 radiative effect (TO3RE, W m−2), and normalized TO3RE (NTO3RE; mW m−2 DU−1) averaged for 2008 to 2017 for IASI-FORLI (top row), IASI-SOFRID (middle row), and IASI-IMS (bottom row). Zonal averages of TCO3 (DU; solid lines) and TO3RE (W m−2; dashed lines), both weighted by cosine of latitude, are shown in the bottom panel from all the IASI instruments.
To derive the satellite TO3RE, the annual average IASI 3D ozone field is multiplied by the offline radiative kernel (grid box by grid box) and then summed from the surface to the tropopause pressure. Here, the IASI ozone data are mapped onto the spatial resolution of the radiative kernel and then interpolated vertically onto its pressure grid. The equation for each grid box is
where TO3RE is the tropospheric ozone radiative effect (W m−2), RK is the radiative kernel (W m−2/ppbv/100 hPa), O3 is the satellite ozone grid box value (ppbv), dp is the pressure difference between vertical levels (hPa), and i is the grid box index between the surface pressure level and the tropopause pressure. The tropopause pressure is based on the World Meteorological Organization (WMO) definition of “the lowest level at which the temperature lapse rate decreases to 2 K km−1 or less” (WMO, 1957).
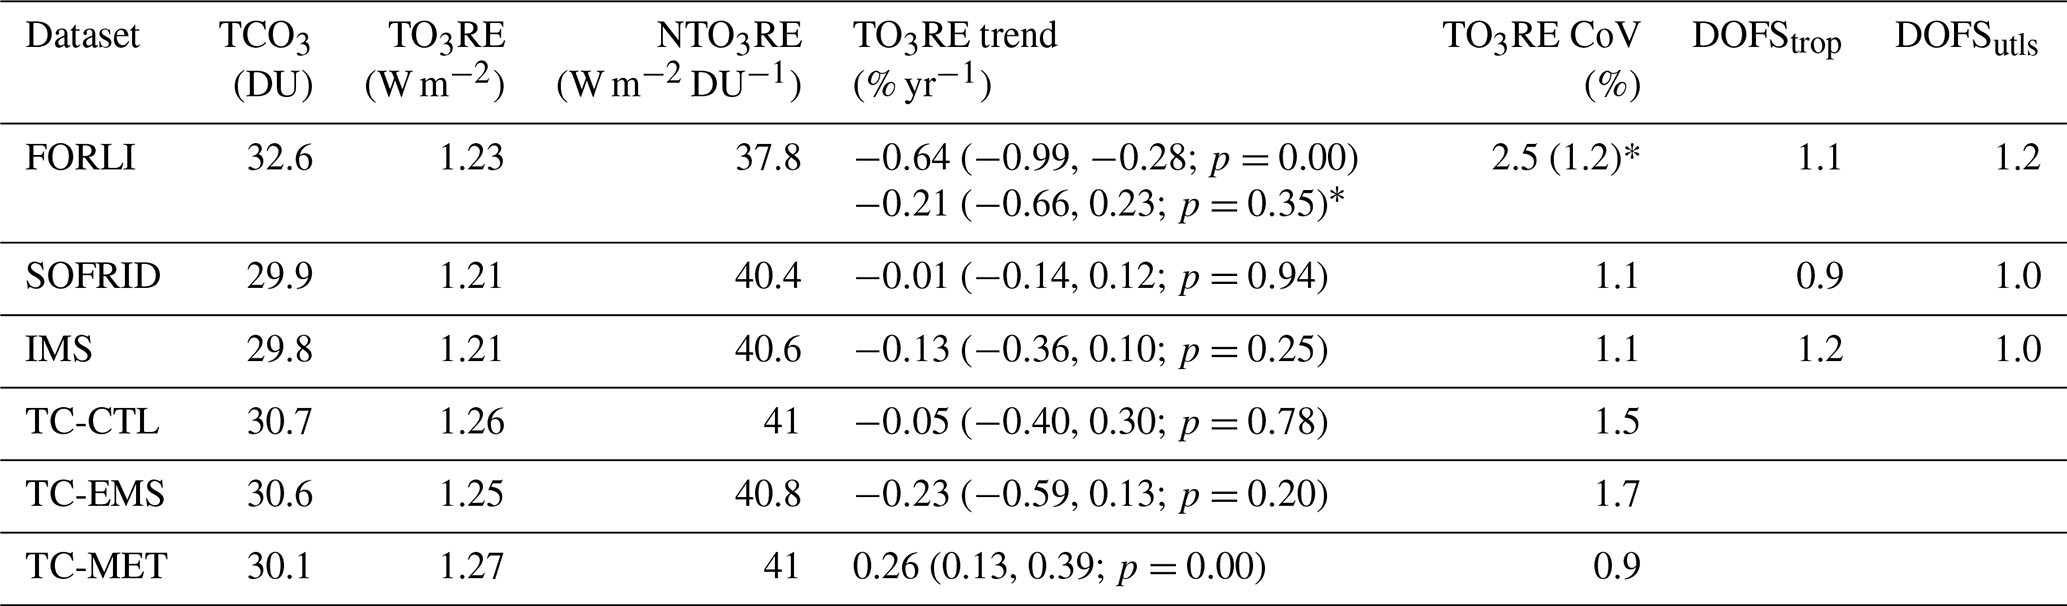
Table 1Summary statistics of the satellite and TOMCAT TCO3, TO3RE, and NTO3RE global average (2008–2017) metrics and the corresponding linear trends and coefficient of variation (CoV) from Figs. 1, 2, and 3. TC-CTL, TC-EMS, and TC-MET represent the control, fixed-emissions, and fixed-meteorology runs, respectively. The global average (2008) degrees of freedom of signal (DOFS) for the IASI products are shown for the troposphere (approximately the surface to 200 hPa) and the upper troposphere–lower stratosphere (UTLS; approximately 400–100 hPa). ∗ represents the IASI-FORLI trends for 2011–2017.
3.1 Tropospheric ozone radiative effect
Figure 1 shows the IASI-derived TCO3, TO3RE, and normalized TO3RE (NTO3RE; i.e. the TO3RE divided by its TCO3 as in Rap et al. (2015)). For the TCO3, the three harmonized IASI products have good spatial agreement in the decadal (2008–2017) average, with a background Northern–Southern Hemisphere gradient of approximately 30.0–40.0 to 15.0–25.0 DU. Peak TCO3 (>40.0 DU) occurs over East Asia, over the Middle East, and in ozone outflow from central Africa (e.g. production from lightning and biomass burning precursor gases (Moxim and Levy, 2000)). The global average TCO3 values for IASI-FORLI, IASI-SOFRID, and IASI-IMS are 32.6, 29.9, and 29.9 DU, respectively (Fig. 1 left column and Table 1). From Table 1, degrees of freedom of signal (DOFS) are approximately 1.0 for the troposphere (i.e. DOFStrop) and also in the upper troposphere–lower stratosphere (UTLS; DOFSutls), i.e. the vertical region where the O3 radiative effect is most prominent. These DOFS are derived on a global scale using IASI data for 2008. They show there to be sufficient information in the troposphere from IASI to derive radiative effect metrics. Therefore, like in Rap et al. (2015), we are confident in our approach to directly use the satellite data to derive the observational TO3RE.
When the TO3RE is calculated (Fig. 1 middle column), peak values occur over the sub-tropics, Africa, and Australia, ranging consistently between approximately 2.0 and 2.5 W m−2 for each IASI product. The minimum values are found at high latitudes ranging between 0.0 and 0.8 W m−2. The bottom panel of Fig. 1 shows the zonally averaged profiles weighted by the cosine of latitude (similar to Rap et al., 2015). This accounts for area weighting in the derived TO3RE for different latitude bands on the global weighted average. Here, TCO3 is near-zero at high latitudes and approximately 15.0–20.0 DU at mid-latitudes, peaking at 28.0–33.0 DU in the sub-tropics and then decreasing by several DU in the tropics. The corresponding TO3RE profiles follow a similar pattern, with near-zero values at high latitudes and approximately 0.5–1.0 W m−2 at mid-latitudes, peaking at 1.5 W m−2 in the sub-tropics and then decreasing to 1.1–1.2 W m−2 in the tropics. Therefore, the sub-tropics have the largest contribution to the global TO3RE. The global weighted TO3RE averages for IASI-FORLI, IASI-SOFRID, and IASI-IMS are 1.23, 1.21, and 1.21 W m−2, respectively (Fig. 1 and Table 1).
The NTO3RE (Fig. 1 right column) provides an estimate of where the TO3RE is most sensitive to changes in TCO3 (i.e. the unit of TO3RE per unit of TCO3). Peak NTO3RE (>50.0 mW m−2 DU−1) occurs at similar locations to the peak TO3RE (e.g. Africa and Australia), while the minimum values (10.0–20.0 mW m−2 DU−1) occur at high latitudes. Over the sub-tropical oceans, there are NTO3RE values of similar magnitude (approximately 45.0 mW m−2 DU−1). Therefore, despite some regions having lower TCO3 and TO3RE values (e.g. the South Pacific vs. the South Atlantic and Indian Ocean), the sensitivity to ozone perturbations (i.e. radiative effect per unit of TO3) is similar in these regions.
Overall, the global weighted average NTO3RE is 37.78, 40.43, and 40.60 mW m−2 DU−1 for IASI-FORLI, IASI-SOFRID, and IASI-IMS, respectively. It is likely that differences between the three ozone retrieval schemes could be causing the differences between globally averaged NTO3RE values. As the IASI-FORLI NTO3RE is lower, while having the highest global average TCO3 and TO3RE, it suggests that IASI-FORLI has a larger fraction of TO3 located in the mid-troposphere, where the radiative kernel has less sensitivity than the upper troposphere. Further to this, as the IASI ozone products only have approximately 1.0 DOFS in the troposphere (Table 1), the harmonization of the products using the ozonesondes can best be done on a tropospheric column level. As a result, the scaling of the satellite-derived TO3RE is done based on the relationship between the original IASI and IASI-sonde-corrected TCO3. Thus, a limitation is that though the upper troposphere is the most sensitive region to ozone radiative properties, the scaling of the TO3RE is applied based on the satellite–ozonesonde TCO3 relative differences.
TOMCAT allows for a further quantification of the TO3RE in the satellite era and the ability to run sensitivity experiments to explore some important top-level processes. Evaluation of the model using the IASI products and ozonesondes (see Sect. S2, Figs. S3, S4) shows the model generally captures the TCO3 spatial pattern and absolute values. In the tropics (middle and high latitudes), the model underestimates (overestimates) by approximately 10 %–20 % on average. These biases are comparable with other modelling studies evaluating models against satellite TO3 observations (e.g. Archibald et al., 2020; Monks et al., 2017; Nassar et al., 2009; Young et al., 2013), indicating that TOMCAT is suitable for this study.
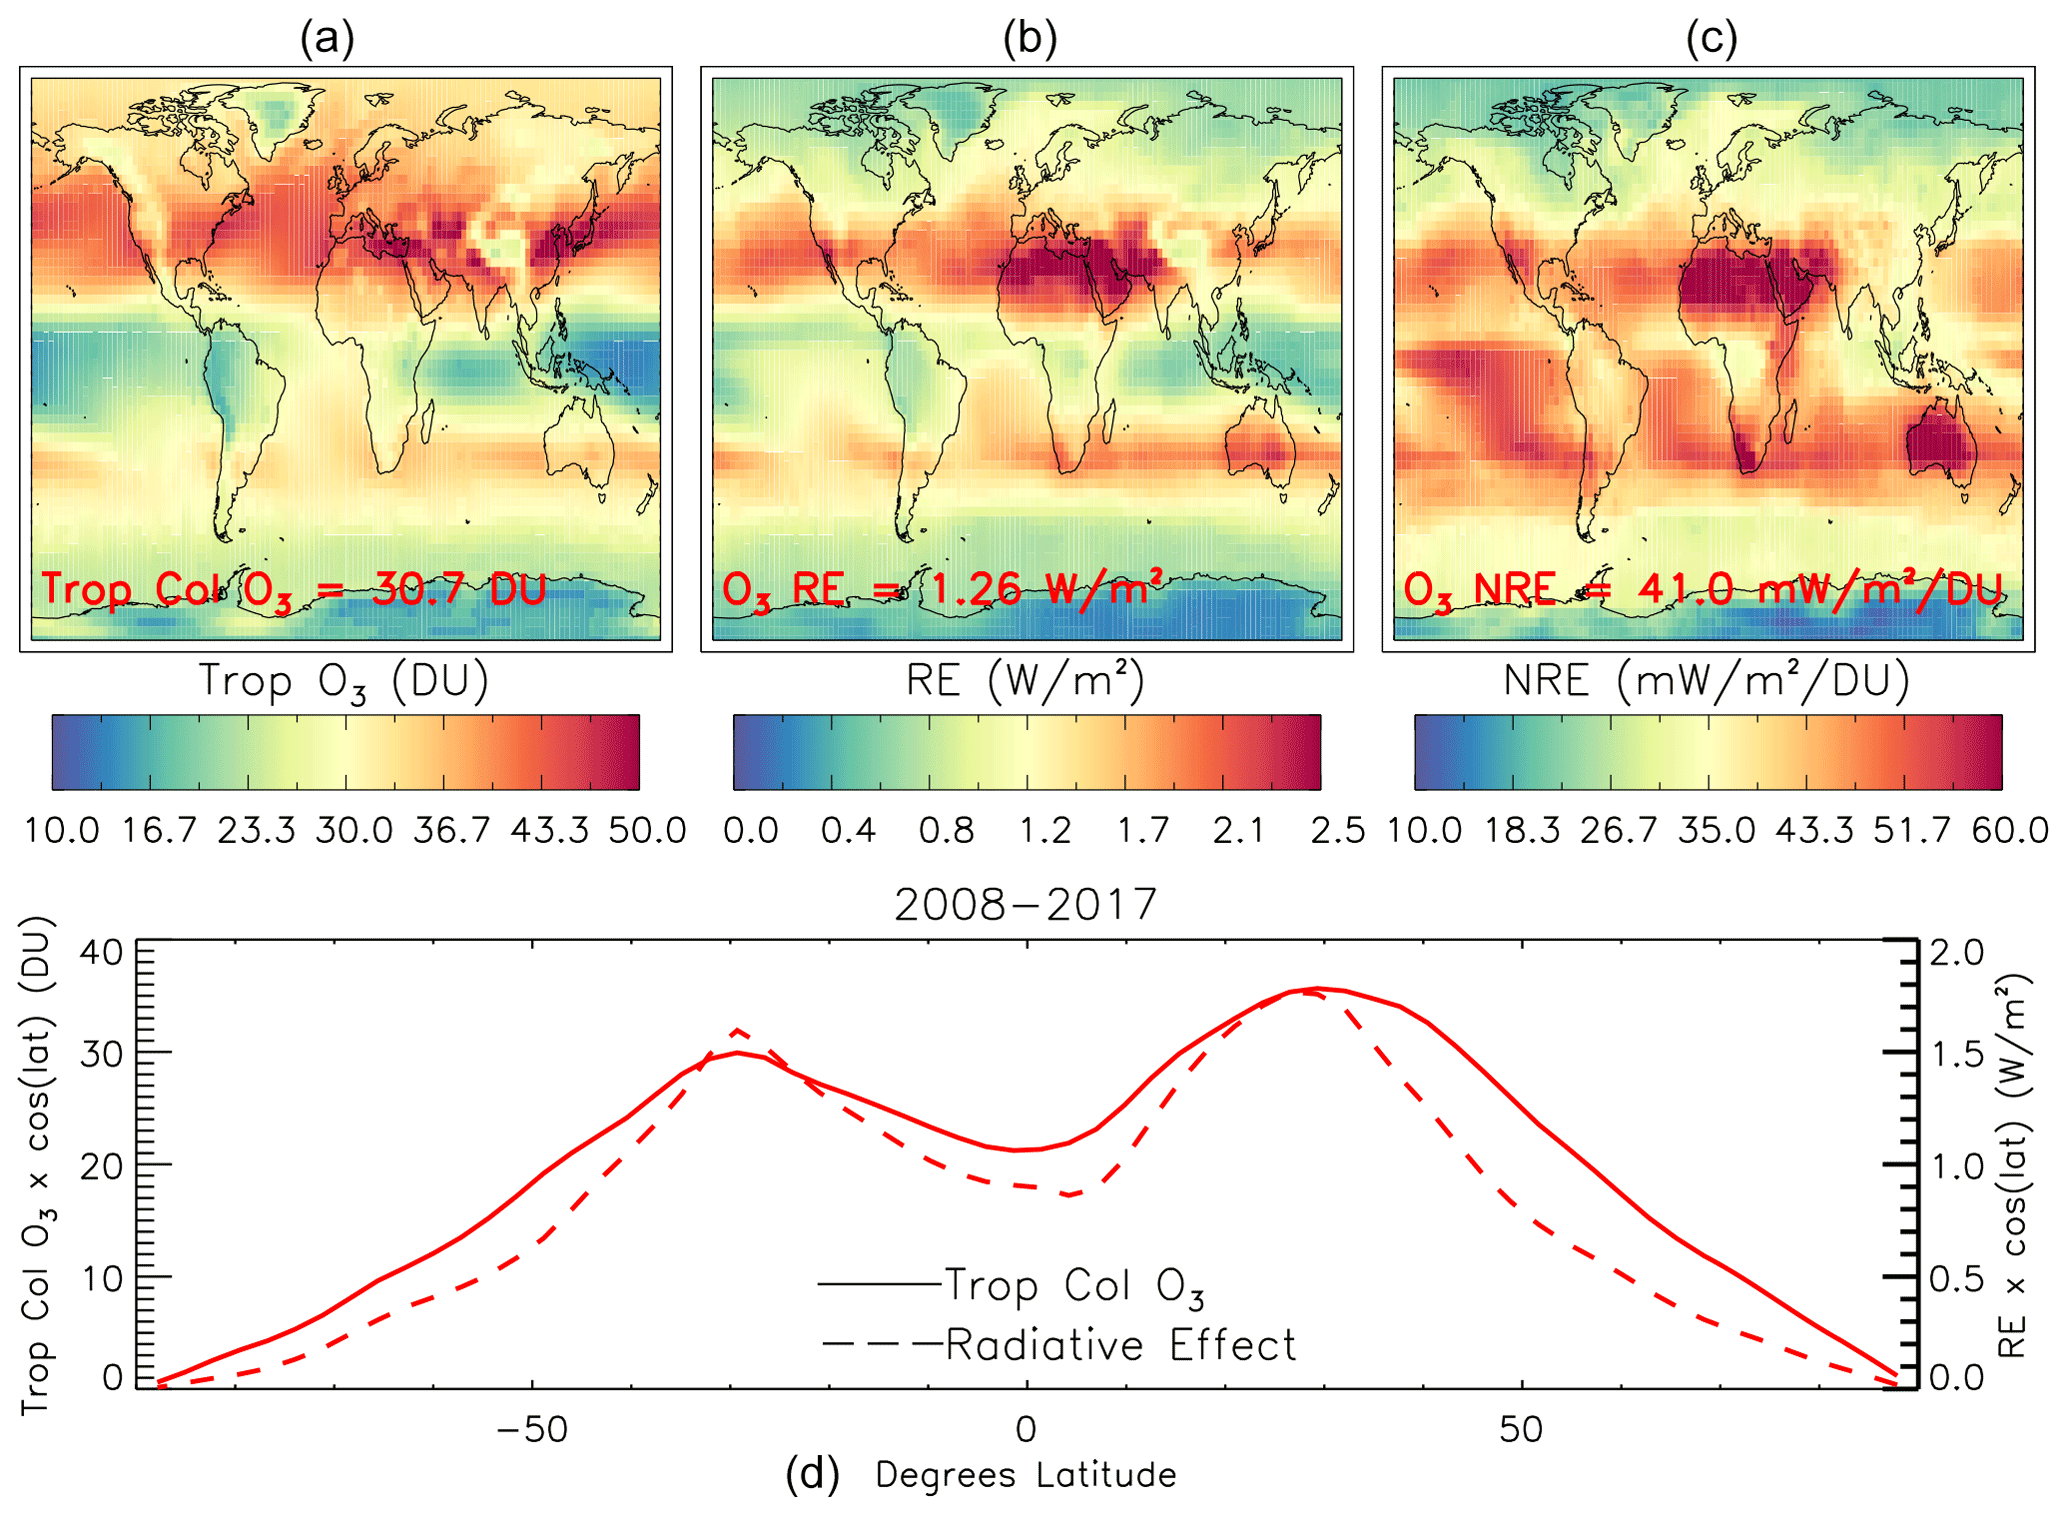
Figure 2TOMCAT-averaged TCO3 (DU), TO3RE (W m−2), and NTO3RE (mW m−2 DU−1) for 2008 to 2017 is shown in panels (a), (b), and (c), respectively. Zonal averages of TCO3 (DU; solid lines) and TO3RE (W m−2; dashed lines), both weighted by cosine of latitude, are shown in (d) from TOMCAT.
The global mean TCO3 from TOMCAT (2008–2017) (Fig. 2 – top panel) is 30.7 DU and consistent with the IASI datasets in Fig. 1. When translated into TO3RE, described above, the peak values from TOMCAT range between 2.0 and >2.5 W m−2 over Africa, Australia, and the sub-tropics. The global area-weighted TO3RE for TOMCAT is 1.26 W m−2, thus slightly larger than for IASI (1.21–1.23 W m−2). The fact that TOMCAT has a positive TCO3 bias with respect to the observations in the sub-tropics, where the TO3RE influence is most pronounced, probably explains the slightly larger model TO3RE value. In the bottom panel of Fig. 2, the zonal profiles (weighted by cosine of latitude to highlight the relative influence on the global weighted average) for TCO3 (TO3RE) have similar values to those of IASI. Here, the TOMCAT high-latitude values are near-zero (constrained by cos(90°)=0), mid-latitude values range between 10.0 and 20.0 DU (0.5 to 1.0 W m−2), and sub-tropical values range between 30.0 and 38.0 DU (1.5 and 1.7 W m−2). There is a decrease to approximately 25.0 DU (1.0–1.3 W m−2) in the tropics. In terms of the NTO3RE, the TOMCAT global area-weighted average is 41.0 mW m−2 DU−1, which is similar to IASI. The peak NTO3RE values are over the oceans (50.0–60.0 mW m−2 DU−1) and over Africa and Australia (>60.0 mW m−2 DU−1).
3.2 Temporal evolution of the tropospheric ozone radiative effect
As IASI has daily global coverage (Clerbaux et al., 2009), we are able to derive annual average 3D ozone fields between 2008 and 2017, thus providing the first assessment of interannual variability and decadal tendency in satellite-derived TO3RE. Figure 3 shows the annual TO3RE time series for all three IASI products. The first thing to note is that the EUMETSAT meteorological data used to retrieve ozone for the IASI-FORLI product are subject to discontinuities (Boynard et al., 2018; Wespes et al., 2018). As a result, we include decadal analysis of the IASI-FORLI data for the full time period (2008–2017) and then a sub-time period (2011–2017) given the large discontinuity in September 2010 reported by Boynard et al. (2018) and Wespes et al. (2018). Here, we can derive the TO3RE to quantify the absolute values and how they compare between products over the two time periods. In the near future, a new consistent IASI-FORLI ozone climate data record will be available using a more stable set of level-2 EUMETSAT meteorological data retrieved from MetOp IASI and microwave sounders.
For IASI-SOFRID and IASI-IMS, the annual TO3RE values range between 1.19 and 1.24 W m−2 across the 2008–2017 decade. IASI-FORLI has somewhat larger values at the start of the record (1.26–1.28 W m−2) before tending to that of IASI-SOFRID/IASI-IMS from 2011 onwards. Correlations (squared) in the annual TO3RE time series between IASI-FORLI and IASI-SOFRID (IASI-IMS) are poor at R2=0.148 (R2=0.132). However, IASI-SOFRID and IASI-IMS have a much stronger agreement, with R2=0.591 sharing nearly 60 % of the temporal variability. We also calculate the coefficient of variation (CoV; i.e., time series standard deviation divided by its mean) to assess the inter-annual variability. For IASI-SOFRID and IASI-IMS, this is 1.1 %, but for IASI-FORLI it is 2.5 %. Therefore, there is more year-to-year variability in the IASI-FORLI TO3RE record. However, when focussing on IASI-FORLI data for 2011–2017, the CoV drops to 1.2 % in line with IASI-SOFRID and IASI-IMS. The correlation (squared) values are now and , which shows improved agreement between IASI-FORLI and IASI-SOFRID but slightly surprisingly not with IASI-IMS. This may potentially be due to the lower sampling sizes of the IASI-IMS data record. Using ordinary least-squares fit regression, IASI-FORLI, IASI-SOFRID, and IASI-IMS have global average weighted TO3RE linear trends of −0.64 (−0.99, −0.28; 95 % confidence interval) % yr−1, −0.01 (−0.14, 0.12) % yr−1, and −0.13 (−0.36, 0.10) % yr−1 (see Table 1). As the IASI-FORLI product has known discontinuities (hence the larger CoV), the near-zero IASI-SOFRID and IASI-IMS trends are more robust. This is supported by IASI-FORLI when only considering 2011–2017 with a linear trend of −0.21 (−0.66, 0.23) % yr−1. Therefore, this suggests a negligible change in the contribution of TO3 to the tropospheric radiative effect over the recent past (i.e. 2008–2017).
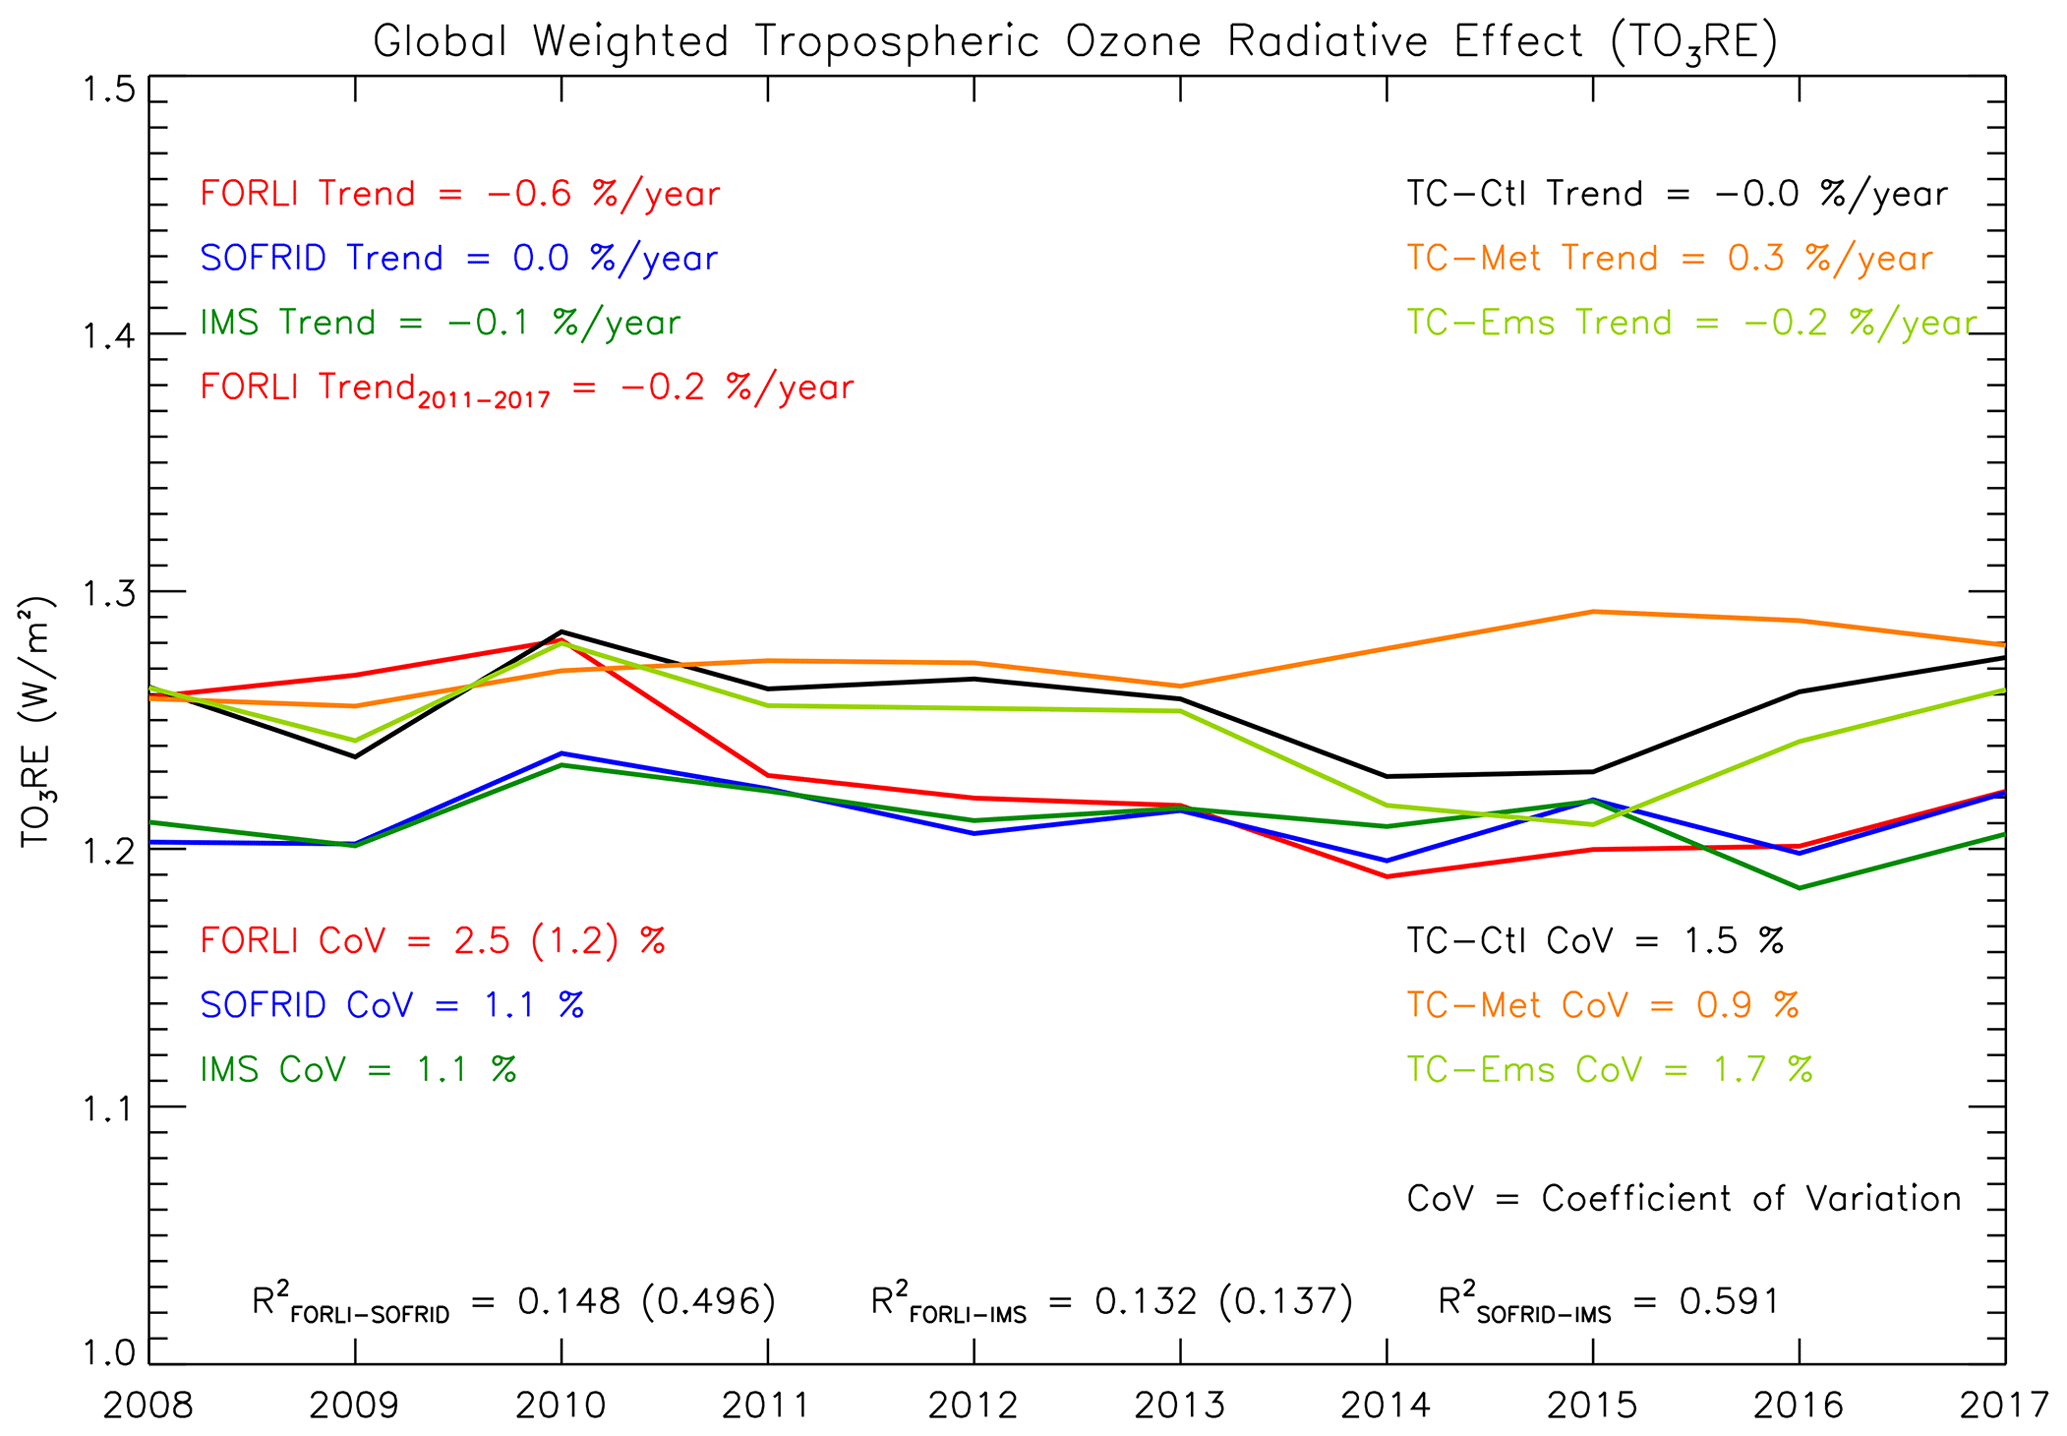
Figure 3Annual global mean time series of TO3RE (W m−2); between 2008 and 2017, for IASI-FORLI (solid red), IASI-SOFRID (solid blue), and IASI-IMS (solid green). TOMCAT simulation (solid black), TOMCAT with fixed emissions (solid lime), and TOMCAT with fixed meteorology (solid orange) are also shown. The linear trend (% yr−1) is shown as well as the percentage coefficient of variation (CoV). The correlation between IASI time series is shown by the R2 values. TC represents TOMCAT. The IASI-FORLI trend for 2011 to 2017 is also shown as well as the CoV and R2 in brackets in addition to the statistical metrics over the full time period due to record inhomogeneities prior to 2011 (Boynard et al., 2018).
TOMCAT global-average weighted TO3RE ranges between 1.24 and 1.29 W m−2 between 2008 and 2017. The CoV is 1.5 % for TOMCAT and is comparable to the IASI products (i.e. IASI-FORLI for later years). The TOMCAT TO3RE time series also has similar temporal variability (e.g. peaks in 2008, 2010, and 2017 and troughs in 2009 and 2014) to that of the IASI products. The underlying TOMCAT TO3RE decadal trend is −0.05 (−0.40, 0.30) % yr−1 and consistent with the IASI products. So, between 2008 and 2017, there has been limited overall change in TO3, despite reasonable interannual variability, and thus its decadal impact on the TO3RE has been relatively minor.
To investigate the importance of emissions and meteorology on the decadal TO3RE trends, TOMCAT was run twice for the full time period, once using repeating emissions and once using repeating meteorology for 2008 (i.e. start of the time series). Using fixed emissions reduced the TO3 burden, and the TO3RE values dropped to 1.22 to 1.28 W m−2 (i.e. minima in 2014 and 2015 more pronounced). However, the trend in TO3RE (−0.23 (−0.59, 0.23) % yr−1) remained small, indicating that temporal changes in emissions yield a relatively small influence on the decadal tendency in TO3RE. By comparison with the fixed-meteorology run, temporal changes in meteorological processes over the period 2008–2017 were found not to dramatically alter the TO3RE values either, but there is an increase to 1.26 to 1.30 W m−2 when the model meteorology is fixed to 2008. The corresponding TO3RE trend in the fixed-meteorology run is 0.26 (0.13, 0.39) % yr−1, leading to a steady increase in TO3RE, though with a similar magnitude to that of the fixed-emissions experiment. Therefore, temporal changes in pre-cursor emissions and meteorological processes appear to be balancing each other out, leading to the near-zero TOMCAT control run TO3RE trend. However, the largest changes in TO3RE between the control and fixed-meteorology runs are towards the end of the decade, coinciding with the 2015/2016 El Niño event (i.e. TO3 spatiotemporal variability has previously been linked to El Niño activity, for example, Ziemke et al. (2015) and Rowlinson et al. (2019)). The largest difference between the TOMCAT control and fixed-meteorology runs is 0.6 W m−2 in 2015, a large El Niño year. Overall, the year-to-year variability in meteorology appears to be counteracting any decadal TO3RE trend arising from temporal changes in precursor emissions, with the net result being no substantial underlying change in TO3RE over the 2008–2017 decade.
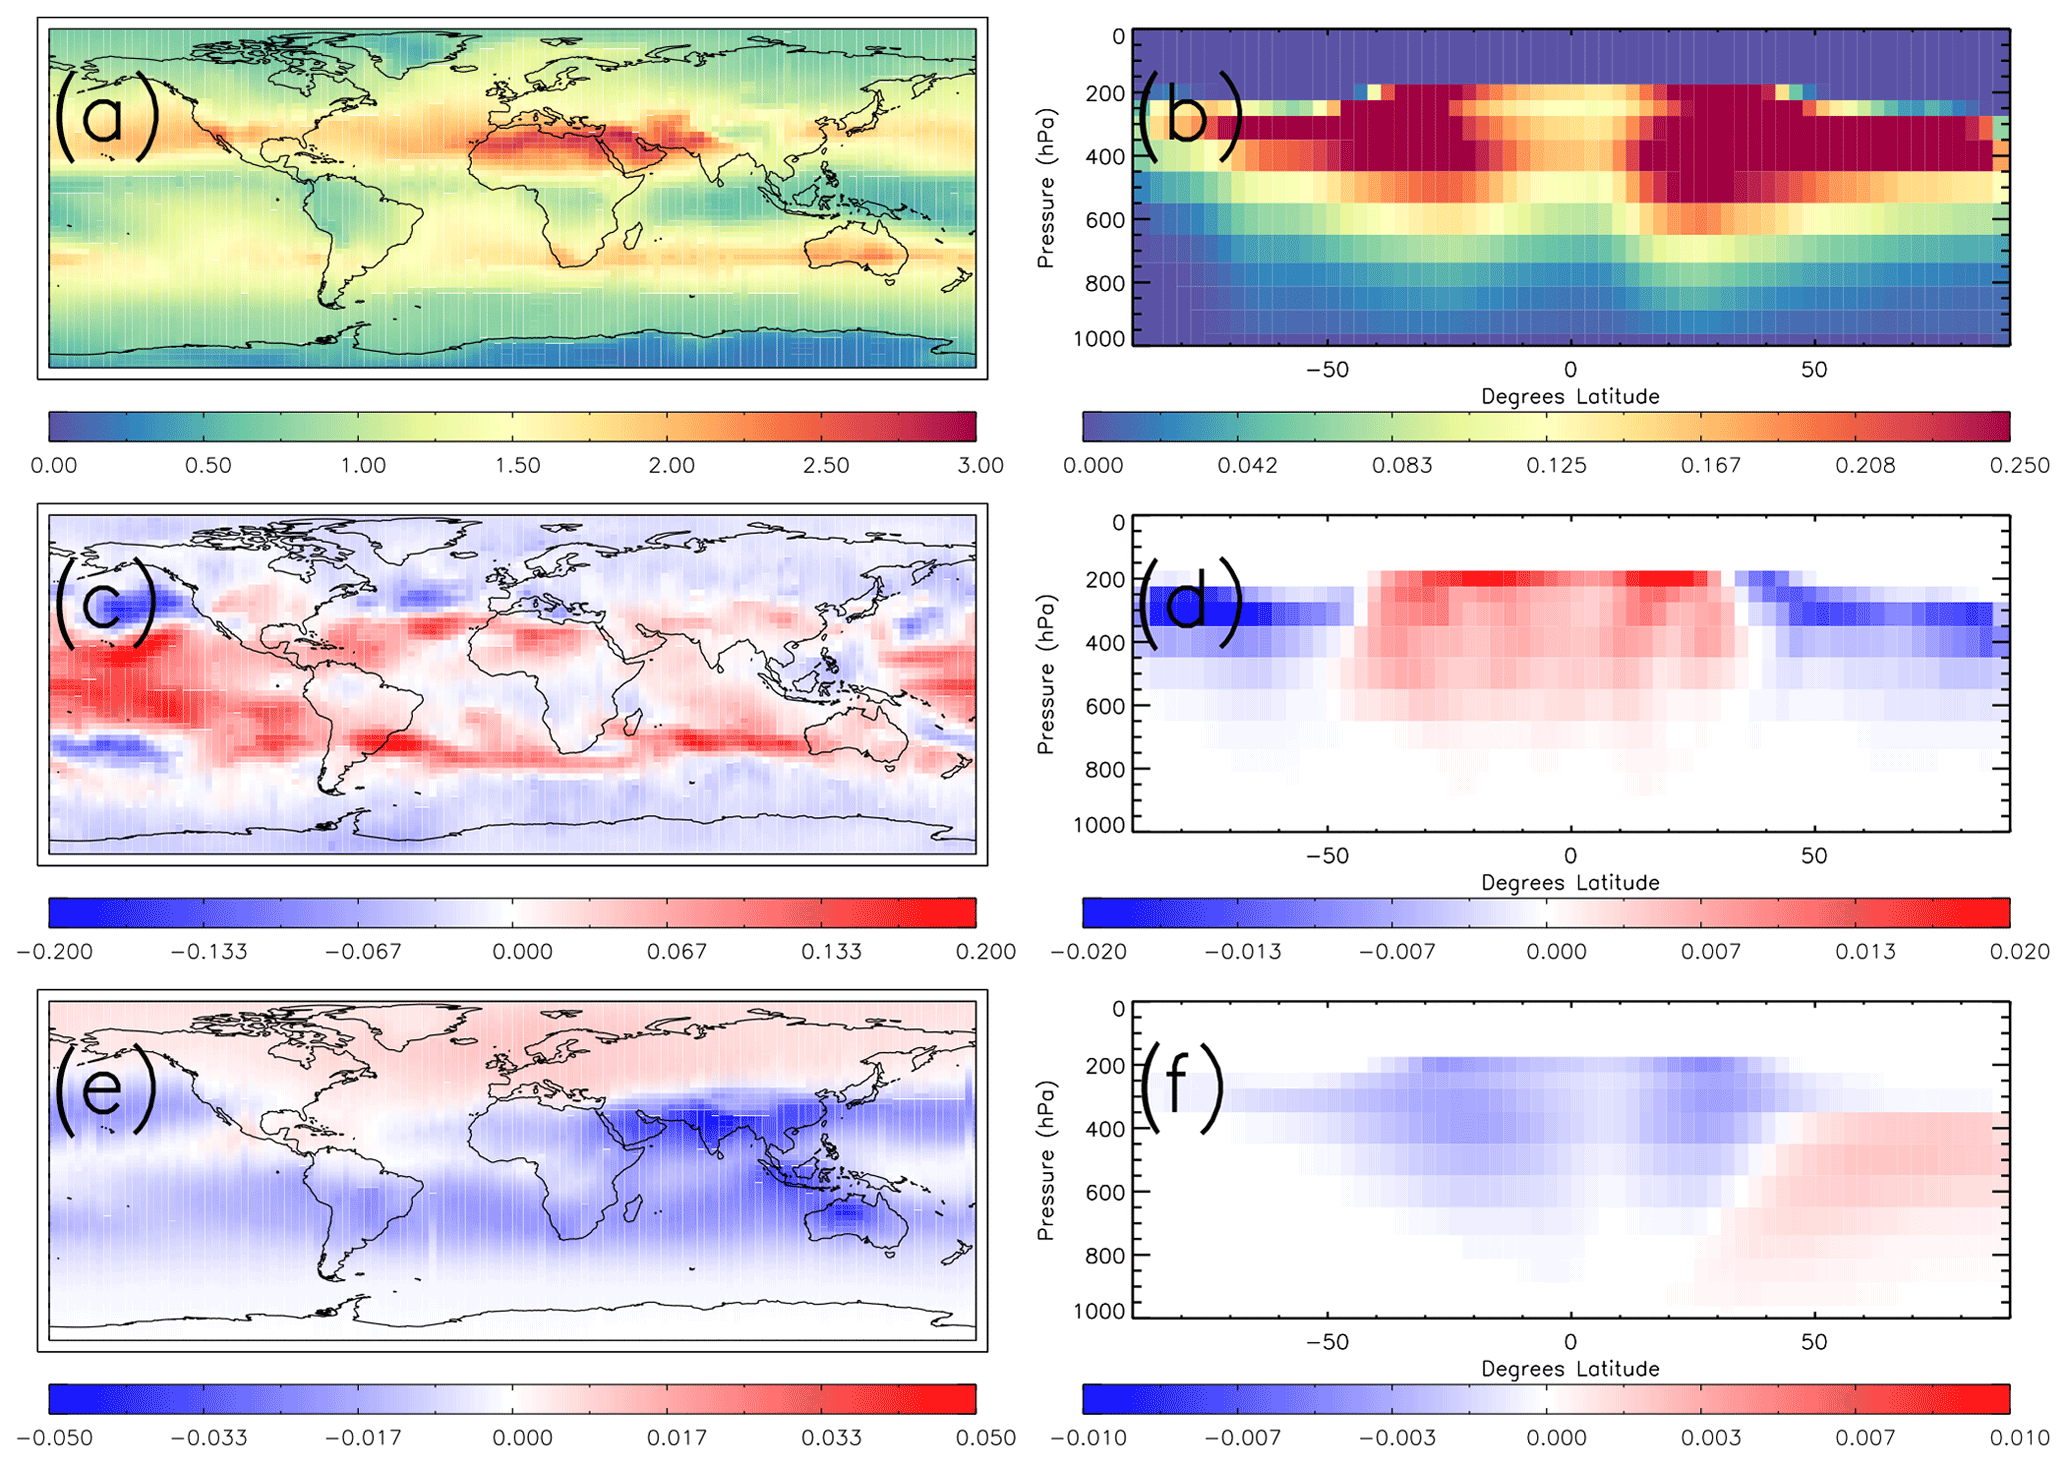
Figure 4(a) TOMCAT control run TO3RE (W m−2), (b) TOMCAT control run zonal average grid box O3 radiative effect (W m−2), (c) TOMCAT fixed meteorology–TOMCAT control TO3RE difference (W m−2), (d) TOMCAT fixed meteorology–TOMCAT control zonal average grid box O3 radiative effect difference (W m−2), (e) TOMCAT fixed emissions–TOMCAT control TO3RE difference (W m−2), and (f) TOMCAT fixed emissions–TOMCAT control zonal average grid box O3 radiative effect difference (W m−2).
Figure 4 shows the horizontal and vertical impact of the two sensitivity experiments on TOMCAT O3 radiative effect (note the different colour bar scales). Consistent with Figs. 1 and 2, the TOMCAT control TO3RE has peak values (>2.50 W m−2) over northern Africa and throughout the sub-tropics (approximately 2.0 W m−2; Fig. 4a). Vertically, the TOMCAT peak ozone radiative effect (>0.25 W m−2) is in the upper troposphere (Fig. 4b), with the largest impact in the sub-tropics of both hemispheres (500–200 hPa). Similar values extend through the mid-latitudes of both hemispheres but in a smaller pressure range (400–300 hPa).
In Fig. 4c, TO3RE is seen to be higher in the fixed-meteorology run than the control by 0.1 to >0.2 W m−2 throughout the tropics and sub-tropics, although there is considerable spatial variability, including an area in the sub-tropical Pacific where TO3RE is lower in the fixed-meteorology run by −0.15 W m−2. At high latitudes and mid-latitudes, TO3RE is lower than the control by between −0.1 and 0.0 W m−2. In the upper troposphere (Fig. 4d), the zonal averaged contribution to TO3RE in the fixed-meteorology run is consistently higher than the control, by up to 0.02 W m−2 at approximately 200 hPa in the tropics and sub-tropics and persisting at approximately 0.01 W m−2 down to 600 hPa in the same latitudinal range. Poleward of 50° N and 50° S, TO3RE is lower in the fixed-meteorology run, peaking at −0.02 to −0.015 W m−2 at 300 hPa and extending down to 500 hPa at −0.005 W m−2.
With fixed emissions, TO3RE is higher at northern middle and high latitudes by up to 0.02 W m−2, whereas in the tropics and sub-tropics and southern mid-latitudes, it is generally lower than in the control run by up to −0.02 W m−2 (Fig. 4e). However, over tropical Asia, Indonesia, and Australia, TO3RE is seen to be lower by a more substantial amount, −0.05 to −0.04 W m−2. In regard to its height dependence, contributions to TO3RE are seen in Fig. 4f to be lower in the fixed-emissions run by up to −0.005 W m−2 in the tropics and sub-tropics between 600 and 200 hPa and also in a tongue stretching to southern high latitudes at around 300 hPa (Fig. 4f). In the Northern Hemisphere, on the other hand, TO3RE in the layer between 400 and 600 hPa is seen to be higher by up to 0.003 at latitudes from the pole to 50° N and down to higher pressures at latitudes below 50° N.
In summary, the two model sensitivity experiments indicate that, except for southern high latitudes, precursor emissions and meteorology exerted counteracting influences of comparable magnitude on TO3RE in the 2008–2017 decade, and this is specifically so in the sub-tropical regions of the upper troposphere, where contributions to global-average area-weighted TO3RE are largest. At southern high latitudes, precursor emissions and meteorology are seen to have both increased TO3RE over this period, specifically through contributions in the uppermost troposphere, although area weighting minimized their combined impact on the global averaged TO3RE.
By using state-of-the-art satellite ozone profile retrievals from the Infrared Atmospheric Sounding Interferometer (IASI), on board MetOp-A, in combination with the TOMCAT chemical transport model (CTM) and the offline radiative transfer model, SOCRATES, we provide an updated estimate of the tropospheric ozone radiative effect (TO3RE) and provide the first observational constraint on its variability over the decade 2008–2017. Building upon the previous study of Rap et al. (2015), who quantified the globally weighted average TO3RE to be 1.17 ± 0.03 W m−2 (based on data between 2005 and 2008), we find the decadal average TO3RE, between 2008 and 2017, to range between 1.21 and 1.26 W m−2. This represents an update on the estimates from Rap et al. (2015) using an improved version of the TOMCAT model (as in Monks et al. (2017) compared to Richards et al., 2013)) and improved satellite products with better spatial and temporal coverage. However, these two studies do cover different time periods, which may be contributing to the differences between the studies. Secondly, neither the modelled nor the observed TO3RE suggests any substantial change during this decade. Investigations of the importance of ozone precursor emissions and meteorology, through targeted sensitivity experiments repeating emissions and meteorology for 2008 (i.e. year at start of time series), suggest that temporal changes in both factors have counteracted each other. Fixing emissions reduces the TO3RE values and tendency, so changes in emissions are driving a steady increase in the TO3RE. Conversely, fixing the meteorology drives an increase in the TO3RE values and tendency, thus yielding a net decrease in TO3RE despite its large variability. Therefore, the net tropospheric ozone contribution to atmospheric radiative properties, and potentially climate, has remained relatively stable with time during 2008–2017.
The IASI-FORLI and IASI-SOFRID data can be obtained from https://iasi.aeris-data.fr/O3 (IASI-FORLI, 2020) and https://iasi-sofrid.sedoo.fr/ (IASI-SOFRID, 2022). The IASI-IMS data are available via the NERC Centre for Environmental Data Analysis (CEDA) JASMIN platform subject to data requests. However, we have uploaded the data (IASI-IMS, 2022; RAL, 2024a–e) used in this study to Zenodo for 2008–2009 (https://zenodo.org/records/10699293), 2010–2011 (https://zenodo.org/records/10765615), 2012–2013 (https://zenodo.org/records/10765944), 2014–2015 (https://zenodo.org/records/10766366), and 2016–2017 (https://zenodo.org/records/10766682). The TOMCAT ozone data can be found at https://zenodo.org/records/10670324 (Pope et al., 2024). The ozonesonde data for WOUDC, SHADOZ, and NOAA are available from https://woudc.org/ (WOUDC, 2023), https://tropo.gsfc.nasa.gov/shadoz/ (SHADOZ, 2023), and https://gml.noaa.gov/ozwv/ozsondes/ (NOAA, 2023).
The supplement related to this article is available online at: https://doi.org/10.5194/acp-24-3613-2024-supplement.
RJP conceptualized, planned, and undertook the research study. AR provided the SOCRATES radiative kernel. BB, ELF, BJK, RS, BGL, LJV, AB, and CW provided the IASI ozone data and advice on using the products. MAP performed the TOMCAT model simulations with support from MPC and WF. CR provided advice and help during RP's ESA CCI fellowship. RJP prepared the manuscript with contributions from all co-authors.
The contact author has declared that none of the authors has any competing interests.
Publisher’s note: Copernicus Publications remains neutral with regard to jurisdictional claims made in the text, published maps, institutional affiliations, or any other geographical representation in this paper. While Copernicus Publications makes every effort to include appropriate place names, the final responsibility lies with the authors.
This article is part of the special issue “Tropospheric Ozone Assessment Report Phase II (TOAR-II) Community Special Issue (ACP/AMT/BG/GMD inter-journal SI)”. It is a result of the Tropospheric Ozone Assessment Report, Phase II (TOAR-II, 2020–2024).
This work was funded by the UK Natural Environment Research Council (NERC) by providing funding for the National Centre for Earth Observation (NCEO, award reference NE/R016518/1) and funding from the European Space Agency (ESA) Climate Change Initiative (CCI) post-doctoral fellowship scheme (award reference 4000137140). The TOMCAT runs were undertaken on ARC3, part of the High-Performance Computing facilities at the University of Leeds, UK. The IASI-SOFRID research was conducted at LAERO with some financial support from the CNES French spatial agency (TOSCA–IASI project). We acknowledge the AC SAF project of the EUMETSAT for providing data and/or products used in this paper. Anna Maria Trofaier (ESA Climate Office) provided support and advice throughout the fellowship.
This research has been supported by the National Centre for Earth Observation (grant no. NE/R016518/1) and the European Space Agency (grant no. 4000137140).
This paper was edited by Kostas Tsigaridis and reviewed by William Collins and one anonymous referee.
Archibald, A. T., O'Connor, F. M., Abraham, N. L., Archer-Nicholls, S., Chipperfield, M. P., Dalvi, M., Folberth, G. A., Dennison, F., Dhomse, S. S., Griffiths, P. T., Hardacre, C., Hewitt, A. J., Hill, R. S., Johnson, C. E., Keeble, J., Köhler, M. O., Morgenstern, O., Mulcahy, J. P., Ordóñez, C., Pope, R. J., Rumbold, S. T., Russo, M. R., Savage, N. H., Sellar, A., Stringer, M., Turnock, S. T., Wild, O., and Zeng, G.: Description and evaluation of the UKCA stratosphere–troposphere chemistry scheme (StratTrop vn 1.0) implemented in UKESM1, Geosci. Model Dev., 13, 1223–1266, https://doi.org/10.5194/gmd-13-1223-2020, 2020.
Barret, B., Le Flochmoen, E., Sauvage, B., Pavelin, E., Matricardi, M., and Cammas, J. P.: The detection of post-monsoon tropospheric ozone variability over south Asia using IASI data, Atmos. Chem. Phys., 11, 9533–9548, https://doi.org/10.5194/acp-11-9533-2011, 2011.
Barret, B., Emili, E., and Le Flochmoen, E.: A tropopause-related climatological a priori profile for IASI-SOFRID ozone retrievals: improvements and validation, Atmos. Meas. Tech., 13, 5237–5257, https://doi.org/10.5194/amt-13-5237-2020, 2020.
Bowman, K. W., Shindell, D. T., Worden, H. M., Lamarque, J. F., Young, P. J., Stevenson, D. S., Qu, Z., de la Torre, M., Bergmann, D., Cameron-Smith, P. J., Collins, W. J., Doherty, R., Dalsøren, S. B., Faluvegi, G., Folberth, G., Horowitz, L. W., Josse, B. M., Lee, Y. H., MacKenzie, I. A., Myhre, G., Nagashima, T., Naik, V., Plummer, D. A., Rumbold, S. T., Skeie, R. B., Strode, S. A., Sudo, K., Szopa, S., Voulgarakis, A., Zeng, G., Kulawik, S. S., Aghedo, A. M., and Worden, J. R.: Evaluation of ACCMIP outgoing longwave radiation from tropospheric ozone using TES satellite observations, Atmos. Chem. Phys., 13, 4057–4072, https://doi.org/10.5194/acp-13-4057-2013, 2013.
Boynard, A., Hurtmans, D., Garane, K., Goutail, F., Hadji-Lazaro, J., Koukouli, M. E., Wespes, C., Vigouroux, C., Keppens, A., Pommereau, J.-P., Pazmino, A., Balis, D., Loyola, D., Valks, P., Sussmann, R., Smale, D., Coheur, P.-F., and Clerbaux, C.: Validation of the IASI FORLI/EUMETSAT ozone products using satellite (GOME-2), ground-based (Brewer–Dobson, SAOZ, FTIR) and ozonesonde measurements, Atmos. Meas. Tech., 11, 5125–5152, https://doi.org/10.5194/amt-11-5125-2018, 2018.
Chipperfield, M.P.: New version of the TOMCAT/SLIMCAT off-line chemistry transport model: Intercomparison of stratospheric trace experiments, Q. J. Roy. Meteor. Soc., 132, 1179–1203, https://doi.org/10.1256/qj.05.5, 2006.
Clerbaux, C., Boynard, A., Clarisse, L., George, M., Hadji-Lazaro, J., Herbin, H., Hurtmans, D., Pommier, M., Razavi, A., Turquety, S., Wespes, C., and Coheur, P.-F.: Monitoring of atmospheric composition using the thermal infrared IASI/MetOp sounder, Atmos. Chem. Phys., 9, 6041–6054, https://doi.org/10.5194/acp-9-6041-2009, 2009.
Dee, D. P., Uppala, S. M., Simmons, A. J., Berrisford, P., Poli, P., Kobayashi, S., Andrae, U., Balmaseda, M. A., Balsamo, G., Bauer, P., Bechtold, P., Beliaars, A. C. M., van de Berg, L., Bidlot, J., Bormann, N., Delsol, C., Dragani, R., Fuentes, M., Geer, A. J., Haimberger, L., Healy, S. B., Hersbach, H., Holm, E. V., Isaksen, L., Kallberg, P., Kohler, M., Matricardi, M., McNally, A. P., Monge-Sanz, B. M., Morcrette, J. J., Park, B. K., Peubey, C., de Rosnay, P., Tavolato, C., Thepaut, J. N., and Vitart, E.: The ERA-Interim reanalysis: Configuration and performance of the data assimilation system, Q. J. Roy. Meteor. Soc., 137, 553–597, https://doi.org/10.1002/qj.828, 2011.
Dlugokencky, E.: NOAA Global Monitoring Laboratory–Trends in Atmospheric Methane, https://gml.noaa.gov/ccgg/trends_ch4/ (last access: 23 January 2023), 2020.
Doniki, S., Hurtmans, D., Clarisse, L., Clerbaux, C., Worden, H. M., Bowman, K. W., and Coheur, P.-F.: Instantaneous longwave radiative impact of ozone: an application on IASI/MetOp observations, Atmos. Chem. Phys., 15, 12971–12987, https://doi.org/10.5194/acp-15-12971-2015, 2015.
Edwards, J. M. and Slingo, A.: Studies with a flexible new radiation code. I: Choosing a configuration for a large-scale model, Q. J. Roy. Meteor. Soc., 122, 689–719, https://doi.org/10.1002/qj.49712253107, 1996.
Fels, S. B., Mahlman, J. D., Schwarzkopf, M. D., and Sinclair, R. W.: Stratospheric Sensitivity to Perturbations in Ozone and Carbon Dioxide: Radiative and Dynamical Response, J. Atmos. Sci., 37, 2265–2297, 1980.
Feng, L., Smith, S. J., Braun, C., Crippa, M., Gidden, M. J., Hoesly, R., Klimont, Z., van Marle, M., van den Berg, M., and van der Werf, G. R.: The generation of gridded emissions data for CMIP6, Geosci. Model Dev., 13, 461–482, https://doi.org/10.5194/gmd-13-461-2020, 2020.
Fleming, Z. L., Doherty, R. M., von Schneidemesser, E., Malley, C. S., Cooper, O. R., Pinto, J. P., Colette, A., Xutt, X., Simpson, D., Schultz, M. G., Lefohn, A. S., Hamad, S., Moolla, R., Solberg, S., and Feng, Z.: Tropospheric Ozone Assessment Report: Present-day ozone distribution and trends relevant to human health, Elem. Sci. Anth., 6, 12, https://doi.org/10.1525/elementa.273, 2018.
Forster, P., Storelvmo, T., Armour, K., Collins, W., Dufresne, J.- L., Frame, D., Lunt, D. J., Mauritsen, T., Palmer, M. D., Watanabe, M., Wild, M., and Zhang, H.: The Earth's Energy Budget, Climate Feedbacks, and Climate Sensitivity, in: Climate Change 2021: The Physical Science Basis, Contribution of Working Group I to the Sixth Assessment Report of the Intergovernmental Panel on Climate Change, edited by: Masson-Delmotte, V., Zhai, P., Pirani, A., Connors, S. L., Péan, C., Berger, S., Caud, N., Chen, Y., Goldfarb, L., Gomis, M. I., Huang, M., Leitzell, K., Lonnoy, E., Matthews, J. B. R., Maycock, T. K., Waterfield, T., Yelekçi, O., Yu, R., and Zhou, B., Cambridge University Press, Cambridge, United Kingdom and New York, NY, USA, 923–1054, https://doi.org/10.1017/9781009157896.009, 2021.
Gauss, M., Myhre, G., Isaksen, I. S. A., Grewe, V., Pitari, G., Wild, O., Collins, W. J., Dentener, F. J., Ellingsen, K., Gohar, L. K., Hauglustaine, D. A., Iachetti, D., Lamarque, F., Mancini, E., Mickley, L. J., Prather, M. J., Pyle, J. A., Sanderson, M. G., Shine, K. P., Stevenson, D. S., Sudo, K., Szopa, S., and Zeng, G.: Radiative forcing since preindustrial times due to ozone change in the troposphere and the lower stratosphere, Atmos. Chem. Phys., 6, 575–599, https://doi.org/10.5194/acp-6-575-2006, 2006.
Gulev, S. K., Thorne, P. W., Ahn, J., Dentener, F. J., Domingues, C. M., Gerland, S., Gong, D., Kaufman, D. S., Nnamchi, H. C., Quaas, J., Rivera, J. A., Sathyendranath, S., Smith, S. L., Trewin, B., von Schuckmann, K., and Vose R. S.: Changing State of the Climate System. In Climate Change 2021: The Physical Science Basis, Contribution of Working Group I to the Sixth Assessment Report of the Intergovernmental Panel on Climate Change, edited by: Masson-Delmotte, V., Zhai, P., Pirani, A., Connors, S. L., Péan, C., Berger, S., Caud, N., Chen, Y., Goldfarb, L., Gomis, M. I., Huang, M., Leitzell, K., Lonnoy, E., Matthews, J. B. R., Maycock, T. K., Waterfield, T., Yelekçi, O., Yu, R., and Zhou, B., Cambridge University Press, Cambridge, United Kingdom and New York, NY, USA, 287–422, https://doi.org/10.1017/9781009157896.004, 2021.
Heue, K.-P., Coldewey-Egbers, M., Delcloo, A., Lerot, C., Loyola, D., Valks, P., and van Roozendael, M.: Trends of tropical tropospheric ozone from 20 years of European satellite measurements and perspectives for the Sentinel-5 Precursor, Atmos. Meas. Tech., 9, 5037–5051, https://doi.org/10.5194/amt-9-5037-2016, 2016.
Hurtmans, D., Coheur, P.-F., Wespes, C., Clarisse, L., Scharf, O., Clerbaux, C., Hadji-Lazaro, George, M., and Turquety, S.: FORLI radiative transfer and retrieval code for IASI, J. Quant. Spectrosc. Ra., 113, 1391–1408, https://doi.org/10.1016/j.jqsrt.2012.02.036, 2012.
Iglesias-Suarez, F., Kinnison, D. E., Rap, A., Maycock, A. C., Wild, O., and Young, P. J.: Key drivers of ozone change and its radiative forcing over the 21st century, Atmos. Chem. Phys., 18, 6121–6139, https://doi.org/10.5194/acp-18-6121-2018, 2018.
IASI-IMS: IASI-IMS Data [data set], https://homepages.see.leeds.ac.uk/~earrjpo/to3re/iasi_ims/ (last access: 1 January 2023), 2022.
IASI-FORLI: Daily IASI/Metop-A ULB-LATMOS ozone (O3) L2 product (total column and vertical profile) (v20151001) [data set], https://iasi.aeris-data.fr/catalog/ (last access: 15 December 2022), 2020.
IASI-SOFRID: Welcome to the IASI-SOFRID database (vn3.5) [data set], http://thredds.sedoo.fr/iasi-sofrid-o3-co/ (last access: 1 December 2022), 2022.
Joiner, J., Schoeberl, M. R., Vasilkov, A. P., Oreopoulos, L., Platnick, S., Livesey, N. J., and Levelt, P. F.: Accurate satellite-derived estimates of the tropospheric ozone impact on the global radiation budget, Atmos. Chem. Phys., 9, 4447–4465, https://doi.org/10.5194/acp-9-4447-2009, 2009.
Keppens, A., Lambert, J.-C., Granville, J., Hubert, D., Verhoelst, T., Compernolle, S., Latter, B., Kerridge, B., Siddans, R., Boynard, A., Hadji-Lazaro, J., Clerbaux, C., Wespes, C., Hurtmans, D. R., Coheur, P.-F., van Peet, J. C. A., van der A, R. J., Garane, K., Koukouli, M. E., Balis, D. S., Delcloo, A., Kivi, R., Stübi, R., Godin-Beekmann, S., Van Roozendael, M., and Zehner, C.: Quality assessment of the Ozone_cci Climate Research Data Package (release 2017) – Part 2: Ground-based validation of nadir ozone profile data products, Atmos. Meas. Tech., 11, 3769–3800, https://doi.org/10.5194/amt-11-3769-2018, 2018.
Lamarque, J.-F., Bond, T. C., Eyring, V., Granier, C., Heil, A., Klimont, Z., Lee, D., Liousse, C., Mieville, A., Owen, B., Schultz, M. G., Shindell, D., Smith, S. J., Stehfest, E., Van Aardenne, J., Cooper, O. R., Kainuma, M., Mahowald, N., McConnell, J. R., Naik, V., Riahi, K., and van Vuuren, D. P.: Historical (1850–2000) gridded anthropogenic and biomass burning emissions of reactive gases and aerosols: methodology and application, Atmos. Chem. Phys., 10, 7017–7039, https://doi.org/10.5194/acp-10-7017-2010, 2010.
Mann, G. W., Carslaw, K. S., Spracklen, D. V., Ridley, D. A., Manktelow, P. T., Chipperfield, M. P., Pickering, S. J., and Johnson, C. E.: Description and evaluation of GLOMAP-mode: a modal global aerosol microphysics model for the UKCA composition-climate model, Geosci. Model Dev., 3, 519–551, https://doi.org/10.5194/gmd-3-519-2010, 2010.
McPeters, R. D., Labow, G. J., and Logan, J. A.: Ozone climatological profiles for satellite retrieval algorithms, J. Geophys. Res., 112, D05308, https://doi.org/10.1029/2005JD006823, 2007.
Mills, G., Pleijelt, H., Malley, C. S., Sinha, B., Cooper, O. R., Schultz, M. G., Neufeld, H. S., Simpson, D., Sharps, K., Feng, Z., Gerosa, G., Harmens, H., Kobayashi, K., Saxena, P., Paoletti, E., Sinha, V. and Xu, X.: Tropospheric Ozone Assessment Report: Present-day tropospheric ozone distribution and trends relevant to vegetation, Elem. Sci. Anth., 6, 47, https://doi.org/10.1525/elementa.302, 2018.
Monks, S. A., Arnold, S. R., Hollaway, M. J., Pope, R. J., Wilson, C., Feng, W., Emmerson, K. M., Kerridge, B. J., Latter, B. L., Miles, G. M., Siddans, R., and Chipperfield, M. P.: The TOMCAT global chemical transport model v1.6: description of chemical mechanism and model evaluation, Geosci. Model Dev., 10, 3025–3057, https://doi.org/10.5194/gmd-10-3025-2017, 2017.
Morgenstern, O., Hegglin, M. I., Rozanov, E., O'Connor, F. M., Abraham, N. L., Akiyoshi, H., Archibald, A. T., Bekki, S., Butchart, N., Chipperfield, M. P., Deushi, M., Dhomse, S. S., Garcia, R. R., Hardiman, S. C., Horowitz, L. W., Jöckel, P., Josse, B., Kinnison, D., Lin, M., Mancini, E., Manyin, M. E., Marchand, M., Marécal, V., Michou, M., Oman, L. D., Pitari, G., Plummer, D. A., Revell, L. E., Saint-Martin, D., Schofield, R., Stenke, A., Stone, K., Sudo, K., Tanaka, T. Y., Tilmes, S., Yamashita, Y., Yoshida, K., and Zeng, G.: Review of the global models used within phase 1 of the Chemistry–Climate Model Initiative (CCMI), Geosci. Model Dev., 10, 639–671, https://doi.org/10.5194/gmd-10-639-2017, 2017.
Moxy, W. J. and Levy, H.: A model analysis of tropical South Atlantic Ocean tropospheric ozone maximum: The interaction of transport and chemistry, J. Geophys. Res., 105, 17393–17415, https://doi.org/10.1029/2000JD900175, 2000.
Myhre, G., Shindell, D., Bréon, F.-M, Collins, W., Fuglestvedt, J., Huang, J., Koch, D., Lamarque, J.-F., Lee, D., Mendoza, B., Nakajima, T., Robock, A., Stephens, G., Takemura, T. and Zhang, H.: Anthropogenic and Natural Radiative Forcing, in: Climate Change 2013: The Physical Science Basis. Contribution of Working Group I to the Fifth Assessment Report of the Intergovernmental Panel on Climate Change, Cambridge University Press, Cambridge, United Kingdom and New York, NY, USA, 659–740, 2013.
Nassar, R., Logan, J. A., Mergretskaia, I. A., Murray, L. T., Zhang, L., and Jones, D. B. A.: Analysis of tropical tropospheric ozone, carbon monoxide, and water vapor during the 2006 El Niño using TES observations and the GEOS-Chem model, J. Geophys. Res.-Atmos., 114, D17304, https://doi.org/10.1029/2009JD011760, 2009.
NOAA: ESRL/GML Ozonesondes [data set], https://gml.noaa.gov/ozwv/ozsondes/ (last access: 1 June 2022), 2023.
Olivier, J., Peters, J., Granier, C., Petron, G., Muller, J. F., and Wallens, S.: Present and future surface emissions for atmsopheric compounds, POET report #2, http://accent.aero.jussieu.fr/Documents/del2_final.doc (last access: 23 January 2023), 2003.
Pacifico, F., Harrison, S. P., Jones, C. D., Arneth, A., Sitch, S., Weedon, G. P., Barkley, M. P., Palmer, P. I., Serça, D., Potosnak, M., Fu, T.-M., Goldstein, A., Bai, J., and Schurgers, G.: Evaluation of a photosynthesis-based biogenic isoprene emission scheme in JULES and simulation of isoprene emissions under present-day climate conditions, Atmos. Chem. Phys., 11, 4371–4389, https://doi.org/10.5194/acp-11-4371-2011, 2011.
Pimlott, M. A., Pope, R. J., Kerridge, B. J., Latter, B. G., Knappett, D. S., Heard, D. E., Ventress, L. J., Siddans, R., Feng, W., and Chipperfield, M. P.: Investigating the global OH radical distribution using steady-state approximations and satellite data, Atmos. Chem. Phys., 22, 10467–10488, https://doi.org/10.5194/acp-22-10467-2022, 2022.
Pope, R. J., Kerridge, B. J., Siddans, R., Latter, B. G., Chipperfield, M. P., Arnold, S. R., Ventress, L. J., Pimlott, M. A., Graham, A. M., Knappett, D. S and Rigby R.: Large Enhancements in Southern Hemisphere Satellite-Observed Trace Gases Due to the 2019/2020 Australian Wildfires, J. Geophys. Res.-Atmos., 126, e2021JD034892, https://doi.org/10.1029/2021JD034892, 2021.
Pope, R., Chipperfield, M., and Pimlott, M.: TOMCAT Tropospheric Ozone, Zenodo [data set], https://doi.org/10.5281/zenodo.10670324, 2024.
RAL: RAL Space Infrared-Mirowave-Sounding (IMS) Scheme Ozone Profiles: 2008–2009, Zenodo [data set], https://doi.org/10.5281/zenodo.10699293, 2024a.
RAL: RAL Space Infrared-Mirowave-Sounding (IMS) Scheme Ozone Profiles: 2010–2011, Zenodo [data set], https://doi.org/10.5281/zenodo.10765615, 2024b.
RAL: RAL Space Infrared-Mirowave-Sounding (IMS) Scheme Ozone Profiles: 2012–2013, Zenodo [data set], https://doi.org/10.5281/zenodo.10765944, 2024c.
RAL: RAL Space Infrared-Mirowave-Sounding (IMS) Scheme Ozone Profiles: 2014–2015, Zenodo [data set], https://doi.org/10.5281/zenodo.10766366, 2024d.
RAL: RAL Space Infrared-Mirowave-Sounding (IMS) Scheme Ozone Profiles: 2016–2017, Zenodo [data set], https://doi.org/10.5281/zenodo.10766682, 2024e.
Rap, A., Richard, N. A. D., Forster, P. M., Monks, S. A., Arnold, S. R., and Chipperfield, M. P.: Satellite constraint on the tropospheric ozone radiative effect, Geophys. Res. Lett., 42, 5074–5081, https://doi.org/10.1002/2015GL064037, 2015.
Richards, N. A. D, Osterman, G. B., Browell, E. V., Hair, J. W., Avery, M., and Li, Q.: Validation of tropospheric emission spectrometer ozone profiles with aircraft observations during the intercontinental chemical transport experiment–B, J. Geophys. Res., 113, D16S29, https://doi.org/10.1029/2007JD008815, 2008.
Rodgers, C. D.: Inverse methods for atmospheric sounding: Theory and practice, New Jersey, USA: World Science, ISBN 978-981-02-2740-1, 2000.
Rossow, W. B. and Schiffer, R. A.: Advances in understanding clouds from ISCCP, B. Am. Meteorol. Soc., 80, 2261–2287, https://doi.org/10.1175/1520-0477(1999)080>2.0.co;2,1999.
Rowlinson, M. J., Rap, A., Arnold, S. R., Pope, R. J., Chipperfield, M. P., McNorton, J., Forster, P., Gordon, H., Pringle, K. J., Feng, W., Kerridge, B. J., Latter, B. L., and Siddans, R.: Impact of El Niño–Southern Oscillation on the interannual variability of methane and tropospheric ozone, Atmos. Chem. Phys., 19, 8669–8686, https://doi.org/10.5194/acp-19-8669-2019, 2019.
Rowlinson, M. J., Rap, A., Hamilton, D. S., Pope, R. J., Hantson, S., Arnold, S. R., Kaplan, J. O., Arneth, A., Chipperfield, M. P., Forster, P. M., and Nieradzik, L.: Tropospheric ozone radiative forcing uncertainty due to pre-industrial fire and biogenic emissions, Atmos. Chem. Phys., 20, 10937–10951, https://doi.org/10.5194/acp-20-10937-2020, 2020.
Saunders, R., Matricardi, M., and Brunel, P.: An improved fast radiative transfer model for assimilation of satellite radiance observations. Q. J. Roy. Meteor. Soc., 125 1407–1425, https://doi.org/10.1256/smsqj.55614, 1999.
Scott, C. E., Monks, S. A., Spracklen, D. V., Arnold, S. R., Forster, P. M., Rap, A., Aijala, M., Artaxo, P., Carslaw, K. S., Chipperfield, M. P., Ehn, M., Gilardoni, S., Heikkinen, L., Kulmala, M., Petaja, T., Reddington, C. L. S, Rizzo, L. V., Swietlicki, E., Vignati, E., and Wilson, C.: Impact on short-lived climate forcers increases projected warming due to deforestation, Nat. Commun., 9, 157, https://doi.org/10.1038/s41467-017-02412-4, 2018.
Sellar, A. A., Jones, C. G., Mulcahy, J. P., Tang, Y., Yool, A, Wiltshire, A., O'Connor, F. M., Stringer, M., Hill, R., Palmieri, J., Woodward, S., de Mora, L. Kuhlbrodt, T., Rumbold, S. T., Kelley, D. I., Ellis, R., Jonson, C. E. Walton, J., Abraham, N. L., Andrews, M. B., Andrews, T., Archibald, A. T., Berthou, S., Burke, E., Blockley, E., Carslaw, K., Dalvi, M., Edwards, J., Folberth, G. A., Gedney, N., Jones, A., Jones, C. D., Keeble, J., Liddicoat, S., Morgenstern, O., Parker, R. J., Predoi, V., Robertson, E., Siahaan, A., Smith, R. S., Swaminathan, R., Woodhouse, M. T., Zeng, G., and Zerroukat, M.: Description and Evaluation of the UK Earth System Model, J. Adv. Model. Earth Sy., 11, 4513–4558, https://doi.org/10.1029/2019MS001739, 2019.
SHADOZ: SHADOZ Data Archive [data set], https://tropo.gsfc.nasa.gov/shadoz/Archive.html (last access: 1 June 2022), 2023.
Sitch, S., Cox, P. M., Collins, W. J., and Huntingford, C.: Indirect radiative forcing of climate change through ozone effects on the land carbon sink, Nature, 448, 791–795, https://doi.org/10.1038/nature06059, 2007.
Sofieva, V. F., Tamminen, J., Kyrölä, E., Mielonen, T., Veefkind, P., Hassler, B., and Bodeker, G. E.: A novel tropopause-related climatology of ozone profiles, Atmos. Chem. Phys., 14, 283–299, https://doi.org/10.5194/acp-14-283-2014, 2014.
Stevenson, D. S., Young, P. J., Naik, V., Lamarque, J.-F., Shindell, D. T., Voulgarakis, A., Skeie, R. B., Dalsoren, S. B., Myhre, G., Berntsen, T. K., Folberth, G. A., Rumbold, S. T., Collins, W. J., MacKenzie, I. A., Doherty, R. M., Zeng, G., van Noije, T. P. C., Strunk, A., Bergmann, D., Cameron-Smith, P., Plummer, D. A., Strode, S. A., Horowitz, L., Lee, Y. H., Szopa, S., Sudo, K., Nagashima, T., Josse, B., Cionni, I., Righi, M., Eyring, V., Conley, A., Bowman, K. W., Wild, O., and Archibald, A.: Tropospheric ozone changes, radiative forcing and attribution to emissions in the Atmospheric Chemistry and Climate Model Intercomparison Project (ACCMIP), Atmospheric Chemistry and Physics, 13, 3063–3085, https://doi.org/10.5194/acp-13-3063-2013, 2013.
Szopa, S., Naik, V., Adhikary, B., Artaxo, P., Berntsen, T., Collins, W. D., Fuzzi, S., Gallardo, L., Kiendler-Scharr, A., Klimont, Z., Liao, H., Unger, N., and Zanis, P.: Short-Lived Climate Forcers. In Climate Change 2021: The Physical Science Basis. Contribution of Working Group I to the Sixth Assessment Report of the Intergovernmental Panel on Climate Change, edited by: Masson-Delmotte, V., Zhai, P., Pirani, A., Connors, S. L., Péan, C., Berger, S., Caud, N., Chen, Y., Goldfarb, L., Gomis, M. I., Huang, M., Leitzell, K., Lonnoy, E., Matthews, J. B. R., Maycock, T. K., Waterfield, T., Yelekçi, O., Yu, R., and Zhou, B., Cambridge University Press, Cambridge, United Kingdom and New York, NY, USA, 817–922, https://doi.org/10.1017/9781009157896.008, 2021.
TOMCAT: TOMCAT Simulations [data set], https://homepages.see.leeds.ac.uk/~earrjpo/to3re/tomcat/ (last access: 23 January 2023), 2023.
van der Werf, G. R., Randerson, J. T., Giglio, L., van Leeuwen, T. T., Chen, Y., Rogers, B. M., Mu, M., van Marle, M. J. E., Morton, D. C., Collatz, G. J., Yokelson, R. J., and Kasibhatla, P. S.: Global fire emissions estimates during 1997–2016, Earth Syst. Sci. Data, 9, 697–720, https://doi.org/10.5194/essd-9-697-2017, 2017.
Wespes, C., Hurtmans, D., Clerbaux, C., Boynard, A., and Coheur, P.-F.: Decrease in tropospheric O3 levels in the Northern Hemisphere observed by IASI, Atmos. Chem. Phys., 18, 6867–6885, https://doi.org/10.5194/acp-18-6867-2018, 2018.
WMO, Meteorology – A three-dimensional science, World Meteorological Organisation, Bulletin 6, (Oct), 134–138, 1957.
Worden, H. M., Bowman, K. W., Worden, J. R., Eldering, A., and Beer, R.: Satellite measurements of the clear-sky greenhouse effect from tropospheric ozone, Nat. Geosci., 1, 305–308, doi:doi.org/10.1038/ngeo182, 2008.
Worden, H. M., Bowman, K. W., Kulawik, S. S., and Aghedo, A. M.: Sensitivity of outgoing longwave radiative flux to the global vertical distribution of ozone characterized by instantaneous radiative kernels from Aura-TES, J. Geophys. Res.-Atmos., 116, D14115, https://doi.org/10.1029/2010JD015101, 2011.
WOUDC: Data Search/Download [data set], https://woudc.org/data/explore.php (last access: 1 June 2022), 2023.
Young, P. J., Archibald, A. T., Bowman, K. W., Lamarque, J.-F., Naik, V., Stevenson, D. S., Tilmes, S., Voulgarakis, A., Wild, O., Bergmann, D., Cameron-Smith, P., Cionni, I., Collins, W. J., Dalsøren, S. B., Doherty, R. M., Eyring, V., Faluvegi, G., Horowitz, L. W., Josse, B., Lee, Y. H., MacKenzie, I. A., Nagashima, T., Plummer, D. A., Righi, M., Rumbold, S. T., Skeie, R. B., Shindell, D. T., Strode, S. A., Sudo, K., Szopa, S., and Zeng, G.: Pre-industrial to end 21st century projections of tropospheric ozone from the Atmospheric Chemistry and Climate Model Intercomparison Project (ACCMIP), Atmos. Chem. Phys., 13, 2063–2090, https://doi.org/10.5194/acp-13-2063-2013, 2013.
Ziemke, J. R., Douglass, A. R., Oman, L. D., Strahan, S. E., and Duncan, B. N.: Tropospheric ozone variability in the tropics from ENSO to MJO and shorter timescales, Atmos. Chem. Phys., 15, 8037–8049, https://doi.org/10.5194/acp-15-8037-2015, 2015.