the Creative Commons Attribution 4.0 License.
the Creative Commons Attribution 4.0 License.
 | 22 Mar 2024
Global and regional chemical influence of sprites: reconciling modelling results and measurements
Francisco J. Pérez-Invernón
Francisco J. Gordillo-Vázquez
Alejandro Malagón-Romero
Patrick Jöckel
Mesospheric electrical discharges, known as sprites and formed by fast-propagating streamers, have been shown to create localized enhancements of atmospheric constituents such as N, O, NOx, N2O, and HOx, as indicated by both modelling results and space-based measurements. In this study, we incorporate the occurrence rate of sprites into a chemistry–climate model using meteorological parameters as a proxy. Additionally, we introduce the injection of chemical species by sprites into the model based on electrodynamical modelling of individual sprite streamers and observations from space.
Our modelling results show a good agreement between the simulated sprite distribution and observed data on a global scale. While the global influence of sprites on the atmospheric chemistry is found to be negligible, our findings reveal their measurable chemical influence at the regional scale, particularly for the concentration of HNO3 and HNO4 within the mesosphere. The simulations also suggest that sprites could be responsible for the observed NO2 anomalies at an altitude of 52 km above thunderstorms, as reported by MIPAS. Finally, a projected simulation reveals that the occurrence rate of sprites could increase at a rate of 14 % per 1 K rise in the global temperature.
- Article
(13262 KB) - Full-text XML
- BibTeX
- EndNote


In 1925, Wilson (1925) predicted the existence of electrical discharges (nowadays called sprites) above thunderstorms, which was later confirmed by Franz et al. (1990). Sprites are a category of transient luminous events (TLEs) that take place at altitudes ranging from 40 to 90 km. They are initiated by the ionization resulting from the quasi-electrostatic field component of lightning discharges, as described by studies such as Pasko et al. (1997), Pasko et al. (2012), and Stenbaek-Nielsen et al. (2000). The quasi-electrostatic field primarily generates electromagnetic radiation within the extremely-low-frequency (ELF) and the ultra-low-frequency (ULF) electromagnetic spectra, which result from continuing currents during discharges lasting several tens or hundreds of milliseconds (Brook et al., 1962). Consequently, sprites are commonly observed simultaneously with a discernible ELF and/or ULF signal, emitted by lightning flashes characterized by continuing currents (Greenberg et al., 2009; Inan et al., 2010; Lu et al., 2017).
Sprites consist of fast-propagating streamers followed by long-standing luminous structures known as beads and glows. These events typically last between 1 and 100 ms (Liu, 2010; Luque and Gordillo-Vázquez, 2010, 2011; Luque et al., 2016; Malagón-Romero et al., 2020). The primary sources of optical emissions in sprite streamers, beads, and glows originate from various molecular components, including the first and second positive systems of molecular neutral nitrogen, the first negative system of molecular nitrogen ions, the Meinel band of molecular nitrogen ions, and the Lyman–Birge–Hopfield (LBH) band of molecular neutral nitrogen (Armstrong et al., 1998; Chen et al., 2003; Kuo et al., 2005; Stenbaek-Nielsen et al., 2007; Kanmae et al., 2007; Šimek, 2014; Sato et al., 2015; Hoder et al., 2016; Ihaddadene and Celestin, 2017; Gordillo-Vázquez et al., 2018; Pérez-Invernón et al., 2018b).
Observing sprites is challenging due to their short duration. However, ground-, space-, and aircraft-based instruments have been successful in detecting sprites, providing valuable information about their occurrence (Armstrong et al., 1998; Stenbaek-Nielsen et al., 2007; Gordillo-Vázquez et al., 2018; Arnone et al., 2020). To overcome the limitations of direct observations, some researchers have proposed using ELF and ULF lightning measurements from flashes with continuing currents as a proxy indicator for the occurrence of sprites (Füllekrug and Constable, 2000; Sato and Fukunishi, 2003; Andrey et al., 2022). Following this approach, Ignaccolo et al. (2006) estimated a global occurrence rate of 2.8 sprites per minute with an accuracy factor of ∼ 2–3. Chen et al. (2008) used satellite-based optical observations from the Imager of Sprites and Upper Atmospheric Lightning (ISUAL) experiment aboard the FORMOSAT-2 satellite to report a global occurrence rate of 0.5 sprites per minute while also providing information about the polarity of the lightning parents and the distribution of sprites over land and ocean (Zhang et al., 2022). More recently, Andrey et al. (2022) estimated a global occurrence rate of about 0.6 sprites per minute based on global measurements of the energy radiated by cloud-to-ground (CG) lightning reported by the World Wide Lightning Location Network (WWLLN).
Electrodynamical and chemical models of sprites suggest a significant local production of NOx (NO + NO2), N2O, and HOx (H + OH + HO2) in the mesosphere (from about 40 km upwards) and the lower ionosphere (Sentman et al., 2008; Gordillo-Vázquez, 2008, 2010; Gordillo-Vázquez et al., 2012; Evtushenko et al., 2013; Winkler and Nothold, 2014; Parra-Rojas et al., 2015; Pérez-Invernón et al., 2020; Winkler et al., 2021). According to Sentman et al. (2008), they calculated a production of 5×10¹⁹ molecules of NO per single streamer in sprites between altitudes of 65 and 75 km by using a chemical model of sprites. Enell et al. (2008) reported a production of 3×10²² to 3×10²³ NO molecules per complete sprite. Pérez-Invernón et al. (2020) calculated a production of N2O and NO molecules per sprite between 68 and 75 km altitude of 2 × 10¹⁹ and 1 × 10²¹ molecules, respectively. Winkler et al. (2021) modelled the production of HO2 by sprite streamers and found that they could produce about 1020 molecules of HO2 between 70 and 80 km altitude. Finally, Malagón-Romero et al. (2023) extended the electrodynamical model of sprite streamers of Pérez-Invernón et al. (2020) to estimate a production of 7.5×10¹⁸ molecules of NO, 2.6×10¹⁸ molecules of NO2, and 2.6×10¹⁸ molecules of N2O and a removal of 3.1 × 10²² molecules of O3 by sprite streamers between 49.75 and 50 km.
The possibility of sprites producing NOx and HOx in the mesosphere has motivated several attempts to measure the chemical production of sprites to determine their chemical role in the atmosphere. Arnone et al. (2008) combined NO2 measurements obtained from the Michelson Interferometer for Passive Atmospheric Sounding (MIPAS) with lightning data sourced from the World Wide Lightning Location Network (WWLLN) for the period August to December 2003. They conducted a search for anomalies in nighttime measurements of NO2 mixing ratios (at about 22:00 LT) at altitudes of 47, 52, and 60 km above thunderstorms. This search was limited to latitudes within the range of 30° S to 20° N and over an instantaneous field of view with a footprint of 1200 km in latitude × 30 km in longitude at 52 km. To examine the relationship between lightning activity and NO2 mixing ratios, they generated five sets of NO2 measurements based on the accumulation of lightning events prior to the MIPAS overpass. The first set consisted of measurements taken in the absence of lightning flashes up to 60 min before the MIPAS overpass, while the remaining sets were similar but included data from 10, 20, and 30 min prior to the overpass. They reported a maximum positive anomaly of the NO2 mixing ratio of +1 ppbV 20 min after the occurrence of lightning at 52 km. Subsequently, Arnone and Dinelli (2016) extended their investigation up to April 2004, corroborating the presence of an elevated mixing ratio of NO2 above thunderstorms. However, when the analysis was further expanded to encompass the entire MIPAS2D dataset (Dinelli et al., 2010), no significant augmentation in the NO2 mixing ratio was discernible at an altitude of 52 km above thunderstorms. These results collectively suggest that the chemical disturbance induced by sprites in the mesosphere resides on the cusp of current detection capabilities. Following these measurements, Arnone et al. (2014) introduced a parameterization scheme into the Whole Atmosphere Community Climate Model (WACCM) to explore how sprites influence the chemistry of the mesosphere. They incorporated the injection of sprite-generated NOx based on the latest findings from sprite streamer modelling, simulating a global rate of 2–3 sprites per minute. Their study encompassed both summer and winter conditions, involving simulations covering 40 d each. Their results revealed an elevation of 0.015–0.15 ppbv of the NOx mixing ratio at 70 km altitude in tropical regions, although this effect became insignificant on a global scale. Furthermore, they identified a potential localized increase of up to tens of percent in the NOx mixing ratio within the altitude range of 60 to 85 km. This increase, while potentially detectable by current instruments like MIPAS, remains a localized phenomenon. Sentman et al. (2003) reported that sprites produce no distinctive OH emissions at the 2 % background brightness level, indicating an upper estimate in the perturbation of OH by sprites. Recently, Yamada et al. (2020) documented a notable increase in the HO2 mixing ratio in three regions following the incidence of sprites. They used limb spectral measurements reported by the Submillimeter-Wave Limb-Emission Sounder (SMILES) and estimated that a single sprite could produce up to 1 × 1025 molecules of HO2 between 75 and 80 km altitude, which is considerably larger than the production of 1 × 10²⁰ molecules of HO2 estimated by Winkler et al. (2021). An injection of 1 × 1025 molecules of HO2 per sprite implies that sprites could represent up to 1 % of the global source of nighttime background HO2 in the upper mesosphere. Nevertheless, there remains uncertainty regarding whether measurements of sprite chemical activity (Yamada et al., 2020) might be influenced, either partially or entirely, by the chemical production of lightning-induced electron precipitation in the mesosphere (Xu et al., 2021).
In this study, we present the first parameterization of sprites based on the proxy meteorological parameter vertical velocity at the 450 hPa level for sprite activity. We implement this parameterization in the Modular Earth Submodel System (MESSy) for usage within the ECHAM/MESSy Atmospheric Chemistry (EMAC) model (Jöckel et al., 2010, 2016). The parameterization of sprites is based on the parameterization of the occurrence rate of long-continuing-current (LCC) lightning developed by Pérez-Invernón et al. (2022), enabling us to investigate the global seasonal variability in the occurrence of sprites, as well as their sensitivity to climate change. In addition, we introduce in the parameterization the injection of NOx, N2O, and HO2 by sprites, as well as the direct depletion of O3, between 45 and 80 km altitude by using the modelling results of Pérez-Invernón et al. (2020), Winkler et al. (2021), and Malagón-Romero et al. (2023). In turn, we compare the simulated NO2 mixing ratio resulting from model simulations of sprites with the nighttime positive anomalies in the NO2 mixing ratio reported by MIPAS above thunderstorms (Arnone et al., 2014; Arnone and Dinelli, 2016) to assess the potential influence of sprites on these measurements.
2.1 The EMAC model
The numerical chemistry–climate model EMAC couples ECHAM5 (Roeckner et al., 2006) with the MESSy framework to connect various multi-institutional computer codes, referred to as MESSy submodels (Jöckel et al., 2010, 2016). The submodels are employed to depict processes within the troposphere and middle atmosphere, as well as their interactions with oceans, land, and external factors originating from anthropogenic emissions.
The model is operated with a triangular truncation of the spectral resolution at wave number 42, corresponding to a quadratic Gaussian grid with a resolution of 2.8° in both latitude and longitude. It comprises 90 vertical levels, extending up to the 0.01 hPa pressure level, and employs a time step length of 720 s, as described by Jöckel et al. (2016) for the T42L90MA resolution. Additionally, the Tiedtke–Nordeng convection scheme (Tiedtke, 1989; Nordeng, 1994) implemented within the CONVECT submodel is utilized.
The LNOX submodel of MESSy is used to calculate the occurrence rate of sprite-triggering LCC lightning flashes. The LNOX submodel calculates the total lightning flash frequency, the LCC lightning flash frequency, and the production of NOx by lightning from several lightning parameterizations selected by the user (Tost et al., 2007) and by fixing a scaling factor that results in a lightning occurrence rate of ∼ 45 flashes per second globally (Christian et al., 2003; Cecil et al., 2014). For the present study, we used the parameterization of lightning flashes producing the best comparison between the simulated and the observed LCC lightning flash density (Bitzer, 2017), i.e. the lightning parameterization based on the cloud top height (CTH) by Price and Rind (1992) for land, combined with a parameterization of lightning that used the updraft strength at 440 hPa pressure level (Allen and Pickering, 2002) for the ocean, with a global scaling factor of 1.13 (Pérez-Invernón et al., 2022). The submodel LNOX calculates the occurrence rate of LCC flashes with a continuing current longer than 18 ms (LCC (> 18 ms) lightning) from the updraught mass flux by employing the parameterization for the ratio of LCC to total lightning, as developed by Pérez-Invernón et al. (2022).
2.2 Parameterization of sprites
A new submodel named SPRITES is developed to include the parameterization of sprites in MESSy v2.55.2 (MESSy Consortium, 2021) and will be implemented in the submodel LNOX in future versions of MESSy. The submodel SPRITES calculates the sprite density and the production of NO, NO2, N2O, and HO2 and, in turn, the depletion of O3 by sprites between 45 and 75 km altitude.
2.2.1 Sprite occurrence
The occurrence rate of sprites in the submodel SPRITES is implemented by using the calculation of lightning density from the LNOX submodel. Sprites are generated by the charge moment change resulting from lightning, along with the duration over which the charge moment is attained (Cummer and Füllekrug, 2001). Lightning flashes with continuing currents, such as LCC (> 18 ms) lightning, can induce a substantial charge moment change and a high quasi-electrostatic field in the mesosphere (Gamerota et al., 2011). Consequently, this process can trigger the initiation of sprites (e.g. Pasko et al., 1997; Pasko et al., 2012; Stenbaek-Nielsen et al., 2000). Therefore, we use the LCC (> 18 ms) lightning density computed by the LNOX submodel of MESSy (Tost et al., 2007; Pérez-Invernón et al., 2022) based on the vertical velocity at the 450 hPa pressure level as a proxy for the occurrence of sprites. In addition, we imposed the limitation that nighttime sprites can only be produced after sunset, when the sun is below the horizon. The absence of solar radiation during the nighttime contributes to reducing the ionization of the lower ionosphere and, in turn, favours the electric breakdown of the air that triggers the inception of sprites (Pérez-Invernón et al., 2016). Finally, we imposed the limitation that only 20 % of the nighttime LCC (> 18 ms) lightning flashes have the potential to trigger sprites, following the ELF measurements of lightning with continuing current reported by Füllekrug and Constable (2000). Arnone et al. (2014) estimated that about 1/1000 flashes could produce a sprite, while Pérez-Invernón et al. (2022) found that 7.4 out of 1000 flashes reported by LIS over 1 year have a continuing current lasting more than 18 ms. Therefore, the approximation of 1 sprite per 20 % of nighttime LCC (> 18 ms) lightning flashes is of the same order as the 1/1000 sprite-to-flash estimate by Arnone et al. (2014). The assumed 20 % is an upper limit as Füllekrug and Constable (2000) reported that between 5 % and 20 % of the measured lightning flashes had the potential to produce air electric breakdown at sprite altitude. However, our approach lacks a consideration of sprites triggered by lightning without continuing currents, which may lead to an underestimation of sprite occurrences (Inan et al., 2010). Sprites are generated by the quasi-static removal of a relatively large lateral charge distribution where lightning continuing current is perhaps the most prominent indicator but not necessarily the only mechanism that contributes. It is worth noting that Greenberg et al. (2009) found that approximately 33 % of the 15 sprites analysed in Europe were produced by lightning strikes unaccompanied by associated ELF transients. Similarly, Lu et al. (2017) reported that 15 % of the 247 recorded sprites in North America were the result of negative cloud-to-ground flashes without detectable continuing currents.
Winkler et al., 2021Yamada et al., 2020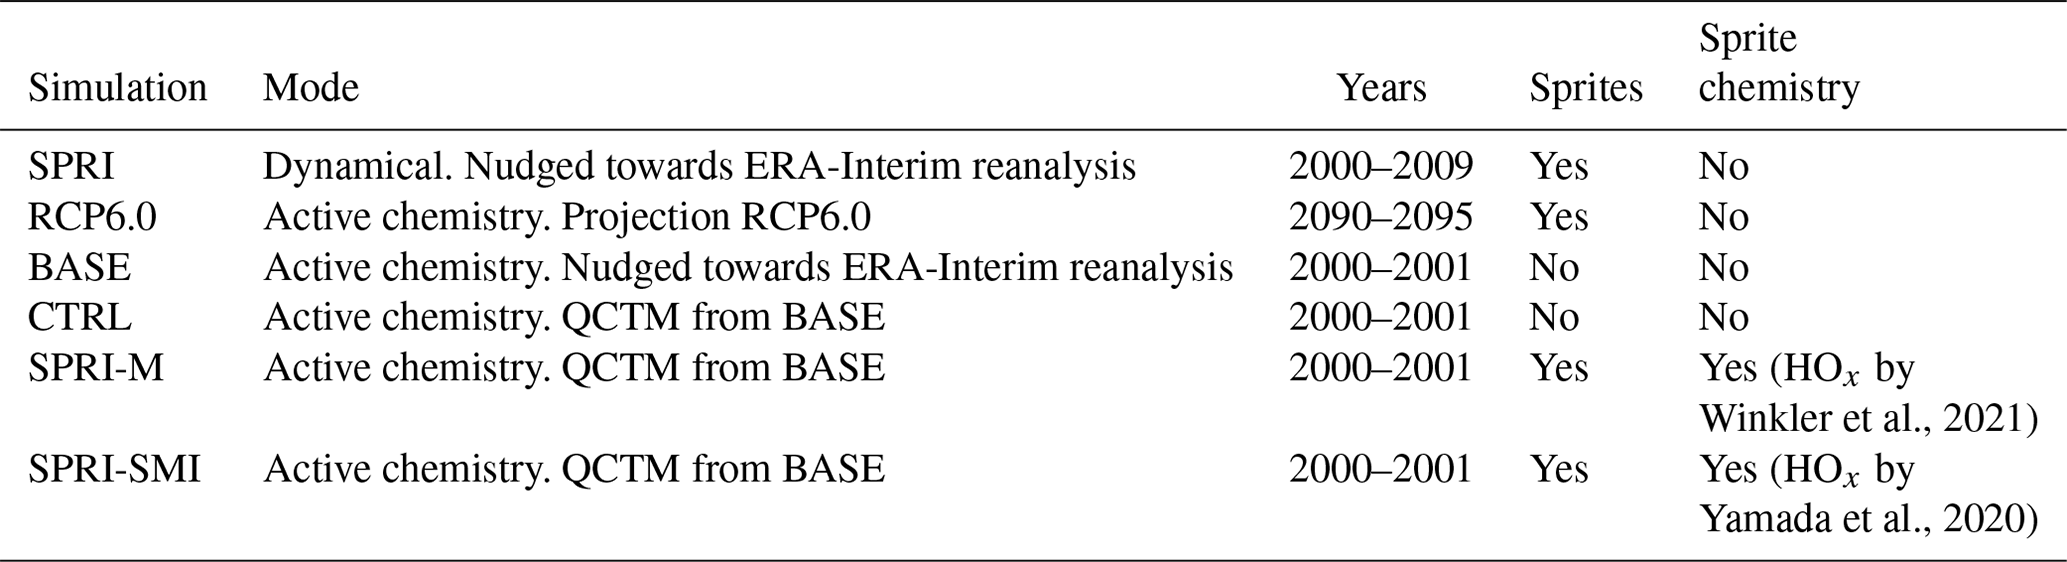
2.2.2 Chemical influence of sprites
The submodel SPRITES introduces the chemical influence of sprites in the mesosphere by multiplying the calculated sprite density and the production and/or destruction of chemical species by single sprites. The HO2 molecules produced by sprites are homogeneously distributed between 70 and 75 km altitude. The submodel's name list allows the user to choose a total injection of 1 × 10²⁰ or 1 × 1025 molecules of HO2 per sprite based on modelling results (Winkler et al., 2021) and measurements (Yamada et al., 2020), respectively.
The injection of NO, NO2, and N2O molecules and the direct depletion of O3 molecules implemented in the SPRITE submodel are based on modelling results of single sprite streamers in the mesosphere–lower thermosphere (67–75 km) and in the lower mesosphere (49.75–50 km) by Pérez-Invernón et al. (2020) and Malagón-Romero et al. (2023), respectively. The production of chemical species by sprites between the altitude ranges of 45 to 49.75 km and 50 to 67 km is estimated by following the approach developed by Malagón-Romero et al. (2023), i.e. by interpolating and extrapolating from the results by Pérez-Invernón et al. (2020) and Malagón-Romero et al. (2023). In particular, we estimate the production per metre of NO, NO2, and N2O molecules, as well as the depletion per metre of O3 molecules, in the altitude ranges of 49.75 to 50 km and 67 to 75 km. Subsequently, we extrapolate the production or removal of molecules from 45 to 49.75 km and interpolate the production or removal of molecules from 50 to 75 km. Following this approach, Malagón-Romero et al. (2023) obtained 6.2 × 10²⁰ NO molecules, 2.6 × 10¹⁹ NO2 molecules, and 1.7 × 10²⁰ N2O molecules injected by a single sprite streamer in the altitude range of 45 to 75 km, while they reported a removal of 3.1 × 10²³ O3 molecules. In addition, we apply a conversion factor between the chemical injection by a single sprite streamer and that by a complete sprite in EMAC. While ELF radio measurements suggest the presence of over 1000 streamers per individual sprite (Qin et al., 2012), it is important to recognize that the characteristics and production of chemical species within streamers can be heterogeneous (Stenbaek-Nielsen et al., 2013). Consequently, multiplying the injection of chemical species per streamer by the total number of streamers may lead to inaccuracies. To address this, we conduct a comparison between the simulated and observed total number of photons, allowing us to estimate the production of chemical species by observed sprites based on simulation results. Pérez-Invernón et al. (2020) reported a scaling factor ranging between 18 and 50 based on observed sprites. We have updated the estimation of this scaling factor by using recent detections of sprites by the Atmosphere-Space Interactions Monitor (ASIM). Gomez Kuri (2021) reported the detection of a sprite on 10 July 2019 by combining optical ASIM and ELF measurements from ground-based sensors. We have integrated the optical signal detected by ASIM in the wavelength range of 180 to 230 nm (ASIM photometer 2) during the 0.85 ms after the onset of the first and second peaks associated with the sprite event at the times 21:53:17.554 and 21:53:17.563 Gomez Kuri (2021, Fig. 4.16), obtaining observed photometric fluxes of 1 × 10⁻¹⁰ and 1.1 × 10⁻¹⁰ J m−2, respectively. The synthetic flux of the streamer simulated by Pérez-Invernón et al. (2020) that would be observed by ASIM during 0.85 ms in the wavelength range of 180 to 230 nm is 1 × 10⁻¹² J m−2. Therefore, we can assume that a complete sprite emits about 100 times more photons than the simulated single sprite streamer. Therefore, we used a factor of 100 to convert the simulated injection of molecules by a single sprite streamer into the injection of molecules by a complete sprite.
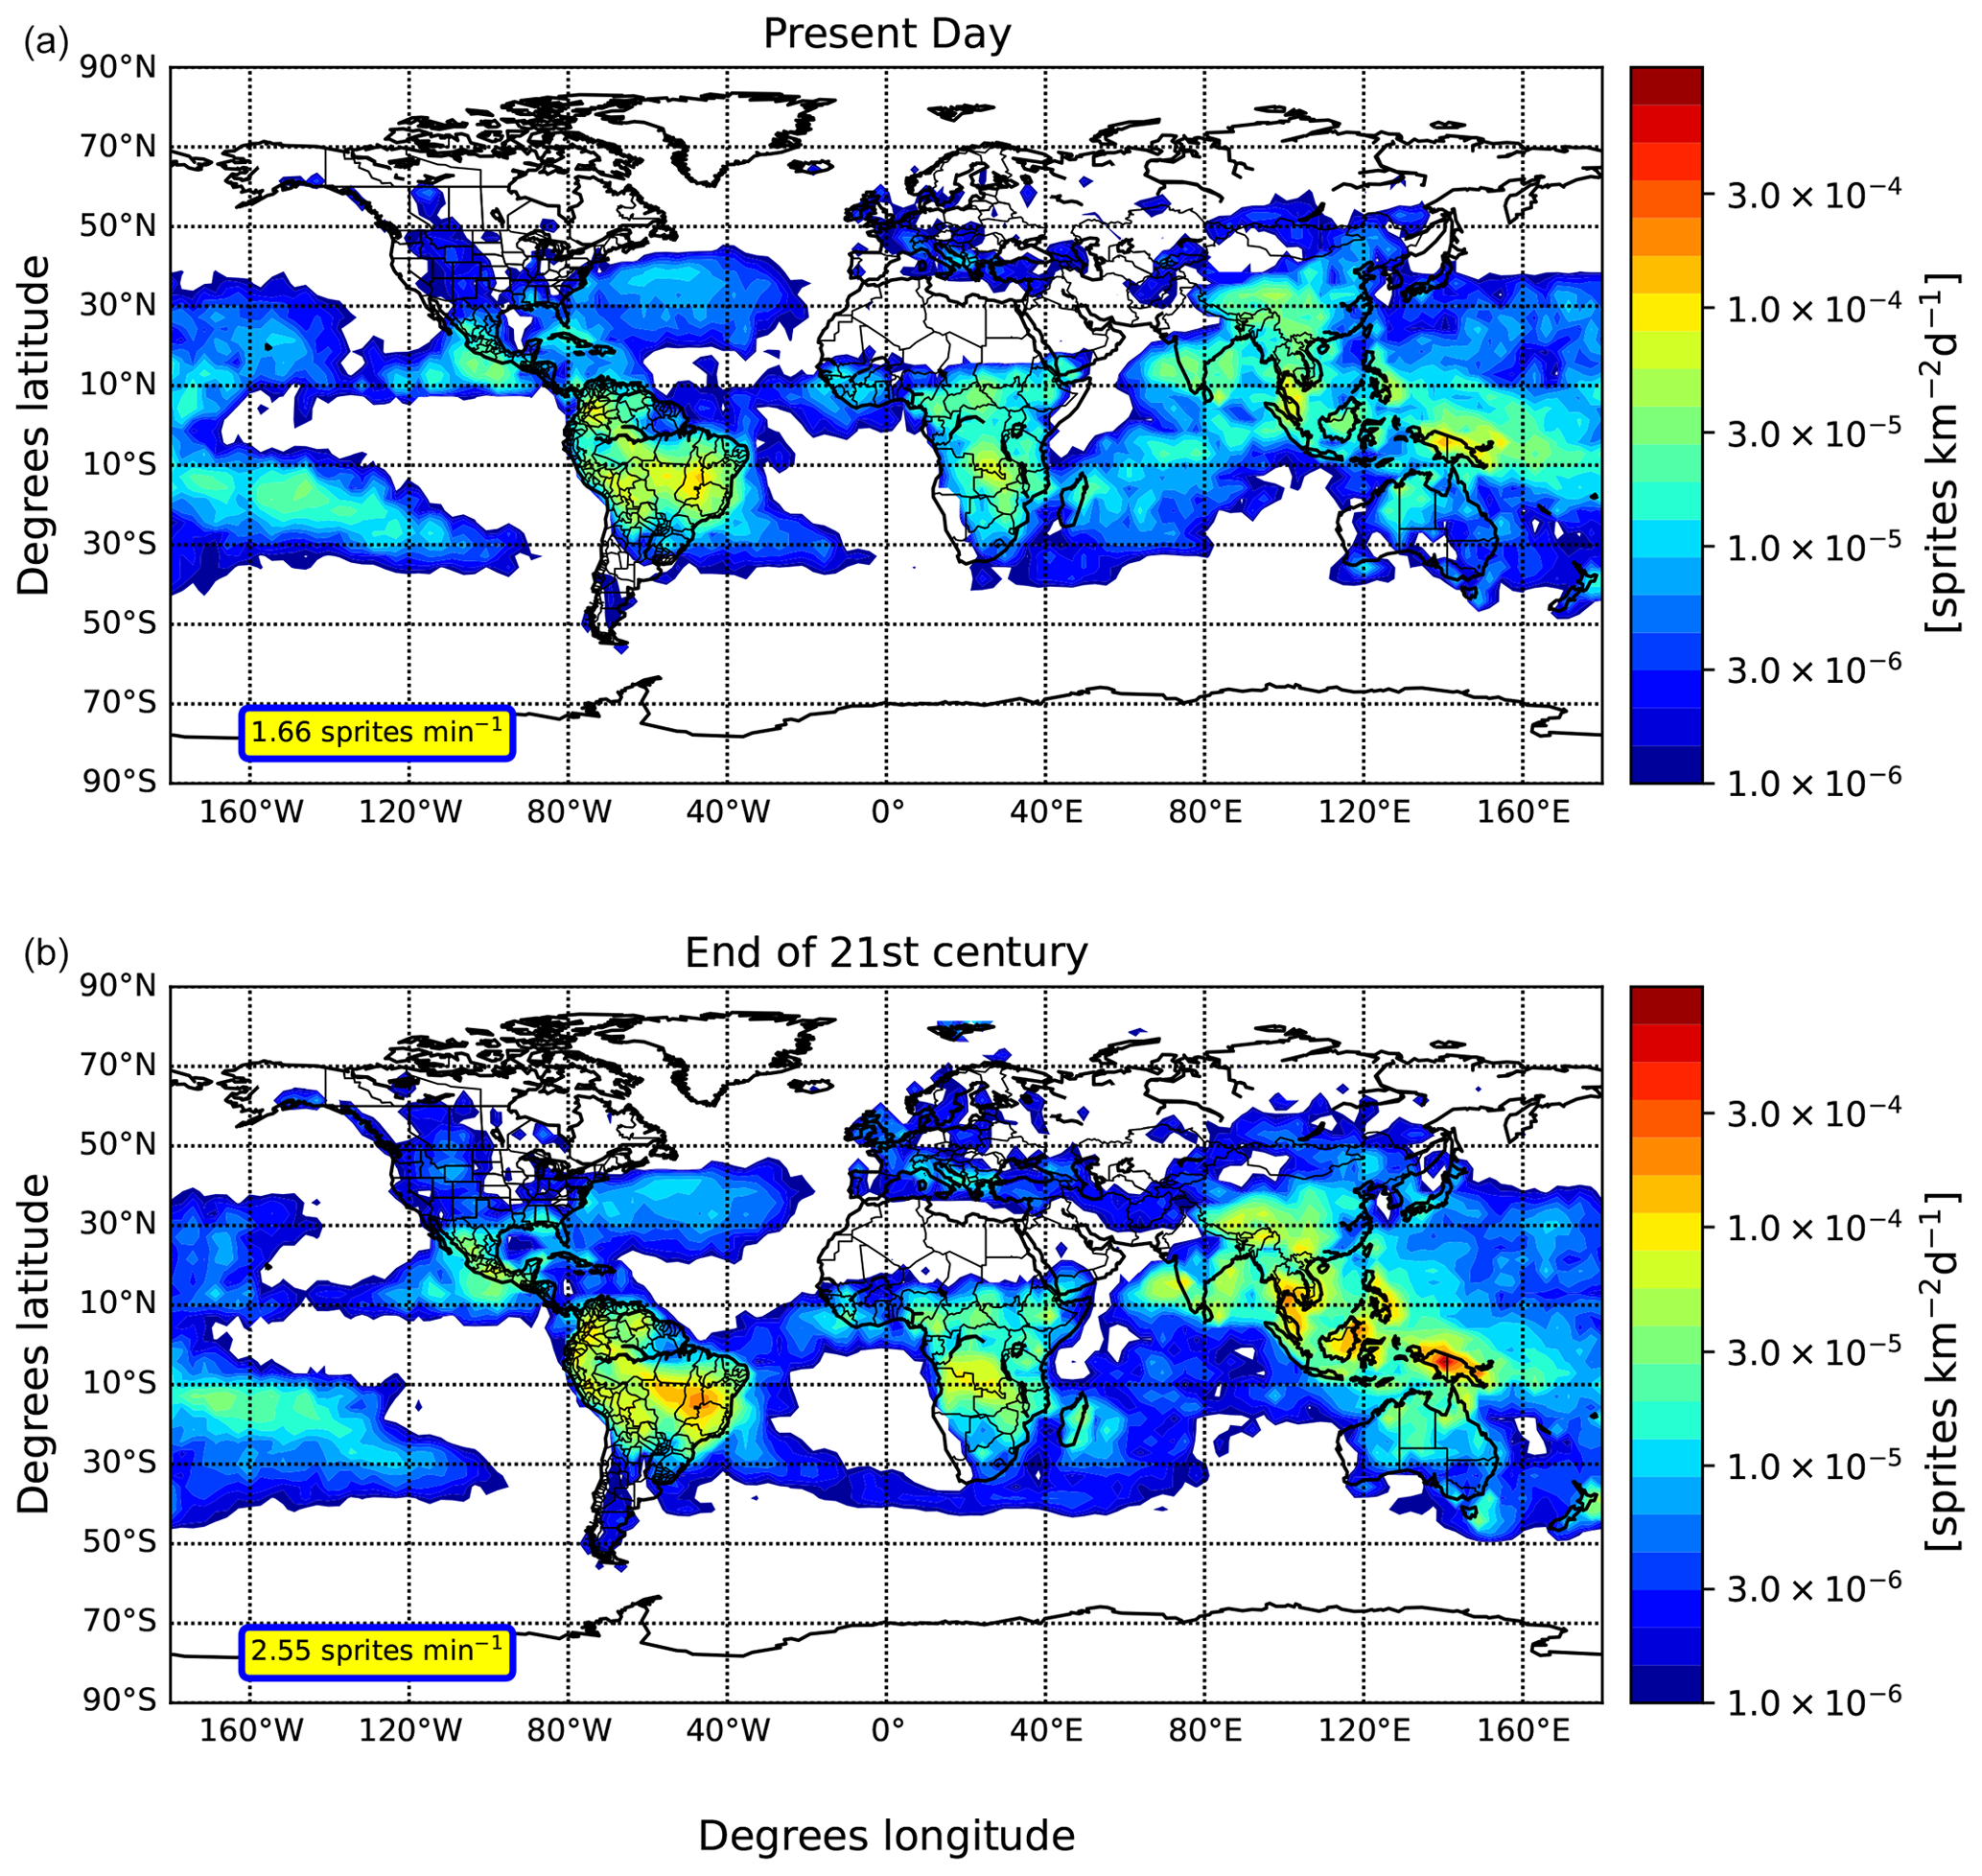
Figure 1Simulated annually averaged sprite density in sprites per squared kilometre and day during 2001–2009 from the SPRI simulation (a) and during 2091–2095 from the RCP6.0 simulation (b). We annotate in boxes the annually averaged occurrence rate of sprites per minute.
2.3 Simulation set-up
Table 1 shows the overview of the performed simulations. Firstly, a purely dynamical simulation (SPRI) covering the present-day climatic state is performed during the period 2000–2009 by nudging the model towards ERA-Interim reanalysis meteorological fields (Dee et al., 2011) to evaluate the sprite frequency parameterization. A projection simulation (RCP6.0) covering the years 2090–2095 is performed under Representative Concentration Pathway 6.0 (RCP6.0) in order to evaluate the sensitivity of sprites under climate change. We consider the years 2000 and 2090 as the spin-up phases. The RCP6.0 simulation is established following the simulation RC2-base-04 of Jöckel et al. (2016) and Pérez-Invernón et al. (2023). The sea surface temperatures (SSTs) and the sea-ice concentrations (SICs) are prescribed from simulations with the Hadley Centre Global Environment Model version 2 – Earth System (HadGEM2-ES) model (Collins et al., 2011; The HadGEM2 Development Team, 2011). Projected greenhouse gases and SF6 mixing ratios are taken from Eyring et al. (2013). Anthropogenic emissions are taken from monthly values provided by Fujino et al. (2006) for the RCP6.0 scenario. The chemical influence of sprites in the atmosphere has been deactivated in this simulation in order to avoid unexpected perturbations in the chemistry. We refer to Jöckel et al. (2016) for more details about the simulation set-up. Pérez-Invernón et al. (2023) obtained a temperature increase of 4 K between the present day and 2091–2095 using the same set-up.
In turn, a set of simulations with active chemistry are performed to evaluate the chemical role of sprites in the atmosphere in the Quasi Chemistry-Transport Model (QCTM) mode proposed by Deckert et al. (2011) to ensure that small chemical perturbations do not alter the simulated meteorology by introducing noise. Firstly, a 2-year simulation nudged towards ERA-Interim reanalysis meteorological fields (Dee et al., 2011; ECMWF, 2011) and without sprites is performed (BASE). The simulation is set up following the simulation with interactive chemistry (RC1SD-base-07) of Jöckel et al. (2016). The sea surface temperatures (SSTs) and the sea-ice concentrations (SICs) from ERA-Interim reanalysis data are used (Dee et al., 2011). The chemical kinetics are simulated by using the submodel MECCA (Module Efficiently Calculating the Chemistry of the Atmosphere) by Sander et al. (2019). Next, we conduct a present-time simulation in the QCTM mode, featuring active chemistry but excluding sprites (CTRL). This simulation is generated utilizing inputs for radiation calculations and methane oxidation from the BASE simulation. This approach allows us to separate dynamics from chemistry while maintaining consistent meteorological conditions, effectively suppressing meteorological variability. Lastly, we perform two additional present-day simulations, both in the QCTM mode and incorporating sprites. These simulations are denoted as SPRI-M and SPRI-SMI. In the SPRI-M simulation we have used modelling results of single sprite streamers (Pérez-Invernón et al., 2020; Malagón-Romero et al., 2023) to set the injection chemical species, while in the simulation SPRI-SMI we have modified the injection of HOx in accordance with measurements from SMILES (Yamada et al., 2020) (see Sect. 2.2.2). Comparison of the CTRL, SPRI-M, and SPRI-SMI simulations allows us to determine the chemical role of sprites in the mesosphere. In this set of simulations, we consider the year 2000 as the spin-up phase.
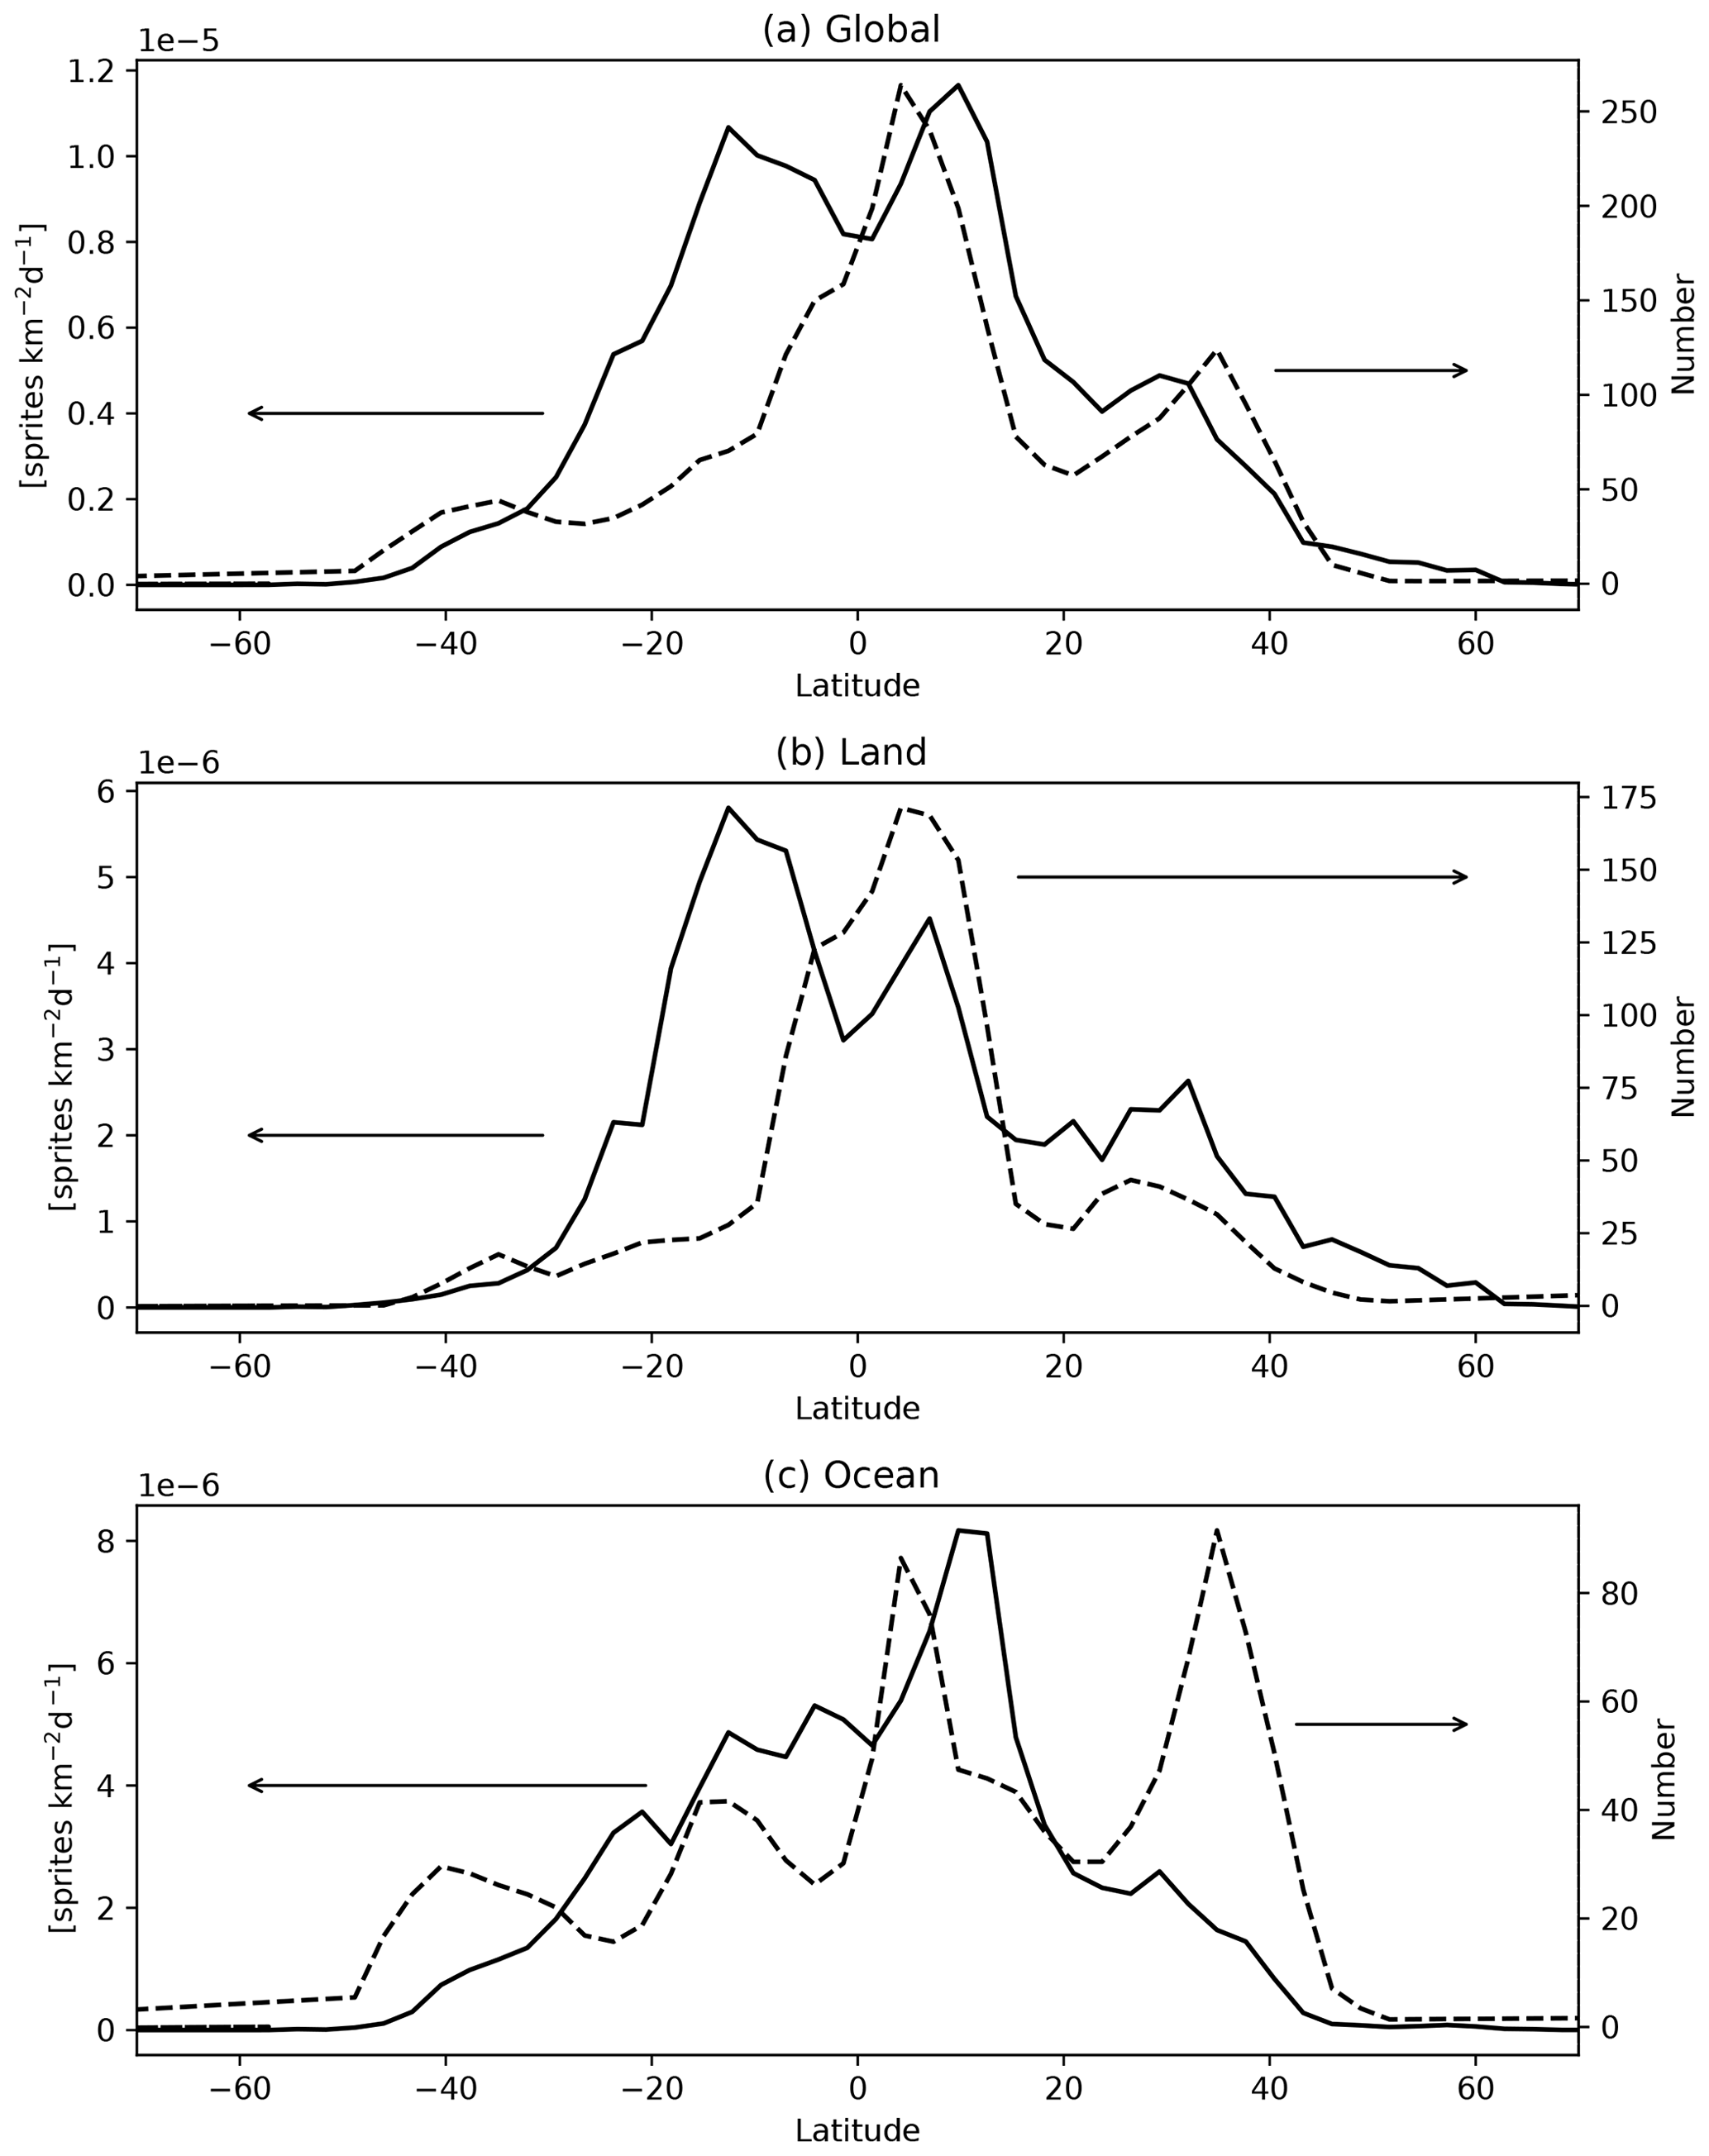
Figure 2The solid lines depict the simulated annual average latitudinal sprite density, measured in sprites per square kilometre per day, spanning the years 2001 to 2009 (SPRI simulation), encompassing both, land, and ocean regions. The dashed lines represent the total number of pure sprites and sprites accompanied by halos observed by ISUAL, as illustrated by Lu et al. (2022, Fig. 2b). The observations have been interpolated to the corresponding latitudes of the simulation results.
Table 2Occurrence rate of lightning and sprites from the simulations SPRI and RCP6.0.
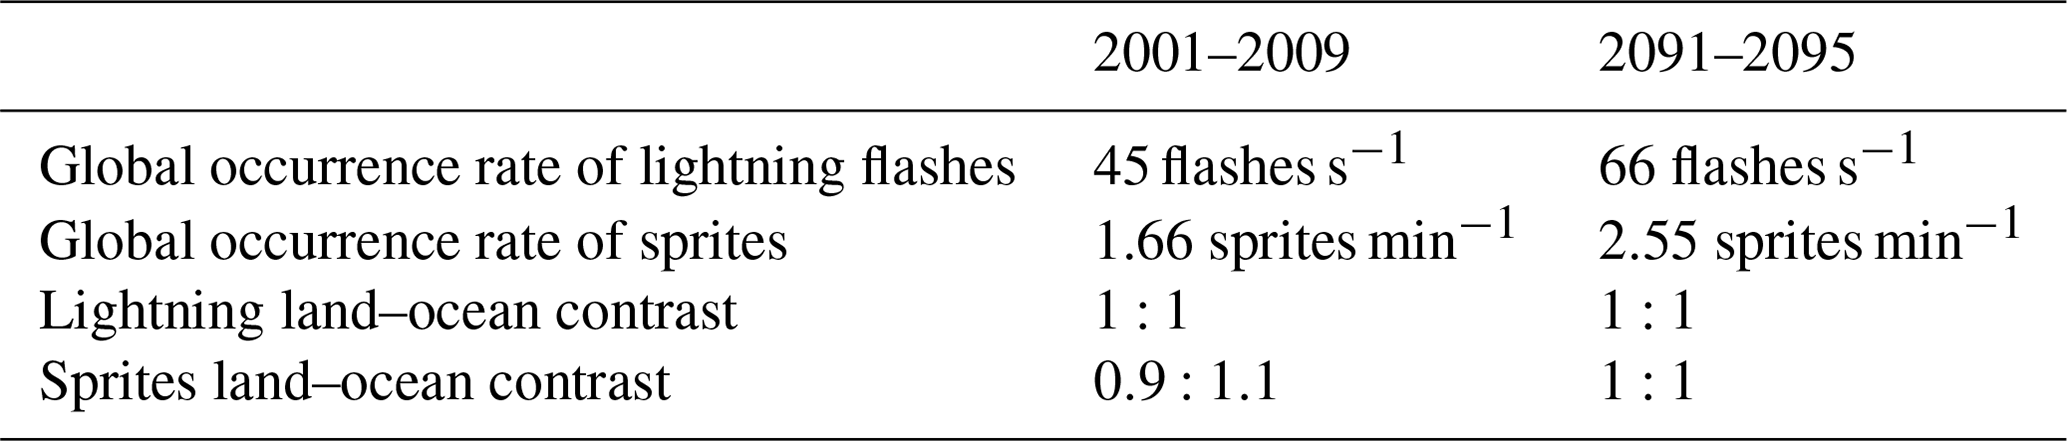
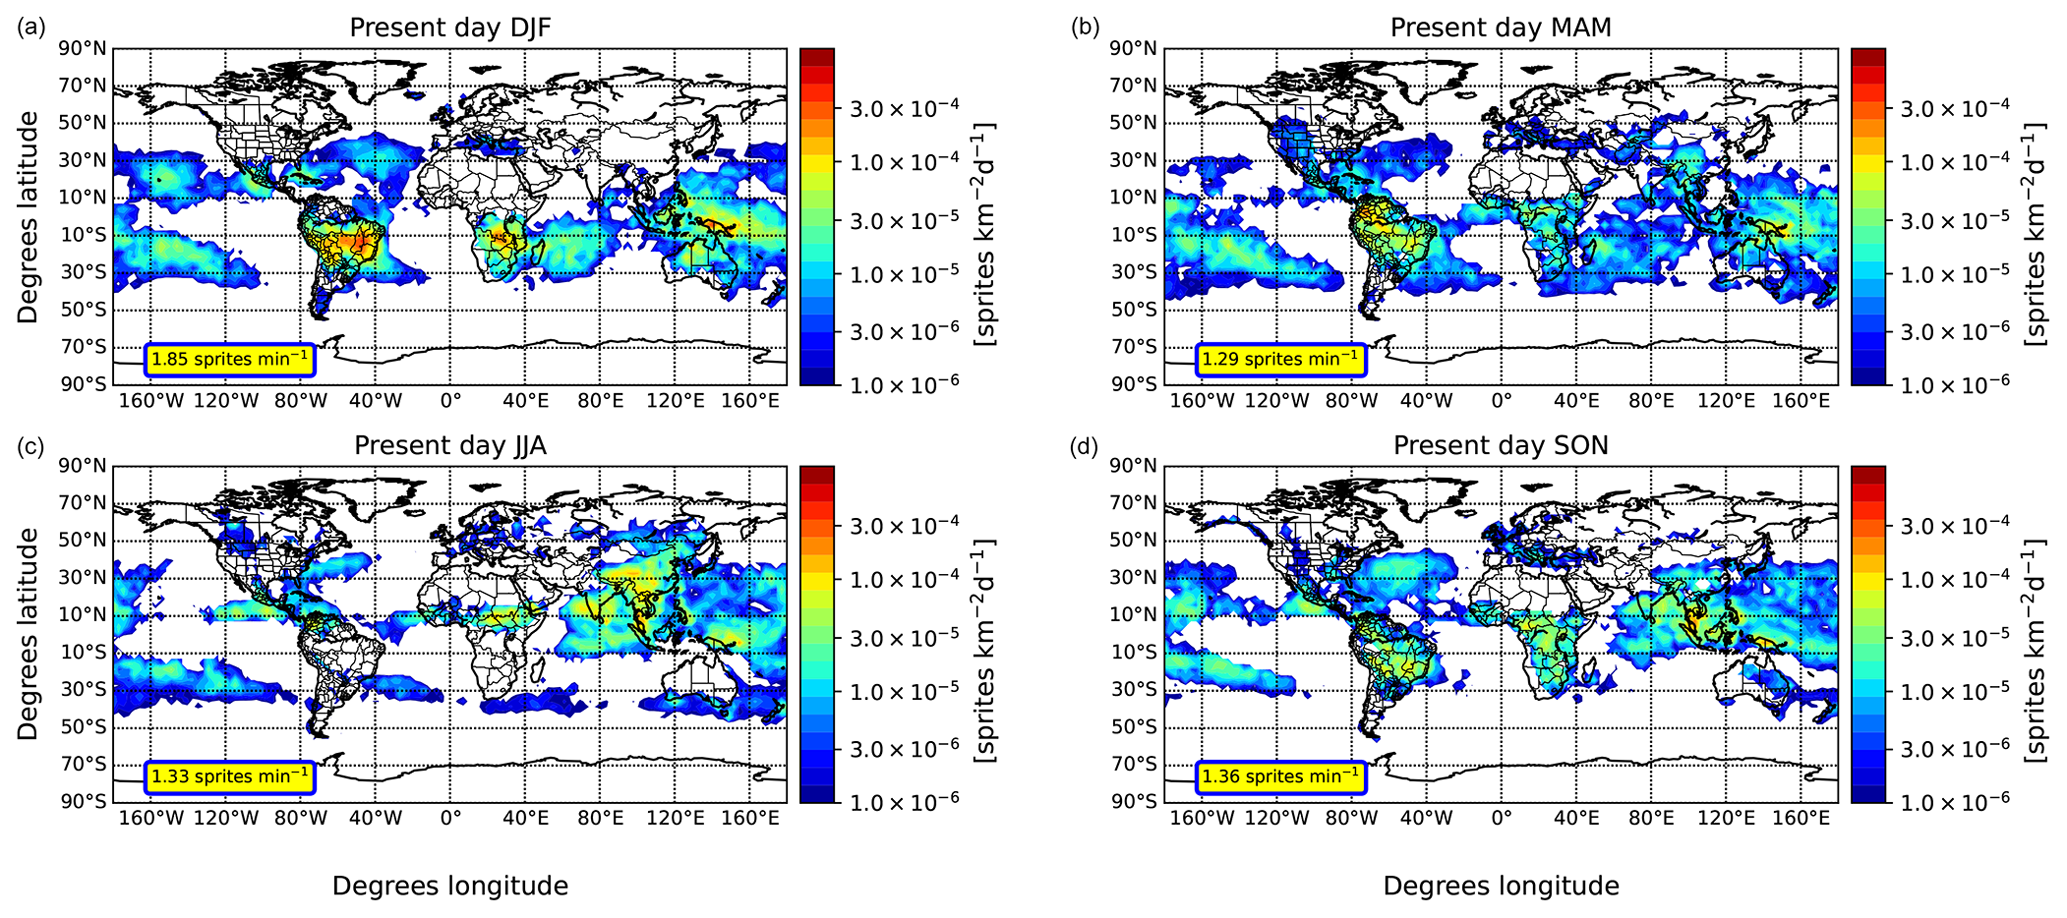
Figure 3Simulated seasonally averaged sprite density in sprites per squared kilometre and day during 2001–2009 from the SPRI simulation. We annotate in boxes the seasonally averaged occurrence rate of sprites per minute.
3.1 Geographical distribution of sprites
Details on the simulated global frequency of sprites and lightning are summarized in Table 2, while the simulated annually averaged sprite densities for the present day and 2091–2095 are shown in Fig. 1. We obtained a global sprite occurrence rate of 1.66 sprites per minute in 2000–2009, which is above the value reported by Chen et al. (2008) (0.5 sprites per minute) and below the value reported by Ignaccolo et al. (2006), ranging between 2 and 3 sprites per minute. In turn, we obtained a global occurrence rate of 2.55 sprites per minute in 2091–2095, which represents an increase of 54 % (14 % increase per 1 K increase in the global temperature between the periods 2091–2095 and 2000–2009). The simulated increase in the global occurrence rate of sprites between the present day and 2091–2095 is approximately similar to the simulated increase in the global occurrence rate of total lightning (47 %).
The simulated latitudinal distribution of sprites has a pronounced peak between 10 and 20° N and another less pronounced peak between 30 and 40° N (see Fig. 2a), in agreement with the climatology reported by Zhang et al. (2022, Fig. 5) and Lu et al. (2022, Fig. 2b) from ISUAL measurements. However, the simulated latitudinal distribution of sprites presents a main peak between 10 and 20° S that was not detected by ISUAL. The disagreement between the observed and the simulated latitudinal distribution of sprites is influenced by the overestimation of simulated sprites over land between 10 and 20° S (Fig. 2b), i.e. in South America and southeastern Asia. In turn, we found a good agreement between the simulated and the observed (Zhang et al., 2022; Lu et al., 2022) latitudinal distribution of sprites over the ocean (Fig. 2c), except for the observed peak near 40° N that is less pronounced in the simulations. We found a sprite land–ocean contrast of 0.9:1.1 and 1:1 for the present day and 2091–2095, respectively. Chen et al. (2008) reported a sprite land–coast–ocean contrast of . The horizontal resolution of our simulations (2.8° × 2.8° quadratic Gaussian grid in latitude and longitude) does not allow us to distinguish between coast and land and coast and ocean. The parameterization of Andrey et al. (2022) produced 41.4 % sprites over land and 58.6 % over ocean, while we obtained 45 % and 55 %, respectively.
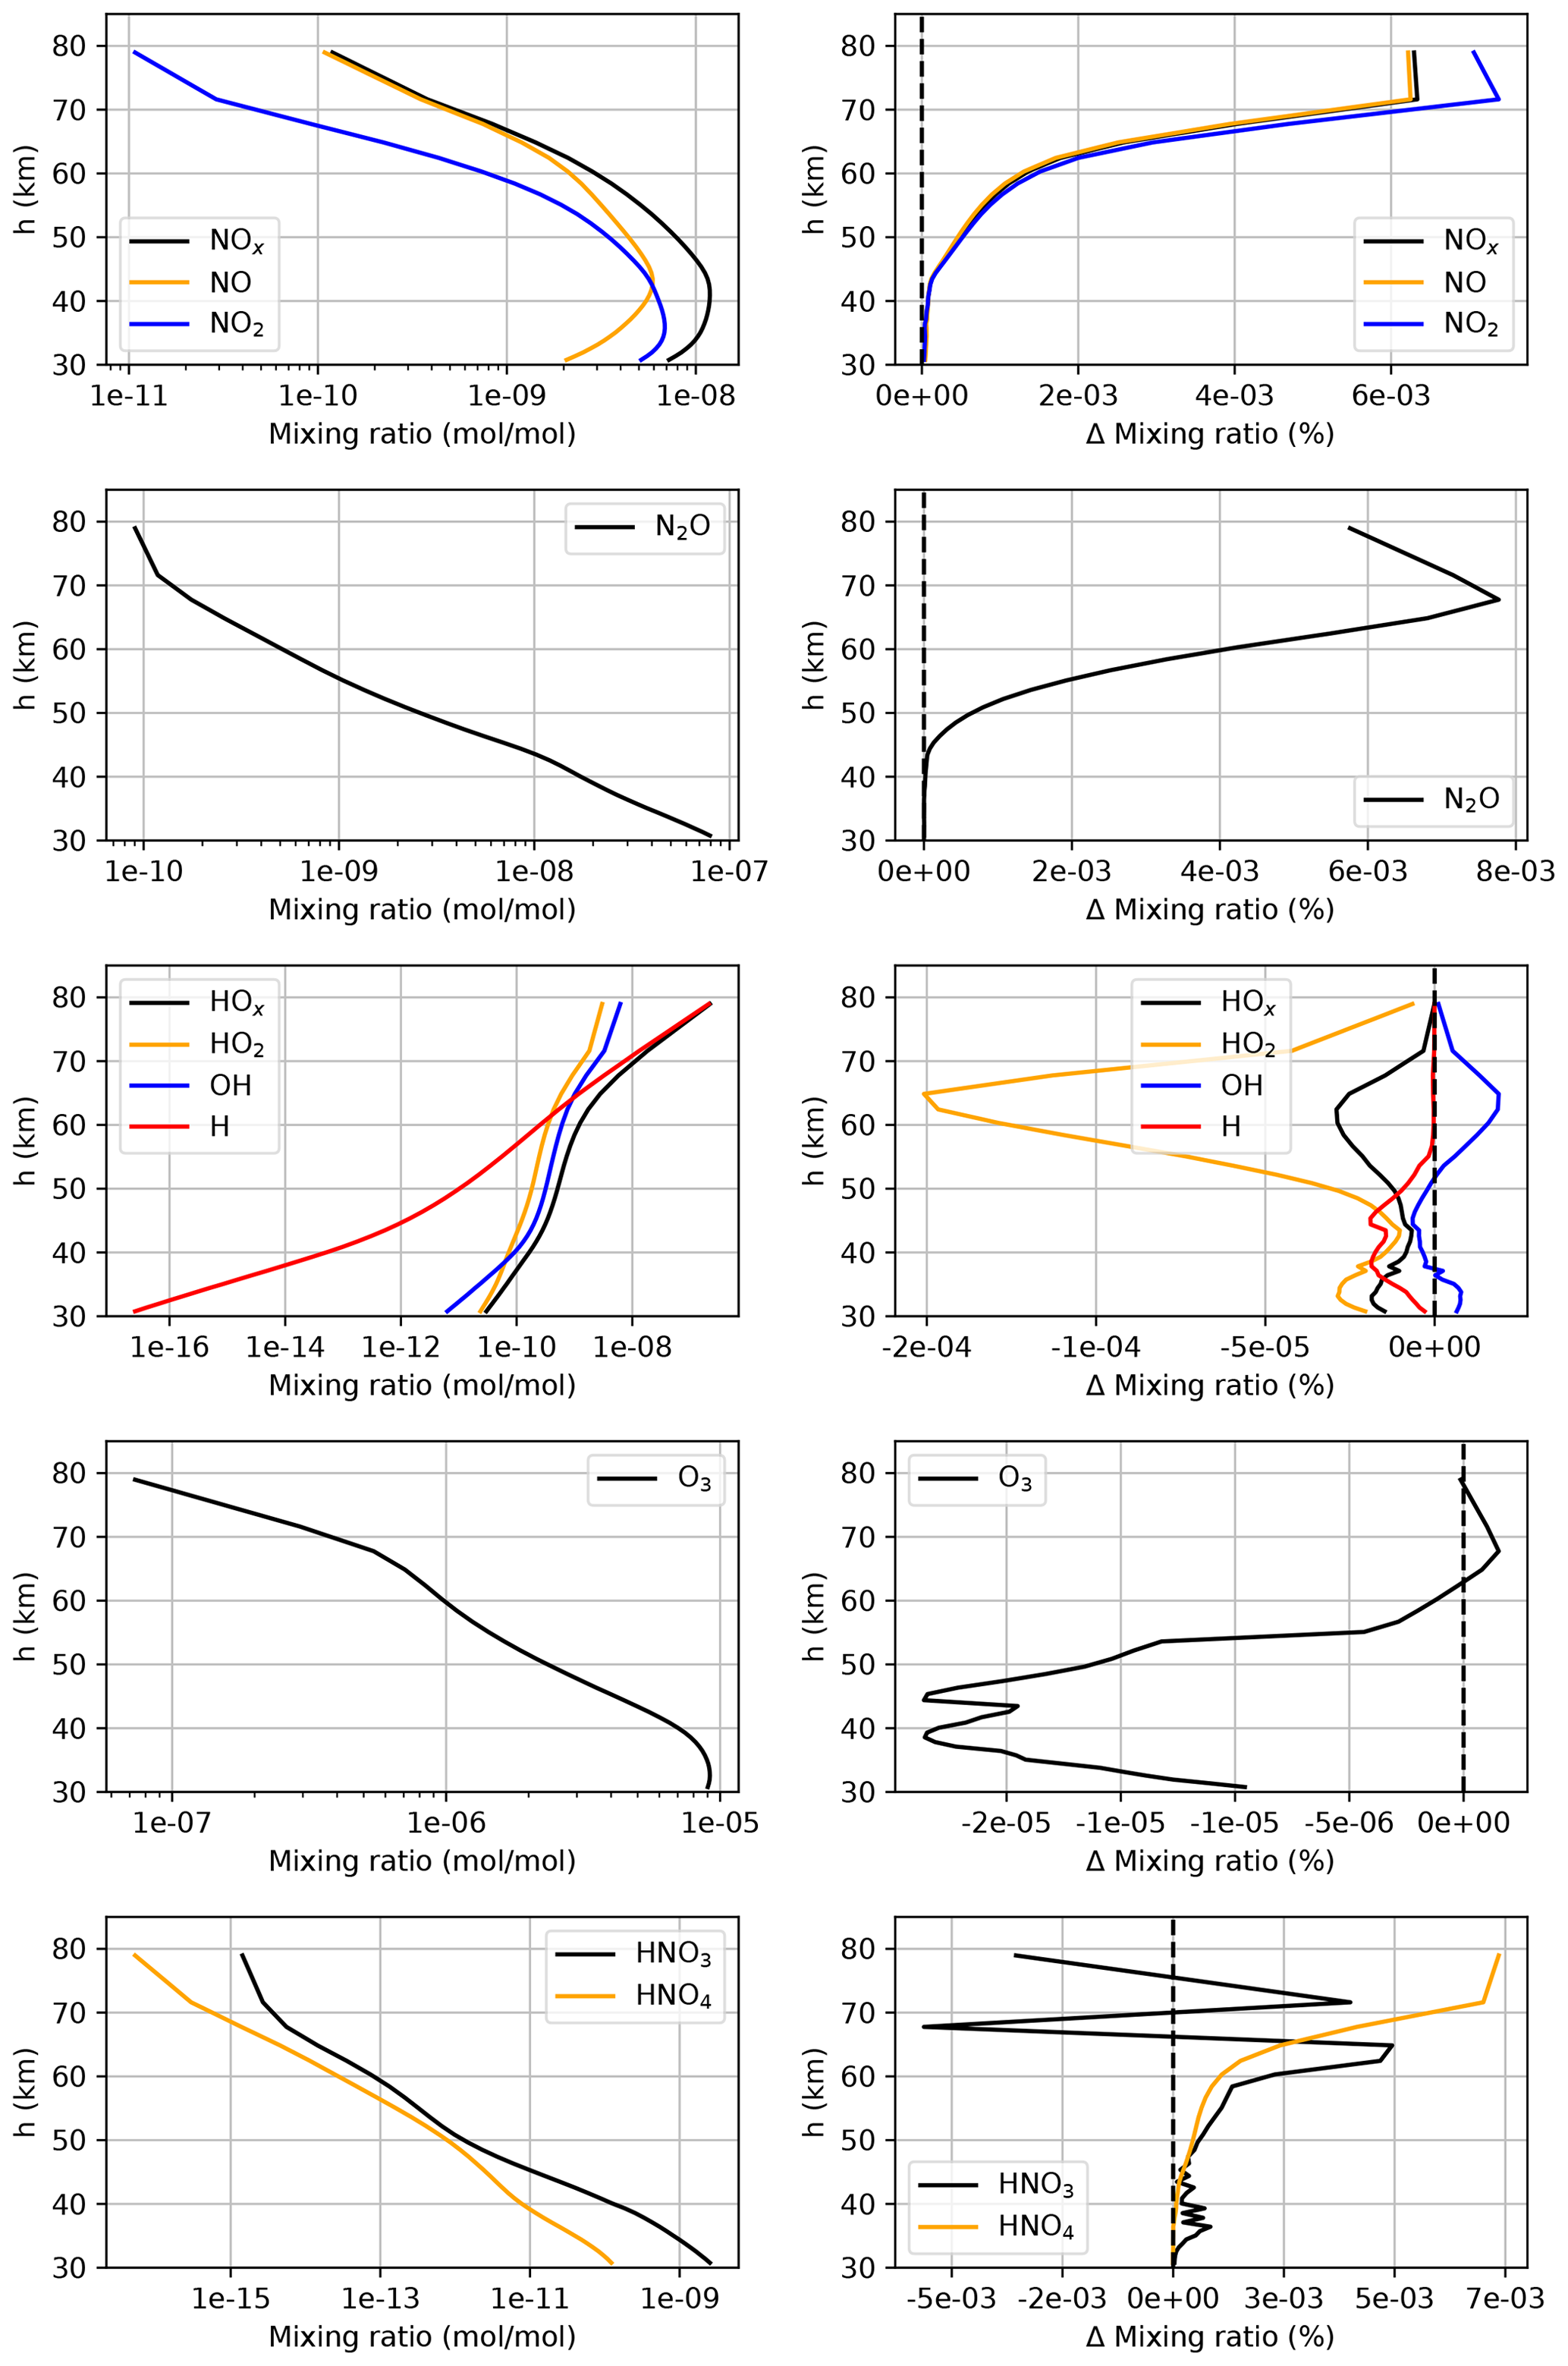
Figure 4First column: annually (2001) and globally averaged vertical profiles of the mixing ratio of NOx, N2O, HOx, O3, HNO3, and HO4 for a simulation without sprites (CTRL). Second column: differences (in %) between the annually and globally averaged mixing ratio of the chemical species between the simulation with sprites (SPRI-M) and without sprites (CTRL). In the simulation with sprites, we have assumed that a single sprite can inject 1 × 10²⁰ HO2 molecules (Winkler et al., 2021).
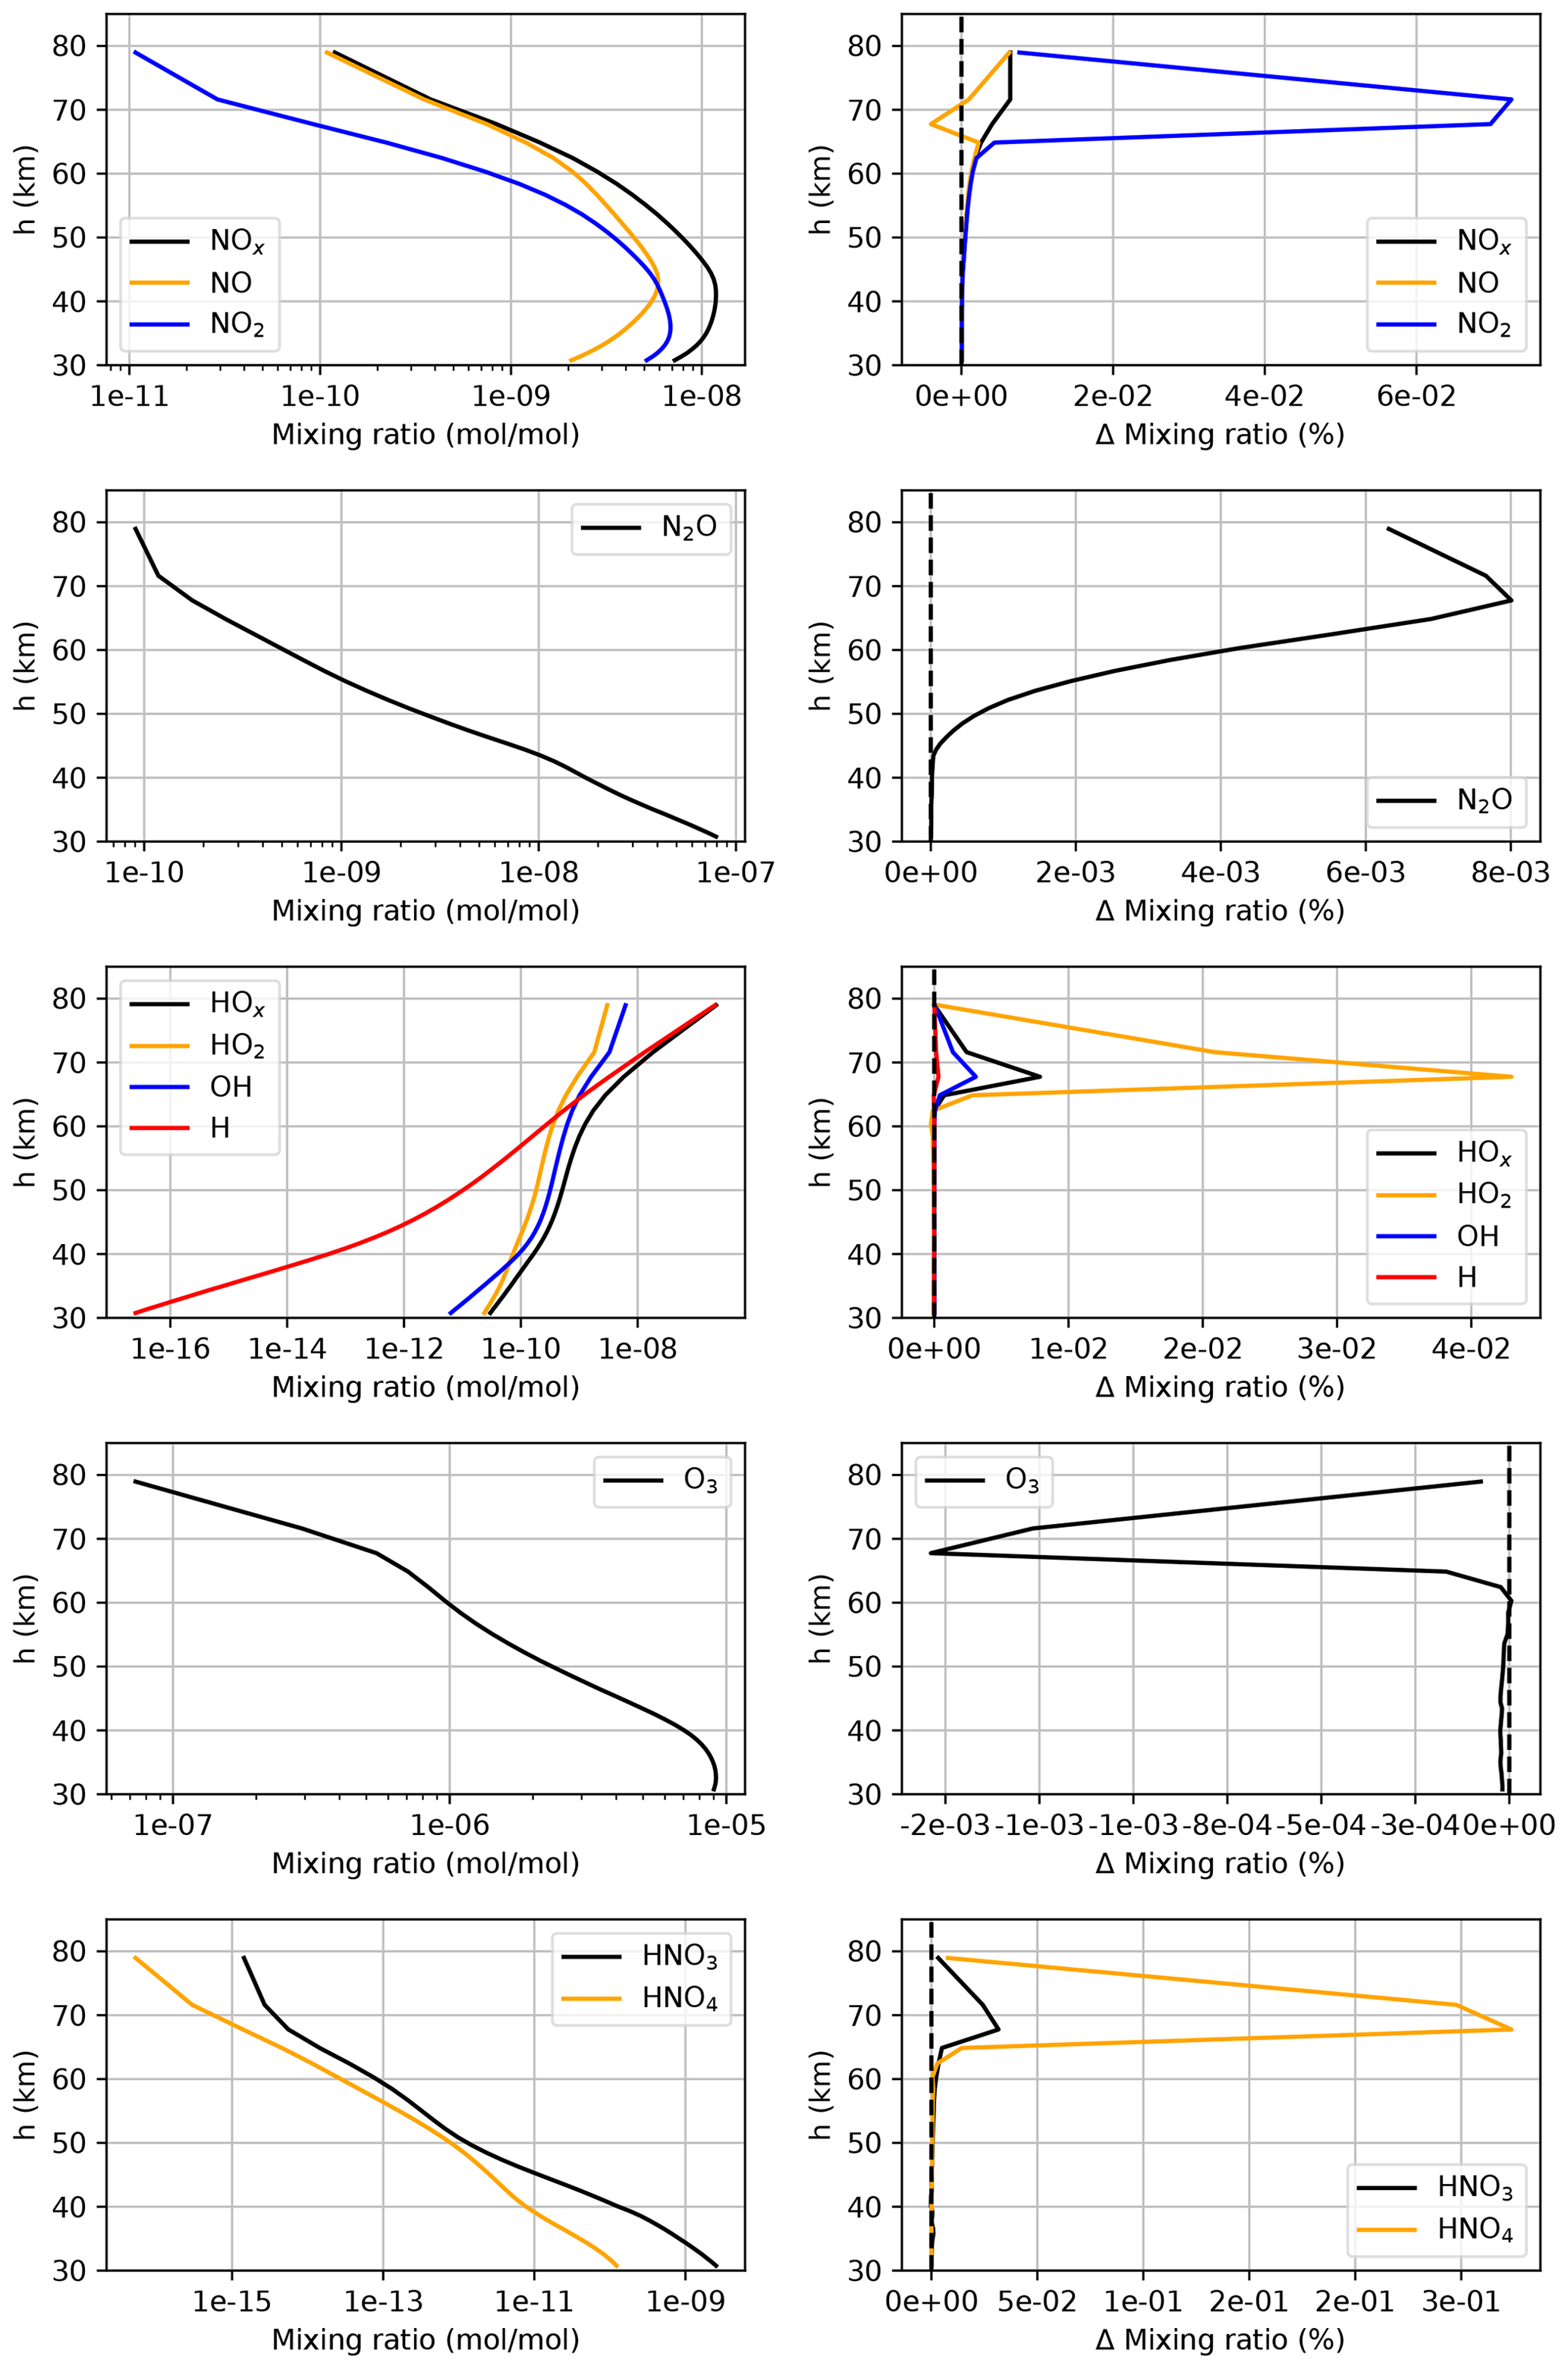
Figure 5Same as Fig. 4 but assuming that a single sprite injects 1 × 1025 HO2 molecules (SPRI-SMI simulation) as reported by Yamada et al. (2020).
The simulated global density of sprites over land in present-day simulations is in fairly good agreement with the observations reported by Chen et al. (2008) and Zhang et al. (2022), showing hotspots in middle Africa, South America, eastern North America, the Tornado Alley of North America, western Europe, and southeastern Asia. The simulation produced an overestimation of the sprite density in Brazil, southern Africa, and China that can be explained by the low accumulative observation time of ISUAL in these regions (Chen et al., 2008). The high occurrence of sprites in the Mediterranean Sea and western Europe is in agreement with the European climatology of sprites reported by Yair et al. (2015) and Arnone et al. (2020). The obtained sprite occurrence in Russia is in agreement with the sprite density derived from WWLLN data by Evtushenko et al. (2024), with the highest occurrence of sprites in the south.
Figure 3 shows the averaged sprite density during the seasons of December–January–February (DJF), March–April–May (MAM), June–July–August (JJA), and September–October–November (SON) during 2000–2009. The maximum occurrence of sprites is reached during summer (DJF in the Southern Hemisphere, JJA in the Northern Hemisphere). During MAM the global density of sprites is shifted towards the Equatorial region and the Southern Hemisphere, while it is equally distributed between both hemispheres in SON. Sato and Fukunishi (2003, Fig. 4) reported the global seasonal distribution of sprites based on ELF measurements for DJF, JJA, and SON. There is a good agreement between the simulated (Fig. 3) and the reported (Sato and Fukunishi, 2003, Fig. 4a) spatial maximum of sprite density in JJA near the Equator and in southeastern Asia, while the present parameterization underestimates the production of sprites in North and South America. In DJF, the simulation is in agreement with the climatology of sprites based on ELF measurements (Sato and Fukunishi, 2003) in all regions except for North America. Finally, we have found a good agreement between the simulations and the ELF-based climatology during SON.
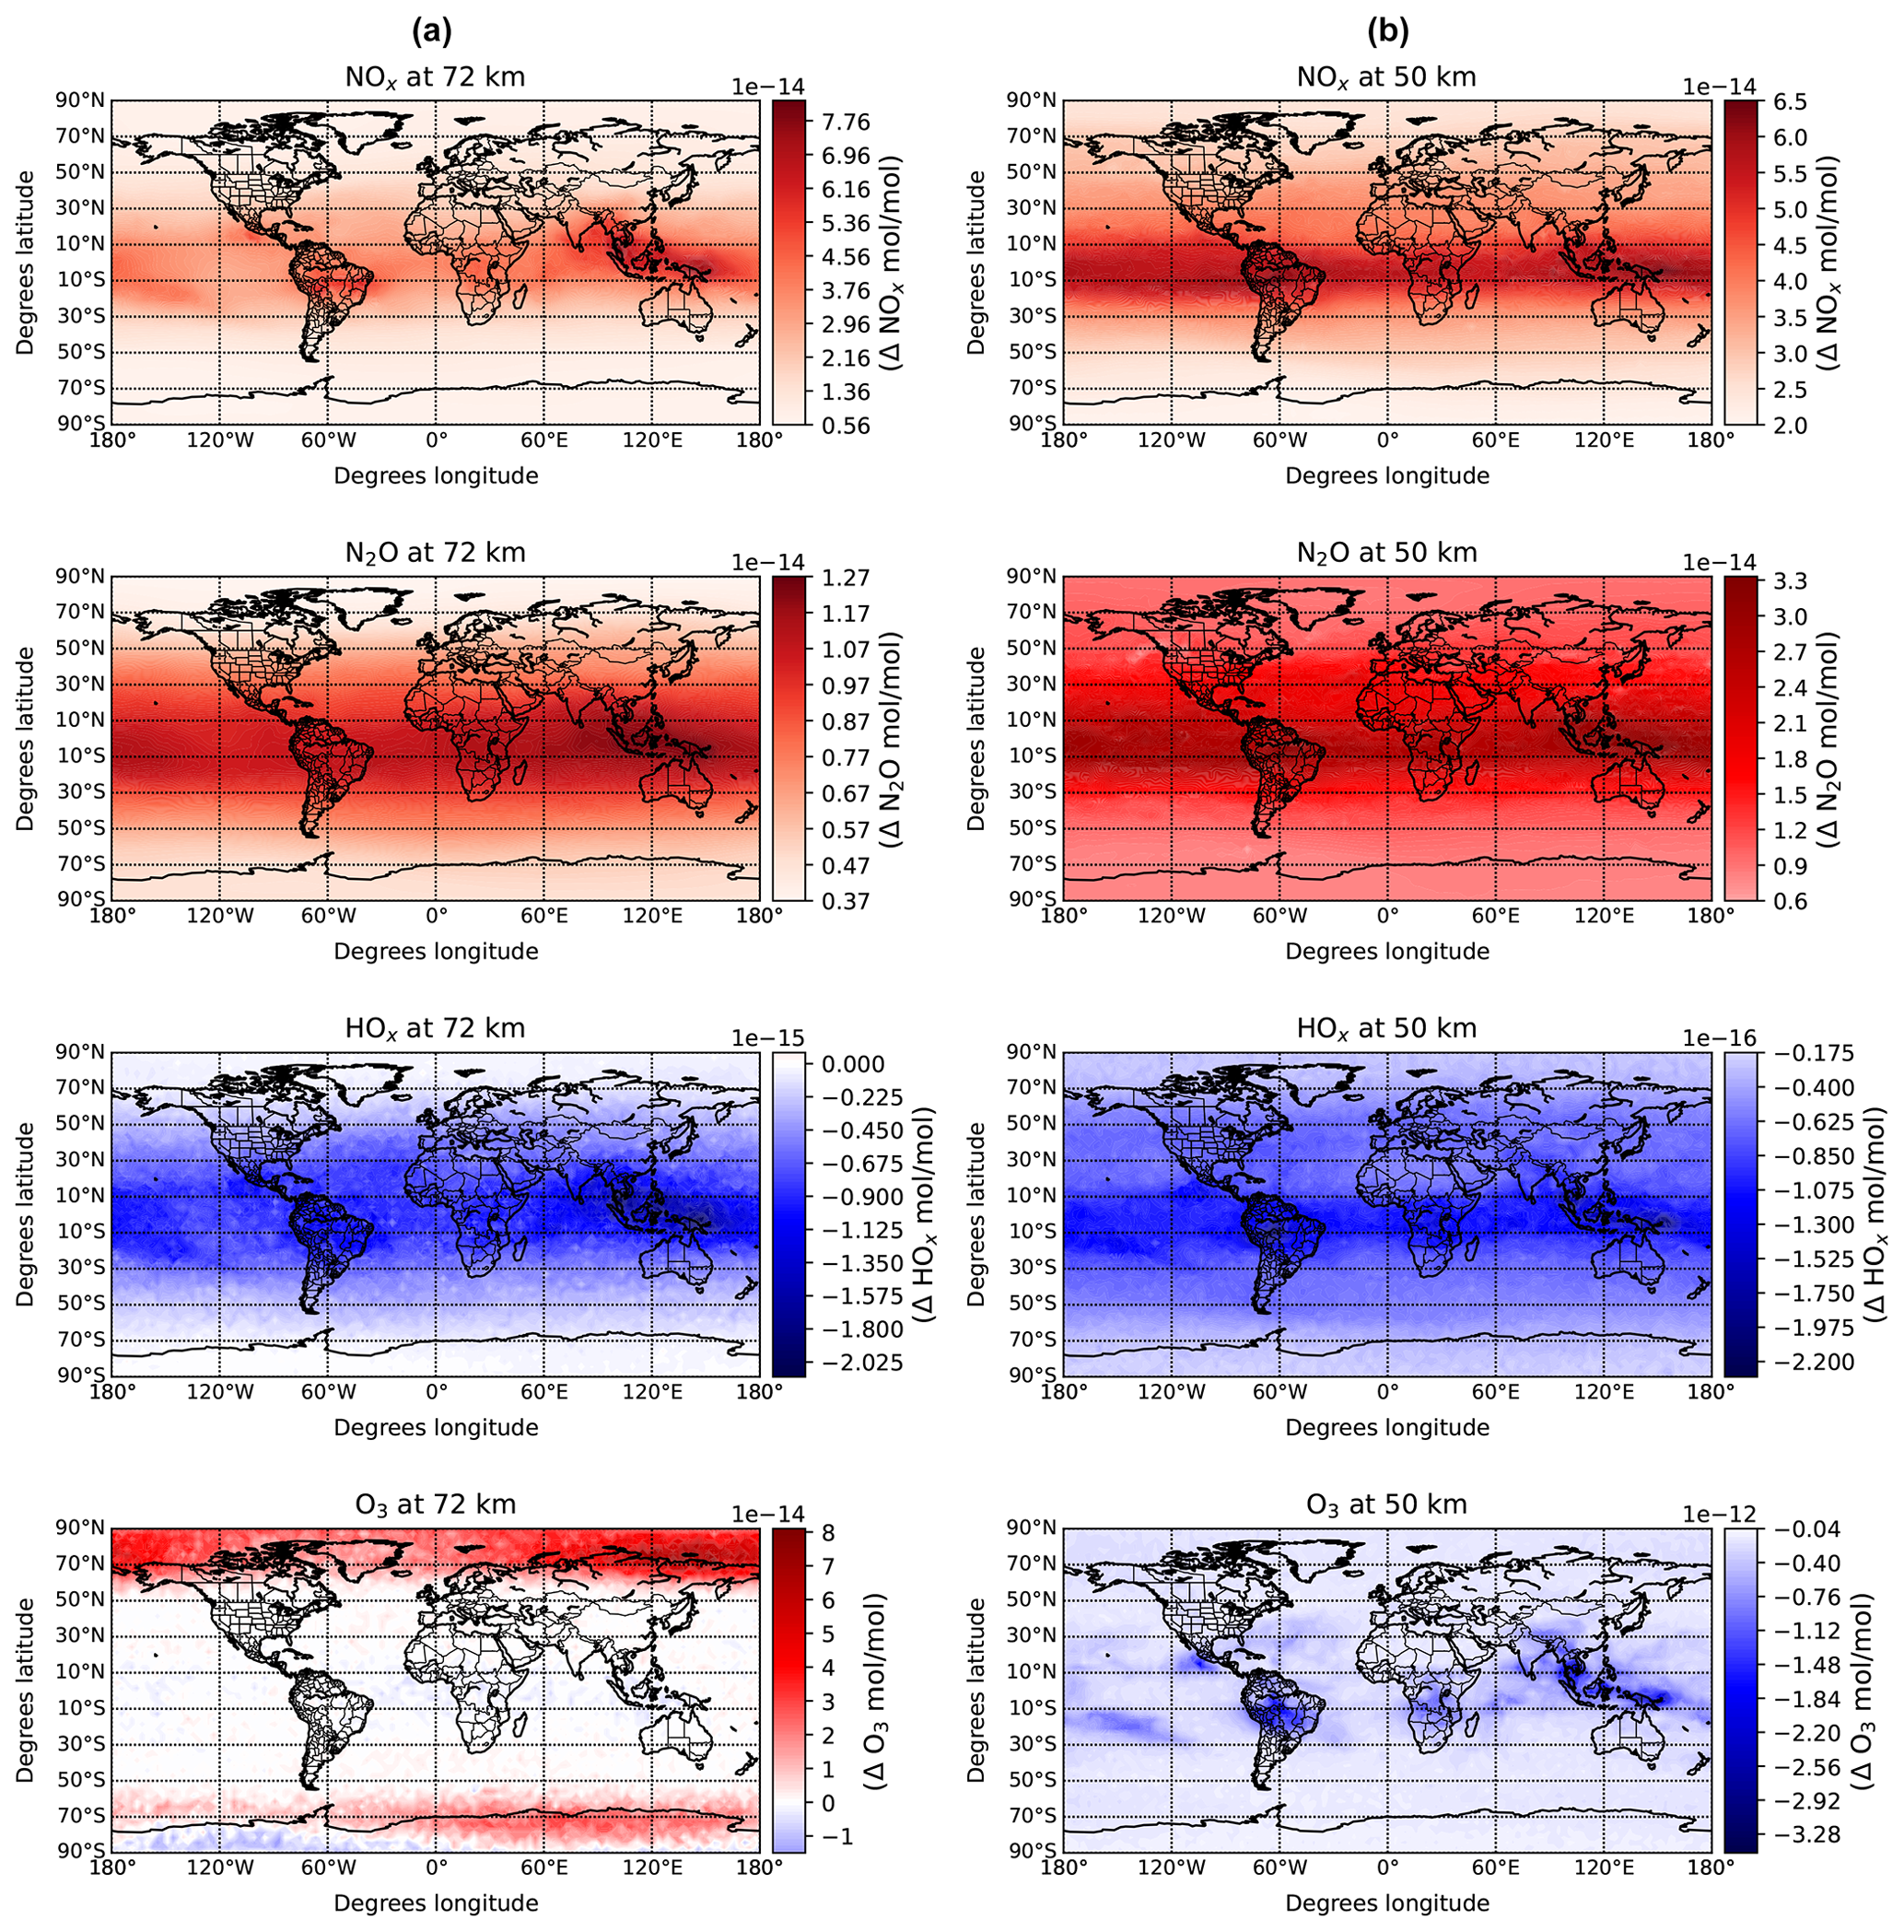
Figure 6Annually (2001) averaged differences of the NOx, N2O, HOx, and O3 mixing ratios between a simulation with sprites (SPRI-M) and without sprites (CTRL) at 72 km (a) and 50 km (b) altitude. In the simulation with sprites, we have assumed that a single sprite can inject 1 × 10²⁰ HO2 molecules (Winkler et al., 2021).
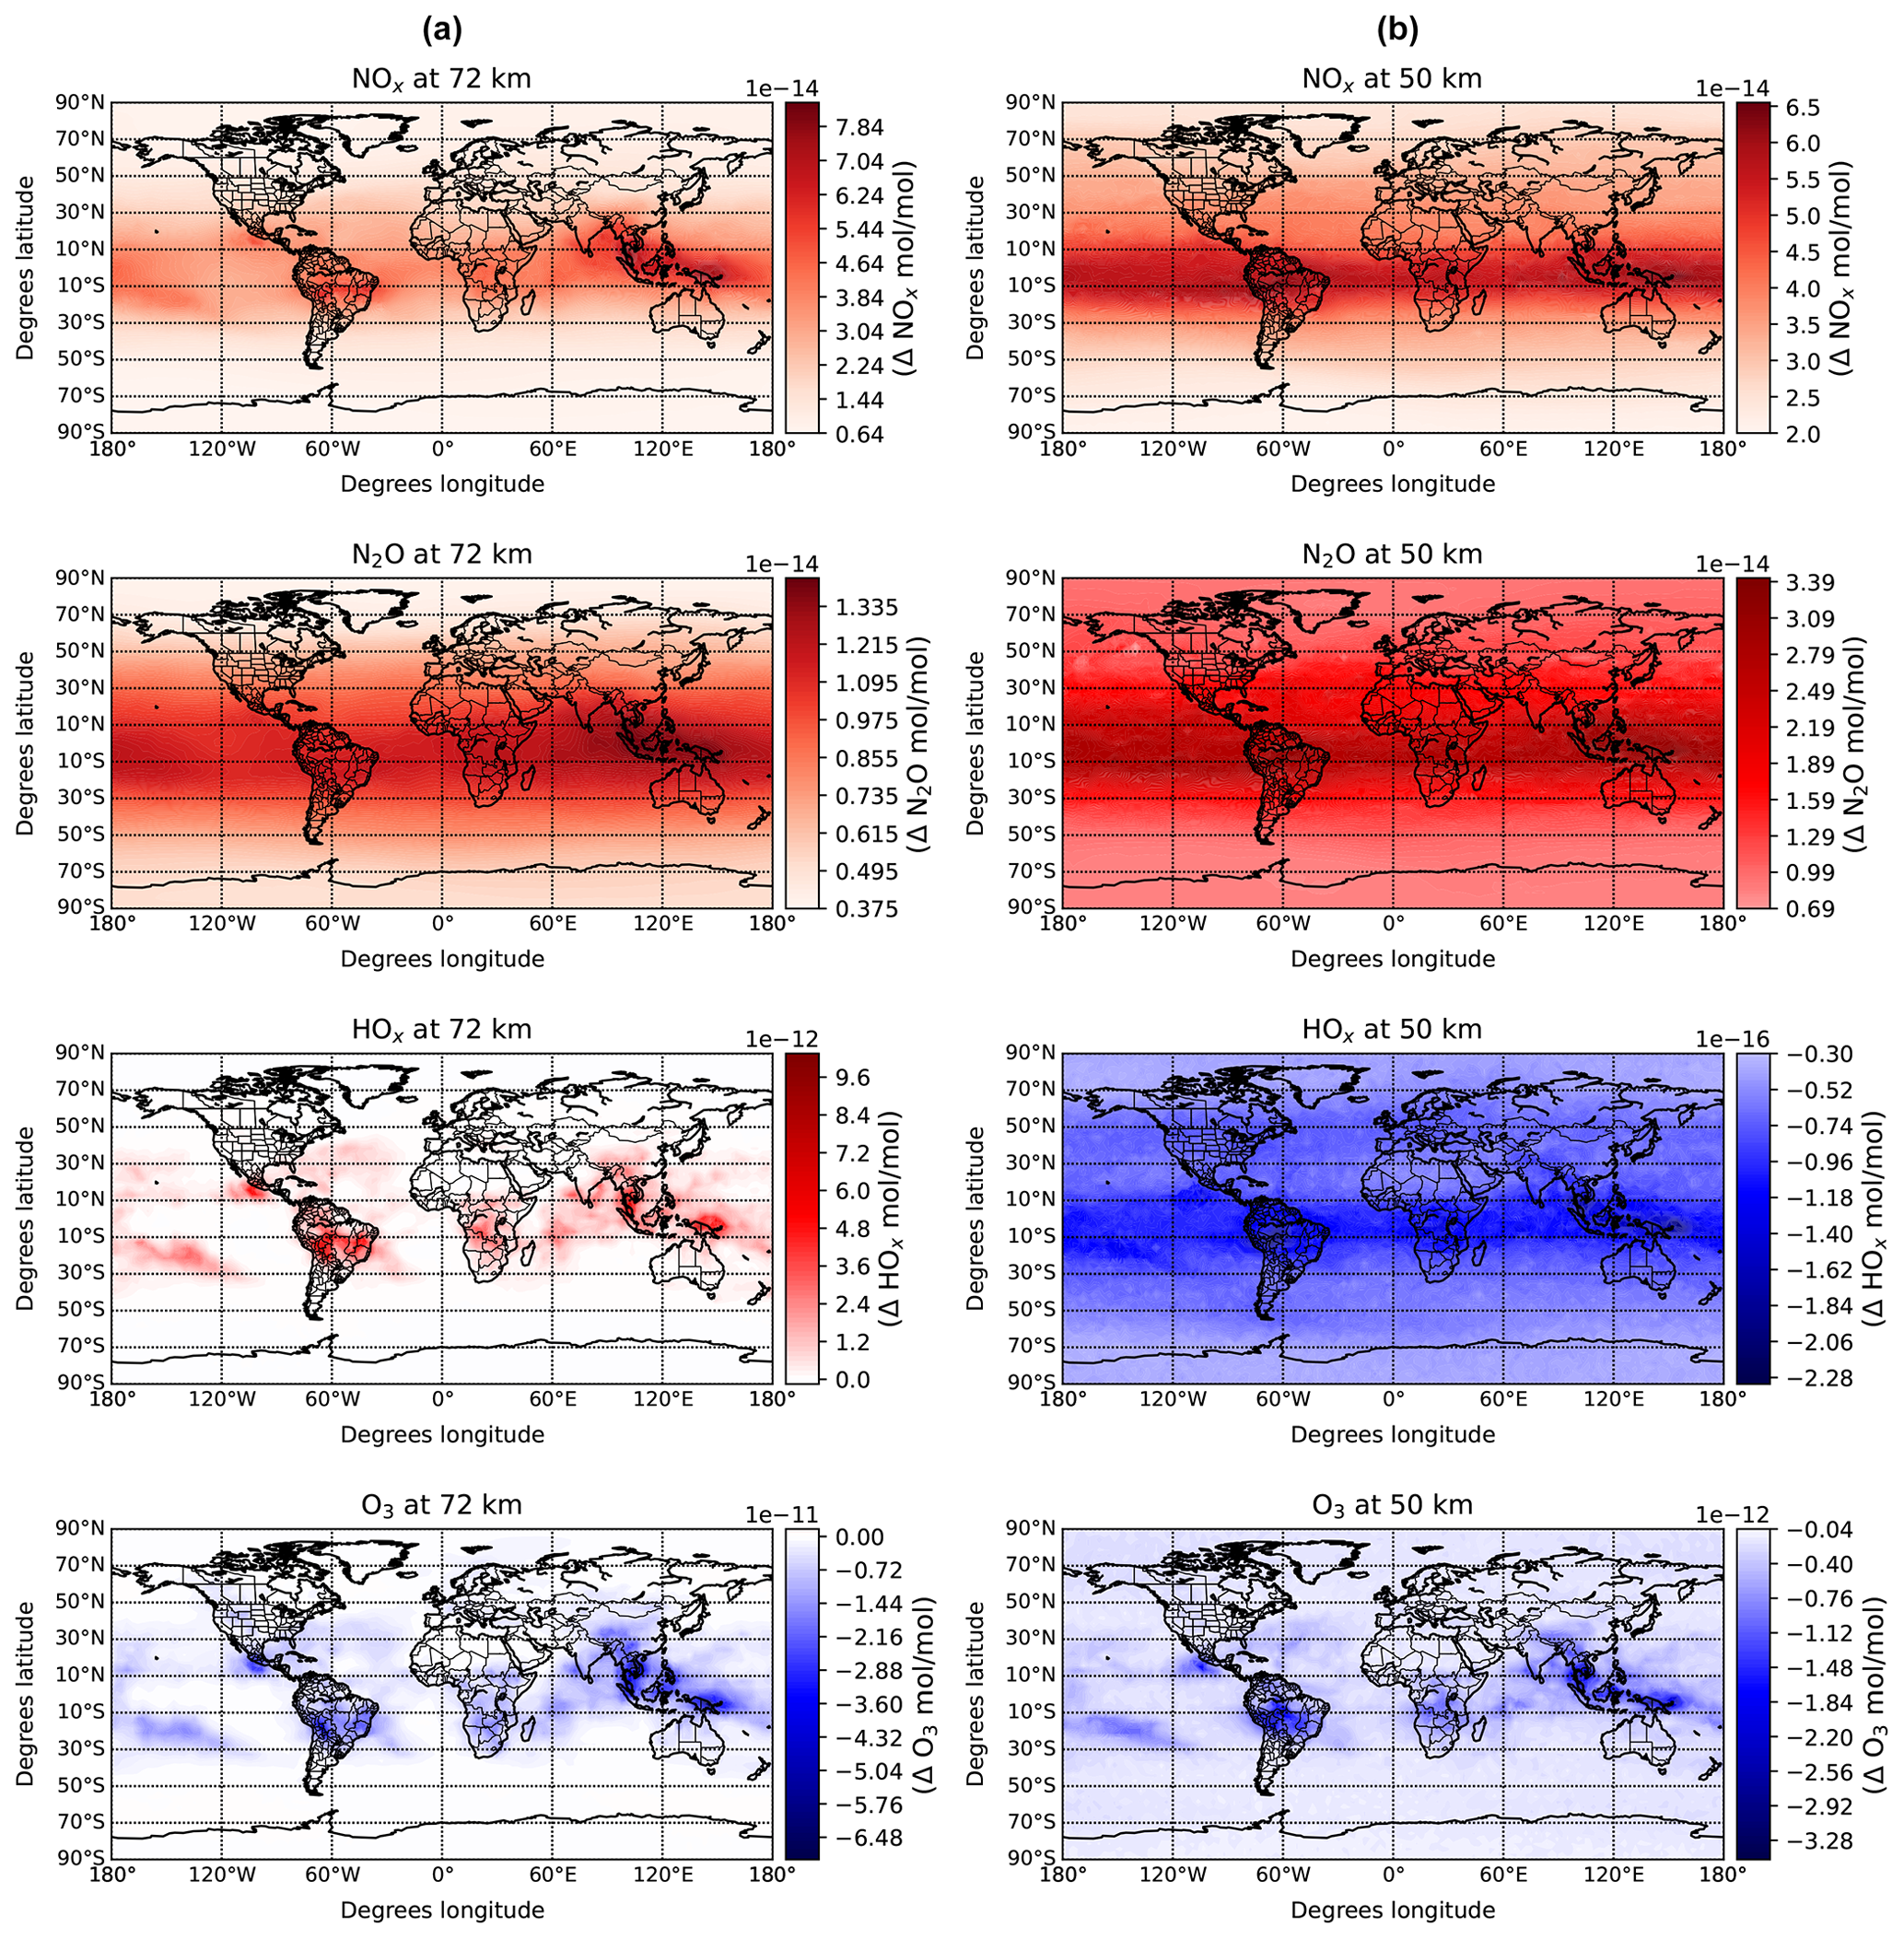
Figure 7Same as Fig. 6 but assuming that a single sprite injects 1 × 1025 HO2 molecules (SPRI-SMI simulation) as reported by Yamada et al. (2020).
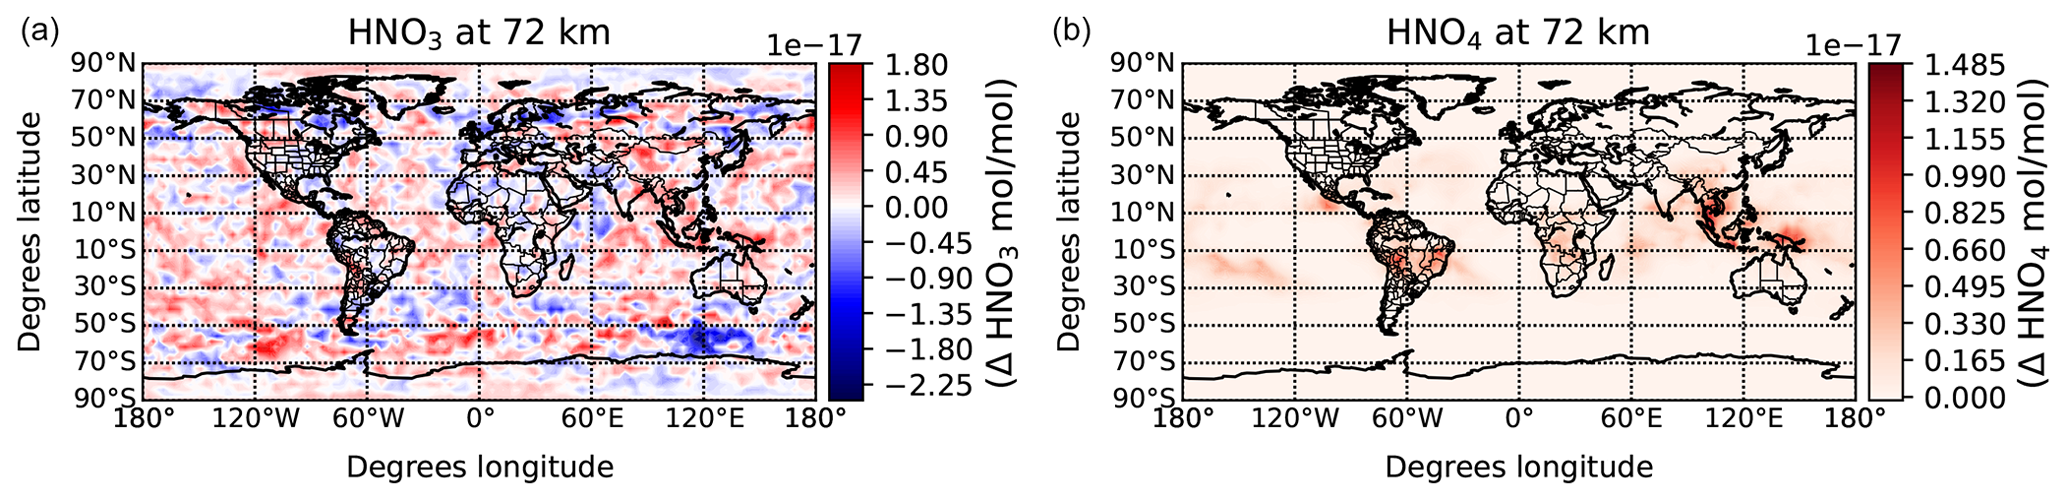
Figure 8Same as Fig. 7 but for the reactive nitrogen compounds HNO3 and HNO4.
3.2 Global chemical influence of sprite streamers in the mesosphere–lower thermosphere
Figure 4 shows the simulated influence of sprites in the annually and globally averaged vertical profiles of NOx= NO + NO2, N2O, HOx= OH + HO2, O3, HNO3, and HNO4 by assuming that single sprites inject 1 × 10²⁰ HO2 molecules (Winkler et al., 2021). The obtained small variations between simulations with and without sprites clearly show that the influence of sprites is negligible on the global scale. The maximum effects of sprites in the vertical profiles of NOx and N2O are located in the upper mesosphere, where the background abundance of these species is low. The found contribution of sprites to the global amount of N2O in the upper mesosphere is about 0.008 %, in agreement with previous estimates by Pérez-Invernón et al. (2020) of 0.003 % from electrodynamical simulations of streamers. We obtained a marginal increase of approximately 0.007 % in the background concentration of NOx at an altitude of 70 km. This increment is notably lower than the perturbation estimated by Arnone et al. (2014) due to sprites, which falls within the range of 2 % to 20 %. The variance in results can be attributed to the disparity in assumptions made by Arnone et al. (2014), who considered an injection of NOx molecules ranging from 1.5 × 10²³ to 1.5 × 1024. In contrast, our study assumes a more conservative injection of 6.46 × 10²² NOx molecules. In addition, the sprite–NOx perturbation profile in this study is linear between the altitudes of 45 and 80 km, while the profile adopted by Arnone et al. (2014) peaks at about 65 km altitude. The amount of HOx is reduced in the mesosphere as a consequence of the conversion of HO2 and OH into the nitrogen reactive compounds HNO3 and HNO4 produced by the injection of NOx. As a consequence, the mixing ratio of HNO3 and HNO4 increased in the upper mesosphere. In turn, the injection of NO and HO2 by sprites produces an enhancement in the upper-mesospheric background O3 mixing ratio, while the net contribution of sprites to O3 in the middle and the lower mesosphere is negative.
We show in Fig. 5 the influence of sprites on the annually and globally averaged vertical profiles of NOx= NO + NO2, N2O, HOx= OH + HO2, and O3 by assuming that single sprites inject 1 × 1025 HO2 molecules (Yamada et al., 2020). There are some relevant differences between the enhancements of NOx when introducing 1 × 1025 HO2 molecules instead of 1 × 10²⁰ HO2 molecules per sprite. The injected HO2 produces a modification of the contribution of NO and NO2 to the total NOx. The HO2 reacts with NO, producing a slight decrease in the concentration of NO in the upper mesosphere and an increase of about 0.07 % in NO2. The injection of 1 × 1025 HO2 molecules per sprite produces a 0.01 % increment in the mixing ratio of HOx between 60 and 80 km altitude, still too low to be considered a significant source of HOx at a global scale. However, the conversion of OH and HO2 into the reactive nitrogen compounds HNO3 and HNO4 in combination with NOx led to a 0.3 % and a 0.04 % enhancement in the mixing ratio of HNO4 and HNO3 in the upper mesosphere, respectively. In turn, the influence of sprites on O3 is different when introducing 1 × 1025 HO2 molecules per sprite. The injected HO2 contributes to a decrease in the background mixing ratio of O3 in the upper mesosphere (about −0.002 % at a global scale). The depletion of O3 by HOx can be due to the enhancement of NO2, which contributes to the depletion of the mixing ratio of O3.
We further analyse the geographical influence of sprites in the chemistry of the mesosphere. We show in Fig. 6 the annual global difference in the mixing ratios of NOx, N2O, HOx, and O3 at 72 and 50 km altitude between two simulations with and without sprites. In this case, we have assumed that a single sprite injects 1 × 10²⁰ HO2 molecules (Winkler et al., 2021). The maximum increases in NOx and N2O mixing ratios at both altitudes are observed in the tropical and middle latitudes. This region coincides with the area that experiences the largest annual occurrence of sprites. The chemical influence of sprites in the geographical distributions of HOx and Ox is more complex. The mixing ratios of HOx and O3 decrease in the areas with a high occurrence rate of sprites at 72 and 50 km altitude. The HOx is depleted by the injected molecules of NOx, while O3 is directly depleted by sprites as prescribed by the developed parameterization. The mixing ratio of O3 increases near the poles at 72 km altitude, where the implemented parameterization of sprites imposes an injection of NO without NO2. The NO injected at 72 km altitude at tropical and middle latitudes is transported polewards and produces O3 in the presence of N.
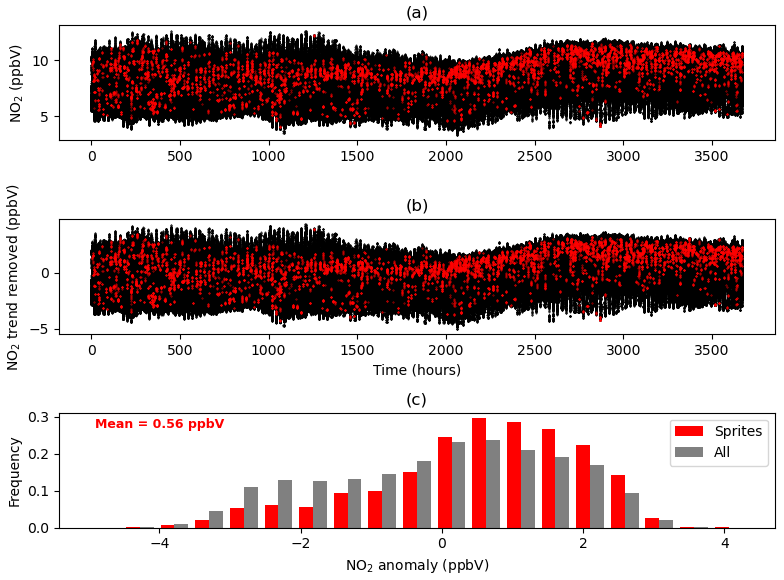
Figure 9(a) Simulated NO2 mixing ratio time series within the latitude band 30° S to 20° N between 22:00 and 23:00 LT every 720 s. The horizontal axis represents the time elapsed since 1 August 2001 at 00:00:00 UTC. Black dots denote NO2 mixing ratios when no sprites occurred within the 24 min window, whereas red dots signify NO2 mixing ratios during the presence of at least one sprite within the same 24 min period. (b) Same as (a) but after NO2 trend removal. (c) The grey distribution shows the simulated NO2 mixing ratio anomalies at 52 km altitude within the latitude band 30° S to 20° N between 22:00 and 23:00 LT every 720 s. The red distribution shows the NO2 anomalies for cases in which sprite took place less than 24 min before.
Figure 7 shows the annual global difference between the mixing ratios of the analysed chemical species assuming that a single sprite injects 1 × 1025 HO2 molecules (Yamada et al., 2020) instead of 1 × 10²⁰ HO2 molecules (Winkler et al., 2021). The larger injection of HO2 molecules does not produce any significant difference in the variation of NOx and N2O between the simulations with and without sprites. However, clear differences in the impact of sprites for the background mixing ratios of HOx and O3 can be seen (see values and geographical distribution). There is a significant enhancement of the HOx mixing ratio at 72 km in the regions with the largest occurrence of sprites due to the direct injection of HO2. The increase in the mixing ratio of HOx produces a decrease in the O3 mixing ratio as O3 molecules are depleted in the conversion between H, OH, and HO2 molecules, such as OH + O3 →HO2 + O2 and HO2 + O3→ OH + 2O2 (Jaeglé et al., 2001; Sander et al., 2011). At 50 km altitude, far from the vertical level where the HO2 is injected (above 70 km), the variations in the HOx and O3 mixing ratios are nearly similar to those in the previous case (Fig. 6).
Finally, we show in Fig. 8 the annual global difference in the mixing ratio of HNO3 and HNO4 at 72 km altitude between a simulation with sprites (assuming that a single sprite injects 1 × 1025 HO2 molecules (Yamada et al., 2020)) and a simulation without sprites. There is a clear enhancement of the HNO4 mixing ratio in regions with a large occurrence of sprites produced by the reaction between the injected NOx and HOx molecules, mainly NO2 + OH → HNO3, NO2 + OH + M → HNO3 + M, and NO2 + HO2 → HNO4 (Sander et al., 2011). According to Fig. 8, the relative increase in the global HNO4 mixing ratio (0.3 %; see Fig. 5) is significantly concentrated at tropical latitudes. In particular, sprites potentially represent a non-negligible source of upper-mesospheric HNO4 at a regional scale in South America and southeastern Asia. In specific regions, the decrease in the HNO3 mixing ratio is likely attributable to the elevated mixing ratio of OH, which interacts with HNO3, leading to its depletion (Sander et al., 2011).
3.3 Regional chemical influence of sprite streamers: comparison with NO2 measurements by MIPAS
We now compare the simulated and the observed anomalies of the NO2 mixing ratio at nighttime at the same local hour and timescale as reported by Arnone et al. (2008). They reported NO2 anomalies over an instantaneous field-of-view footprint of 30 km × 500 km, a horizontal area that is about 6 times smaller than the area covered by each cell domain of our simulations. We examine the simulation SPRI-M to generate vertical profiles of NO2 and sprite frequency rates for each time step (720 s) between 22:00 and 23:00 LT in the period August to December 2001 within the latitude band 30° S to 20° N. Figure 9a shows the time series of the simulated NO2 mixing ratio time series with and without sprites taking place up to 24 min before each given time according to the implemented parameterization of sprites. In total, Fig. 9a comprises 1 808 154 data points for NO2 mixing ratios (black dots), from which 11 850 correspond to post-sprite occurrences (red dots). Following Arnone et al. (2008), we have removed the NO2 trend in Fig. 9b. The trend is calculated as the average of all the NO2 mixing ratio data plotted in Fig. 9a. Comparison between the values shown in Fig. 9a and b and those in Arnone et al. (2008, Fig. 2) confirms that the simulation is producing NO2 mixing ratios at 52 km that are similar to the MIPAS measurements. The anomalies are analysed in Fig. 9c, showing a positive NO2 mixing ratio anomaly of +0.56 ppbV at 52 km altitude and 24 min after the occurrence of sprites, which is slightly lower than the +1 ppbV NO2 anomaly reported by Arnone et al. (2014) above thunderstorms, as observed by MIPAS. We computed the 95 % confidence intervals for the mean and median of the distributions using a bootstrap method (Efron and Tibshirani, 1994) with 5000 resamples. The calculated confidence intervals are (−0.0022, 0.0023 ppbV) and (0.5334, 0.5843 ppbV) for the means of the distribution of simulated NO2 mixing ratio anomalies at 52 km altitude and the distribution of NO2 anomalies for cases in which sprites occurred less than 24 min before, respectively. Notably, these intervals do not overlap, suggesting significant differences between the distributions.
In their study, Arnone et al. (2008) reported NO2 anomalies over an instantaneous field of view with a footprint of 30 km × 1200 km, a size roughly 3 times smaller than the area covered by each cell domain in our simulations. As a result, it can be expected that the simulated anomalies are lower than those reported by Arnone et al. (2008).
We have developed and implemented in EMAC the first parameterization of sprites based on meteorological variables used as a proxy. This parameterization has enabled us to simulate the global annual and seasonal global distributions of sprites and to estimate their sensitivity to climate change. In particular, we have obtained a future increase in the occurrence rate of sprites of 69 % in 2091, which is larger than the predicted increase in lightning activity (about 47 %). Recent modelling results and space-based measurements have been used to introduce the injection of chemical species by sprites in the model. We have found that the chemical influence of sprites in the mesosphere is not important at a global scale. However, our results indicate that sprites could be a non-negligible (measurable) source of HNO4 at a regional scale, especially in the upper-mesosphere in South America and southeastern Asia.
The analysis of simulated NO2 mixing ratios above thunderstorms after the occurrence of sprites has confirmed that the anomalies in the nighttime NO2 measurements reported by MIPAS after the occurrence of lightning (Arnone et al., 2014) can be due to sprites. In particular, our simulations indicate an enhancement of +0.56 ppbV of the NO2 mixing ratio above thunderstorms at 52 km altitude within a 24 min window, while the increase reported by Arnone et al. (2014) was +1 ppbV.
The main conclusions of this study are as follows:
-
The developed parameterization of sprites produces a good agreement between the simulated and the observed global distribution of sprites.
-
Implementation of sprites in EMAC (see Sect. 3.2) produces a variation of +0.008 % of the mixing ratio of N2O, +0.006 % of NOx, between % and +0.02 % of HOx, between −0.002 % and −10−5 % of O3, between +0.005 and +0.05 % of HNO3, and between +0.007 % and +0.3 % of HNO4 between 60 and 80 km altitude in the mesosphere.
-
The influence of sprites on the chemistry of the atmosphere at a global scale is negligible.
-
Our results confirm that NO2 mixing ratio anomalies reported by MIPAS at 52 km altitude after the occurrence of lightning can be due to sprites.
-
The projected simulation with sprites (RCP6.0) indicates a 54 % increase (14 % per K) in their occurrence rate at the end of the 21st century, approximately similar to the expected increase in lightning activity.
The Modular Earth Submodel System (MESSy) is continuously developed and applied by a consortium of institutions. The usage of MESSy and access to the source code are licensed to all affiliates of institutions which are members of the MESSy Consortium. Institutions can become a member of the MESSy Consortium by signing the MESSy Memorandum of Understanding. More information can be found on the MESSy Consortium website (http://www.messy-interface.org, last access: 29 September 2023). As the MESSy code is only available under license, the code cannot be made publicly available. The parameterization of the sprites has been developed based on MESSy version 2.55.2 (MESSy Consortium, 2021) and will be included in the next release. The data of the simulations generated in this study have been deposited in the Zenodo repository: https://doi.org/10.5281/zenodo.10554170 (Pérez-Invernón et al., 2023).
FJPI: conceptualization, methodology, validation, formal analysis, investigation, data curation, writing – original draft. FJGV, AMR, and PJ: conceptualization, methodology, validation, formal analysis, investigation, data curation, writing – review and editing.
At least one of the (co-)authors is a member of the editorial board of Atmospheric Chemistry and Physics. The peer-review process was guided by an independent editor, and the authors also have no other competing interests to declare.
Publisher’s note: Copernicus Publications remains neutral with regard to jurisdictional claims made in the text, published maps, institutional affiliations, or any other geographical representation in this paper. While Copernicus Publications makes every effort to include appropriate place names, the final responsibility lies with the authors.
This article is part of the special issue “The Modular Earth Submodel System (MESSy) (ACP/GMD inter-journal SI)”. It is not associated with a conference.
The project that gave rise to these results received the support of a fellowship from “La Caixa” Foundation (project ID no. 100010434). The fellowship code is LCF/BQ/PI22/11910026 (Francisco J. Pérez-Invernón). Additionally, this work was supported by grant nos. PID2019-109269RB-C43 (Francisco J. Pérez-Invernón and Francisco J. Gordillo-Vázquez) and PID2022-136348NB-C31 (Francisco J. Pérez-Invernón and Francisco J. Gordillo-Vázquez) funded by MCIN/AEI/ grant no. 10.13039/501100011033 and “ERDF A way of making Europe”. Alejandro Malagón-Romero acknowledges the financial support from the grant no. BEVP34A6840 funded by “Ramón Areces Foundation”. Francisco J. Pérez-Invernón and Francisco J. Gordillo-Vázquez acknowledge financial support from the grant no. CEX2021-001131-S funded by MCIN/AEI/ grant no. 10.13039/501100011033. Patrick Jöckel acknowledges funding from the Initiative and Networking Fund of the Helmholtz Association through the project “Advanced Earth System Modelling Capacity (ESM)” and from the Helmholtz Association project “Joint Lab Exascale Earth System Modelling (JL-ExaESM)”. The content of the paper is the sole responsibility of the author(s), and it does not represent the opinion of the Helmholtz Association, and the Helmholtz Association is not responsible for any use that might be made of the information contained. The high-performance computing (HPC) simulations have been carried out on the DRAGO supercomputer of CSIC.
We acknowledge the support of the publication fee by the CSIC Open Access Publication Support Initiative through its Unit of Information Resources for Research (URICI).
This paper was edited by John Plane and reviewed by two anonymous referees.
Allen, D. J. and Pickering, K. E.: Evaluation of lightning flash rate parameterizations for use in a global chemical transport model, J. Geophys. Res.-Atmos., 107, ACH–15, https://doi.org/10.1029/2002JD002066, 2002. a
Andrey, E., Nikolay, I., and Ekaterina, S.: Parameterization and global distribution of sprites based on the WWLLN data, Atmos. Res., 276, p. 106272, https://doi.org/10.1016/j.atmosres.2022.106272, 2022. a, b, c
Armstrong, R. A., Shorter, J. A., Taylor, M. J., Suszcynsky, D. M., Lyons, W. A., and Jeong, L. S.: Photometric measurements in the SPRITES 1995 and 1996 campaigns of nitrogen second positive (399.8 nm) and first negative (427.8 nm) emissions, J. Atm. Sol.-Terr. Phys., 60, 787, https://doi.org/10.1016/S1364-6826(98)00026-1, 1998. a, b
Arnone, E. and Dinelli, B. M.: CHIMTEA – chemical impact of thunderstorms on Earth's atmosphere, in: Remote Sensing Advances for Earth System Science, edited by: Fernández-Prieto, D. and Sabia, R., 1–14, Springer, https://doi.org/10.1007/978-3-319-16952-1, 2016. a, b
Arnone, E., Kero, A., Dinelli, B. M., Enell, C.-F., Arnold, N. F., Papandrea, E., Rodger, C. J., Carlotti, M., Ridolfi, M., and Turunen, E.: Seeking sprite-induced signatures in remotely sensed middle atmosphere NO2, Geophys. Res. Lett., 35, L05807, https://doi.org/10.1029/2007GL031791, 2008. a, b, c, d, e, f
Arnone, E., Smith, A. K., Enell, C.-F., Kero, A., and Dinelli, B. M.: WACCM climate chemistry sensitivity to sprite perturbations, J. Geophys. Res.-Atmos., 119, 6958–6970, https://doi.org/10.1002/2013JD020825, 2014. a, b, c, d, e, f, g, h, i, j
Arnone, E., Bór, J., Chanrion, O., Barta, V., Dietrich, S., Enell, C.-F., Farges, T., Füllekrug, M., Kero, A., Labanti, R., Mäkelä, A., Mezuman, K., Odzimek, A., Popek, M., Prevedelli, M., Ridolfi, M., Soula, S., Valeri, D., van der Velde, O., Yair, Y., Zanotti, F., Zoladek, P., and Neubert, T.: Climatology of transient luminous events and lightning observed above Europe and the Mediterranean Sea, Surv. Geophys., 41, 167–199, https://doi.org/10.1007/s10712-019-09573-5, 2020. a, b
The HadGEM2 Development Team: G. M. Martin, Bellouin, N., Collins, W. J., Culverwell, I. D., Halloran, P. R., Hardiman, S. C., Hinton, T. J., Jones, C. D., McDonald, R. E., McLaren, A. J., O'Connor, F. M., Roberts, M. J., Rodriguez, J. M., Woodward, S., Best, M. J., Brooks, M. E., Brown, A. R., Butchart, N., Dearden, C., Derbyshire, S. H., Dharssi, I., Doutriaux-Boucher, M., Edwards, J. M., Falloon, P. D., Gedney, N., Gray, L. J., Hewitt, H. T., Hobson, M., Huddleston, M. R., Hughes, J., Ineson, S., Ingram, W. J., James, P. M., Johns, T. C., Johnson, C. E., Jones, A., Jones, C. P., Joshi, M. M., Keen, A. B., Liddicoat, S., Lock, A. P., Maidens, A. V., Manners, J. C., Milton, S. F., Rae, J. G. L., Ridley, J. K., Sellar, A., Senior, C. A., Totterdell, I. J., Verhoef, A., Vidale, P. L., and Wiltshire, A.: The HadGEM2 family of Met Office Unified Model climate configurations, Geosci. Model Dev., 4, 723–757, https://doi.org/10.5194/gmd-4-723-2011, 2011. a
Bitzer, P. M.: Global distribution and properties of continuing current in lightning, J. Geophys. Res.-Atmos., 122, 1033–1041, https://doi.org/10.1002/2016JD025532, 2017. a
Brook, M., Kitagawa, N., and Workman, E.: Quantitative study of strokes and continuing currents in lightning discharges to ground, J. Geophys. Res., 67, 649–659, https://doi.org/10.1029/JZ067i002p00649, 1962. a
Cecil, D. J., Buechler, D. E., and Blakeslee, R. J.: Gridded lightning climatology from TRMM-LIS and OTD: Dataset description, Atmos. Res., 135, 404–414, https://doi.org/10.1016/j.atmosres.2012.06.028, 2014. a
Chen, A. B., Wang, T., Huang, T., Kuo, C., Hsu, R., Su, H., Chern, J., Mende, S., Takahashi, Y., Fukunishi, H., and Lee, L.: Observations of transient luminous events on the ROCSAT-2 satellite using ISUAL instruments*, AGU Fall Meeting Abstracts, San Francisco, CA, 8-12 December 2003, A792+ pp., 2003. a
Chen, A. B., Kuo, C.-L., Lee, Y.-J., Su, H.-T., Hsu, R.-R., Chern, J.-L., Frey, H. U., Mende, S. B., Takahashi, Y., Fukunishi, H., Chang, Y.-S., Liu, T.-Y., and Lee, L.-C.: Global distributions and occurrence rates of transient luminous events, J. Geophys. Res.-Space Phys, 113, A08306, https://doi.org/10.1029/2008JA013101, 2008. a, b, c, d, e
Christian, H. J., Blakeslee, R. J., Boccippio, D. J., Boeck, W. L., Buechler, D. E., Driscoll, K. T., Goodman, S. J., Hall, J. M., Koshak, J. M., Mach, D. M., and Stewart, M. F.: Global frequency and distribution of lightning as observed from space by the Optical Transient Detector, J. Geophys. Res., 108, ACL4–1, https://doi.org/10.1029/2002JD002347, 2003. a
Collins, W. J., Bellouin, N., Doutriaux-Boucher, M., Gedney, N., Halloran, P., Hinton, T., Hughes, J., Jones, C. D., Joshi, M., Liddicoat, S., Martin, G., O'Connor, F., Rae, J., Senior, C., Sitch, S., Totterdell, I., Wiltshire, A., and Woodward, S.: Development and evaluation of an Earth-System model – HadGEM2, Geosci. Model Dev., 4, 1051–1075, https://doi.org/10.5194/gmd-4-1051-2011, 2011. a
Cummer, S. A. and Füllekrug, M.: Unusually intense continuing current in lightning produces delayed mesospheric breakdown, Geophys. Res. Lett., 28, 495, https://doi.org/10.1029/2000GL012214, 2001. a
Deckert, R., Jöckel, P., Grewe, V., Gottschaldt, K.-D., and Hoor, P.: A quasi chemistry-transport model mode for EMAC, Geosci. Model Dev., 4, 195–206, https://doi.org/10.5194/gmd-4-195-2011, 2011. a
Dee, D. P., Uppala, S. M., Simmons, A. J., Berrisford, P., Poli, P., Kobayashi, S., Andrae, U., Balmaseda, M., Balsamo, G., Bauer, D. P., Bechtold, P., Beljaars, A. C. M., van de Berg, L., Bidlot, J., Bormann, N., Delsol, C., Dragani, R., Fuentes, M., Geer, A. J., Haimberger, L., Healy, S. B., Hersbach, H., Hólm, E. V., Isaksen, L., Kållberg, P., Köhler, M., Matricardi, M., McNally, A. P., Monge-Sanz, B. M., Morcrette, J.-J., Park, B.-K., Peubey, C., de Rosnay, P., Tavolato, C., Thépaut, J.-N., and Vitart, F.: The ERA-Interim reanalysis: Configuration and performance of the data assimilation system, Q. J. Roy. Meteorol. Soc., 137, 553–597, 2011. a, b, c
Dinelli, B. M., Arnone, E., Brizzi, G., Carlotti, M., Castelli, E., Magnani, L., Papandrea, E., Prevedelli, M., and Ridolfi, M.: The MIPAS2D database of MIPAS/ENVISAT measurements retrieved with a multi-target 2-dimensional tomographic approach, Atmos. Meas. Tech., 3, 355–374, https://doi.org/10.5194/amt-3-355-2010, 2010. a
ECMWF: European Centre for Medium-range Weather Forecast (ECMWF) (2011). The ERA-Interim reanalysis dataset, Copernicus Climate Change Service (C3S), https://www.ecmwf.int/en/forecasts/datasets/archive-datasets/reanalysis-datasets/era-interim (last access: 29 September 2023), 2011. a
Efron, B. and Tibshirani, R. J.: An introduction to the bootstrap, CRC press, Pub. Location New York Imprint Chapman and Hall/CRC, 456 pp., https://doi.org/10.1201/9780429246593, 1994. a
Enell, C.-F., Arnone, E., Adachi, T., Chanrion, O., Verronen, P. T., Seppälä, A., Neubert, T., Ulich, T., Turunen, E., Takahashi, Y., and Hsu, R.-R.: Parameterisation of the chemical effect of sprites in the middle atmosphere, Ann. Geophys., 26, 13–27, https://doi.org/10.5194/angeo-26-13-2008, 2008. a
Evtushenko, A., Svechnikova, E., and Kudryavtsev, A.: Analysis of Sprite Activity in Middle Latitudes, Atmosphere, 15, 169, https://doi.org/10.3390/atmos15020169, 2024. a
Evtushenko, A. A., Kuterin, F. A., and Mareev, E. A.: A model of sprite influence on the chemical balance of mesosphere, J. Atmos. Terrest. Phys., 102, 298–310, https://doi.org/10.1016/j.jastp.2013.06.005, 2013. a
Eyring, V., Lamarque, J.-F., Hess, P., Arfeuille, F., Bowman, K., Chipperfiel, M. P., Duncan, B., Fiore, A., Gettelman, A., Giorgetta, M. A., et al.: Overview of IGAC/SPARC Chemistry-Climate Model Initiative (CCMI) community simulations in support of upcoming ozone and climate assessments, http://www.sparc-climate.org/fileadmin/customer/6_Publications/ Newsletter_PDF/40_SPARCnewsletter_Jan2013_web.pdf (last access: 29 September 2023), 2013. a
Franz, R. C., Nemzek, R. J., and Winckler, J. R.: Television Image of a Large Upward Electrical Discharge Above a Thunderstorm System, Science, 249, 48, https://doi.org/10.1126/science.249.4964.48, 1990. a
Fujino, J., Nair, R., Kainuma, M., Masui, T., and Matsuoka, Y.: Multi-gas mitigation analysis on stabilization scenarios using AIM global model, The Energy J., 27, 343–354, https://doi.org/10.5547/ISSN0195-6574-EJ-VolSI2006-NoSI3-17, 2006. a
Füllekrug, M. and Constable, S.: Global triangulation of intense lightning discharges, Geophys. Res. Lett., 27, 333, https://doi.org/10.1029/1999GL003684, 2000. a, b, c
Gamerota, W. R., Cummer, S. A., Li, J., Stenbaek-Nielsen, H. C., Haaland, R. K., and McHarg, M. G.: Comparison of sprite initiation altitudes between observations and models, J. Geophys. Res.-Space Phys., 116, A02317, https://doi.org/10.1029/2010JA016095, 2011. a
Gomez Kuri, Z.: Analyse des evenements lumineux transitoires a partir d’observations terrestres et spatiales, Ph.D. thesis, Universite Toulouse, https://www.theses.fr/2021TOU30303 (last access: 29 September 2023), 2021. a, b
Gordillo-Vázquez, F. J.: Air plasma kinetics under the influence of sprites, J. Phys. D, 41, 234016, https://doi.org/10.1088/0022-3727/41/23/234016, 2008. a
Gordillo-Vázquez, F. J.: Vibrational kinetics of air plasmas induced by sprites, J. Geophys. Res.-Space Phys., 115, A00E25, https://doi.org/10.1029/2009JA014688, 2010. a
Gordillo-Vázquez, F. J., Luque, A., and Simek, M.: Near infrared and ultraviolet spectra of TLEs, J. Geophys. Res.-Space Phys., 117, A05329, https://doi.org/10.1029/2012JA017516, 2012. a
Gordillo-Vázquez, F. J., Passas, M., Luque, A., Sánchez, J., Velde, O. A., and Montanyá, J.: High spectral resolution spectroscopy of sprites: A natural probe of the mesosphere, J. Geophys. Res.-Atmos., 123, 2336–2346, 2018. a, b
Greenberg, E., Price, C., Yair, Y., Haldoupis, C., Chanrion, O., and Neubert, T.: ELF/VLF signatures of sprite-producing lightning discharges observed during the 2005 EuroSprite campaign, J. Atmos. Sol.-Terr. Phys., 71, 1254, https://doi.org/10.1016/j.jastp.2009.05.005, 2009. a, b
Hoder, T., Simek, M., Bonaventura, Z., Prukner, V., and Gordillo-Vázquez, F. J.: Radially and temporally resolved electric field of positive streamers in air and modelling of the induced plasma chemistry, Plasma Sourc. Sci. Technol., 25, 045021, https://doi.org/10.1088/0963-0252/25/4/045021, 2016. a
Ignaccolo, M., Farges, T., Mika, A., Allin, T. H., Chanrion, O., Blanc, E., Neubert, T., Fraser-Smith, A. C., and Füllekrug, M.: The Planetary rate of sprite events, Geophys. Res. Lett., 33, L11808, https://doi.org/10.1029/2005GL025502, 2006. a, b
Ihaddadene, M. A. and Celestin, S.: Determination of sprite streamers altitude based on N2 spectroscopic analysis, J. Geophys. Res.-Space Phys., 122, 1000–1014, 2017. a
Inan, U. S., Cummer, S. A., and Marshall, R. A.: A survey of ELF and VLF research on lightning-ionosphere interactions and causative discharges, J. Geophys. Res.-Space Phys., 115, A00E36, https://doi.org/10.1029/2009JA014775, 2010. a, b
Jaeglé, L., Jacob, D. J., Brune, W. H., and Wennberg, P. O.: Chemistry of HOx radicals in the upper troposphere, Atmos. Environ., 35, 469–489, https://doi.org/10.1016/S1352-2310(00)00376-9, 2001. a
Jöckel, P., Kerkweg, A., Pozzer, A., Sander, R., Tost, H., Riede, H., Baumgaertner, A., Gromov, S., and Kern, B.: Development cycle 2 of the Modular Earth Submodel System (MESSy2), Geosci. Model Dev., 3, 717–752, https://doi.org/10.5194/gmd-3-717-2010, 2010. a, b
Jöckel, P., Tost, H., Pozzer, A., Kunze, M., Kirner, O., Brenninkmeijer, C. A. M., Brinkop, S., Cai, D. S., Dyroff, C., Eckstein, J., Frank, F., Garny, H., Gottschaldt, K.-D., Graf, P., Grewe, V., Kerkweg, A., Kern, B., Matthes, S., Mertens, M., Meul, S., Neumaier, M., Nützel, M., Oberländer-Hayn, S., Ruhnke, R., Runde, T., Sander, R., Scharffe, D., and Zahn, A.: Earth System Chemistry integrated Modelling (ESCiMo) with the Modular Earth Submodel System (MESSy) version 2.51, Geosci. Model Dev., 9, 1153–1200, https://doi.org/10.5194/gmd-9-1153-2016, 2016. a, b, c, d, e, f
Kanmae, T., Stenbaek-Nielsen, H. C., and McHarg, M. G.: Altitude resolved sprite spectra with 3 ms temporal resolution, Geophys. Res. Lett., 34, L07810, https://doi.org/10.1029/2006GL028608, 2007. a
Kuo, C.-L., Hsu, R. R., Chen, A. B., Su, H. T., Lee, L. C., Mende, S. B., Frey, H. U., Fukunishi, H., and Takahashi, Y.: Electric fields and electron energies inferred from the ISUAL recorded sprites, Geophys. Res. Lett., 32, L19103, https://doi.org/10.1029/2005GL023389, 2005. a
Liu, N.: Model of sprite luminous trail caused by increasing streamer current, Geophys. Res. Lett., 37, L04102, https://doi.org/10.1029/2009GL042214, 2010. a
Lu, G., Cummer, S. A., Chen, A. B., Lyu, F., Li, D., Liu, F., Hsu, R.-R., and Su, H.-T.: Analysis of lightning strokes associated with sprites observed by ISUAL in the vicinity of North America, Terr. Atmos. Ocean. Sci, 28, 583–595, https://doi.org/10.3319/TAO.2017.03.31.01, 2017. a, b
Lu, G., Peng, K.-M., Xian, T., Wang, Y., Ren, H., Tian, Y., Zhang, M., Lucena, F., Zhang, X., Huang, X., and Cheng, Z.: Contrast between continental and oceanic thunderstorms in producing red sprites and halos, Front. Earth Sci., 10, 961566, https://doi.org/10.3389/feart.2022.961566, 2022. a, b, c
Luque, A. and Gordillo-Vázquez, F.: Modeling of Sprite Beads: Using Numerical Streamer Simulations to Infer the Pre-existing Electron Density in a Sprite Discharge, AGU Fall Meeting Abstracts, pp. B3+, San Francisco, 13–17 December 2010, 2010. a
Luque, A. and Gordillo-Vázquez, F. J.: Sprite beads originating from inhomogeneities in the mesospheric electron density, Geophys. Res. Lett., 38, L04808, https://doi.org/10.1029/2010GL046403, 2011. a
Luque, A., Stenbaek-Nielsen, H., McHarg, M., and Haaland, R.: Sprite beads and glows arising from the attachment instability in streamer channels, J. Geophys. Res.-Space Phys., 121, 2431–2449, 2016. a
Malagón-Romero, A., Teunissen, J., Stenbaek-Nielsen, H. C., McHarg, M. G., Ebert, U., and Luque, A.: On the Emergence Mechanism of Carrot Sprites, Geophys. Res. Lett., 47, e85776, https://doi.org/10.1029/2019GL085776, 2020. a
Malagón-Romero, A., Pérez-Invernón, F. J., and Gordillo-Vázquez, F. J.: Chemical activity of low altitude (50 km) sprite streamers, J. Geophys. Res.-Atmos., 128, p. e2023JD038570, https://doi.org/10.1029/2023JD038570, 2023. a, b, c, d, e, f, g
MESSy Consortium: The Modular Earth Submodel System (2.55.2), Zenodo, https://doi.org/10.5281/zenodo.8360276, 2021. a
Nordeng, T. E.: Extended versions of the convective parametrization scheme at ECMWF and their impact on the mean and transient activity of the model in the tropics., Research Department Technical Memorandum, 206, 1–41, https://cir.nii.ac.jp/crid/1573668923866414848 (last access: 29 September 2023), 1994. a
Parra-Rojas, F. C., Luque, A., and Gordillo-Vázquez, F. J.: Chemical and thermal impact of sprite streamers in the Earth mesosphere, J. Geophys. Res.-Space Phys., 120, 8899–8933, https://doi.org/10.1002/2014JA020933, 2015. a
Pasko, V. P., Inan, U. S., Bell, T. F., and Taranenko, Y. N.: Sprites produced by quasi-electrostatic heating and ionization in the lower ionosphere, J. Geophys. Res.-Atmos., 102, 4529, https://doi.org/10.1029/96JA03528, 1997. a
Pasko, V. P., Yair, Y., and Kuo, C.-L.: Lightning related transient luminous events at high altitude in the Earth’s atmosphere: Phenomenology, mechanisms and effects, Space Sci. Rev., 168, 475–516, https://doi.org/10.1007/s11214-011-9813-9, 2012. a
Pérez-Invernón, F. J., Gordillo-Vázquez, F. J., and Luque, A.: On the electrostatic field created at ground level by a halo, Geophys. Res. Lett., 43, 7215–7222, https://doi.org/10.1002/2016GL069590, 2016. a
Pérez-Invernón, F. J., Luque, A., Gordillo-Vazquez, F. J., Sato, M., Ushio, T., Adachi, T., and A. B. Chen, A. B.: Spectroscopic Diagnostic of Halos and Elves Detected From Space‐Based Photometers, J. Geophys. Res.-Atmos., 123, 12917–12941, https://doi.org/10.1029/2018JD029053, 2018b. a
Pérez-Invernón, F. J., Malagón-Romero, A., Gordillo-Vázquez, F. J., and Luque, A.: The contribution of sprite streamers to the chemical composition of the mesosphere-lower thermosphere, Geophys. Res. Lett., 47, e2020GL088578, https://doi.org/10.1029/2020GL088578, 2020. a, b, c, d, e, f, g, h, i, j
Pérez-Invernón, F. J., Huntrieser, H., Jöckel, P., and Gordillo-Vázquez, F. J.: A parameterization of long-continuing-current (LCC) lightning in the lightning submodel LNOX (version 3.0) of the Modular Earth Submodel System (MESSy, version 2.54), Geosci. Model Dev., 15, 1545–1565, https://doi.org/10.5194/gmd-15-1545-2022, 2022. a, b, c, d, e
Pérez-Invernón, F. J., Gordillo-Vázquez, F. J., Huntrieser, H., and Jöckel, P.: Variation of lightning-ignited wildfire patterns under climate change, Nat. Commun., 14, 739, https://doi.org/10.1038/s41467-023-36500-5, 2023. a, b
Pérez-Invernón, F. J., Gordillo-Vázquez, F. J., Malagón-Romero, A., and Jöckel, P. [Data]: Monthly averaged sprite and chemical data ex- tracted from EMAC simulations including sprites (T42L90MA resolution), Zenodo, https://doi.org/10.5281/zenodo.10554170, 2023 a
Price, C. and Rind, D.: A simple lightning parameterization for calculating global lightning distributions, J. Geophys. Res.-Atmos., 97, 9919–9933, https://doi.org/10.1029/92JD00719, 1992. a
Qin, J., Celestin, S., and Pasko, V. P.: Low frequency electromagnetic radiation from sprite streamers, Geophys. Res. Lett., 39, L22803, https://doi.org/10.1029/2012GL053991, 2012. a
Roeckner, E., Brokopf, R., Esch, M., Giorgetta, M., Hagemann, S., Kornblueh, L., Manzini, E., Schlese, U., and Schulzweida, U.: Sensitivity of simulated climate to horizontal and vertical resolution in the ECHAM5 atmosphere model, J. Climate, 19, 3771–3791, https://doi.org/10.1175/JCLI3824.1, 2006. a
Sander, R., Baumgaertner, A., Gromov, S., Harder, H., Jöckel, P., Kerkweg, A., Kubistin, D., Regelin, E., Riede, H., Sandu, A., Taraborrelli, D., Tost, H., and Xie, Z.-Q.: The atmospheric chemistry box model CAABA/MECCA-3.0, Geosci. Model Dev., 4, 373–380, https://doi.org/10.5194/gmd-4-373-2011, 2011. a, b, c
Sander, R., Baumgaertner, A., Cabrera-Perez, D., Frank, F., Gromov, S., Grooß, J.-U., Harder, H., Huijnen, V., Jöckel, P., Karydis, V. A., Niemeyer, K. E., Pozzer, A., Riede, H., Schultz, M. G., Taraborrelli, D., and Tauer, S.: The community atmospheric chemistry box model CAABA/MECCA-4.0, Geosci. Model Dev., 12, 1365–1385, https://doi.org/10.5194/gmd-12-1365-2019, 2019. a
Sato, M. and Fukunishi, H.: Global sprite occurrence locations and rates derived from triangulation of transient Schumann resonance events, Geophys. Res. Lett., 30, 1859, https://doi.org/10.1029/2003GL017291, 2003. a, b, c, d
Sato, M., Ushio, T., Morimoto, T., Kikuchi, M., Kikuchi, H., Adachi, T., Suzuki, M., Yamazaki, A., Takahashi, Y., Inan, U., et al.: Overview and early results of the Global Lightning and Sprite Measurements mission, J. Geophys. Res.-Atmos., 120, 3822–3851, 2015. a
Sentman, D. D., Wescott, E. M., Picard, R. H., Winick, J. R., Stenbaek-Nielsen, H. C., Dewan, E. M., Moudry, D. R., Sa~O Sabbas, F. T., Heavner, M. J., and Morrill, J.: Simultaneous observations of mesospheric gravity waves and sprites generated by a midwestern thunderstorm, J. Atmos. Sol.-Terr. Phys., 65, 537, https://doi.org/10.1016/S1364-6826(02)00328-0, 2003. a
Sentman, D. D., Stenbaek-Nielsen, H. C., McHarg, M. G., and Morrill, J. S.: Plasma chemistry of sprite streamers, J. Geophys. Res.-Atmos., 113, D11112, https://doi.org/10.1029/2007JD008941, 2008. a, b
Stenbaek-Nielsen, H. C., Moudry, D. R., Wescott, E. M., Sentman, D. D., and Sao Sabbas, F. T.: Sprites and possible mesospheric effects, Geophys. Res. Lett., 27, 3829, https://doi.org/10.1029/2000GL003827, 2000. a
Stenbaek-Nielsen, H. C., McHarg, M. G., Kanmae, T., and Sentman, D. D.: Observed emission rates in sprite streamer heads, Geophys. Res. Lett., 34, L11105, https://doi.org/10.1029/2007GL029881, 2007. a, b
Stenbaek-Nielsen, H. C., Kanmae, T., McHarg, M. G., and Haaland, R.: High-Speed Observations of Sprite Streamers, Surv. Geophys., 34, 769–795, https://doi.org/10.1007/s10712-013-9224-4, 2013. a
Tiedtke, M.: A comprehensive mass flux scheme for cumulus parameterization in large-scale models, Mon. Weather Rev., 117, 1779–1800, https://doi.org/10.1175/1520-0493(1989)117<1779:ACMFSF>2.0.CO;2, 1989. a
Tost, H., Jöckel, P., and Lelieveld, J.: Lightning and convection parameterisations – uncertainties in global modelling, Atmos. Chem. Phys., 7, 4553–4568, https://doi.org/10.5194/acp-7-4553-2007, 2007. a, b
Šimek, M.: Optical diagnostics of streamer discharges in atmospheric gases, J. Phys. D, 47, 463001, https://doi.org/10.1088/0022-3727/47/46/463001, 2014. a
Wilson, C. T. R.: The electric field of a thundercloud and some of its effects, Proc. Phys. Soc. London, 37, 32D, https://doi.org/10.1088/1478-7814/37/1/314, 1925. a
Winkler, H. and Notholt, J.: The chemistry of daytime sprite streamers – a model study, Atmos. Chem. Phys., 14, 3545–3556, https://doi.org/10.5194/acp-14-3545-2014, 2014. a
Winkler, H., Yamada, T., Kasai, Y., Berger, U., and Notholt, J.: Model simulations of chemical effects of sprites in relation with observed HO2 enhancements over sprite-producing thunderstorms, Atmos. Chem. Phys., 21, 7579–7596, https://doi.org/10.5194/acp-21-7579-2021, 2021. a, b, c, d, e, f, g, h, i, j, k
Xu, W., Marshall, R. A., Kero, A., and Sousa, A.: Chemical Response of the Upper Atmosphere Due to Lightning-Induced Electron Precipitation, J. Geophys. Res.-Atmos., 126, e2021JD034914, https://doi.org/10.1029/2021JD034914, 2021. a
Yair, Y., Price, C., Katzenelson, D., Rosenthal, N., Rubanenko, L., Ben-Ami, Y., and Arnone, E.: Sprite climatology in the Eastern Mediterranean Region, Atmos. Res., 157, 108–118, https://doi.org/10.1016/j.atmosres.2014.12.018, 2015. a
Yamada, T., Sato, T., Adachi, T., Winkler, H., Kuribayashi, K., Larsson, R., Yoshida, N., Takahashi, Y., Sato, M., Chen, A., Hsu, R. R., Nakano, Y., Fujinawa, T., Nara, S., Uchiyama, Y., and Kasai, Y.: HO Generation Above Sprite-Producing Thunderstorms Derived from Low-Noise SMILES Observation Spectra, Geophys. Res. Lett., 47, e60090, https://doi.org/10.1029/2019GL085529, 2020. a, b, c, d, e, f, g, h, i, j
Zhang, M., Lu, G., Wang, Z., Peng, K.-M., Huang, H., Ren, H., Liu, F., and Lei, J.: Sprite Distribution of Different Polarities From ISUAL Observations With Machine Learning Method, J. Geophys. Res.-Atmos., 127, e2022JD036968, https://doi.org/10.1029/2022JD036968, 2022. a, b, c, d