the Creative Commons Attribution 4.0 License.
the Creative Commons Attribution 4.0 License.
 | 21 Mar 2024
Mixing-layer-height-referenced ozone vertical distribution in the lower troposphere of Chinese megacities: stratification, classification, and meteorological and photochemical mechanisms
Zhiheng Liao
Jinqiang Zhang
Jiaren Sun
Jiannong Quan
Xingcan Jia
Yubing Pan
Shaojia Fan
Traditional tropospheric ozone (O3) climatology uses a simple average substantially smoothed stratification structure in individual O3 profiles, limiting our ability to properly describe and understand how O3 is vertically distributed at the interface between the mixing layer (ML) and free troposphere (FT). In this study, we collected 1897 ozonesonde profiles from two Chinese megacities (Beijing and Hong Kong) over the period 2000–2022 to investigate the climatological vertical heterogeneity of the lower-tropospheric O3 distribution with a mixing-layer-height-referenced (h-referenced) vertical coordinate system. The mixing-layer height (h) was first estimated following an integral method that integrates the information of temperature, humidity, and cloud. After that, a so-called h-referenced vertical distribution of O3 was determined by averaging all individual profiles expressed as a function of rather than z (where z is altitude). We found that the vertical stratification of O3 is distributed heterogeneously in the lower troposphere, with stronger vertical gradients at the surface layer and ML–FT interface. There are low vertical autocorrelations of O3 between the ML and FT but high autocorrelations within each of the two atmospheric compartments. These results suggest that the ML–FT interface acts as a geophysical “barrier” separating air masses of distinct O3 loadings. This barrier effect varies with season and city, with an ML–FT detrainment barrier in summer (autumn) and an FT–ML entrainment barrier in other seasons in Beijing (Hong Kong). Based on a Student's t test, daily h-referenced O3 profiles were further classified into three typical patterns: MLO3-dominated, FTO3-dominated, and uniform distribution. Although the FTO3-dominated pattern occurs most frequently during the whole study period (69 % and 54 % of days in Beijing and Hong Kong, respectively), the MLO3-dominated pattern prevails in the photochemically active season, accounting for 47 % of summer days in Beijing and 54 % of autumn days in Hong Kong. These occurrences of the MLO3-dominated pattern are significantly more frequent than in previously reported results at northern mid-latitudes, indicating intensive photochemical MLO3 production under the high-emission background of a Chinese megacity. From a FTO3-dominated to MLO3-dominated pattern, the O3 precursor CH2O (NO2) experiences a substantial increase (decrease) in Beijing but a slight change in Hong Kong. Vertically, the increment of CH2O is larger in the upper ML, and the decrement of NO2 is larger in the lower ML. Such vertical changes in O3 precursors push O3 production sensitivity away from the VOC-limited regime and facilitate high-efficiency production of O3 via photochemical reactions, particularly in the upper ML of Beijing.
- Article
(6854 KB) - Full-text XML
- BibTeX
- EndNote


Ozone (O3), the dominant precursor of hydroxyl radicals, plays a crucial role in tropospheric chemistry. It is also an important greenhouse gas closely related to climate change and environmental issues (Seinfeld and Pandis, 2016; Monks et al., 2015). Being an air pollutant, O3 can influence air quality on a hemispheric scale, exerting detrimental effects on human health and vegetation (Fleming et al., 2018; Mills et al., 2018). Tropospheric O3 is primarily formed through a complex series of photochemical reactions between nitrogen oxides (NOx) and volatile organic compounds (VOCs) in the presence of sunlight (Seinfeld and Pandis, 2016). There are substantial emissions of NOx and VOCs in urban regions, where most of the population and industry are concentrated. As a result, elevated O3 concentrations in the lower troposphere remain a persistent environmental problem in urban regions around the world (Lu et al., 2018). Significant efforts have been made to understand O3 pollution in different cities (Monks et al., 2015). However, most previous studies were based on ground-based observations and gave only limited insight into O3 vertical distribution.
The O3 vertical distribution in the lower troposphere can provide very important information for mechanistic understanding of surface O3 pollution (He et al., 2021; Lin et al., 2010; Jaffe, 2011; Yates et al., 2017). One of the major advantages when dealing with O3 profile data is the ability to discriminate between the two specific O3 components corresponding to the two “reservoirs” – the mixing layer (ML) and the free troposphere (FT) – and therefore to determine the direction and intension of vertical exchange processes across the ML–FT interface. Several studies have been carried out to try to resolve the O3 vertical exchange problem in the lower troposphere (Neuman et al., 2012; Berkes et al., 2016; Kaser et al., 2017; Trousdell et al., 2016; Zhao et al., 2019; Lin et al., 2010; Zhu et al., 2020). For example, based on tethered ozone soundings during a 4 d ozone episode in southern Taiwan, Lin et al. (2010) revealed that the increase rate of the surface O3 concentration due to the downward mixing of the O3 from the O3 reservoir layers can be as high as 12–24 ppbv h−1 in the late morning. Based on 214 aircraft vertical profiles in Colorado during the summer of 2014, Kaser et al. (2017) investigated the O3 vertical gradient between the ML and the FT in order to estimate the FT–ML O3 entrainment and to evaluate its representation in the Weather Research and Forecasting model with Chemistry (WRF-Chem) model. Their study focusing on the O3 entrainment highlighted deficiencies in the model, indicating an overestimation of the O3 entrainment and a too-efficient vertical mixing in the lower ML. These deficiencies were found to originate mainly from errors in the entrainment rate and ML height during the morning and an erroneous representation of the O3 gradient at the ML–FT interface during the rest of the day. Overall, by measuring the specific terms in the vertical O3 budget, detailed comparisons with photochemical models can uncover distinct weaknesses in the current models and discern whether the difficulties lie in dynamical (transport) or chemical aspects of the numerical efforts (Trousdell et al., 2016).
O3 vertical stratification below and above the ML–FT interface (i.e. the mixing-layer height, h) is the basis for ozone vertical exchange processes. The formation of O3 stratification is mainly due to the fact that the turbulent–convective ML and overlying FT are usually separated by the mixing-layer capping inversion, which acts as a transport barrier (Donnell et al., 2001). This barrier is indicated by steep vertical gradients of meteorological variables and chemical constituents (Petetin et al., 2018; Wyngaard and Brost, 1984; Williams et al., 2011). This means that the climatological h-referenced O3 vertical distribution in the lower troposphere could provide a useful reference for understanding vertical exchange processes and validating air quality numerical models. However, tropospheric O3 climatology is traditionally formed in a sea-level-referenced vertical coordinate system (Ding et al., 2008; Liao et al., 2021; Diab et al., 2004; Yonemura et al., 2002; Stauffer et al., 2016). Owing to day-to-day variation in the mixing-layer top height, vertical stratification introduced in all the individual profiles can be substantially smoothed in the climatological profile when adopting the traditional vertical coordinate system. To address this issue, Petetin et al. (2018) proposed an h-referenced climatology of lower-tropospheric O3 profiles based on aircraft and ozonesondes at northern mid-latitudes over 1994–2016. When adopting this h-referenced vertical coordinate system, O3 vertical stratification can be well preserved in the lower-tropospheric O3 climatology, demonstrating a significant improvement in capturing possible specific features (i.e. stratification) in the O3 vertical distribution that would be smoothed with a simple average, in particular at the ML–FT interface. However, the h-referenced O3 climatology in Petetin et al. (2018) is a hemispheric-scale composite result, which cannot represent the state over polluted urban regions, including megacities.
O3 pollution has long been a significant environmental issue in China, despite the 2013 Clean Air Action Plan. In recent photochemically active seasons, O3 overtook fine particles as the most important air pollutant in the three major city agglomerations: the North China Plain (NCP), the Yangtze River Delta (YRD), and the Pearl River Delta (PRD). As such, urban O3 pollution is becoming a priority for scientific research and control strategies in China (Lu et al., 2018; T. Wang et al., 2022), and numerous studies have explored the spatiotemporal characteristics and formation mechanisms of surface O3 pollution, as summarized in Wang et al. (2017) and T. Wang et al. (2022). Moreover, there are ongoing efforts to understand the role of vertical exchange in surface O3 pollution in China based on vertical observations from tower-based, tethered-balloon-based, uncrewed-aerial-vehicle-based, aircraft-based, and lidar-based observations (Lin et al., 2010; Zhao et al., 2019; He et al., 2021; Benish et al., 2020; Zhu et al., 2020; Han et al., 2020; Chen et al., 2023). These vertically observational studies generally indicate that merging of the stable boundary layer, residual layer, and convection-driven mixing layer involves the mixing of trace gases from these different atmospheric layers and leads to complex vertical O3 profiles. However, these existing O3 vertical observations suffer from a low observation height (tower-based, tethered-balloon-based, and uncrewed-aerial-vehicle-based observations), short observation period (tethered-balloon-based, aircraft-based, and uncrewed-aerial-vehicle-based observations), and low observation accuracy (lidar-based observation), making them less able to provide a complete and accurate O3 vertical distribution for the whole lower troposphere, not to mention the h-reference lower-tropospheric O3 climatology.
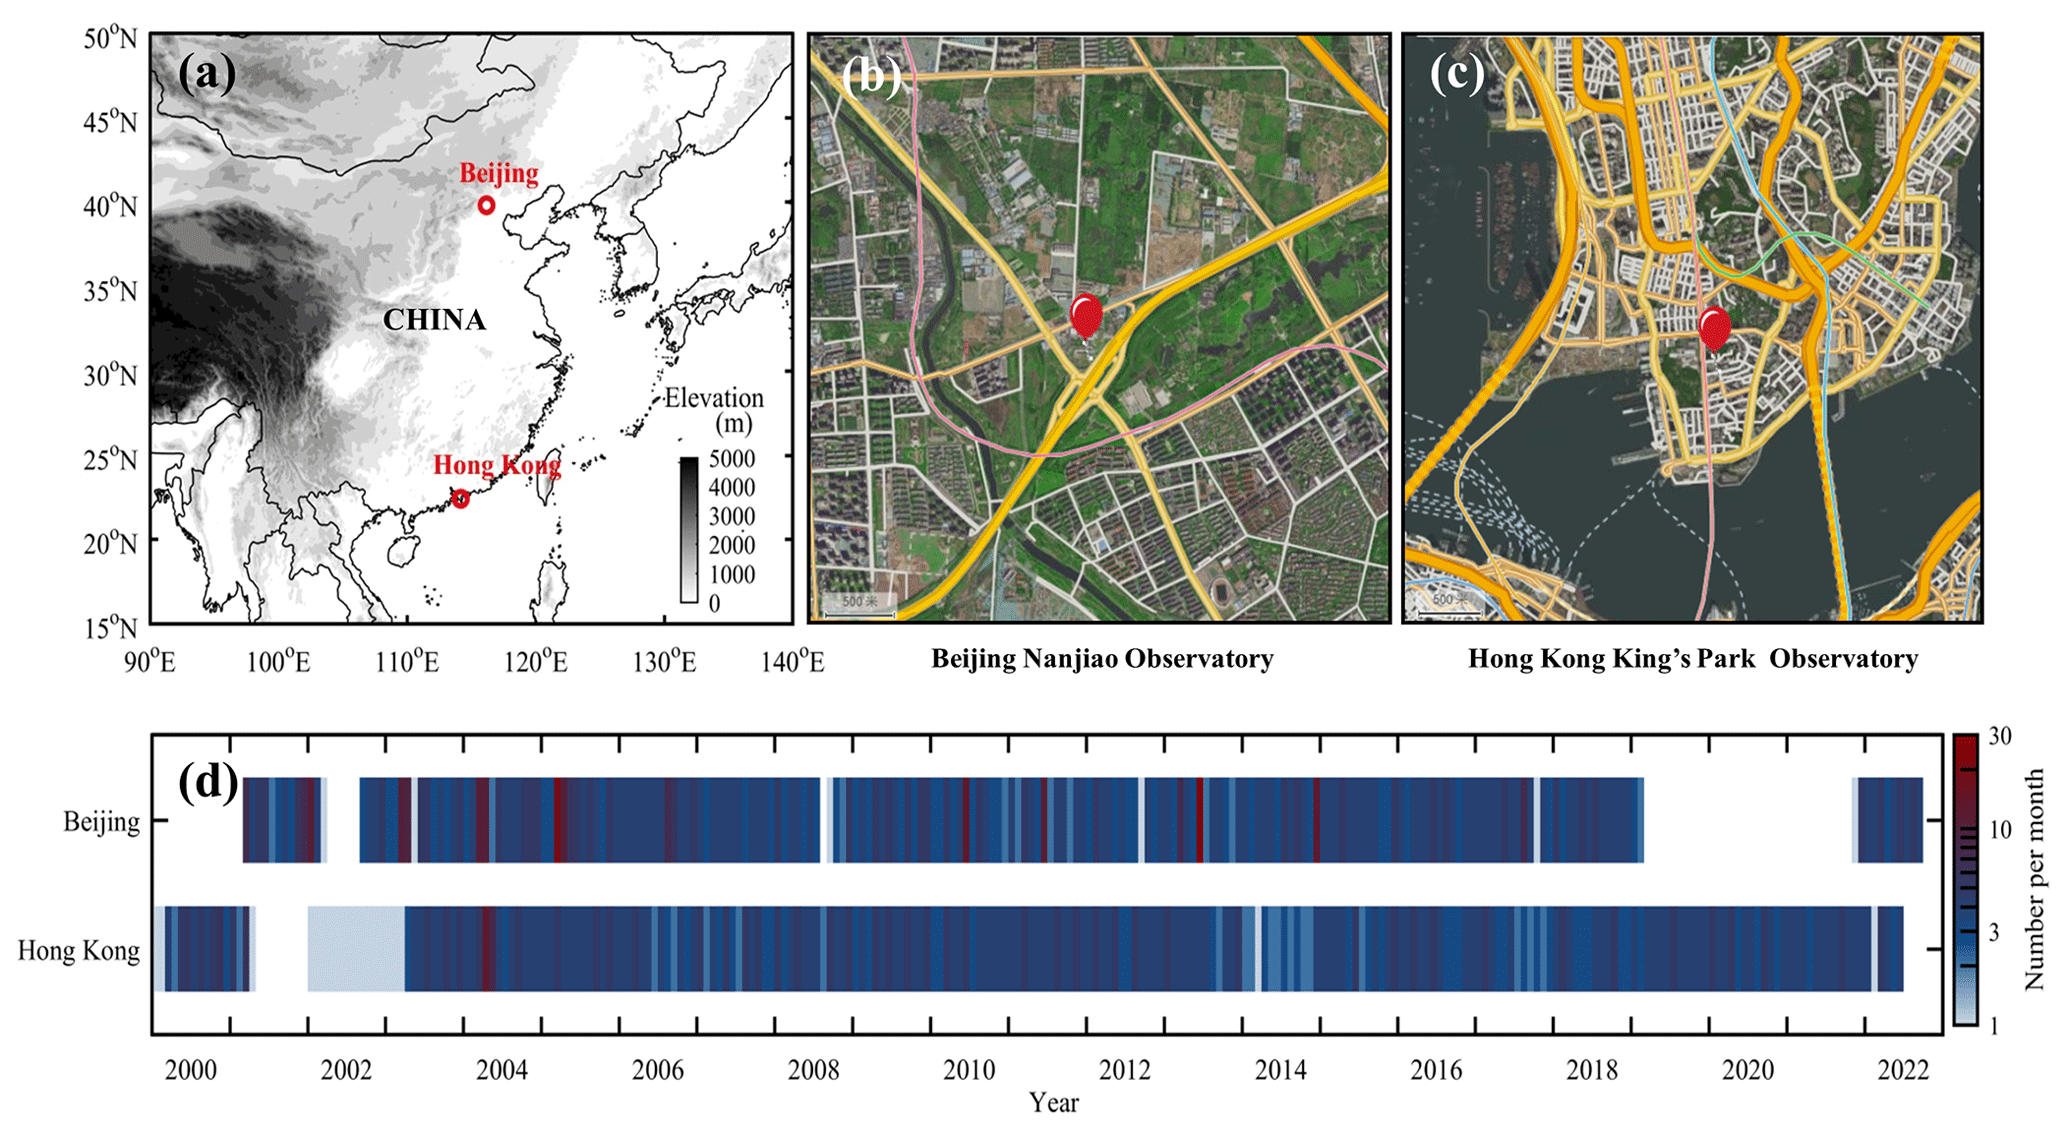
Figure 1(a) Coordinates and surrounding environments of ozonesonde sites at (b) Beijing Nanjiao Observatory and (c) Hong Kong's King's Park Observatory. (d) Monthly distribution of the available ozonesonde observations. Map image: © Amap.
To our knowledge, ozonesonde represents the most accurate observation method for O3 profiles in the troposphere. Therefore, in this study, we collected ozonesonde data observed in Beijing (northern China, Fig. 1a) and Hong Kong (southern China, Fig. 1a) to investigate the h-reference O3 vertical distribution in the lower troposphere over Chinese megacities. In addition, we also considered satellite-based O3 precursor data, atmospheric composition reanalysis data, an integral method to determine the mixing-layer top height h, and a photochemical indicator method to diagnose the O3 production sensitivity. The specific aims of the study were to explore (1) the degree to which lower-tropospheric O3 over megacities stratifies in the h-reference vertical coordinate system, (2) patterns in lower-tropospheric O3 profiles in the h-reference vertical coordinate system, (3) how meteorological and photochemical processes modulate O3 vertical distribution patterns in the lower troposphere, and (4) differences in the characteristics and mechanisms of the lower-tropospheric O3 vertical distribution between Beijing and Hong Kong. The results of this study offer a reference for better understanding O3 pollution in urban regions.
2.1 Ozonesonde measurements
We used ozonesonde data collected by Beijing Nanjiao Observatory (116.47° E, 39.80° N; 33 m) and Hong Kong's King's Park Observatory (114.17° E, 22.31° N; 66 m) from 2000 to 2022 (Fig. 1). Beijing Nanjiao Observatory is located in the southern suburbs of Beijing (Fig. 1b), while Hong Kong's King's Park Observatory is situated within the urban core of Hong Kong (Fig. 1c). Both sites are affected by urban traffic emissions (Fig. 1b and c). Ozonesondes accompanied by radiosondes were regularly launched at approximately 13:30 local standard time (LST) once a week and provided high-vertical-resolution profiles of O3, temperature, pressure, and humidity. We excluded data from ozonesondes launched outside a time window of 12:00–15:00 LST in order to minimize changes in mixing-layer O3 arising from different launch times. We interpolated the original profiles on a fixed vertical grid of 20 m vertical resolution. To reduce uncertainties associated with data gaps, we further discarded (i) profiles with >25 % missing data between 0 and 4 km (i.e. accumulated data gaps of m) and/or (ii) profiles with >10 missing data points between the surface and estimated mixing-layer heights (i.e. accumulated data gaps of m). After data exclusion, 1897 ozonesondes were available for study: 924 soundings in Beijing and 973 soundings in Hong Kong. Figure 1d shows the monthly distribution of the available ozonesondes.
2.2 Meteorological and atmospheric composition reanalysis
The fifth-generation reanalysis (ERA5) data from the European Centre for Medium-Range Weather Forecasts (ECMWF) were used to characterize synoptic meteorological conditions. The meteorological variables include the geopotential height and horizontal wind vector at 850 hPa as well as downward ultraviolet radiation at the surface. ERA5 is generated by 4-D variational data assimilation of the ECMWF's Integrated Forecast System and predictions from the CF41R2 model (Hersbach et al., 2020). It has a spatial resolution of 0.25°×0.25°. In addition, pressure-level CH2O and NO2 data from the fourth-generation ECMWF Atmospheric Composition Reanalysis (EAC4) were also used to characterize O3 precursor concentrations and to diagnose the vertical O3 production sensitivity. The EAC4 combines model data with global satellite observations into a complete and consistent dataset using a model of the atmosphere based on the laws of physics and chemistry (Inness et al., 2019). It was available at 3 h resolution for a horizontal resolution of 0.75°×0.75° and a vertical resolution of seven layers below 700 hPa (1000, 950, 925, 900, 850, 800, and 700 hPa). All the above-mentioned reanalysis data at 06:00 UTC from 2003 onwards were used to support our interpretation of sonde-based O3 vertical distribution.
2.3 Determination of the mixing-layer top height h
Several approaches have been developed to estimate h based on the gradient variation of individual atmospheric variables from radiosonde data (Seidel et al., 2010), including temperature (T), potential temperature (θ), relative humidity (RH), specific humidity (q), and atmospheric refractivity (N). However, there are substantial differences in the existing methods. Wang and Wang (2014) proposed a three-step method to integrate temperature, humidity, and cloud data to generate a consistent estimate of h from radiosonde profiles: step 1 identifies the height (h0) that best meets the individual criteria for different atmospheric variables, step 2 derives the location of the cloud, and step 3 determines a consistent mixing-layer height (hcon). We adopted this integral method to determine the mixing-layer heights in Beijing and Hong Kong. Five atmospheric variables, i.e. T, θ, RH, q, and N, were used. Among them, T and RH were measured by radiosonde, and the other variables were calculated from T, RH, and atmospheric pressure (Seidel et al., 2010). The upper limit of h was set to 4 km.
2.4 h-referenced vertical distribution and classification
Once the mixing-layer height h was determined, all the profiles were expressed in the vertical coordinate system, where z is the actual altitude. In practice, atmospheric variables were interpolated along values ranging between 0 (the surface) and 2 (2×h) with a vertical resolution of 0.05 (i.e. 41 altitude levels). For instance, if h in a specific profile was 1000 m, the resampled profile extended from 0 to 2000 m with bins of 50 m. Hereafter, this type of vertical profile is denominated as a mixing-layer-height-referenced (i.e. h-referenced) profile. In this vertical coordinate system, mixing-layer O3 was denominated as MLO3 and free-tropospheric O3 was denominated as FTO3. Based on a Student's t test, we further classified individual h-referenced O3 profiles into three distinct patterns: MLO3-dominated (mean MLO3 significantly higher than mean FTO3 at a significance level of 0.01), FTO3-dominated (mean MLO3 significantly lower than mean FTO3 at a significance level of 0.01), and uniform distribution (no significant differences between the means of MLO3 and FTO3).
2.5 Diagnosis of ozone production sensitivity
O3 is photochemically generated when its precursors (e.g. NOx and VOCs) are abundant in the presence of sunlight (Seinfeld and Pandis, 2016). Owing to complex chemical mechanisms and regional differences in emissions and meteorology, the relationship between O3 and its precursors involves highly non-linear interactions (Jin et al., 2020). Under high-VOC and low-NOx conditions, O3 production is not sensitive to VOCs but is positively correlated with NOx (i.e. a NOx-sensitive regime). Under low-VOC and high-NOx conditions, O3 production tends to increase with VOC growth or NOx reduction (i.e. a VOC-sensitive regime). In this study, the ratio (FNR) was used as the photochemical indicator to diagnose O3 production sensitivity. An inherent challenge of this diagnosis approach is that FNR thresholds marking the VOC–NOx transition regime are likely distinct from region to region (Jin et al., 2020). For the NCP region (including Beijing), Li et al. (2021) diagnosed the transition regime as occurring when FNR ranges from 1.2 to 2.1; for the PRD region (including Hong Kong), Liao et al. (2021) diagnosed the transition regime as occurring when FNR ranges from 1.0 to 1.5. Ratios below and above these ranges indicate VOC-limited O3 production and NOx-limited regimes, respectively. These localized FNR thresholds were adopted in this study to diagnose O3 production sensitivity.
3.1 Lower-tropospheric ozone climatology
Figure 2 shows the traditional lower-tropospheric O3 climatology of Beijing and Hong Kong. Seasonal results are averaged from ozonesonde profiles collected in spring (M–A–M), summer (J–J–A), autumn (S–O–N), and winter (D–J–F). There is a typical summer high seasonality–winter low seasonality in the lower-tropospheric O3 over Beijing, with the highest O3 concentrations in June. Such seasonality is broadly similar to the previous tropospheric O3 climatology based on lesser O3 profiles in Beijing (Ding et al., 2008; Zhang et al., 2021). In photochemically active months (May–August), high-concentration O3 is photochemically produced throughout the lower troposphere, particularly in the mixing layer, causing an isolated O3-peak area (>100 ppbv) near the upper mixing layer. In the other months, strong urban NO titration accompanied by weak O3 production causes a positive vertical gradient of O3 concentration in the lower troposphere; the average vertical gradient of O3 reaches a maximum in winter.
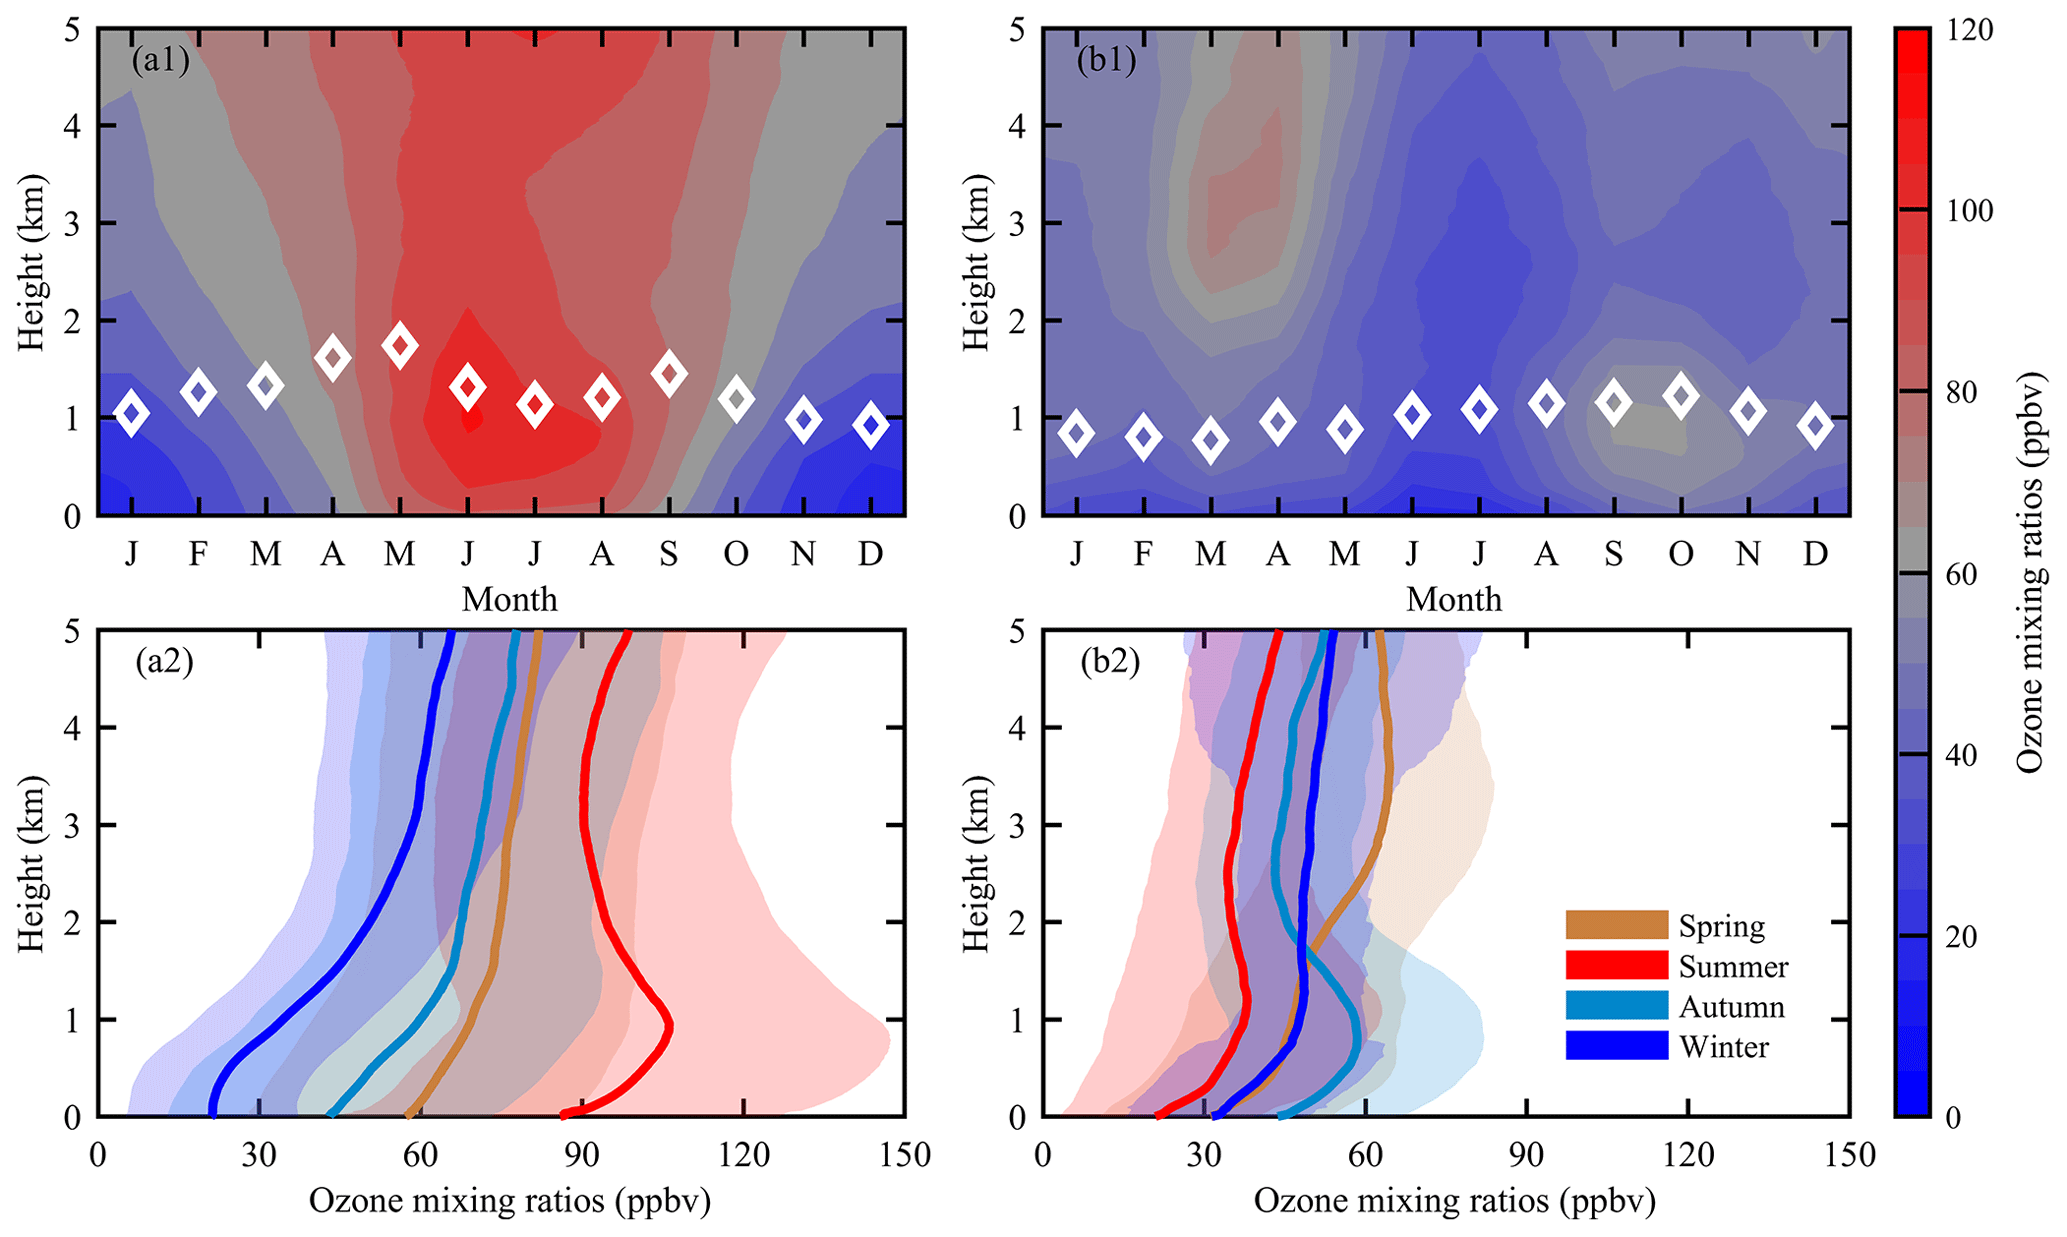
Figure 2Lower-tropospheric ozone vertical distribution over (a) Beijing and (b) Hong Kong. (a1, b1) Monthly variation. (a2, b2) Seasonal variation. The white diamonds in panels (a1) and (b1) represent the monthly mean mixing-layer height. The shaded areas in the lower panels denote the standard deviation.
The lower-tropospheric O3 climatology in Hong Kong is remarkably different from that in Beijing. In particular, lower-tropospheric O3 is low in the summertime (<40 ppbv). Similar O3 minima have been reported in other subtropical cities in eastern Asia, such as Hanoi and Naha (Liao et al., 2021; Oltmans et al., 2004; Ogino et al., 2013), and likely reflect the influence of the Asian summer monsoons, which bring maritime air with low O3 northward from the tropical Pacific to subtropical regions. Although Beijing is also impacted by the Asian summer monsoons, these ocean-sourced air masses become enriched with O3 precursors while passing over polluted eastern China, leading to an accumulation of O3 over Beijing. Interestingly, there are two isolated areas of O3 enhancement over Hong Kong: those in the lower free troposphere (∼3.5 km) from March to April and those in the upper mixing layer (∼0.8 km) in autumn. The former is attributed to long-range transport of wildfire-related O3 production in the upwind Indochina Peninsula, and the latter results from local O3 production via photochemical reactions under hot and dry weather conditions in autumn (Liao et al., 2021).
3.2 Mixing-layer-height-referenced ozone vertical distribution
We investigated the climatological vertical stratification of O3 below and above the ML–FT interface (i.e. mixing-layer height h) over Beijing and Hong Kong (Fig. 3). This h-referenced O3 climatology provides an additional dimension (further categorization by mixing-layer height) not available in traditional vertical ozone profile climatology. The significant disparity between the h-referenced O3 climatology (Fig. 3) and traditional O3 climatology (Fig. 2) illustrates how much information is lost using simple ozonesonde averages. For example, the h-referenced O3 profiles show a clear inflexion (or discontinuity) at the interface between the ML and FT (), which is not apparent in the traditional O3 climatology. These results reflect the fact that mixing-layer capping inversion acts as an effective although porous geophysical barrier that limits vertical exchange between the ML and FT, leading to distinct O3 levels on either side.
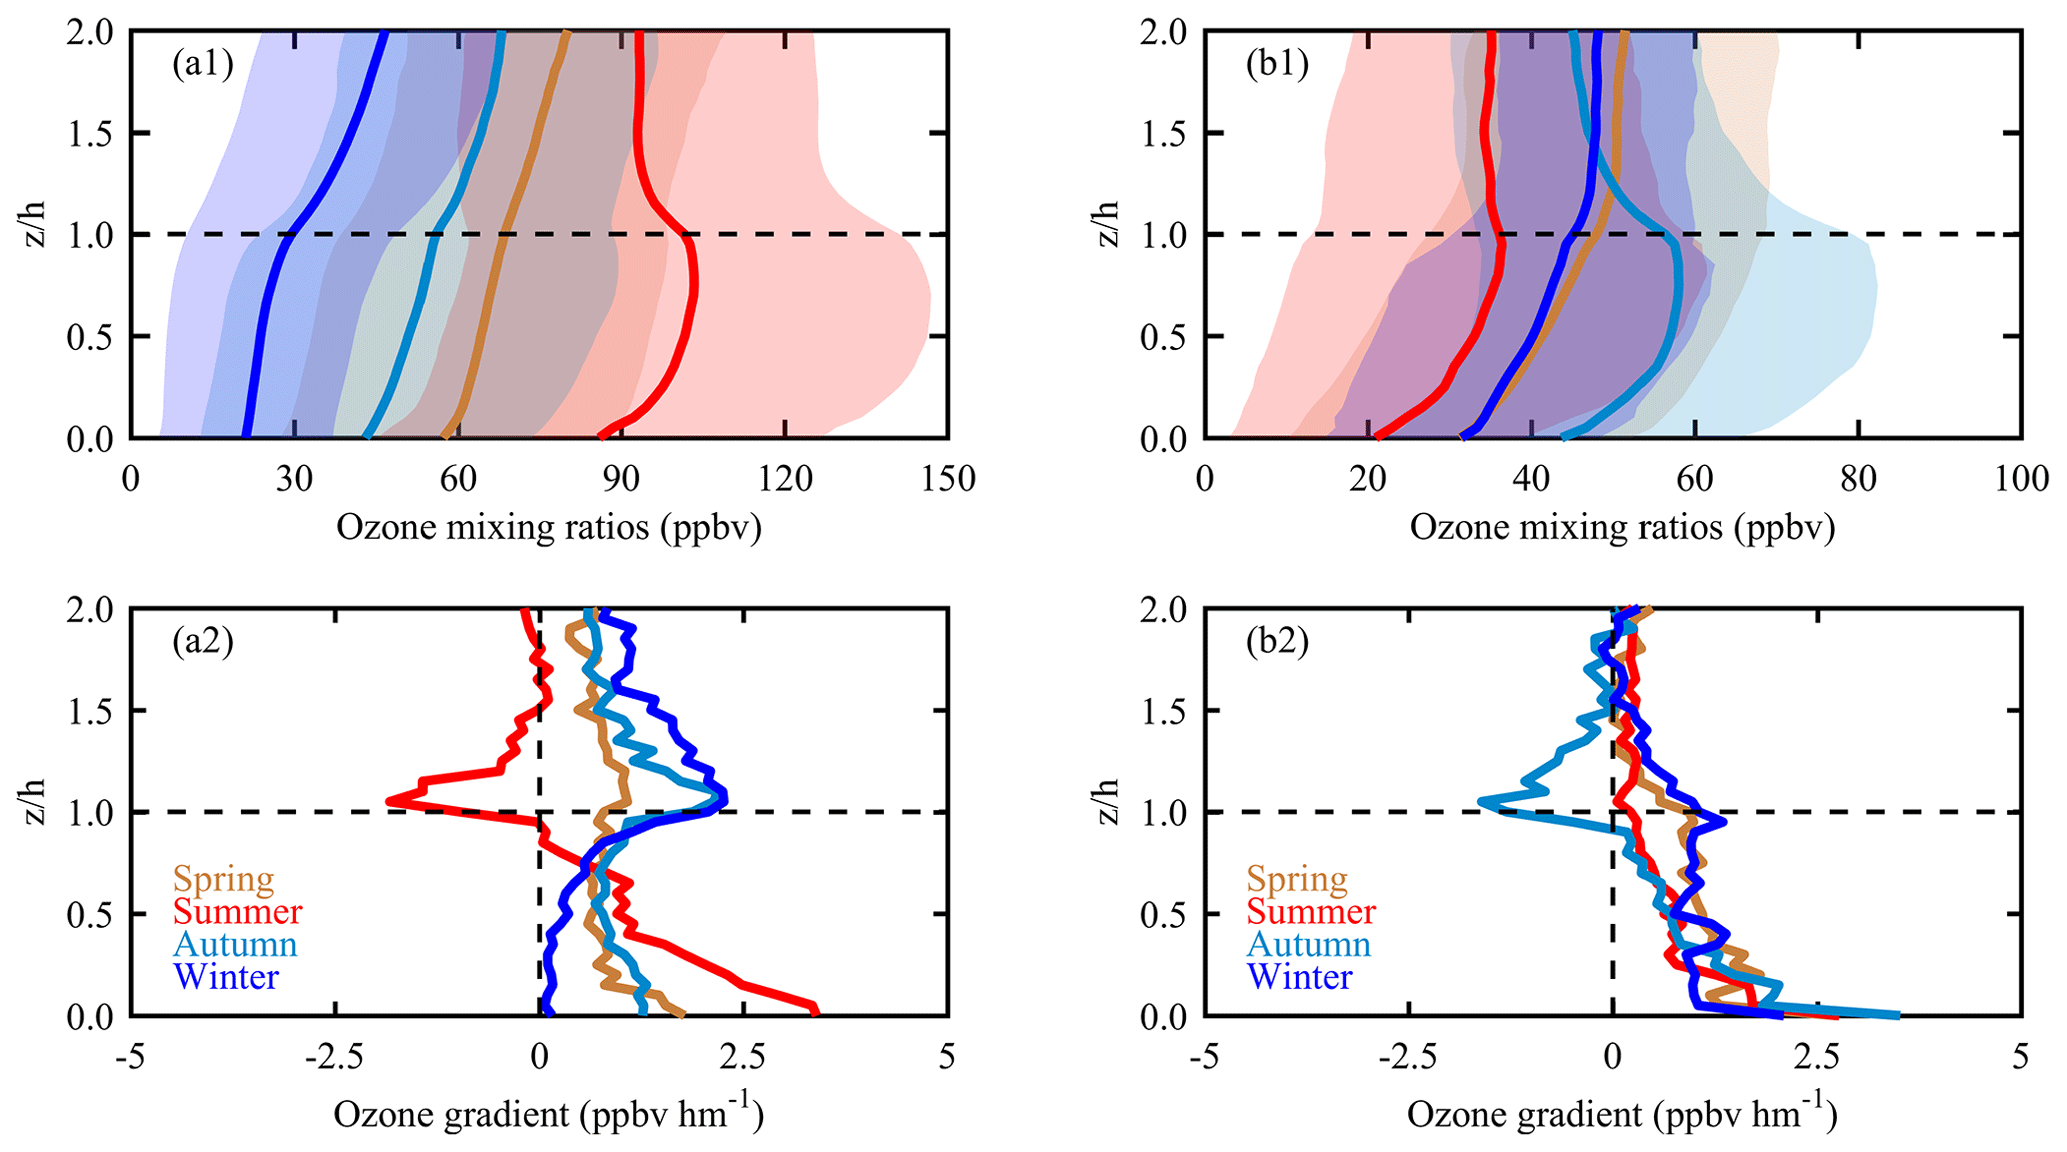
Figure 3Mixing-layer-height-referenced ozone vertical distribution over (a) Beijing and (b) Hong Kong. (a1, b1) Ozone mixing ratio profile. (a2, b2) Ozone gradient profile. The shaded areas in the upper panels denote the standard deviation.
In Beijing, seasonal O3 profiles in autumn, winter, and spring present a low-ML and high-FT vertical distribution pattern with O3 mixing ratios that increase with altitude throughout the lower troposphere and variable vertical gradients depending on season and altitude. Generally, the strongest gradients are observed either close to the surface or near the ML–FT interface. Near the surface, they are likely due to strong O3 titration by NO emitted from urban traffic (Karl et al., 2023). Near the ML–FT interface, they are likely attributable to the barrier effect of mixing-layer capping inversion. The O3 gradients gradually decrease with altitude above the ML–FT interface; below the interface, they slightly decrease with altitude in spring and autumn but gradually increase with altitude in winter. Winter O3 gradients are almost zero in the surface layer (), reflecting strong titration that often causes O3 to be almost completely depleted in the lower ML. In summer, the averaged O3 profile exhibits a sickle-shaped pattern, with a marked drop in concentrations from the upper ML to the lower FT. Summer O3 gradients quickly decrease with altitude inside the ML and eventually become negative near the ML–FT interface. The maximum negative gradient (−2.2 ppbv hm−1) occurs just above the mixing-layer top height. In Hong Kong, the averaged O3 profiles in winter and spring present a low-ML and high-FT vertical distribution, similar to Beijing. However, the autumn-averaged O3 profile shows a sickle-shaped pattern, similar to the summer profile in Beijing. In contrast, the summer-averaged O3 profile in Hong Kong displays a transitional feature from spring to autumn characterized by a weak O3 peak just below the ML–FT interface. Compared with Beijing, the O3 gradients in Hong Kong vary across a smaller range; however, they are commonly sharper in the surface layer.
For both Beijing and Hong Kong, the highly variable O3 gradients in the ML confirm that the well-mixed ML remains a large exception for O3, even on summer afternoons when vertical turbulent mixing is expected to be strongest. In particular, the increasing O3 with altitude in the lower ML indicates that strong photochemistry and vertical mixing on summer afternoons is insufficient to quickly compensate for O3 titration consumption () in the surface layer, where NO is largely emitted by urban traffic. A previous study indicated that MLO3 evolution in urban areas adheres to vertical physiochemical circulation involving multiple reactions in the O3–NO–NO2 triad (Tang et al., 2017). NO emissions react with O3 to generate NO2 near the ground, which is then transported vertically to the upper ML. O3 is generated by NO2 photolysis in the upper ML and is then transported down to the surface layer to compensate for the loss by NO titration. In this process, the titration is thought to drive the downward flux of O3 into the urban roughness layer (Karl et al., 2023). Under favourable weather conditions, high-concentration MLO3 production can greatly modify the vertical profile of O3 from the more customary low-ML and high-FT vertical distribution to a high-ML or low-FT vertical distribution. This modification is thought to be episodic in low-emission cities (e.g. Frankfurt; Petetin et al., 2016). In such cities, the vertical structure of averaged O3 profiles in the photochemically active season (e.g. summer) keeps the low ML or high FT the same throughout the year (Petetin et al., 2018). However, in high-emission megacities (e.g. Beijing and Hong Kong), photochemistry-driven modification can be expected to be common during in the photochemically active season (summer in Beijing and autumn in Hong Kong), eventually causing a seasonal sickle-shaped O3 profile in the lower troposphere. These seasonal differences in lower-tropospheric O3 profiles imply that the aforementioned transport barrier to vertical exchange has different connotations, typically changing from an ML–FT detrainment barrier in summer (autumn) to an FT–ML entrainment barrier in the other seasons in Beijing (Hong Kong).
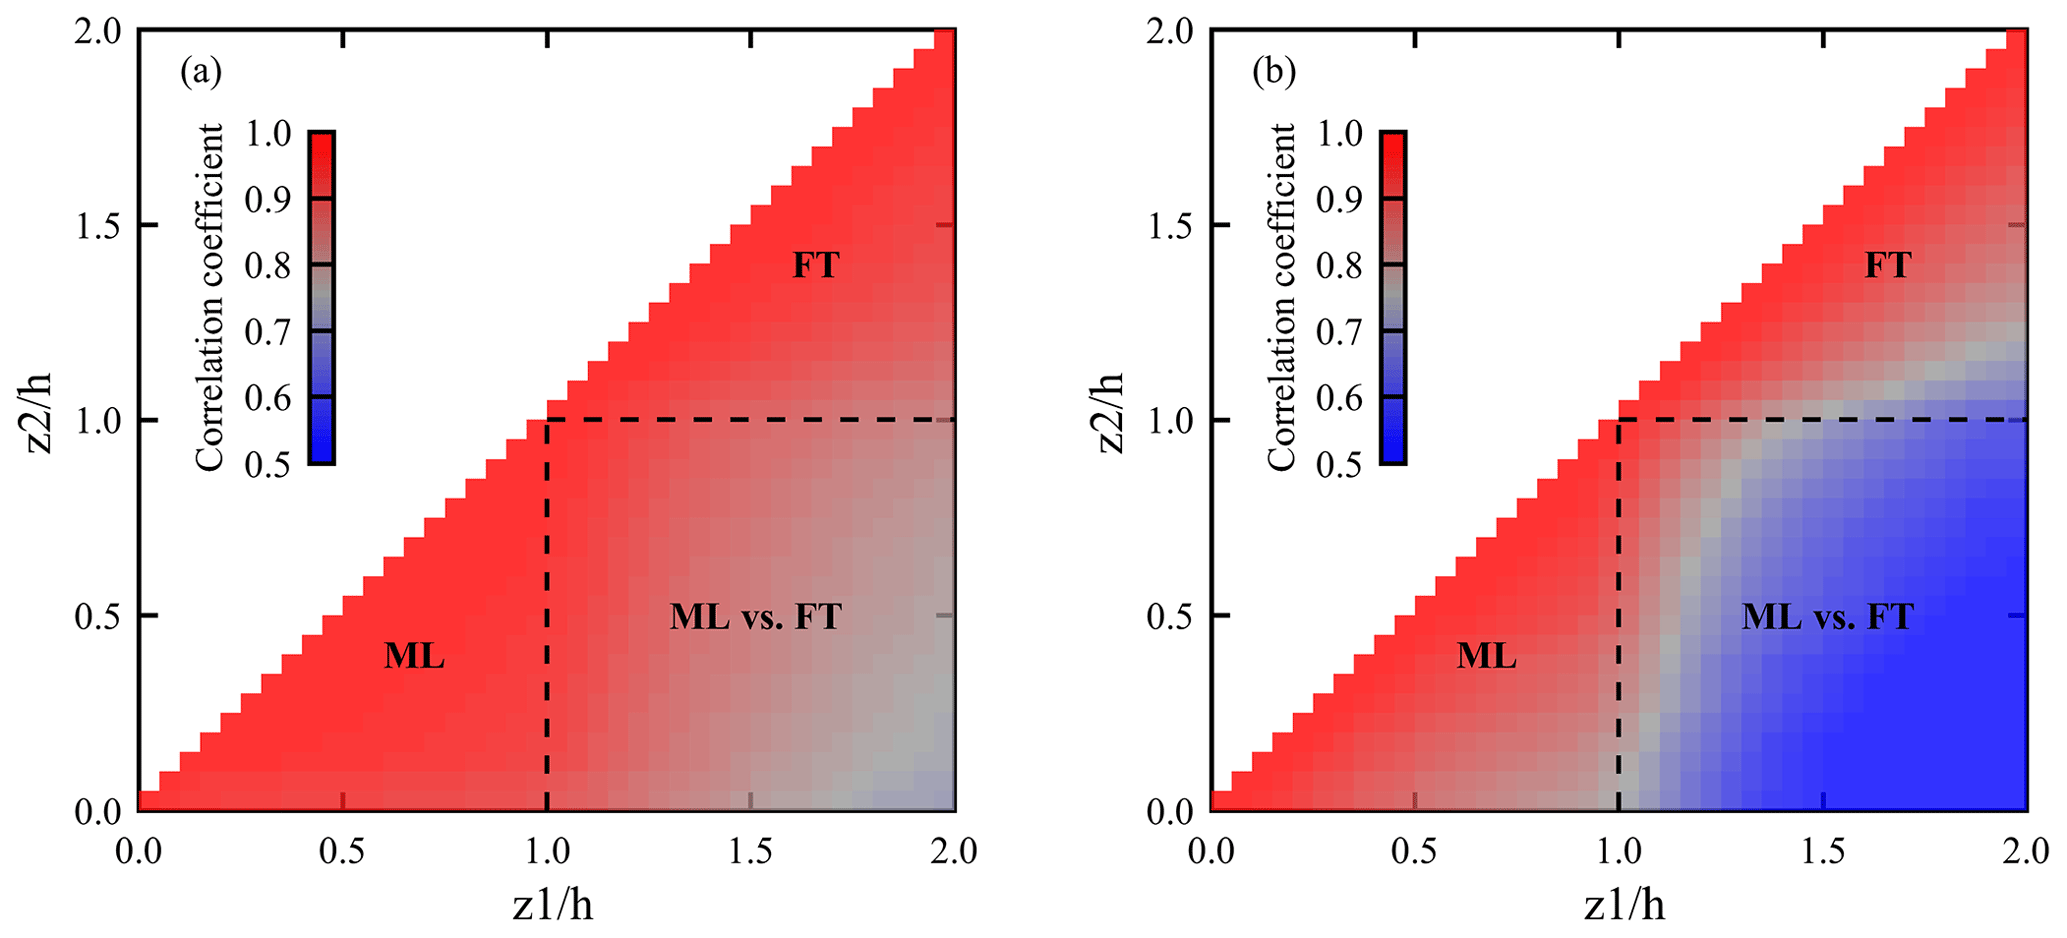
Figure 4Autocorrelation of ozone mixing ratios between different altitude levels over (a) Beijing and (b) Hong Kong. Dashed lines separate three areas involving correlation within the mixing layer (ML), within the free troposphere (FT), and between the mixing layer and free troposphere (ML vs. FT).
The vertical autocorrelation of O3 in the vertical coordinate system was further analysed to investigate the links between the ML and FT. Based on all the individual O3 profiles, we calculated the correlation coefficients of O3 between the different pairs of altitude levels. The obtained O3 vertical autocorrelation matrix is shown in Fig. 4. Within both the ML ( between 0 and 1) and FT ( between 1 and 2), we found strong correlations (usually >0.90, mean of 0.97 in Beijing; >0.85, mean of 0.91 in Hong Kong). However, the correlations between the two atmospheric compartments (ML vs. FT) decreased quickly with vertical distance, with means of 0.84 in Beijing and 0.60 in Hong Kong. In general, correlations in Hong Kong were found to be weaker than those in Beijing. This can be explained by two possible reasons. (i) Hong Kong is a coastal city, where clean maritime air and polluted continental air can dominate at different altitudes (e.g. sea–land breeze); therefore, distinct air mass sources can weaken the correlation of O3 between different altitude levels. (ii) Hong Kong is located in a humid zone, where surface sensible heat is relatively weaker than that in semi-humid zones (e.g. Beijing); therefore, weak turbulent convection causes weak mixing of O3 in the vertical direction (Xu et al., 2021). The iso-correlation contours in both megacities present a “W” shape along the diagonal direction, with the inflexion point at . This is consistent with northern mid-latitude findings in Petetin et al. (2018), indicating that stratification occurs most commonly at the ML–FT interface.
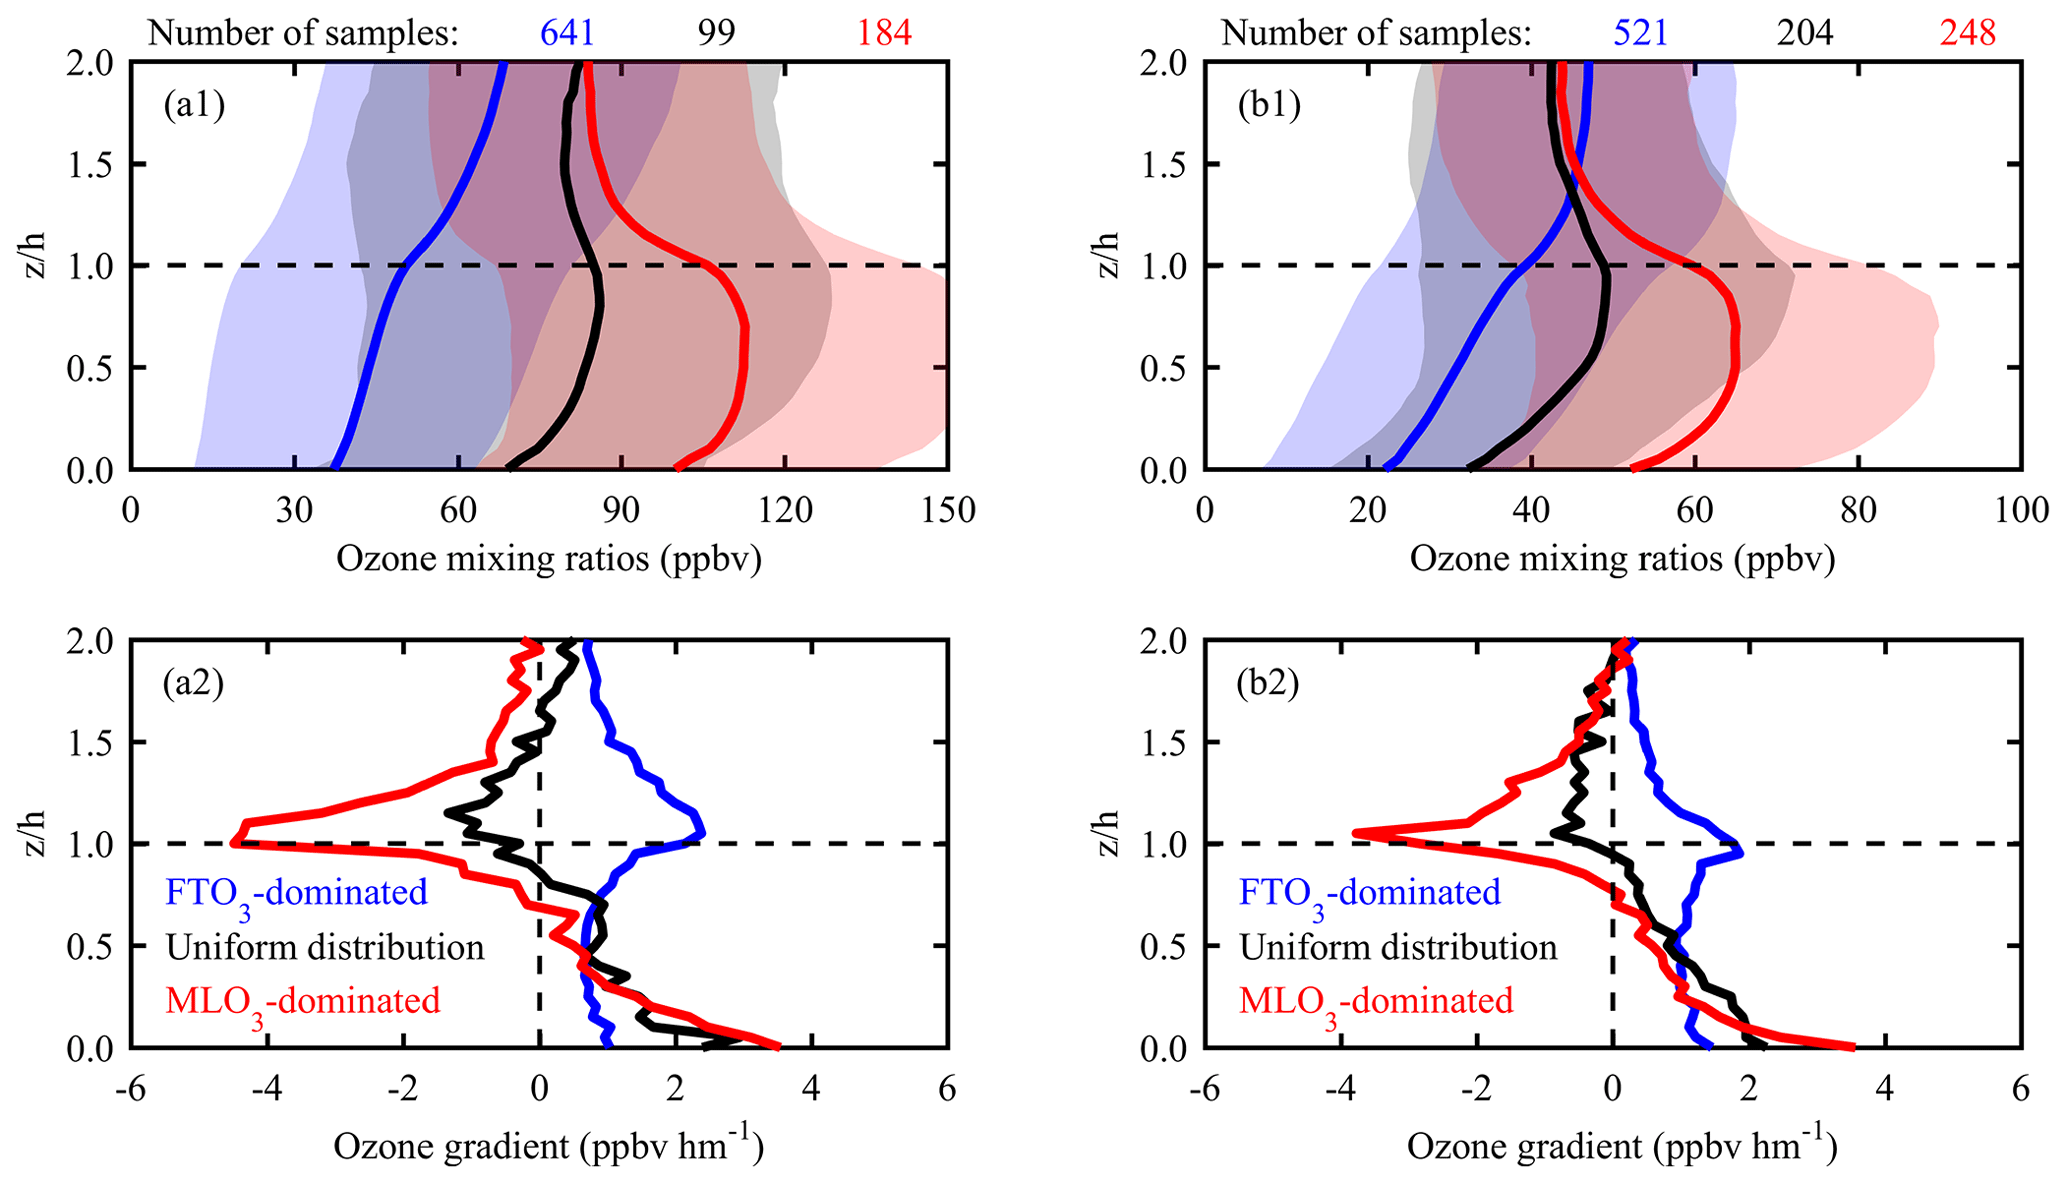
Figure 5Composites of (a1, b1) h-referenced ozone profiles and (a2, b2) h-referenced ozone gradient profiles according to different patterns in (a) Beijing and (b) Hong Kong. The shaded areas in the upper panels denote the standard deviation.
Both the surface concentration and vertical distribution of O3 are highly variable at the synoptic scale and can greatly depart from the standard climatology, depending on the meteorological conditions and the availability of the O3 precursors. Based on a Student's t test, all the individual h-referenced O3 profiles were further classified into three typical patterns to investigate the synoptic climatology of lower-tropospheric O3 in Beijing and Hong Kong. The statistical results indicate that the FTO3-dominated pattern occurs most frequently in both megacities. The respective occurrence frequencies of the FTO3-dominated, uniform, and MLO3-dominated distributions were 69 %, 11 %, and 20 % in Beijing and 54 %, 21 %, and 25 % in Hong Kong, respectively. Figure 5 shows the composite of the O3 (gradient) profiles according to the different O3 profile patterns in Beijing and Hong Kong. In the FTO3-dominated pattern, the averaged FTO3 concentrations are 61.6 ppbv in Beijing and 44.9 ppbv in Hong Kong, which are 15 and 13 ppbv higher than the averaged MLO3 concentrations in the respective cities. Such concentration differences between FTO3 and MLO3 cause a sharp positive gradient of O3 near the ML–FT interface (2.3 ppbv hm−1 in Beijing and 1.8 ppbv hm−1 in Hong Kong). For the MLO3-dominated pattern, the averaged MLO3 concentrations are 109.8 ppbv in Beijing and 62.2 ppbv in Hong Kong, ∼18 ppbv higher than the averaged FTO3 concentrations in both cities, causing a steep negative gradient of O3 near the ML–FT interface (−4.3 ppbv hm−1 in Beijing and −3.8 ppbv hm−1 in Hong Kong). For the uniform distribution, despite no significant difference in the means of MLO3 and FTO3, the composited O3 profile shows an “S”-shaped pattern with a slightly negative gradient (approximately −1.0 ppbv hm−1) near the ML–FT interface.
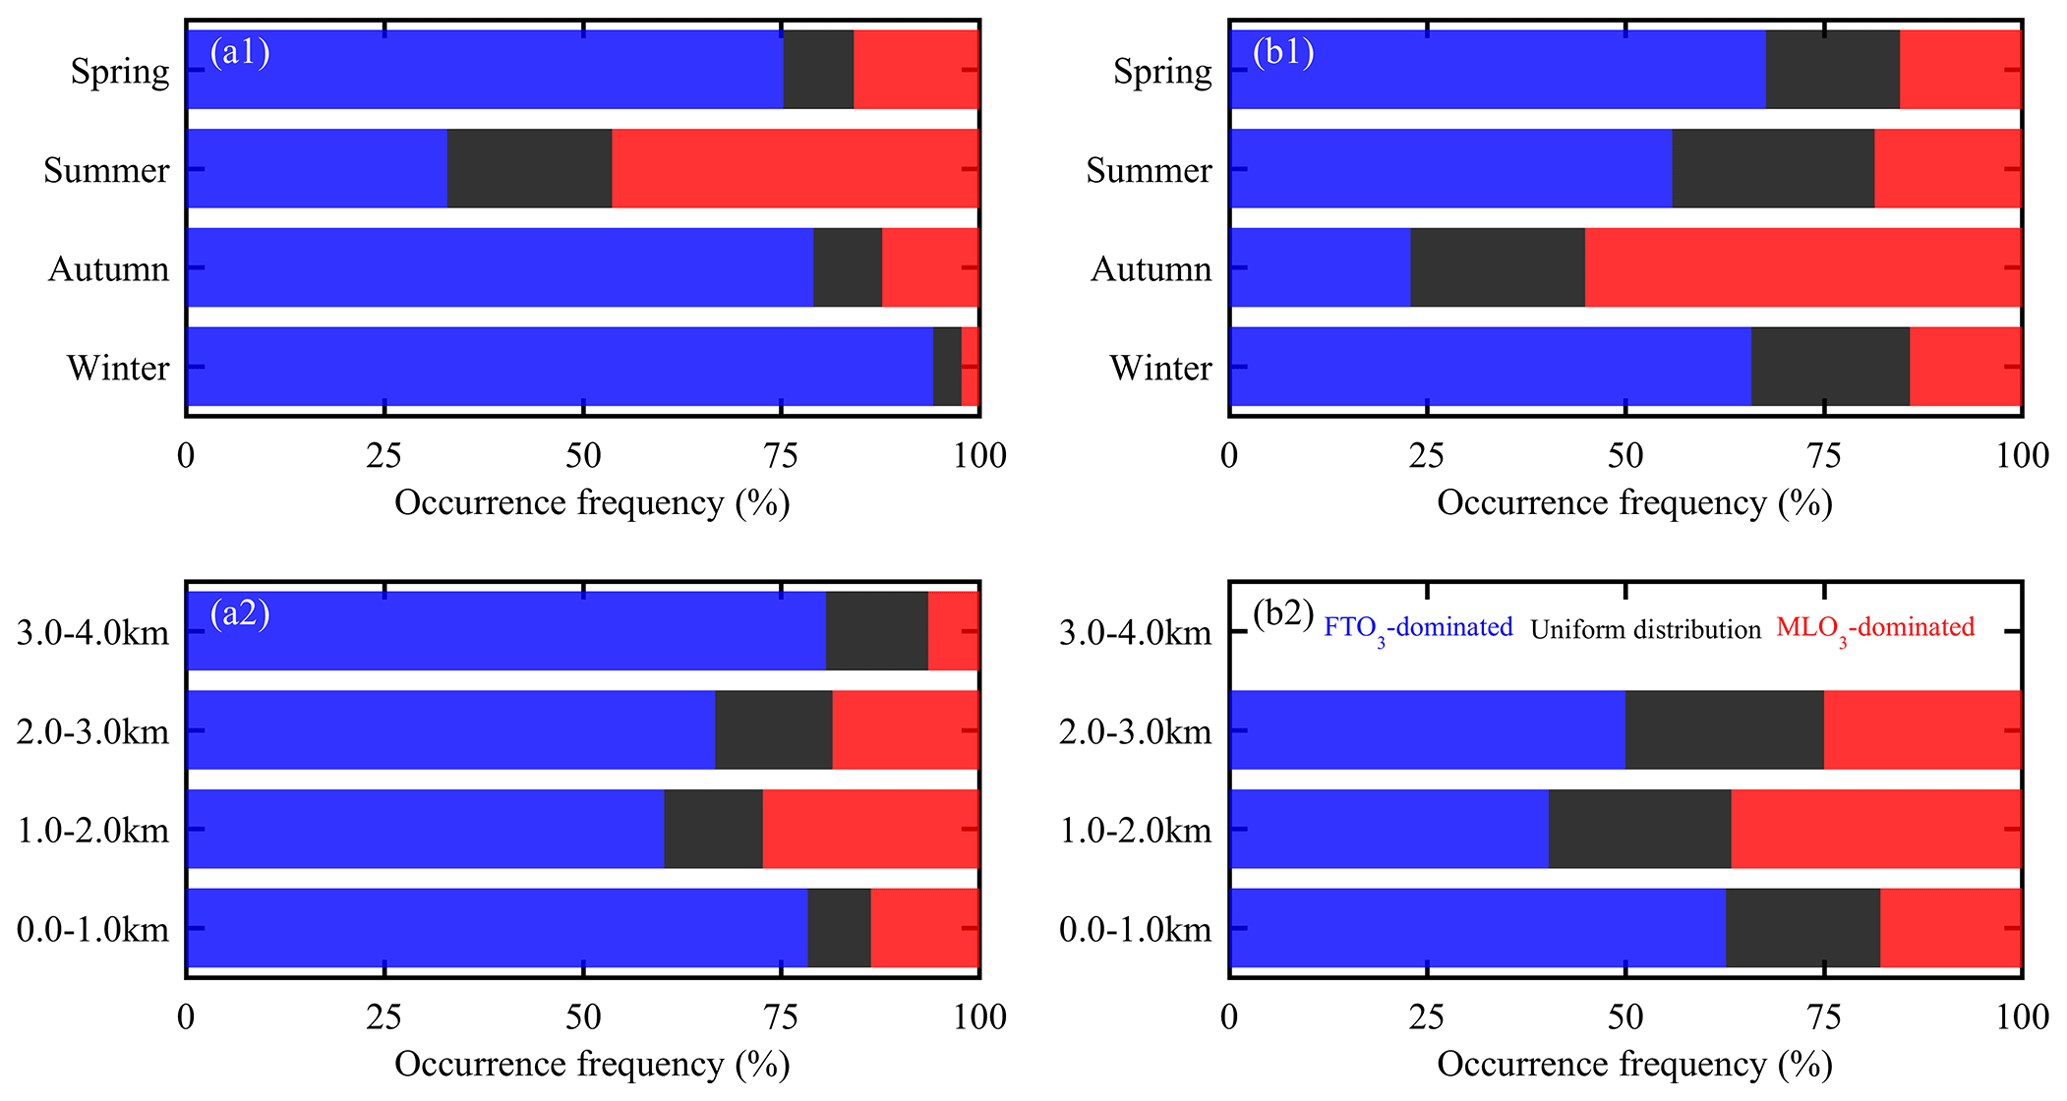
Figure 6Occurrence frequencies of three h-referenced ozone profile patterns according to (a1, b1) season and (a2, b2) mixing-layer height bins in (a) Beijing and (b) Hong Kong (in Hong Kong, no case is found for h>3.0 km).
Figure 6 shows occurrence frequencies of the three distinct O3 profile patterns in different seasons and mixing-layer height bins. In Beijing, while the FTO3-dominated pattern prevails in winter (94.2 %), autumn (79.1 %), and spring (75.3 %), the MLO3-dominated pattern prevails in summer (46.3 %). In Hong Kong, the FTO3-dominated pattern occurs frequently in spring (67.7 %), winter (65.8 %), and summer (55.8 %), and the MLO3-dominated pattern prevails in autumn (55.1 %). Such frequent occurrence of MLO3-dominated patterns confirms our theory that the MLO3-dominated pattern is common rather than episodic in the photochemically active season of high-emission Chinese megacities. In contrast, the occurrence dependence of O3 profile patterns on the mixing-layer height is not as strong as that on the season. The FTO3-dominated pattern prevails in most h bins, particularly in Beijing. Nevertheless, the MLO3-dominated pattern is still relatively more frequent in the h bin between 1.0 and 2.0 km (27.3 % in Beijing and 36.7 % in Hong Kong) than in lower and higher h bins. This is to some degree consistent with the findings of Zhao et al. (2019), who revealed that moderate mixing-layer height is usually accompanied by very favourable meteorological (moderate RH and high temperature) and photochemical (NOx–VOC transition regime) conditions for high-concentration MLO3 production.
3.3 Mechanistic understanding of distinct ozone profile patterns in polluted seasons
This section explores the causal mechanisms of distinct O3 profile patterns in the summer of Beijing and autumn of Hong Kong. These two seasons represent the typical ozone pollution season in individual megacities (Fig. 2). Meanwhile, the days in these two seasons are usually alternately controlled by different O3 profile patterns rather than overwhelmingly controlled by a single O3 profile pattern, i.e. an FTO3-dominated pattern (Fig. 6). Therefore, the results focusing on these two seasons will provide a more in-depth understanding of ozone pollution mechanisms through comparison among the different O3 profile patterns.
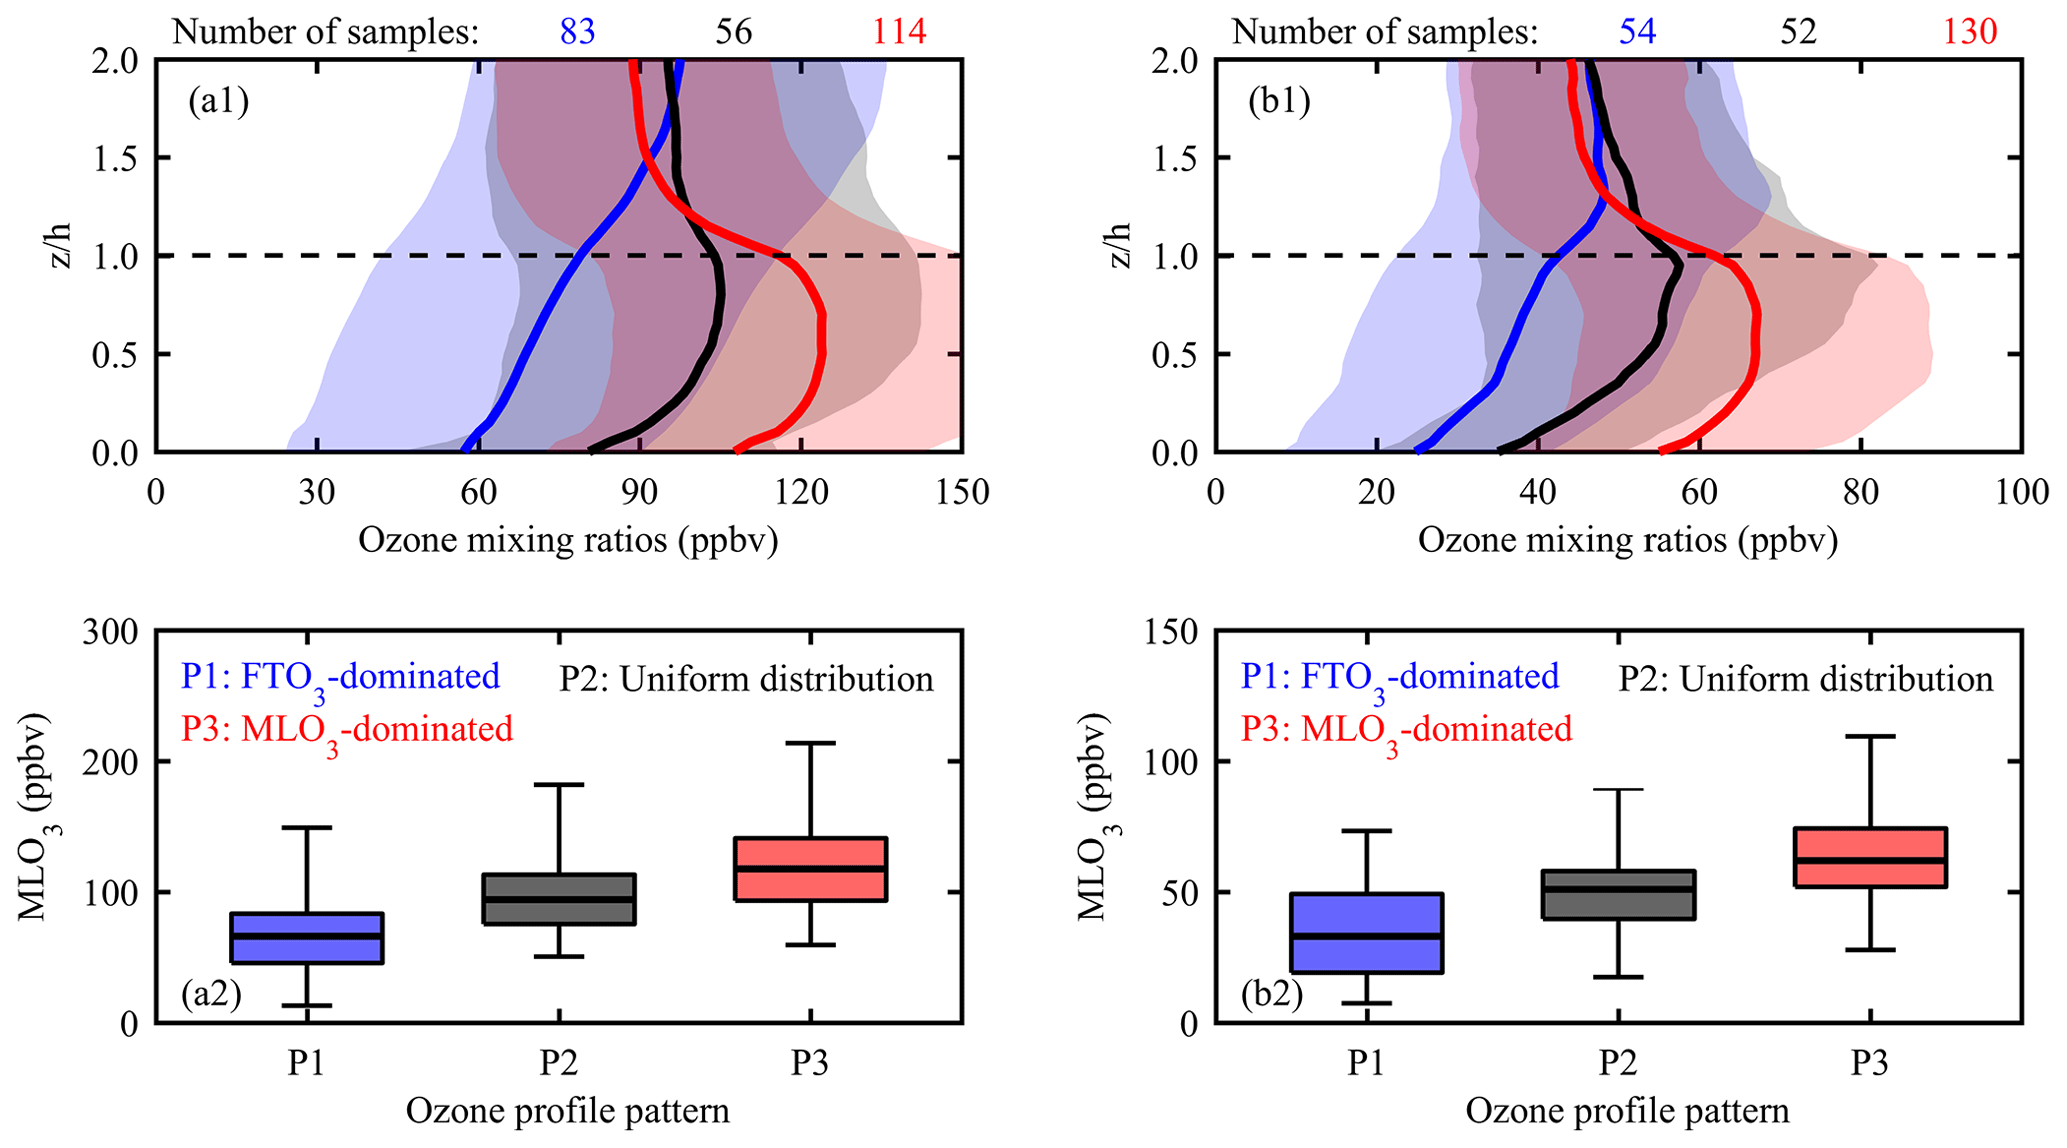
Figure 7(a1, b1) Composited h-referenced ozone profiles and (a2, b2) MLO3 concentrations according to different ozone profile patterns in (a) the summer of Beijing and (b) the autumn of Hong Kong. The shaded areas in the upper panels denote the standard deviation. The box–whisker plots in the lower panels denote the MLO3 concentrations of the 2.5, 25, 50, 75, and 97.5 percentiles. The digits in the upper plots denote the sample numbers in each of the patterns.
Figure 7 shows the composited h-referenced O3 profiles and MLO3 concentrations according to different O3 profile patterns in the summer of Beijing and autumn of Hong Kong. It can be seen that the MLO3 concentrations present a wide-ranging variability across the different O3 profile patterns, while O3 in the FT part shows a similar concentration, especially in the uppermost part of the h-referenced lower troposphere, indicating that downward transport of O3-rich air masses from high altitudes such as the stratosphere is not the main factor working to shape the distinct lower-tropospheric O3 profile patterns. Given that the O3 photochemistry is active in the mixing layer, the wide-ranging MLO3 variability indicates that the distinct lower-tropospheric O3 profile patterns are mainly attributed to the varying MLO3 production, which is modulated by multi-scale meteorology and ozone precursors. In the MLO3-dominated pattern, the medians of MLO3 concentrations are 117.5 ppbv in Beijing and 61.9 ppbv in Hong Kong, far higher than the corresponding values (66.0 ppbv in Beijing and 33.0 ppbv in Hong Kong) in the FTO3-dominated patterns. This indicates that the MLO3-dominated pattern has a very strong O3 production through photochemical reaction, whereas the FTO3-dominated pattern corresponds to a weak O3 production or even a strong O3 titration ().
3.3.1 Meteorological interpretations
Synoptic meteorological conditions play an important role in controlling lower-tropospheric ozone variability (Kalabokas et al., 2013, 2015; Stauffer et al., 2017). Figure 8 shows the composited large-scale geopotential height and horizontal wind vector at 850 hPa and the downward ultraviolet radiation at the surface according to different O3 profile patterns in the summer of Beijing and the autumn of Hong Kong.
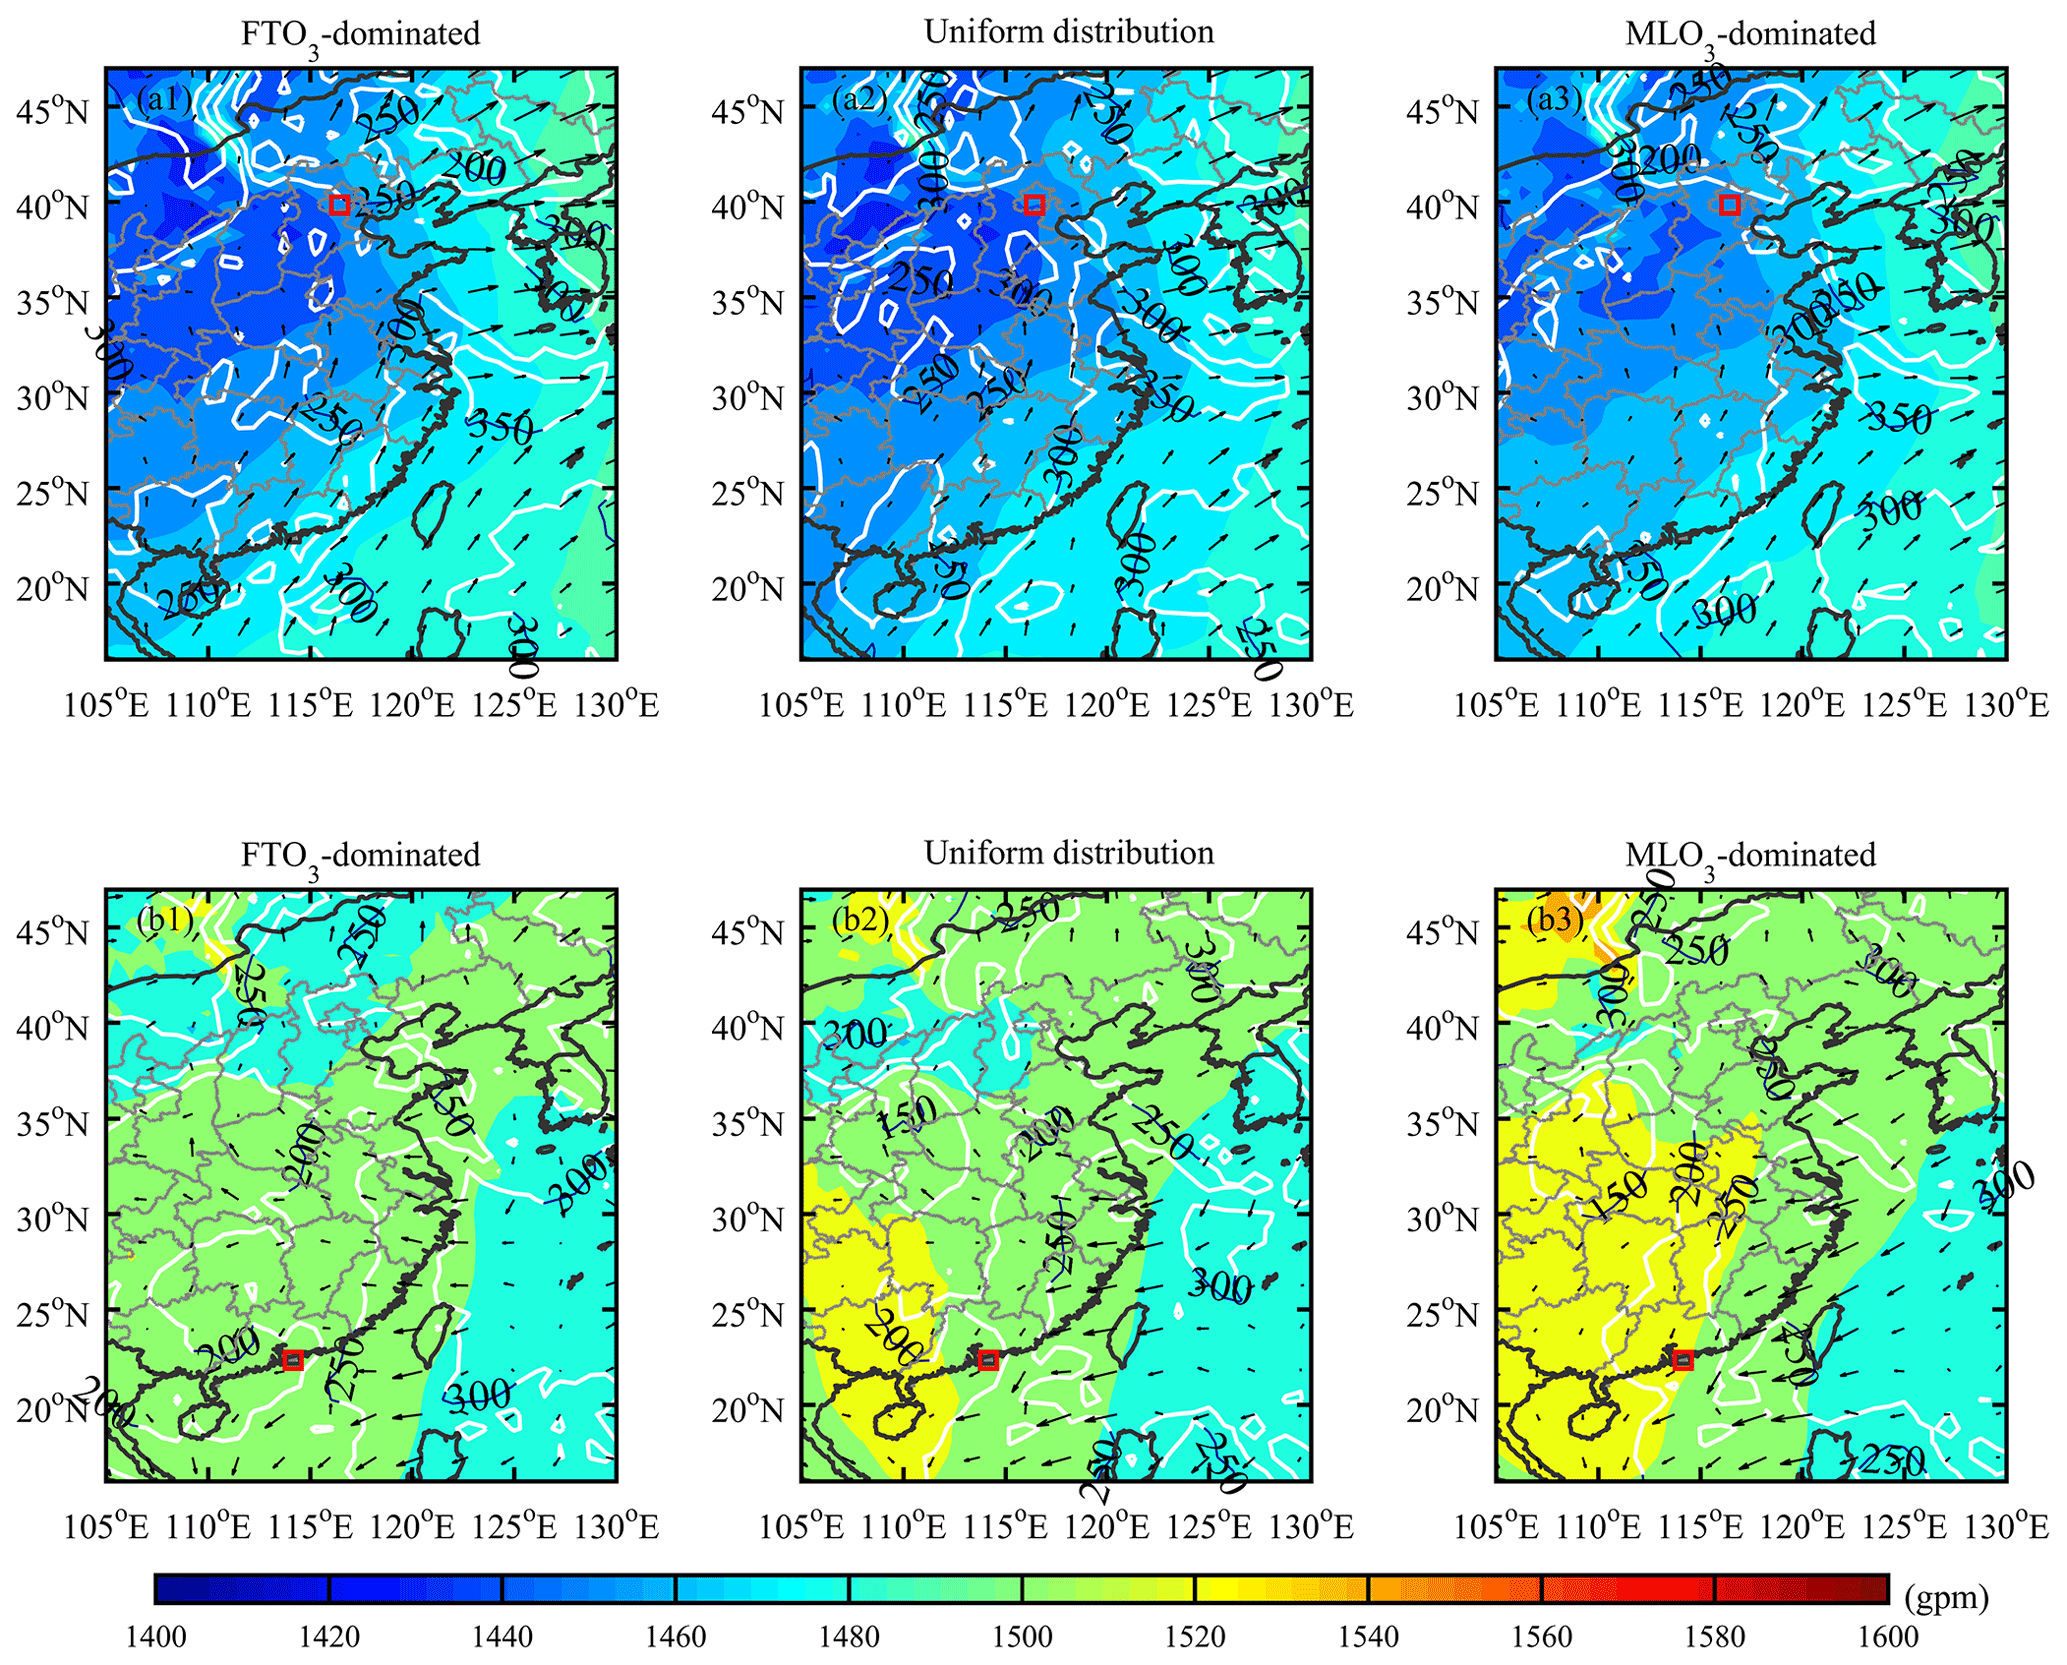
Figure 8Composited large-scale meteorology, including the geopotential height and horizontal wind vector at 850 hPa and the downward ultraviolet radiation at the surface (contour, kJ m−2), according to the different ozone profile patterns in the (a) summer of Beijing and (b) autumn of Hong Kong. The red boxes indicate the locations of Beijing and Hong Kong.
In summer, northern China is controlled by a continental thermal low-pressure system with prevailing southerly flows in the North China Plain. The southerly flows are favourable for transporting ozone and its precursors from central eastern China to Beijing (Liao et al., 2023), resulting in ozone production and accumulation in the presence of strong ultraviolet radiation. From the FTO3-dominated to MLO3-dominated patterns, the low-pressure system is gradually weakened. This change leads to an inhabitation of convective cloud formation favouring downward ultraviolet radiation. In Fig. 8a, there is a slight increase in the downward ultraviolet radiation over northern China from the FTO3-dominated to MLO3-dominated patterns, suggesting a tendency to a more favourable photochemical condition. In autumn, southern China is controlled by a weak high-pressure system. From the FTO3-dominated to MLO3-dominated patterns, the high-pressure system is gradually strengthened, leading to a significant wind direction change from Pacific-originating easterly flows to continent-originating north-easterly flows over Hong Kong and its surrounding region. The wind direction change causes an increasing influence of regional transport of ozone precursors originating from eastern China (Ding et al., 2013). Meanwhile, the strengthened high-pressure system suppresses convective cloud formation, resulting in a significant increase in downward ultraviolet radiation (from 180 to 230 kJ m−2) over Hong Kong and its surrounding region.
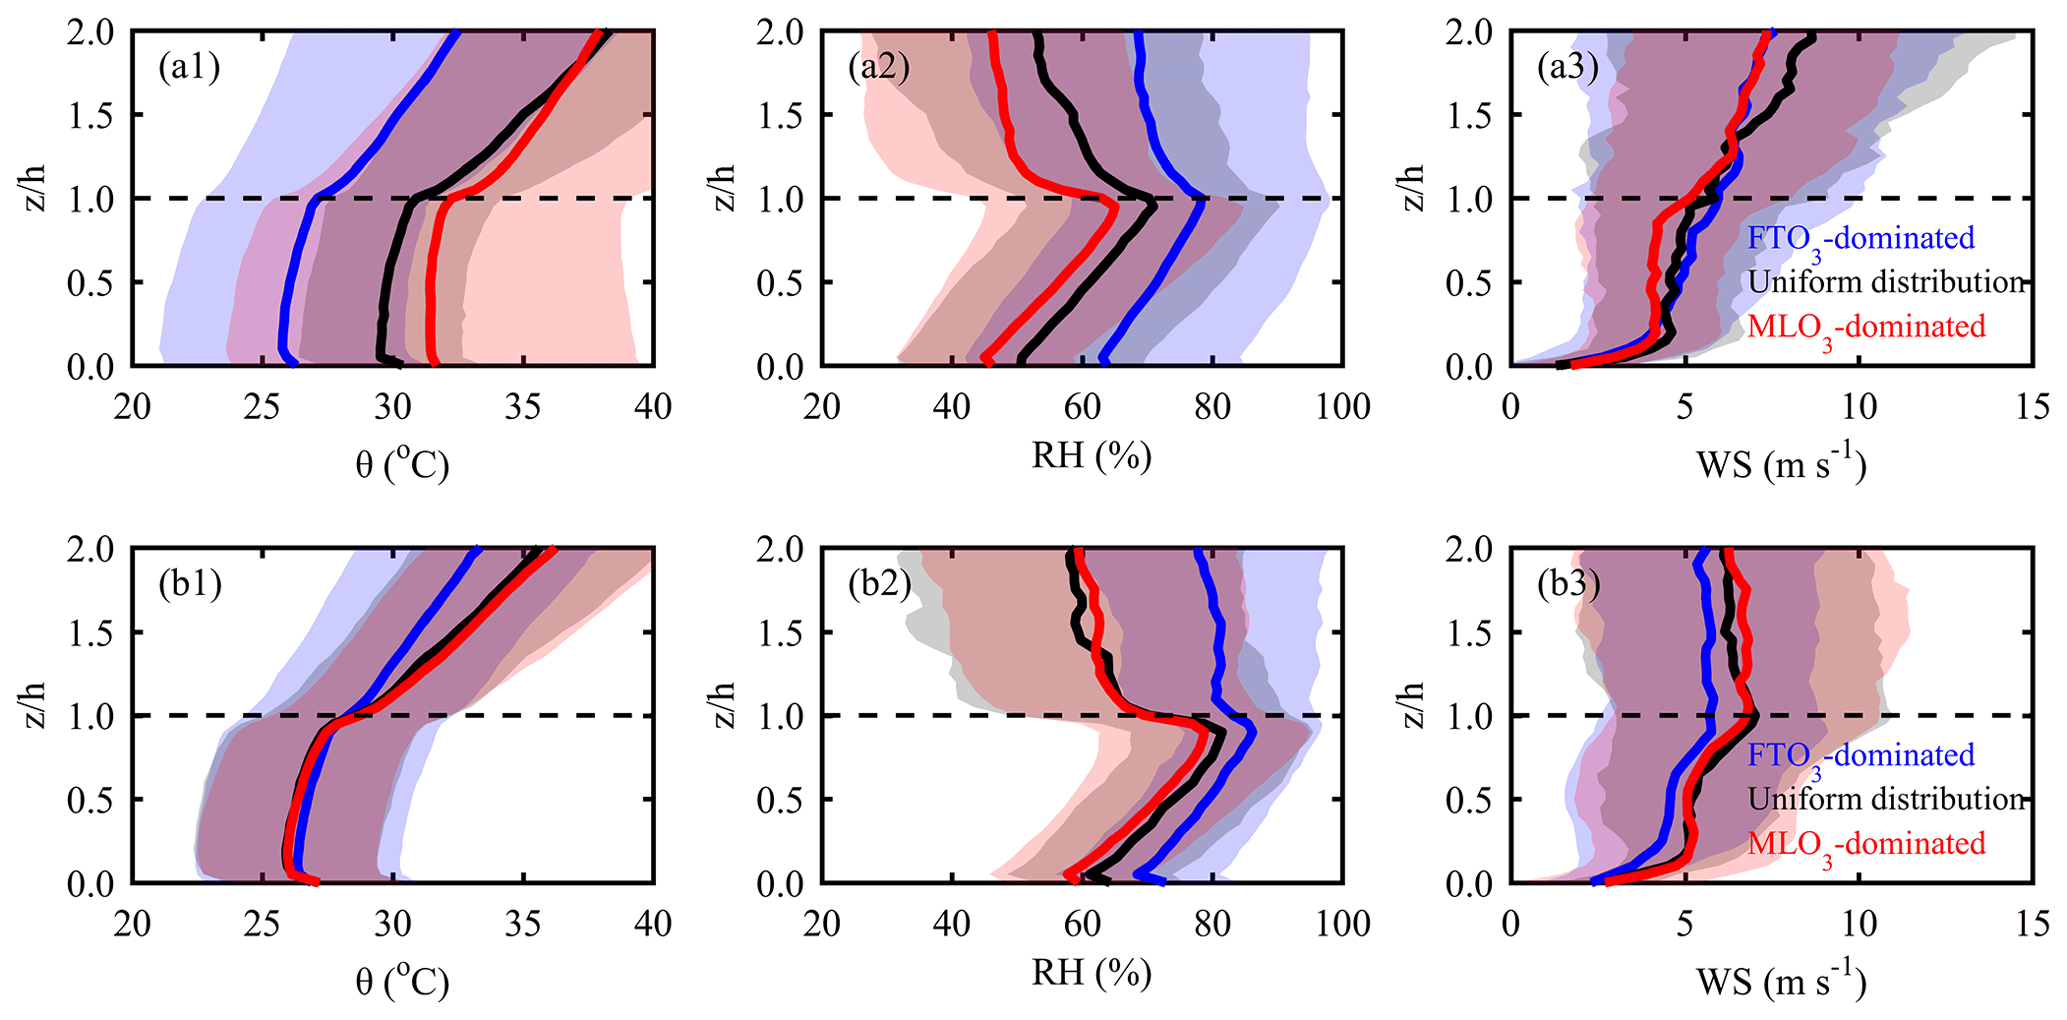
Figure 9Composited h-referenced profiles of (a1, b1) potential temperature, (a2, b2) relative humidity, and (a3, b3) wind speed according to different ozone profile patterns in the (a) summer of Beijing and (b) autumn of Hong Kong. The shaded areas denote the standard deviation.
In contrast to large-scale meteorology, local meteorology exerts more direct influences on local ozone production and accumulation. The h-referenced profiles of potential temperature (θ), RH, and wind speed (WS) according to different O3 profile patterns in the summer of Beijing and autumn of Hong Kong are shown in Fig. 9. Near the surface (), potential temperature decreases with altitude in both megacities, indicating a shallow superadiabatic layer due to daytime surface radiation heating. In other parts of the ML, potential temperature profiles are neutral adiabatic (small positive gradient) due to afternoon convection (Stull, 1988). However, potential temperature in the FT () increases with altitude with a larger positive gradient than that in the ML. In particular, there is a sharp increase in potential temperature at the ML–FT interface where positive vertical gradients reach 1.0 °C hm−1 on average. This large gradient is indicative of strong mixing-layer capping thermal inversion. However, the maximum gradient values are almost identical among the different O3 profile patterns, suggesting that capping inversion acts as a transport barrier to suppress O3 vertical exchange but is not responsible for the different directions of vertical exchange (i.e. FT–ML entrainment or ML–FT detrainment). Overall, no significant structural change is found in the averaged θ profiles among the different patterns. Similar to the θ profiles, the RH and WS profiles share an analogous vertical structure among the different O3 profile patterns in both megacities.
Without considering the vertical structure, the values of the aforementioned meteorological variables usually differ greatly among the different O3 profile patterns. From the FTO3-dominated to MLO3-dominated patterns, there is a significant increase in the potential temperature value in Beijing. The high temperature favours high-concentration ozone production in the MLO3-dominated pattern. Previous studies have indicated that high temperature not only increases the O3 production rate (P. Wang et al., 2022) but also strengthens the volatilization rate of O3 precursors, particularly biomass VOC emissions (Duncan et al., 2009). However, there are no significant temperature differences between the FTO3-dominated and MLO3-dominated patterns in Hong Kong, indicating an insensitivity of Hong Kong's ozone production to air temperature. Turning to relative humidity, it has a significant decrease from an FTO3-dominated pattern to an MLO3-dominated pattern in both megacities. Given that humid air tends to suppress photochemical reactions (Yu, 2019), the lower RH in the MLO3-dominated pattern favours ozone photochemical production. In contrast to RH, the cross-pattern WS profile change shows some differences between Beijing and Hong Kong. For example, on MLO3-dominated days, WS is low in Beijing but high in Hong Kong. The high WS conditions indicate that regional transport plays an important role in O3 pollution in Hong Kong. From the above analyses, a common meteorological factor leading to the MLO3-dominated pattern in both megacities is the low RH.
3.3.2 Photochemical interpretations
Figure 10 shows composited vertical distributions of EAC4-based CH2O and NO2 concentrations according to the different O3 profile patterns in the summer of Beijing and autumn of Hong Kong. There are significantly higher precursor concentrations in Beijing than those in Hong Kong, particularly above the surface layer. This partly explains the higher ozone concentration in Beijing. No matter the CH2O and NO2, its concentration decreases with altitude in both megacities. By comparison, the vertical gradient of the ozone precursors in Hong Kong is significantly larger than that in Beijing. For the different ozone precursors, the vertical gradient of CH2O is significantly smaller than that of NO2 in the ML part (below 850 hPa). For example, the NO2 concentration decreases by 50 %–75 % (80 %–85 %) from the near surface to 900 hPa in Beijing (Hong Kong), while the corresponding CH2O concentration just decreases by approximately 30 % (60 %). These vertical characteristics of EAC4-based ozone precursors are consistent with those previous observations (Chi et al., 2018; Lin et al., 2022; Liu et al., 2023).
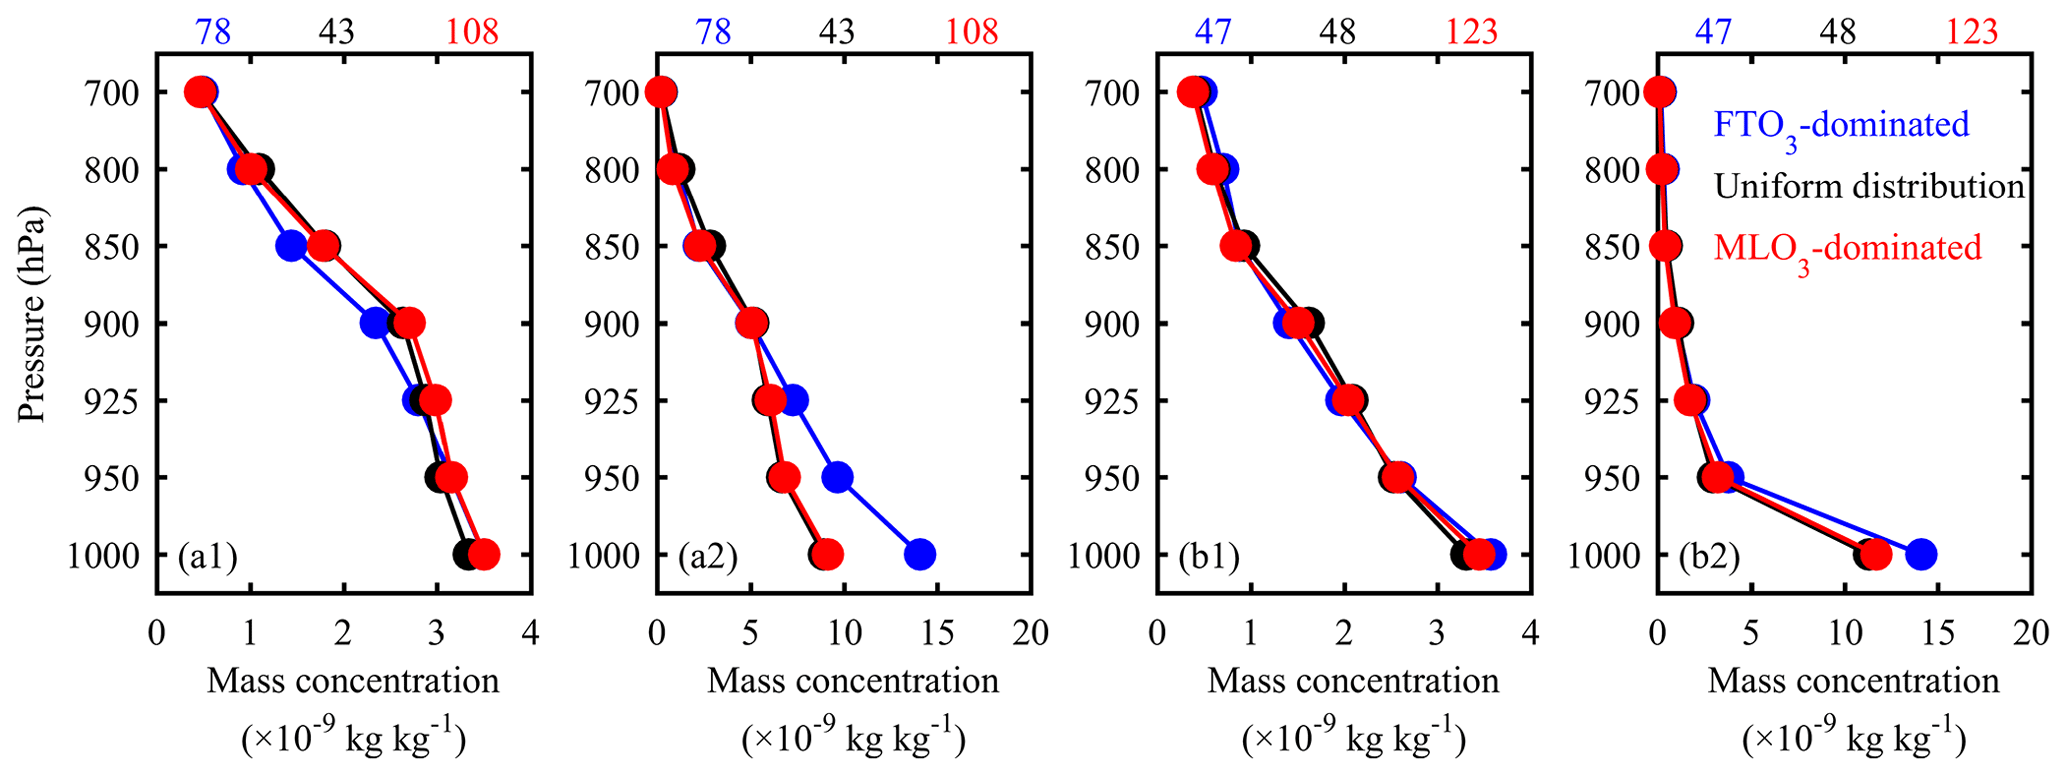
Figure 10Composited vertical distributions (lower panel) of ozone precursors (a1, b1) CH2O and (a2, b2) NO2 according to the different ozone profile patterns in the (a) summer of Beijing and (b) autumn of Hong Kong. The digits in the upper plots denote the sample numbers in each of the patterns.
From the FTO3-dominated to MLO3-dominated patterns, CH2O increases throughout the lower troposphere (up to 700 hPa) in Beijing, with a maximum increment in the upper ML (∼900 hPa). The maximum CH2O increment near the mixing-layer top may be explained by northward transport of VOC emissions in eastern China and high-elevation biogenic VOC emissions in the western mountains (i.e. Taihang Mountains). In contrast to CH2O, NO2 decreases in the ML part (below 900 hPa), especially in the surface layer (1000 hPa). For example, the surface NO2 concentration is approximately kg kg−1 in the FTO3 pattern but decreases to approximately kg kg−1 in the MLO3 pattern. The cross-pattern change in O3 precursors in Hong Kong nearly follows the same characteristic as that in Beijing (i.e. an increase in CH2O and a decrease in NO2 from FTO3-dominated to MLO3-dominated) but with a significantly smaller change amplitude. This difference is likely attributable to temperature-driven precursor changes. In Beijing, the cross-pattern temperature change is very significant. Higher temperature in the MLO3-dominated pattern tends to trigger the release of VOC emissions, causing higher CH2O concentrations, and to improve the photolysis of NO2, causing lower NO2 concentrations. However, the cross-pattern temperature change is insignificant in Hong Kong, leading to a small change amplitude of ozone precursors among the different O3 profile patterns.
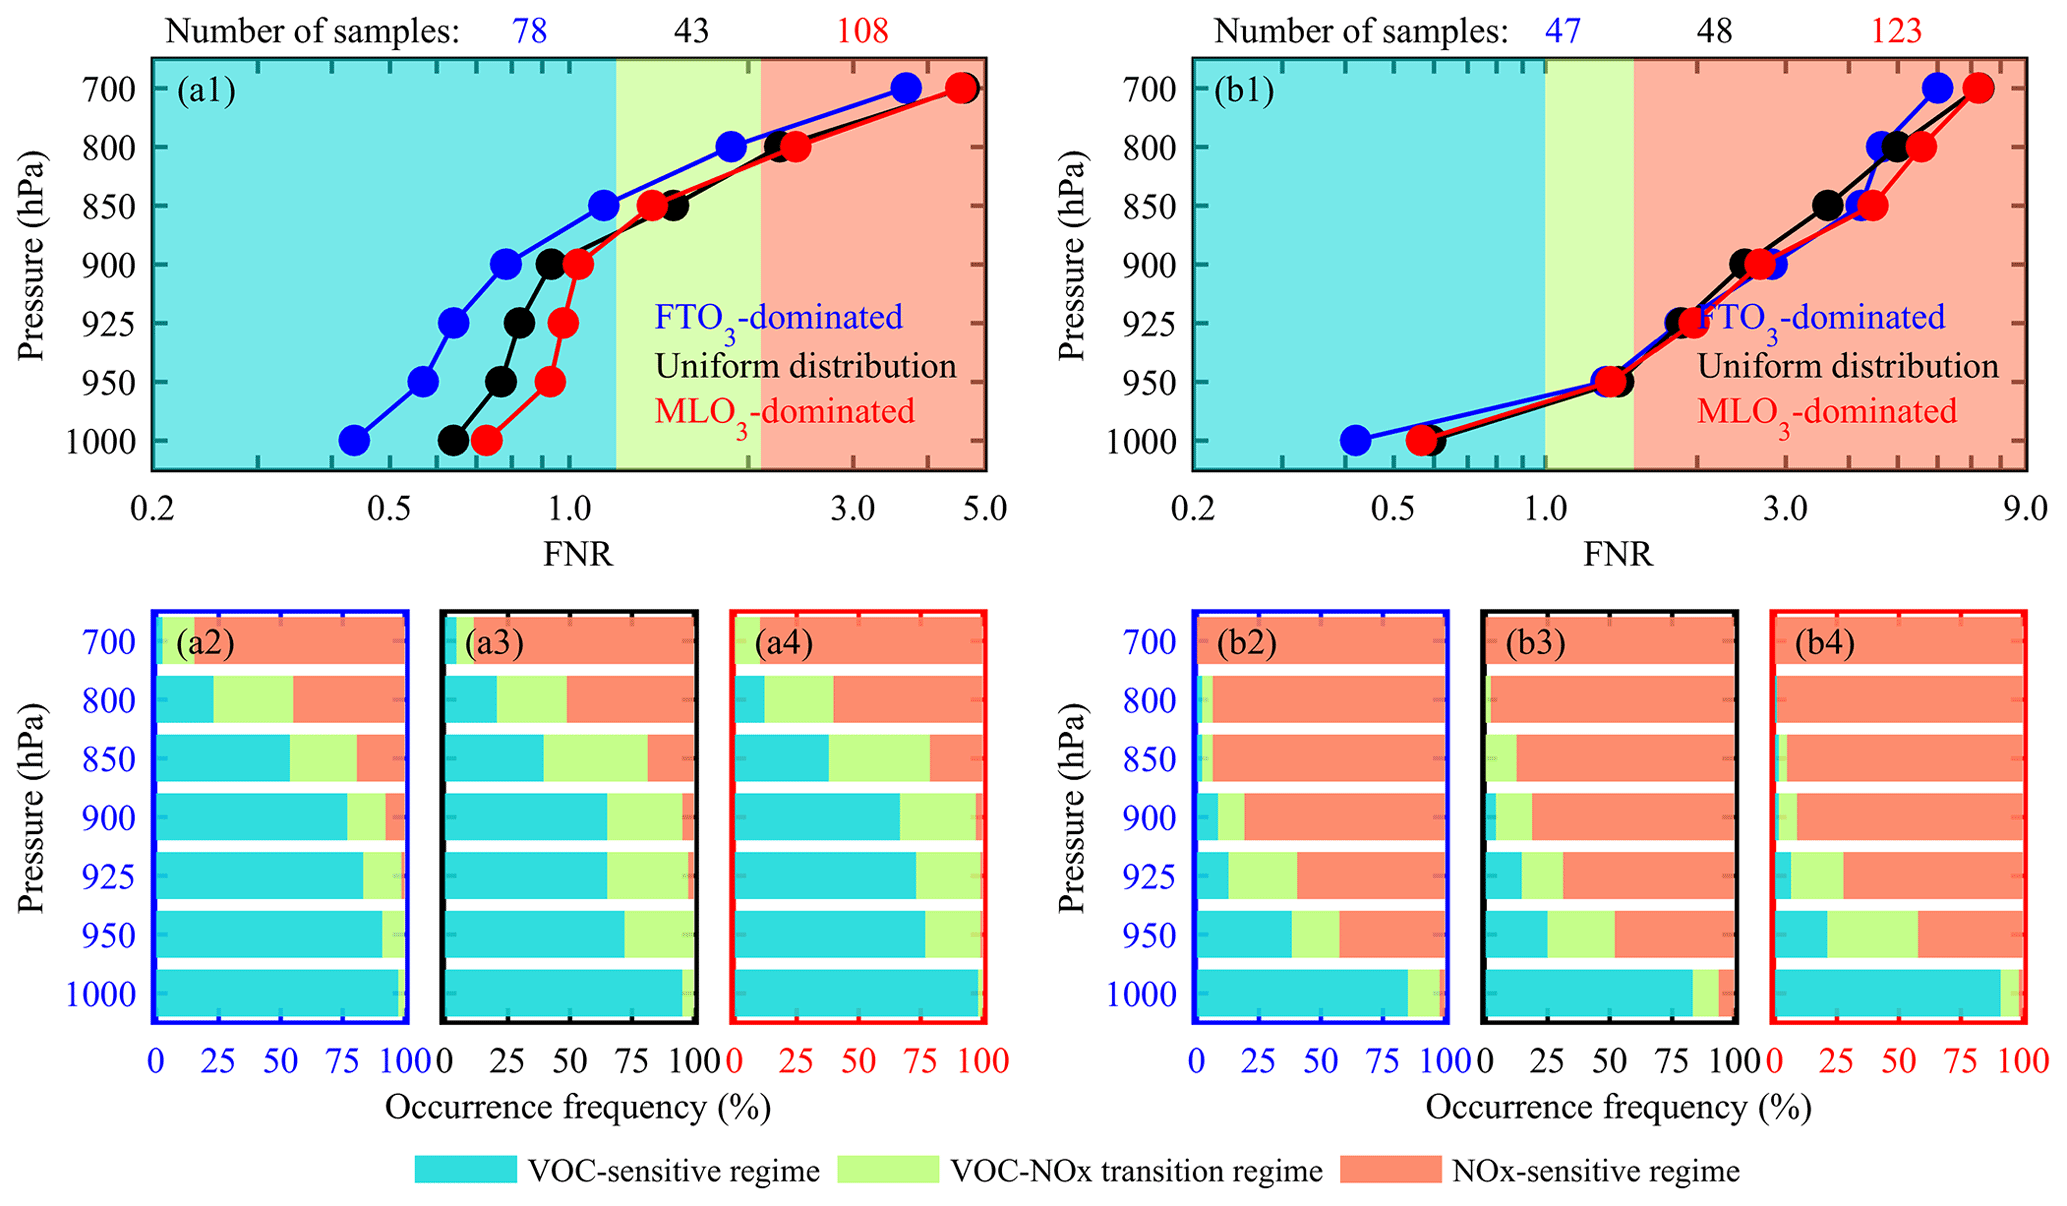
Figure 11Vertical characteristics of ozone production sensitivity according to the different ozone profile patterns in the (a) summer of Beijing and (b) autumn of Hong Kong. The upper panels (a1, b1) denote vertical FNR profiles. The lower panels (a2, b2, a3, b3, a4, b4) denote the occurrence frequency of ozone production sensitivity in the (2) FTO3-dominated, (3) uniform distribution, and (4) MLO3-dominated patterns. The digits in the upper plots denote the sample numbers in each of the patterns.
Ozone production is non-linearly dependent on the relative availability of NOx vs. VOCs. Owing to the non-linear relationship between O3 and its precursors, the net production of O3 is subject to both absolute concentrations of VOC and NOx and their relative ratio, which determines the O3 production sensitivity. Based on the (FNR) photochemical indicator method, we further diagnosed the O3 production sensitivity to its precursors among the different O3 profile patterns (Fig. 11). In Beijing, the averaged FNR values in the ML (<850 hPa) differ significantly among the different O3 profile patterns. From 900 to 700 hPa, the averaged FNR values increase quickly, causing a shift of O3 production sensitivity from VOC-limited to NOx-limited. Daily statistics indicate that there is a significant increase in the transition regime frequency from an FTO3-dominated pattern to an MLO3-dominated pattern, whereas the occurrence of the VOC-limited regime shows the opposite trend. Vertically, the transition regime frequency increases with height in the ML (<850 hPa), regardless of the O3 profile pattern. This is broadly similar to the multi-axis differential optical absorption spectroscopy (MAX–DOAS)-based findings of Chi et al. (2018), who reported that the transition regime accounted for 27.3 % at 300 m height but 50.0 % at 1100 m height over Beijing. In Hong Kong, the averaged FNR values increase more rapidly with height than in Beijing but show small differences among the different O3 profile patterns. The shift height of O3 production sensitivity in Hong Kong (approximately 950 hPa) is lower than that in Beijing. Daily statistics reveal that, below this height, O3 production chemistry is overwhelmingly controlled by the VOC-limited regime and above by the NOx-limited regime. Similar results had been reported via MAX–DOAS observations in Guangzhou (a megacity ∼110 km north-west of Hong Kong), where the O3 production sensitivity changed with height from VOC-limited (0.02–0.22 km) to transitional (0.22–0.42 km) to NOx-limited (0.42–2.02 km) (Lin et al., 2022).
Near the surface, O3 production chemistry is usually VOC-limited in both Beijing and Hong Kong. Controlled by the VOC-limited regime, O3 production increases with increasing VOCs but decreases with NOx due to titration reaction (). From the FTO3-dominated to MLO3-dominated patterns, the NO2 concentration has a pronounced decrease in both megacities, suggesting a weakening of ozone consumption from NO titration. Meanwhile, the CH2O concentration increases more or less, suggesting increased potentiality of high-concentration O3 production. This potentiality can be easily realized on the MLO3-dominated days owing to the hot and dry weather conditions, particularly in Beijing. In the upper ML, O3 production chemistry in Beijing is dominated by the VOC-limited and transition regimes. From the FTO3-dominated to MLO3-dominated patterns, there is a significant increase in the CH2O concentration in the upper ML of Beijing. Therefore, higher-concentration O3 production can be expected in the upper ML owing to a more favourable sensitivity condition, consistent with the observational result of the sickle-shaped O3 profile in the lower troposphere of Beijing. By contrast, O3 production chemistry in the upper ML of Hong Kong is dominated by NOx-limited and transition regimes. From the FTO3-dominated pattern to the MLO3-dominated pattern, there is an insignificant change in the NO2 concentration in the upper ML of Hong Kong. This suggests that the high-concentration MLO3 in Hong Kong cannot be well explained by local photochemical production. Considering the higher wind speed associated with the MLO3-dominated pattern in Hong Kong (Fig. 9), regional transport may be an important factor influencing the lower-tropospheric ozone distribution over Hong Kong.
We investigate the lower-tropospheric O3 distribution over two Chinese megacities (Beijing and Hong Kong) by introducing a novel mixing-layer-height-referenced (h-referenced) O3 climatology, in which lower-tropospheric O3 profiles are scaled according to the mixing-layer top height h. The mixing-layer top height was determined by an integral method that integrates temperature, humidity, and cloud profiles. We focused on the lower troposphere (below 2×h), with each profile subdivided into two compartments: the mixing layer and the free troposphere (ML and FT). By examining O3 concentration differences between the ML and FT (i.e. MLO3 and FTO3), all the individual O3 profiles were classified into three typical patterns: MLO3-dominated, FTO3-dominated, and uniform distribution. Multi-scale meteorology and O3 precursors (CH2O and NO2) were further analysed to characterize the main physiochemical processes driving the different O3 profile patterns in polluted seasons (summer in Beijing and autumn in Hong Kong). Our conclusions are as follows.
-
Compared with traditional sea-level-referenced climatology, the h-referenced O3 climatology preserves the dependence of O3 abundance and its variability on mixing-layer top height, highlighting an inflexion point (or discontinuity) at the interface between the ML and FT.
-
Mixing-layer O3 concentrations show a summer-high and winter-low climatology in Beijing, together with an autumn-high and summer-low climatology in Hong Kong. In the photochemically active season (summer in Beijing and autumn in Hong Kong), seasonal lower-tropospheric O3 profiles exhibit a sickle-shaped pattern with a marked drop in concentrations from high values in the upper ML to low values in the lower FT. This sickle-shaped profile pattern is significantly different from monotone increasing profile patterns across the rest of the year.
-
Highly variable O3 gradients in the lower troposphere, particularly at the surface layer and ML–FT interface, reflect the universality of the vertical O3 stratification structure. O3 stratification in Hong Kong is stronger than that in Beijing. The stratification in the surface layer is likely due to strong-titration chemical processes, and that at the ML–FT interface is attributable to the dynamic transport barrier of the mixing-layer capping inversion on vertical exchange. The contrasting O3 gradients at the ML–FT interface indicate different transport barrier effects, which typically shift from a ML–FT detrainment barrier in summer (autumn) to a FT–ML entrainment barrier in the other seasons in Beijing (Hong Kong).
-
The FTO3-dominated pattern represents the most common O3 profile patterns in both Beijing and Hong Kong (occurrence frequencies of 69 % and 54 %, respectively). However, the MLO3-dominated pattern prevails in the photochemically active season, accounting for 46 % of the summer days in Beijing and 55 % of the autumn days in Hong Kong, which are more frequent than the previously reported episodic occurrence at northern mid-altitudes, indicating intensive MLO3 production in high-emission Chinese megacities. In the polluted seasons (summer in Beijing and autumn in Hong Kong), the cross-pattern O3 profiles present a small difference in the FT part but a wide-ranging variability in the ML part, indicating that MLO3 production shapes the distinct O3 profile patterns.
-
From the FTO3-dominated to MLO3-dominated patterns, large-scale meteorology is characterized by increased geopotential height and downward ultraviolet radiation. Locally, there are no vertical structural differences in lower-tropospheric meteorological profiles (θ, RH, and WS) among the different O3 profile patterns. The maximum positive θ gradient at the ML–FT interface demonstrates the common existence of the mixing-layer capping inversion, which acts as a barrier to vertical exchange. Low humidity represents a common factor associated with the MLO3-dominated pattern in both Beijing and Hong Kong.
-
From the FTO3-dominated to MLO3-dominated patterns, the O3 precursor CH2O (NO2) substantially increases (decreases) in Beijing but increases (decreases) slightly in Hong Kong. In Beijing, the CH2O increment is larger in the upper ML, whereas the NO2 decrement is larger in the lower ML. Such changes in O3 precursors push O3 production sensitivity away from the VOC-limited regime (towards higher NOx sensitivity) and facilitate net production of O3 via photochemical reactions in the upper ML.
Comparing the above results with previous northern mid-latitude observations (Petetin et al., 2018), lower-tropospheric O3 variability over high-emission Chinese megacities is more likely controlled by O3-related chemical processes, including titration consumption and photochemical production. From our comparison of Beijing and Hong Kong, lower-tropospheric O3 variability in China is not only subject to precursor emissions but also reflects local topographical and meteorological characteristics. Therefore, to achieve comprehensive understanding of lower-tropospheric O3 variability in China, more ozonesonde observations over more sites will be needed in the future.
Ozonesonde data for Beijing are available from the first author upon reasonable request (lzhiheng118@163.com). Ozonesonde data for Hong Kong are available from the World Ozone and Ultraviolet Radiation Data Centre (https://woudc.org/home.php, WOUDC, 2024). ERA5-based meteorological reanalysis data are available from the Climate Data Store of the European Center for Medium Weather Forecasting (https://cds.climate.copernicus.eu/ (Climate Change Service, 2024). EAC4-based ozone precursor reanalysis data are available from the Atmosphere Data Store of the European Center for Medium Weather Forecasting (https://ads.atmosphere.copernicus.eu/, Atmosphere Monitoring Service, 2024).
ZL and SF designed the research. ZL organized and wrote the manuscript. MG and JQ edited the manuscript. JS contributed to the satellite data analysis and code writing. JZ and YP contributed to the ozonesonde observations in Beijing. All the authors contributed to the revision of the manuscript.
The contact author has declared that none of the authors has any competing interests.
Publisher’s note: Copernicus Publications remains neutral with regard to jurisdictional claims made in the text, published maps, institutional affiliations, or any other geographical representation in this paper. While Copernicus Publications makes every effort to include appropriate place names, the final responsibility lies with the authors.
The authors would like to thank the Hong Kong Observatory for generating the ozonesonde products in Hong Kong. We also thank the World Ozone and Ultraviolet Radiation Data Centre for providing the ozonesonde products.
This research has been supported by the major project of Basic and Applied Basic Research of Guangdong Province (grant no. 2020B0301030004), the Key-Area Research and Development Program of Guangdong Province (grant no. 2020B1111360003), and the National Natural Science Foundation of China (grant nos. 42293321 and 41975181).
This paper was edited by Anne Perring and reviewed by two anonymous referees.
Atmosphere Monitoring Service: Welcome to the Atmosphere Data Store, ECMWF, https://ads.atmosphere.copernicus.eu/, last access: 5 March 2024.
Benish, S. E., He, H., Ren, X., Roberts, S. J., Salawitch, R. J., Li, Z., Wang, F., Wang, Y., Zhang, F., Shao, M., Lu, S., and Dickerson, R. R.: Measurement report: Aircraft observations of ozone, nitrogen oxides, and volatile organic compounds over Hebei Province, China, Atmos. Chem. Phys., 20, 14523–14545, https://doi.org/10.5194/acp-20-14523-2020, 2020.
Berkes, F., Hoor, P., Bozem, H., Kunkel, D., Sprenger, M., and Henne, S.: Airborne observation of mixing across the entrainment zone during PARADE 2011, Atmos. Chem. Phys., 16, 6011–6025, https://doi.org/10.5194/acp-16-6011-2016, 2016.
Chen, Z., Xie, Y., Liu, J., Shen, L., Cheng, X., Han, H., Yang, M., Shen, Y., Zhao, T., and Hu, J.: Distinct seasonality in vertical variations of tropospheric ozone over coastal regions of southern China, Sci. Total Environ., 874, 162423, https://doi.org/10.1016/j.scitotenv.2023.162423, 2023.
Climate Change Service: Welcome to the Climate Data Store, ECMWF, https://cds.climate.copernicus.eu/, last access: 5 March 2024.
Chi, X. Y., Liu, C., Xie, Z. Q., Fan, G. Q., Wang, Y., He, P. Z., Fan, S. D., Hong, Q. Q., Wang, Z., Yu, X. W., Yue, F. E., Duan, J. B., Zhang, P. F., and Liu, J. G.: Observations of ozone vertical profiles and corresponding precursors in the low troposphere in Beijing, China, Atmos. Res., 213, 224–235, https://doi.org/10.1016/j.atmosres.2018.06.012, 2018.
Diab, R. D., Thompson, A. M., Mari, K., Ramsay, L., and Coetzee, G. J. R.: Tropospheric ozone climatology over Irene, South Africa, from 1990 to 1994 and 1998 to 2002, J. Geophys. Res.-Atmos., 109, D20301, https://doi.org/10.1029/2004jd004793, 2004.
Ding, A. J., Wang, T., Thouret, V., Cammas, J.-P., and Nédélec, P.: Tropospheric ozone climatology over Beijing: analysis of aircraft data from the MOZAIC program, Atmos. Chem. Phys., 8, 1–13, https://doi.org/10.5194/acp-8-1-2008, 2008.
Ding, A. J., Wang, T., and Fu, C. B.: Transport characteristics and origins of carbon monoxide and ozone in Hong Kong, South China, J. Geophys. Res.-Atmos., 118, 9475–9488, https://doi.org/10.1002/jgrd.50714, 2013.
Donnell, E. A., Fish, D. J., Dicks, E. M., and Thorpe, A. J.: Mechanisms for pollutant transport between the boundary layer and the free troposphere, J. Geophys. Res.-Atmos., 106, 7847–7856, https://doi.org/10.1029/2000JD900730, 2001.
Duncan, B. N., Yoshida, Y., Damon, M. R., Douglass, A. R., and Witte, J. C.: Temperature dependence of factors controlling isoprene emissions, Geophys. Res. Lett., 36, L05813, https://doi.org/10.1029/2008GL037090, 2009.
Fleming, Z. L., Doherty, R. M., von Schneidemesser, E., Malley, C. S., Cooper, O. R., Pinto, J. P., Colette, A., Xu, X. B., Simpson, D., Schultz, M. G., Lefohn, A. S., Hamad, S., Moolla, R., Solberg, S., and Feng, Z. Z.: Tropospheric Ozone Assessment Report: Present-day ozone distribution and trends relevant to human health, Elementa-Sci. Anthrop., 6, 12, https://doi.org/10.1525/Elementa.273, 2018.
Han, S., Yao, Q., Tie, X., Zhang, Y., Zhang, M., Li, P., and Cai, Z.: Analysis of surface and vertical measurements of O3 and its chemical production in the NCP region, China, Atmos. Environ., 241, 117759, https://doi.org/10.1016/j.atmosenv.2020.117759, 2020.
He, G. W., Deng, T., Wu, D., Wu, C., Huang, X. F., Li, Z. N., Yin, C. Q., Zou, Y., Song, L., Ouyang, S. S., Tao, L. P., and Zhang, X.: Characteristics of boundary layer ozone and its effect on surface ozone concentration in Shenzhen, China: A case study, Sci. Total Environ., 791, 148044, https://doi.org/10.1016/j.scitotenv.2021.148044, 2021.
Hersbach, H., Bell, B., Berrisford, P., Hirahara, S., Horanyi, A., Munoz-Sabater, J., Nicolas, J., Peubey, C., Radu, R., Schepers, D., Simmons, A., Soci, C., Abdalla, S., Abellan, X., Balsamo, G., Bechtold, P., Biavati, G., Bidlot, J., Bonavita, M., De Chiara, G., Dahlgren, P., Dee, D., Diamantakis, M., Dragani, R., Flemming, J., Forbes, R., Fuentes, M., Geer, A., Haimberger, L., Healy, S., Hogan, R. J., Holm, E., Janiskova, M., Keeley, S., Laloyaux, P., Lopez, P., Lupu, C., Radnoti, G., de Rosnay, P., Rozum, I., Vamborg, F., Villaume, S., and Thepaut, J. N.: The ERA5 global reanalysis, Q. J. Roy. Meteor. Soc., 146, 1999–2049, https://doi.org/10.1002/qj.3803, 2020.
Inness, A., Ades, M., Agustí-Panareda, A., Barré, J., Benedictow, A., Blechschmidt, A.-M., Dominguez, J. J., Engelen, R., Eskes, H., Flemming, J., Huijnen, V., Jones, L., Kipling, Z., Massart, S., Parrington, M., Peuch, V.-H., Razinger, M., Remy, S., Schulz, M., and Suttie, M.: The CAMS reanalysis of atmospheric composition, Atmos. Chem. Phys., 19, 3515–3556, https://doi.org/10.5194/acp-19-3515-2019, 2019.
Jaffe, D.: Relationship between Surface and Free Tropospheric Ozone in the Western U. S., Environ. Sci. Technol., 45, 432–438, https://doi.org/10.1021/es1028102, 2011.
Jin, X. M., Fiore, A., Boersma, K. F., De Smedt, I., and Valin, L.: Inferring Changes in Summertime Surface Ozone-NOx-VOC Chemistry over US Urban Areas from Two Decades of Satellite and Ground-Based Observations, Environ. Sci. Technol., 54, 6518–6529, https://doi.org/10.1021/acs.est.9b07785, 2020.
Kalabokas, P. D., Cammas, J.-P., Thouret, V., Volz-Thomas, A., Boulanger, D., and Repapis, C. C.: Examination of the atmospheric conditions associated with high and low summer ozone levels in the lower troposphere over the eastern Mediterranean, Atmos. Chem. Phys., 13, 10339–10352, https://doi.org/10.5194/acp-13-10339-2013, 2013.
Kalabokas, P. D., Thouret, V., Cammas, J. P., Volz-Thomas, A., Boulanger, D., and Repapis, C. C.: The geographical distribution of meteorological parameters associated with high and low summer ozone levels in the lower troposphere and the boundary layer over the eastern Mediterranean (Cairo case), Tellus B, 67, 27853, https://doi.org/10.3402/Tellusb.V67.27853, 2015.
Karl, T., Lamprecht, C., Graus, M., Cede, A., Tiefengraber, M., Vila-Guerau de Arellano, J., Gurarie, D., and Lenschow, D.: High urban NOx triggers a substantial chemical downward flux of ozone, Science Advances, 9, eadd2365, https://doi.org/10.1126/sciadv.add2365, 2023.
Kaser, L., Patton, E. G., Pfister, G. G., Weinheimer, A. J., Montzka, D. D., Flocke, F., Thompson, A. M., Stauffer, R. M., and Halliday, H. S.: The effect of entrainment through atmospheric boundary layer growth on observed and modeled surface ozone in the Colorado Front Range, J. Geophys. Res.-Atmos., 122, 6075–6093, https://doi.org/10.1002/2016JD026245, 2017.
Li, R., Xu, M., Li, M., Chen, Z., Zhao, N., Gao, B., and Yao, Q.: Identifying the spatiotemporal variations in ozone formation regimes across China from 2005 to 2019 based on polynomial simulation and causality analysis, Atmos. Chem. Phys., 21, 15631–15646, https://doi.org/10.5194/acp-21-15631-2021, 2021.
Liao, Z., Ling, Z., Gao, M., Sun, J., Zhao, W., Ma, P., Quan, J., and Fan, S.: Tropospheric Ozone Variability Over Hong Kong Based on Recent 20 years (2000–2019) Ozonesonde Observation, J. Geophys. Res.-Atmos., 126, e2020JD033054, https://doi.org/10.1029/2020JD033054, 2021.
Liao, Z. H., Pan, Y. B., Ma, P. K., Jia, X. C., Cheng, Z. G., Wang, Q. Q., Dou, Y. J., Zhao, X. J., Zhang, J. Q., and Quan, J. N.: Meteorological and chemical controls on surface ozone diurnal variability in Beijing: A clustering-based perspective, Atmos. Environ., 295, 119566, https://doi.org/10.1016/j.atmosenv.2022.119566, 2023.
Lin, C.-H., Wu, Y.-L., and Lai, C.-H.: Ozone reservoir layers in a coastal environment – a case study in southern Taiwan, Atmos. Chem. Phys., 10, 4439–4452, https://doi.org/10.5194/acp-10-4439-2010, 2010.
Lin, H., Xing, C., Hong, Q., Liu, C., Ji, X., Liu, T., Lin, J., Lu, C., Tan, W., Li, Q., and Liu, H.: Diagnosis of Ozone Formation Sensitivities in Different Height Layers via MAX-DOAS Observations in Guangzhou, J. Geophys. Res.-Atmos., 127, e2022JD036803, https://doi.org/10.1029/2022jd036803, 2022.
Liu, Z., Zha, F., Wang, Y., Yuan, B., Liu, B., and Tang, G.: Vertical evolution of the concentrations and sources of volatile organic compounds in the lower boundary layer in urban Beijing in summer, Chemosphere, 332, 138767, https://doi.org/10.1016/j.chemosphere.2023.138767, 2023.
Lu, X., Hong, J. Y., Zhang, L., Cooper, O. R., Schultz, M. G., Xu, X. B., Wang, T., Gao, M., Zhao, Y. H., and Zhang, Y. H.: Severe Surface Ozone Pollution in China: A Global Perspective, Environ. Sci. Tech. Let., 5, 487–494, https://doi.org/10.1021/acs.estlett.8b00366, 2018.
Mills, G., Pleijel, H., Malley, C. S., Sinha, B., Cooper, O. R., Schultz, M. G., Neufeld, H. S., Simpson, D., Sharps, K., Feng, Z. Z., Gerosa, G., Harmens, H., Kobayashi, K., Saxena, P., Paoletti, E., Sinha, V., and Xu, X. B.: Tropospheric Ozone Assessment Report: Present-day tropospheric ozone distribution and trends relevant to vegetation, Elementa-Sci. Anthrop., 6, 47, https://doi.org/10.1525/Elementa.302, 2018.
Monks, P. S., Archibald, A. T., Colette, A., Cooper, O., Coyle, M., Derwent, R., Fowler, D., Granier, C., Law, K. S., Mills, G. E., Stevenson, D. S., Tarasova, O., Thouret, V., von Schneidemesser, E., Sommariva, R., Wild, O., and Williams, M. L.: Tropospheric ozone and its precursors from the urban to the global scale from air quality to short-lived climate forcer, Atmos. Chem. Phys., 15, 8889–8973, https://doi.org/10.5194/acp-15-8889-2015, 2015.
Neuman, J. A., Trainer, M., Aikin, K. C., Angevine, W. M., Brioude, J., Brown, S. S., de Gouw, J. A., Dube, W. P., Flynn, J. H., Graus, M., Holloway, J. S., Lefer, B. L., Nedelec, P., Nowak, J. B., Parrish, D. D., Pollack, I. B., Roberts, J. M., Ryerson, T. B., Smit, H., Thouret, V., and Wagner, N. L.: Observations of ozone transport from the free troposphere to the Los Angeles basin, J. Geophys. Res.-Atmos., 117, D00V09, https://doi.org/10.1029/2011JD016919, 2012.
Ogino, S. Y., Fujiwara, M., Shiotani, M., Hasebe, F., Matsumoto, J., Hoang, T. H. T., and Nguyen, T. T. T.: Ozone variations over the northern subtropical region revealed by ozonesonde observations in Hanoi, J. Geophys. Res.-Atmos., 118, 3245–3257, https://doi.org/10.1002/jgrd.50348, 2013.
Oltmans, S. J., Johnson, B. J., Harris, J. M., Thompson, A. M., Liu, H. Y., Chan, C. Y., Vomel, H., Fujimoto, T., Brackett, V. G., Chang, W. L., Chen, J. P., Kim, J. H., Chan, L. Y., and Chang, H. W.: Tropospheric ozone over the North Pacific from ozonesonde observations, J. Geophys. Res.-Atmos., 109, D15s01, https://doi.org/10.1029/2003jd003466, 2004.
Petetin, H., Thouret, V., Fontaine, A., Sauvage, B., Athier, G., Blot, R., Boulanger, D., Cousin, J.-M., and Nédélec, P.: Characterising tropospheric O3 and CO around Frankfurt over the period 1994–2012 based on MOZAIC–IAGOS aircraft measurements, Atmos. Chem. Phys., 16, 15147–15163, https://doi.org/10.5194/acp-16-15147-2016, 2016.
Petetin, H., Sauvage, B., Smit, H. G. J., Gheusi, F., Lohou, F., Blot, R., Clark, H., Athier, G., Boulanger, D., Cousin, J.-M., Nedelec, P., Neis, P., Rohs, S., and Thouret, V.: A climatological view of the vertical stratification of RH, O3 and CO within the PBL and at the interface with free troposphere as seen by IAGOS aircraft and ozonesondes at northern mid-latitudes over 1994–2016, Atmos. Chem. Phys., 18, 9561–9581, https://doi.org/10.5194/acp-18-9561-2018, 2018.
Seidel, D. J., Ao, C. O., and Li, K.: Estimating climatological planetary boundary layer heights from radiosonde observations: Comparison of methods and uncertainty analysis, J. Geophys. Res.-Atmos., 115, D16113, https://doi.org/10.1029/2009JD013680, 2010.
Seinfeld, J. H. and Pandis, S. N.: Atmospheric Chemistry and Physics from Air Pollution to Climate Change, 3rd edn., Wiley, ISBN 978-1-119-22117-3, 2016.
Stauffer, R. M., Thompson, A. M., and Young, G. S.: Tropospheric ozonesonde profiles at long-term US monitoring sites: 1. A climatology based on self-organizing maps, J. Geophys. Res.-Atmos., 121, 1320–1339, https://doi.org/10.1002/2015JD023641, 2016.
Stauffer, R. M., Thompson, A. M., Oltmans, S. J., and Johnson, B. J.: Tropospheric ozonesonde profiles at long-term US monitoring sites: 2. Links between Trinidad Head, CA, profile clusters and inland surface ozone measurements, J. Geophys. Res.-Atmos., 122, 1261–1280, https://doi.org/10.1002/2016JD025254, 2017.
Stull, R. B.: An Introduction to Boundary Layer Meteorology, Kluwer Academic Publishers, Dordrecht, the Netherlands, ISBN 978-90-277-2769-5, 1988.
Tang, G. Q., Zhu, X. W., Xin, J. Y., Hu, B., Song, T., Sun, Y., Zhang, J. Q., Wang, L. L., Cheng, M. T., Chao, N., Kong, L. B., Li, X., and Wang, Y. S.: Modelling study of boundary-layer ozone over northern China – Part I: Ozone budget in summer, Atmos. Res., 187, 128–137, https://doi.org/10.1016/j.atmosres.2016.10.017, 2017.
Trousdell, J. F., Conley, S. A., Post, A., and Faloona, I. C.: Observing entrainment mixing, photochemical ozone production, and regional methane emissions by aircraft using a simple mixed-layer framework, Atmos. Chem. Phys., 16, 15433–15450, https://doi.org/10.5194/acp-16-15433-2016, 2016.
Wang, P., Yang, Y., Li, H., Chen, L., Dang, R., Xue, D., Li, B., Tang, J., Leung, L. R., and Liao, H.: North China Plain as a hot spot of ozone pollution exacerbated by extreme high temperatures, Atmos. Chem. Phys., 22, 4705–4719, https://doi.org/10.5194/acp-22-4705-2022, 2022.
Wang, T., Xue, L., Brimblecombe, P., Lam, Y. F., Li, L., and Zhang, L.: Ozone pollution in China: A review of concentrations, meteorological influences, chemical precursors, and effects, Sci. Total Environ., 575, 1582–1596, https://doi.org/10.1016/j.scitotenv.2016.10.081, 2017.
Wang, T., Xue, L., Feng, Z., Dai, J., Zhang, Y., and Tan, Y.: Ground-level ozone pollution in China: a synthesis of recent findings on influencing factors and impacts, Environ. Res. Lett., 17, 063003, https://doi.org/10.1088/1748-9326/ac69fe, 2022.
Wang, X. Y. and Wang, K. C.: Estimation of atmospheric mixing layer height from radiosonde data, Atmos. Meas. Tech., 7, 1701–1709, https://doi.org/10.5194/amt-7-1701-2014, 2014.
Williams, A. G., Zahorowski, W., Chambers, S., Griffiths, A., Hacker, J. M., Element, A., and Werczynski, S.: The Vertical Distribution of Radon in Clear and Cloudy Daytime Terrestrial Boundary Layers, J. Atmos. Sci., 68, 155–174, https://doi.org/10.1175/2010JAS3576.1, 2011.
WOUDC: World Ozone and Ultraviolet Radiation Data Centre, Home, Version 1.30.6, https://woudc.org/home.php (last access: 5 March 2024), 2024.
Wyngaard, J. C. and Brost, R. A.: Top-Down and Bottom-Up Diffusion of a Scalar in the Convective Boundary Layer, J. Atmos. Sci., 41, 102–112, https://doi.org/10.1175/1520-0469(1984)041<0102:TDABUD>2.0.CO;2, 1984.
Xu, Z., Chen, H., Guo, J., and Zhang, W.: Contrasting Effect of Soil Moisture on the Daytime Boundary Layer Under Different Thermodynamic Conditions in Summer Over China, Geophys. Res. Lett., 48, e2020GL090989, https://doi.org/10.1029/2020GL090989, 2021.
Yates, E. L., Johnson, M. S., Iraci, L. T., Ryoo, J. M., Pierce, R. B., Cullis, P. D., Gore, W., Ives, M. A., Johnson, B. J., Leblanc, T., Marrero, J. E., Sterling, C. W., and Tanaka, T.: An Assessment of Ground Level and Free Tropospheric Ozone Over California and Nevada, J. Geophys. Res.-Atmos., 122, 10089–10102, https://doi.org/10.1002/2016JD026266, 2017.
Yonemura, S., Tsuruta, H., Kawashima, S., Sudo, S., Peng, L. C., Fook, L. S., Johar, Z., and Hayashi, M.: Tropospheric ozone climatology over Peninsular Malaysia from 1992 to 1999, J. Geophys. Res.-Atmos., 107, ACH 1-1–ACH 1-12, https://doi.org/10.1029/2001JD000993, 2002.
Yu, S. C.: Fog geoengineering to abate local ozone pollution at ground level by enhancing air moisture, Environ. Chem. Lett., 17, 565–580, https://doi.org/10.1007/s10311-018-0809-5, 2019.
Zhang, J., Li, D., Bian, J., Xuan, Y., Chen, H., Bai, Z., Wan, X., Zheng, X., Xia, X., and Lü, D.: Long-term ozone variability in the vertical structure and integrated column over the North China Plain: results based on ozonesonde and Dobson measurements during 2001–2019, Environ. Res. Lett., 16, 074053, https://doi.org/10.1088/1748-9326/ac109f, 2021.
Zhao, W., Tang, G. Q., Yu, H., Yang, Y., Wang, Y. H., Wang, L. L., An, J. L., Gao, W. K., Hu, B., Cheng, M. T., An, X. Q., Li, X., and Wang, Y. S.: Evolution of boundary layer ozone in Shijiazhuang, a suburban site on the North China Plain, J. Environ. Sci., 83, 152–160, https://doi.org/10.1016/j.jes.2019.02.016, 2019.
Zhu, X. W., Ma, Z. Q., Qiu, Y. L., Liu, H., Liu, Q., and Yin, X. M.: An evaluation of the interaction of morning residual layer ozone and mixing layer ozone in rural areas of the North China Plain, Atmos. Res., 236, 104788, https://doi.org/10.1016/j.atmosres.2019.104788, 2020.