the Creative Commons Attribution 4.0 License.
the Creative Commons Attribution 4.0 License.
 | 20 Mar 2024
Above-cloud concentrations of cloud condensation nuclei help to sustain some Arctic low-level clouds
Lucas J. Sterzinger
Previous studies have found that low-level Arctic clouds often persist for long periods even in the face of very low surface cloud condensation nuclei (CCN) concentrations. Here, we investigate whether these conditions could occur due to continuous entrainment of aerosol particles from the free troposphere (FT). We use an idealized large eddy simulation (LES) modeling framework, where aerosol concentrations are low in the boundary layer (BL) but increased up to 50× in the free troposphere. We find that the tests with higher tropospheric aerosol concentrations simulated clouds, which persisted for longer and maintained higher liquid water paths (LWPs). This is due to direct entrainment of the tropospheric aerosol into the cloud layer, which results in a precipitation suppression from the increase in cloud droplet number and in stronger cloud-top radiative cooling, which causes stronger circulations maintaining the cloud in the absence of surface forcing. Together, these two responses result in a more well-mixed boundary layer with a top that remains in contact with the tropospheric aerosol reservoir and can maintain entrainment of those aerosol particles. The surface aerosol concentrations, however, remained low in all simulations. The free-tropospheric aerosol concentration necessary to maintain the clouds is consistent with concentrations that are frequently seen in observations.
- Article
(3472 KB) - Full-text XML
- BibTeX
- EndNote


Low-level mixed-phase clouds are crucial regulators of Arctic climate (Intrieri et al., 2002; Shupe and Intrieri, 2004; Sedlar et al., 2011) and are ubiquitous (Shupe et al., 2006, 2011; Shupe, 2011). Properly modeling these clouds is necessary to accurately project Arctic and global climate change, yet the representation of Arctic low-level clouds in models has remained a challenge (Klein et al., 2009; Morrison et al., 2009, 2011, 2012; Sotiropoulou et al., 2016). Low-level Arctic clouds have been observed to exist for days at a time (Shupe, 2011; Shupe et al., 2011; Morrison et al., 2012; Verlinde et al., 2007). This is especially curious given the low aerosol concentrations in the Arctic; boundary layer aerosol concentrations are at a minimum in the summer, with typical accumulation-mode concentrations less than 100 cm−3 and sometimes less than 1 cm−3 (Mauritsen et al., 2011; Heintzenberg et al., 2015). Such low concentrations may be insufficient to maintain clouds (Mauritsen et al., 2011; Stevens et al., 2018; Sterzinger et al., 2022).
One idea regarding how these low-level clouds can be maintained in the face of such low accumulation-mode concentrations is that Aitken-mode particles become important for cloud droplet activation. This idea is supported by observational evidence suggesting that Aitken particles contribute to cloud condensation nuclei (CCN) populations in the Arctic (Willis et al., 2016; Koike et al., 2019; Kecorius et al., 2019) and, in many cases, even dominate the CCN population (Karlsson et al., 2021, 2022; Siegel et al., 2022). The importance of the Aitken mode for cloud droplets has also been suggested in Southern Ocean low-level clouds (McCoy et al., 2021). The observations are supported by large eddy simulations (LESs) and show that supersaturation in these low-level high-latitude clouds can be large enough to activate Aitken particles (Bulatovic et al., 2021; Wyant et al., 2022). However, Bulatovic et al. (2021) found that when Aitken-mode concentrations are low, the accumulation-mode concentrations are most likely also low. That is, when accumulation-mode concentrations are low, there may not necessarily be enough Aitken particles to sustain the low-level clouds either.
It has also been shown that measurements taken at the surface may not be representative of the rest of the lower atmosphere. Aerosol concentrations have been observed to be higher in the free troposphere (FT) than in the boundary layer (BL) (Lonardi et al., 2022a; Creamean et al., 2021; Wylie and Hudson, 2002; Hegg et al., 1995; Igel et al., 2017). More specifically, using tethered balloon data from Oliktok Point, Alaska, spanning late spring 2017 through early fall 2018, Creamean et al. (2021) found that above-cloud aerosol concentrations were higher than those below cloud in 38 % of the profiles analyzed. Lonardi et al. (2022a) and Igel et al. (2017), using summertime data from the high Arctic, similarly found higher concentrations of tropospheric aerosol concentrations when compared to the surface, but these studies presented data from a limited number of days (4 d in Igel et al., 2017, and 3 d in Lonardi et al., 2022a, both in over a week and a half's time frame).
It has been found that entrainment of aerosol particles above the inversion is an important source of aerosol for the Arctic boundary layer (Igel et al., 2017; Price et al., 2023). As such, while the activation of Aitken particles may be one way to maintain low-level clouds when accumulation-mode particle concentrations are ultra-low, the continuous entrainment of accumulation-mode particles at cloud top may be another way.
In this study, we first analyze the entire tethered balloon dataset from MOSAiC (Pilz et al., 2022a) for further evidence that enhanced aerosol concentrations frequently exist above the boundary layer top and to determine whether there are any consistent changes in the size distribution across the boundary layer top. We then use idealized modeling to investigate the sensitivity of Arctic mixed-phase boundary layer clouds to aerosol concentrations in the free troposphere – specifically, aerosols that act as cloud condensation nuclei. We present a suite of simulations, each with different tropospheric aerosol concentrations, and examine the effect of these varied concentrations on aerosol, cloud, and boundary layer properties. Finally, we briefly examine the sensitivity of our results to thermodynamic conditions.
Here, we extend the analysis presented by Lonardi et al. (2022a) to include all BELUGA (Balloon-bornE moduLar Utility for profilinG the lower Atmosphere) tethered balloon profiles from the high Arctic collected during MOSAiC (Shupe et al., 2022) with a well-defined temperature inversion to mark the transition to the free troposphere that is at least 100 m below the profile top (Pilz et al., 2022b). We identified eight balloon flights that meet these criteria, only two of which were shown in Lonardi et al. (2022a) (23 July 2020 beginning at 09:01 UTC and 24 July 2020). These flights occur over about 1 month. Coincident measurements of cloud presence (Lonardi et al., 2022b) and radiation properties (Lonardi et al., 2022c) with the aerosol concentration measurements (Pilz et al., 2022a) are typically not available but are instead frequently available an hour or two prior to the collection of the aerosol data. We use a combination of the cloud presence flags (available for only two flights), the broadband fluxes, and the relative humidity to make a best guess at the extent of cloud layers for each aerosol data flight. Typically, these layers seem consistent with the potential temperature profiles despite the measurements not being coincident with time (Fig. 1a). Figure 1a–c show vertical profiles of potential temperature and aerosol concentration for particle diameters > 12 nm (N12) and > 150 nm (N150) for all eight identified flights. Flight data have been binned and averaged over 10 m height bins. The extent of the cloud layers is shown with overlaid thin black lines. Note that even though cloud layers are identified, the aerosol measurements may or may not have occurred in clear skies.
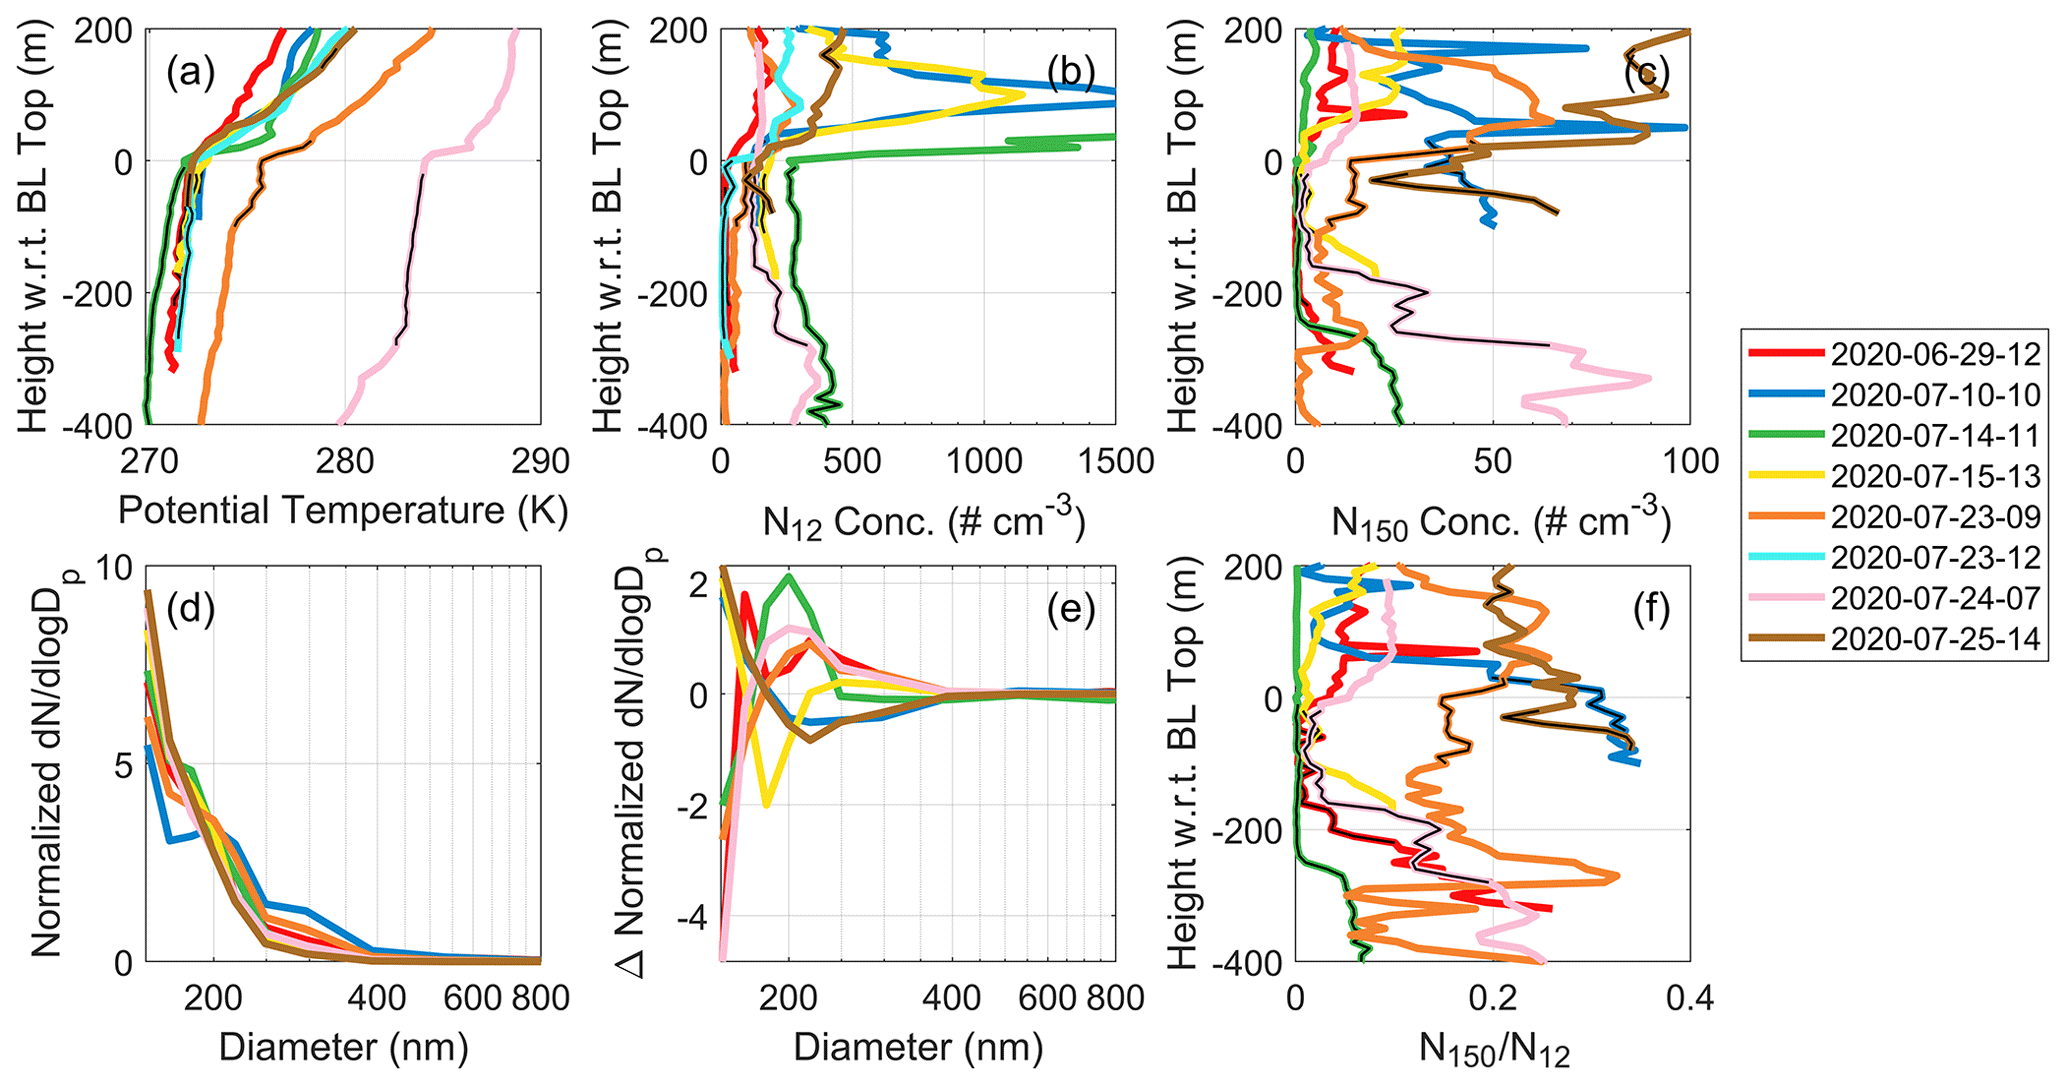
Figure 1Vertical profiles of (a) potential temperature, (b) concentration of particles with diameter > 12 nm (N12), (c) concentration of particles with diameter > 150 nm (N150), and (f) the ratio of N150 to N12 for select tethered balloon flights during the MOSAiC campaign. In these panels, height is with respect to the height temperature inversion base which has been subjectively identified. The thin black line overlaid on the thicker, colored lines indicates the most likely location of a cloud layer. (d) Normalized size distributions averaged over 100 m above the inversion base and (e) the normalized size distribution averaged over 100 m above the inversion base minus the normalized size distribution averaged 100 m below the inversion base.
All aerosol profiles, except the profile of 24 July 2020 (Fig. 1b), have higher N12 concentrations above the inversion than at any level below the inversion. The N150 data are noisier; most profiles show higher concentrations just above the inversion compared to below, but this could just be the result of aerosol scavenging by the cloud layer, such as is possibly evident on 29 June, 14 July, and/or 15 July. While the N150 data are more relevant for cloud droplet activation, there is growing evidence that Aitken-mode particles contribute to droplet formation in environments with low accumulation-mode concentration (Karlsson et al., 2021, 2022; Siegel et al., 2022). Therefore, both the N12 and N150 profiles are relevant for cloud layers in the Arctic. Some profiles show free-tropospheric N12 aerosol concentrations in the low hundreds per cubic centimeter, while others are seen to reach 1000 cm−3 or more. In all but one profile, the N150 concentrations are less than 100 cm−3 throughout the lowest 1 km of the atmosphere. In all profiles, near-surface N12 aerosol concentrations are quite low, most below 200 cm−3 and some well below 100 cm−3, despite the higher concentrations in the free troposphere. Although the number of in situ observations of above-inversion aerosol concentrations in the high Arctic remains low, there is increasing evidence that the concentration of aerosol particles is higher immediately above the inversion than at the surface more often than not during the summer months.
We can also examine the size distribution of aerosol particles for particles with diameters > 150 nm with the BELUGA data. The normalized size distributions averaged over the 100 m above the mixed layer top show that the modal diameter in all cases is 150 nm or less (Fig. 1d). As such, from these data alone, it is difficult to determine a mean aerosol particle size. Nonetheless, we can take a difference in the normalized distributions averaged over 100 m above and below the mixed layer top to get a sense of whether there is a shift in the size distributions (Fig. 1e). Doing so reveals that there is no consistent trend among the flights; in some cases, the relative number of the smallest particles (sizes near 150 nm) increases and the relative number of larger particles decreases, whereas in other cases, the opposite is true. Likewise, there is no consistent trend in the ratio of N150 to N12 as a function of height (Fig. 1f). In the model simulations that follow, we will assume that there is no change in the mean size of the aerosol population across the boundary layer top.
We used the Colorado State University Regional Atmospheric Modeling System (RAMS; Cotton et al., 2003) to run large eddy simulations of Arctic low-level clouds. RAMS uses a double-moment bulk microphysics scheme (Meyers et al., 1997; Saleeby and Cotton, 2004) predicting hydrometeor mass and number concentrations for cloud, rain, ice, snow, aggregates, graupel, and hail. The scheme includes a prognostic aerosol treatment that prognoses the aerosol mass and number concentrations (Saleeby and van den Heever, 2013). When aerosol particles activate to form droplets or ice crystals, the aerosol mass is tracked within the hydrometeor categories. Cloud droplets are activated from aerosol particles using Köhler theory by referencing lookup tables (Saleeby and Cotton, 2004), and hydrometeor diffusional growth is explicitly dependent on supersaturation. The dry and wet deposition of aerosols is included (Saleeby and van den Heever, 2013), but new particle formation is not parameterized in the RAMS aerosol scheme. Ice nucleation is parameterized following DeMott et al. (2010) as described in Saleeby and van den Heever (2013). Aerosol particles are regenerated upon hydrometeor evaporation, and the aerosol mass returned to the atmosphere is proportional to the fraction of hydrometeor mass that was fully evaporated.
In order to investigate the aerosol impacts on the liquid phase alone, the model was modified to have separate categories for aerosol able to act as CCN and ice-nucleating particles (INPs). Salt was chosen as the aerosol category that would only serve as CCN as it is totally soluble and cannot act as INP. Dust was chosen as the aerosol acting as INP; routines that allowed liquid nucleation onto dust were deactivated. While dust is known to act as CCN, the DeMott parameterization makes no distinction between immersion and deposition freezing – only the total number of particles, in or out of droplets, is required. Therefore, we think that this separation approach is appropriate. In this study, we are concerned solely with the impacts of CCN on mixed-phase Arctic clouds – this separation of CCN and INPs will allow for future study on the impact of INPs alone. Furthermore, most of the simulations in this study are run at temperatures that are only slightly supercooled; ice mixing ratios in these simulations are very low, and we do not believe that the ice is qualitatively impacting the results of this study. As such, ice in the simulations will not be discussed.
Longwave radiation is parameterized by BUGSRAD, a two-stream radiation model (Stephens et al., 2001) that includes a dependency on the effective radius of cloud droplets and ice crystals. Despite ultra-low aerosol concentrations typically occurring during the summer, we neglect shortwave radiation to avoid the complications of a diurnal cycle and to avoid needing to tie our simulations to a specific day of the year. Subgrid-scale turbulence and diffusion are based on Deardorff (1980) – this scheme parameterizes eddy viscosity as a function of resolved turbulent kinetic energy (TKE). Surface heat fluxes were set to zero to provide an idealized framework in which cloud processes can be examined without influence from the surface. The surface roughness length for momentum is set to m. These surface assumptions are supported by observations of surface fluxes in the Arctic (Schröder et al., 2003).
The simulations in this study follow a similar setup to those in Sterzinger et al. (2022): a 6 × 6 km2 periodic domain with 62.5 m horizontal and 6.25 m vertical grid spacing. The model top was set at 1500 m. Simulations were run for a simulated 30 h with a 1 s time step. The model was initialized with analytic thermodynamic profiles. A recent analysis of MOSAiC data by Jozef et al. (2023) showed that in the Arctic summer, boundary layers with very shallow mixed layers less than 125m deep are about as common as deeper, near-neutral layers. Both are frequently associated with low clouds and most frequently capped by inversions of 5 K per 100 m or stronger. Our base setup, in terms of inversion strength and boundary layer stability, is consistent with this latter cloud-bearing regime. Analytic profiles rather than case-based profiles are chosen so as to be able to easily modify them in thermodynamic sensitivity tests in a future study. These profiles are given by
where z is the height above the surface in meters, θ is potential temperature, w is the water vapor mixing ratio, and ws is the saturated mixing ratio. For our simulations, θ0= 273.15 K, a= 0.06 K m−1, and w0 is the mixing ratio that gives 100 % relative humidity at cloud base. We use a cloud that is initially 150 m thick, and as such, w0= 2.7 g kg−1.
We do not explicitly initialize cloud water. Instead, the potential temperature and water vapor profiles produce relative humidity well in excess of 100 % in the cloud layer. Excess water vapor is converted to cloud water by the model, and the associated latent heat of condensation is added to the temperature profile. Since it is these conditions – those after the model has modified the profiles that we provide in the input files – that are of most interest for understanding the model setup, we show profiles of potential temperature, water vapor, and cloud mixing ratio shortly after model initialization in Fig. 2a–b in blue. Winds are calm, and nudging of the profiles to the initial condition is not performed. The large-scale subsidence is prescribed by a fixed divergence rate of s−1. This value was chosen to prevent the boundary layer top from rising too rapidly.
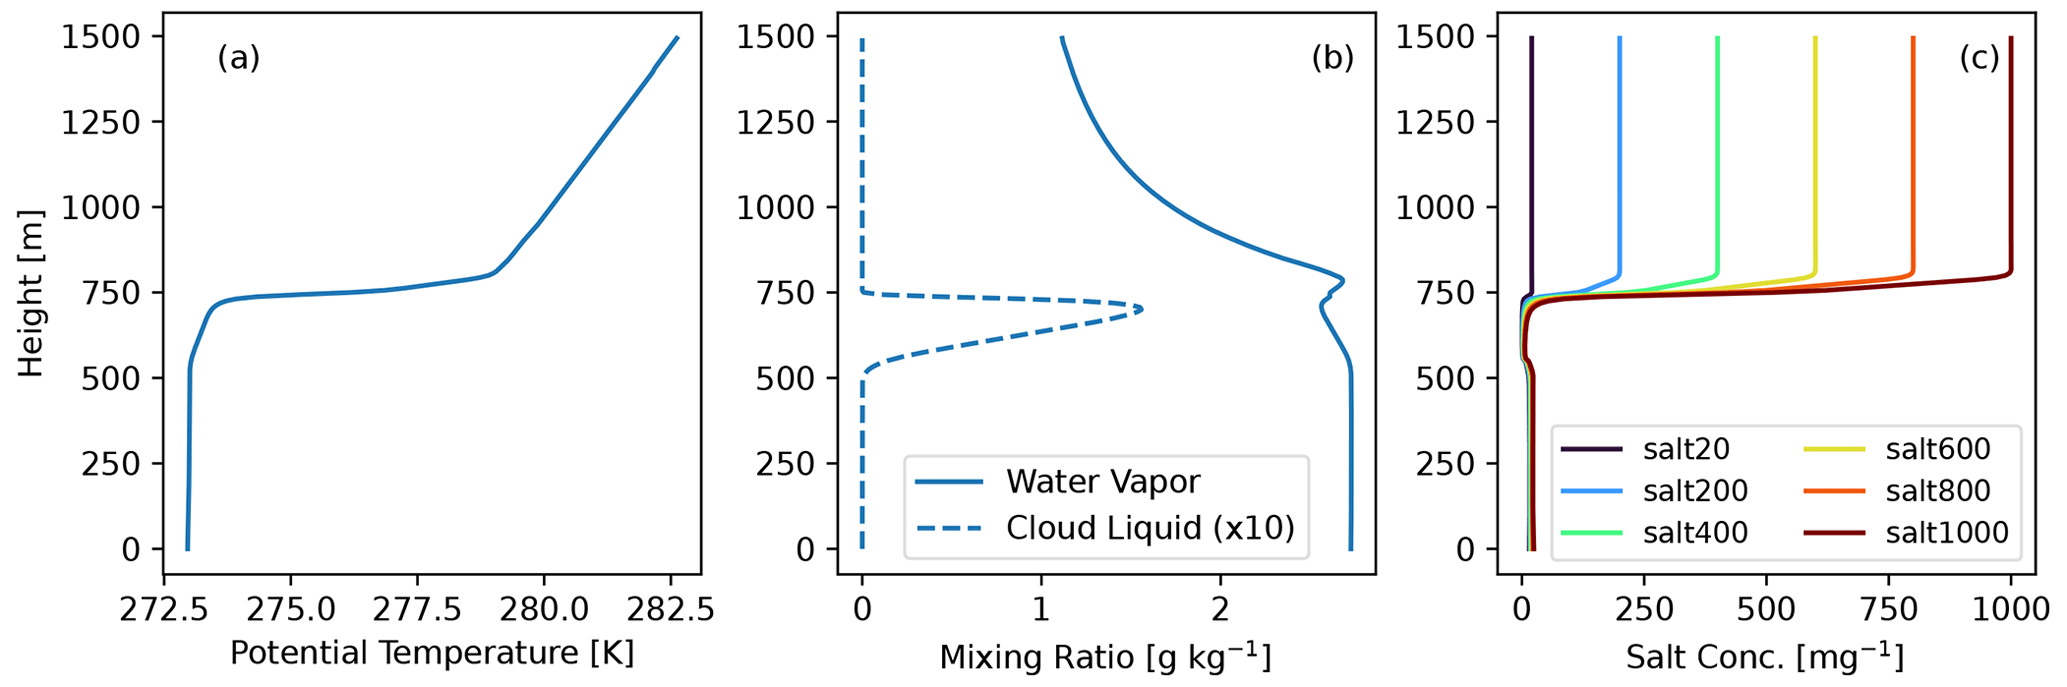
Figure 2Profiles of (a) potential temperature, (b) water vapor mixing ratio (solid lines) and cloud water mixing ratio (dashed lines; multiplied by 10 for clarity), and (c) salt aerosol profiles taken 30 min after simulation initialization.
To test the sensitivity to tropospheric CCN concentrations, a suite of simulations were run across a range of tropospheric salt concentrations. A baseline simulation with a salt aerosol particle concentration of 20 mg−1 at all levels was run. Sensitivity tests were run in which salt concentrations in the FT were set by multiples of 200 mg−1 until a concentration of 1000 mg−1 (Fig. 2c). These concentrations were chosen to be representative of the range of observed aerosol concentrations in the Arctic troposphere, with 1000 mg−1 being a high, but not unrealistically high, value (Fig. 1b). The concentration in the inversion layer linearly increases with height from 20 mg−1 to the FT concentration. In all simulations, the aerosol particles were lognormally distributed with a modal diameter of 200 nm and a logarithmic standard deviation of 1.5. These parameters were kept constant with height, given that we found no consistent trends in the change in size across the mixed layer top (Fig. 1e–f). For all of these CCN sensitivity simulations, dust concentrations were set at 20 mg−1 in both the FT and BL.
Since salt concentrations are the only aerosol species being modified in this study, from this point forward, any mention of “aerosol” is in reference to salt/CCN particles alone unless specified otherwise.
4.1 Microphysical response
The clouds produced by the six aerosol sensitivity simulations are shown in Fig. 3. Clouds appear to attain quasi-steady cloud tops for the higher aerosol concentration simulations (by design), with cloud-top mixing ratios of around 0.35 g kg−1. There is a strong sensitivity to FT aerosol concentration, with simulations initialized with FT salt concentrations of 20–400 mg−1 dissipating or nearly dissipating within 10–20 h, while the simulations initialized with concentrations of 600 mg−1 or higher are able to persist for the entire simulation period – though salt600 is headed toward dissipation. Salt600, salt800, and salt1000 are similar for the first 10 h or so but start to diverge after this time. All simulations produce some rainwater (Fig. 4b). For salt800 and above, the rainwater is a small fraction of the total liquid water. As seen by a lack of liquid water in the domain mean near the surface (Fig. 3), very little rainwater actually reaches the surface. Surface precipitation rates are at most 1.2 mm d−1, which is essentially negligible; the vast majority of the little rain that exists is quickly evaporated below cloud base.
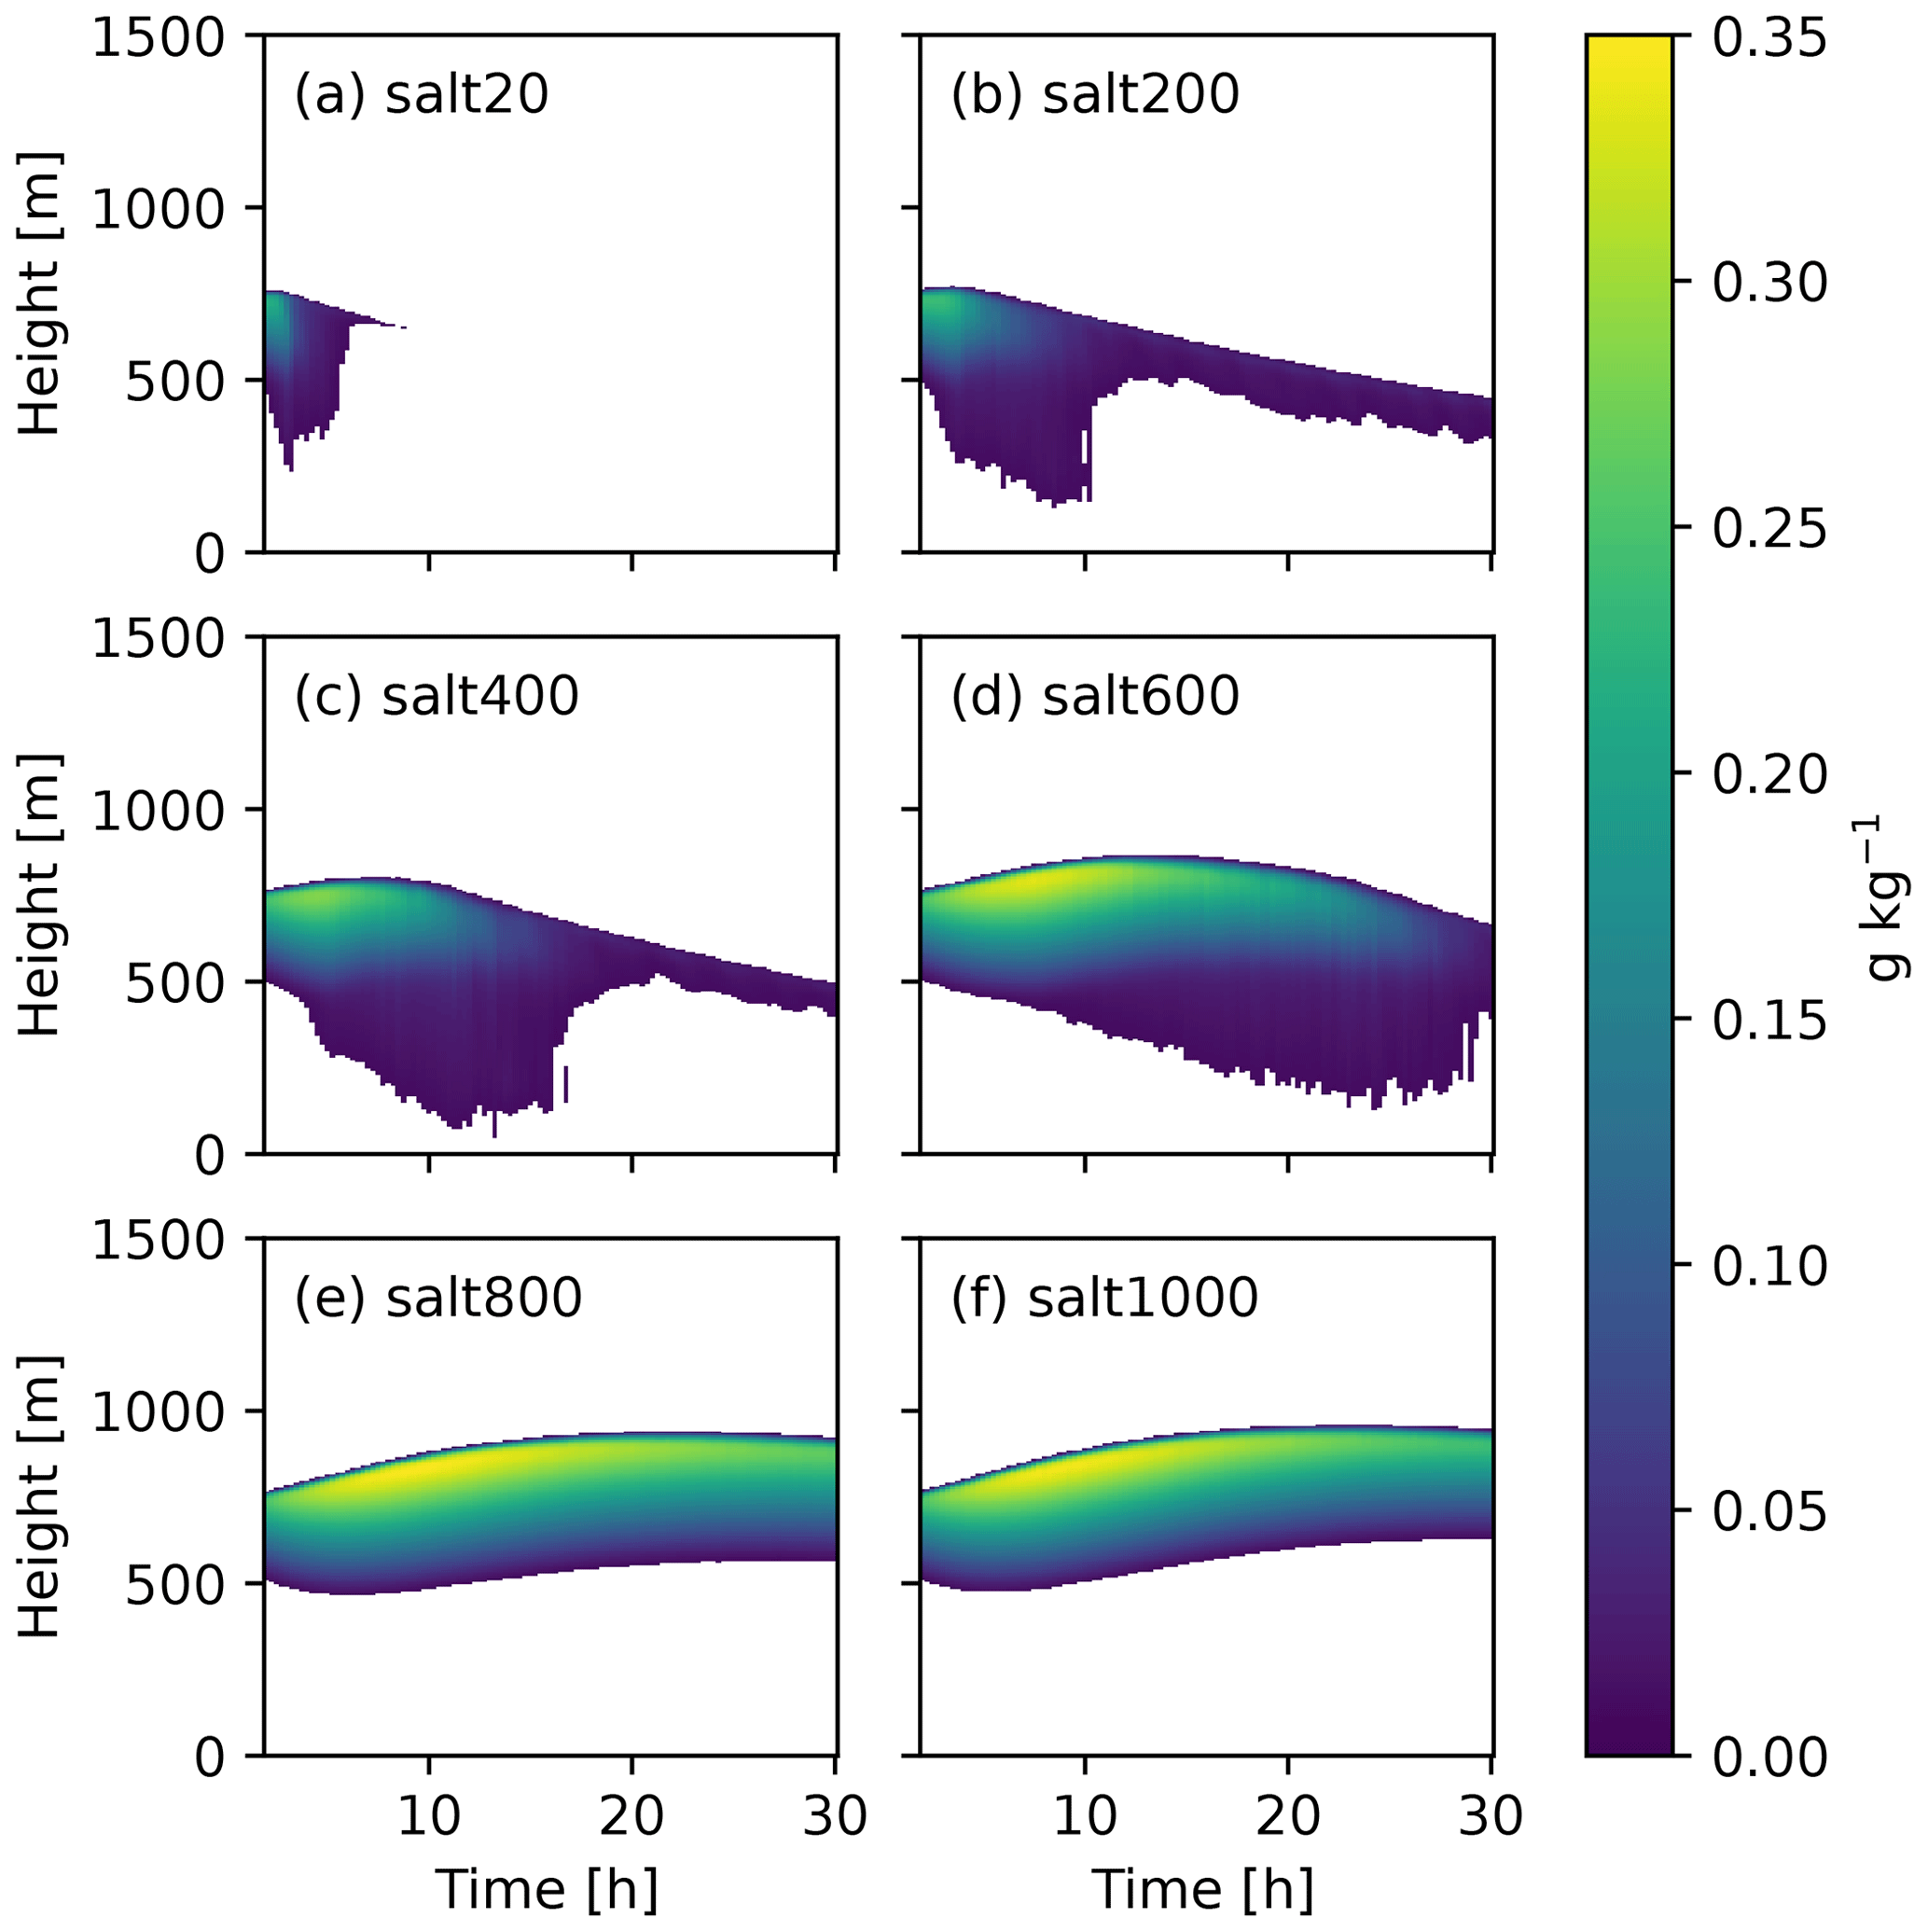
Figure 3Time–height contours of total liquid water for all six simulations. The minimum liquid water mixing ratio shown is 0.01 g kg−1. The black line denotes a 0.01 g kg−1 contour of cloud water alone.
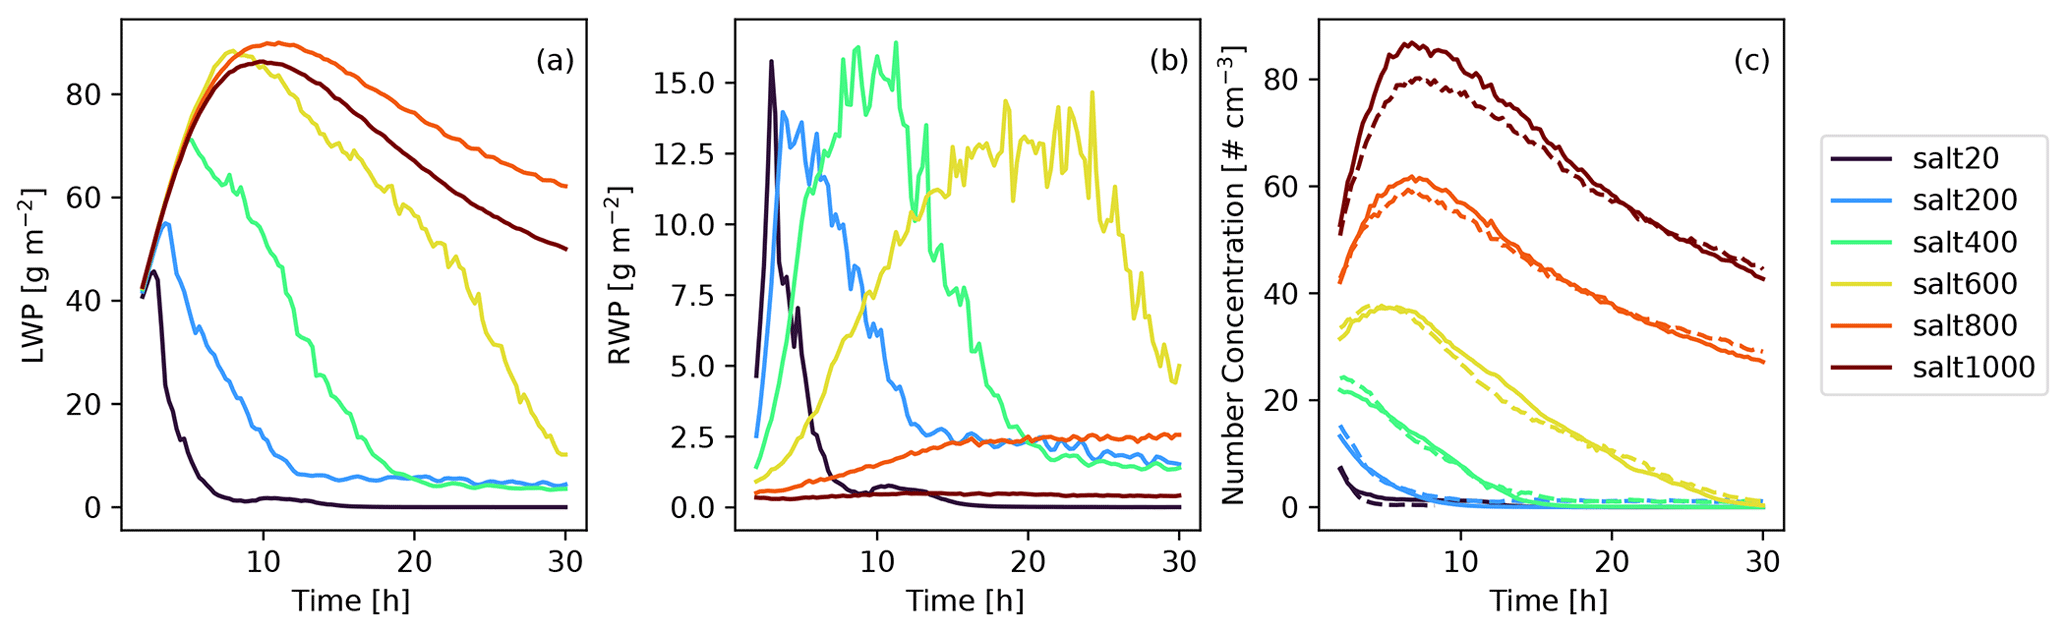
Figure 4(a) Liquid water path, (b) rainwater path for each base simulation, and (c) surface aerosol concentrations (solid) in the lowest model level and mean cloud droplet number concentrations (dashed) within the cloud layer. The first 2 h is omitted.
Since the BL aerosol concentration is initialized to 20 mg−1 in all simulations, any changes in cloud liquid properties must come from tropospheric aerosol being entrained into the cloud layer. As such, we now look to how the boundary layer aerosol concentrations and droplet concentrations respond to the FT aerosol concentration. Figure 4c shows the domain-mean salt number concentration directly above the surface in the lowest model level (solid lines) as well as the average cloud droplet concentration (dashed lines). As expected, the simulations initialized with higher aerosol concentrations in the free troposphere also have higher concentrations in the boundary layer due to transport of aerosol into the BL either via activation of FT aerosol at cloud top and subsequent hydrometeor evaporation in the boundary layer or by direct transport from the FT without being activated (Igel et al., 2017). In all cases, the BL aerosol concentration (less than about 80 cm−3 for all simulations) remains an order of magnitude lower than what was initialized in the FT. The mean droplet concentration is very closely linked to the surface aerosol concentrations (Fig. 4c), likely because the cloud layers are at least initially coupled to the surface. Decoupling occurs in some of the lower salt simulations as the clouds dissipate (Fig. 6d). Aerosol concentrations rapidly increase at the start of the simulations due to aerosol entrainment in salt600–salt1000. Eventually, aerosol concentrations decrease in time for all simulations, most likely due to dry and wet deposition and reduction in particle concentrations due to weak collision–coalescence. In salt20, without a large source of particles in the FT, surface concentrations are rapidly depleted within only a few hours after the simulations start. We note, though, that the rate of aerosol depletion in our simulations is likely unrealistically fast since our simulations lack sources of particles from the surface or from new particle formation.
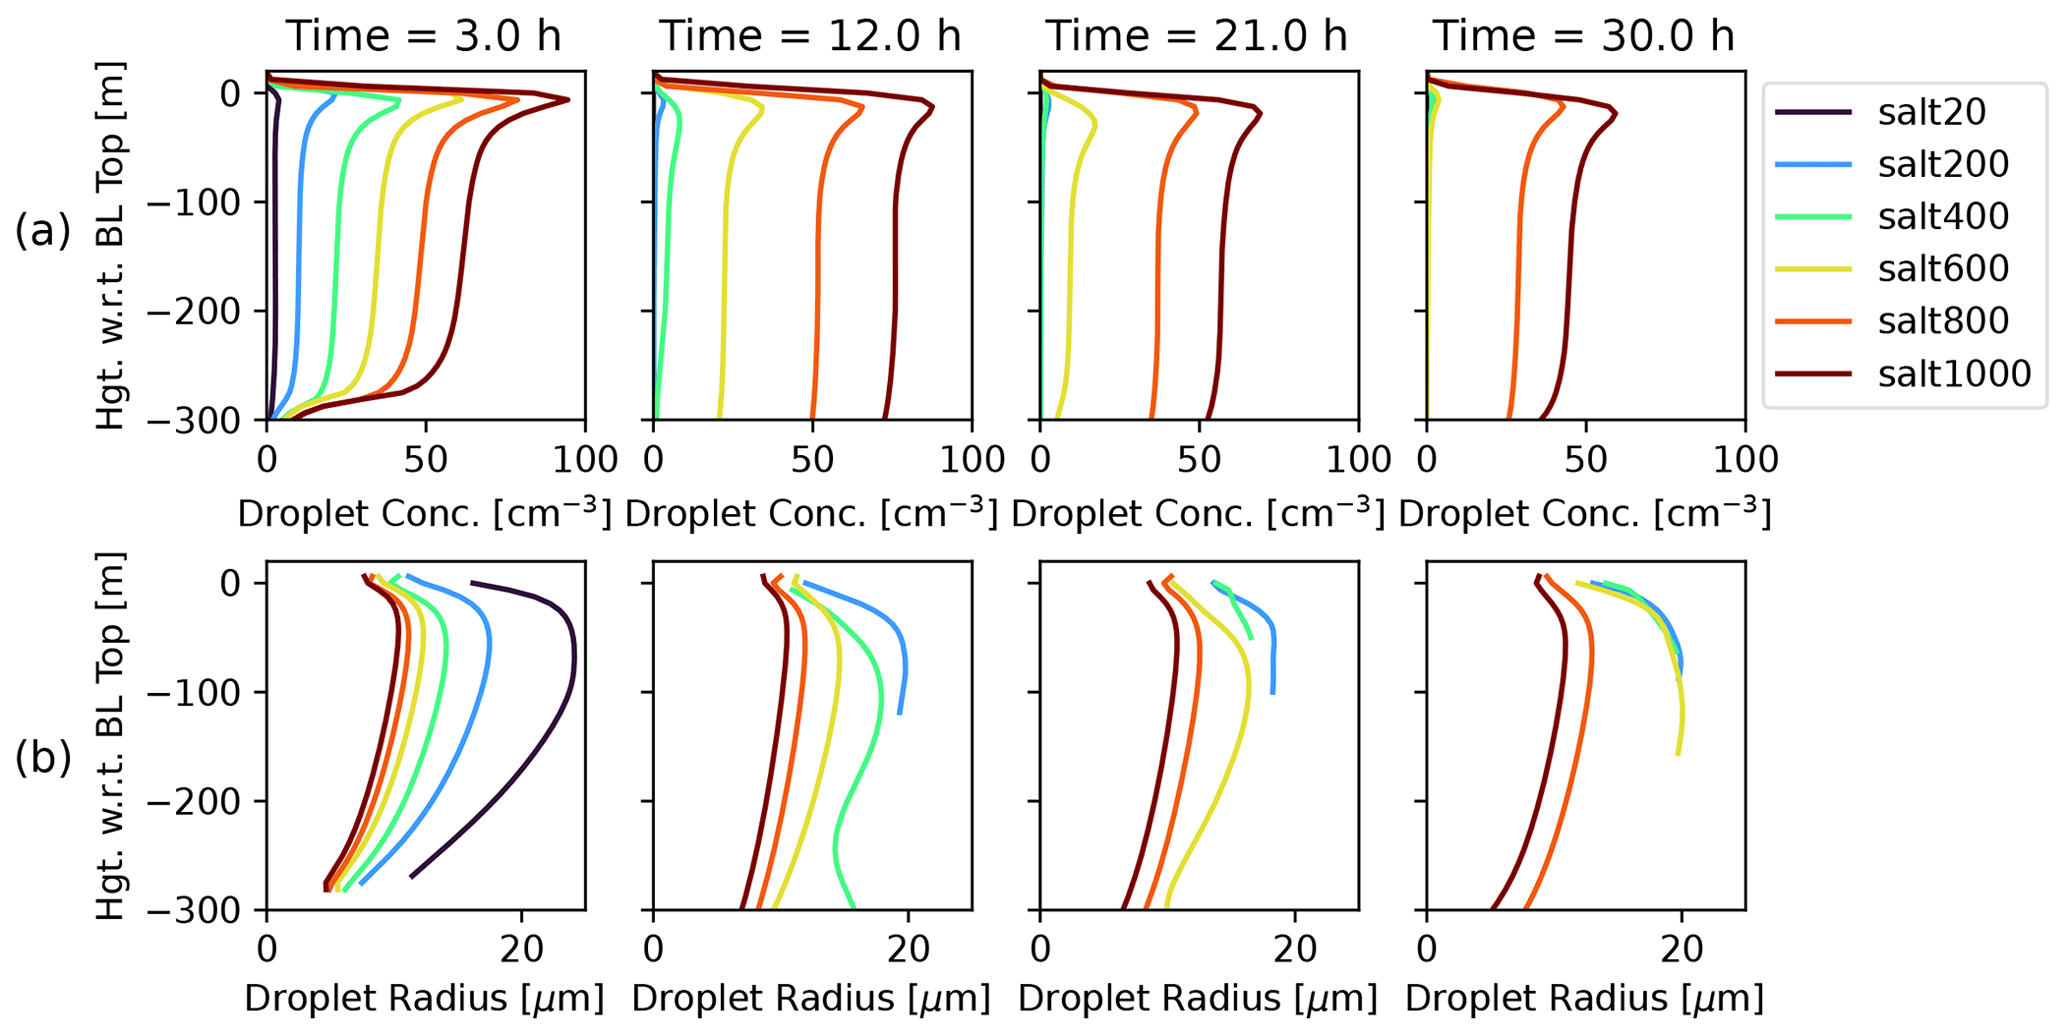
Figure 5Evolution of (a) mean cloud droplet number concentration and (b) mass-mean cloud droplet radius profiles for all simulations every 9 h. The y axes display heights with respect to the boundary layer top.
As expected, our simulations show an increase in droplet number concentration (Nd) and a decrease in mean droplet radius (rd) with an increase in FT aerosol concentrations. Figure 5a shows profiles of Nd at various times throughout the simulation period. There is an approximate linear increase in the droplet concentration with the linearly increasing tropospheric aerosol concentrations. All profiles show a small increase in Nd at cloud top, which becomes less prominent with time, consistent with the nucleation of a relatively high number of entrained aerosol particles at cloud top. The mean cloud droplet radius (Fig. 5b) decreases with increasing aerosol concentrations. In each simulation, cloud droplet number concentrations are decreasing and mean radii are increasing in time. This is indicative of either a decrease in the availability of CCN in the boundary layer and/or a decrease in the amount of aerosol being entrained into the cloud.
The result of the combined increase in cloud droplet number and decrease in radius is a reduction in collision coalescence efficiency. Figure 4c shows the rainwater path (RWP) evolution for each simulation. There clearly is sensitivity to the tropospheric aerosol concentration with salt20 raining the most at the beginning of the simulation before dissipating. The peak rain rate is delayed as the FT aerosol increases and salt1000 produces almost no rain at all. Such precipitation suppression has been commonly described in response to increasing aerosol concentrations in both warm- and mixed-phase stratocumulus clouds (e.g., Albrecht, 1989; Wood, 2005; Peng et al., 2002). As noted above, although rain is being produced, very little rain actually reaches the surface.
While salt20 simulates an essentially complete removal of aerosol and cloud water, salt200 and salt400 do not simulate complete dissipation of the clouds. Rather, salt200 and salt400 simulate persistent, very thin clouds, less than 40 m thick and with liquid water path (LWP) < 5 g m−2 (Fig. 4a), with a very small number of relatively large droplets (< 1 cm−3 in number and 10–20 µm in radius; Fig. 5). Some of this water resides in the rain category, but we note that this rainwater is produced when the droplets grow by condensation to exceed the maximum allowed mean cloud droplet diameter of 50 µm (not shown). In this situation, some cloud water is transferred to the rain category. Collision–coalescence is minimal. In this state, there are no longer strong sinks of aerosol number concentration since any particle that is activated can be returned to the atmosphere upon drop evaporation. These thin clouds are still weakly turbulent. We do not know if such a state – one with very low LWP coincident with very low aerosol particle concentrations – commonly exists in the Arctic atmosphere. Certainly, liquid-bearing clouds with LWP less than 25 g m−2 are frequently occurring (Silber et al., 2020; Sedlar, 2014). Alternatively, because the aerosol concentrations that are simulated are exceptionally low given our lack of particle sources in the model, the simulated clouds may not be representative of the Arctic atmosphere.
4.2 Thermodynamic response
The precipitation suppression process is the primary factor in the spread in LWP seen in Fig. 4a. However, it is not the only process impacting the LWP. As expected, a change in a cloud's liquid water path also affects its emissivity. Figure 6a shows a time series of the net longwave radiative flux difference across the cloud layer. This difference is equivalent to the vertically integrated longwave radiative cooling occurring in the cloud layer. There is a large spread in the flux difference, with around 80 W m−2 separating salt600 and above from salt20 and salt200 around hour 20. This radiative sensitivity to aerosol concentration is triggered first by the precipitation suppression effect described above. The less numerous, larger droplets created with fewer aerosol lead to the development of thin clouds with less liquid water, which do not behave as a blackbody but rather as a graybody. This radiative behavior of thin water clouds is consistent with previous work (Morrison et al., 2008; Shupe and Intrieri, 2004; Mauritsen et al., 2011; Garrett and Zhao, 2006). Generally, while the longwave impacts of the aerosol indirect effects are seen as minimal (especially in thicker stratocumulus clouds in lower latitude), Morrison et al. (2008) found through modeling that changing aerosol concentrations had a longwave effect in thin clouds with LWP < 50 g m−2. Shupe and Intrieri (2004) have a lower threshold of 30 g m−2 for this effect. Our results are consistent with these previous studies. Salt400, with its LWP of 50 g m−2 or less throughout most of the simulation, has an integrated radiative cooling that differs substantially from those for salt600 and above.
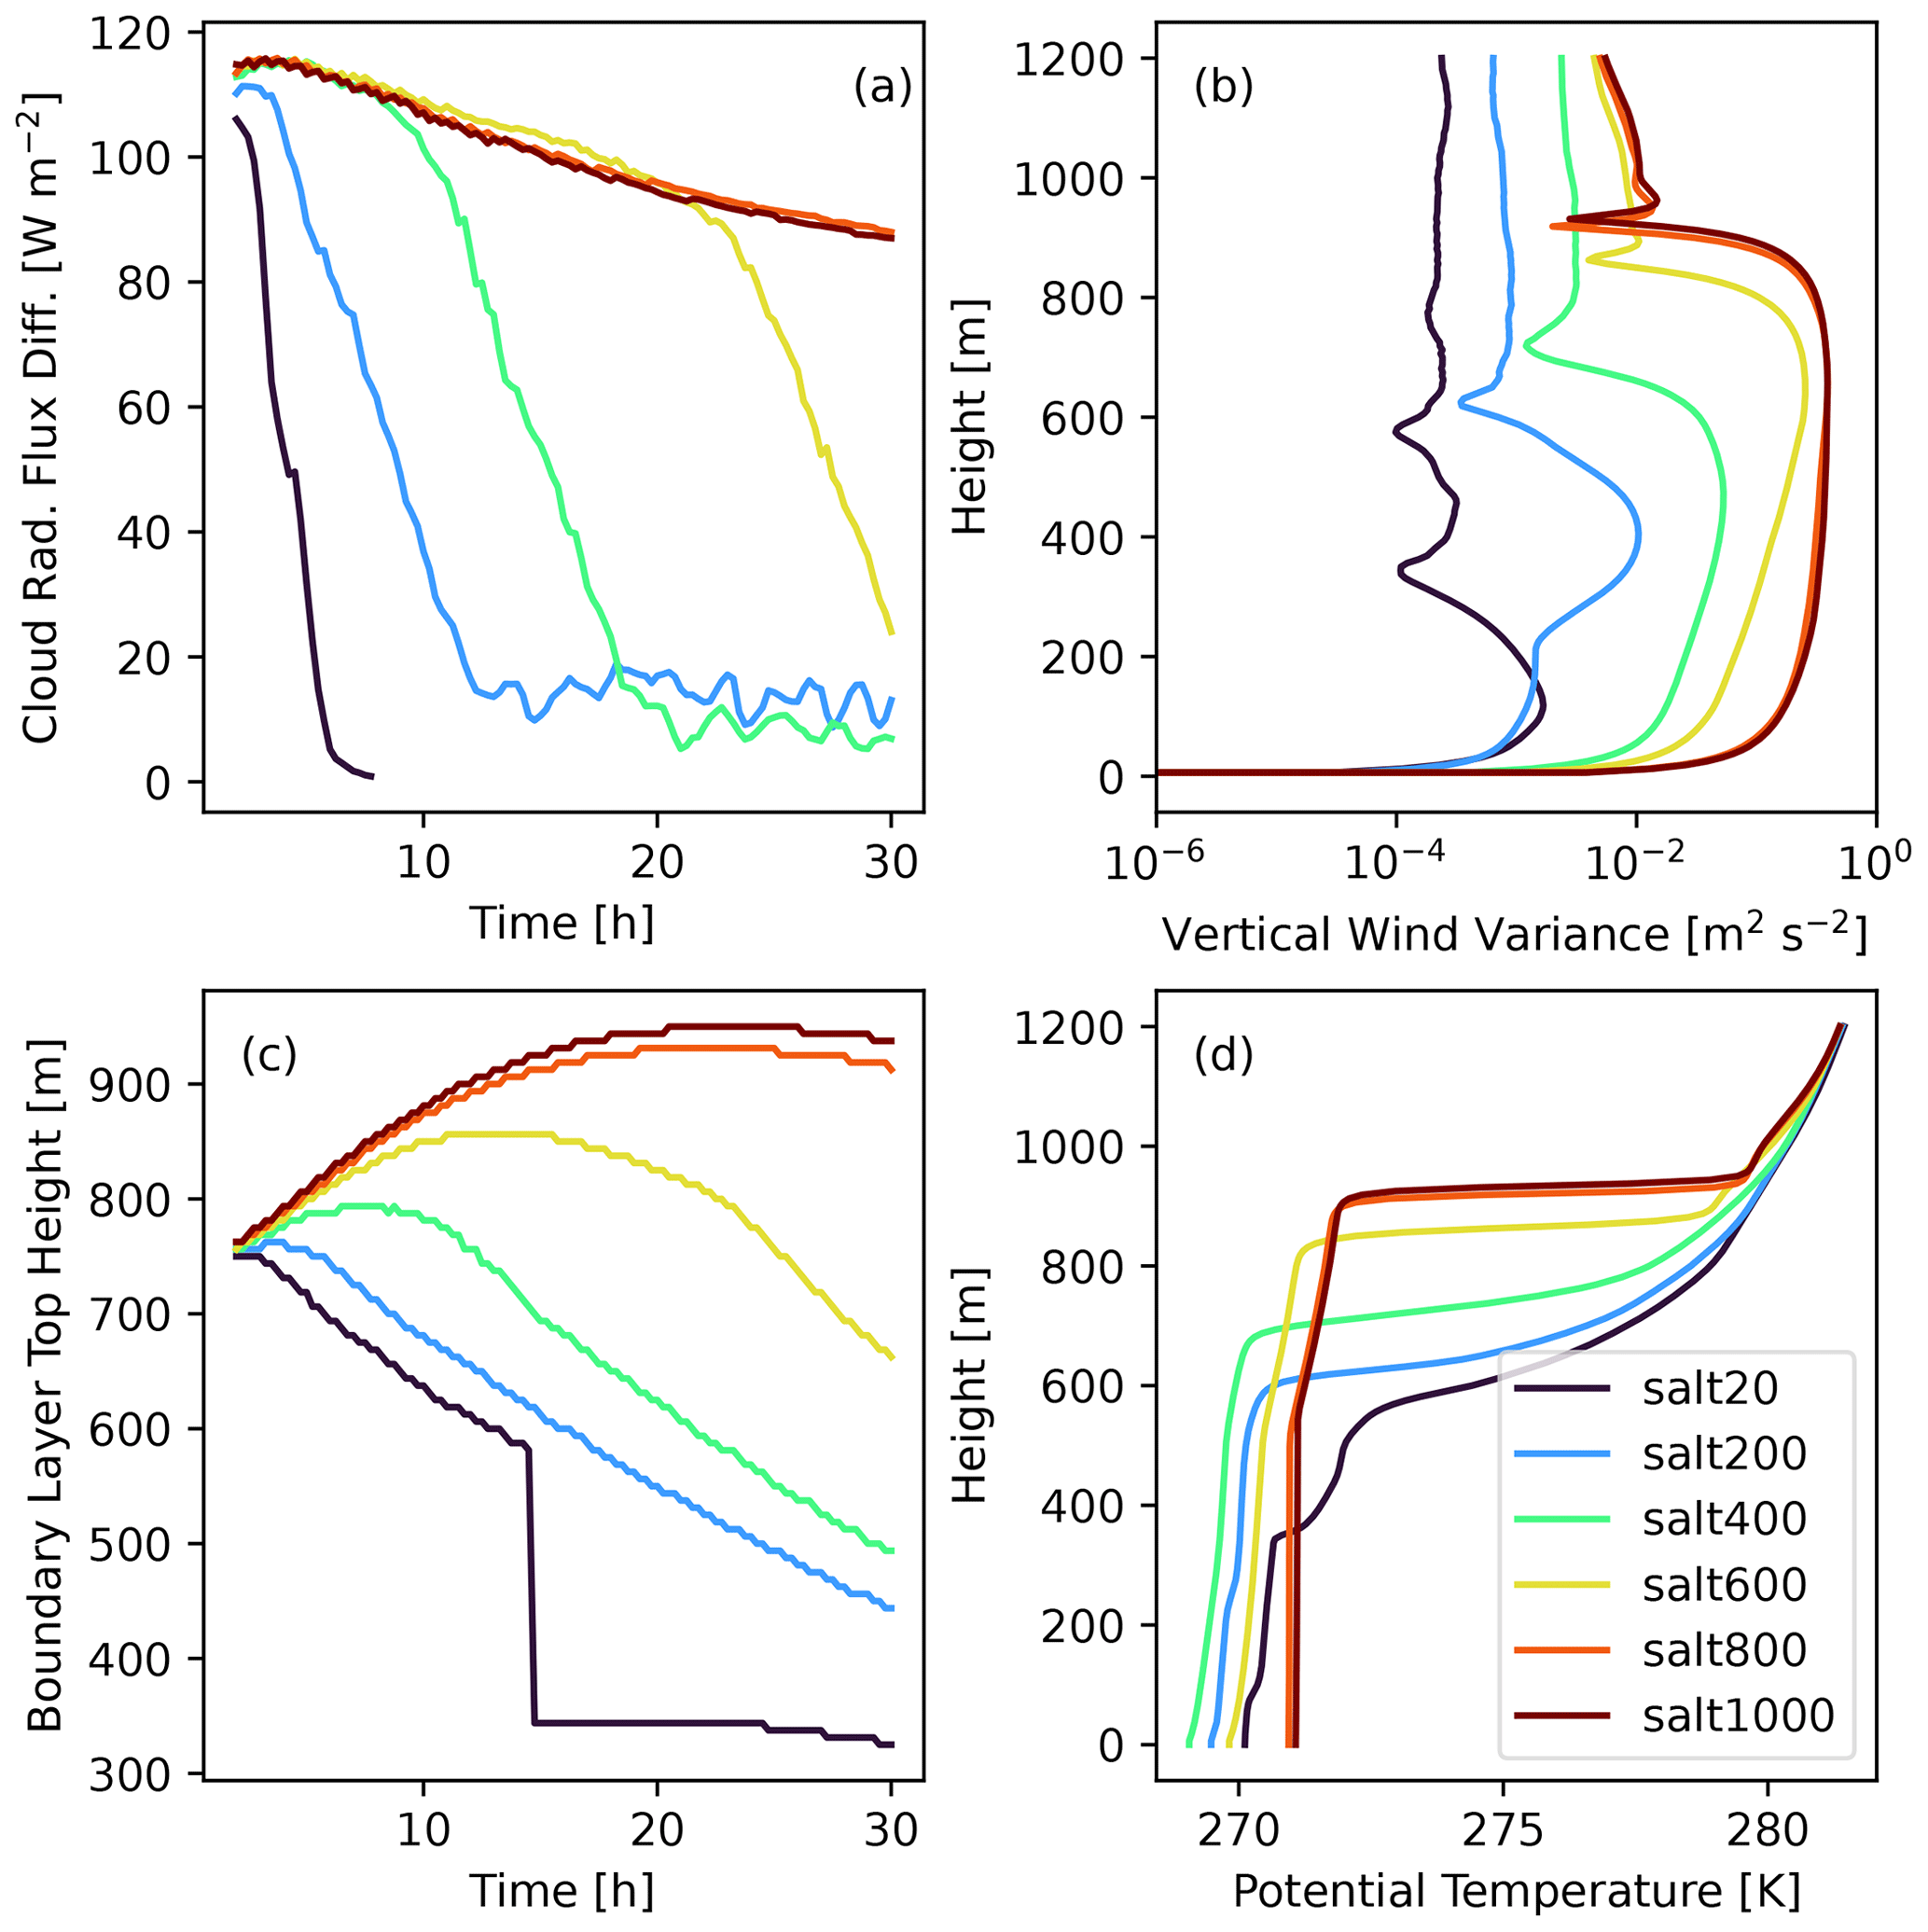
Figure 6Time series of the (a) radiative flux difference across the cloud layer and (c) boundary layer top height. Vertical profiles of (b) vertical wind variance () and (d) boundary layer potential temperature (θ) at hour 15.
This longwave sensitivity is important since, in the absence of surface fluxes, the cloud must be maintained from the top down (cooling at cloud top drives an overturning buoyancy circulation) versus from the bottom up (surface heat fluxes and BL instability drive vertical motions). As such, the dynamics of the cloud are sensitive to changes in radiative cooling rates within the cloud layer. The much reduced cooling rates in the salt200 and salt400 clouds contribute to the reduced LWP. At the same time, the reduced cooling rates help to maintain these clouds in their low LWP state by helping to reduce rain formation.
The resolved-scale vertical wind variance, which is the vertical component of resolved turbulence kinetic energy (TKE) , thus also has a sensitivity to the tropospheric aerosol concentrations. Figure 6b shows the domain-average vertical profile of midway through the simulations. Simulations with higher aerosol concentrations drive stronger vertical motions. The effect of increasing aerosol concentrations on vertical motions is more apparent at lower aerosol concentrations, where the clouds are thinner and where the cloud droplet concentration is increasing, and LWP has a stronger effect on the longwave emissivity of the cloud. As clouds start to approach a blackbody in salt600 and above, the difference in becomes smaller.
These changes to the turbulent mixing have consequences for the development of the boundary layer. Figure 6c shows the evolution of boundary layer top height (defined as the height with maximum curvature in the potential temperature profile) with time. In the higher aerosol simulations (salt800/salt1000), the BL top is nearly constant in time after about hour 15 (by design). On the other extreme, salt20 develops a second inversion at the base of the dissipating cloud. Around hour 15, this inversion becomes stronger than the original inversion, and our diagnosed BL top plummets from around 600 m to around 350 m. This double-inversion structure in salt20 is seen explicitly in the potential temperature profile at hour 15 (Fig. 6d). Salt200 and salt400 do not have a total collapse of the cloudy mixed layer, but they do have rapidly descending BL tops accompanied by weakened temperature inversions (Fig. 6d). With surface fluxes disabled and without a cloud-driven circulation to drive entrainment, the large-scale subsidence acts to lower the height of the inversion, and a lack of mixing will weaken the inversion.
Finally, the collapsing of the boundary layer has implications for aerosol entrainment and ultimately for the cloud's ability to maintain itself. Efficient entrainment of tropospheric aerosol depends on a layer of enhanced aerosol concentration directly above the cloud top. Figure 7a–c show that in salt200 and salt600 (and salt400, but not shown), a buffer develops between the aerosol in the FT and the top of the boundary layer. Potential temperature profiles normalized to BL top (Fig. 7d–f) show that the separation of the aerosol occurs as the inversion layer weakens and thickens. This is a likely factor in the faster decrease of BL aerosol concentrations in the salt20–salt400 simulations seen in Fig. 4c and, more importantly, in the ability of clouds to sustain themselves in the face of very low boundary layer aerosol concentrations. As a result of the weakened turbulent mixing, the low FT salt simulations effectively distance themselves from the reservoir of particles in the free troposphere. This in turn speeds up the weakening and thickening of the inversion layer, which further drives separation between the cloud and the FT aerosols.
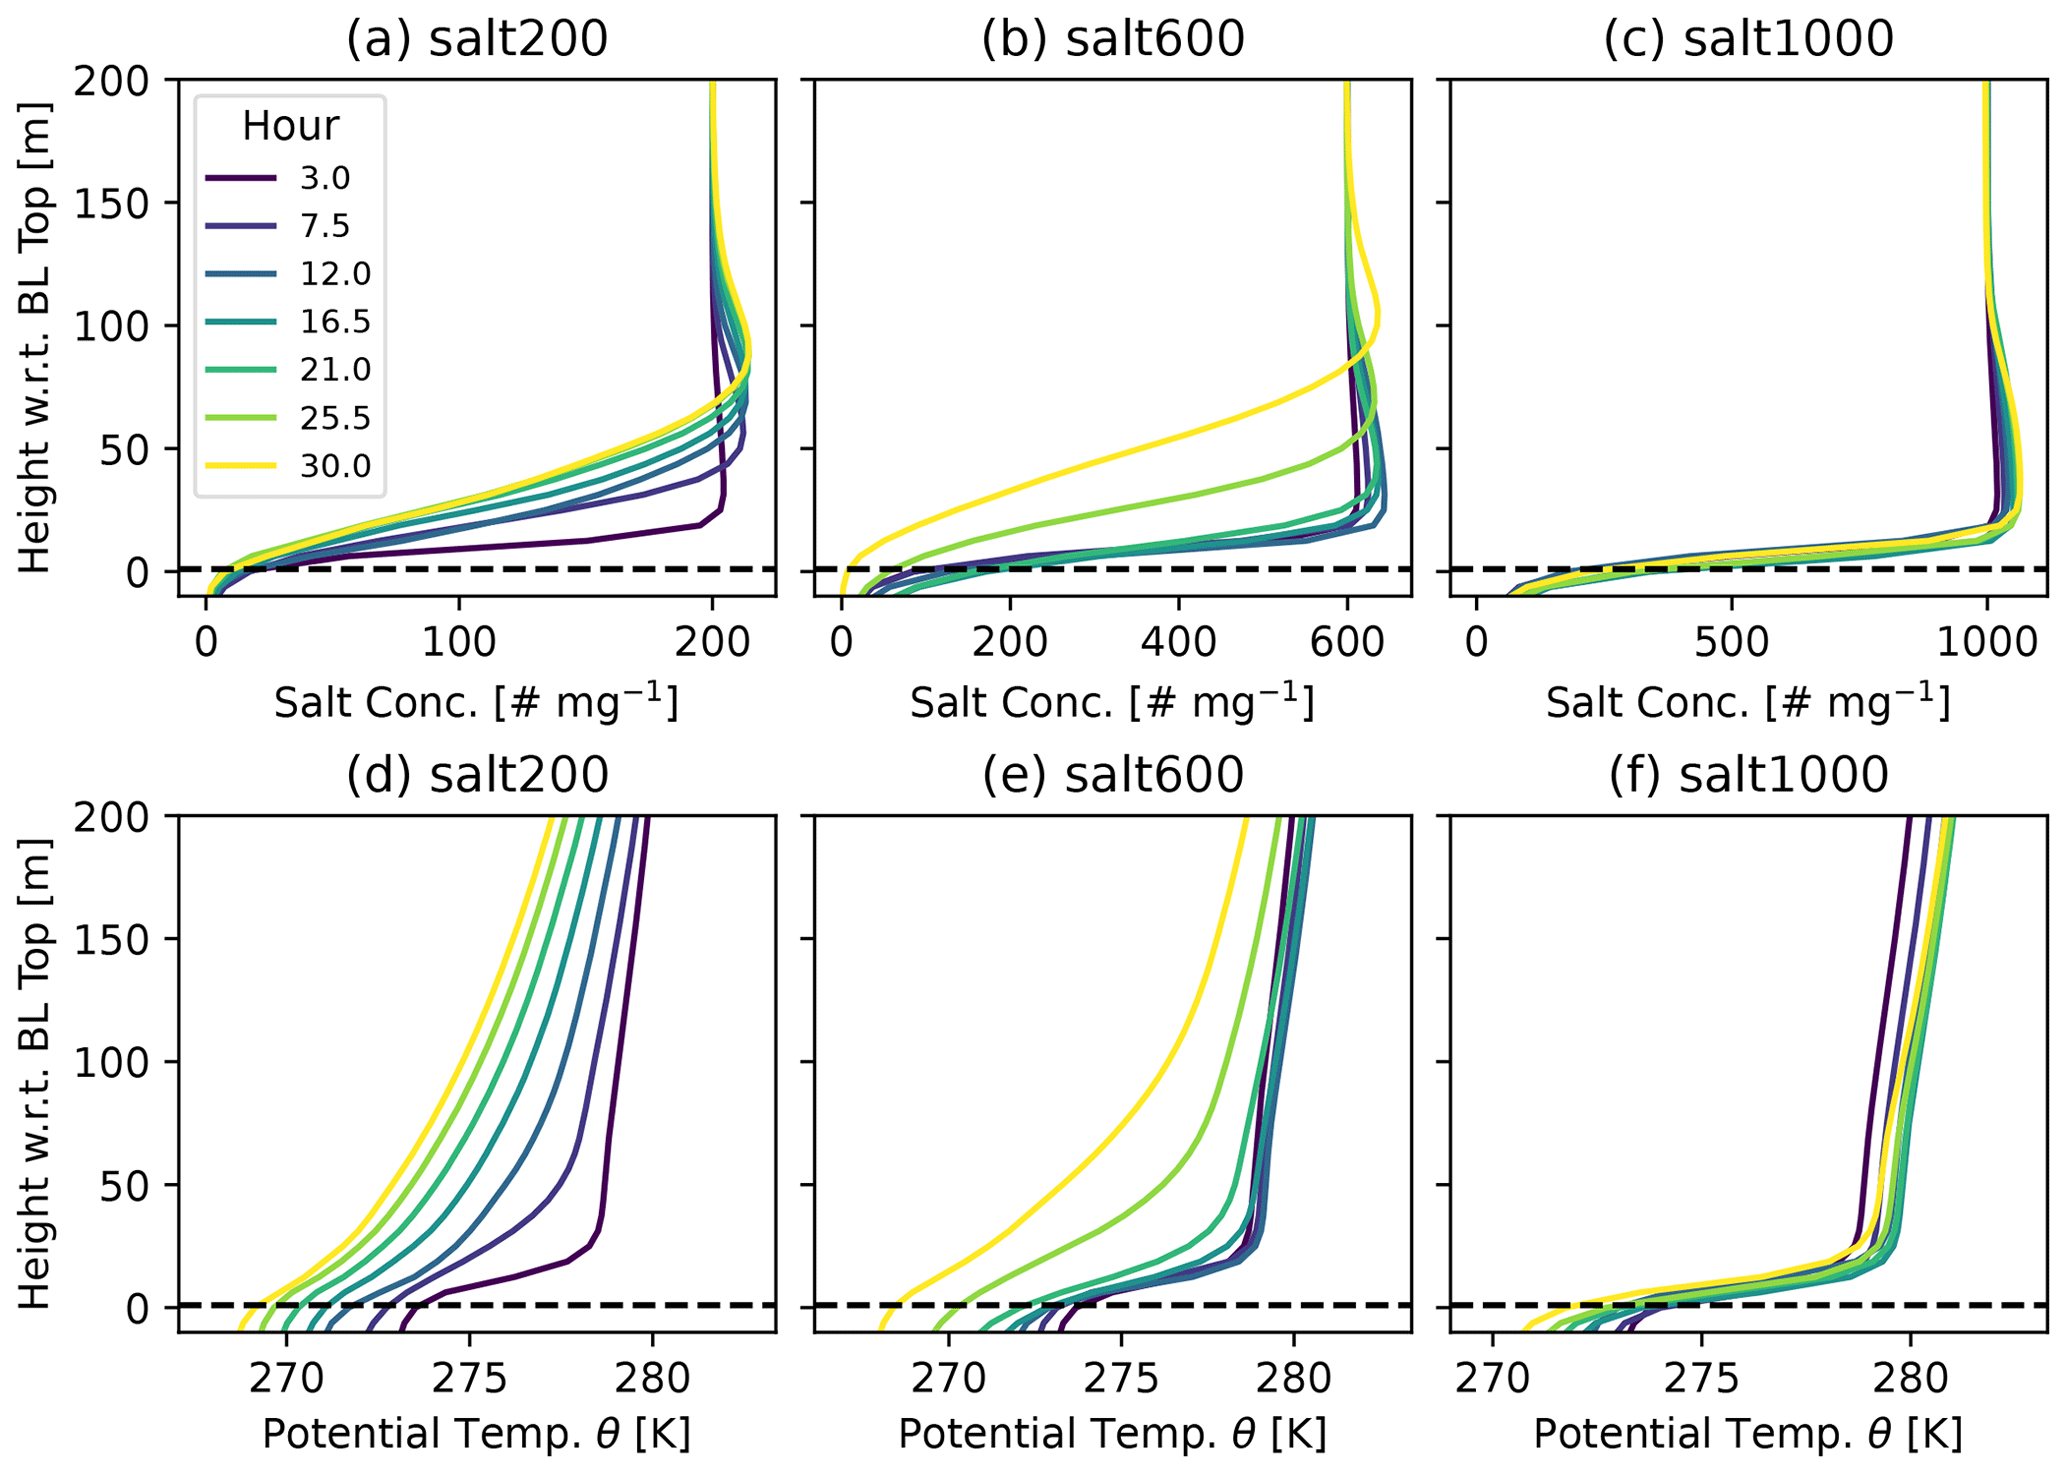
Figure 7Profiles of aerosol concentrations (a–c) and potential temperature (d–f) near the boundary layer top for salt200, salt600, and salt1000.
We present idealized LESs of an Arctic low-level cloud with various tropospheric aerosol concentrations which serve only as CCN. A baseline simulation with low aerosol concentration (20 mg−1 of salt) in both the boundary layer and free troposphere simulated a cloud that was unable to sustain itself more than a few hours. Increasing tropospheric salt concentrations from 200–1000 mg−1 (in multiples of 200 mg−1) increased LWP. The lower aerosol concentration simulations yielded clouds that either dissipated within the simulation period or persisted with very low LWP. The higher aerosol concentration simulations produced clouds that maintained high LWP throughout all or most of the simulation period.
The cloud sensitivity to aerosol in the free troposphere is a result of entrainment and activation of aerosol particles from the troposphere into the cloud layer. This process causes three feedbacks that result in the change in liquid water content in the cloud:
-
Increasing tropospheric aerosol concentrations leads to the commonly noted precipitation suppression effect. As more aerosols are entrained into the cloud layer and activated, the available liquid is divided among more droplets, causing an increase in cloud droplet number and a decrease in their size. This results in less efficient collision–coalescence processes and thus less removal of water by rain.
-
As a consequence of the rain suppression, the higher liquid water content in the higher aerosol concentration simulations causes stronger cooling at cloud top. This cooling, which is primarily responsible for the circulations that maintain the cloud in the absence of surface forcing, drives stronger vertical motions in the clouds with higher droplet concentrations.
-
Finally, due to these two processes, higher FT aerosol concentration simulations are better able to maintain contact between the FT aerosol reservoir and the boundary layer top in order to maintain the very aerosol entrainment that supports the precipitation suppression.
We find that tropospheric aerosol concentrations of more than 400 mg−1 were necessary for cloud persistence beyond about 24 h in most of the conditions that we tested. This concentration is only meant to be a very rough estimate that will of course depend on thermodynamic conditions and the size and hygroscopicity of the aerosol particles (which was rather high with our assumed salt particles). Nonetheless, it is encouraging that such concentrations are well within the range generally found in the lower free troposphere (Fig. 1b, and, e.g., Lonardi et al., 2022a; Jung et al., 2018). Given that the required concentrations are realistic, continuous aerosol entrainment from the FT is likely important in the summertime high Arctic for maintaining low-level clouds. As discussed in the Introduction, others have speculated that Aitken particles are important for explaining cloud maintenance under low aerosol conditions and found evidence of Aitken particle activation in these clouds (Bulatovic et al., 2021; Karlsson et al., 2021, 2022; Siegel et al., 2022). Here, we present a second mechanism for maintaining a sufficient CCN supply that can work together with Aitken particle activation. A major limitation of this study is that we did not include new particle formation in our simulations. Price et al. (2023) found that in the late summer in the Arctic boundary layer there is a transition from particle sources dominated by long-range transport and entrainment through the boundary layer top to local new particle formation. As such, there is reason to believe that new particle formation may be important at this time of year. We also did not include Aitken particles in our simulations. Future work looking at the maintenance of clouds under low aerosol conditions should consider all of these processes as well as consider the sensitivity to thermodynamic conditions.
Tethered balloon data can be found on PANGAEA: meteorology data at https://doi.org/10.1594/PANGAEA.952341 (Pilz et al., 2022b), aerosol data at https://doi.org/10.1594/PANGAEA.943907 (Pilz et al., 2022a), broadband longwave radiation at https://doi.org/10.1594/PANGAEA.944200 (Lonardi et al., 2022c), and liquid water flags at https://doi.org/10.1594/PANGAEA.944068 (Lonardi et al., 2022b). Model source code and namelists used in this study can be found at https://doi.org/10.5281/zenodo.7991354 (Sterzinger et al., 2023). Horizontally averaged processed model data used for analysis can be found at https://doi.org/10.5281/zenodo.7986917 (Sterzinger and Igel, 2023b). Code used to generate plots for this paper can be found at https://doi.org/10.5281/zenodo.7996595 (Sterzinger and Igel, 2023a).
LJS and ALI conceived the study. LJS and ALI conducted and analyzed the simulations. ALI analyzed the tethered balloon data. LJS wrote the original draft. LJS and ALI edited and reviewed the draft.
The contact author has declared that neither of the authors has any competing interests.
Publisher’s note: Copernicus Publications remains neutral with regard to jurisdictional claims made in the text, published maps, institutional affiliations, or any other geographical representation in this paper. While Copernicus Publications makes every effort to include appropriate place names, the final responsibility lies with the authors.
We thank Michael Tjernström and one anonymous reviewer for their comments on the manuscript.
This research has been supported by the U.S. Department of Energy's ASR, an Office of Science Biological and Environmental Research program (grant no. DE-SC0019073-0).
This paper was edited by Lynn M. Russell and reviewed by Michael Tjernström and one anonymous referee.
Albrecht, B. A.: Aerosols, Cloud Microphysics, and Fractional Cloudiness, Science, 245, 1227–1230, https://doi.org/10.1126/science.245.4923.1227, 1989. a
Bulatovic, I., Igel, A. L., Leck, C., Heintzenberg, J., Riipinen, I., and Ekman, A. M. L.: The importance of Aitken mode aerosol particles for cloud sustenance in the summertime high Arctic – a simulation study supported by observational data, Atmos. Chem. Phys., 21, 3871–3897, https://doi.org/10.5194/acp-21-3871-2021, 2021. a, b, c
Cotton, W. R., Pielke Sr., R. A., Walko, R. L., Liston, G. E., Tremback, C. J., Jiang, H., McAnelly, R. L., Harrington, J. Y., Nicholls, M. E., Carrio, G. G., and McFadden, J. P.: RAMS 2001: Current Status and Future Directions, Meteorol. Atmos. Phys., 82, 5–29, https://doi.org/10.1007/s00703-001-0584-9, 2003. a
Creamean, J. M., de Boer, G., Telg, H., Mei, F., Dexheimer, D., Shupe, M. D., Solomon, A., and McComiskey, A.: Assessing the vertical structure of Arctic aerosols using balloon-borne measurements, Atmos. Chem. Phys., 21, 1737–1757, https://doi.org/10.5194/acp-21-1737-2021, 2021. a, b
Deardorff, J. W.: Stratocumulus-Capped Mixed Layers Derived from a Three-Dimensional Model, Bound.-Lay. Meteorol., 18, 495–527, https://doi.org/10.1007/BF00119502, 1980. a
DeMott, P. J., Prenni, A. J., Liu, X., Kreidenweis, S. M., Petters, M. D., Twohy, C. H., Richardson, M. S., Eidhammer, T., and Rogers, D. C.: Predicting Global Atmospheric Ice Nuclei Distributions and Their Impacts on Climate, P. Natl. Acad. Sci. USA, 107, 11217–11222, https://doi.org/10.1073/pnas.0910818107, 2010. a
Garrett, T. J. and Zhao, C.: Increased Arctic Cloud Longwave Emissivity Associated with Pollution from Mid-Latitudes, Nature, 440, 787–789, https://doi.org/10.1038/nature04636, 2006. a
Hegg, D. A., Ferek, R. J., and Hobbs, P. V.: Cloud Condensation Nuclei over the Arctic Ocean in Early Spring, J. Appl. Meteorol. Clim., 34, 2076–2082, https://doi.org/10.1175/1520-0450(1995)034<2076:CCNOTA>2.0.CO;2, 1995. a
Heintzenberg, J., Leck, C., and Tunved, P.: Potential source regions and processes of aerosol in the summer Arctic, Atmos. Chem. Phys., 15, 6487–6502, https://doi.org/10.5194/acp-15-6487-2015, 2015. a
Igel, A. L., Ekman, A. M. L., Leck, C., Tjernström, M., Savre, J., and Sedlar, J.: The Free Troposphere as a Potential Source of Arctic Boundary Layer Aerosol Particles, Geophys. Res. Lett., 44, 7053–7060, https://doi.org/10.1002/2017GL073808, 2017. a, b, c, d, e
Intrieri, J. M., Fairall, C. W., Shupe, M. D., Persson, P. O. G., Andreas, E. L., Guest, P. S., and Moritz, R. E.: An Annual Cycle of Arctic Surface Cloud Forcing at SHEBA, J. Geophys. Res.-Oceans, 107, SHE 13-1–SHE 13-14, https://doi.org/10.1029/2000JC000439, 2002. a
Jozef, G. C., Cassano, J. J., Dahlke, S., Dice, M., Cox, C. J., and de Boer, G.: Thermodynamic and kinematic drivers of atmospheric boundary layer stability in the central Arctic during the Multidisciplinary drifting Observatory for the Study of Arctic Climate (MOSAiC), Atmos. Chem. Phys., 23, 13087–13106, https://doi.org/10.5194/acp-23-13087-2023, 2023. a
Jung, C. H., Yoon, Y. J., Kang, H. J., Gim, Y., Lee, B. Y., Ström, J., Krejci, R., and Tunved, P.: The Seasonal Characteristics of Cloud Condensation Nuclei (CCN) in the Arctic Lower Troposphere, Tellus B, 70, 1–13, https://doi.org/10.1080/16000889.2018.1513291, 2018. a
Karlsson, L., Krejci, R., Koike, M., Ebell, K., and Zieger, P.: A long-term study of cloud residuals from low-level Arctic clouds, Atmos. Chem. Phys., 21, 8933–8959, https://doi.org/10.5194/acp-21-8933-2021, 2021. a, b, c
Karlsson, L., Baccarini, A., Duplessis, P., Baumgardner, D., Brooks, I. M., Chang, R. Y.-W., Dada, L., Dällenbach, K. R., Heikkinen, L., Krejci, R., Leaitch, W. R., Leck, C., Partridge, D. G., Salter, M. E., Wernli, H., Wheeler, M. J., Schmale, J., and Zieger, P.: Physical and Chemical Properties of Cloud Droplet Residuals and Aerosol Particles During the Arctic Ocean 2018 Expedition, J. Geophys. Res.-Atmos., 127, e2021JD036383, https://doi.org/10.1029/2021JD036383, 2022. a, b, c
Kecorius, S., Vogl, T., Paasonen, P., Lampilahti, J., Rothenberg, D., Wex, H., Zeppenfeld, S., van Pinxteren, M., Hartmann, M., Henning, S., Gong, X., Welti, A., Kulmala, M., Stratmann, F., Herrmann, H., and Wiedensohler, A.: New particle formation and its effect on cloud condensation nuclei abundance in the summer Arctic: a case study in the Fram Strait and Barents Sea, Atmos. Chem. Phys., 19, 14339–14364, https://doi.org/10.5194/acp-19-14339-2019, 2019. a
Klein, S. A., McCoy, R. B., Morrison, H., Ackerman, A. S., Avramov, A., de Boer, G., Chen, M., Cole, J. N., del Genio, A. D., Falk, M., Foster, M. J., Fridlind, A., Golaz, J. C., Hashino, T., Harrington, J. Y., Hoose, C., Khairoutdinov, M. F., Larson, V. E., Liu, X., Luo, Y., McFarquhar, G. M., Menon, S., Neggers, R. A., Park, S., Poellot, M. R., Schmidt, J. M., Sednev, I., Shipway, B. J., Shupe, M. D., Spangenberg, D. A., Sud, Y. C., Turner, D. D., Veron, D. E., von Salzen, K., Walker, G. K., Wang, Z., Wolf, A. B., Xie, S., Xu, K. M., Yang, F., and Zhang, G.: Intercomparison of Model Simulations of Mixed-Phase Clouds Observed during the ARM Mixed-Phase Arctic Cloud Experiment. I: Single-layer Cloud, Q. J. Roy. Meteorol. Soc., 135, 979–1002, https://doi.org/10.1002/qj.416, 2009. a
Koike, M., Ukita, J., Ström, J., Tunved, P., Shiobara, M., Vitale, V., Lupi, A., Baumgardner, D., Ritter, C., Hermansen, O., Yamada, K., and Pedersen, C. A.: Year-Round In Situ Measurements of Arctic Low-Level Clouds: Microphysical Properties and Their Relationships With Aerosols, J. Geophys. Res.-Atmos., 124, 1798–1822, https://doi.org/10.1029/2018JD029802, 2019. a
Lonardi, M., Pilz, C., Akansu, E. F., Dahlke, S., Egerer, U., Ehrlich, A., Griesche, H., Heymsfield, A. J., Kirbus, B., Schmitt, C. G., Shupe, M. D., Siebert, H., Wehner, B., and Wendisch, M.: Tethered Balloon-Borne Profile Measurements of Atmospheric Properties in the Cloudy Atmospheric Boundary Layer over the Arctic Sea Ice during MOSAiC: Overview and First Results, Elementa: Science of the Anthropocene, 10, 000120, https://doi.org/10.1525/elementa.2021.000120, 2022a. a, b, c, d, e, f
Lonardi, M., Pilz, C., Siebert, H., Ehrlich, A., and Wendisch, M.: Tethered balloon-borne measurements of liquid cloud water presence during MOSAiC leg 4 in July 2020, PANGAEA [data set], https://doi.org/10.1594/PANGAEA.944068, 2022b. a, b
Lonardi, M., Pilz, C., Siebert, H., Ehrlich, A., and Wendisch, M.: Tethered balloon-borne measurements of terrestrial radiation during MOSAiC leg 4 in July 2020, PANGAEA [data set], https://doi.org/10.1594/PANGAEA.944200, 2022c. a, b
Mauritsen, T., Sedlar, J., Tjernström, M., Leck, C., Martin, M., Shupe, M., Sjogren, S., Sierau, B., Persson, P. O. G., Brooks, I. M., and Swietlicki, E.: An Arctic CCN-limited cloud-aerosol regime, Atmos. Chem. Phys., 11, 165–173, https://doi.org/10.5194/acp-11-165-2011, 2011. a, b, c
McCoy, I. L., Bretherton, C. S., Wood, R., Twohy, C. H., Gettelman, A., Bardeen, C. G., and Toohey, D. W.: Influences of Recent Particle Formation on Southern Ocean Aerosol Variability and Low Cloud Properties, J. Geophys. Res.-Atmos., 126, e2020JD033529, https://doi.org/10.1029/2020JD033529, 2021. a
Meyers, M. P., Walko, R. L., Harrington, J. Y., and Cotton, W. R.: New RAMS Cloud Microphysics Parameterization. Part II: The Two-Moment Scheme, Atmos. Res., 45, 3–39, https://doi.org/10.1016/S0169-8095(97)00018-5, 1997. a
Morrison, H., Pinto, J. O., Curry, J. A., and McFarquhar, G. M.: Sensitivity of modeled arctic mixed-phase stratocumulus to cloud condensation and ice nuclei over regionally varying surface conditions, J. Geophys. Res., 113, D05203, https://doi.org/10.1029/2007JD008729, 2008. a, b
Morrison, H., McCoy, R. B., Klein, S. A., Xie, S., Luo, Y., Avramov, A., Chen, M., Cole, J. N. S., Falk, M., Foster, M. J., Del Genio, A. D., Harrington, J. Y., Hoose, C., Khairoutdinov, M. F., Larson, V. E., Liu, X., McFarquhar, G. M., Poellot, M. R., von Salzen, K., Shipway, B. J., Shupe, M. D., Sud, Y. C., Turner, D. D., Veron, D. E., Walker, G. K., Wang, Z., Wolf, A. B., Xu, K.-M., Yang, F., and Zhang, G.: Intercomparison of Model Simulations of Mixed-Phase Clouds Observed during the ARM Mixed-Phase Arctic Cloud Experiment. II: Multilayer Cloud, Q. J. Roy. Meteor. Soc., 135, 1003–1019, https://doi.org/10.1002/qj.415, 2009. a
Morrison, H., Zuidema, P., Ackerman, A. S., Avramov, A., De Boer, G., Fan, J., Fridlind, A. M., Hashino, T., Harrington, J. Y., Luo, Y., Ovchinnikov, M., and Shipway, B.: Intercomparison of Cloud Model Simulations of Arctic Mixed-Phase Boundary Layer Clouds Observed during SHEBA/FIRE-ACE, J. Adv. Model. Earth Sy., 3, M05001, https://doi.org/10.1029/2011MS000066, 2011. a
Morrison, H., De Boer, G., Feingold, G., Harrington, J., Shupe, M. D., and Sulia, K.: Resilience of Persistent Arctic Mixed-Phase Clouds, Nat. Geosci., 5, 11–17, https://doi.org/10.1038/ngeo1332, 2012. a, b
Peng, Y., Lohmann, U., Leaitch, R., Banic, C., and Couture, M.: The Cloud Albedo-Cloud Droplet Effective Radius Relationship for Clean and Polluted Clouds from RACE and FIRE.ACE, J. Geophys. Res., 107, AAC 1-1–AAC 1-6, https://doi.org/10.1029/2000JD000281, 2002. a
Pilz, C., Lonardi, M., Siebert, H., and Wehner, B.: Tethered balloon-borne measurements of aerosol particle microphysics during the MOSAiC expedition from June to July 2020, PANGAEA [data set], https://doi.org/10.1594/PANGAEA.943907, 2022a. a, b, c
Pilz, C., Siebert, H., and Lonardi, M.: Tethered balloon-borne measurements of meteorological parameters during MOSAiC leg 4 in June and July 2020, PANGAEA [data set], https://doi.org/10.1594/PANGAEA.952341, 2022b. a, b
Price, R., Baccarini, A., Schmale, J., Zieger, P., Brooks, I. M., Field, P., and Carslaw, K. S.: Late summer transition from a free-tropospheric to boundary layer source of Aitken mode aerosol in the high Arctic, Atmos. Chem. Phys., 23, 2927–2961, https://doi.org/10.5194/acp-23-2927-2023, 2023. a, b
Saleeby, S. M. and Cotton, W. R.: A Large-Droplet Mode and Prognostic Number Concentration of Cloud Droplets in the Colorado State University Regional Atmospheric Modeling System (RAMS). Part I: Module Descriptions and Supercell Test Simulations, J. Appl. Meteorol., 43, 182–195, https://doi.org/10.1175/1520-0450(2004)043<0182:ALMAPN>2.0.CO;2, 2004. a, b
Saleeby, S. M. and van den Heever, S. C.: Developments in the CSU-RAMS Aerosol Model: Emissions, Nucleation, Regeneration, Deposition, and Radiation, J. Appl. Meteorol. Clim., 52, 2601–2622, https://doi.org/10.1175/JAMC-D-12-0312.1, 2013. a, b, c
Schröder, D., Vihma, T., Kerber, A., and Brümmer, B.: On the parameterization of turbulent surface fluxes over heterogeneous sea ice surfaces, J. Geophys. Res.-Oceans, 108, 3195, https://doi.org/10.1029/2002JC001385, 2003. a
Sedlar, J.: Implications of Limited Liquid Water Path on Static Mixing within Arctic Low-Level Clouds, J. Appl. Meteorol. Clim., 53, 2775–2789, https://doi.org/10.1175/JAMC-D-14-0065.1, 2014. a
Sedlar, J., Tjernström, M., Mauritsen, T., Shupe, M. D., Brooks, I. M., Persson, P. O. G., Birch, C. E., Leck, C., Sirevaag, A., and Nicolaus, M.: A Transitioning Arctic Surface Energy Budget: The Impacts of Solar Zenith Angle, Surface Albedo and Cloud Radiative Forcing, Clim. Dynam., 37, 1643–1660, https://doi.org/10.1007/s00382-010-0937-5, 2011. a
Shupe, M. D.: Clouds at Arctic Atmospheric Observatories. Part II: Thermodynamic Phase Characteristics, J. Appl. Meteorol. Clim., 50, 645–661, https://doi.org/10.1175/2010JAMC2468.1, 2011. a, b
Shupe, M. D. and Intrieri, J. M.: Cloud Radiative Forcing of the Arctic Surface: The Influence of Cloud Properties, Surface Albedo, and Solar Zenith Angle, J. Climate, 17, 616–628, https://doi.org/10.1175/1520-0442(2004)017<0616:CRFOTA>2.0.CO;2, 2004. a, b, c
Shupe, M. D., Matrosov, S. Y., and Uttal, T.: Arctic Mixed-Phase Cloud Properties Derived from Surface-Based Sensors at SHEBA, J. Atmos. Sci., 63, 697–711, https://doi.org/10.1175/JAS3659.1, 2006. a
Shupe, M. D., Walden, V. P., Eloranta, E., Uttal, T., Campbell, J. R., Starkweather, S. M., and Shiobara, M.: Clouds at Arctic Atmospheric Observatories. Part I: Occurrence and Macrophysical Properties, J. Appl. Meteorol. Clim., 50, 626–644, https://doi.org/10.1175/2010JAMC2467.1, 2011. a, b
Shupe, M. D., Rex, M., Blomquist, B., Persson, P. O. G., Schmale, J., Uttal, T., Althausen, D., Angot, H., Archer, S., Bariteau, L., Beck, I., Bilberry, J., Bucci, S., Buck, C., Boyer, M., Brasseur, Z., Brooks, I. M., Calmer, R., Cassano, J., Castro, V., Chu, D., Costa, D., Cox, C. J., Creamean, J., Crewell, S., Dahlke, S., Damm, E., de Boer, G., Deckelmann, H., Dethloff, K., Dütsch, M., Ebell, K., Ehrlich, A., Ellis, J., Engelmann, R., Fong, A. A., Frey, M. M., Gallagher, M. R., Ganzeveld, L., Gradinger, R., Graeser, J., Greenamyer, V., Griesche, H., Griffiths, S., Hamilton, J., Heinemann, G., Helmig, D., Herber, A., Heuzé, C., Hofer, J., Houchens, T., Howard, D., Inoue, J., Jacobi, H.-W., Jaiser, R., Jokinen, T., Jourdan, O., Jozef, G., King, W., Kirchgaessner, A., Klingebiel, M., Krassovski, M., Krumpen, T., Lampert, A., Landing, W., Laurila, T., Lawrence, D., Lonardi, M., Loose, B., Lüpkes, C., Maahn, M., Macke, A., Maslowski, W., Marsay, C., Maturilli, M., Mech, M., Morris, S., Moser, M., Nicolaus, M., Ortega, P., Osborn, J., Pätzold, F., Perovich, D. K., Petäjä, T., Pilz, C., Pirazzini, R., Posman, K., Powers, H., Pratt, K. A., Preußer, A., Quéléver, L., Radenz, M., Rabe, B., Rinke, A., Sachs, T., Schulz, A., Siebert, H., Silva, T., Solomon, A., Sommerfeld, A., Spreen, G., Stephens, M., Stohl, A., Svensson, G., Uin, J., Viegas, J., Voigt, C., von der Gathen, P., Wehner, B., Welker, J. M., Wendisch, M., Werner, M., Xie, Z., and Yue, F.: Overview of the MOSAiC expedition: Atmosphere, Elementa: Science of the Anthropocene, 10, 00060, https://doi.org/10.1525/elementa.2021.00060, 2022. a
Siegel, K., Neuberger, A., Karlsson, L., Zieger, P., Mattsson, F., Duplessis, P., Dada, L., Daellenbach, K., Schmale, J., Baccarini, A., Krejci, R., Svenningsson, B., Chang, R., Ekman, A. M. L., Riipinen, I., and Mohr, C.: Using Novel Molecular-Level Chemical Composition Observations of High Arctic Organic Aerosol for Predictions of Cloud Condensation Nuclei, Environ. Sci. Technol., 56, 13888–13899, https://doi.org/10.1021/acs.est.2c02162, 2022. a, b, c
Silber, I., Fridlind, A. M., Verlinde, J., Russell, L. M., and Ackerman, A. S.: Nonturbulent Liquid-Bearing Polar Clouds: Observed Frequency of Occurrence and Simulated Sensitivity to Gravity Waves, Geophys. Res. Lett., 47, e2020GL087099, https://doi.org/10.1029/2020GL087099, 2020. a
Sotiropoulou, G., Sedlar, J., Forbes, R., and Tjernstrom, M.: Summer Arctic Clouds in the ECMWF Forecast Model: An Evaluation of Cloud Parametrization Schemes, Q. J. Roy. Meteor. Soc., 142, 387–400, https://doi.org/10.1002/qj.2658, 2016. a
Stephens, G. L., Gabriel, P. M., and Partain, P. T.: Parameterization of Atmospheric Radiative Transfer. Part I: Validity of Simple Models, J. Atmos. Sci., 58, 3391–3409, https://doi.org/10.1175/1520-0469(2001)058<3391:POARTP>2.0.CO;2, 2001. a
Sterzinger, L. and Igel, A.: Plotting Scripts for Sterzinger and Igel (2023), Zenodo [code], https://doi.org/10.5281/zenodo.7996595, 2023a. a
Sterzinger, L. and Igel, A. L.: Model data for Sterzinger and Igel (2023) “Simulated Idealized Arctic Cloud Sensitivity to Above Cloud CCN Concentrations”, Zenodo [data set], https://doi.org/10.5281/zenodo.7986917, 2023b. a
Sterzinger, L., Igel, A., and RAMS-Developers: Model source code and namelists for Sterzinger and Igel (2023), Zenodo [code], https://doi.org/10.5281/zenodo.7991354, 2023. a
Sterzinger, L. J., Sedlar, J., Guy, H., Neely III, R. R., and Igel, A. L.: Do Arctic mixed-phase clouds sometimes dissipate due to insufficient aerosol? Evidence from comparisons between observations and idealized simulations, Atmos. Chem. Phys., 22, 8973–8988, https://doi.org/10.5194/acp-22-8973-2022, 2022. a, b
Stevens, R. G., Loewe, K., Dearden, C., Dimitrelos, A., Possner, A., Eirund, G. K., Raatikainen, T., Hill, A. A., Shipway, B. J., Wilkinson, J., Romakkaniemi, S., Tonttila, J., Laaksonen, A., Korhonen, H., Connolly, P., Lohmann, U., Hoose, C., Ekman, A. M. L., Carslaw, K. S., and Field, P. R.: A model intercomparison of CCN-limited tenuous clouds in the high Arctic, Atmos. Chem. Phys., 18, 11041–11071, https://doi.org/10.5194/acp-18-11041-2018, 2018. a
Verlinde, J., Harrington, J. Y., McFarquhar, G. M., Yannuzzi, V. T., Avramov, A., Greenberg, S., Johnson, N., Zhang, G., Poellot, M. R., Mather, J. H., Turner, D. D., Eloranta, E. W., Zak, B. D., Prenni, A. J., Daniel, J. S., Kok, G. L., Tobin, D. C., Holz, R., Sassen, K., Spangenberg, D., Minnis, P., Tooman, T. P., Ivey, M. D., Richardson, S. J., Bahrmann, C. P., Shupe, M., DeMott, P. J., Heymsfield, A. J., and Schofield, R.: The Mixed-Phase Arctic Cloud Experiment, B. Am. Meteorol. Soc., 88, 205–222, https://doi.org/10.1175/BAMS-88-2-205, 2007. a
Willis, M. D., Burkart, J., Thomas, J. L., Köllner, F., Schneider, J., Bozem, H., Hoor, P. M., Aliabadi, A. A., Schulz, H., Herber, A. B., Leaitch, W. R., and Abbatt, J. P. D.: Growth of nucleation mode particles in the summertime Arctic: a case study, Atmos. Chem. Phys., 16, 7663–7679, https://doi.org/10.5194/acp-16-7663-2016, 2016. a
Wood, R.: Drizzle in Stratiform Boundary Layer Clouds. Part II: Microphysical Aspects, J. Atmos. Sci., 62, 3034–3050, https://doi.org/10.1175/JAS3530.1, 2005. a
Wyant, M. C., Bretherton, C. S., Wood, R., Blossey, P. N., and McCoy, I. L.: High Free-Tropospheric Aitken-Mode Aerosol Concentrations Buffer Cloud Droplet Concentrations in Large-Eddy Simulations of Precipitating Stratocumulus, J. Adv. Model. Earth Sy., 14, e2021MS002930, https://doi.org/10.1029/2021MS002930, 2022. a
Wylie, D. P. and Hudson, J. G.: Effects of Long-Range Transport and Clouds on Cloud Condensation Nuclei in the Springtime Arctic, J. Geophys. Res.-Atmos., 107, AAC 13-1–AAC 13-11, https://doi.org/10.1029/2001JD000759, 2002. a