the Creative Commons Attribution 4.0 License.
the Creative Commons Attribution 4.0 License.
 | 19 Mar 2024
Measurement report: Evaluation of the TOF-ACSM-CV for PM1.0 and PM2.5 measurements during the RITA-2021 field campaign
Xinya Liu
Bas Henzing
Arjan Hensen
Jan Mulder
Danielle van Dinther
Jerry van Bronckhorst
Rujin Huang
Ulrike Dusek
The recently developed time-of-flight aerosol chemical speciation monitor with a capture vaporizer and a PM2.5 aerodynamic lens (TOF-ACSM-CV-PM2.5) aims to improve the collection efficiency and chemical characterization of aerosol particles with a diameter smaller than 2.5 µm. In this study, comprehensive cross-comparisons were performed between real-time online measurements and offline filter analysis with 24 h collection time. The goal was to evaluate the capabilities of the TOF-ACSM-CV-PM2.5 lens, as well as the accuracy of the TOF-ACSM-CV-PM2.5. The experiments were conducted at Cabauw Experimental Site for Atmospheric Research (CESAR) during the RITA-2021 campaign. The non-refractory fine particulate matter (PM1.0 and PM2.5) was measured by two collocated TOF-ACSM-CV-PM2.5 instruments by placing them behind a PM2.5 and PM1.0 inlet, respectively. A comparison between the ACSMs and PM2.5 and PM1.0 filter samples showed a much better accuracy than ±30 % less given in the previous reports, with average differences less than ±10 % for all inorganic chemical species. In addition, the ACSMs were compared to the Monitoring Instrument for Aerosol and Gas (MARGA) (slope between 0.78 and 0.97 for inorganic compounds, R2≥ 0.93) and a mobility particle size spectrometer (MPSS), measuring the particle size distribution from around 10 to 800 nm (slope was around 1.00, R2= 0.91). The intercomparison of the online measurements and the comparison between the online and offline measurements indicated a low bias (< 10 % for inorganic compounds) and demonstrated the high accuracy and stability of the TOF-ACSM-CV-PM2.5 lens for the atmospheric observations of particle matter. The two ACSMs exhibited an excellent agreement, with differences less than 7 %, which allowed a quantitative estimate of PM1.0 vs. PM2.5 chemical composition. The result showed that the PM1.0 accounted for about 70 %–80 % of the PM2.5 on average. The NO3 mass fraction increased, but the organic carbon (OC) mass fraction decreased from PM1.0 to PM2.5, indicating the size dependence on chemical composition.
- Article
(2414 KB) - Full-text XML
-
Supplement
(955 KB) - BibTeX
- EndNote


Aerosols play an important role in climate change and have been intensely studied for their effects on the global radiation balance. Direct effects include absorption and scattering of solar radiation, and indirect effects refer to changes of cloud properties by aerosols acting as cloud condensation nuclei (Intergovernmental Panel on Climate Change, 2014; Fan et al., 2016). Furthermore, air pollution is considered the biggest environmental health threat in Europe (European Environment Agency, 2022), causing considerable morbidity and mortality (Gurjar et al., 2010; Ostro et al., 2015; Southerland et al., 2022). Approximately 7.0 million premature deaths each year are caused by long-term air pollution exposure worldwide (WHO, 2021). In particular, fine aerosol particles with diameters below 2.5 µm are able to penetrate deep into the lungs, possibly causing more than 3.5 million premature deaths each year (Lelieveld et al., 2015). In the Netherlands, particulate matter is usually dominated by secondary inorganic aerosols (SIAs) due to emissions from intensive agriculture and traffic emissions, which has been become a serious problem to the local governments and globally (Brunekreef et al., 2009; Janssen et al., 2013; Gu et al., 2021).
Long-term monitoring of chemical composition and concentration is obviously important for controlling these emissions and improve the air quality. A lot of the measurement techniques and platforms have been developed and studied over decades with the aim of long-term measurements of aerosols. The aerosol chemical species monitor (ACSM) has been developed for monitoring aerosol chemical composition, based on the aerosol mass spectrometer (AMS) (Ng et al., 2011). Compared to the AMS, the ACSM is portable, economical, and relatively easy to operate.
ACSMs have been widely applied since 2011 and are continuously being improved (Wang et al., 2019). The initial design of the ACSM, which has been used in most reported papers to date, was equipped with an aerodynamic lens, a standard hot vaporizer, and a lower-cost residual gas analyzer (RGA) quadrupole mass spectrometer (Q-ACSM) detector (Wang et al., 2019). Then, the time-of-flight ACSM (TOF-ACSM) was developed (Fröhlich et al., 2013), which has a faster response time and a higher sensitivity and has been used increasingly in recent years. The recent equipment of the ACSM with a capture vaporizer (Jayne and Worsnop, 2016) and a PM2.5 lens (Xu et al., 2017) has opened up avenues for quantitative study of the chemical composition of PM2.5. One potential application is monitoring the chemical differences between PM1.0 and PM2.5, which have been studied intensively for air quality monitoring. However, most previous studies comparing PM1.0 and PM2.5 have some limitations: most often, the comparisons were based on offline filter samples, which lack high temporal resolution (Sarti et al., 2015; Zhang et al., 2018; Giugliano et al., 2005; Vecchi et al., 2004; Perrone et al., 2013). For online approaches, the measurements usually switched between PM1.0 and PM2.5 by changing the size cutoff of the sampler inlet, making the comparison not exactly synchronous (Zheng et al., 2020; Sun et al., 2020), or observations of PM1.0 and PM2.5 were based on different instruments; thus observed differences might result from different measurement approaches (Rodríguez et al., 2008; Budisulistiorini et al., 2014). However, to use the ACSM for such intercomparing studies requires higher accuracy than the ±30 % cited by the manufacturer, based on the standard setup with the PM1.0 lens. In this study we want to investigate if the introduction of the capture vaporizer (CV) and the PM2.5 lens sufficiently improved the accuracy and precision of the TOF-ACSM for quantitative PM2.5 monitoring.
In the ACSM instrument, particles are converged into a narrow beam in the aerodynamic lens and then collide with the vaporizer. The generated vapor is detected with a time-of-flight or quadrupole mass spectrometer after ionization (Ng et al., 2011). The ACSM equipped with the standard vaporizer (SV) has been most frequently used to date and has been evaluated in several previous studies (Zhang et al., 2017; Pieber et al., 2016; Xu et al., 2017; Canagaratna et al., 2015). The SV has an inverted cone structure with a porous tungsten surface, which causes particle bounce and therefore reduced collection efficiency. To reduce the particle bounce associated with the SV, the capture vaporizer (CV) was introduced in 2016 (Jayne and Worsnop, 2016). The CV is made of solid molybdenum and constructed with a narrow entry “cage” and an internal structure that facilitates repeated internal bounces. This increases the residence time of the particles in contact with the thermal evaporator surfaces and therefore reduces the proportion of particles that bounce without evaporating (Hu et al., 2017). It has been reported the CV can achieve a collection efficiency (CE) of 1 for ambient aerosols (Hu et al., 2017), whereas the CE of the SV is only typically ∼ 0.5 for ambient aerosols and even lower for laboratory aerosols (Matthew et al., 2008; Robinson et al., 2017; Liao et al., 2017; Middlebrook et al., 2012).
Further, the ACSM initially measured particles with aerodynamic diameters below 1.0 µm, due to the low transmission efficiency of the aerodynamic lens for the larger particles (Xu et al., 2017). The high-pressure aerodynamic lens (HPL) was developed and used for the transmission of larger particles. However, the HPL requires very high precision in the machining, which makes it difficult to reproduce consistently during manufacture (Williams et al., 2013; Xu et al., 2017). To overcome these limitations, Peck et al. (2016) built a new intermediate pressure lens (IPL) (3.8 Torr), and it clearly improved the transmission efficiency of particles from 1 to 2.5 µm (Xu et al., 2017; Peck et al., 2016). For a typical ambient PM2.5 size distribution, the PM2.5 aerodynamic lens system on a Q-AMS detected a higher percentage of non-refractory mass compared to the old PM1.0 aerodynamic lens system. Specifically, the new system detected 89 % of the non-refractory mass, while the old system only detected 65 % (Xu et al., 2017). A few articles reported the application of this new PM2.5 inlet system (Zhang et al., 2017), but a comprehensive assessment is still missing.
In this study, two identically configured and collocated TOF-ACSM-CV instruments, both with a PM2.5 aerodynamic lens, were deployed to measure the NR-PM1.0 and NR-PM2.5 during the Ruisdael Land-Atmosphere Interactions Intensive Trace-gas and Aerosol measurement campaign (RITA-2021) at the Cabauw Experimental Site for Atmospheric Research (CESAR) site in the Netherlands. Other online instruments such as the Monitoring Instrument for Aerosol and Gas (MARGA) and a multi-angle absorption photometer (MAAP), as well as a mobility particle size spectrometer (MPSS), were applied for auxiliary measurements. Offline filters were collected and analyzed to evaluate the TOF-ACSM-CV-PM2.5 lens. Cross-comparisons between online and online and between online and offline were conducted to investigate the capacity of TOF-ACSM-CV-PM2.5 in long-term field measurements and to give insights into the local chemical composition of the NR-PM1.0 and NR-PM2.5.
2.1 Site and campaign description
A series of comprehensive aerosol in situ measurements were performed during the 2021 RITA campaign at the CESAR site in the Netherlands (51.97° N, 4.93° E). The Cabauw Experimental Site for Atmospheric Research (CESAR) is part of the ACTRIS1 (Aerosol, Clouds and Trace Gases Infra-Structure) and ICOS2 (Integrated Carbon Observation System) and is one of the core observation sites for the Ruisdael Observatory3 in European and global climate networks (Knoop et al., 2021). The site is located between the northeast of Rotterdam and the southwest of Utrecht, and the air masses are mostly influenced by the continental and marine environments depending on the wind direction. Previous studies showed that clean air masses are often received from the North Sea or Scandinavia. In contrast, polluted air masses generally originate from southern Europe (Mamali et al., 2018). Continuous observations of aerosol physiochemical properties were conducted during the RITA-2021 campaign from 11 to 24 May and from 16 September to 12 October 2021; additional measurements such as meteorological data from the 213 m high mast of Cabauw tower at 10 min time resolution were available via the KNMI Data Platform4.
2.2 Aerosol physical properties
Ground-based observations of aerosol physical properties were performed in the Cabauw main building using an inlet that samples air from 4.5 m above the ground through the roof. Every inlet consisted of three parts: (a) a PM10 size selector, (b) a wide-diameter Nafion drying system to dry the ambient aerosol to below 40 % RH, and (c) a manifold to split the aerosol flow to the multiple instruments. The inlet systems were vertically oriented to avoid deposition losses. To minimize the electrostatic losses all tubing was stainless steel. The measurements used in this study included the following: (1) a multi-angle absorption photometer (MAAP; model 5012, Thermo Fisher Scientific Inc, Franklin, MA) measuring at a single nominal wavelength of 637 nm with a 5 min time resolution to quantify the aerosol absorption coefficient (Petzold and Schönlinner, 2004). The mass concentration of equivalent black carbon (eBC) was calculated based on the optical absorbance at two different angles using a constant mass absorption cross section (MAC) value (6.6 m2 g−1). (2) A mobility particle size spectrometer (MPSS; TROPOS), consisting of a bipolar particle charger (KR-85), a differential mobility analyzer (DMA; model Vienna-DMA medium), and a condensation particle counter (CPC; 3750 TSI), was also used. Particle number size distributions in the diameter range between approximately 8 and 800 nm were recorded with a time resolution of 5 min. The inversion of the raw data was performed by a custom evaluation software (DMPS-Inversion-2.13.exe), described in Wiedensohler et al. (2012).
2.3 Aerosol chemical composition measurement
2.3.1 Online measurements by TOF-ACSM and MARGA
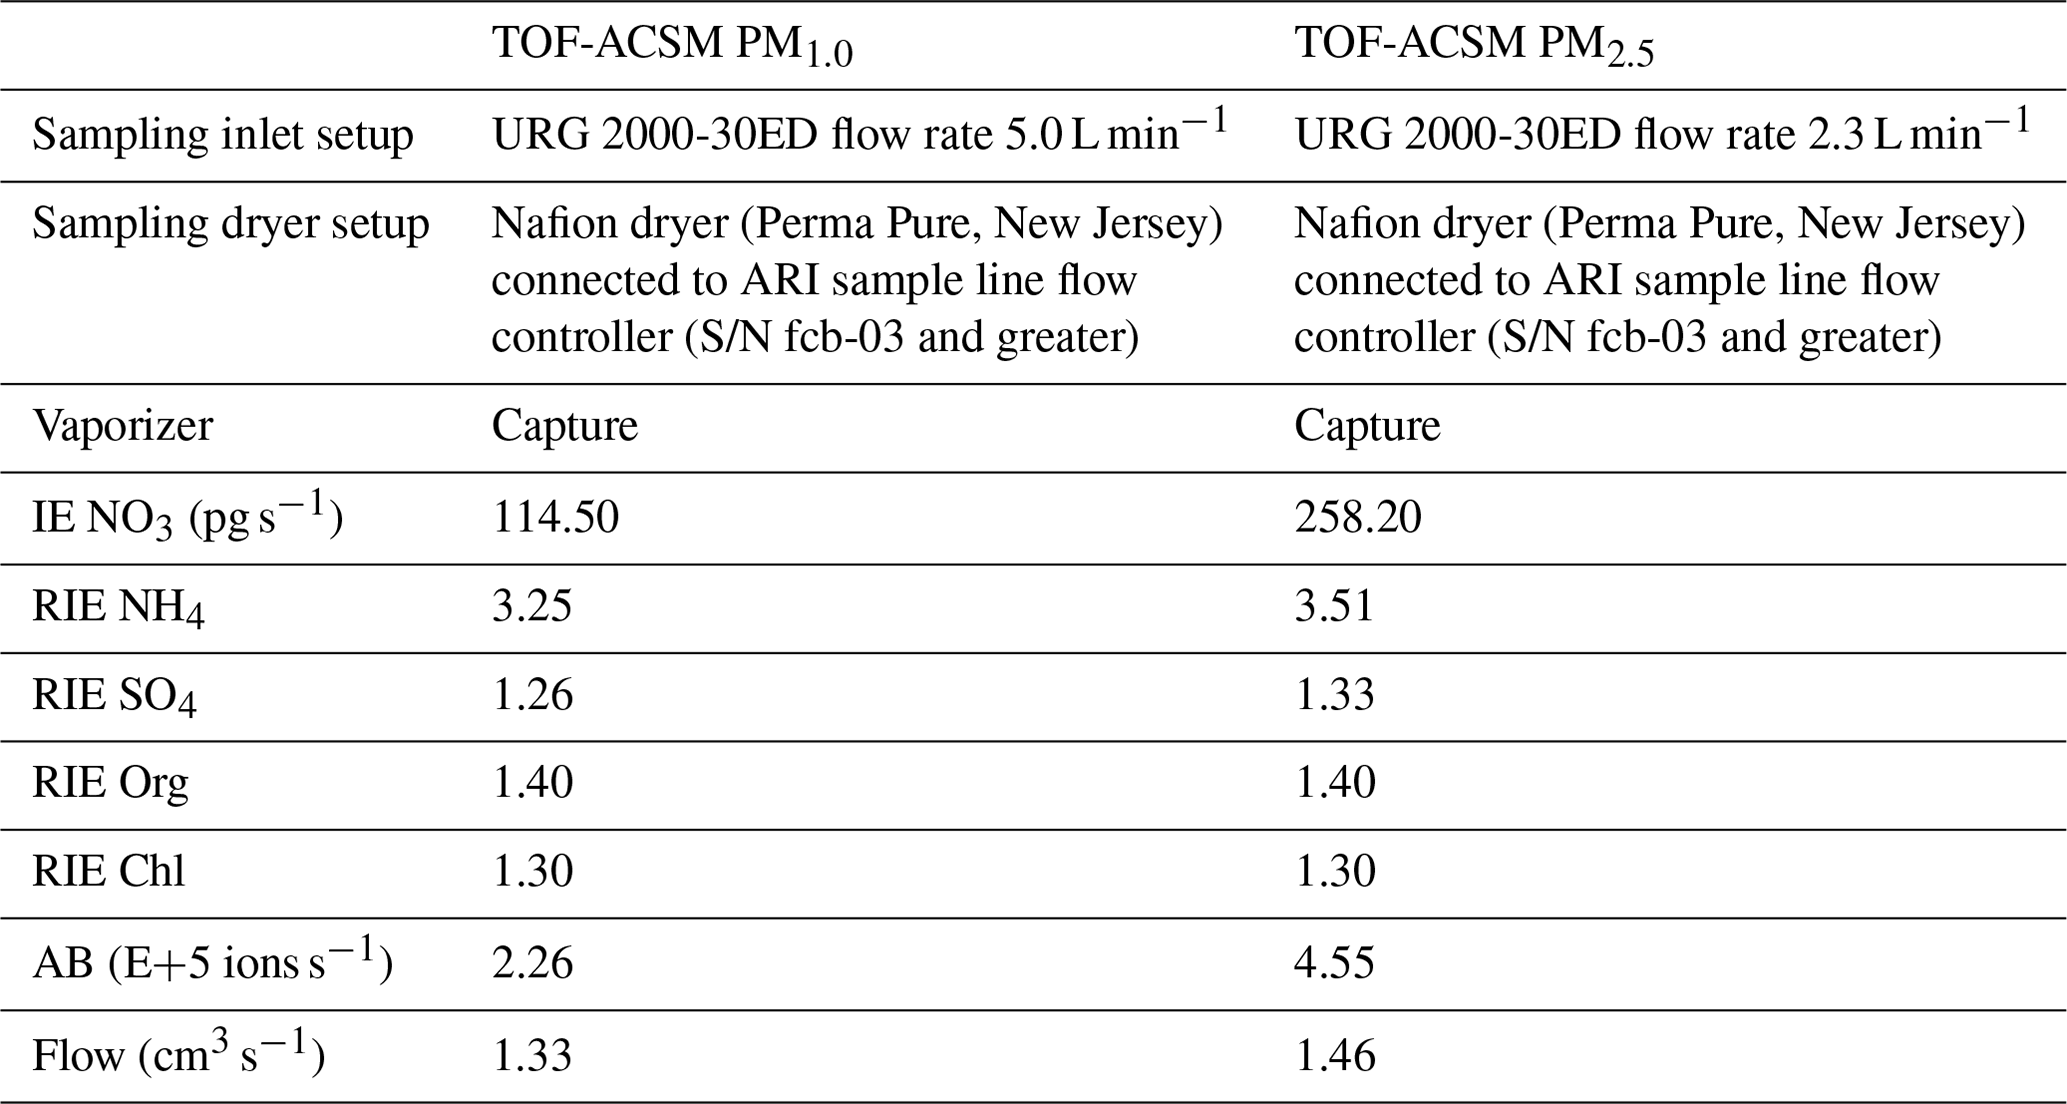
The non-refractory (NR) chemical compositions of PM1.0 and PM2.5 were measured continuously during the RITA-2021 campaign with a time resolution of 5 min, including ammonium (NH), nitrate (NO), sulfate (SO), chloride (Cl−), and organics (organic aerosol, OA), using two TOF-ACSMs (Aerodyne Research Inc., Billerica, MA) (Fröhlich et al., 2013), both equipped with a CV and PM2.5 aerodynamic lens (Xu et al., 2017). The two TOF-ACSMs were installed side by side in a trailer, which was around 200 m away from the above-mentioned main measurement site. Teflon-coated aluminum cyclones (URG 2000-30ED) were installed at the head of the inlet with a downward entry direction to avoid external effects such as rain. Flow rates of 2.3 and 5.0 L min−1 were applied to select PM2.5 and PM1.0, respectively. Then, a multi-tube Nafion dryer (Perma Pure, New Jersey) was used to dry the particles. It should be emphasized that the size selection occurred at ambient conditions; thus the upper limit of the dry particle size depends on humidity. The working principle of the TOF-ACSM is based on the Aerodyne aerosol mass spectrometer (AMS) and can be briefly described as follows: the particles are focused and drawn into the instrument through an aerodynamic lens, and then the non-refractory constituents are evaporated rapidly by the capture vaporizer (T=600 °C) and subsequently ionized by electron impact. The ions are identified by their mass-to-charge ratio in the time-of-flight mass spectrometer. In the end, the electrical signal is converted to a digital signal by the signal detector and recorded (Fröhlich et al., 2013). Several calibrations need to be performed regularly to ensure the accuracy of the instruments, including the lens calibration, flow rate calibration, and tuning of the heater bias (HB) voltage, as well as the ionization efficiency (IE) and the relative ionization efficiency (RIE) calibrations. The standard procedure of the calibration details can be found in previous publications (Fröhlich et al., 2013; Canagaratna et al., 2007). The IE calibration and RIE calibration were performed before the RITA campaign, and the parameters used in this paper are summarized in Table 1. The data analysis was produced by Tofware (v3.2.4, Tofwerk AG, Thun, Switzerland) based on Igor Pro 8.
Table 1The setup details for two of the TOF-ACSMs and the corresponding IE and RIE calibration values for each species used in this study.
The Monitor for AeRosols and Gases in ambient Air (MARGA 2060, Metrohm Applikon B.V., the Netherlands) was used during the September part of the campaign to measure the water-soluble inorganic components based on ion chromatography (IC), including hydrochloric acid (HCl), nitric acid (HNO3), nitrous acid (HONO), sulfur dioxide (SO2), and ammonia (NH3) in the gas phase and chloride (Cl−), nitrate (NO), sulfate (SO), ammonium (NH), potassium (K+), calcium (Ca2+), and magnesium (Mg2+) in the aerosol phase. A “MARGA sizer” introduced by ten Brink (2007, 2009) was used to control the size of the particles (e.g., PM1.0, PM2.5, or PM10) entering the instrument. We applied the PM1.0 sizer in the first stage (from 5 to 30 September 2021) and PM2.5 sizer in the later stage (from 3 to 16 October 2021) of the campaign. The ambient air was drawn into the instrument at a constant flow rate of 16.7 L min−1 through a short (0.2 m) length of Teflon tubing with an outer diameter of 25.4 mm, via a vacuum pump. Then, the water-soluble gases were absorbed by a wet rotating denuder (WRD) device (Wyers et al., 1993; Keuken et al., 1988), and the water-soluble aerosols were extracted in a steam-jet aerosol collector (SJAC) (Khlystov et al., 1995; Slanina et al., 2001). Eventually, the liquid of the samples was collected continuously in separate syringes and then analyzed by IC at 1 h resolution. Rumsey and Walker (2016) and Rumsey et al. (2014) provided the operational, calibration, and data analysis procedures in detail.
2.3.2 Offline filter measurements and analysis
From midnight to midnight, 24 h PM1.0 and PM2.5 filters were collected simultaneously, according to the reference method described in the European Standards (EN12341: 1998 and EN14907: 2005). The SEQ47/50 (Leckel GmbH, Germany) instrument with a sequential low-volume system (LVS) of 2.3 m3 h−1 was used for the sampling. Two polytetrafluoroethylene (PTFE) filters (diameter 47 mm, pore size 3 µm, Millipore) and two quartz fiber filters (diameter 47 mm, Pallflex) were placed in the samplers for a paired measurement of PM1.0 and PM2.5. The quartz filters were pre-baked at 550 °C over 6 h before use. All filter samples were collected and stored at °C and cooled by ice packs during transportation. The gravimetric mass of the PTFE filters was obtained by triple weighing before and after sampling. The weighing was performed under a condition of a temperature of 20.0±0.5 °C and relative humidity of 50±2 %. Detailed information about the logistic and operational (QA QC, weighing) procedures, as well as the data acquisition was described in Schaap et al. (2010).
The PM1.0 and PM2.5 quartz fiber filters were used to perform the ion analysis by ion chromatography, including the three inorganic anions (NO, Cl−, SO) and the five cations (Na+, K+, Mg2+, Ca2+, NH). Aliquots of the filter samples (cations: 3.28 cm2; anions: 3.0 cm2) were extracted by the 2.0 mL of the 30 mM methane sulfonic acid (MSA; cations) or 2.0 mL of extra pure water (anions) for 40 min under ultrasonic agitation. The determination of the concentrations was performed by the ICS-1100 and AQUION instruments (both Thermo Scientific) combined with an autosampler AS-DV and ion exchange columns (cations – CS16, anions – AS22). The description of the equipment used can be found in Samek et al. (2020). The organic carbon (OC) and elemental carbon (EC) were analyzed by a Sunset thermal–optical analyzer (TOA; Sunset Laboratory Inc.) on the quartz fiber filters. The EUSAAR2 protocol (Cavalli et al., 2010) was applied to distinguish the OC and EC. The details of the operation procedure can be found in Yao et al. (2022).
3.1 Intercomparison results
The comparison between online chemical composition measurements (TOF − ACSM + MAAP) and filter measurements for daily average concentration of each species is presented in Sect. 3.1.1. In addition, the volume concentrations derived from chemical composition measurements and the particle number size distribution (PNSD) are compared in Sect. 3.1.2 with hourly time resolution. Total online NR-PM1.0 and NR-PM2.5 mass concentrations were calculated by adding the eBC to the total TOF-ACSM mass concentration (the sum of nitrate, sulfate, ammonium, organic, and chloride mass concentrations). The total mass concentrations of PM1.0 and PM2.5 filters are also calculated by the sum of the concentrations of inorganic anions (NO3, Cl, SO4, NH4), OC, and EC.
3.1.1 Comparison of online and offline measurements for PM1.0 and PM2.5
Figure 1 shows the comparison of each component between the online and offline measurements for PM1.0 (green dots) and PM2.5 (orange triangles), including a linear least-squares regression line. The uncertainties of the slope correspond to the standard error. The daily fluctuations in the online measurements are shown in Fig. S7 in the Supplement. We illustrate this by presenting the standard deviation of the daily measurements, which are taken at 10 min intervals. These variations are marked as error bars for each individual day. Over the intensive measurement period, the daily average NO3 mass concentrations measured by the TOF-ACSM-CV and by filters showed a high correlation with R2= 0.98 for PM1.0 and R2= 0.97 for PM2.5, and the corresponding slopes are 0.94 ± 0.09 and 0.88 ± 0.10, respectively. The results showed that NO3 concentrations on the filters were slightly higher than TOF-ACSM-CV measurements. Paired t tests were performed to investigate the significance of the difference between the online and offline measurements, and the results are shown in Table S1 and S2 in the Supplement. It shows a significant difference between the ACSM-measured NO3 and filter-measured NO3 (p values are for PM1.0 and for PM2.5). Since the filter concentrations were higher, the difference cannot be explained by the evaporation of ammonium nitrate collected on the filter, which is a well-known sampling artifact (Malaguti et al., 2015; Kuokka et al., 2007; Chow et al., 2008; Pakkanen and Hillamo, 2002). Previous studies have shown that the loss grows with an increase in temperature and a decrease in humidity and that it can exceed 80 % up to complete evaporation when the temperature exceeds 25 °C (Schaap et al., 2004; Allan et al., 2003; Pandolfi et al., 2014). During the measurement in this study, the RH was 81.16 ± 14.17 %, and temperature was 15.94 ± 4.20 °C, which should largely prevent this evaporation loss. Consequently, we observe slightly higher concentrations on the filter samples. Likely reasons for this difference are that (i) the higher offline concentration of nitrate may be caused by the absorption of gas-phase nitric acid (HNO3) on the filter (Chow, 1995). Bhowmik et al. (2022) also observed higher nitrate concentrations on filter samples with an even lower slope of 0.49 between the online AMS and offline filter NO3 measurements. (ii) For ACSM measurements, the absolute concentration of the nitrate is highly dependent on the IE calibration, which needs to be performed carefully and regularly. The calibration parameters used in this study are listed in Table 1. If they are slightly biased, the ACSM concentration could be too low. However, the differences in filter and ACSM NO3 are in general less than 10 %, which are much better than the previous ±30 % accuracy given in the manufactory for the ACSM with a SV and PM1.0 lens.
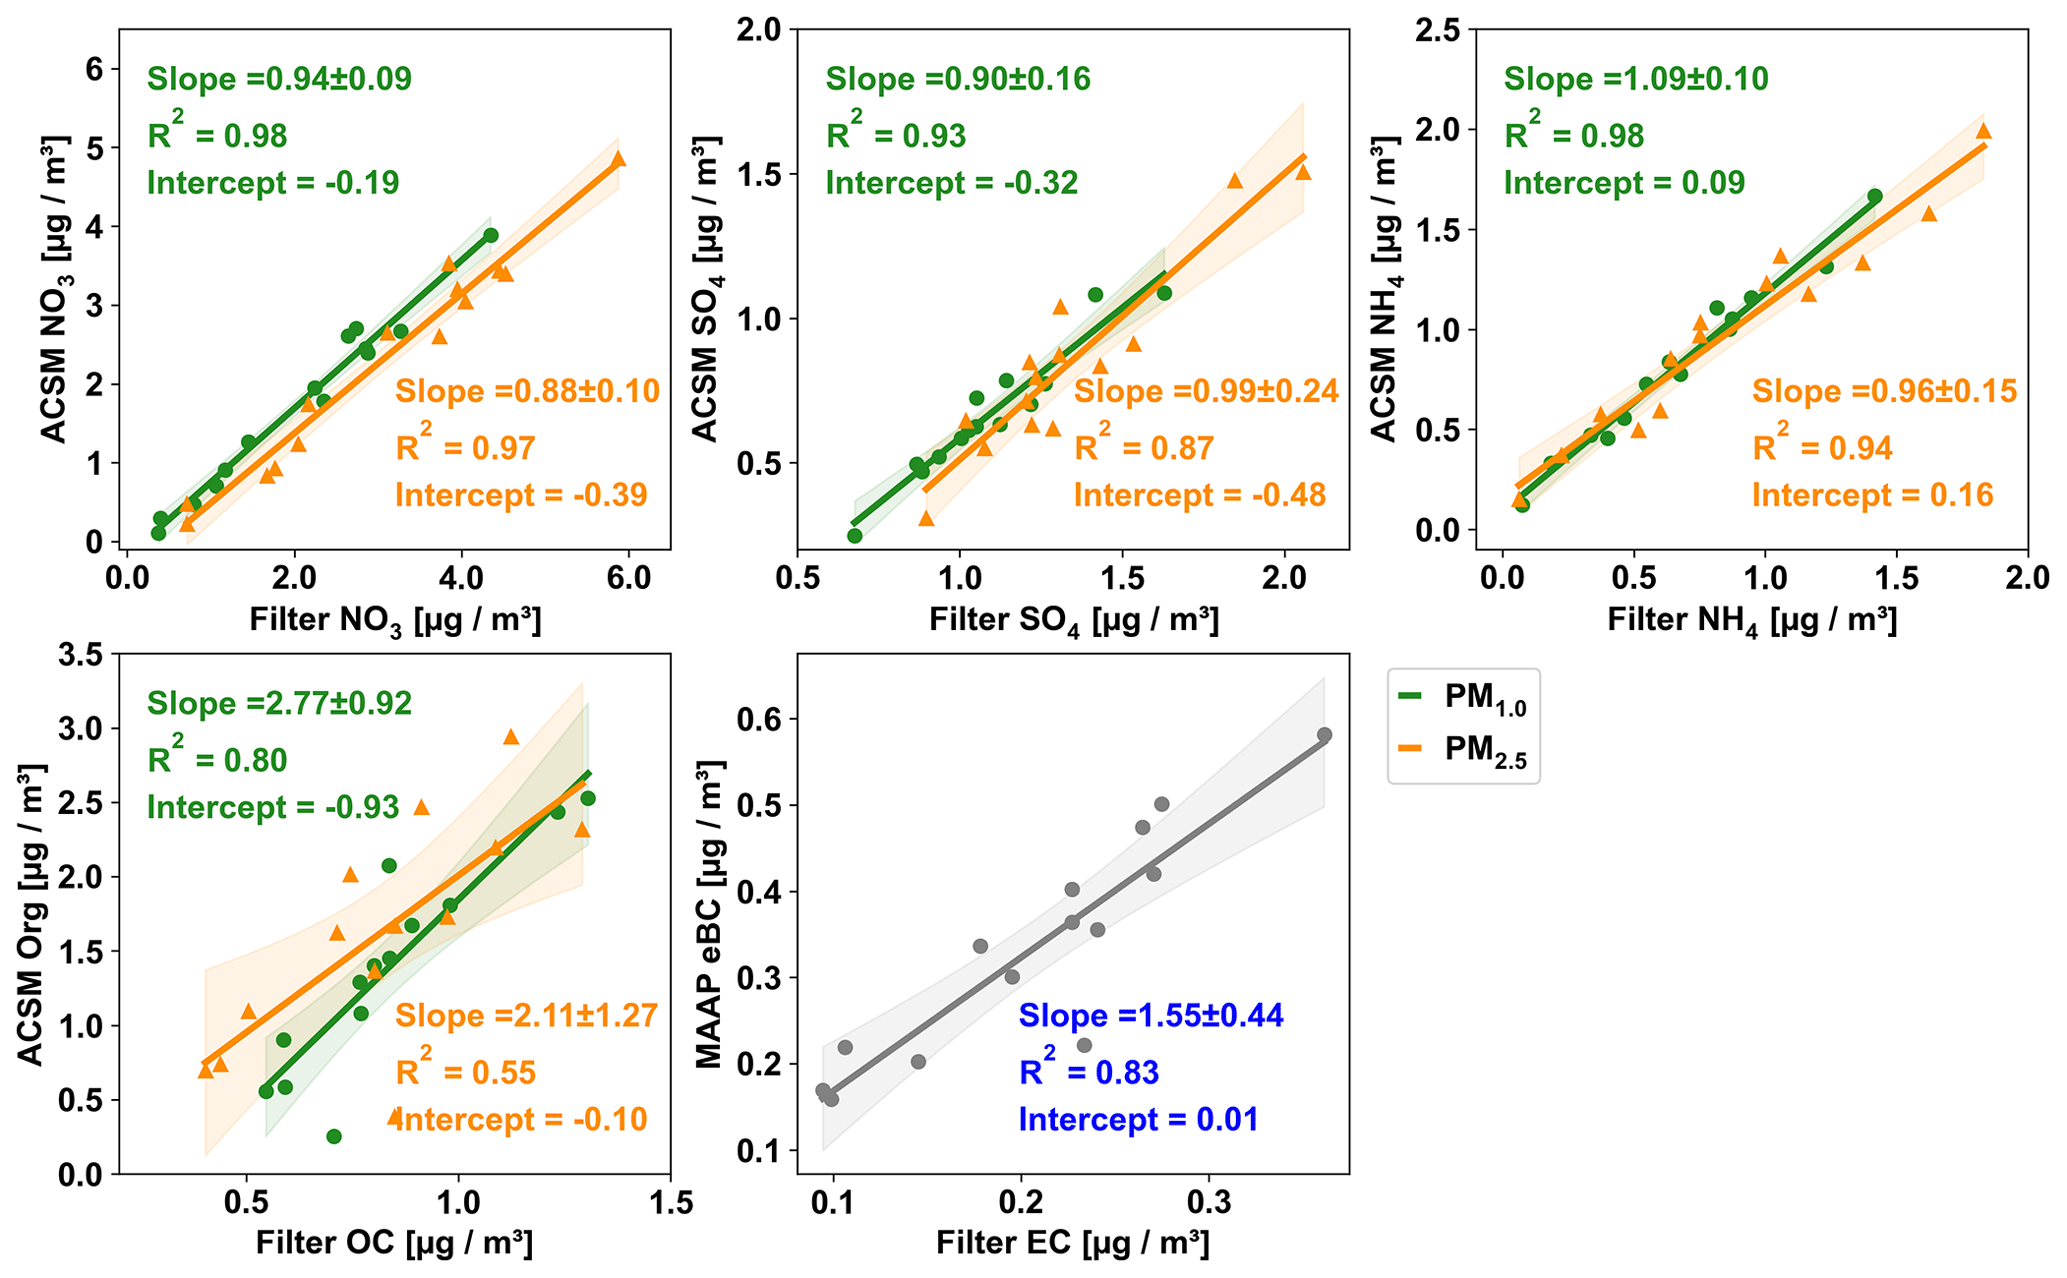
Figure 1The linear regression fitting correlations between the online (ACSM and MAAP) and offline (filters) daily average mass concentrations of various chemical components. PM1.0 is indicated in green and PM2.5 in orange. The shaded area represents the 95 % confidential interval of the best fit line.
For sulfate, the online and offline measurements also showed a high correlation, though it was lower than for ammonium nitrate. The slope and coefficient of determination are 0.90 ± 0.16 and R2 is 0.93 for sulfate PM1.0, and the slope is nearly 1 (0.99 ± 0.24) and the R2 is 0.87 for sulfate PM2.5. The relatively lower R2 is potentially due to the low sulfate mass concentration (0.67 and 0.84 µg cm−3 on average for PM1.0 and PM2.5) during the measurements. Similar to nitrate, the ACSM sulfate measurements are influenced by the IE and RIE calibrations. Apart from that, higher offline values of the sulfate may also be caused by some refractory sulfates such as potassium sulfate, calcium sulfate, and sodium sulfate, which cannot be detected by TOF-ACSM (Poulain et al., 2020). Or it can also be due to the positive sampling artifacts, for example, the absorption of SO2 by alkaline particles in the filter membrane or by the reaction of gas-phase ammonia with sulfate aerosols to form ammonium sulfate or ammonium bisulfate (Nicolás et al., 2009; Nie et al., 2010). This is less likely to occur in the Netherlands as sulfate is usually completely neutralized by excess ammonia already in the ambient atmosphere.
For ammonium, the coefficients of determination were R2= 0.98 in PM1.0 and R2= 0.94 in PM2.5 with slopes of 1.09 ± 0.10 and 0.96 ± 0.15, respectively. As the ammonium measured by the ACSM mainly corresponds to ammonium nitrate and ammonium sulfate, the small deviation of the online and offline data is reasonable. However, it is worth noting that the ammonia concentrations in Europe as a whole are usually sufficient to neutralize nitric and sulfuric acid (Wichink Kruit et al., 2017). In particular, an excess of ammonium (ammonium concentrations higher than those explained by the formation of inorganic ammonium salts) has been observed a lot in the Netherlands in past reports (Schlag et al., 2017). Tables S4 and S5 show the molar mass concentration of cation (NH4) and anions (NO3 and SO4) from the filter samples and ACSM measurements. Anions are observed to be 7 % higher than cation in PM1.0 filter samples, indicating a light underestimation of NH4 in filter PM1.0. But on the whole, the average differences between the ACSM and filter samples are less than ±10 % for all inorganic chemical species, showing a good accuracy of the ACSM with the CV and PM2.5 lens in the field measurements.
Regarding the measurement of the organic aerosol (OA) fraction, the ACSM measures OA, under the assumption that all mass, which cannot be explained by known inorganic components, must be organic (Allan et al., 2004). Thus, the quantification of the OA concentration is determined by how to interpret and assign fragmentation signals. On the other hand, the offline measurement of the organics is normally done by thermal–optical analysis, which usually only detects the carbon element of the organic compounds and is therefore referred to as organic carbon (OC). OC concentrations usually depend on the calculation methods and measuring protocols (Cavalli et al., 2010; Chiappini et al., 2014; Zanatta et al., 2016). As a result of the different quantification, the correlation between organic matter (OM) and OC is much lower than for inorganic compounds (R2= 0.55 in PM1.0 and R2= 0.80 in PM2.5). Because OM also includes associated hydrogen, oxygen, and other elements, OM is significantly higher than OC, indicated by a slope of from 2.77 ± 0.92 for PM1.0 and 2.11 ± 1.27 for PM2.5. On average the OM OC ratios were 1.58 ± 0.54 for PM1.0 and 1.97 ± 0.59 for PM2.5 in this study, which are common ratios of OM OC observed in the organic aerosol. The lower ratio for PM1.0 indicates more hydrocarbon-like aerosol at smaller particles and the higher ratio for PM2.5 more oxidized aerosol in larger particles. Several effects could lead to inaccurate OM OC ratios and lower correlation coefficients in the data. Volatile and semi-volatile organic compounds (VOCs and SVOCs) cause positive and negative artifacts in the estimation of OC (Cheng et al., 2019; Turpin et al., 1994; Cheng et al., 2011). The positive artifact results from the adsorption of VOCs and SVOCs on quartz filters, leading to an overestimation of OC mass and thus underestimated OM OC ratios. Based on previous measurements at the same location, we estimate the upper limit of the positive artifact in this study on the order of 20 %–30 % (Dusek, unpublished data). Sometimes studies found higher artifacts up to a factor of 2, but this would lead to unrealistically high OM OC ratios in our case. Negative artifacts arise from the evaporation of SVOCs collected on the filter during sampling and potentially during storage. In order to mitigate the latter artifact, we conducted the OC–EC analysis promptly after the campaign and stored the filters in the freezer. Regarding the ACSM data, a critical factor is called the “Pieber effect”, which observed that the inorganic salts can thermally decompose and release carbonaceous material already present in the instrument, leading to the formation of CO ( 44) ions that are not related to the organic aerosol (Freney et al., 2019; Pieber et al., 2016). Data showed that the degree of interference was highly variable between instruments and over time, and CO was overestimated by 0.4 % to 10.2 %. This would lead to an overestimation of OM OC ratios by up to 10 %. In the Netherlands, values towards the upper limit are more likely due to the inorganic concentrations in the Netherlands, especially of ammonium nitrate. Specifically, NH4NO3 resulted in a median CO2+ overestimate that was 3.4 % higher compared to HNO3. The level of interference caused by other semi-refractory nitrate salts was 2–10 times higher than that caused by NH4NO3. In contrast, (NH4)2SO4 induced interference that was 3–10 times lower than NH4NO3. Apart from this, a constant RIE of 1.4 was assumed for OA during the study based on the recommendation by Aerodyne, which can contribute to uncertainties in OA quantification, since this RIE can change for different instruments and different OA composition and concentration. Although there are some studies that attempted to convert the ACSM f44 signal to O : C ratios and to derive OM : OC ratios, the large variability of the f44 signal itself causes a large uncertainty in the O : C ratio (Crenn et al., 2015; Canagaratna et al., 2015; Aiken et al., 2008; Rollins et al., 2010; Poulain et al., 2020). Thus, this approach was not attempted in this study. In summary, OM OC ratios in this study have considerable uncertainties but are within the range of typical values found in the literature (Aiken et al., 2008; Poulain et al., 2020; Sun et al., 2011; Zhao et al., 2020).
The eBC was measured online using the MAAP with a PM10 inlet, whereas the EC was collected on the filters using the PM2.5 inlet and then analyzed offline by the sunset analyzer. Figure 1 shows the comparison of eBC and the PM2.5 EC with a good correlation (R2 of 0.83). The slope was 1.55 ± 0.44, mainly reflecting the difference in size cutoff. Moreover, it is worth noting that the MAAP instrument measures eBC at 637 nm, encompassing both BC and other light-absorbing species that share the same absorption wavelength, such as brown carbon potentially leading to overestimation of the eBC measurements (Cheng et al., 2019). Additional uncertainties are related to filter loading and multiple scattering effects (Petzold et al., 2005; Petzold and Schönlinner, 2004). The measured eBC is based on a MAC of 6.6 m2 g−1 for black carbon (Petzold et al., 2002) for converting the absorption to the mass concentration of eBC. In reality, this MAC value can vary widely among different environments. On the other hand, EC measurements by thermal–optical analysis (TOA) also have significant uncertainties. Previous studies show that EC can be both overestimated or underestimated by TOA depending on the thermal protocol, optical correction method, and filter loading (Yang and Yu, 2002; Schmid et al., 2001; Panteliadis et al., 2015; Cadle et al., 1980; Zenker et al., 2020), which can introduce addition uncertainties when comparing eBC and EC measurements. A recent comparison between the MAAP and OC EC analysis shows differences of 20 % for an urban site and 70 % for a regional site (Karanasiou et al., 2020). The 55 % differences found in our studies with different size cutoffs show a reasonable result.
To sum up, the comparison between the online and offline measurements of the PM1.0 and PM2.5 showed consistent results, especially for the SIA with slopes between 0.88–1.09 and R2 values greater than 0.87. The OA vs. OC and eBC vs. EC comparisons showed results in line with previous studies. Overall, the data were fairly accurate and reliable for further study. In particular, the configuration of TOF-ACSM-CV-PM2.5 lens showed a high stability and accuracy. With suitable inlets it can perform both NR-PM1.0 and NR-PM2.5 measurements for the purpose of long-term field observation.
3.1.2 Comparison of chemically derived volume concentration and PNSD-derived volume concentration
The total TOF-ACSM volume concentration was also compared and validated by the particle volume concentration derived from the PNSD. The aerosol particle size distribution with a range of around 8–800 nm in electromobility diameter was obtained by the MPSS during the RITA-2021 campaigns (in May and September) to further validate the chemical measurements. Simply put, the volume concentration from ACSM was calculated as the mass concentrations of individual species divided by the corresponding density. The density of each species using in this study was 1.75 g cm−3 for the inorganics (Haynes, 1942), 1.2 g cm−3 for the organics (Turpin and Lim, 2001), 1.52 g cm−3 for chloride (Haynes, 1942), and 1.77 g cm−3 for eBC (Park et al., 2004; Poulain et al., 2014). The MPSS volume concentration was estimated by converting the PNSD to the particle volume distribution. The total volume concentration of the MPSS is the integral of the particle volume distribution over all the size bins. Figure 2a shows the time series of the volume concentrations derived from ACSM + MAAP measurements and the MPSS-derived volume concentration. The agreement was good over the whole measurements period, indicating a stable condition of the instrument and satisfactory quality. The correlation of volume concentrations is displayed in Fig. 2b, with data points colored by the RH. The slope was nearly 1 (±0.02) with R2= 0.91, which was comparable with previous studies (Poulain et al., 2020; Pokorná et al., 2022). However, it demonstrates that the linear correlation between the two variables is significantly influenced by relative humidity. Higher relative humidity led to a lower size cutoff diameter, resulting in a lower mass concentration measured by ACSM. As also reported in the previous studies, the aerosol hygroscopic growth has a great impact on the size cut off in terms of dry particle size (Chen et al., 2018) when the ambient RH is high. It has been pointed out that the difference between ambient and dry cutoff size is approximately 10 % and 20 % for PM1.0 and PM2.5 in the European background and even larger in marine or coastal stations, with up to 43 % and 62 % for PM1.0 and PM2.5 (Poulain et al., 2020). The upper cutoff for the ACSM inlet is ∼ 2.5 µm (ambient, aerodynamic) and ∼ 0.8 µm (dry, electrodynamic equivalent) for the MPSS. Nevertheless, the dry, electrodynamic equivalent cutoff size of the ACSM inlet will be larger than 0.8 µm. Therefore, the ACSM volume concentrations were expected to be higher, and it is surprising that the agreement is so close. However, the ACSM only measures non-refractory material, whereas the MPSS-derived volume concentration also includes non-refractory material. This indicates that there is considerable contribution from non-refractory material other than BC. The filter analysis also supports this conclusion, as seen in Fig. S5, which shows approximately 21 % of the PM2.5 mass was not detected by the ion analysis. Thus, the slope of 1.00 is probably a coincidence, where missing volume from the MPSS cutoff and missing mass from the ACSM roughly cancel out. On the whole, the high R2 values give confidence in the stability and accurateness of the ACSM instrument in the long-term observations. A comparison between ACSM and MPSS volume concentrations is highly recommended as a regular quality control strategy.
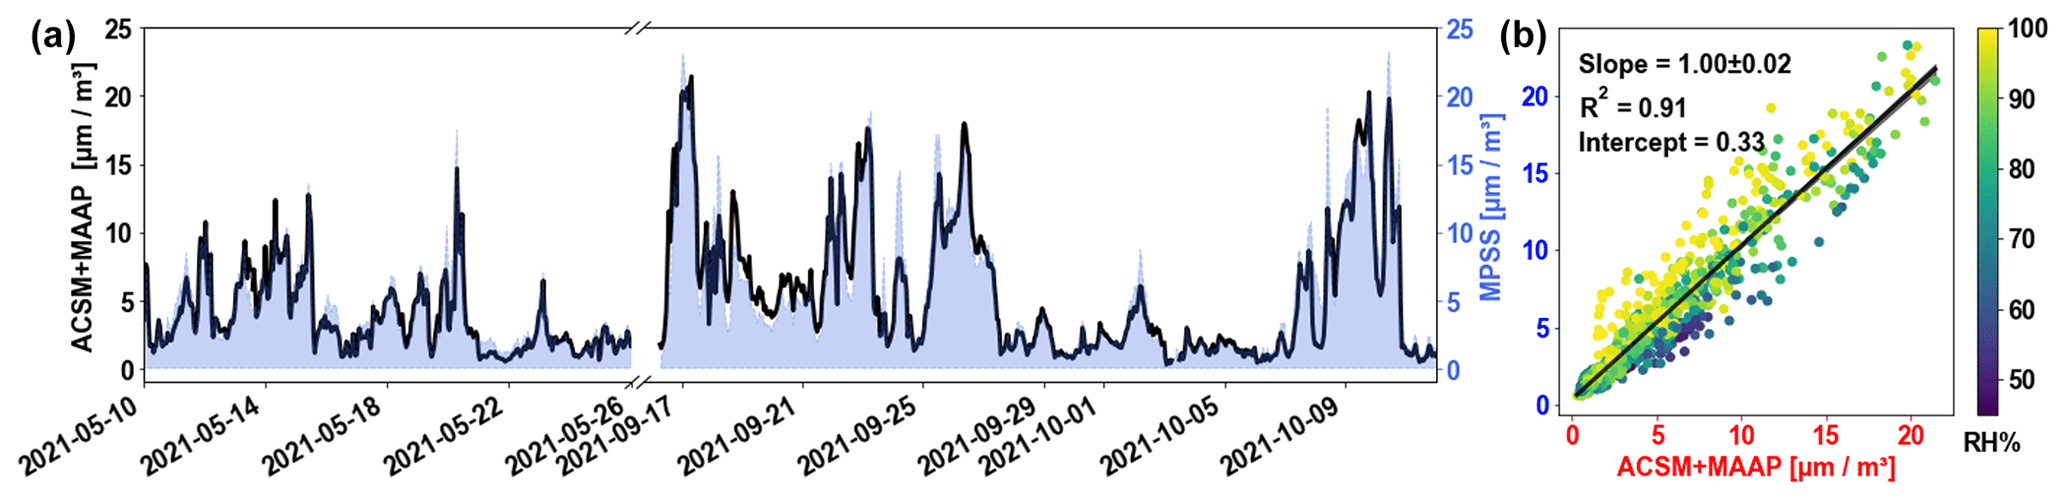
Figure 2(a) The time series of the ACSM and MAAP volume concentrations (red line) compared with the MPSS volume concentration (blue area). (b) The linear regression fitting correlations of the ACSM and MAAP volume concentration with the MPSS-derived volume concentration. Scatters colored by the relative humidity (%).
3.2 Chemical composition of the PM1.0 and PM2.5
Based on the good agreement between the online and offline measurements, ACSM accurately measured both PM1.0 and PM2.5 concentrations. Therefore, it is possible to further quantify the PM1.0 vs. PM2.5 chemical composition and investigate the differences.
3.2.1 Comparison of NR-PM1.0 and NR-PM2.5 species measured by TOF-ACSM
As mentioned, two identically configured TOF-ACSMs with PM2.5 aerodynamic lens were collocated and set up to measure the NR-PM1.0 and NR-PM2.5 during the RITA-2021 spring campaign. At the start of the campaign, both instruments were intercompared by measuring the NR-PM2.5. The results shown in Fig. S1 demonstrate good comparability, with the R2 ranging from 0.91 to 1.0 and slopes ranging from 0.94 to 0.99 for the SIA compounds SO4, NO3, and NH4. The slopes were not significantly different from 1 at the 95 % confidence level. For chloride, the correlation was not as good as for other species because ammonium chloride had a very low concentration during the whole measurement period. Therefore, it will not be discussed in the following. The correlation of PM1.0 and PM2.5 OA concentrations was also reasonable with a slope of 0.93 ± 0.13 (R2= 0.80). Overall, the two collocated TOF-ACSMs compared well and can be used to compare PM1.0 and PM2.5 chemical composition.
Figure 3 shows the total mass concentration time series of the NR-PM1.0 and NR-PM2.5, as well as the concentration of individual chemical species and the corresponding scatter plots with regression lines. The mass concentration of NR-PM2.5 was on average 5.27 ± 3.98 µg m−3, with a range from 4.84 to 22.25 µg m−3. This concentration was below the WHO PM2.5 annual limit values (10 µg m−3) (World Health Organization, 2021) and also lower than previously reported concentrations in this region of 14.4 ± 2.1 µg m−3 (Schlag et al., 2016; Mensah et al., 2012; Mamali et al., 2018). The PM1.0 and PM2.5 mass concentrations of each species were highly correlated over the whole measurements period with R2≥ 0.98. In general, the PM1.0 SIA accounted for approximately 75 %–85 % of the PM2.5 SIA on average, with individual contributions ranging from 82±1 % for ammonium and 79±1 % for nitrate to 76±1 % for sulfate. For organics, the PM1.0 accounted for a higher fraction of PM2.5, with around 85±1 %. Similar results were also found in the filter samples as displayed in Fig. S2. In addition, EC-PM1.0 accounted for 74±14 % of the EC-PM2.5. In general, the PM1.0 mass concentration explained 80±1 % of the PM2.5 on average, and this ratio ranged from 45.21 %–94.78 % throughout the campaigns. However, there was still a substantial proportion (∼ 21 %) of unexplained mass in the PM2.5 as shown in Fig. S5.
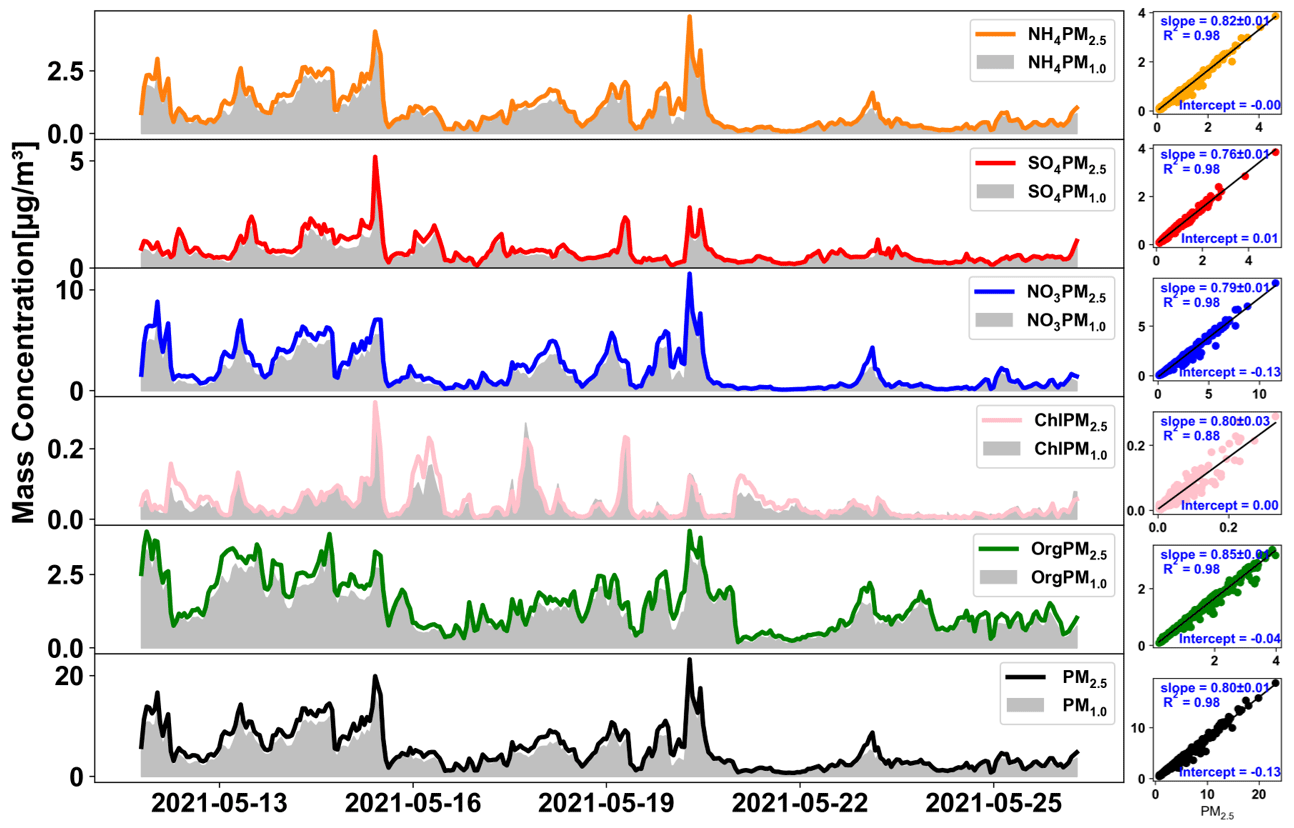
Figure 3Time series of the NR-PM1.0 and NR-PM2.5 chemical species and the total mass concentration measured by TOF-ACSM and corresponding linear regression fitting correlations.
In addition, the chemical mass fractions of PM1.0 and PM2.5 displayed in Figs. S3–S4 revealed that there were some slight differences in the chemical composition of the PM1.0 and PM2.5. Figure S3 showed the average hourly mass fraction measured by the ACSM for the NR-PM1.0 and NR-PM2.5. The OA accounted for similar proportions, namely 34.4 % of NR-PM1.0 and 33.0 % of NR-PM2.5. NO3 contributed 27.8 % to NR-PM1.0, with a slight increase to 31.5 % in NR-PM2.5. Figures S4 and S5 show the daily and the average mass fractions for PM1.0 and PM2.5 species from the filter samples, with a higher NO3 fraction in PM2.5 and a lower OC fraction in PM1.0 for the whole period. Specifically, the NO3 fraction increased from 38.3 % in PM1.0 filter samples to 45.5 % in PM2.5 filter samples, whereas the OC fraction decreased from 19.9 % to 15.1 %. The difference between the ACSM OA mass fractions (similar in PM1.0 and PM2.5) and the OC mass fraction on the filters (higher in PM1.0 than in PM2.5) is the result of higher OM OC ratios for larger particles. As discussed in Sect. 3.1.1, this is likely due to the fact that pure hydrocarbons that are often contained in primary emissions are more abundant in the smaller particle size range. This change in chemical composition with particle size suggests that different types of particles may dominate in different size ranges, potentially indicating a non-internal aerosol mixing state during the measurements. The differences of OC mass fraction in PM1.0 and in PM2.5 also further explain the stronger correlation of ACSM OA and Filter OC in PM1.0 compared to in PM2.5 shown in Fig. 1.
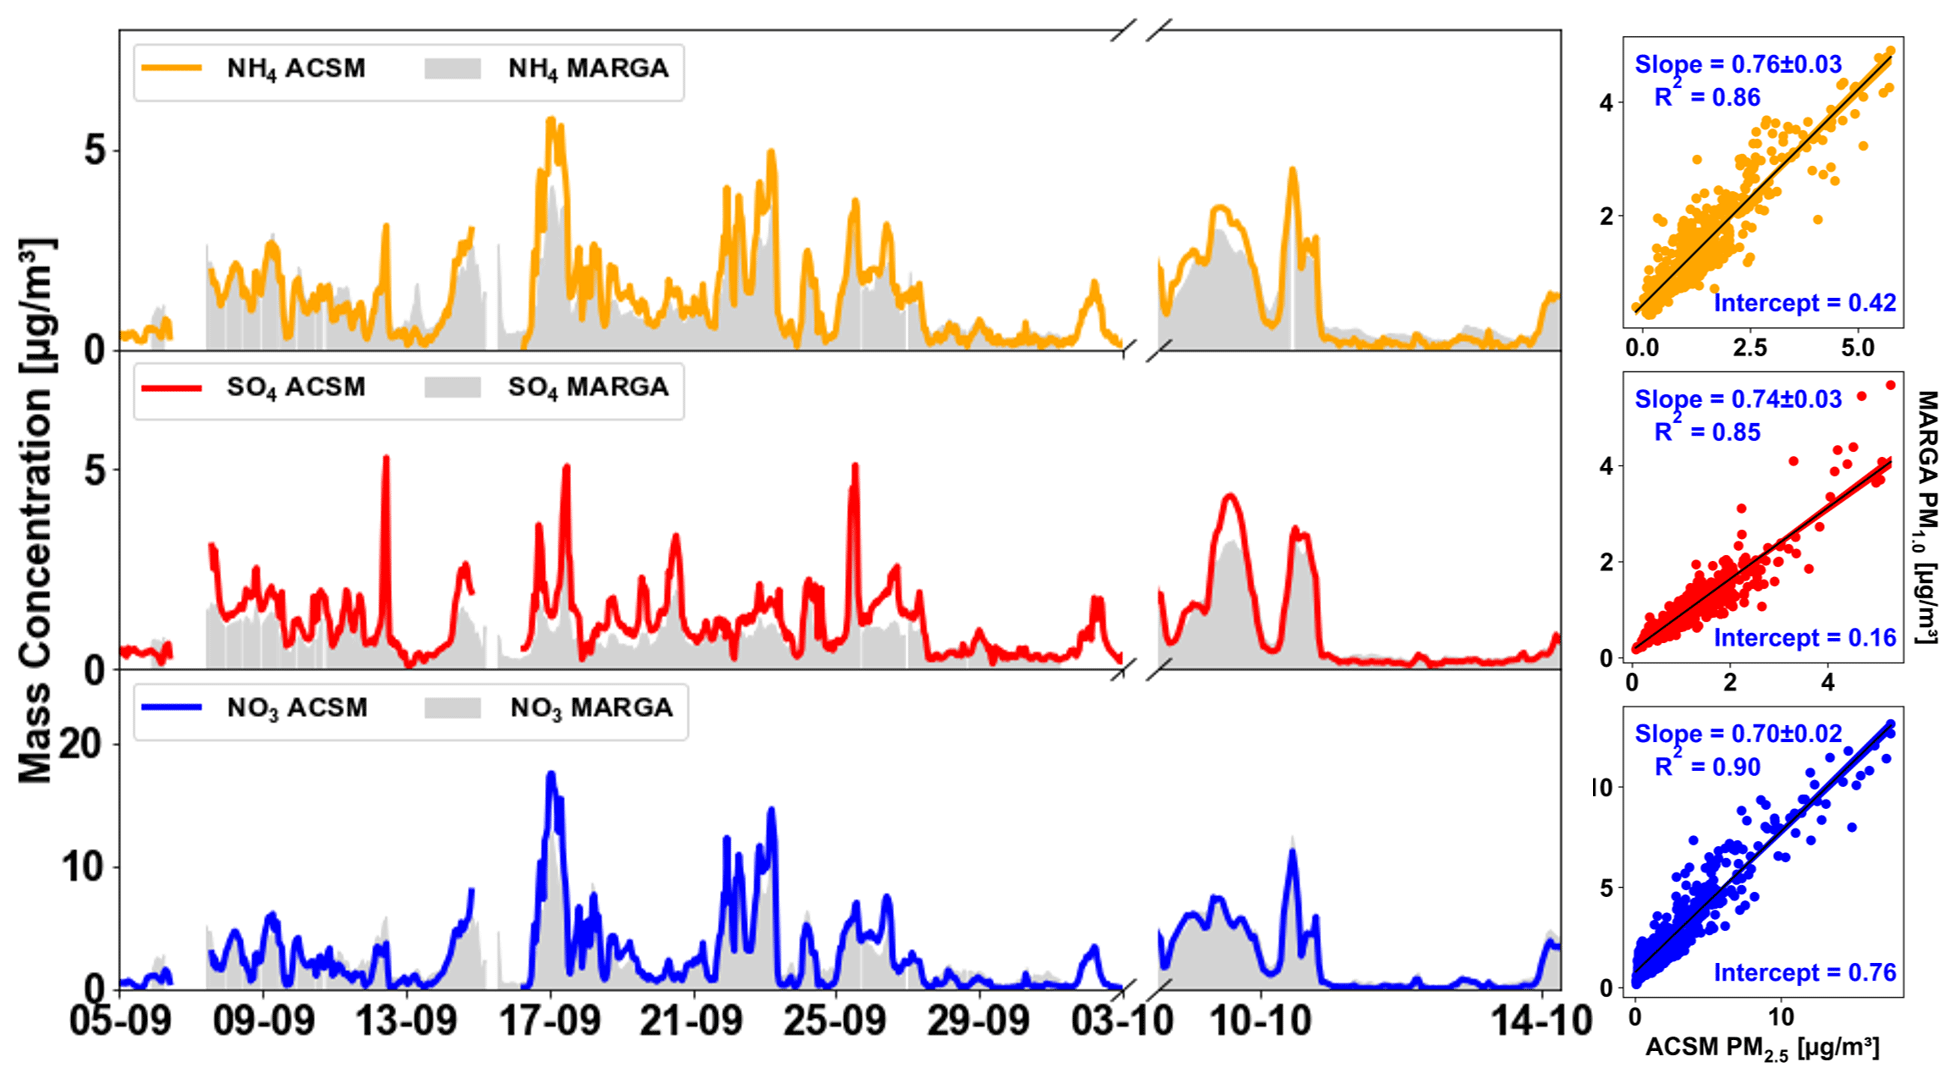
Figure 4Time series of TOF-ACSM-measured SIA-PM2.5 during the whole period. MARGA-measured PM1.0 from 5 to 30 September 2021 and PM2.5 from 3 to 15 October 2021. The corresponding linear regression fitting correlations between MARGA PM1.0 and TOF-ACSM PM2.5.
3.2.2 Comparison of the SIA-PM1.0 by MARGA and SIA-PM2.5 by TOF-ACSM
The comparison of the MARGA and ACSM measurements was carried out for further evaluation and validation. Figure 4 displays the time series of the MARGA measurements and TOF-ACSM measurements. Figure 5 compares MARGA and TOF-ACSM data during time periods when both instruments measured PM2.5. Strong correlations with R2 ranging from 0.93 to 0.97 and small intercepts demonstrated a good reliability of the two methods. However, the linear regression slopes display some discrepancies for individual species. The NO3 measured by the ACSM and MARGA showed an excellent agreement, with a difference below 3 % (slope , R2= 0.97). For the NH4 and SO4, the MARGA mass concentrations were lower than the ACSM mass concentrations. The slope for NH4 was 0.83 ± 0.04, and for SO4 it was 0.78 ± 0.02. The analysis also revealed a dependence on the RH for the correlation between the two measurements. As illustrated in Fig. 5, the ACSM tended to measure more mass than the MARGA under lower RH conditions. The hygroscopic growth of the aerosol particles at higher RH resulted in lower dry cutoff sizes, and the different inlets of the MARGA and ACSM might lead to differences in the detected mass. Combined with Fig. S6, it shows a slight bias between ACSM and MARGA at higher concentrations, particularly when pollution originates from the south or southeast. Since the ACSM mass also includes contributions from organic nitrates, organic sulfates, and organic ammonium salts to the observed NH4, NO3, and SO4 concentrations, this could also lead to higher concentrations observed by the ACSM. However, given that the validation of the TOF-ACSM against filter samples showed excellent agreement for these ions as discussed in the Sect. 3.3.1 and listed in Tables S1–S3, the ACSM results are more likely to be closer to the true values compared with MARGA. Most previous comparisons of ACSM/AMS and MARGA showed that the MARGA gave higher concentrations when the ACSM/AMS used the PM1.0 lens (Zhao et al., 2020; Stieger et al., 2018; Heikkinen et al., 2020). To the best of our knowledge, this is the first comparison between the PM2.5 lens on a TOF-ACSM-CV and a MARGA. We observed that a higher concentration can be achieved using the CV and PM2.5 lens of the TOF-ACSM, which further verifies its capability in measuring non-refractory PM2.5 and PM1.0 concentrations quantitatively. Because of the very high correlation between MARGA and ACSM concentration, the slight bias between the instruments can be corrected using the regression coefficients in Fig. 5. Figure 4 also displayed the linear regression correlations between the MARGA-measured PM1.0 and TOF-ACSM- measured PM2.5 inorganic chemical species after this correction. The correlations between ACSM PM2.5 and MARGA PM1.0 all showed R2 values greater than 0.85, and the slopes are 0.76 ± 0.03 for NH4, 0.74 ± 0.03 for SO4, and 0.70 ± 0.02 for NO3, very comparable to the slopes achieved in the spring campaign, using two different ACSMs. In summary, the local concentrations of both PM1.0 or PM2.5 were relatively low throughout the observation period. The PM1.0 and PM2.5 studied by using the several different instruments have demonstrated that the PM1.0 mass concentrations accounted for 70 %–80 % of the PM2.5 concentrations for various non-refractory species.
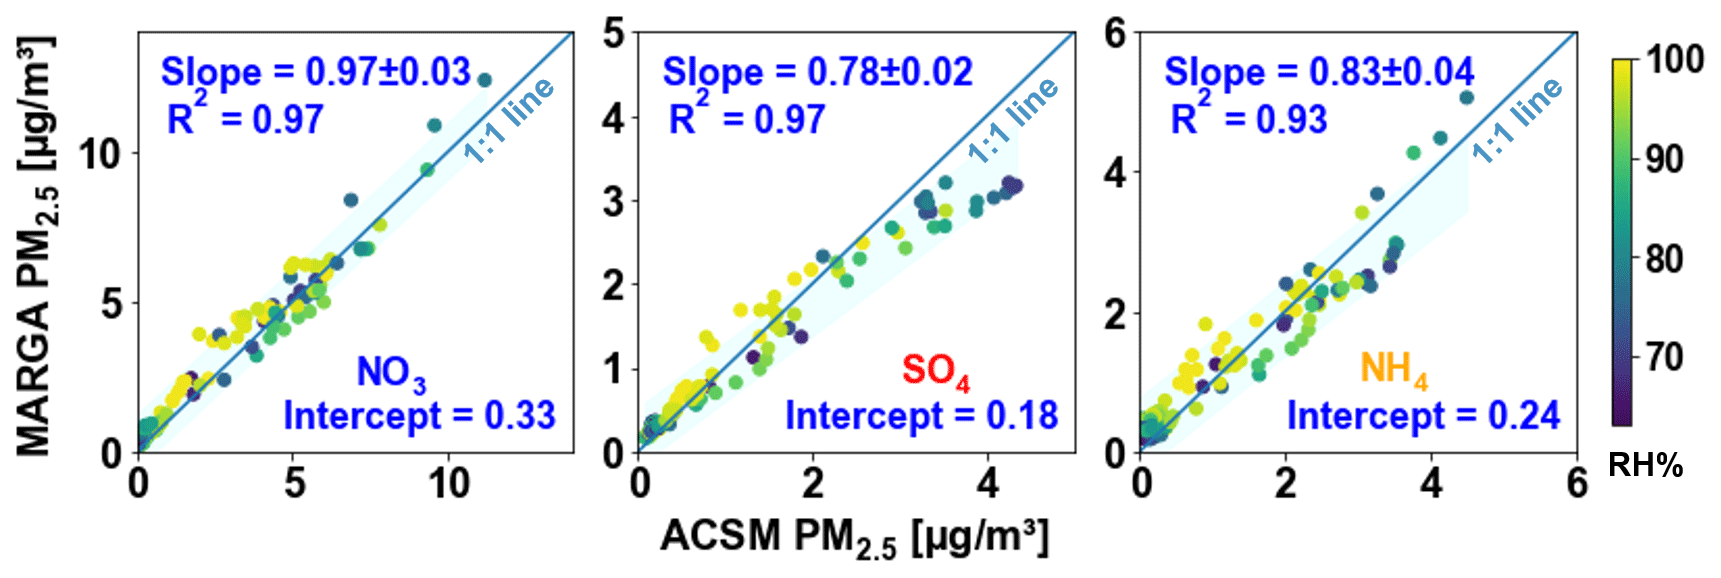
Figure 5The linear regression fitting correlations between MARGA PM2.5 and TOF-ACSM PM2.5, with points colored by the relative humidity (%). The blue shaded area represents the 95 % confidence interval.
This study evaluated the performance of the newly developed time-of-flight aerosol chemical species monitor capture vaporizer (TOF-ACSM-CV) with a PM2.5 aerodynamic lens, in comparison to other offline and online methods. Additionally, we investigated the chemical compositions of PM1.0 and PM2.5 using two collocated and identically configured TOF-ACSM-CVs. Measurements were carried out during the RITA-2021 campaign with two intensive observation periods in Spring and Fall at CESAR (the Cabauw Experimental Site for Atmospheric Research) in the Netherlands. PM1.0 and PM2.5 were also collected on filters for offline analysis. We observed excellent agreement (R2 from 0.87–0.99) between the online and offline measurements, with the differences of all secondary inorganic aerosols smaller than 10 %. This level of accuracy is significantly higher than the nominal specification of ±30 %, indicating the reliability of the ACSM with CV and PM2.5 lens in accurately measuring atmospheric aerosols. The integrated volume size distribution obtained from the MPSS showed a strong correlation, with the summed volume concentration calculated from ACSM and MAAP measurements (slope = 1.0, R2= 0.91). The bias among the multiple online measurements (ACSM, MPSS and MARGA) was dependent on RH, which could be due to the different inlet systems (cyclones vs. impactors). However, the good agreements (with all R2> 0.9) enable further quantification of PM1.0 and PM2.5 mass concentrations with the ACSM. The average mass concentration of non-refractory (NR) compounds was 4.11 ± 3.32 µg m−3 for PM1.0 and 5.27 ± 3.98 µg m−3 for PM2.5. The NR-PM1.0 fraction accounted for approximately 70 %–80 % of the NR-PM2.5 mass concentration, with both dominated by organics (> 33 %), followed by nitrate (> 27 %), sulfate (∼ 18 %), and ammonium (∼ 17 %). However, the mass fraction of nitrate tended to increase by 7.2 % (from 38.3 % to 45.5 %), while the OC mass fraction tended to decrease 4.8 % (from 19.9 % to 15.1 %) from the PM1.0 to PM2.5. This change reveals the size dependence on chemical composition. In conclusion, the introduction of the CV and PM2.5 lens significantly improved the collection and detection efficiency, enabling the TOF-ACSM to measure the PM1.0 and PM2.5 substance quantitatively with good calibration.
The data included in this study are part of the Ruisdael Observatory (https://ruisdael-observatory.nl, KNMI Data Platform, 2024) project and can be accessed at the repository under https://doi.org/10.5281/zenodo.7924288 (Liu et al., 2023). The meteorological data are available at the KNMI (Royal Netherlands Meteorological Institute) Data Platform (https://dataplatform.knmi.nl/dataset/cesar-tower-meteo-lc1-t10-v1-0, KNMI, 2022).
The supplement related to this article is available online at: https://doi.org/10.5194/acp-24-3405-2024-supplement.
XL, BH, and UD designed this study. AH, JM, PY, DD, JB, UD, and XL implemented the experiment and sample analysis. XL analyzed the data and wrote the manuscript. All co-authors proofread and commented on the paper.
The contact author has declared that none of the authors has any competing interests.
Publisher's note: Copernicus Publications remains neutral with regard to jurisdictional claims made in the text, published maps, institutional affiliations, or any other geographical representation in this paper. While Copernicus Publications makes every effort to include appropriate place names, the final responsibility lies with the authors.
The authors would like to thank Jan Pieter Lollinga and Anneliese Kasper-Giebl for their support in data collection.
This research has been supported by the China Scholarship Council (grant no. 201906350118) and the Nederlandse Organisatie voor Wetenschappelijk Onderzoek (Dutch Research Council) (grant no. 184.034.015).
This paper was edited by Samara Carbone and reviewed by two anonymous referees.
Aiken, A. C., Decarlo, P. F., Kroll, J. H., Worsnop, D. R., Huffman, J. A., Docherty, K. S., Ulbrich, I. M., Mohr, C., Kimmel, J. R., Sueper, D., Sun, Y., Zhang, Q., Trimborn, A., Northway, M., Ziemann, P. J., Canagaratna, M. R., Onasch, T. B., Alfarra, M. R., Prevot, A. S. H., Dommen, J., Duplissy, J., Metzger, A., Baltensperger, U., and Jimenez, J. L.: OC and OMOC ratios of primary, secondary, and ambient organic aerosols with high-resolution time-of-flight aerosol mass spectrometry, Environ. Sci. Technol., 42, 4478–4485, https://doi.org/10.1021/es703009q, 2008.
Allan, J. D., Jimenez, J. L., Williams, P. I., Alfarra, M. R., Jayne, J. T., Coe, H., and Worsnop, D. R.: Quantitative sampling using an Aerodyne aerosol mass spectrometer 1. Techniques of data interpretation and error analysis, J. Geophys. Res.-Atmos., 108, 4090, https://doi.org/10.1029/2002jd002358, 2003.
Allan, J. D., Delia, A. E., Coe, H., Bower, K. N., Alfarra, M. R., Jimenez, J. L., Middlebrook, A. M., Drewnick, F., Onasch, T. B., Canagaratna, M. R., Jayne, J. T., and Worsnop, D. R.: A generalised method for the extraction of chemically resolved mass spectra from Aerodyne aerosol mass spectrometer data, J. Aerosol Sci., 35, 909–922, https://doi.org/10.1016/j.jaerosci.2004.02.007, 2004.
Bhowmik, H. S., Shukla, A., Lalchandani, V., Dave, J., Rastogi, N., Kumar, M., Singh, V., and Tripathi, S. N.: Inter-comparison of online and offline methods for measuring ambient heavy and trace elements and water-soluble inorganic ions (NO, SO, NH, and Cl−) in PM2.5 over a heavily polluted megacity, Delhi, Atmos. Meas. Tech., 15, 2667–2684, https://doi.org/10.5194/amt-15-2667-2022, 2022.
Brunekreef, B., Beelen, R., Hoek, G., Schouten, L., Bausch- Goldbohm, S., Fischer, P., Armstrong, B., Hughes, E., Jerrett, M., and van den Brandt, P.: Effects of long-term exposure to trafficrelated air pollution on respiratory and cardiovascular mortality in the Netherlands: the NLCS-AIR study, Research report, Health Effects Institute, 139, 5–89, 2009.
Budisulistiorini, S. H., Canagaratna, M. R., Croteau, P. L., Baumann, K., Edgerton, E. S., Kollman, M. S., Ng, N. L., Verma, V., Shaw, S. L., Knipping, E. M., Worsnop, D. R., Jayne, J. T., Weber, R. J., and Surratt, J. D.: Intercomparison of an Aerosol Chemical Speciation Monitor (ACSM) with ambient fine aerosol measurements in downtown Atlanta, Georgia, Atmos. Meas. Tech., 7, 1929–1941, https://doi.org/10.5194/amt-7-1929-2014, 2014.
Cadle, S. H., Groblicki, P. J., and Stroup, D. P.: Automated Carbon Analyzer For Particulate Samples, Anal. Chem., 52, 2201–2206, https://doi.org/10.1021/ac50063a047, 1980.
Canagaratna, M. R., Jayne, J. T., Jimenez, J. L., Allan, J. D., Alfarra, M. R., Zhang, Q., Onasch, T. B., Drewnick, F., Coe, H., Middlebrook, A., Delia, A., Williams, L. R., Trimborn, A. M., Northway, M. J., DeCarlo, P. F., Kolb, C. E., Davidovits, P., and Worsnop, D. R.: Chemical and microphysical characterization of ambient aerosols with the aerodyne aerosol mass spectrometer, Mass Spectrom. Rev., 26, 185–222, https://doi.org/10.1002/mas.20115, 2007.
Canagaratna, M. R., Jimenez, J. L., Kroll, J. H., Chen, Q., Kessler, S. H., Massoli, P., Hildebrandt Ruiz, L., Fortner, E., Williams, L. R., Wilson, K. R., Surratt, J. D., Donahue, N. M., Jayne, J. T., and Worsnop, D. R.: Elemental ratio measurements of organic compounds using aerosol mass spectrometry: characterization, improved calibration, and implications, Atmos. Chem. Phys., 15, 253–272, https://doi.org/10.5194/acp-15-253-2015, 2015.
Cavalli, F., Viana, M., Yttri, K. E., Genberg, J., and Putaud, J.-P.: Toward a standardised thermal-optical protocol for measuring atmospheric organic and elemental carbon: the EUSAAR protocol, Atmos. Meas. Tech., 3, 79–89, https://doi.org/10.5194/amt-3-79-2010, 2010.
Chen, Y., Wild, O., Wang, Y., Ran, L., Teich, M., Größ, J., Wang, L., Spindler, G., Herrmann, H., van Pinxteren, D., McFiggans, G., and Wiedensohler, A.: The influence of impactor size cut-off shift caused by hygroscopic growth on particulate matter loading and composition measurements, Atmos. Environ., 195, 141–148, https://doi.org/10.1016/j.atmosenv.2018.09.049, 2018.
Cheng, Y., He, K. bin, Duan, F. kui, Zheng, M., Du, Z. yu, Ma, Y. liang, and Tan, J. hua: Ambient organic carbon to elemental carbon ratios: Influences of the measurement methods and implications, Atmos. Environ., 45, 2060–2066, https://doi.org/10.1016/j.atmosenv.2011.01.064, 2011.
Cheng, Z., Atwi, K., Onyima, T., and Saleh, R.: Investigating the dependence of light-absorption properties of combustion carbonaceous aerosols on combustion conditions, Aerosol Sci. Tech., 53, 419–434, https://doi.org/10.1080/02786826.2019.1566593, 2019.
Chiappini, L., Verlhac, S., Aujay, R., Maenhaut, W., Putaud, J. P., Sciare, J., Jaffrezo, J. L., Liousse, C., Galy-Lacaux, C., Alleman, L. Y., Panteliadis, P., Leoz, E., and Favez, O.: Clues for a standardised thermal-optical protocol for the assessment of organic and elemental carbon within ambient air particulate matter, Atmos. Meas. Tech., 7, 1649–1661, https://doi.org/10.5194/amt-7-1649-2014, 2014.
Chow, J. C.: Measurement methods to determine compliance with ambient air quality standards for suspended particles, J. Air Waste Manage., 45, 320–382, https://doi.org/10.1080/10473289.1995.10467369, 1995.
Chow, J. C., Watson, J. G., Lowenthal, D. H., Park, K., Doraiswamy, P., Bowers, K., and Bode, R.: Continuous and filter-based measurements of PM2.5 nitrate and sulfate at the Fresno Supersite, Environ. Monit. Assess., 144, 179–189, https://doi.org/10.1007/s10661-007-9987-5, 2008.
Crenn, V., Sciare, J., Croteau, P. L., Verlhac, S., Fröhlich, R., Belis, C. A., Aas, W., Äijälä, M., Alastuey, A., Artiñano, B., Baisnée, D., Bonnaire, N., Bressi, M., Canagaratna, M., Canonaco, F., Carbone, C., Cavalli, F., Coz, E., Cubison, M. J., Esser-Gietl, J. K., Green, D. C., Gros, V., Heikkinen, L., Herrmann, H., Lunder, C., Minguillón, M. C., Močnik, G., O'Dowd, C. D., Ovadnevaite, J., Petit, J.-E., Petralia, E., Poulain, L., Priestman, M., Riffault, V., Ripoll, A., Sarda-Estève, R., Slowik, J. G., Setyan, A., Wiedensohler, A., Baltensperger, U., Prévôt, A. S. H., Jayne, J. T., and Favez, O.: ACTRIS ACSM intercomparison – Part 1: Reproducibility of concentration and fragment results from 13 individual Quadrupole Aerosol Chemical Speciation Monitors (Q-ACSM) and consistency with co-located instruments, Atmos. Meas. Tech., 8, 5063–5087, https://doi.org/10.5194/amt-8-5063-2015, 2015.
European Environment Agency: Air quality in Europe 2022, Report no. 05/2022, European Environment Agency, https://doi.org/10.2800/488115, 2022.
Fan, J., Wang, Y., Rosenfeld, D., and Liu, X.: Review of Aerosol–Cloud Interactions: Mechanisms, Significance, and Challenges, J. Atmos. Sci., 73, 4221–4252, https://doi.org/10.1175/JAS-D-16-0037.1, 2016.
Freney, E., Zhang, Y., Croteau, P., Amodeo, T., Williams, L., Truong, F., Petit, J. E., Sciare, J., Sarda-Esteve, R., Bonnaire, N., Arumae, T., Aurela, M., Bougiatioti, A., Mihalopoulos, N., Coz, E., Artinano, B., Crenn, V., Elste, T., Heikkinen, L., Poulain, L., Wiedensohler, A., Herrmann, H., Priestman, M., Alastuey, A., Stavroulas, I., Tobler, A., Vasilescu, J., Zanca, N., Canagaratna, M., Carbone, C., Flentje, H., Green, D., Maasikmets, M., Marmureanu, L., Minguillon, M. C., Prevot, A. S. H., Gros, V., Jayne, J., and Favez, O.: The second ACTRIS inter-comparison (2016) for Aerosol Chemical Speciation Monitors (ACSM): Calibration protocols and instrument performance evaluations, Aerosol Sci. Tech., 53, 830–842, https://doi.org/10.1080/02786826.2019.1608901, 2019.
Fröhlich, R., Cubison, M. J., Slowik, J. G., Bukowiecki, N., Prévôt, A. S. H., Baltensperger, U., Schneider, J., Kimmel, J. R., Gonin, M., Rohner, U., Worsnop, D. R., and Jayne, J. T.: The ToF-ACSM: a portable aerosol chemical speciation monitor with TOFMS detection, Atmos. Meas. Tech., 6, 3225–3241, https://doi.org/10.5194/amt-6-3225-2013, 2013.
Giugliano, M., Lonati, G., Butelli, P., Romele, L., Tardivo, R., and Grosso, M.: Fine particulate (PM2.5-PM1) at urban sites with different traffic exposure, Atmos. Environ., 39, 2421–2431, https://doi.org/10.1016/j.atmosenv.2004.06.050, 2005.
Gu, B., Zhang, L., Dingenen, R. Van, Vieno, M., Grinsven, H. J. Van, Zhang, X., Zhang, S., Chen, Y., Wang, S., Ren, C., Rao, S., Holland, M., Winiwarter, W., Chen, D., Xu, J., and Sutton, M. A.: Abating ammonia is more cost-effective than nitrogen oxides for mitigating PM2.5 air pollution, Science, 374, 758–762, https://doi.org/10.1126/science.abf8623, 2021.
Gurjar, B. R., Molina, L. T., and Ojha, C. S. P.: Air pollution: Health and environmental impacts, CRC Press, 1–519, https://doi.org/10.1201/EBK1439809624, 2010.
Haynes, W. M.: CRC handbook of chemistry and physics, CRC press, Edition 95, 3–488, ISBN 10: 1482260964, 1942.
Heikkinen, L., Äijälä, M., Riva, M., Luoma, K., Dällenbach, K., Aalto, J., Aalto, P., Aliaga, D., Aurela, M., Keskinen, H., Makkonen, U., Rantala, P., Kulmala, M., Petäjä, T., Worsnop, D., and Ehn, M.: Long-term sub-micrometer aerosol chemical composition in the boreal forest: inter- and intra-annual variability, Atmos. Chem. Phys., 20, 3151–3180, https://doi.org/10.5194/acp-20-3151-2020, 2020.
Hu, W., Campuzano-Jost, P., Day, D. A., Croteau, P., Canagaratna, M. R., Jayne, J. T., Worsnop, D. R., and Jimenez, J. L.: Evaluation of the new capture vaporizer for aerosol mass spectrometers (AMS) through field studies of inorganic species, Aerosol Sci. Tech., 51, 735–754, https://doi.org/10.1080/02786826.2017.1296104, 2017.
Intergovernmental Panel on Climate Change (Ed.): Summary for Policymakers, in: Climate Change 2013 – The Physical Science Basis: Working Group I Contribution to the Fifth Assessment Report of the Intergovernmental Panel on Climate Change, Cambridge University Press, Cambridge, 1–30, https://doi.org/10.1017/CBO9781107415324.004, 2014.
Janssen, N. A. H., Fischer, P., Marra, M., Ameling, C., and Cassee, F. R.: Short-term effects of PM2.5, PM10 and PM2.5−10 on daily mortality in the Netherlands, Sci. Total Environ., 463–464, 20–26, https://doi.org/10.1016/j.scitotenv.2013.05.062, 2013.
Jayne, J. T. and Worsnop, D. R.: Particle capture device, Aerodyne Res. Inc., 20150040689 A1, 2016.
Karanasiou, A., Panteliadis, P., Perez, N., Minguillón, M. C., Pandolfi, M., Titos, G., Viana, M., Moreno, T., Querol, X., and Alastuey, A.: Evaluation of the Semi-Continuous OCEC analyzer performance with the EUSAAR2 protocol, Sci. Total Environ., 747, 141266, https://doi.org/10.1016/j.scitotenv.2020.141266, 2020.
Keuken, M. P., Schoonebeek, C. A. M., van Wensveen-Louter, A., and Slanina, J.: Simultaneous sampling of NH3, HNO3, HC1, SO2 and H2O2 in ambient air by a wet annular denuder system, Atmos. Environ., 22, 2541–2548, https://doi.org/10.1016/0004-6981(88)90486-6, 1988.
Khlystov, A., Wyers, G. P., and Slanina, J.: The steam-jet aerosol collector, Atmos. Environ., 29, 2229–2234, https://doi.org/10.1016/1352-2310(95)00180-7, 1995.
KNMI (Royal Netherlands Meteorological Institute): Meteo profiles – validated and gapfilled tower profiles of wind, dew point, temperature and visibility at 10 minute interval at Cabauw, cesar_tower_meteo_lc1_t10, KNMI [data set], https://dataplatform.knmi.nl/dataset/cesar-tower-meteo-lc1-t10-v1-0, last access: 20 July 2022.
KNMI Data Platform (KDP): Ruisdael Observatory, https://ruisdael-observatory.nl, last access: 20 July 2022.
Knoop, S., Bosveld, F. C., de Haij, M. J., and Apituley, A.: A 2-year intercomparison of continuous-wave focusing wind lidar and tall mast wind measurements at Cabauw, Atmos. Meas. Tech., 14, 2219–2235, https://doi.org/10.5194/amt-14-2219-2021, 2021.
Kuokka, S., Teinilä, K., Saarnio, K., Aurela, M., Sillanpää, M., Hillamo, R., Kerminen, V.-M., Pyy, K., Vartiainen, E., Kulmala, M., Skorokhod, A. I., Elansky, N. F., and Belikov, I. B.: Using a moving measurement platform for determining the chemical composition of atmospheric aerosols between Moscow and Vladivostok, Atmos. Chem. Phys., 7, 4793–4805, https://doi.org/10.5194/acp-7-4793-2007, 2007.
Lelieveld, J., Evans, J. S., Fnais, M., Giannadaki, D., and Pozzer, A.: The contribution of outdoor air pollution sources to premature mortality on a global scale, Nature, 525, 367–371, https://doi.org/10.1038/nature15371, 2015.
Liao, J., Brock, C. A., Murphy, D. M., Sueper, D. T., Welti, A., and Middlebrook, A. M.: Single-particle measurements of bouncing particles and in situ collection efficiency from an airborne aerosol mass spectrometer (AMS) with light-scattering detection, Atmos. Meas. Tech., 10, 3801–3820, https://doi.org/10.5194/amt-10-3801-2017, 2017.
Liu, X., Henzing, B., Hensen, A., van Dintherand, D., and Dusek, U.: Datasets for “Evaluation of the TOF-ACSM-CV for PM1.0 and PM2.5 measurements during the RITA-2021 field campaign”, Zenodo [data set], https://doi.org/10.5281/zenodo.7924288, 2023.
Malaguti, A., Mircea, M., La Torretta, T. M. G., Telloli, C., Petralia, E., Stracquadanio, M., and Berico, M.: Comparison of online and offline methods for measuring fine secondary inorganic ions and carbonaceous aerosols in the central mediterranean area, Aerosol Air Qual. Res., 15, 2641–2653, https://doi.org/10.4209/aaqr.2015.04.0240, 2015.
Mamali, D., Mikkilä, J., Henzing, B., Spoor, R., Ehn, M., Petäjä, T., Russchenberg, H., and Biskos, G.: Long-term observations of the background aerosol at Cabauw, The Netherlands, Sci. Total Environ., 625, 752–761, https://doi.org/10.1016/j.scitotenv.2017.12.136, 2018.
Matthew, B. M., Middlebrook, A. M., and Onasch, T. B.: Collection Efficiencies in an Aerodyne Aerosol Mass Spectrometer as a Function of Particle Phase for Laboratory Generated Aerosols, Aerosol Sci. Tech., 42, 884–898, https://doi.org/10.1080/02786820802356797, 2008.
Mensah, A. A., Holzinger, R., Otjes, R., Trimborn, A., Mentel, Th. F., ten Brink, H., Henzing, B., and Kiendler-Scharr, A.: Aerosol chemical composition at Cabauw, The Netherlands as observed in two intensive periods in May 2008 and March 2009, Atmos. Chem. Phys., 12, 4723–4742, https://doi.org/10.5194/acp-12-4723-2012, 2012.
Middlebrook, A. M., Bahreini, R., Jimenez, J. L., and Canagaratna, M. R.: Evaluation of Composition-Dependent Collection Efficiencies for the Aerodyne Aerosol Mass Spectrometer using Field Data, Aerosol Sci. Tech., 46, 258–271, https://doi.org/10.1080/02786826.2011.620041, 2012.
Ng, N. L., Herndon, S. C., Trimborn, A., Canagaratna, M. R., Croteau, P. L., Onasch, T. B., Sueper, D., Worsnop, D. R., Zhang, Q., Sun, Y. L., and Jayne, J. T.: An Aerosol Chemical Speciation Monitor (ACSM) for routine monitoring of the composition and mass concentrations of ambient aerosol, Aerosol Sci. Tech., 45, 780–794, https://doi.org/10.1080/02786826.2011.560211, 2011.
Nicolás, J. F., Galindo, N., Yubero, E., Pastor, C., Esclapez, R., and Crespo, J.: Aerosol inorganic ions in a semiarid region on the Southeastern Spanish mediterranean coast, Water. Air. Soil Poll., 201, 149–159, https://doi.org/10.1007/s11270-008-9934-2, 2009.
Nie, W., Wang, T., Gao, X., Pathak, R. K., Wang, X., Gao, R., Zhang, Q., Yang, L., and Wang, W.: Comparison among filter-based, impactor-based and continuous techniques for measuring atmospheric fine sulfate and nitrate, Atmos. Environ., 44, 4396–4403, https://doi.org/10.1016/j.atmosenv.2010.07.047, 2010.
Ostro, B., Hu, J., Goldberg, D., Reynolds, P., Hertz, A., Bernstein, L., and Kleeman, M. J.: Associations of mortality with long-term exposures to fine and ultrafine particles, species and sources: Results from the California teachers study Cohort, Environ. Health Persp., 123, 549–556, https://doi.org/10.1289/ehp.1408565, 2015.
Pakkanen, T. A. and Hillamo, R.: Comparison of sampling artifacts and ion balances for a Berner low-pressure impactor and a virtual impactor, Boreal Environ. Res., 7, 129–140, 2002.
Pandolfi, M., Querol, X., Alastuey, A., Jimenez, J. L., Jorba, O., Day, D., Ortega, A., Cubison, M. J., Comerón, A., Sicard, M., Mohr, C., Prévôt, A. S. H., Minguillón, M. C., Pey, J., Baldasano, J. M., Burkhart, J. F., Seco, R., Peñuelas, J., van Drooge, B. L., Artiñano, B., Di Marco, C., Nemitz, E., Schallhart, S., Metzger, A., Hansel, A., Lorente, J., Ng, S., Jayne, J., and Szidat, S.: Effects of sources and meteorology on particulate matter in the Western Mediterranean Basin: An overview of the DAURE campaign, J. Geophys. Res.-Atmos., 119, 4978–5010, https://doi.org/10.1002/2013JD021079, 2014.
Panteliadis, P., Hafkenscheid, T., Cary, B., Diapouli, E., Fischer, A., Favez, O., Quincey, P., Viana, M., Hitzenberger, R., Vecchi, R., Saraga, D., Sciare, J., Jaffrezo, J. L., John, A., Schwarz, J., Giannoni, M., Novak, J., Karanasiou, A., Fermo, P., and Maenhaut, W.: ECOC comparison exercise with identical thermal protocols after temperature offset correction – instrument diagnostics by in-depth evaluation of operational parameters, Atmos. Meas. Tech., 8, 779–792, https://doi.org/10.5194/amt-8-779-2015, 2015.
Park, K., Kittelson, D. B., Zachariah, M. R., and McMurry, P. H.: Measurement of inherent material density of nanoparticle agglomerates, J. Nanopart. Res., 6, 267–272, https://doi.org/10.1023/b:nano.0000034657.71309.e6, 2004.
Peck, J., Gonzalez, L. A., Williams, L. R., Xu, W., Croteau, P. L., Timko, M. T., Jayne, J. T., Worsnop, D. R., Miake-Lye, R. C., and Smith, K. A.: Development of an aerosol mass spectrometer lens system for PM2.5, Aerosol Sci. Tech., 50, 781–789, https://doi.org/10.1080/02786826.2016.1190444, 2016.
Perrone, M. R., Becagli, S., Garcia Orza, J. A., Vecchi, R., Dinoi, A., Udisti, R., and Cabello, M.: The impact of long-range-transport on PM1 and PM2.5 at a Central Mediterranean site, Atmos. Environ., 71, 176–186, https://doi.org/10.1016/j.atmosenv.2013.02.006, 2013.
Petzold, A. and Schönlinner, M.: Multi-angle absorption photometry – a new method for the measurement of aerosol light absorption and atmospheric black carbon, J. Aerosol Sci., 35, 421–441, https://doi.org/10.1016/j.jaerosci.2003.09.005, 2004.
Petzold, A., Kramer, H., and Schonlinner, M.: Continuous measurement of atmospheric black carbon using a multi-angle absorption photometer, Environ. Sci. Pollut. Res., 9, 78–82, 2002.
Petzold, A., Schloesser, H., Sheridan, P. J., Arnott, W. P., Ogren, J. A., and Virkkula, A.: Evaluation of multiangle absorption photometry for measuring aerosol light absorption, Aerosol Sci. Tech., 39, 40–51, https://doi.org/10.1080/027868290901945, 2005.
Pieber, S. M., El Haddad, I., Slowik, J. G., Canagaratna, M. R., Jayne, J. T., Platt, S. M., Bozzetti, C., Daellenbach, K. R., Fröhlich, R., Vlachou, A., Klein, F., Dommen, J., Miljevic, B., Jiménez, J. L., Worsnop, D. R., Baltensperger, U., and Prévôt, A. S. H.: Inorganic Salt Interference on CO in Aerodyne AMS and ACSM Organic Aerosol Composition Studies, Environ. Sci. Technol., 50, 10494–10503, https://doi.org/10.1021/acs.est.6b01035, 2016.
Pokorná, P., Zíková, N., Vodička, P., Lhotka, R., Mbengue, S., Holubová Šmejkalová, A., Riffault, V., Ondráček, J., Schwarz, J., and Ždímal, V.: Chemically speciated mass size distribution, particle density, shape and origin of non-refractory PM1 measured at a rural background site in central Europe, Atmos. Chem. Phys., 22, 5829–5858, https://doi.org/10.5194/acp-22-5829-2022, 2022.
Poulain, L., Birmili, W., Canonaco, F., Crippa, M., Wu, Z. J., Nordmann, S., Spindler, G., Prévôt, A. S. H., Wiedensohler, A., and Herrmann, H.: Chemical mass balance of 300 °C non-volatile particles at the tropospheric research site Melpitz, Germany, Atmos. Chem. Phys., 14, 10145–10162, https://doi.org/10.5194/acp-14-10145-2014, 2014.
Poulain, L., Spindler, G., Grüner, A., Tuch, T., Stieger, B., van Pinxteren, D., Petit, J.-E., Favez, O., Herrmann, H., and Wiedensohler, A.: Multi-year ACSM measurements at the central European research station Melpitz (Germany) – Part 1: Instrument robustness, quality assurance, and impact of upper size cutoff diameter, Atmos. Meas. Tech., 13, 4973–4994, https://doi.org/10.5194/amt-13-4973-2020, 2020.
Robinson, E. S., Onasch, T. B., Worsnop, D., and Donahue, N. M.: Collection efficiency of α-pinene secondary organic aerosol particles explored via light-scattering single-particle aerosol mass spectrometry, Atmos. Meas. Tech., 10, 1139–1154, https://doi.org/10.5194/amt-10-1139-2017, 2017.
Rodríguez, S., Cuevas, E., González, Y., Ramos, R., Romero, P. M., Pérez, N., Querol, X., and Alastuey, A.: Influence of sea breeze circulation and road traffic emissions on the relationship between particle number, black carbon, PM1, PM2.5 and PM2.5−10 concentrations in a coastal city, Atmos. Environ., 42, 6523–6534, https://doi.org/10.1016/j.atmosenv.2008.04.022, 2008.
Rollins, A. W., Fry, J. L., Hunter, J. F., Kroll, J. H., Worsnop, D. R., Singaram, S. W., and Cohen, R. C.: Elemental analysis of aerosol organic nitrates with electron ionization high-resolution mass spectrometry, Atmos. Meas. Tech., 3, 301–310, https://doi.org/10.5194/amt-3-301-2010, 2010.
Rumsey, I. C. and Walker, J. T.: Application of an online ion-chromatography-based instrument for gradient flux measurements of speciated nitrogen and sulfur, Atmos. Meas. Tech., 9, 2581–2592, https://doi.org/10.5194/amt-9-2581-2016, 2016.
Rumsey, I. C., Cowen, K. A., Walker, J. T., Kelly, T. J., Hanft, E. A., Mishoe, K., Rogers, C., Proost, R., Beachley, G. M., Lear, G., Frelink, T., and Otjes, R. P.: An assessment of the performance of the Monitor for AeRosols and GAses in ambient air (MARGA): a semi-continuous method for soluble compounds, Atmos. Chem. Phys., 14, 5639–5658, https://doi.org/10.5194/acp-14-5639-2014, 2014.
Samek, L., Stegowski, Z., Styszko, K., Furman, L., Zimnoch, M., Skiba, A., Kistler, M., Kasper-Giebl, A., Rozanski, K., and Konduracka, E.: Seasonal variations of chemical composition of PM2.5 fraction in the urban area of Krakow, Poland: PMF source attribution, Air Qual. Atmos. Hlth., 13, 89–96, https://doi.org/10.1007/s11869-019-00773-x, 2020.
Sarti, E., Pasti, L., Rossi, M., Ascanelli, M., Pagnoni, A., Trombini, M., and Remelli, M.: The composition of PM1 and PM2.5 samples, metals and their water soluble fractions in the bologna area (Italy), Atmos. Pollut. Res., 6, 708–718, https://doi.org/10.5094/APR.2015.079, 2015.
Schaap, M., Spindler, G., Schulz, M., Acker, K., Maenhaut, W., Berner, A., Wieprecht, W., Streit, N., Müller, K., Brüggemann, E., Chi, X., Putaud, J. P., Hitzenberger, R., Puxbaum, H., Baltensperger, U., and ten Brink, H.: Artefacts in the sampling of nitrate studied in the “iNTERCOMP” campaigns of EUROTRAC-AEROSOL, Atmos. Environ., 38, 6487–6496, https://doi.org/10.1016/j.atmosenv.2004.08.026, 2004.
Schaap, M., Weijers, E. P., Mooibroek, D., Nguyen, L., and Hoogerbrugge, R.: Composition and origin of particulate matter in the Netherlands, RIVM Rapp., Report 500099007/2010, ISSN: 1875-2314 (online), 2010.
Schlag, P., Kiendler-Scharr, A., Blom, M. J., Canonaco, F., Henzing, J. S., Moerman, M., Prévôt, A. S. H., and Holzinger, R.: Aerosol source apportionment from 1-year measurements at the CESAR tower in Cabauw, the Netherlands, Atmos. Chem. Phys., 16, 8831–8847, https://doi.org/10.5194/acp-16-8831-2016, 2016.
Schlag, P., Rubach, F., Mentel, T. F., Reimer, D., Canonaco, F., Henzing, J. S., Moerman, M., Otjes, R., Prévôt, A. S. H., Rohrer, F., Rosati, B., Tillmann, R., Weingartner, E., and Kiendler-Scharr, A.: Ambient and laboratory observations of organic ammonium salts in PM1, Faraday Discuss., 200, 331–351, https://doi.org/10.1039/c7fd00027h, 2017.
Schmid, H., Laskus, L., Jürgen Abraham, H., Baltensperger, U., Lavanchy, V., Bizjak, M., Burba, P., Cachier, H., Crow, D., Chow, J., Gnauk, T., Even, A., Ten Brink, H. M., Giesen, K. P., Hitzenberger, R., Hueglin, C., Maenhaut, W., Pio, C., Carvalho, A., Putaud, J. P., Toom-Sauntry, D., and Puxbaum, H.: Results of the “carbon conference” international aerosol carbon round robin test stage I, Atmos. Environ., 35, 2111–2121, https://doi.org/10.1016/S1352-2310(00)00493-3, 2001.
Slanina, J., Ten Brink, H. M., Otjes, R. P., Even, A., Jongejan, P., Khlystov, A., Waijers-Ijpelaan, A., Hu, M., and Lu, Y.: The continuous analysis of nitrate and ammonium in aerosols by the steam jet aerosol collector (SJAC): extension and validation of the methodology, Atmos. Environ., 35, 2319–2330, https://doi.org/10.1016/S1352-2310(00)00556-2, 2001.
Southerland, V. A., Brauer, M., Mohegh, A., Hammer, M. S., van Donkelaar, A., Martin, R. V., Apte, J. S., and Anenberg, S. C.: Global urban temporal trends in fine particulate matter (PM2.5) and attributable health burdens: estimates from global datasets, Lancet Planet Health, 6, e139–e146, https://doi.org/10.1016/S2542-5196(21)00350-8, 2022.
Stieger, B., Spindler, G., Fahlbusch, B., Müller, K., Grüner, A., Poulain, L., Thöni, L., Seitler, E., Wallasch, M., and Herrmann, H.: Measurements of PM10 ions and trace gases with the online system MARGA at the research station Melpitz in Germany – A five-year study, J. Atmos. Chem., 75, 33–70, https://doi.org/10.1007/s10874-017-9361-0, 2018.
Sun, Y., He, Y., Kuang, Y., Xu, W., Song, S., Ma, N., Tao, J., Cheng, P., Wu, C., Su, H., Cheng, Y., Xie, C., Chen, C., Lei, L., Qiu, Y., Fu, P., Croteau, P., and Worsnop, D. R.: Chemical Differences Between PM1 and PM2.5 in Highly Polluted Environment and Implications in Air Pollution Studies, Geophys. Res. Lett., 47, e2019GL086288, https://doi.org/10.1029/2019GL086288, 2020.
Sun, Y.-L., Zhang, Q., Schwab, J. J., Demerjian, K. L., Chen, W.-N., Bae, M.-S., Hung, H.-M., Hogrefe, O., Frank, B., Rattigan, O. V., and Lin, Y.-C.: Characterization of the sources and processes of organic and inorganic aerosols in New York city with a high-resolution time-of-flight aerosol mass apectrometer, Atmos. Chem. Phys., 11, 1581–1602, https://doi.org/10.5194/acp-11-1581-2011, 2011.
ten Brink, H., Otjes, R., Jongejan, P., and Slanina, S.: An instrument for semi-continuous monitoring of the size-distribution of nitrate, ammonium, sulphate and chloride in aerosol, Atmos. Environ., 41, 2768–2779, https://doi.org/10.1016/j.atmosenv.2006.11.041, 2007.
ten Brink, H., Otjes, R., Jongejan, P., and Kos, G.: Monitoring of the ratio of nitrate to sulphate in size-segregated submicron aerosol in the Netherlands, Atmos. Res., 92, 270–276, https://doi.org/10.1016/j.atmosres.2008.12.003, 2009.
Turpin, B. J. and Lim, H. J.: Species contributions to PM2.5 mass concentrations: Revisiting common assumptions for estimating organic mass, Aerosol Sci. Tech., 35, 602–610, https://doi.org/10.1080/02786820119445, 2001.
Turpin, B. J., Huntzicker, J. J., and Hering, S. V.: Investigation of organic aerosol sampling artifacts in the los angeles basin, Atmos. Environ., 28, 3061–3071, https://doi.org/10.1016/1352-2310(94)00133-6, 1994.
Vecchi, R., Marcazzan, G., Valli, G., Ceriani, M., and Antoniazzi, C.: The role of atmospheric dispersion in the seasonal variation of PM1 and PM2.5 concentration and composition in the urban area of Milan (Italy), Atmos. Environ., 38, 4437–4446, https://doi.org/10.1016/j.atmosenv.2004.05.029, 2004.
Wang, Y., Wang, Q., Ye, J., Yan, M., Qin, Q., Prévôt, A. S. H., and Cao, J.: A Review of Aerosol Chemical Composition and Sources in Representative Regions of China during Wintertime, Atmosphere-Basel, 10, 277, https://doi.org/10.3390/atmos10050277, 2019.
Wichink Kruit, R. J., Aben, J., de Vries, W., Sauter, F., van der Swaluw, E., van Zanten, M. C., and van Pul, W. A. J.: Modelling trends in ammonia in the Netherlands over the period 1990–2014, Atmos. Environ., 154, 20–30, https://doi.org/10.1016/j.atmosenv.2017.01.031, 2017.
Wiedensohler, A., Birmili, W., Nowak, A., Sonntag, A., Weinhold, K., Merkel, M., Wehner, B., Tuch, T., Pfeifer, S., Fiebig, M., Fjäraa, A. M., Asmi, E., Sellegri, K., Depuy, R., Venzac, H., Villani, P., Laj, P., Aalto, P., Ogren, J. A., Swietlicki, E., Williams, P., Roldin, P., Quincey, P., Hüglin, C., Fierz-Schmidhauser, R., Gysel, M., Weingartner, E., Riccobono, F., Santos, S., Grüning, C., Faloon, K., Beddows, D., Harrison, R., Monahan, C., Jennings, S. G., O'Dowd, C. D., Marinoni, A., Horn, H.-G., Keck, L., Jiang, J., Scheckman, J., McMurry, P. H., Deng, Z., Zhao, C. S., Moerman, M., Henzing, B., de Leeuw, G., Löschau, G., and Bastian, S.: Mobility particle size spectrometers: harmonization of technical standards and data structure to facilitate high quality long-term observations of atmospheric particle number size distributions, Atmos. Meas. Tech., 5, 657–685, https://doi.org/10.5194/amt-5-657-2012, 2012.
Williams, L. R., Gonzalez, L. A., Peck, J., Trimborn, D., McInnis, J., Farrar, M. R., Moore, K. D., Jayne, J. T., Robinson, W. A., Lewis, D. K., Onasch, T. B., Canagaratna, M. R., Trimborn, A., Timko, M. T., Magoon, G., Deng, R., Tang, D., de la Rosa Blanco, E., Prévôt, A. S. H., Smith, K. A., and Worsnop, D. R.: Characterization of an aerodynamic lens for transmitting particles greater than 1 micrometer in diameter into the Aerodyne aerosol mass spectrometer, Atmos. Meas. Tech., 6, 3271–3280, https://doi.org/10.5194/amt-6-3271-2013, 2013.
WHO (World Health Organization): WHO global air quality guidelines: particulate matter (PM2.5 and PM10), ozone, nitrogen dioxide, sulfur dioxide and carbon monoxide, World Health Organization, ISBN: 9240034226, 2021.
Wyers, G. P., Otjes, R. P., and Slanina, J.: A continuous-flow denuder for the measurement of ambient concentrations and surface-exchange fluxes of ammonia, Atmos. Environ. A-Gen., 27, 2085–2090, https://doi.org/10.1016/0960-1686(93)90280-C, 1993.
Xu, W., Croteau, P., Williams, L., Canagaratna, M., Onasch, T., Cross, E., Zhang, X., Robinson, W., Worsnop, D., and Jayne, J.: Laboratory characterization of an aerosol chemical speciation monitor with PM2.5 measurement capability, Aerosol Sci. Tech., 51, 69–83, https://doi.org/10.1080/02786826.2016.1241859, 2017.
Yang, H. and Yu, J. Z.: Uncertainties in charring correction in the analysis of elemental and organic carbon in atmospheric particles by thermal/optical methods, Environ. Sci. Technol., 36, 5199–5204, https://doi.org/10.1021/es025672z, 2002.
Yao, P., Ni, H., Paul, D., Masalaite, A., Huang, R.-J., Meijer, H. A. J., and Dusek, U.: An automated method for thermal-optical separation of aerosol organic/elemental carbon for 13C analysis at the sub-µgC level: A comprehensive assessment, Sci. Total Environ., 804, 150031, https://doi.org/10.1016/j.scitotenv.2021.150031, 2022.
Zanatta, M., Gysel, M., Bukowiecki, N., Müller, T., Weingartner, E., Areskoug, H., Fiebig, M., Yttri, K. E., Mihalopoulos, N., Kouvarakis, G., Beddows, D., Harrison, R. M., Cavalli, F., Putaud, J. P., Spindler, G., Wiedensohler, A., Alastuey, A., Pandolfi, M., Sellegri, K., Swietlicki, E., Jaffrezo, J. L., Baltensperger, U., and Laj, P.: A European aerosol phenomenology-5: Climatology of black carbon optical properties at 9 regional background sites across Europe, Atmos. Environ., 145, 346–364, https://doi.org/10.1016/j.atmosenv.2016.09.035, 2016.
Zenker, K., Sirignano, C., Riccio, A., Chianese, E., Calfapietra, C., Prati, M. V., Masalaite, A., Remeikis, V., Mook, E., Meijer, H. A. J., and Dusek, U.: δ13C signatures of organic aerosols: Measurement method evaluation and application in a source study, J. Aerosol Sci., 145, 105534, https://doi.org/10.1016/j.jaerosci.2020.105534, 2020.
Zhang, Y., Tang, L., Croteau, P. L., Favez, O., Sun, Y., Canagaratna, M. R., Wang, Z., Couvidat, F., Albinet, A., Zhang, H., Sciare, J., Prévôt, A. S. H., Jayne, J. T., and Worsnop, D. R.: Field characterization of the PM2.5 Aerosol Chemical Speciation Monitor: insights into the composition, sources, and processes of fine particles in eastern China, Atmos. Chem. Phys., 17, 14501–14517, https://doi.org/10.5194/acp-17-14501-2017, 2017.
Zhang, Y., Lang, J., Cheng, S., Li, S., Zhou, Y., Chen, D., Zhang, H., and Wang, H.: Chemical composition and sources of PM1 and PM2.5 in Beijing in autumn, Sci. Total Environ., 630, 72–82, https://doi.org/10.1016/j.scitotenv.2018.02.151, 2018.
Zhao, Q., Huo, J., Yang, X., Fu, Q., Duan, Y., Liu, Y., Lin, Y., and Zhang, Q.: Chemical characterization and source identification of submicron aerosols from a year-long real-time observation at a rural site of Shanghai using an Aerosol Chemical Speciation Monitor, Atmos. Res., 246, 105154, https://doi.org/10.1016/j.atmosres.2020.105154, 2020.
Zheng, Y., Cheng, X., Liao, K., Li, Y., Li, Y. J., Huang, R.-J., Hu, W., Liu, Y., Zhu, T., Chen, S., Zeng, L., Worsnop, D. R., and Chen, Q.: Characterization of anthropogenic organic aerosols by TOF-ACSM with the new capture vaporizer, Atmos. Meas. Tech., 13, 2457–2472, https://doi.org/10.5194/amt-13-2457-2020, 2020.
http://www.actris.net/ (last access: 20 July 2022)
https://www.icos-cp.eu/ (last access: 20 July 2022)
https://ruisdael-observatory.nl/ (last access: 20 July 2022)
https://dataplatform.knmi.nl/ (last access: 20 July 2022)