the Creative Commons Attribution 4.0 License.
the Creative Commons Attribution 4.0 License.
 | 15 Mar 2024
Spring tropical cyclones modulate near-surface isotopic compositions of atmospheric water vapour in Kathmandu, Nepal
Niranjan Adhikari
Aibin Zhao
Tianli Xu
Manli Chen
Xiaowei Niu
Tandong Yao
While westerlies are recognized as a significant moisture transport in Nepal during the pre-monsoon season, precipitation is also attributed to moisture from cyclones originating in the Bay of Bengal (BoB) or the Arabian Sea (AS). Tropical cyclones exhibit negative isotopic values in both precipitation and atmospheric water vapour; however, the factors influencing isotopic fractionation during tropical cyclones remain poorly understood. We present the results of continuous measurements of the isotopic composition of atmospheric water vapour (δ18Ov, δDv, and d-excessv) in Kathmandu from 7 May to 7 June 2021 during two pre-monsoon cyclones: cyclone Tauktae, formed over the Arabian Sea, and cyclone Yaas, formed over the Bay of Bengal. Our study reveals that tropical cyclones originating from the BoB and the AS during the pre-monsoon season modulate isotopic signals of near-surface atmospheric water vapour in Nepal. Comparing conditions before and after, we observed a significant depletion of δ18Ov and δDv during both cyclones, attributed to changes in moisture sources (local vs. marine). Convective activity plays a pivotal role in the variability of δ18Ov and δDv during both cyclones, confirmed by the spatial variations of outgoing longwave radiation (OLR) and regional precipitation during both cyclones. We also found a significant negative correlation between δ18Ov and/or δDv and rainfall amount along the trajectories during cyclone Tauktae, probably resulting from integrated upstream processes linked to the earlier Rayleigh distillation of water vapour via rainfall rather than local rainfall. The decrease in δ18Ov and/or δDv during cyclone Yaas is associated with the intensified convection and moisture convergence at the measurement site, while the lower cloud top temperatures (CTTs) and lower cloud top pressure (CTP) during intense convection contribute to higher d-excessv values during the final stage of cyclone Yaas. This characteristic is missing during cyclone Tauktae. Our results shed light on key processes governing the isotopic composition of atmospheric water vapour in Kathmandu with implications for the monsoon moisture transport and paleoclimate reconstructions of tropical cyclone activity.
- Article
(14968 KB) - Full-text XML
-
Supplement
(2152 KB) - BibTeX
- EndNote


Although the Indian summer monsoon accounts for more than 80 % of annual rainfall in Nepal, agricultural activities also rely on precipitation in the pre-monsoon season. Pre-monsoonal rainfall in Nepal is often associated with cyclonic events that provide precipitation to support the timely planting of monsoonal crops. Previous studies have suggested that extreme precipitation in Nepal is mostly fuelled by moisture from the Arabian Sea (AS) and the Bay of Bengal (BoB) (Bohlinger et al., 2017; Boschi and Lucarini, 2019). Higher sea surface temperatures and the westward movement of tropical cyclones formed over the western Pacific result in cyclones being formed over the BoB and the AS (Mohapatra et al., 2016). The number of cyclones in the AS has increased recently compared to the number of cyclones in the BoB (Pandya et al., 2021). According to the International Best Track Archive for Climate Stewardship (IBTrACS) project (Knapp et al., 2010), in 2019, three cyclones originated in the BoB, and five cyclones originated in the AS, both due to a rise in sea surface temperature lengthening the cyclone decay period (Li and Chakraborty, 2020). Usually, the impact of cyclones formed over the AS is restricted to the nearest coastal regions. However, in recent years, this appears to have changed as cyclones are forming back to back over the AS and affecting the entire Indian subcontinent, including surrounding regions (Li and Chakraborty, 2020). Cyclone Tauktae affected the livelihoods of people both near the coast and further inland during the pre-monsoon season of 2021 (Pandya et al., 2021). The impacts of cyclone Yaas after cyclone Tauktae were also felt in Nepal, where it triggered flooding and landslides in several parts of the country (https://floodlist.com/asia/nepal-flood-landslide-may-2021/, last access: 8 September 2023). As both cyclones hit in short succession, this led to severe agricultural damage in several parts of India at a critical time when farmers were preparing to sow their rice paddies ahead of the monsoon season (https://reliefweb.int/organization/acaps, last access: 8 September 2023). In Nepal, the damage due to Yaas was mostly limited to the Terai regions, which experienced intense and continuous rainfall (https://kathmandupost.com/, last access: 8 September 2023). Moisture flux associated with cyclones generally extends over a large area and causes moderate to heavy precipitation along the cyclone path and on the nearest land mass (Chan et al., 2022; Rajeev and Mishra, 2022). It is therefore essential to understand the moisture transport processes of these extreme rainfall events in relation to atmospheric water vapour.
With climate change, the amount of water vapour in the atmosphere is also expected to increase, creating scientific interest in the impact of atmospheric water vapour on changing moisture patterns (Hoffmann et al., 2005). The isotopic composition of atmospheric water vapour (δ18Ov, δDv, and d-excessv) contains comprehensive information about the history of moisture exchange (Noone, 2012; Payne et al., 2007; Risi et al., 2008; Worden et al., 2007). Several studies have shown that the isotopic composition is an effective indicator of cyclone activity (Munksgaard et al., 2015; Sun et al., 2022), including cyclone evolution and structure (Lawrence et al., 2002). The atmospheric water vapour and precipitation associated with tropical cyclones tend to have extremely depleted isotopic compositions compared to monsoonal rain (Chen et al., 2021; Jackisch et al., 2022; Munksgaard et al., 2015; Sánchez-Murillo et al., 2019), which may be due to the high condensation efficiency and substantial fractionation associated with cyclones. A few studies found a systematic depletion of heavy isotopes towards the cyclone eye (Lawrence et al., 2002, 1998; Lawrence and Gedzelman, 1996; Sun et al., 2022; Xu et al., 2019). For example, during cyclone Shanshan, Fudeyasu et al. (2008) observed that isotopic depletion of precipitation and water vapour increased radially inward in the cyclone's outer region, likely due to a rainout effect. A study conducted in northeastern Australia during cyclone Ita in April 2014 underlined the role of synoptic-scale meteorological settings in determining the isotopic variability of atmospheric water vapour (Munksgaard et al., 2015). In Fuzhou, China, Xu et al. (2019) reported a significant depletion of typhoon rain δ18O related to the combined effect of large-scale convection, high condensation efficiency, and recycling of isotopically depleted vapour in the rain shield area. Sánchez-Murillo et al. (2019) highlighted the role of convective and stratiform activity, as well as precipitation type and amount. The impact of high stratiform fractions and deep convection on isotopic depletion of precipitation during typhoon Lekima was confirmed by Han et al. (2021).
Although several studies have examined the isotopic variation of event-based precipitation in Nepal (Acharya et al., 2020; Adhikari et al., 2020; Chhetri et al., 2014), there remains a knowledge gap regarding the isotopic response of atmospheric water vapour during cyclone events. We present for the first time the evolution of the isotopic composition of atmospheric water vapour (δ18Ov, δDv, and d-excessv) in Kathmandu during two pre-monsoon cyclone events. Isotopic data were collected in 2021, from 1 week before to 1 week after the cyclones. A substantial influence of these cyclone events over the sampling site was apparent for several days in terms of the isotopic composition of atmospheric water vapour, showcasing a marked depletion in comparison to normal days. This allowed us to scrutinize fluctuations in isotopic composition with a high temporal resolution and to investigate the atmospheric processes associated with cyclone events that lead to significant depletion of isotopic composition at diurnal scales.
2.1 Site description
The Kathmandu station lies on the southern slope of the Himalayas (27°42′ N, 85°20′ E) at an altitude of approximately 1400 m above sea level. Based on an 18-year-long record from the Department of Hydrology and Meteorology, Government of Nepal (2001 to 2018), this region has an average annual temperature of 19 °C and an average annual precipitation amount of about 1500 mm, with ∼ 78 % of the annual rainfall occurring in the monsoon season from June to September (Adhikari et al., 2020). About 16 % of annual rainfall in Kathmandu occurs in the pre-monsoon season (March to May), with air temperatures ranging from 13 to 28 °C and an average relative humidity (RH) of 67 %. Advection of the southern branch of westerlies and evaporation from nearby waterbodies are the main contributors to pre-monsoonal precipitation (Yu et al., 2016; Chhetri et al., 2014). These arid westerlies resulted in diminished temperature and relative humidity (RH) within the region, while a substantial presence of moisture was observed over extensive areas encompassing the BoB, the AS, India, and surrounding regions, including our sampling site, during our study period. Figure S1 in the Supplement shows the elevated specific humidity levels at 850 hPa from 7 May to 7 June 2021.
2.2 The evolution of cyclones Tauktae and Yaas and weather conditions at Kathmandu
Cyclone Tauktae developed as a tropical disturbance on 13 May 2021 over the AS, evolved into a deep depression by 14 May, moved north, and gradually intensified before turning into a cyclonic storm with wind speeds reaching 75 km h−1 on that same day (Pandya et al., 2021). After making landfall in the Gir-Somnath district of Gujarat, Tauktae continued to strengthen and was classified as an extremely severe cyclonic storm on 17 May, reaching maximum wind speeds of 185 km h−1 (Verma and Gupta, 2021; Pandya et al., 2021). Tauktae weakened into a low depression on 18 May 2021 at 20:30 Indian local time (ILT) and finally dissipated 1 d later. Due to its large convective area, it brought heavy rainfall to different regions of India and Nepal.
The signal of cyclone Tauktae was first detected at the Kathmandu site on 19 May at approximately 03:00 local time (LT), followed by light drizzle. The recorded air temperature was about 22 °C, and the relative humidity (RH) was approximately 72 %. Within 16 h, the RH increased from 72 % to 91 %, while the temperature dropped from 22 to around 19 °C. The maximum RH and minimum temperature were observed on 21 May around 04:00 LT, reaching 92 % and 17 °C, respectively.
Cyclone Yaas started out as a depression over the BoB on 22 May 2021 at 08:30 ILT and gradually intensified into a deep depression before turning into a cyclonic storm on 24 May at 05:30 ILT as it moved northeast (Paul and Chowdhury, 2021). The corresponding wind speed and central pressure were recorded as 65 km h−1 and 990 hPa, respectively. On 24 May, around 23:30 ILT, it intensified into a severe cyclonic storm with wind speeds ranging from 92 to 111 km h−1 before becoming a very severe cyclonic storm on 25 May at 17:30 ILT, with wind speeds from 120 to 139 km h−1. It made landfall north of Odisha on 26 May with maximum sustained wind speeds of 130 to 140 km h−1 and progressively weakened into a depression on 27 May before dissipating over northern India on 28 May.
The Kathmandu weather station recorded a total of 59.6 mm of precipitation during cyclone Yaas. Intermittent small patches of rainfall commenced on 25 May at 11:00 LT. The main cyclone event occurred from 26 May at 01:00 LT to 29 May at 01:00 LT. Throughout this period, the ground-level RH fluctuated between 84 % and 93 %, while surface temperature varied between 18 and 22 °C. Notably, all RH values exceeded 80 % from 25 May at around 22:00 LT to 29 May at 10:00 LT.
Wind speeds, pressure, and cyclone eye location information (3 h resolution) were retrieved from the best track data of tropical cyclonic disturbances over the northern Indian Ocean (available at https://rsmcnewdelhi.imd.gov.in/, last access: 20 January 2024), monitored by the India Meteorological Department (IMD). The latter was used to calculate the spatial distance between the cyclone's eye and our measurement location. Figure 1 illustrates the intensity and cumulative rainfall along the paths of the cyclones. A characteristic of both cyclones is the occurrence of rainout along their trajectories, persisting as they move inland.
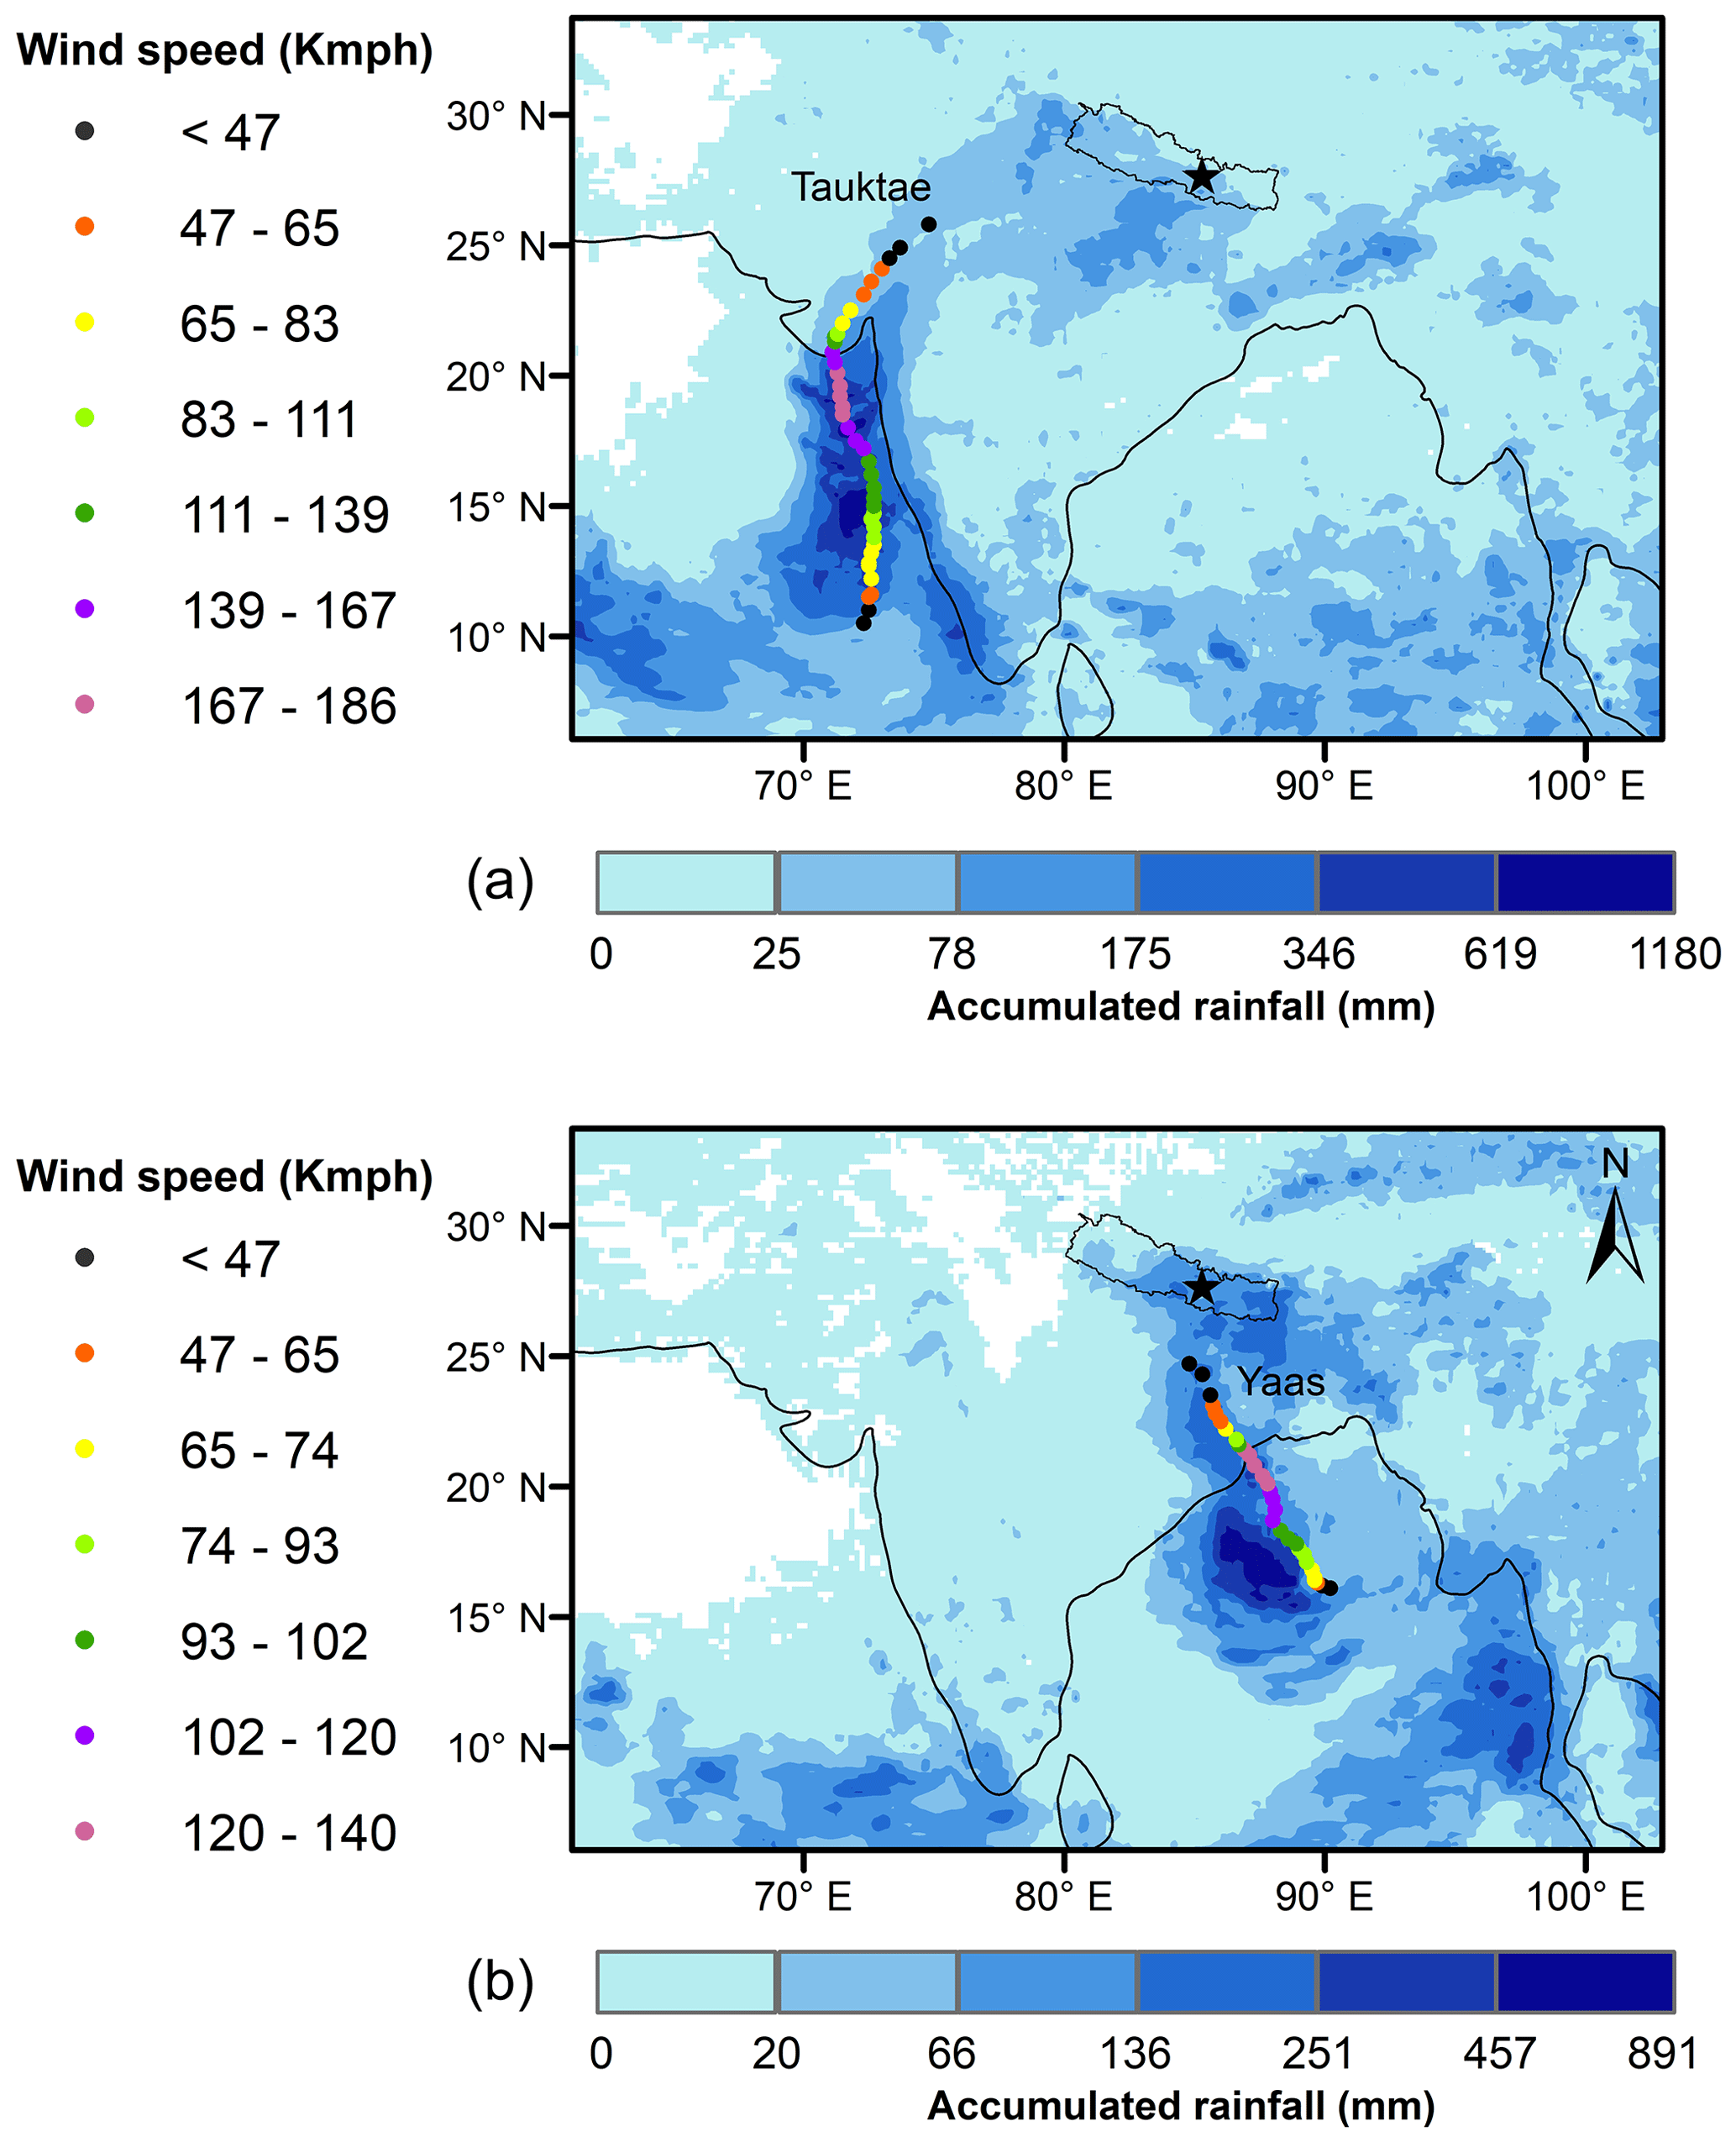
Figure 1The intensity and track of cyclones Tauktae (a) and Yaas (b), along with accumulated rainfall during Tauktae (from 14 to 20 May 2021) and Yaas (24 to 28 May 2021). The intensity and track of cyclones were retrieved from the best track data of tropical cyclonic disturbance over the north Indian Ocean, monitored by IMD, and rainfall data were retrieved from the Integrated Multi-satellite Retrievals provided by the Global Precipitation Measurement programme (GPM, IMERG dataset).
2.3 Isotope measurements
Near-surface δ18Ov and δDv were measured continuously using a Picarro L2130-i analyser based on wavelength-scanned cavity ring-down spectroscopy (WS-CRDS) (Brand et al., 2009), located at the Kathmandu Centre for Research and Education (KCRE), Nepal. The sampling inlet consisting of a heated copper tube, mounted 7 m above the ground and protected with a plastic hood, and a 10 L min−1 pump transported the sample from the inlet to the analyser. The automated standard delivery module (SDM) was used for calibration, with each calibration made using two reference standards calibrated against Vienna Standard Mean Ocean Water (VSMOW), covering the isotopic ranges of ambient water vapour at Kathmandu. Each reference standard was measured continuously for a total of 75 min each day at three different humidity levels (25 min per level). The dry air passed through Drierite™ desiccant (Merck, Germany) and was delivered to the Picarro analyser for standard measurements. The isotopic composition of atmospheric water vapour is reported as parts per thousand (‰) relative to VSMOW using
where δ∗ represents either δDv or δ18Ov, and RA and RS denote the ratios of heavy to light isotopes (18O 16O or D H) in the sample and standard, respectively (Kendall and Caldwell, 1998; Yoshimura, 2015). As suggested by Dansgaard (1964), deuterium excess (d-excessv=δDOv) is used as a tracer for moisture source conditions (Liu et al., 2008; Tian et al., 2001a, b). The detailed calibration procedures are outlined in the Supplement, with the humidity–isotope response function presented in Fig. S2 and all calibration data shown in Fig. S3.
We examined the hourly isotopic composition of atmospheric water vapour between 7 May and 7 June 2021, covering the Tauktae and Yaas cyclones with 1 week on either side.
2.4 Meteorological data
An automated weather station (AWS, Davis Vantage Pro2) continuously measured air temperature, relative humidity, dew point temperature, wind speed and direction, rainfall amount, surface pressure, etc. at 1 min intervals from 7 May to 7 June 2021.
We used the Integrated Multi-satellite Retrievals provided by the Global Precipitation Measurement programme (GPM, IMERG dataset) with a spatial resolution of 0.1° for latitude and longitude (Huffman et al., 2017) to analyse the regional rainfall intensity before, during, and after the cyclone events. These high-resolution data allow for the identification of convective rainfall areas and the passage of tropical cyclones (Jackisch et al., 2022). They have been used previously to depict cyclone tracks and associated rainfall intensities (Gaona et al., 2018; Jackisch et al., 2022; Villarini et al., 2011).
We further acquired data on outgoing longwave radiation (OLR), zonal and meridional winds, specific humidity, vertical velocity, pressure, vertical distribution of relative humidity, and temperature from ERA5 datasets (Hersbach et al., 2020). The data have a spatial resolution of 0.25° based on longitude–latitude grids (https://cds.climate.copernicus.eu/, last access: 22 November 2023). OLR data have already been used as an index of tropical convection (Liebmann and Smith, 1996). Additionally, we used cloud top pressure (CTP) and cloud top temperature (CTT) data from MERRA-2 reanalysis datasets retrieved from https://giovanni.gsfc.nasa.gov/ (last access: 28 November 2023), with a spatial resolution of 0.5° × 0.625°, as indicators of convective intensity.
2.5 Moisture backward trajectory analysis
To assess the influence of moisture transport history on the isotopic composition of atmospheric water vapour before, during, and after the cyclone events, we analysed 5 d moisture backward trajectories that terminated at the sampling site using the Hybrid Single-Particle Lagrangian Integrated Trajectory (HYSPLIT) model (Draxler and Hess, 1997). The Global Data Assimilation System (GDAS) with a spatial resolution of 1° (Kleist et al., 2009) was used to provide the meteorological forcing for the HYSPLIT model. Variations in specific humidity along the moisture trajectories were also calculated. Considering the variation in boundary layer height at Kathmandu during the study period, ranging from approximately 100 to 1170 m, and with the majority of the data falling below 600 m, we set the initial starting height for the moisture backward trajectories to 500 m above ground.
3.1 Isotope dynamics and their relation to local weather before, during, and after cyclone events
Significant variability was observed in isotopic composition before, during, and after the cyclones at Kathmandu station (Fig. 2 and Table 1). δ18Ov and δDv showed a sudden depletion of isotopic composition at the final stages of both cyclones, coinciding with RH reaching maximum values. The depletion was more pronounced during cyclone Yaas compared to cyclone Tauktae.
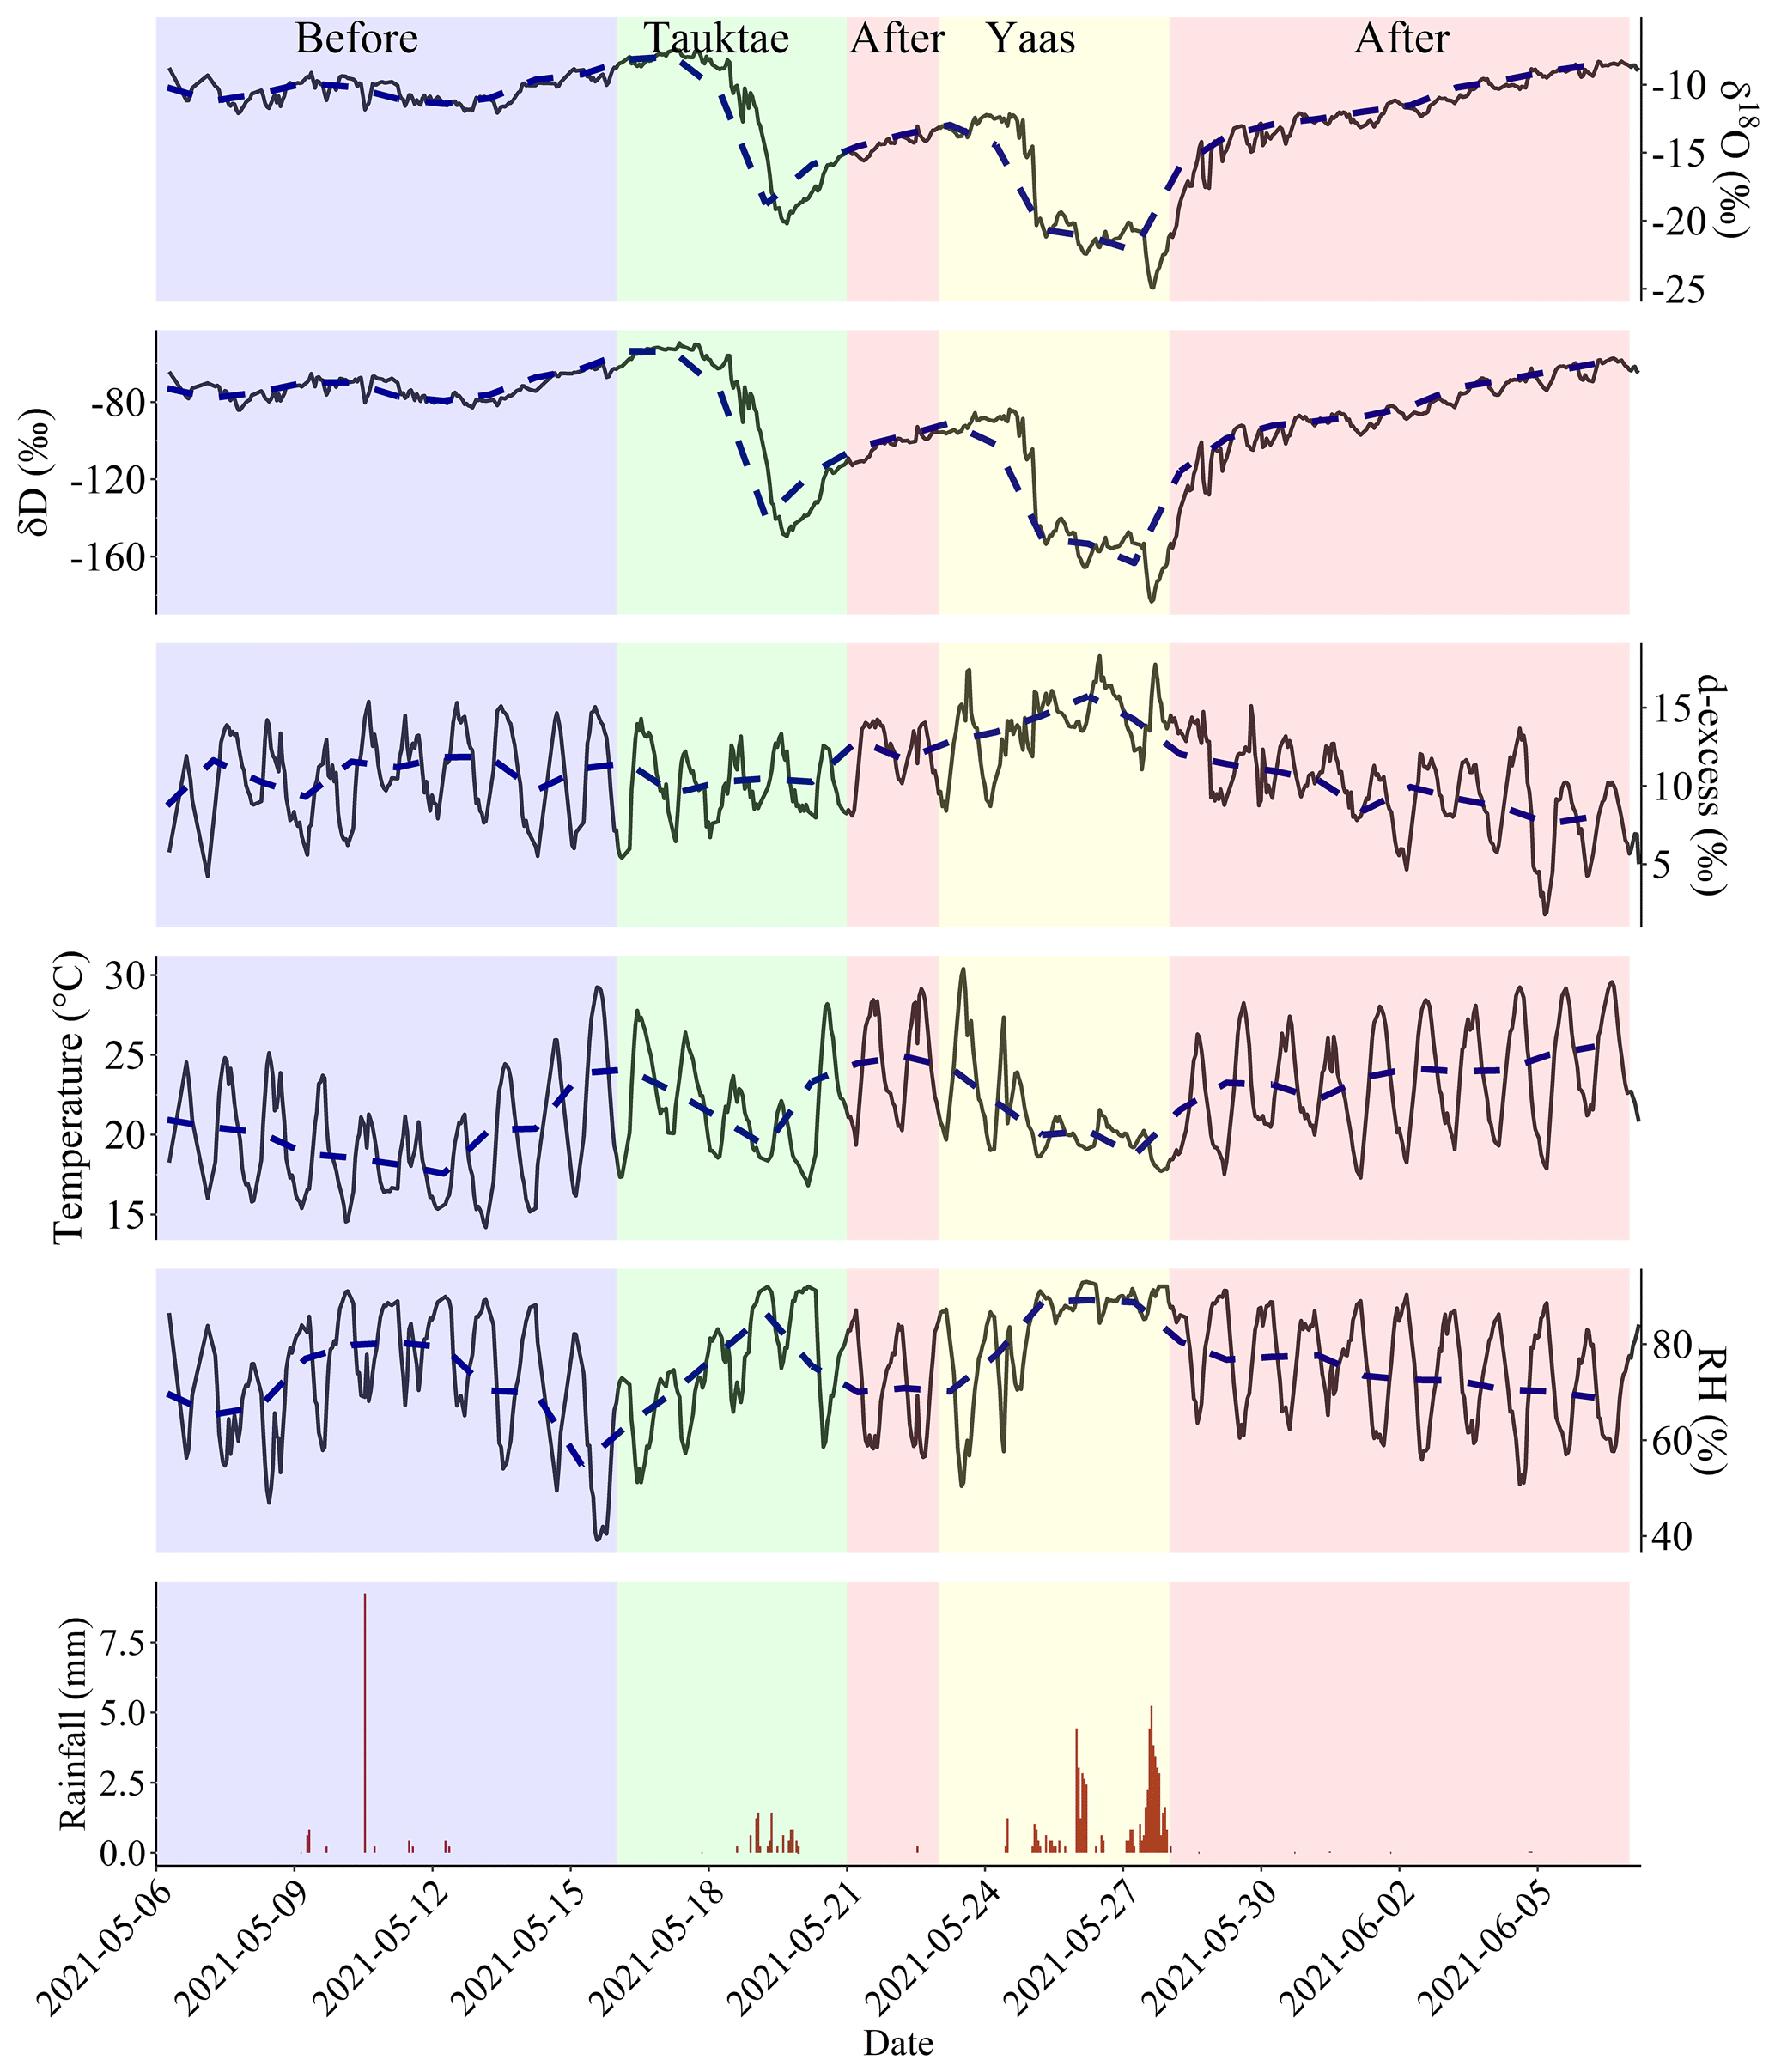
Figure 2Water vapour isotopic evolution (hourly averages) before, during, and after the Tauktae and Yaas cyclone events as indicated by the colour shading along with associated surface air temperature, relative humidity (RH), and rainfall amount. The dashed blue line represents daily average.
Table 1Descriptive statistics of δ18Ov, δDv, and d-excessv measured before, during, and after the cyclone events.
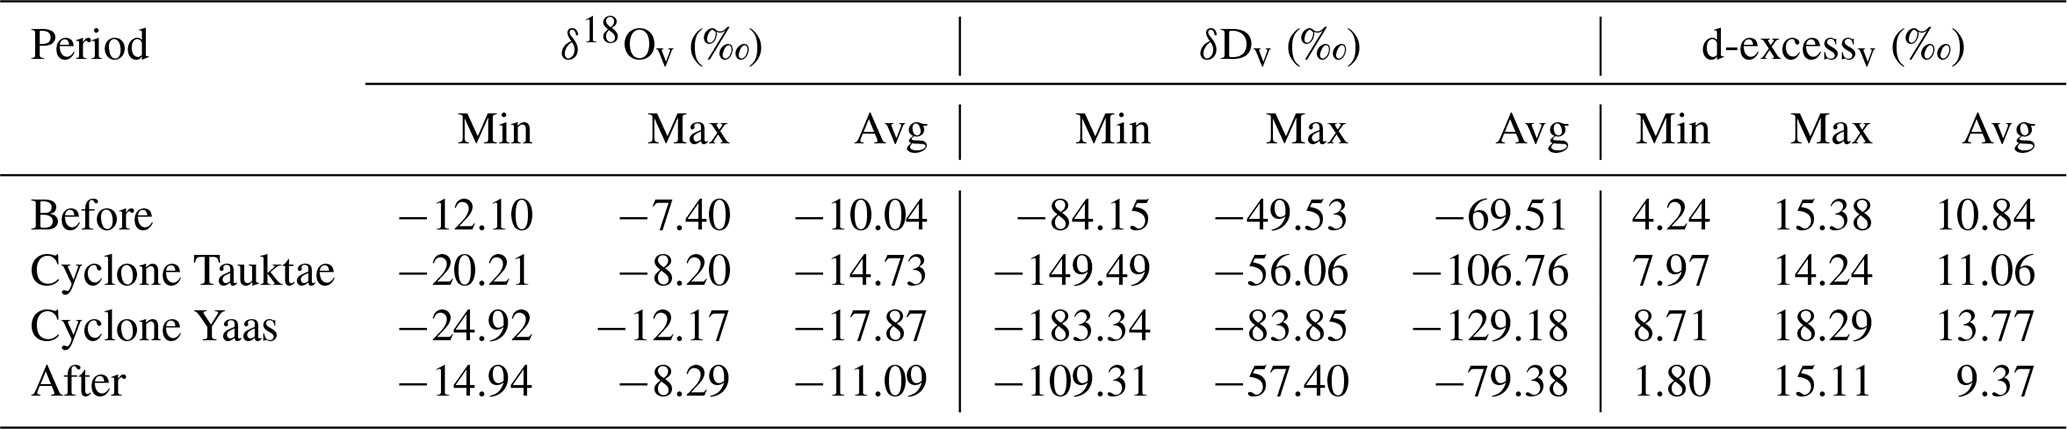
Before cyclone Tauktae, δ18Ov (δDv) varied from −7.40 ‰ (−49.53 ‰) to −12.10 ‰ (−84.15 ‰), with an average of −10.04 ‰ (−69.51 ‰), and d-excessv ranged from 4.24 ‰ to 15.38 ‰, with an average of 10.84 ‰. The isotopic composition clearly shows a downward trend as the remnant of cyclones passed over Kathmandu. δ18Ov decreased by over 12 ‰ from 14 to 20 May (Tauktae) and again between 24 and 29 May (Yaas), reaching minima for δ18Ov (δDv) of −20.21 ‰ (−149.49 ‰) and −24.92 ‰ (−183.34 ‰), respectively. During Tauktae, δ18Ov (δDv) varied from −8.20 ‰ (−56.06 ‰) to −20.21 ‰ (−149.49 ‰), with an average of −14.73 ‰ (−106.76 ‰), and during Yaas, the range was from −12.17 ‰ (−83.85 ‰) to −24.92 ‰ (−183.34 ‰), with an average of −17.87 ‰ (−129.18 ‰). Similarly, d-excessv during Tauktae varied from 7.97 ‰ to 14.24 ‰, with an average of 11.06 ‰, while during Yaas, it varied from 8.71 ‰ to 18.29 ‰, with an average of 13.77 ‰. After both cyclones had dissipated, δ18Ov (and δDv) started to recover pre-cyclone values of −8.29 ‰ to −14.94 ‰ (−57.40 ‰ to −109.31 ‰), with an average of −11.09 ‰ (−79.38 ‰), and d-excessv ranged between 1.80 ‰ and 15.11 ‰, with an average of 9.37 ‰.
The remnants of cyclone Tauktae caused light rain at Kathmandu, with a significant depletion of δ18Ov (δDv) of ∼ 8 ‰ (∼ 66 ‰) on 20 May compared to the previous day. From the formation of a depression over the AS on 14 May 2021 until the dissipation inland on 19 May, no significant variation in the isotopic composition in atmospheric water vapour at Kathmandu was observed (Fig. 2). After the dissipation, when the residual Tauktae vapour passed the Kathmandu site, producing light rains, δ18Ov and δDv began to decrease independently of the rainfall amount, starting on 19 May around 11:00 LT at −8.34 ‰ for δ18Ov and −56.06 ‰ for δDv and decreasing in 1 h to −10.12 ‰ and −68.41 ‰, respectively. This decrease continued for 24 h, reaching a minimum of −20.21 ‰ and −149.49 ‰ for δ18Ov and δDv, respectively, on 20 May at 12:00 LT. However, d-excessv did not show notable variations during the passage of cyclone Tauktae. δ18Ov and δDv remained depleted from 20 to 22 May.
On 24 May, cyclone Yaas formed over the BoB and followed a trajectory through northeastern India. The effect of cyclone Yaas on δ18Ov and δDv at Kathmandu was observed on 25 May with δ18Ov (δDv) dropping rapidly from −12.62 ‰ (−88.71 ‰) on 25 May at 20:00 LT to −15.07 ‰ (−106.22 ‰) just 1 h later. At the same time, d-excessv increased from 12.30 ‰ to 14.34 ‰. The depletion continued until 28 May, with a minimum δ18Ov (δDv) of −24.92 ‰ (−182.35 ‰) at 16:00 LT. Yaas had already weakened into a low-pressure area over Bihar in southeastern Uttar Pradesh, India. δ18Ov and δDv started to increase by about 10 ‰ on 29 May at 16:00 LT after Yaas had dissipated. From 25 to 29 May, d-excessv gradually increased, as opposed to δ18Ov and δDv, resulting in a negative correlation with δ18Ov and δDv of −0.60 and −0.55, respectively.
The passage of cyclones that had formed over the AS (Tauktae) and BoB (Yaas) caused significant depletion of the isotopic composition and led to cumulative rainfall of 9.2 mm (Tauktae) between 14 and 20 May 2021 and 59.6 mm (Yaas) between 25 and 28 May 2021 at our site. This depletion is due to cyclone-associated intense rainfall and agrees with previous studies (Krishnamurthy and Shukla, 2007; Rahul et al., 2016). Note that the above δ18Ov minimum (−24.92 ‰) observed during cyclone Yaas is similar to the minima observed in Bangalore, India (δ18Ov = −22.5 ‰) (Rahul et al., 2016), and Roorkee, India (δ18Ov = −25.35 ‰) (Saranya et al., 2018), when cyclones that evolved over the BoB passed near their sampling sites. These results indicate a similar oceanic source of moisture during cyclones. We discuss the influence of moisture sources in Sect. 3.2.
The relation between δ18Ov and δDv varies for the periods before, during, and after the cyclones, showing different slopes and intercepts with the local meteoric vapour line (LMVL) (Fig. 3). Before the first event, both the slope (5.85) and intercept (−12.12) are significantly lower, indicating the strong influence of non-equilibrium processes such as evaporation. During both cyclones, the slopes and intercepts resemble those of the global meteoric water line (GMWL: δD = 8 × δ18O + 10) (Fig. 3). After the cyclones, the slope and intercept decreased to 7.37 and 2.34, respectively, implying a change in moisture sources and evaporation.
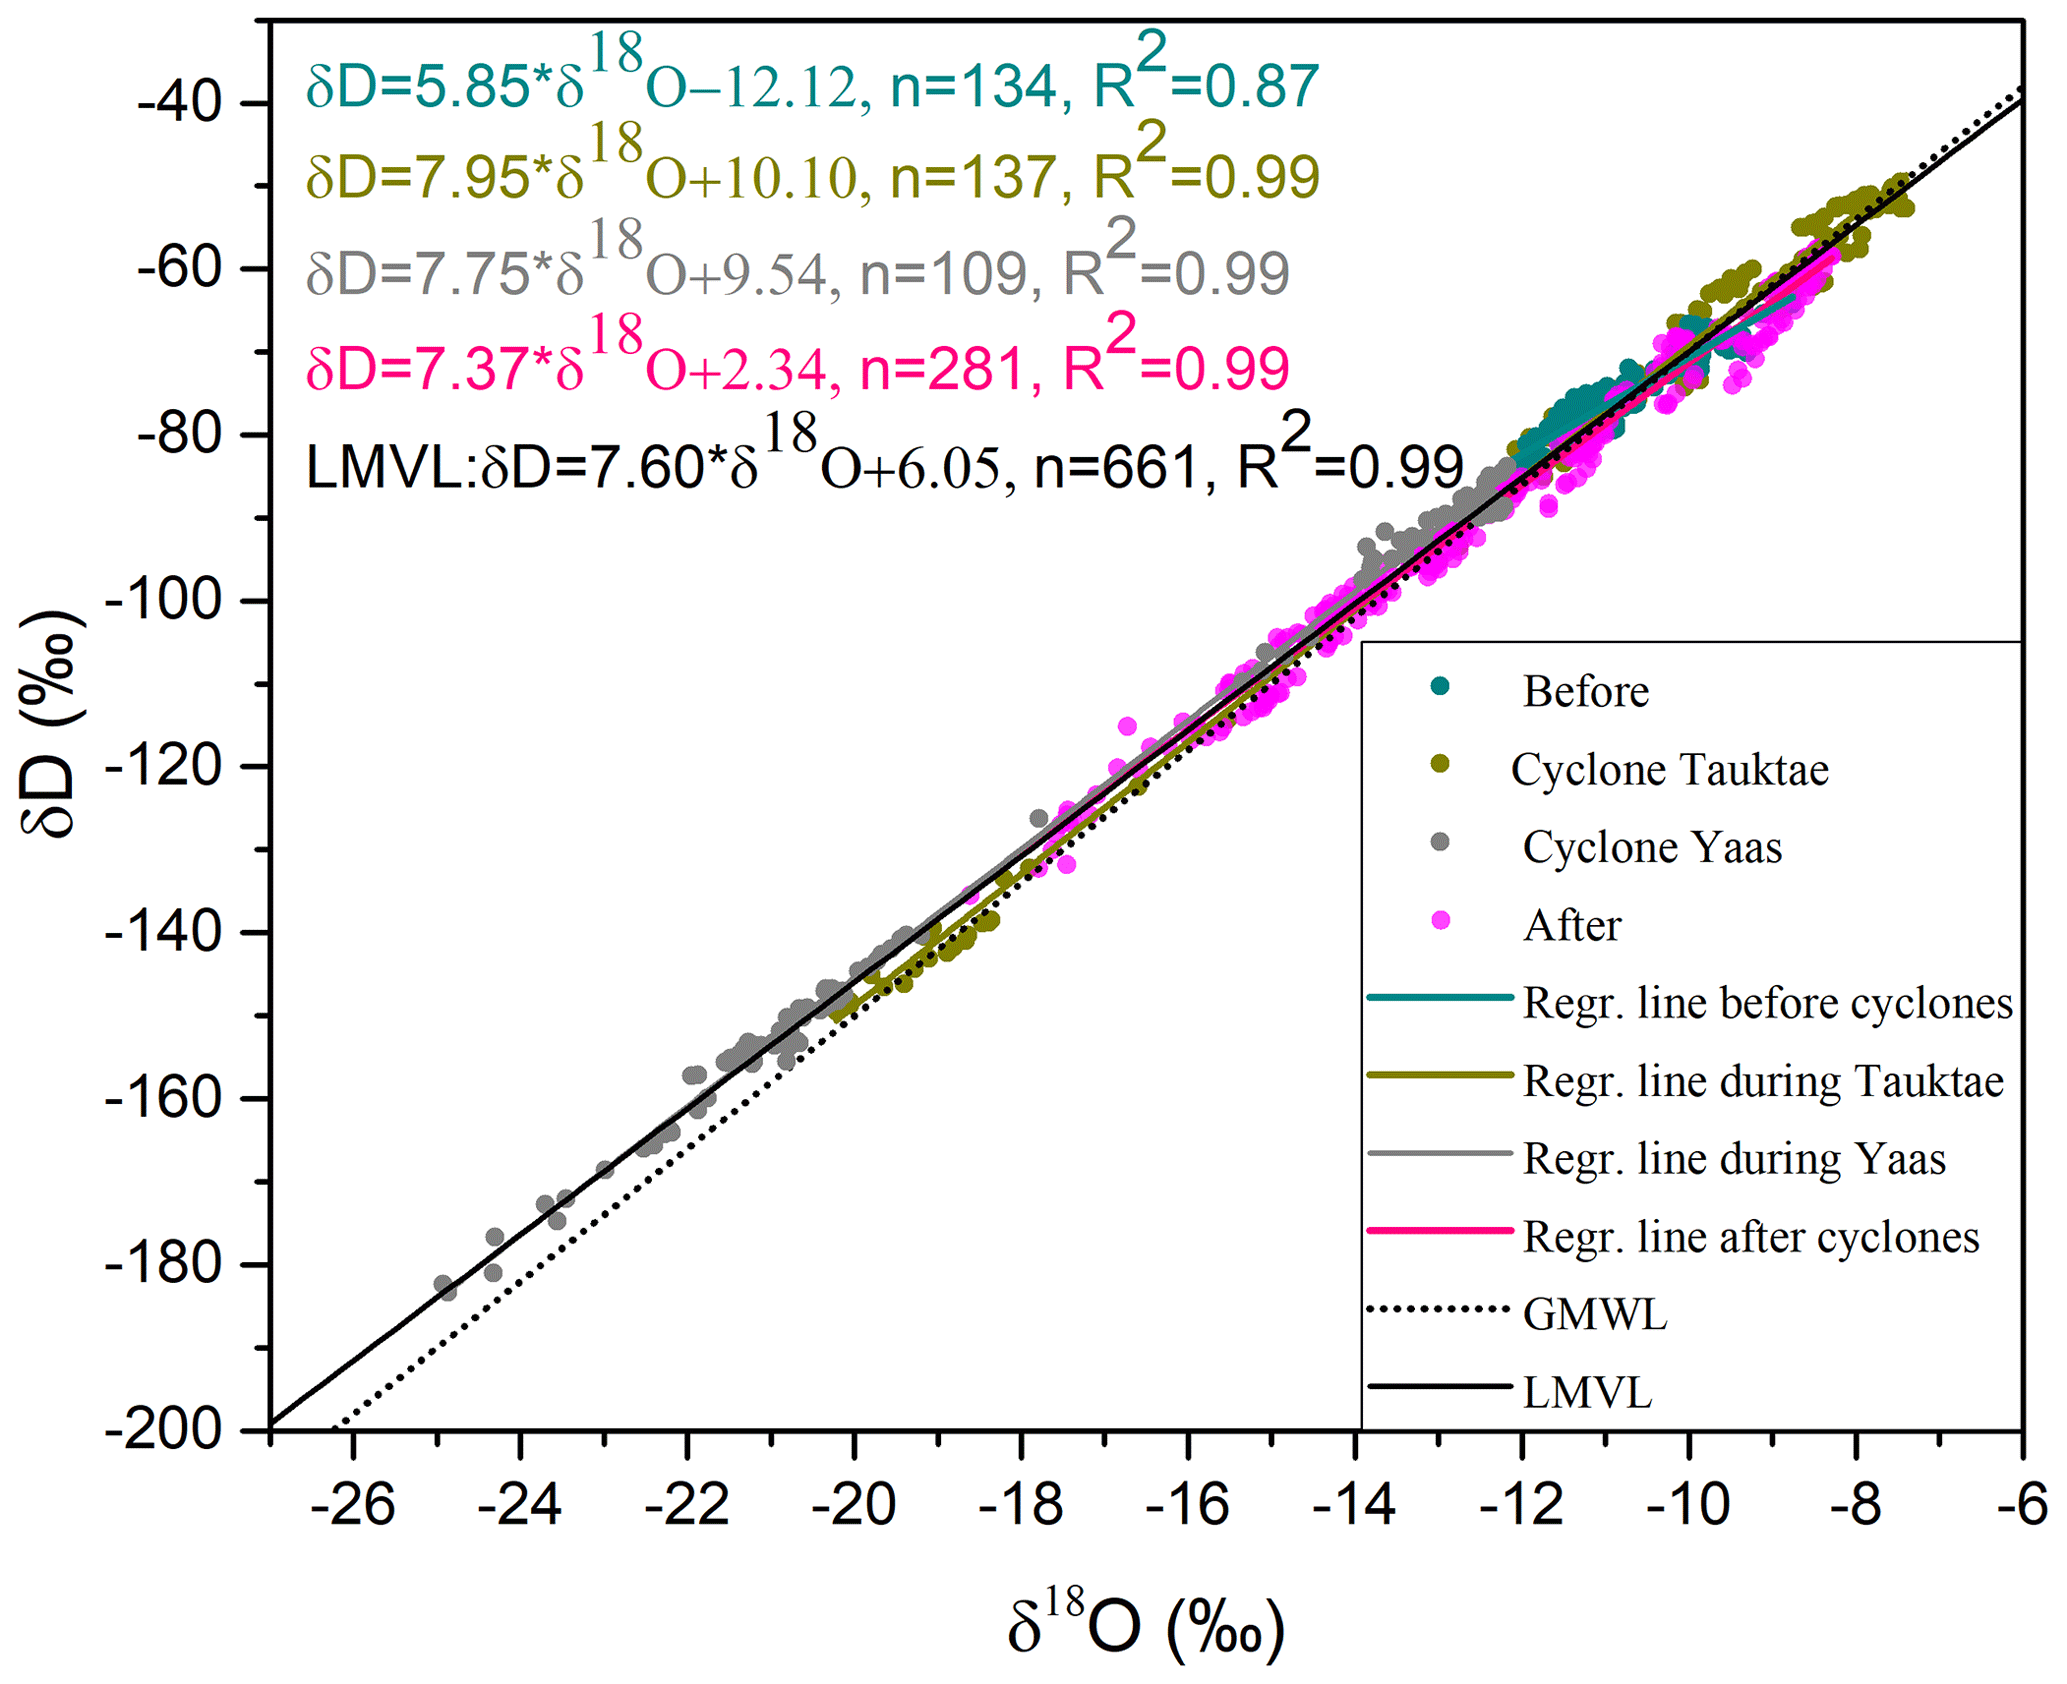
Figure 3Relationships between δ18Ov and δDv before, during, and after the cyclone events. The regression lines for each period are presented along with GMWL for comparison.
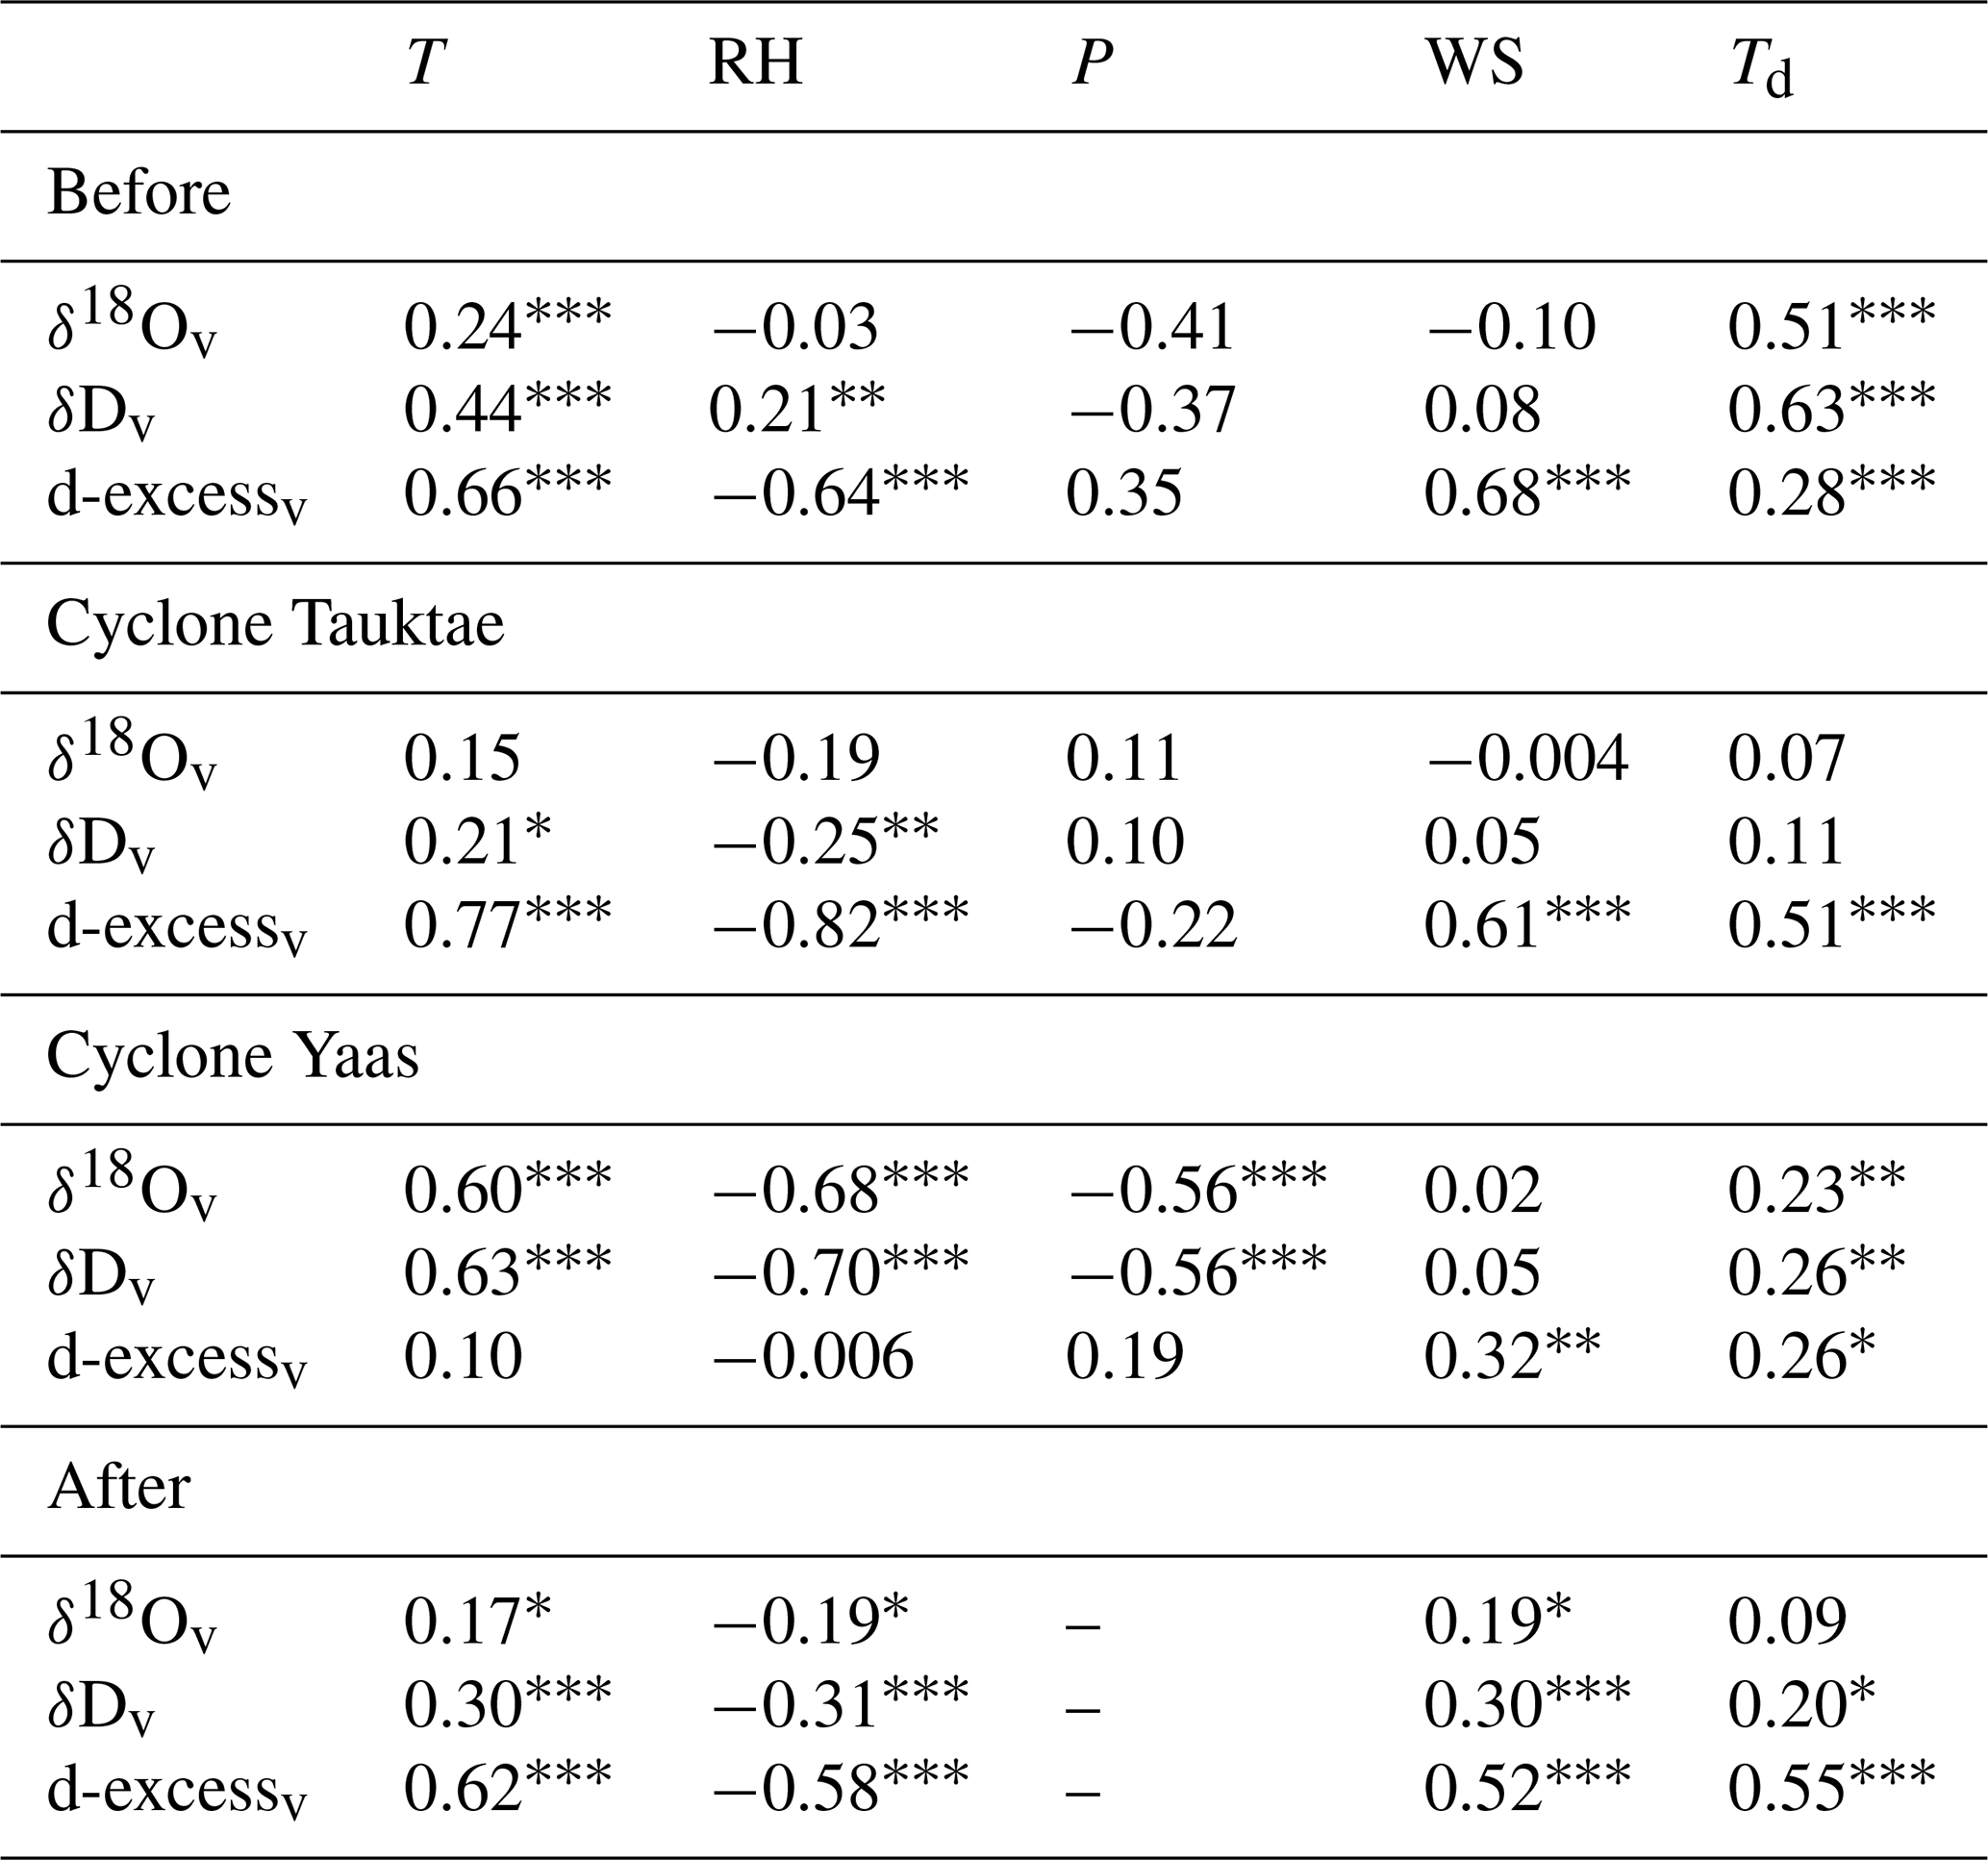
To assess the meteorological influence over the isotopic composition at Kathmandu, we examined the linear correlations between the isotopic composition (δ18Ov, δDv, and d-excessv) and air temperature (T), relative humidity (RH), precipitation amount (P), wind speed (WS), and dew point temperature (Td) before, during, and after the cyclones (Table 2). Before the cyclones, both δ18Ov and δDv showed a positive correlation with air temperature (i.e. temperature effect) and dew point temperature but no correlations with other meteorological variables (Table 2). The correlation between δ18Ov and/or δDv and surface air temperature and RH became weaker during cyclone Tauktae while becoming much stronger (r = 0.60 for temperature and r = −0.68 for RH) during Yaas. During Tauktae, we did not observe any effect of precipitation amount on the isotopic composition, while during Yaas, there was a negative correlation (r = −0.56); d-excessv was positively correlated with local air temperature (negatively correlated with local RH) before, during, and after Tauktae, whilst no correlations were observed during Yaas (Table 2).
Table 2Linear correlations between the isotopic composition of atmospheric water vapour (δ18Ov, δDv, and d-excessv) and air temperature (T), relative humidity (RH), precipitation amount (P), wind speed (WS), and dew point temperature (Td) before, during, and after the cyclone events. , , and ∗ indicate correlation significance levels of 0.001, 0.01, and 0.05, respectively.
3.2 Influence of moisture source
Previous studies suggested that Kathmandu is predominantly impacted by local moisture sources with short- and long-range transport of westerlies before the onset of the summer monsoon, which is generally dry and characterized by sporadic rainfall with enriched δ18O values in precipitation (Adhikari et al., 2020; Chhetri et al., 2014; Yu et al., 2016). We found significant proportions of moisture trajectories prior to cyclone Tauktae that originated either locally or from westerlies, characterized by low specific humidity (Fig. 4, upper-left panel). These moisture trajectories were traced back to the Gangetic Plain before cyclone Tauktae. The associated δ18Ov and δDv values for these moisture sources exhibited enrichment, with average values of −10.04 ‰ and −69.51 ‰ for δ18Ov and δDv, respectively. A similar slope (5.85) and intercept (−12.12) of the local meteoric vapour line before Tauktae in relation to the surface water line was calculated in the Gangetic Plain (Hassenruck-Gudipati et al., 2023), which provided corroboration for the impact of local evaporation on the isotopic composition.
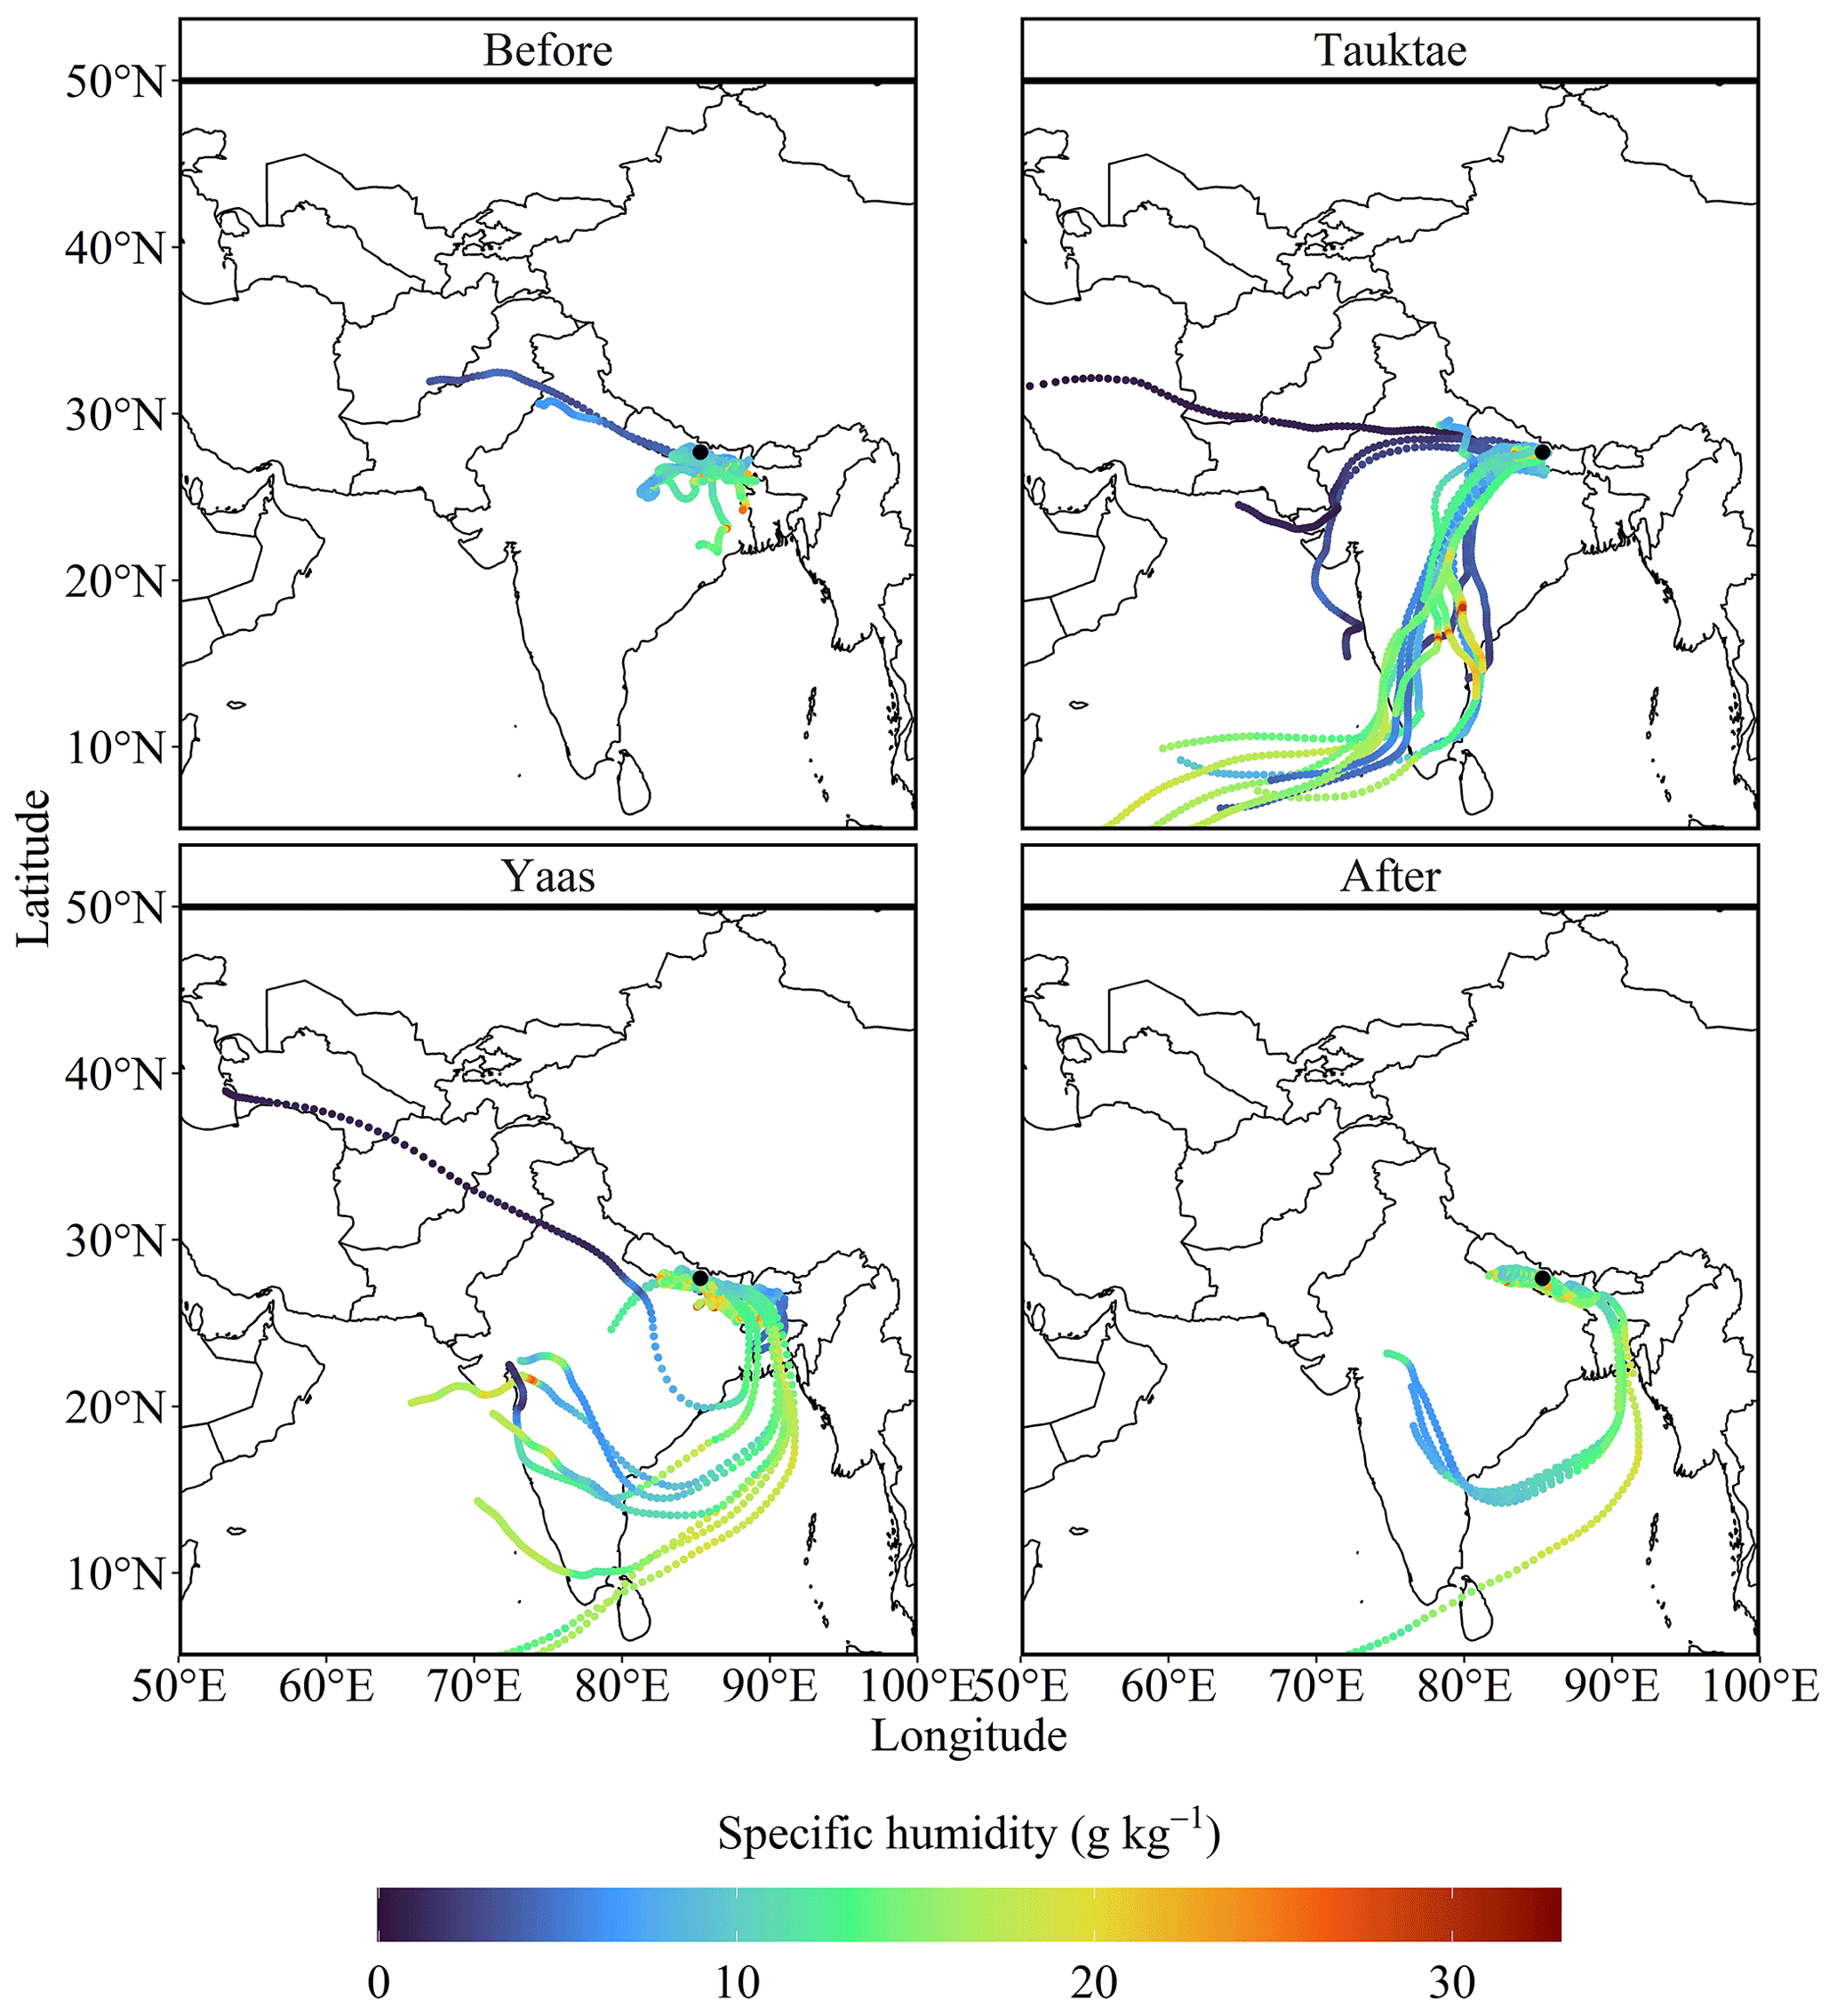
Figure 4The 5 d backward trajectories reaching the sampling site before, during, and after the cyclone events. Colours denote specific humidity (q in g kg−1) along the trajectories.
As cyclone Tauktae approached the continent, the primary moisture to Kathmandu was coming from the Arabian Sea instead of local origins (Fig. 4, upper-right panel). The specific humidity along these trajectories exhibited higher levels over the oceans, diminishing as they traversed over land through precipitation (Fig. 4, upper-right panel). During this phase, δ18Ov and δDv were significantly lower (on average over 4.5 ‰ and 37 ‰ for δ18Ov and δDv, respectively) than measurements preceding the cyclone. Such depletion can be attributed to the progressive rainout along the moisture transport path, wherein heavy isotopes are removed during successive condensation (Xu et al., 2019). Notably, the isotopic composition before the Tauktae-induced rainfall remained enriched, reflecting inflow from the surface layer (Munksgaard et al., 2015). Furthermore, the d-excessv variation in Kathmandu during Tauktae may have been influenced by local moisture-recycling processes.
During cyclone Yaas, only the BoB vapour contributed to moisture at Kathmandu, and specific humidity along the trajectories over the ocean was high (Fig. 4, bottom-left panel). The high specific humidity over India and the surrounding regions during cyclone formation suggests that Yaas lifted a substantial amount of water vapour from the BoB, yielding intense rainfall along its path. The isotopic composition during Yaas was more depleted than that of Tauktae, with averages of −17.87 ‰ and −129.18 ‰ for δ18Ov and δDv, respectively. The difference could stem from varied moisture sources, rainout histories, and the respective strengths of each cyclone. Moreover, the high isotopic depletion during cyclone Yaas might be attributed to the disparity in sea surface water δ18O between the AS and BoB. The surface water δ18O in the BoB is relatively depleted compared to the AS (Lekshmy et al., 2014), which results from a substantial influx of freshwater from rain and runoff originating from the Ganga–Brahmaputra river basin (Breitenbach et al., 2010; Singh et al., 2010).
Although the progressive increment was seen in the time series of δ18Ov and δDv after the dissipation of Tauktae (Fig. 2), δ18Ov and δDv in the earlier stage of Yaas were significantly lower compared to Tauktae because there was not enough time for recovery. There was a strong association between δ18Ov and/or δDv and local meteorological conditions during cyclone Yaas, associated with high relative humidity from the remote ocean (Chen et al., 2021; Xu et al., 2019). Furthermore, the negative correlation of δ18Ov and/or δDv vs. RH and the fact that δ18Ov and/or δDv were depleted highlight the influence of humid moisture sources (Yu et al., 2008), which was also confirmed by our moisture backward trajectory analysis (Fig. 4, bottom-left panel). A similar correlation was also observed in mid-tropospheric water vapour over the western Pacific, associated with intense convective activity (Noone, 2012).
In contrast to cyclone Tauktae, the lack of correlation of d-excessv with RH and local air temperature during cyclone Yaas implies that local moisture-recycling processes are not significant in determining d-excessv variation, and RH might not be a reliable predictor of kinetic fractionation during evaporation. Previous research conducted in the Indian Ocean (e.g. Midhun et al., 2013; Uemura et al., 2008) suggested that the high relative humidity (i.e. > 80 %) at the sampling sites weakens the correlation between d-excessv and RH. Our observed data also satisfied that condition during Yaas because the majority of isotopic measurements (about 75 %) were associated with high relative humidity (> 80 %), while this fraction was only 25 % during Tauktae.
Following the dissipation of the cyclones, some portion of moisture at Kathmandu was provided by the BoB source together with local evaporation (Fig. 4, bottom-right panel). However, the isotopic composition reverted to the original (enriched) levels (δ18Ov = −11.09 ‰, δDv = −79.38 ‰, and d-excessv = 9.37 ‰). The diminished correlation between δ18Ov and/or δDv and temperature following the cyclones is attributed to the admixture of vapour originating from plant transpiration during that period (Delattre et al., 2015).
We used the vapour δDv–q plot combined with the Rayleigh distillation and mixing curve to assess the moisture mixing (Fig. 5). Before the development of cyclone Tauktae and during its early stages, the data points lay well above the mixing curve, indicating that the isotopic variability was mainly dominated by vapour from local evapotranspiration. In contrast, during the latter stage of cyclone Tauktae, δDv was significantly depleted to levels well below the Rayleigh curve. During the early stage of cyclone Yaas, there were only a few data points between the mixing and Rayleigh curves, with the majority being well below the Rayleigh curve, particularly during the later stage. During both events, Kathmandu was dominated by deep convection, leading to a strong convergence of moisture from both the AS (Tauktae) and the BoB (Yaas). This points towards the influence of convective processes (see Sect. 3.3) (Galewsky and Samuels-Crow, 2015). After Yaas had dissipated, δDv gradually increased again, with half of the data points being clustered between the mixing and Rayleigh curves. The remaining data points were well above the mixing curve, indicating the influence of locally evaporated vapour, also evidenced by the moisture back trajectories (Fig. 4, bottom-right panel).
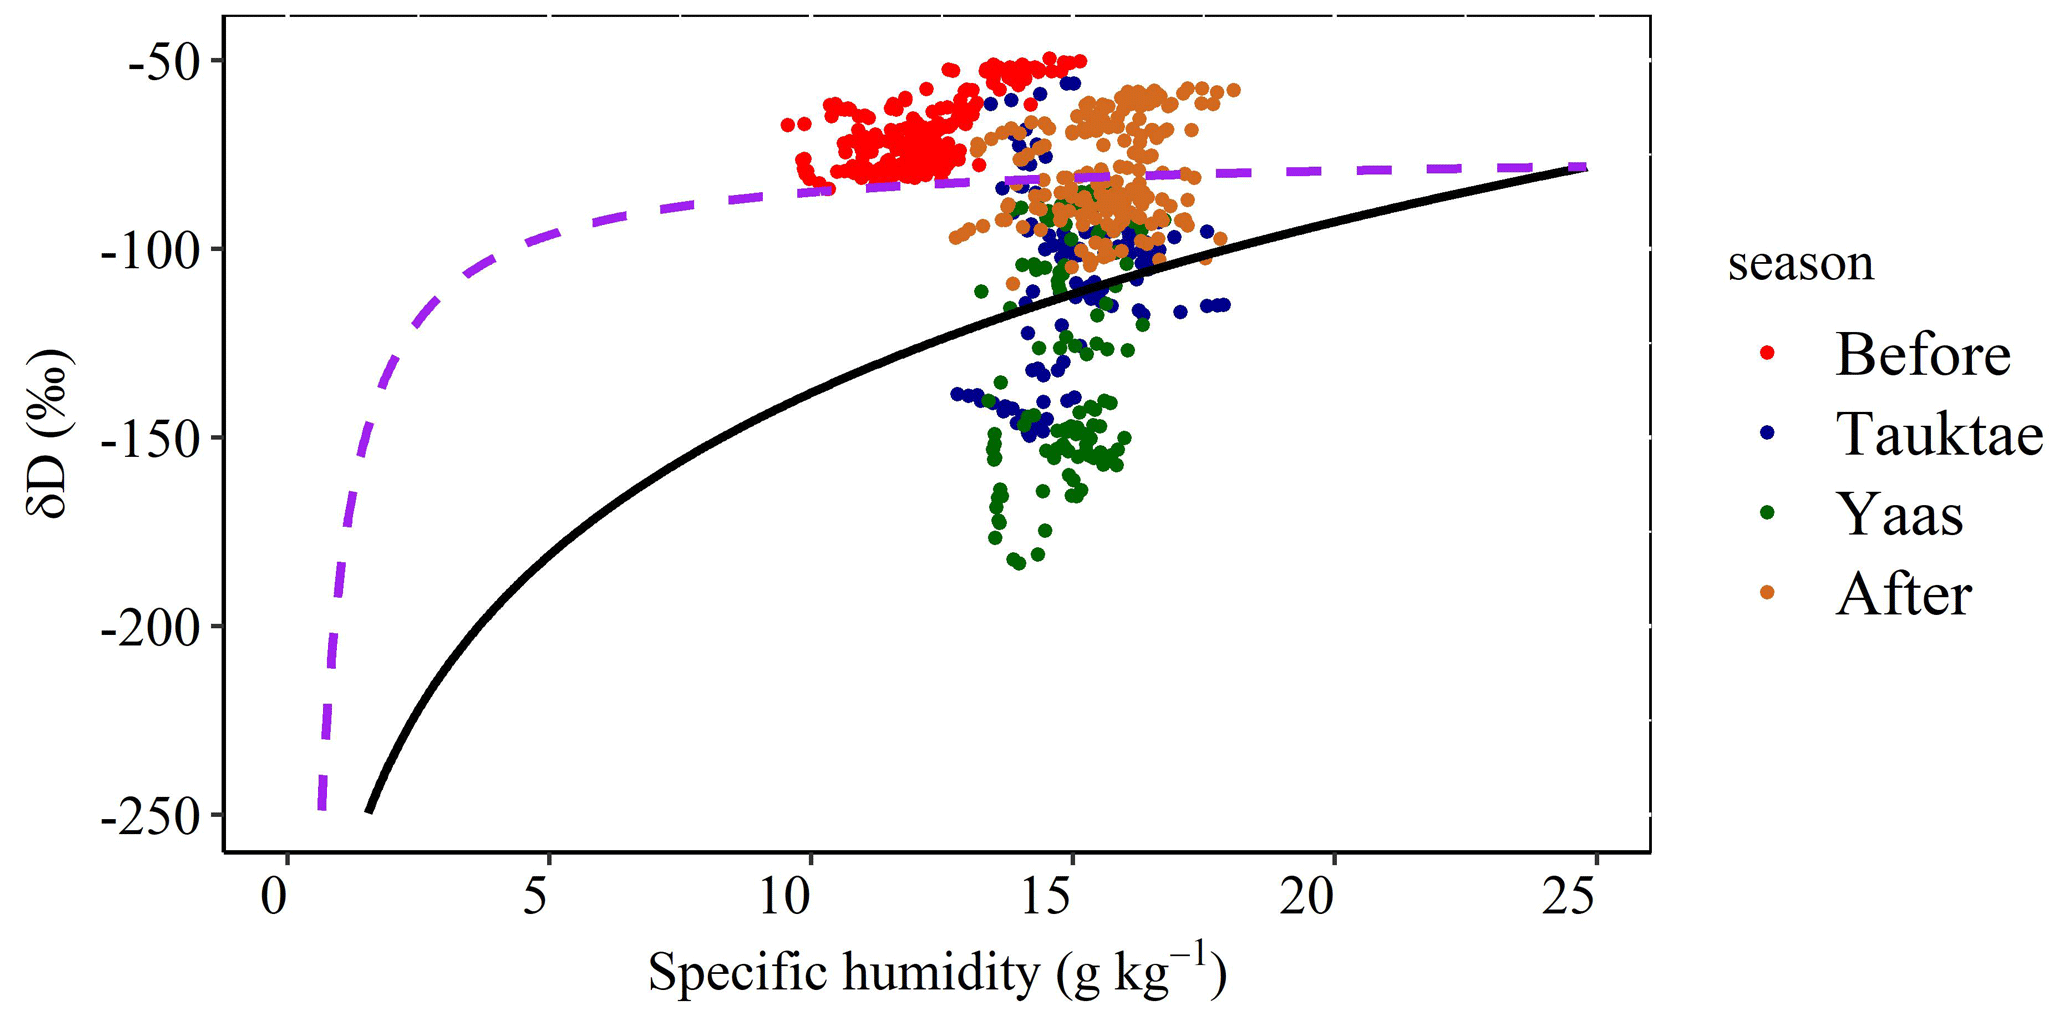
Figure 5Scatter plot of hourly averaged δDv vs. specific humidity (q). The solid black curve represents the Rayleigh distillation curve calculated for the initial condition of δDv = − 78.20 ‰, BoB-averaged δDv (Lekshmy et al., 2022), SST of 30 °C, and RH of 90 %. The dashed purple curve represents the mixing line, calculated based on dry continental air (q = 0.5 g kg−1 and δDv = −300 ‰; Wang et al., 2021) and the wet source, which correspond to the initial conditions used to calculate the theoretical Rayleigh curve.
3.3 Influence of deep convection associated with cyclones
One of the likely causes of large isotopic depletion during cyclones might be the associated convective processes. Studies have demonstrated that convective processes within tropical cyclones can cause the depleted isotopic composition of precipitation and atmospheric water vapour (Fudeyasu et al., 2008; Jackisch et al., 2022; Munksgaard et al., 2015) due to a combination of strong cyclonic circulation, intense large-scale convection, heavy precipitation, and high wind speeds (Chen et al., 2021; Xu et al., 2019). We analysed the relationship between the isotopic composition and convective processes using OLR and vertical velocity as a proxy for convection. Due to the frequent co-occurrence of intense convection and significant mid-tropospheric convergence of moist air, the vertical velocities can also serve as a proxy for convective activity (Lekshmy et al., 2014).
Figures 6 and 7 depict the prevalence of strong convective processes associated with both cyclones throughout their lifespan. During the initial days of cyclone formation, OLR exceeded 260 W m−2 in the area of the sampling site and decreased rapidly to below 200 W m−2 in the final stages of both cyclones when approaching the site. Although the amount of precipitation associated with Tauktae (9.2 mm) was much lower than that of Yaas (59.6 mm), δ18Ov was depleted by up to 12 ‰ during both cyclones. The progressive rainout was evident along the entire cyclone track (Figs. S4 and S5), and the spatial distribution of precipitation was highly correlated with the convective process, suggesting that rainfall occurred from the deep convective cloud rather than local evaporation. This was confirmed by precipitation variations. The site received its first rainfall on 19 May during cyclone Tauktae and on 25 May during cyclone Yaas, as shown in Figs. S4 and S5. In situ observations confirm that, during the days leading up to cyclone Tauktae, the sampling site received a total of 12.2 mm of precipitation, with maximum rainfall of 9.2 mm h−1 recorded on 11 May at 13:00 LT, equal to the total accumulated rainfall during the entire cyclone. Although the rainfall amounts before and during Tauktae are similar, pre-cyclone δ18Ov and δDv were significantly more enriched (averages: δ18Ov = −10.04 ‰ and δDv = −69.51 ‰) than during Tauktae (averages: δ18Ov = −14.73 ‰ and δDv = −106.76 ‰). We compared the values of δ18Ov, δDv, and d-excessv during both events and also examined them in comparison with the isotopic composition at the beginning of the summer monsoon (June 2021). This initial period of intense and continuous rainfall at our sampling site (Fig. S6) is regulated by the monsoon system originating in the BoB. Consequently, our focus centred on the isotopic distinctions between water vapour on typical rainy days and those associated with cyclone Yaas.
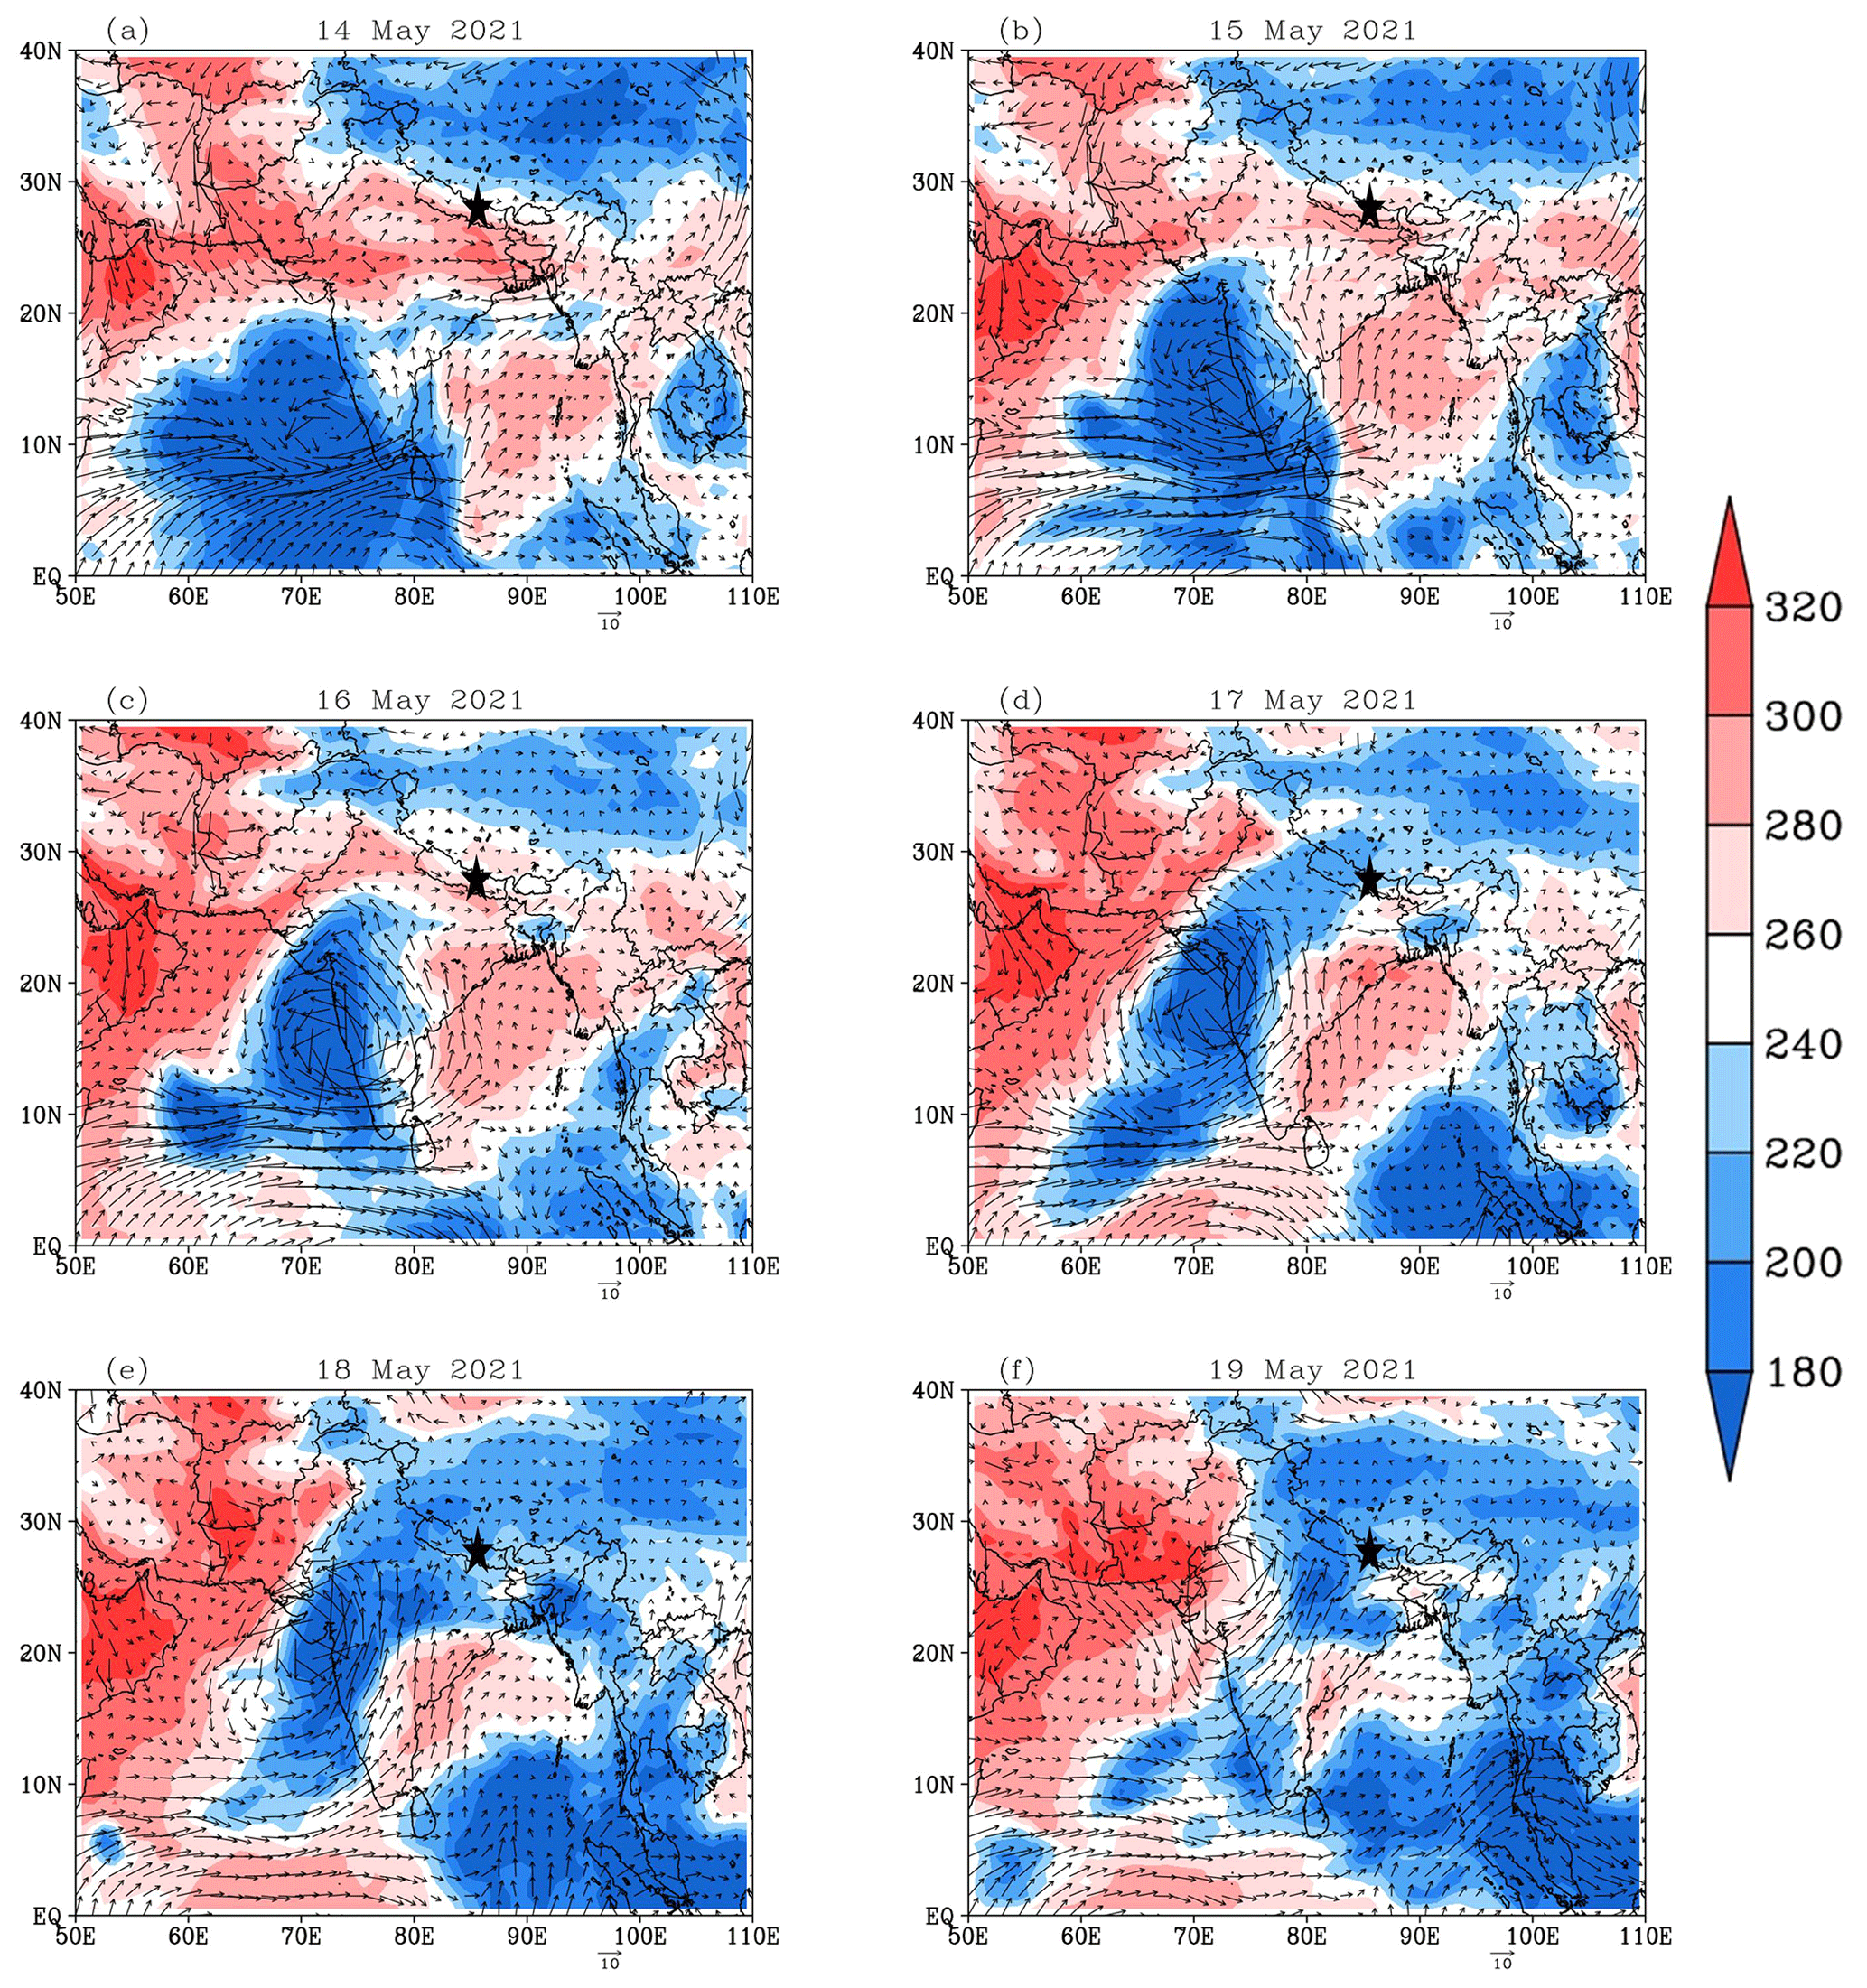
Figure 6Regional winds (arrows) and outgoing longwave radiation (colours in W m−2) during cyclone Tauktae.
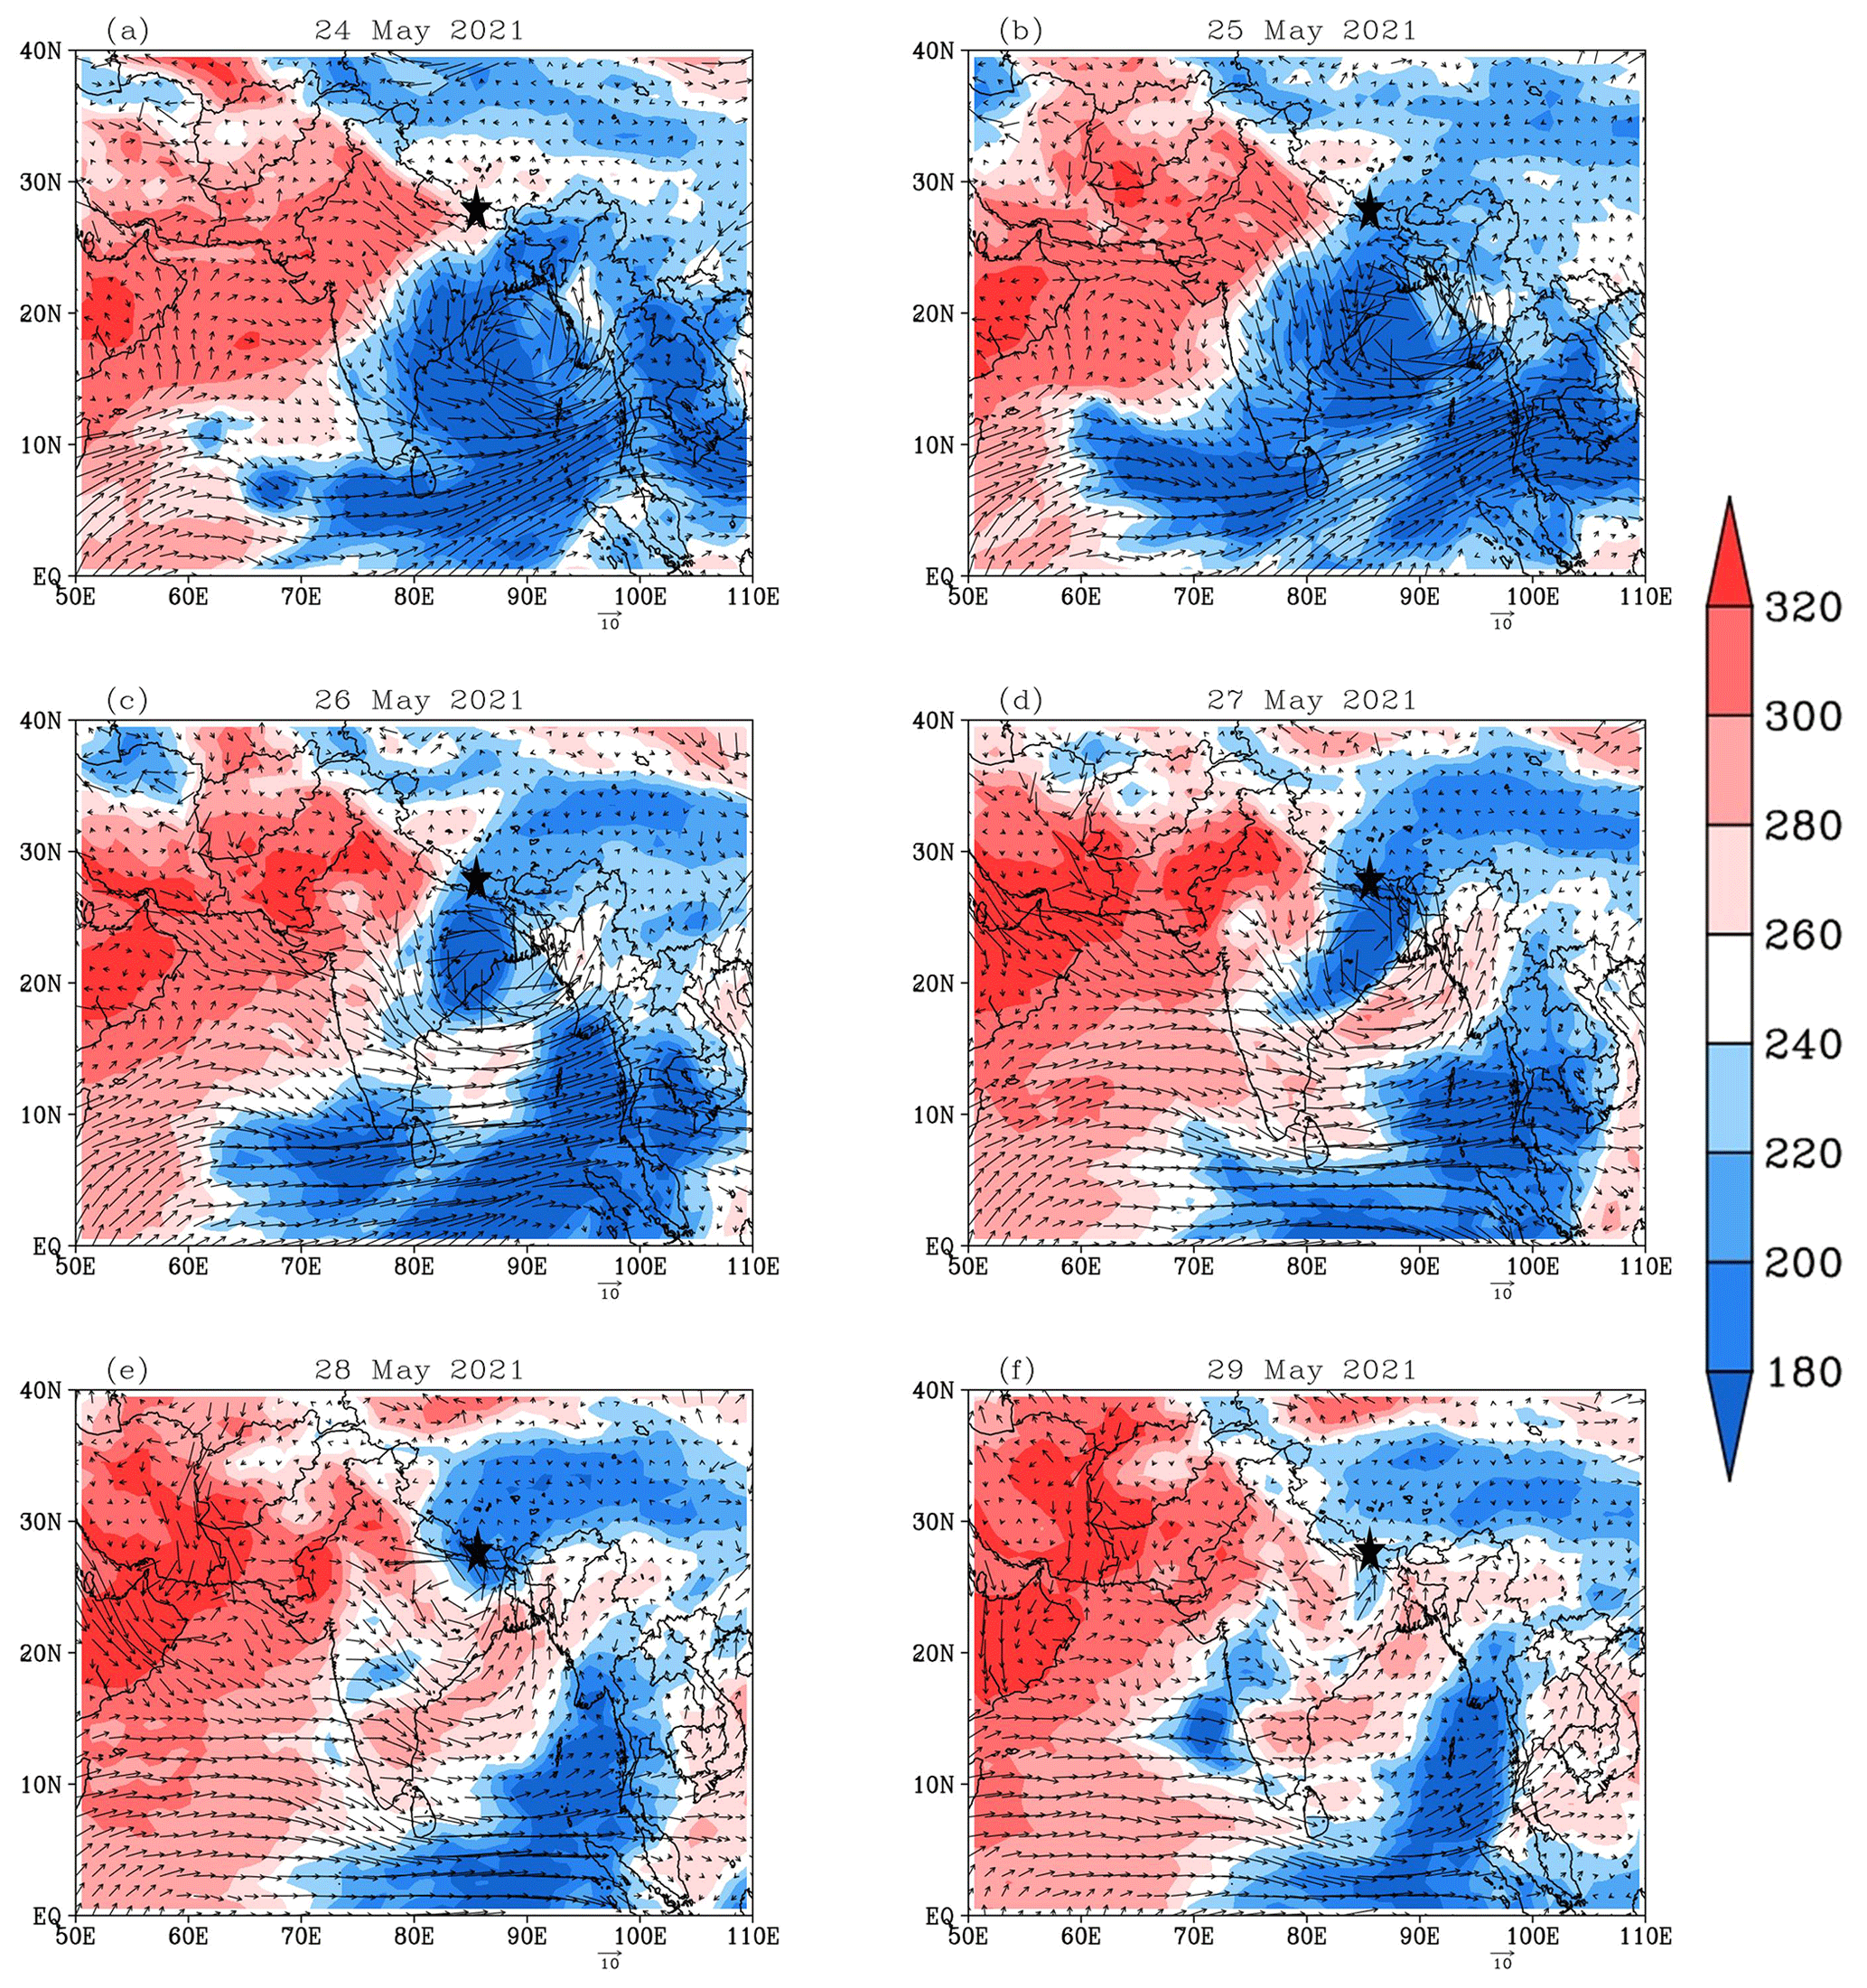
Figure 7Same as Fig. 6 but for cyclone Yaas.
Following the initiation of the summer monsoon, both δ18Ov and δDv exhibited a progressive depletion, coinciding with a decline in air temperature, an increase in relative humidity (RH), and amplified rainfall amounts (Fig. S6). Despite the daily accumulated rainfall and RH being significantly higher during the normal monsoon period, both δ18Ov and δDv were markedly lower during cyclone Yaas (on average by over 2.5 ‰ and 26 ‰ for δ18Ov and δDv, respectively) compared to typical rainy days. A progressive reduction in d-excessv was also evident as the summer monsoon unfolded, a trend typically observed in precipitation d-excess (e.g. Hussain et al., 2015; Acharya et al., 2020; Adhikari et al., 2020) and water vapour d-excess (Tian et al., 2020; Yao et al., 2018; He and Richards, 2016; Wei et al., 2016) in Asian monsoon regions, in contrast to our observations during cyclone Yaas.
Given that d-excess has long served as a diagnostic tool for understanding moisture source conditions (Tian et al., 2001a, b; Liu et al., 2008), the distinct behaviour of d-excessv between cyclone Yaas and the normal monsoon phase suggests that cyclone-related information may be discerned through the isotopic composition recorded at our site. This confirms our previously stated hypothesis that rainfall associated with cyclones causes significantly lower isotope values in vapour due to intense convective systems (Gedzelman et al., 2003; Kurita, 2013), absent in local rain events and days without precipitation (Lekshmy et al., 2022).
The influence of convective processes over water vapour isotopic variations at Kathmandu is further supported by the Hovmöller diagram of OLR averaged over 80–90° E, which clearly shows that δ18Ov depletion coincides with the presence of clouds (Fig. 8b and c). In contrast, d-excessv showed dissimilar variations between both cyclones. Before cyclone Tauktae, the daily averaged d-excessv was above the global average of 10 ‰ (Fig. 8a). Once Tauktae approached our sampling site, d-excessv decreased from around 12 ‰ to 10 ‰ and continued to oscillate by about 10 ‰ until Tauktae had dissipated. As cyclone Yaas approached the measurement site with intense rainfall (Fig. 2), d-excessv gradually increased, while RH increased and air temperature decreased (Fig. 2). Specifically, d-excessv on 24 May was recorded as 12.82 ‰ when surface air temperature and surface RH were about 24 °C and 70 %, respectively. On 27 May, we noted a 3 ‰ rise in d-excessv when the surface temperature was reduced by 4 °C and the surface RH was increased by 19 %. The combination of increasing d-excessv and decreasing δ18Ov highlights the role of vapour recycling due to the subsidence of air masses from stratiform clouds (Kurita et al., 2011). In addition, a large increase in d-excessv was also recorded in atmospheric vapour during cyclone Ita in 2014 and was attributed to downward moisture transport above the boundary layer (Munksgaard et al., 2015). We did not find any statistically significant correlation during cyclone Yaas between d-excessv and RH and/or temperature, although RH is considered to be an important parameter for interpreting d-excess in atmospheric vapour and precipitation (Pfahl and Sodemann, 2014; Steen-Larsen et al., 2014). The observed co-occurrence of higher d-excessv, lower temperatures, and high relative humidity (Fig. 2) points to kinetic fractionation processes either at a larger scale or in association with downdrafts (Conroy et al., 2016). Rain re-evaporation under the condition of high saturation deficit is one of the causes of low δ18Ov and high d-excessv. This is due to the addition of re-evaporated vapour during precipitation events, which results in depleted cloud vapour and high d-excessv (Conroy et al., 2016; Lekshmy et al., 2014). On normal days, high d-excessv values were generally accompanied by low RH (Fig. S7) and vice versa. However, the high relative humidity of the surface air and the near-saturation conditions vertically (Fig. 9b) during cyclone Yaas rule out any effect of re-evaporation on increased d-excessv values. Such high d-excessv values may be associated with downdrafts during convective rain events, transporting isotopically depleted vapour with higher d-excessv values from the boundary layer to the surface (Kurita, 2013; Midhun et al., 2013).
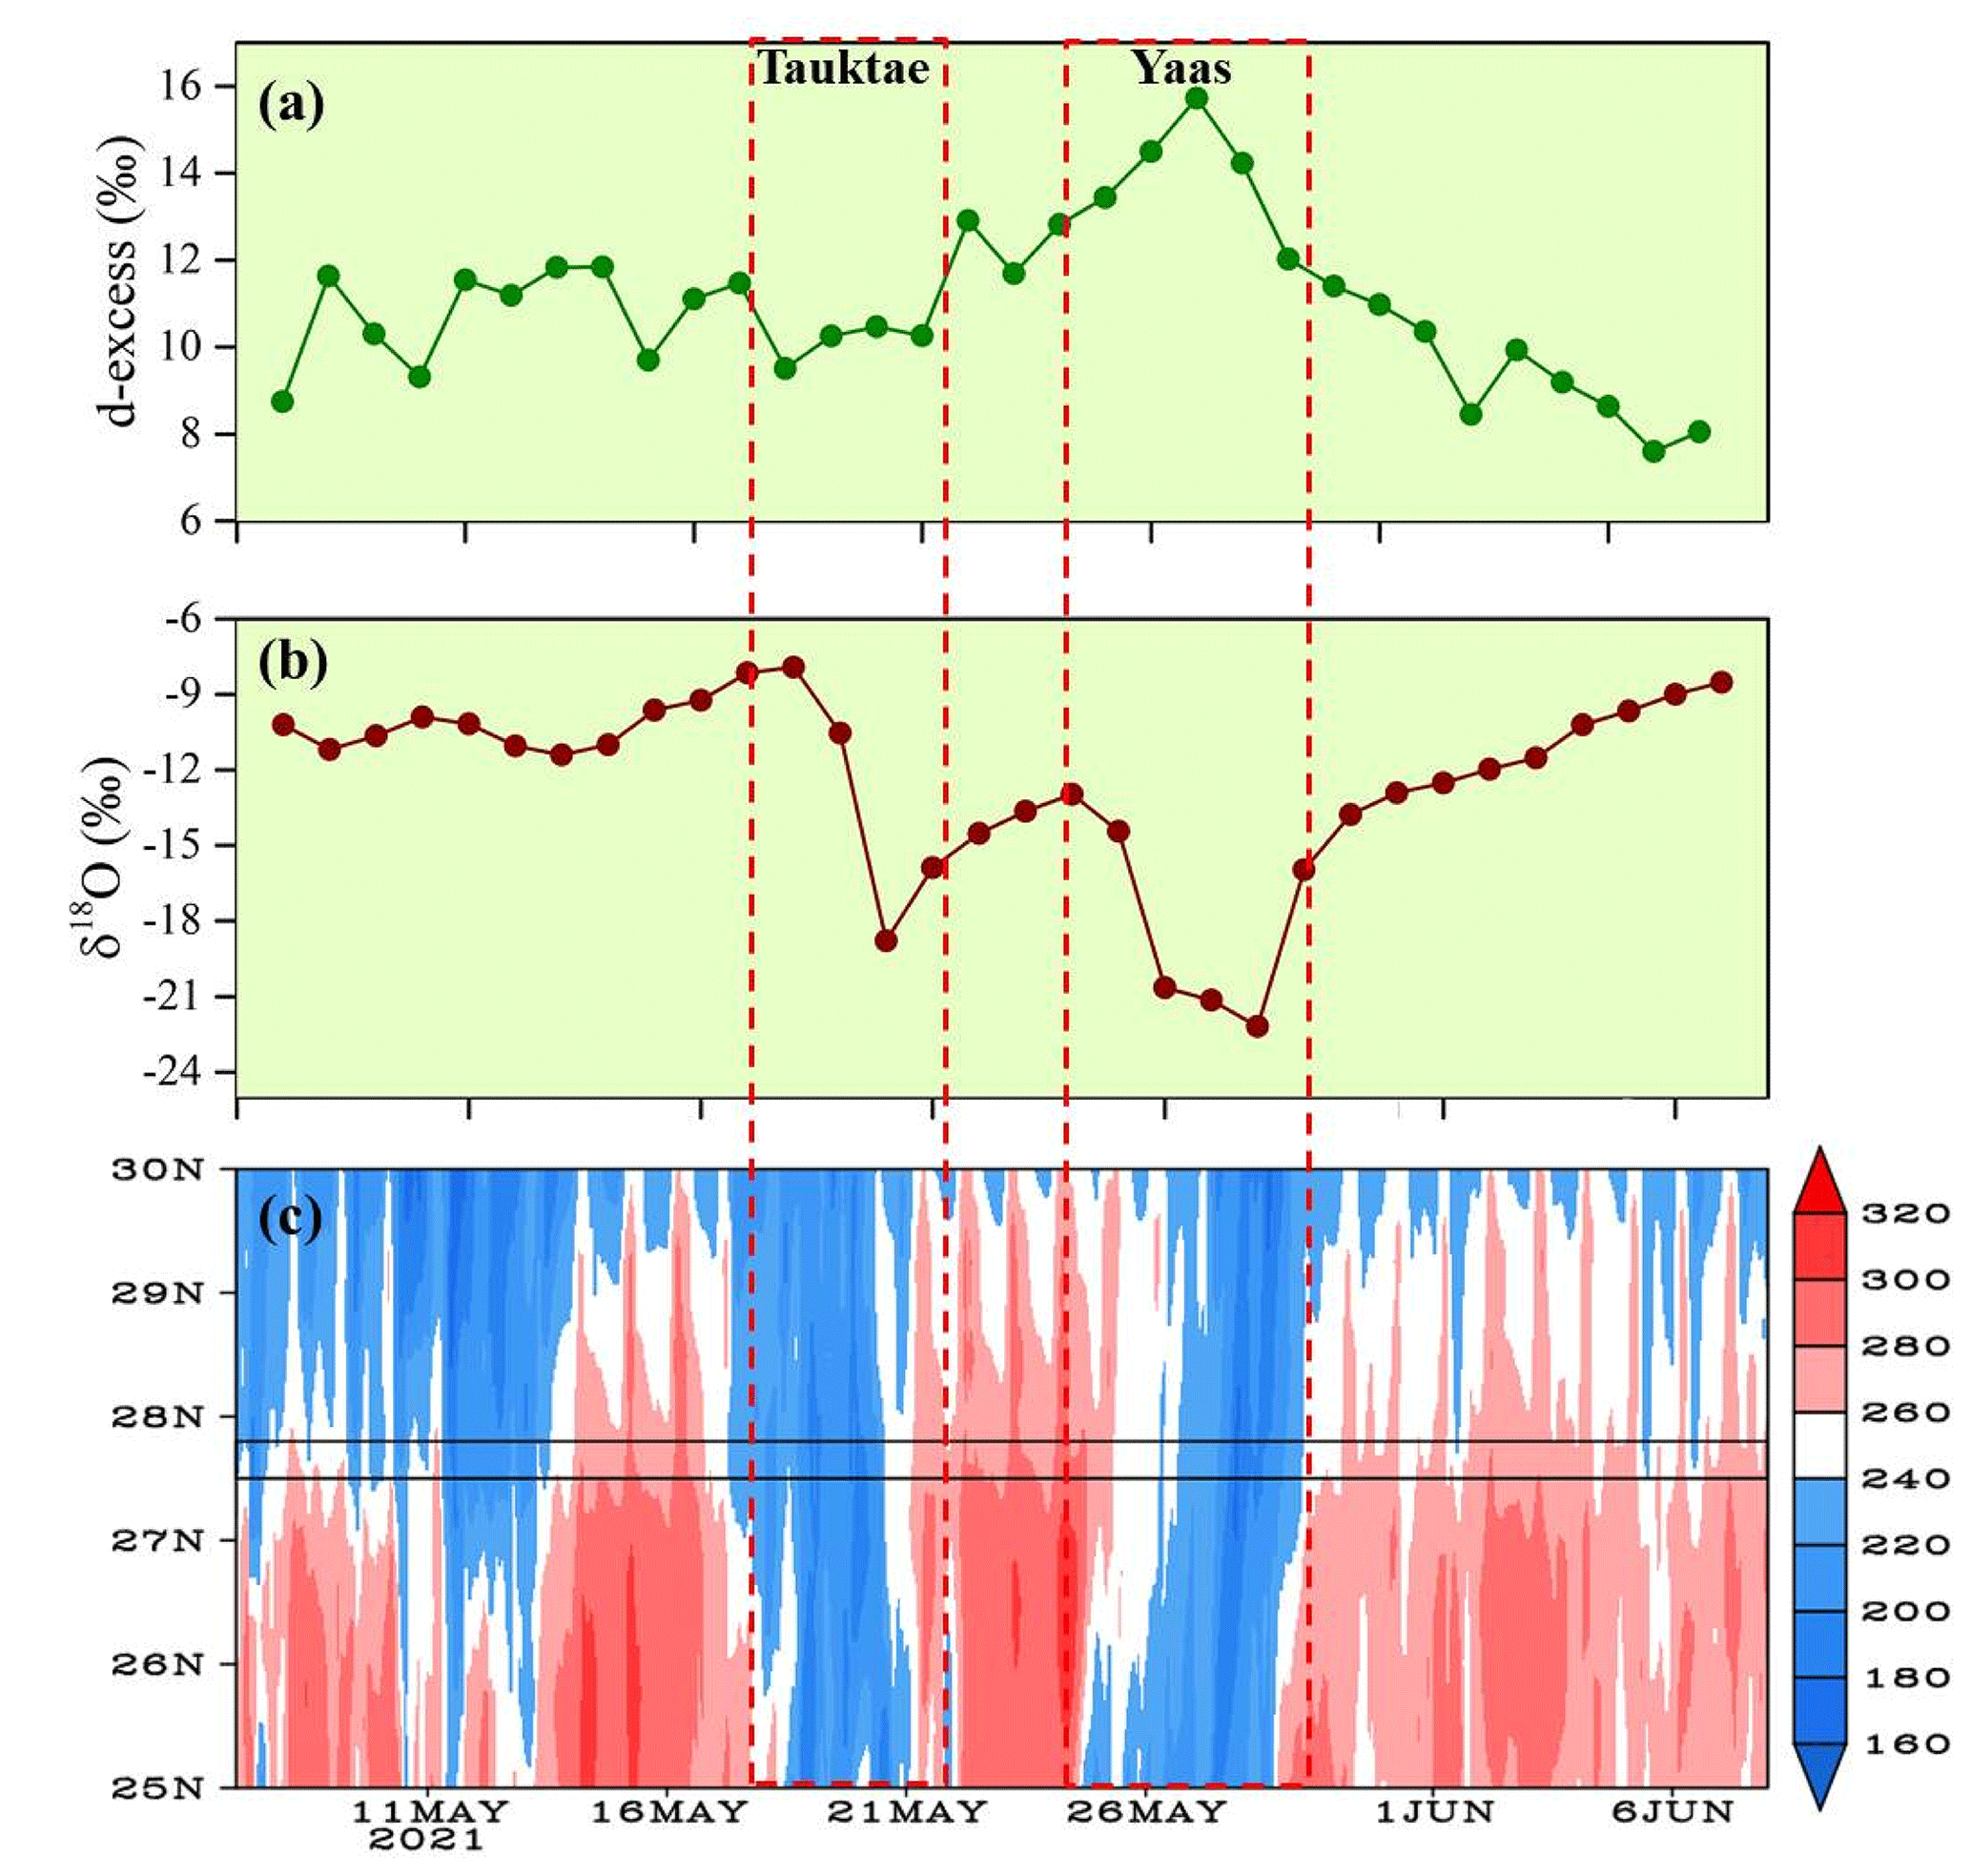
Figure 8Time series of daily averaged d-excessv (a) and δ18Ov (b) and Hovmöller diagram of OLR (W m−2) averaged over 80–90° E (c). The solid parallel lines in (c) depict the latitude range of the sampling site.
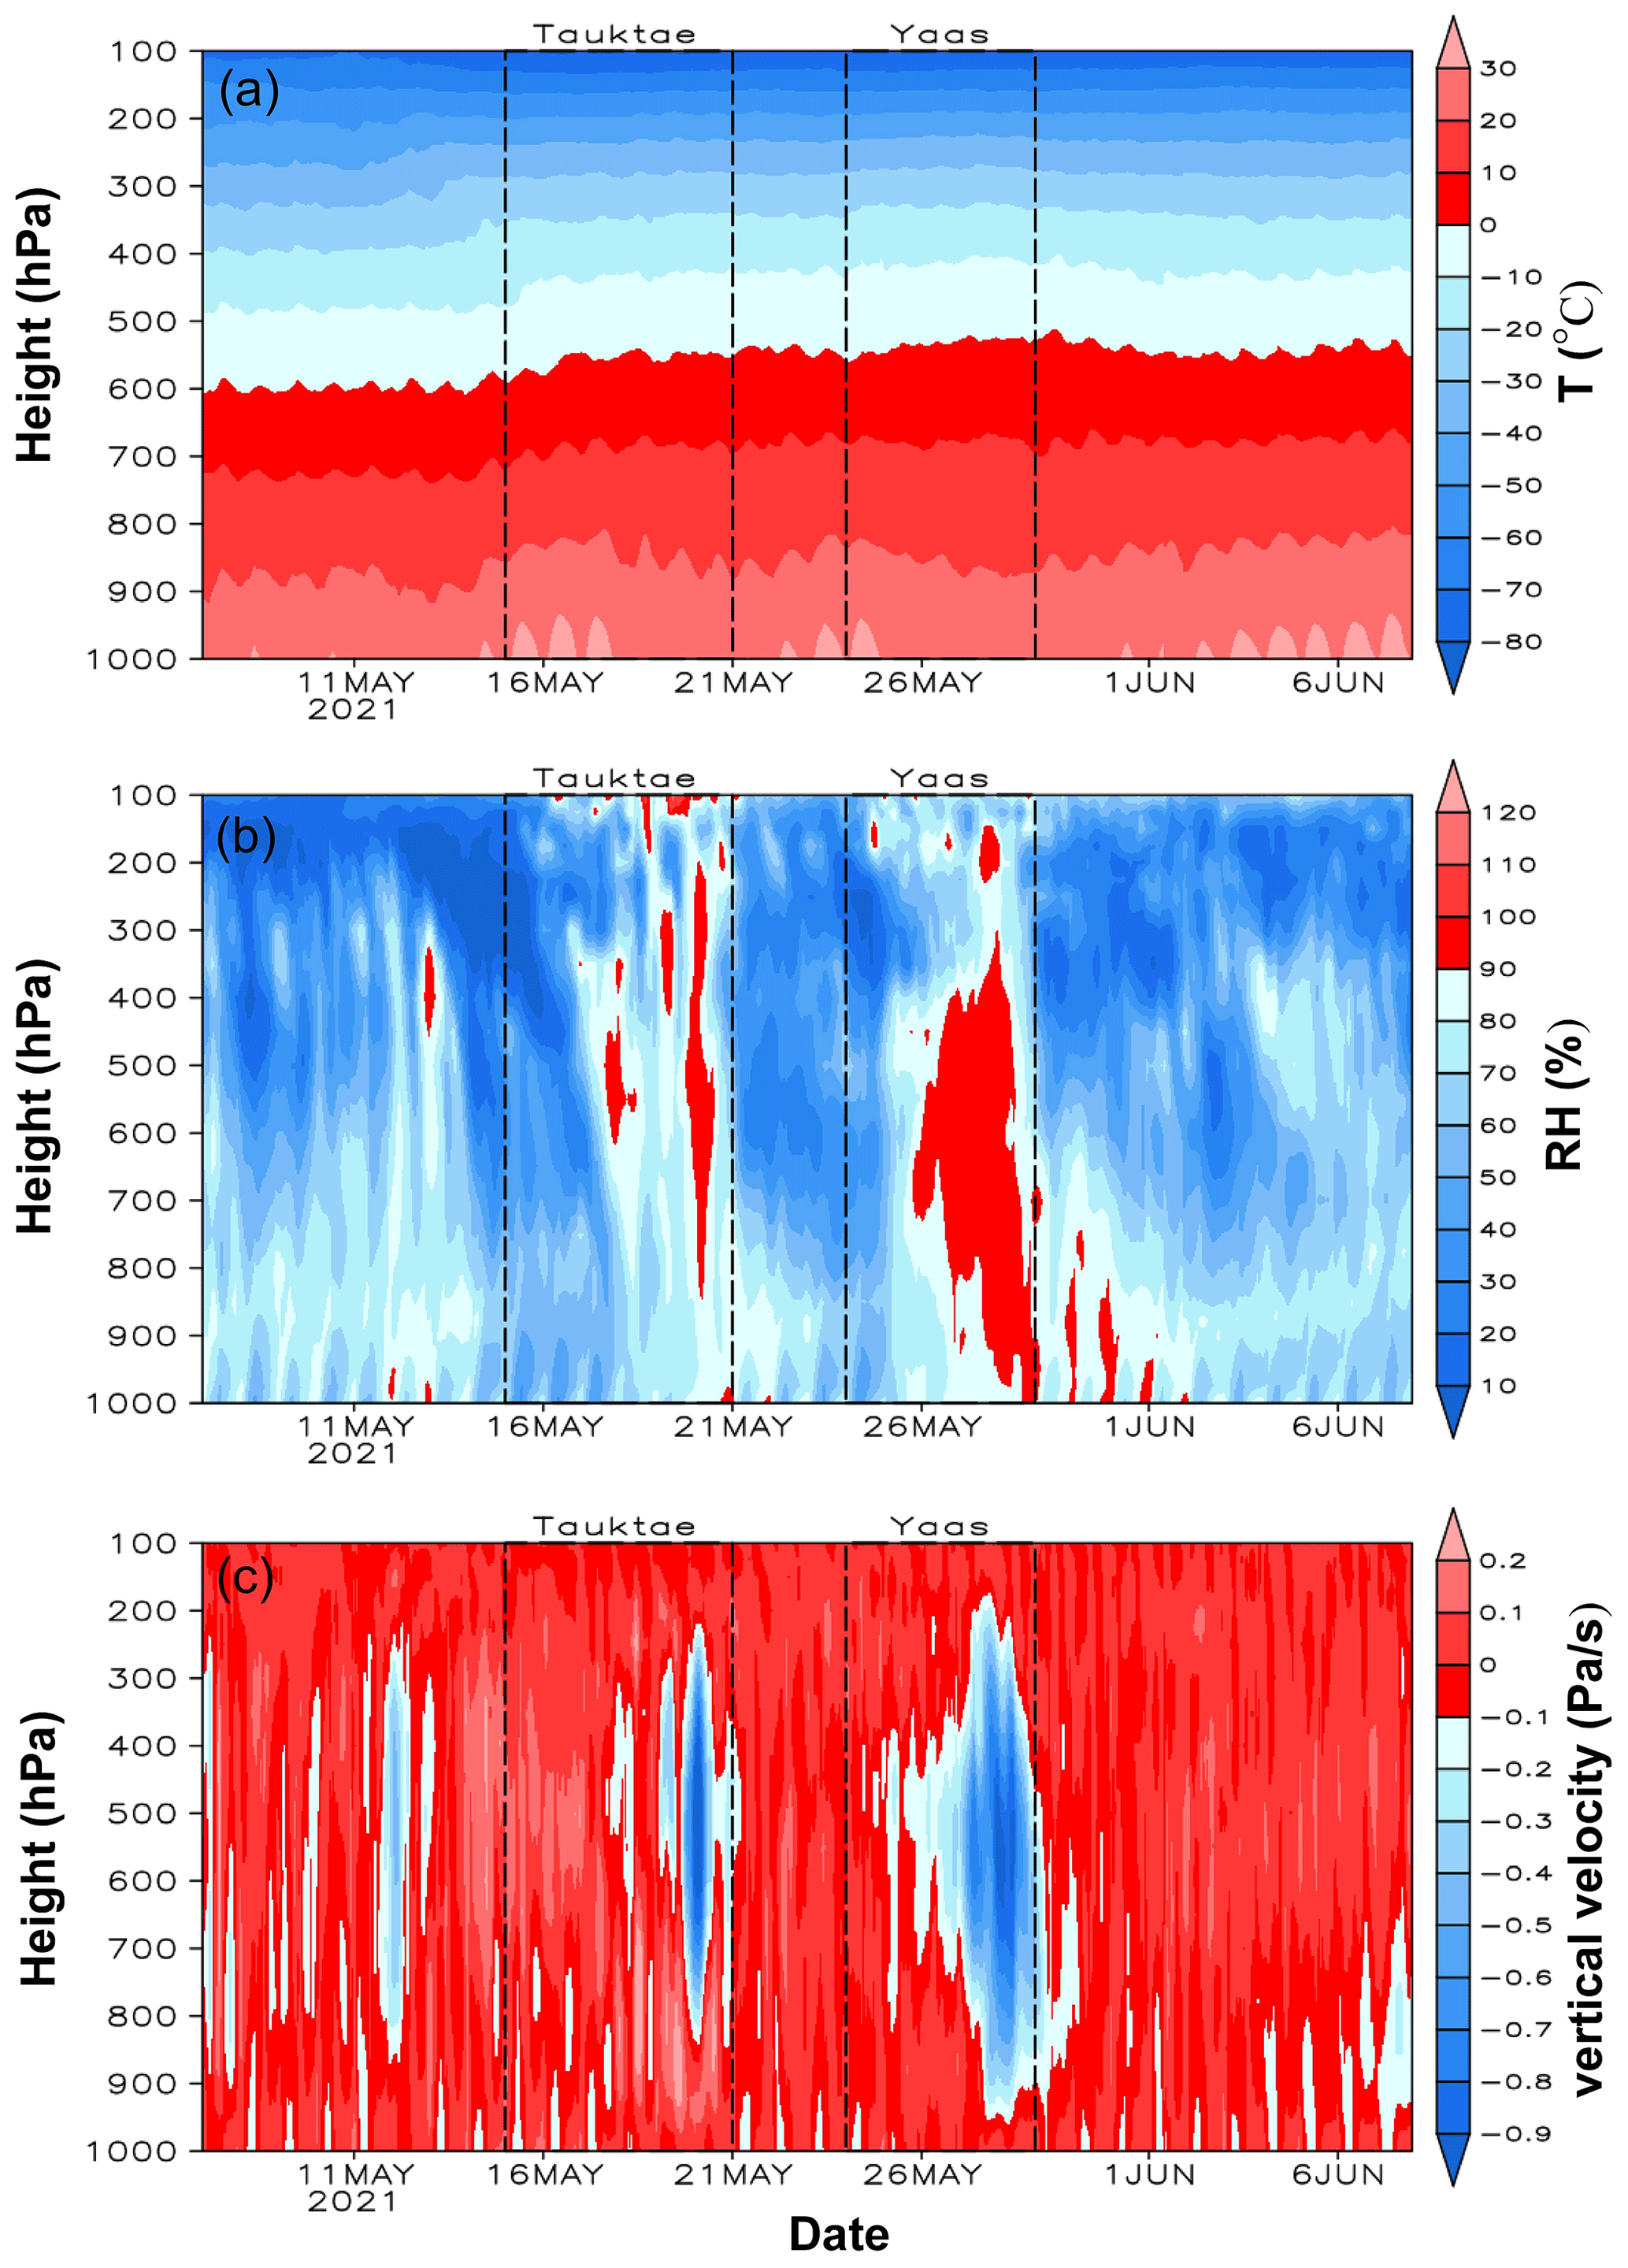
Figure 9Time series of the vertical distribution of air temperature (a), RH (b), and vertical velocity (c) averaged over 25–28° N and 83–87° E, with Kathmandu approximately at the centre. Negative (positive) vertical velocities indicate ascending (descending) winds.
To clarify the impact of convection on the isotopic composition, we analysed the distribution of vertical velocity, relative humidity, and air temperature averaged over a box between 25–28° N and 83–87° E, with our measurement site near its centre (Fig. 9). Our results show that strong shifts in δ18Ov, δDv, and d-excessv during the cyclones were strongly associated with vertical air motions (Fig. 9c). We observed a general downward movement of air before the rain started with Tauktae. The high depletion of δ18Ov and δDv during the final stages of Tauktae (Fig. 2) was accompanied by strong upward air movement extending from 800 hPa to about 200 hPa (Fig. 9c). This upward motion was even stronger during cyclone Yaas and became evident near the measurement site once Yaas made landfall on 26 May. Interestingly, variations in RH at different pressure levels strongly coincided with changes in vertical velocity, while the lower troposphere remained near saturation (RH = ∼ 100 %) during the final stages of both cyclones (Fig. 9b). While the air temperature showed the expected decline with altitude (Fig. 9a), there were no significant temporal variations during the entire period despite the high variation in RH. The strong convective updraft added additional moisture from the warm ocean below before passing over our measurement site (Lekshmy et al., 2014). Convective updrafts cause moisture to condense quickly, and this high-efficiency condensation of heavy rain can result in more depleted δ18Ov and δDv (Lawrence and Gedzelman, 1996). In addition, we found a strong positive correlation between δ18Ov and average vertical velocity (r = 0.57) during Yaas at pressure levels between 300 and 600 hPa (Fig. 10a) in the area surrounding our site. This correlation was weaker (r = 0.30) during Tauktae. The distinctive relationship between δ18Ov and vertical velocity implies that convective processes play a more significant role during Yaas than Tauktae. This result was further supported by the spatial distribution of the correlation coefficient between δ18Ov and vertical velocity (Fig. 10b, c). During cyclone Tauktae, a significant negative correlation was observed between δ18Ov and vertical velocity around the sampling site, while positive correlation areas were identified in western Nepal, certain parts of central India, and the coastal region of the Bay of Bengal (BoB) (Fig. 10b). A comparison with back trajectories unveiled a positive correlation only in specific sections along the moisture transport path, suggesting that convective processes may not be the primary driver of isotopic depletion during cyclone Tauktae. Conversely, a positive correlation was evident in the coastal BoB, extending north toward the sampling site during cyclone Yaas (Fig. 10c). The positive correlation areas were considerably larger compared to Tauktae, and these areas were closely aligned with the moisture transport path. Hence, higher depletion of δ18Ov and δDv during Yaas, relative to Tauktae, may be attributed to the stronger convection associated with BoB vapour compared to the AS vapour. The BoB is a convectively active region, and previous studies reported greater depletions in δ18O and δD in precipitation, irrespective of the season (Breitenbach et al., 2010; Lekshmy et al., 2015; Midhun et al., 2018). Another reason we observed different levels of isotope depletion between both cyclones may be related to differences in their proximity to the sampling site. While Yaas came as close as 330 km to our site, Tauktae was about 1050 km away when it dissipated (Fig. S8). The proximity of Yaas may explain the stronger rainfall during that event which enhanced the isotopic fractionation, in turn leading to stronger isotopic depletion (Jackisch et al., 2022). Similar results have been documented for precipitation stable isotopes (e.g. Fudeyasu et al., 2008; Jackisch et al., 2022; Munksgaard et al., 2015; Xu et al., 2019) and water vapour stable isotopes (e.g. Munksgaard et al., 2015; Rahul et al., 2016; Saranya et al., 2018). Even after both cyclones had dissipated, progressive rainfall continued at our sampling site due to the presence of residual moisture from the cyclones. Once these residual effects had diminished and rainfall intensity weakened, δ18Ov and δDv started to increase again (Fig. 2), likely due to evaporative effects (Munksgaard et al., 2015; Xu et al., 2019; Jackisch et al., 2022).
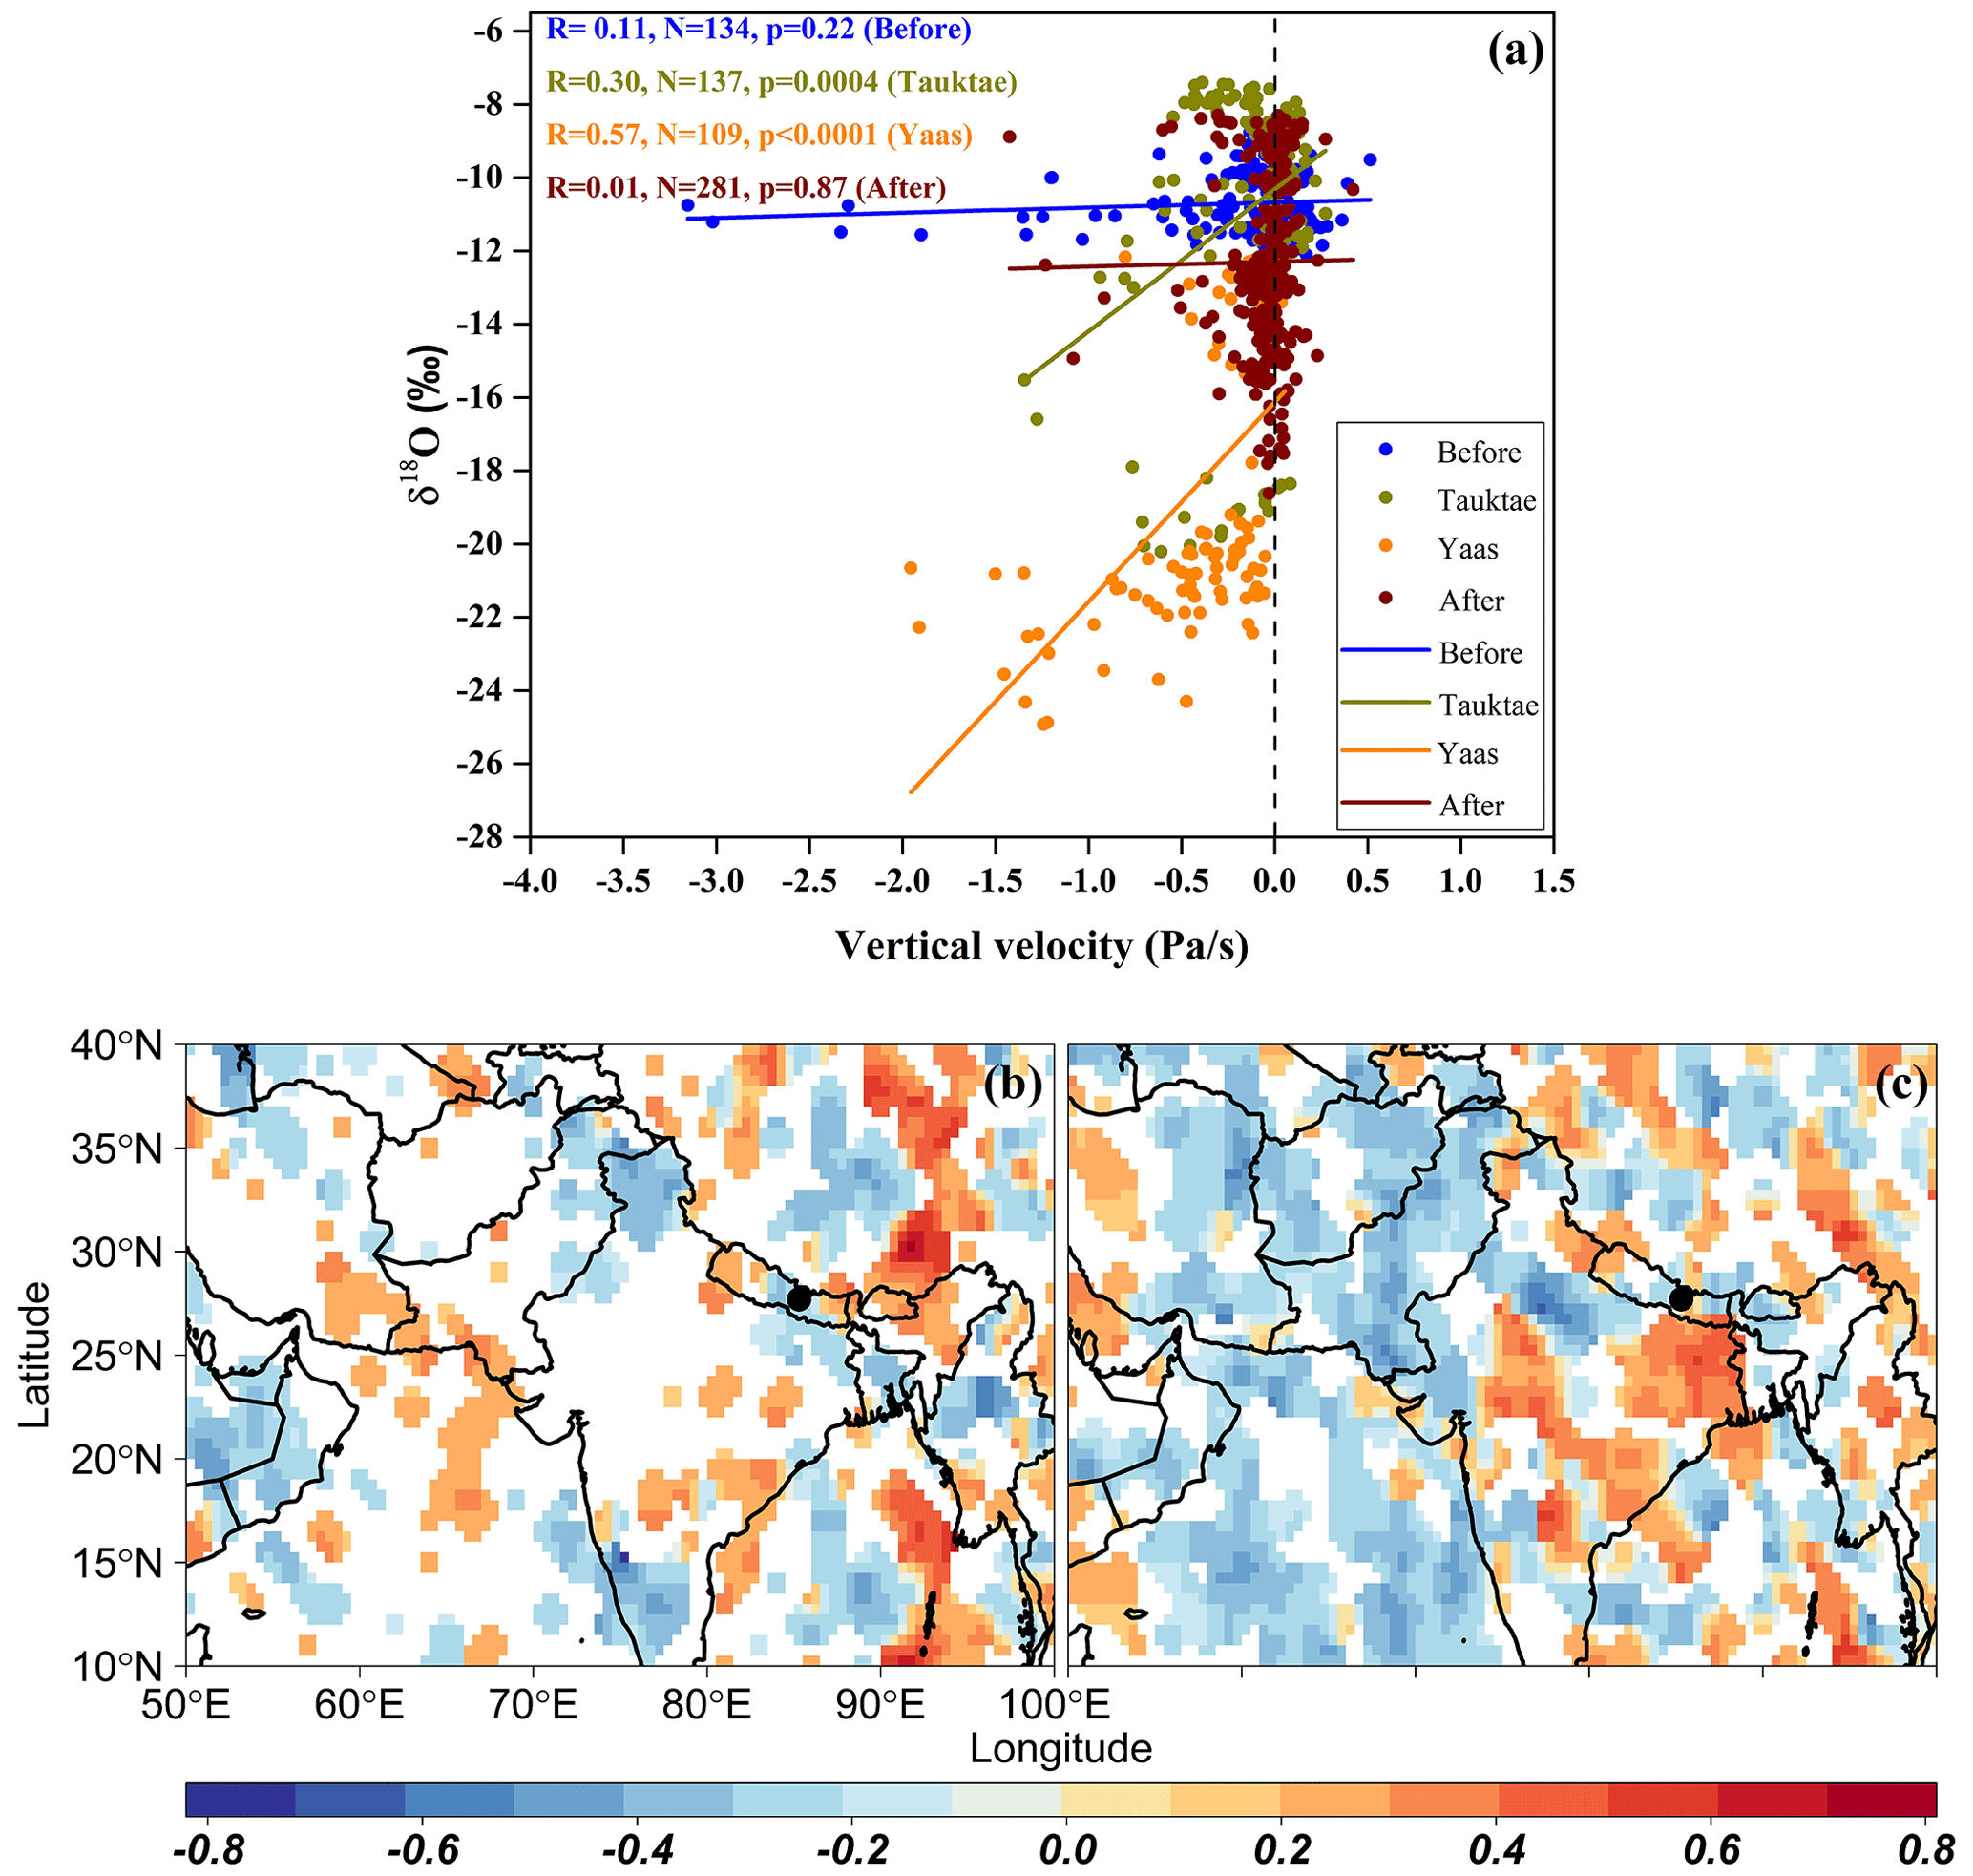
Figure 10(a) Linear regression between δ18Ov and the average vertical velocities at pressure levels between 300 and 600 hPa averaged over 25–28° N and 83–87° E, which has our measurement site near its centre. (b) Spatial distribution of correlation coefficient between δ18Ov and vertical velocity during Tauktae. (c) Same as (b) but during Yaas. The vertical dashed black line in (a) represents the threshold separating ascending (negative values) and descending (positive values) air motions.
3.4 Influence of rainfall
The backward trajectories reveal the impact of separate air masses during cyclones Tauktae and Yaas, specifically between the AS and BoB. We studied the meteorological conditions along the 5 d moisture back trajectories, focusing on the upstream rainout in relation to observed isotopic depletion. During cyclone Tauktae, both δ18Ov and δDv display a strong negative correlation (r = −0.80 and r = −0.79 for δ18Ov and δDv, respectively; Fig. S9) with total precipitation along the moisture trajectories (i.e. upstream rainout). Moreover, a negative correlation emerges between δ18Ov and/or δDv and average relative humidity (RH) along the trajectories (r = −0.69 for δ18Ov and −0.68 for δDv), suggesting that increased upstream rainout corresponds to lower isotope ratios during cyclone Tauktae.
In addition, modelled back trajectories indicate that air masses during cyclone Tauktae had a longer transport time when continuous rainout could have enhanced the isotopic depletion of the residual vapour (Fig. 4, upper-right panel). The upstream rainfall control could also account for the delayed return of δ18Ov and δDv to more positive values following dissipation.
Similar observations have been documented in other regions – for example, the Chinese typhoons Haitang, Megi, and Soudelor (Xu et al., 2019); the Central American hurricanes Irma and Otto (Sánchez-Murillo et al., 2019); and the central Texan hurricane Harvey (Sun et al., 2022) all demonstrate significant negative correlations between upstream rainout and precipitation δ18O. This suggests that upstream rainout could serve as a widely applicable control on the spatiotemporal variability in tropical cyclones (Sun et al., 2022).
In contrast to cyclone Tauktae, neither the total rainfall nor the relative humidity (RH) along the trajectories appears to exert influence over isotopic variation during cyclone Yaas. Instead, a negative correlation was observed between δ18Ov and/or δDv and local rainfall amount, air temperature, and RH (Table 2). This suggests that the observed isotopic depletion during cyclone Yaas cannot be adequately explained by upstream rainout processes. We assume that sudden changes in local meteorological conditions are a consequence of synoptic processes during the cyclones. The progressive rainout during the cyclone events followed a temperature decrease (Fig. 2) which would result in the δ18Ov and/or δDv correlation with temperature (Delattre et al., 2015). The cooling of surface air during rainfall, coupled with the isotopic equilibrium of vapour with raindrops, establishes a positive correlation between δ18Ov and/or δDv and temperature (Midhun et al., 2013). These conditions were favourable during cyclone Yaas because the sampling site experienced consistent rainfall, along with a noticeable increase in relative humidity and a decrease in temperature. This might be one of the reasons for the weaker correlation of δ18Ov and/or δDv with local meteorological variables during Tauktae.
Studies have speculated that the impact of precipitation amount is not confined to a strictly local context (Galewsky et al., 2016) but is subject to modulation by convective and large-scale atmospheric properties including downdraft moisture recycling (Risi et al., 2008), large-scale organized convection and associated stratiform rain (Kurita, 2013), and regional circulation and shifting moisture sources (Lawrence et al., 2004). Our measurements during cyclone Yaas revealed the presence of an intense convective system over our study site, indicating that the observed effect of rainfall amount may have been governed by moisture convergence (Chakraborty et al., 2016). The subsequent rainfall originating from the convective system, occurring over a region characterized by depleted isotope values, resulted in a negative association between precipitation amount and δ18Ov and/or δDv (Kurita, 2013). The 18O-depleted water vapour reaching the sub-cloud layer, accompanied by the intense convective downdrafts, subsequently ascended back to the cloud level with the updrafts in a feedback mechanism proposed by Lekshmy et al. (2014).
3.5 Relation with cloud top temperature and cloud top pressure
Given that cloud top temperature (CTT) and cloud top pressure (CTP) are reliable indicators of both moisture convergence and convective strength (Cai et al., 2018; Cai and Tian, 2016), we investigate the linear correlation between CTT and/or CTP (averaged over the 27–28° N latitude and 85–86° E longitude range, with our site located at the centre) and δ18Ov (Fig. 11). The results demonstrate a weak positive correlation between CTT and/or CTP and δ18Ov during cyclone Tauktae (Fig. 11a, b) and a robust positive correlation during cyclone Yaas (Fig. 11c, d). These correlations exhibit greater strength compared to the correlation observed with local rainfall. Previous research has highlighted positive correlations between δ18O and CTT and/or CTP in the East Asian monsoon, suggesting that intense convection and moisture convergence lead to an increase in cloud top height and a decrease in CTT, causing a reduction in δ18O (Cai and Tian, 2016). The decrease in δ18Ov during cyclone Yaas coupled with a decrease in CTT and CTP (i.e. increase in cloud top height) shows the influence of intensified convective activities and moisture convergence, while the isotopic depletion during cyclone Tauktae is attributed to upstream rainout processes. Furthermore, a negative correlation is evident between d-excessv and CTT and/or CTP, with r = −0.52 and r = −0.60 during cyclone Yaas. Conversely, a weak positive correlation is observed during cyclone Tauktae, with r = 0.32 for both CTT and CTP. This relationship implies that lower CTT and CTP during intense convection relate to increased d-excessv values during the final stage of cyclone Yaas.
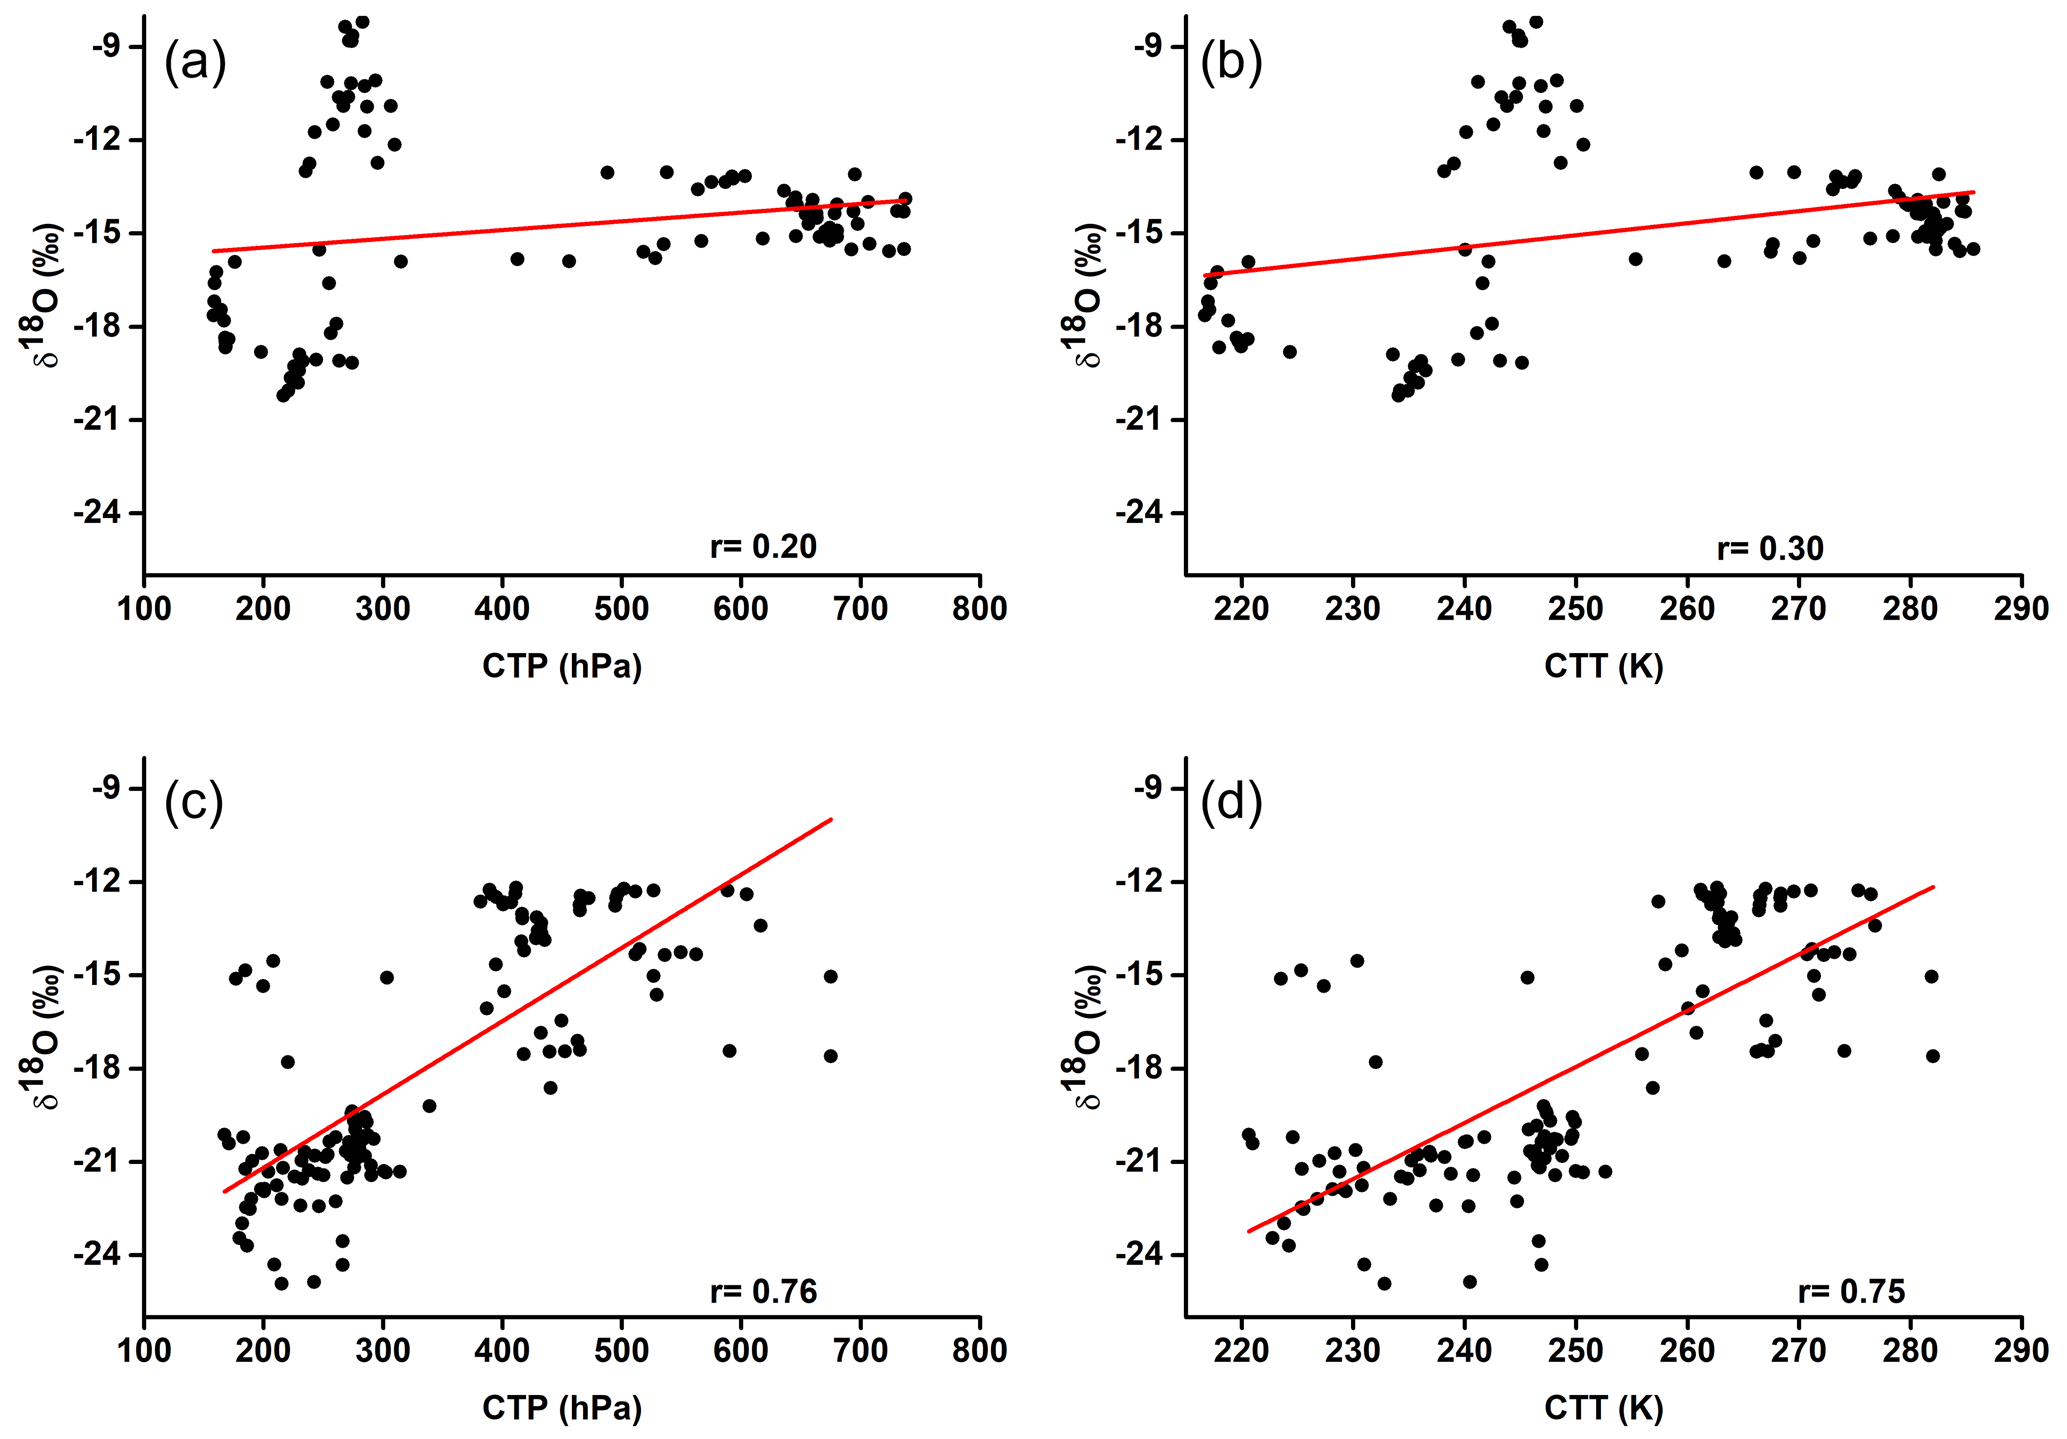
Figure 11Relationship between hourly δ18Ov and (a) CTT during Tauktae, (b) CTP during Tauktae, (c) CTT during Yaas, and (d) CTP during Yaas.
This study presented the results of continuous measurements of the isotopic composition of atmospheric water vapour over Kathmandu between 7 May and 7 June 2021, covering two cyclone events: cyclone Tauktae, formed over the Arabian Sea, and cyclone Yaas, formed over the Bay of Bengal. δ18Ov (δDv) during Tauktae varied from −8.20 ‰ (−56.06 ‰) to −20.21 ‰ (−149.49 ‰), with an average of −14.73 ‰ (−106.76 ‰), and during Yaas, δ18Ov (δDv) ranged from −12.17 ‰ (−83.85 ‰) to −24.92 ‰ (−183.34 ‰), with an average of −17.87 ‰ (−129.18 ‰). Similarly, d-excessv during Tauktae varied from 7.97 ‰ to 14.24 ‰, with an average of 11.06 ‰, while during Yaas, it varied from 8.71 ‰ to 18.29 ‰, with an average of 13.77 ‰. Both cyclones led to significant depletion of δ18Ov and δDv, with δ18Ov decreasing by over 12 ‰. We attribute these rapid depletions to changes in moisture sources (local vs. marine) inferred from backward moisture trajectories. The lower intercepts of the local meteoric vapour line before and after the events highlight the influence of non-equilibrium processes such as evaporation over the isotopic composition. The spatial distribution of OLR, vertical velocity, and regional precipitation during both cyclonic events indicated significant moisture convergence and intense convection at and around the measurement site. This resulted in depleted δ18Ov and δDv, with cyclone Yaas exhibiting stronger moisture convergence and convection, leading to lower δ18Ov values compared to cyclone Tauktae. This difference may be attributed to robust downdrafts during Yaas-related convective rain events, potentially transporting vapour with higher d-excessv and lower δ18Ov values to the surface. The observed isotopic depletion during cyclone Tauktae can be explained by upstream rainout processes.
Overall, our results show that tropical cyclones originating in the BoB and the AS during the pre-monsoon season transport large amounts of isotopically depleted vapour and produce moderate to heavy rainfall over a sizeable region in Nepal. The isotopic composition of atmospheric water vapour and precipitation during the dry season should therefore be interpreted with caution, and the effects of cyclones should not be underestimated. In addition, our results underline the need for simultaneous measurements of the isotopic composition of both atmospheric water vapour and precipitation to better understand post-condensation exchanges between falling raindrops and boundary layer vapour over Kathmandu.
The data used in this study are available in the Zenodo repository at https://zenodo.org/records/10776701 (Gao and Adhikari, 2024).
The supplement related to this article is available online at: https://doi.org/10.5194/acp-24-3279-2024-supplement.
NA: data curation, formal analysis, writing – original draft preparation. JG: data curation, conceptualization, methodology, supervision, writing – review and editing, funding acquisition. AZ: measuring assistance, writing – editing. TX, MC, and XN: measuring assistance. TY: supervision, funding acquisition.
The contact author has declared that none of the authors has any competing interests.
Publisher’s note: Copernicus Publications remains neutral with regard to jurisdictional claims made in the text, published maps, institutional affiliations, or any other geographical representation in this paper. While Copernicus Publications makes every effort to include appropriate place names, the final responsibility lies with the authors.
This work was funded by The Second Tibetan Plateau Scientific Expedition and Research (STEP) project (grant no. 2019QZKK0208) and the National Natural Science Foundation of China (grant nos. 41922002 and 41988101-03). We thank Yulong Yang for his assistance with the instrument set-up and initial running.
This research has been supported by the National Natural Science Foundation of China (grant nos. 41922002 and 41988101-03) and the Second Tibetan Plateau Scientific Expedition and Research (STEP) project (grant no. 2019QZKK0208).
This paper was edited by Farahnaz Khosrawi and reviewed by two anonymous referees.
Acharya, S., Yang, X., Yao, T., and Shrestha, D.: Stable isotopes of precipitation in Nepal Himalaya highlight the topographic influence on moisture transport, Quatern. Int., 565, 22–30, https://doi.org/10.1016/j.quaint.2020.09.052, 2020.
Adhikari, N., Gao, J., Yao, T., Yang, Y., and Dai, D.: The main controls of the precipitation stable isotopes at Kathmandu, Nepal, Tellus B, 72, 1–17, https://doi.org/10.1080/16000889.2020.1721967, 2020.
Bohlinger, P., Sorteberg, A., and Sodemann, H.: Synoptic conditions and moisture sources actuating extreme precipitation in Nepal, J. Geophys. Res.-Atmos., 122, 12653–12671, https://doi.org/10.1002/2017JD027543, 2017.
Boschi, R. and Lucarini, V.: Water pathways for the Hindu-Kush-Himalaya and an analysis of three flood events, Atmosphere, 10, 489, https://doi.org/10.3390/atmos10090489, 2019.
Brand, W. A., Geilmann, H., Crosson, E. R., and Rella, C. W.: Cavity ring-down spectroscopy versus high-temperature conversion isotope ratio mass spectrometry; a case study on delta (2) H and delta (18) O of pure water samples and alcohol/water mixtures, Rapid Commun. Mass Spectrom., 23, 1879–1884, https://doi.org/10.1002/rcm.4083, 2009.
Breitenbach, S. F. M., Adkins, J. F., Meyer, H., Marwan, N., Kumar, K. K., and Haug, G. H.: Strong influence of water vapor source dynamics on stable isotopes in precipitation observed in Southern Meghalaya, NE India, Earth Planet. Sc. Lett., 292, 212–220, https://doi.org/10.1016/j.epsl.2010.01.038, 2010.
Cai, Z. and Tian, L.: Atmospheric controls on seasonal and interannual variations in the precipitation isotope in the East Asian Monsoon region, J. Climate, 29, 1339–1352, https://doi.org/10.1175/JCLI-D-15-0363.1, 2016.
Cai, Z., Tian, L., and Bowen, G. J.: Spatial-seasonal patterns reveal large-scale atmospheric controls on Asian Monsoon precipitation water isotope ratios, Earth Planet. Sc. Lett., 503, 158–169, https://doi.org/10.1016/j.epsl.2018.09.028, 2018.
Chakraborty, S., Sinha, N., Chattopadhyay, R., Sengupta, S., Mohan, P. M., and Datye, A.: Atmospheric controls on the precipitation isotopes over the Andaman Islands, Bay of Bengal, Sci. Rep., 6, 1–11, https://doi.org/10.1038/srep19555, 2016.
Chan, K. T. F., Chan, J. C. L., Zhang, K., and Wu, Y.: Uncertainties in tropical cyclone landfall decay, npj Clim. Atmos. Sci., 5, 93, https://doi.org/10.1038/s41612-022-00320-z, 2022.
Chen, F., Huang, C., Lao, Q., Zhang, S., Chen, C., Zhou, X., Lu, X., and Zhu, Q.: Typhoon Control of Precipitation Dual Isotopes in Southern China and Its Palaeoenvironmental Implications, J. Geophys. Res.-Atmos., 126, 1–15, https://doi.org/10.1029/2020JD034336, 2021.
Chhetri, T. B., Yao, T., Yu, W., Ding, L., Joswiak, D., Tian, L., Devkota, L. P., and Qu, D.: Stable isotopic compositions of precipitation events from Kathmandu, southern slope of the Himalayas, Chinese Sci. Bull., 59, 4838–4846, https://doi.org/10.1007/s11434-014-0547-4, 2014.
Conroy, J. L., Noone, D., Cobb, K. M., Moerman, J. W., and Konecky, B. L.: Paired stable isotopologues in precipitation and vapor: A case study of the amount effect within western tropical Pacific storms, J. Geophys. Res.-Atmos., 121, 3290–3303, https://doi.org/10.1002/2015JD023844, 2016.
Dansgaard, W.: Stable isotopes in precipitation, Tellus 16, 436–468, https://doi.org/10.3402/tellusa.v16i4.8993, 1964.
Delattre, H., Vallet-Coulomb, C., and Sonzogni, C.: Deuterium excess in the atmospheric water vapour of a Mediterranean coastal wetland: regional vs. local signatures, Atmos. Chem. Phys., 15, 10167–10181, https://doi.org/10.5194/acp-15-10167-2015, 2015.
Draxler, R. R. and Hess, G. D.: Description of the HYSPLIT4 modeling system, NOAA Technical Memorandum ERL ARL-224, Air Resources Laboratory, Silver Spring, Maryland, 1997.
Fudeyasu, H., Ichiyanagi, K., Sugimoto, A., Yoshimura, K., Ueta, A., Yamanaka, M. D., and Ozawa, K.: Isotope ratios of precipitation and water vapor observed in Typhoon Shanshan, J. Geophys. Res.-Atmos., 113, D12113, https://doi.org/10.1029/2007JD009313, 2008.
Galewsky, J. and Samuels-Crow, K.: Summertime moisture transport to the southern South American Altiplano: Constraints from in situ measurements of water vapor isotopic composition, J. Climate, 28, 2635–2649, https://doi.org/10.1175/JCLI-D-14-00511.1, 2015.
Galewsky, J., Steen-larsen, H.C., Field, R.D., Risi, W.C., and Schneider, M.: Stable isotopes in atmospheric water vapor and application to the hydrologic cycle., Rev. Geophys., 54, 809–865, https://doi.org/10.1002/2015RG000512, 2016.
Gao, J. and Adhikari, N.: Spring tropical cyclones modulate near-surface isotopic compositions of atmospheric water vapour at Kathmandu, Nepal, Version v1, Zenodo [data set], https://zenodo.org/records/10776701 (last access: 4 March 2024), 2024.
Gaona, M. F. R., Villarini, G., Zhang, W., and Vecchi, G. A.: The added value of IMERG in characterizing rainfall in tropical cyclones, Atmos. Res., 209, 95–102, https://doi.org/10.1016/j.atmosres.2018.03.008, 2018.
Gedzelman, S., Lawrence, J., Gamache, J., Black, M., Hindman, E., Black, R., Dunion, J., Willoughby, H., and Zhang, X.: Probing hurricanes with stable isotopes of rain and water vapor, Mon. Weather Rev., 131, 1112–1127, https://doi.org/10.1175/1520-0493(2003)131<1112:phwsio>2.0.co;2, 2003.
Han, X., Lang, Y., Wang, T., Liu, C.Q., Li, F., Wang, F., Guo, Q., Li, S., Liu, M., Wang, Y., and Xu, A.: Temporal and spatial variations in stable isotopic compositions of precipitation during the typhoon Lekima (2019), China, Sci. Total Environ., 762, 143143, https://doi.org/10.1016/j.scitotenv.2020.143143, 2021.
Hassenruck-Gudipati, H. J., Andermann, C., Dee, S., Brunello, C. F., Baidya, K. P., Sachse, D., Meyer, H., and Hovius, N.: Moisture Sources and Pathways Determine Stable Isotope Signature of Himalayan Waters in Nepal, AGU Adv., 4, 1–19, https://doi.org/10.1029/2022av000735, 2023.
He, S. and Richards, K.: Stable isotopes in monsoon precipitation and water vapour in Nagqu, Tibet, and their implications for monsoon moisture, J. Hydrol., 540, 615–622, https://doi.org/10.1016/j.jhydrol.2016.06.046, 2016.
Hersbach, H., Bell, B., Berrisford, P., Hirahara, S., Horányi, A., Muñoz-Sabater, J., Nicolas, J., Peubey, C., Radu, R., and Schepers, D.: The ERA5 global reanalysis, Q. J. Roy. Meteor. Soc. 146, 1999–2049, https://doi.org/10.1002/qj.3803, 2020.
Hoffmann, G., Cuntz, M., Jouzel, J., and Werner, M.: A systematic comparison between the IAEA/GNIP isotope network and the ECHAM 4 atmospheric general circulation model: How much climate information is in the water isotopes?, in: Isotopes in the Water Cycle, Past, Present and Future of a Developing Science, edited by: Aggarwal, P. K., Gat, J. R., and Froehlich, K. F. O., Springer, New York, 303–320, 2005.
Huffman, G. J., Bolvin, D., Braithwaite, D., Hsu, K., Joyce, R., Kidd, C., Nelkin, E. J., Sorooshian, S., Tan, J., and Xie, P.: Algorithm Theoretical Basis Document (ATBD) of Integrated Multi-satellitE Retrievals for GPM (IMERG), version 4.6, NASA, https://pmm.nasa.gov/sites/default/files/document_files/IMERG_ATBD_V4.6.pdf (last access: 11 July 2023), 2017.
Hussain, S., Xianfang, S., Hussain, I., Jianrong, L., Dong Mei, H., Li Hu, Y., and Huang, W.: Controlling Factors of the Stable Isotope Composition in the Precipitation of Islamabad, Pakistan, Adv. Meteorol., 2015, 1–11, https://doi.org/10.1155/2015/817513, 2015.
Jackisch, D., Yeo, B. X., Switzer, A. D., He, S., Cantarero, D. L. M., Siringan, F. P., and Goodkin, N. F.: Precipitation stable isotopic signatures of tropical cyclones in Metropolitan Manila, Philippines, show significant negative isotopic excursions, Nat. Hazards Earth Syst. Sci., 22, 213–226, https://doi.org/10.5194/nhess-22-213-2022, 2022.
Kendall, C. and Caldwell, E. A.: Fundamentals of Isotope Geochemistry, in: Isotope Tracers in Catchment Hydrology, edited by: Kendall, C. and McDonnell, J. J., Elsevier, Amsterdam, 51–86, https://doi.org/10.1016/B978-0-444-81546-0.50009-4, 1998.
Kleist, D. T., Parrish, D. F., Derber, J. C., Treadon, R., Wu, W.-S., and Lord, S.: Introduction of the GSI into the NCEP global data assimilation system, Weather Forecast., 24, 1691–1705, https://doi.org/10.1175/2009waf2222201.1, 2009.
Knapp, K. R., Kruk, M. C., Levinson, D. H., Diamond, H. J., and Neumann, C. J.: The international best track archive for climate stewardship (IBTrACS) unifying tropical cyclone data, B. Am. Meteorol. Soc., 91, 363–376, https://doi.org/10.1175/2009bams2755.1, 2010.
Krishnamurthy, V. and Shukla, J.: Intraseasonal and seasonally persisting patterns of Indian monsoon rainfall, J. Climate, 20, 3–20, https://doi.org/10.1175/jcli3981.1, 2007.
Kurita, N.: Water isotopic variability in response to mesoscale convective system over the tropical ocean, J. Geophys. Res.-Atmos., 118, 10376–10390, https://doi.org/10.1002/jgrd.50754, 2013.
Kurita, N., Noone, D., Risi, C., Schmidt, G. A., Yamada, H., and Yoneyama, K.: Intraseasonal isotopic variation associated with the Madden-Julian Oscillation, J. Geophys. Res.-Atmos., 116, 1–20, https://doi.org/10.1029/2010JD015209, 2011.
Lawrence, R. J. and Gedzelman, D. S.: Low stable isotope ratios of tropical cyclone rains, Geophys. Res. Lett., 23, 527–530, https://doi.org/10.1029/96gl00425, 1996.
Lawrence, J. R., Gedzelman, S. D., Zhang, X., and Arnold, R.: Stable isotope ratios of rain and vapor in 1995 hurricanes, J. Geophys. Res.-Atmos., 103, 11381–11400, https://doi.org/10.1029/97jd03627, 1998.
Lawrence, J. R., Gedzelman, S. D., Gamache, J., and Black, M.: Stable isotope ratios: hurricane Olivia, J. Atmos. Chem., 41, 67–82, 2002.
Lawrence, J. R., Gedzelman, S. D., Dexheimer, D., Cho, H. K., Carrie, G. D., Gasparini, R., Anderson, C. R., Bowman, K. P., and Biggerstaff, M. I.: Stable isotopic composition of water vapor in the tropics, J. Geophys. Res.-Atmos., 109, D06115, https://doi.org/10.1029/2003jd004046, 2004.
Lekshmy, P. R., Midhun, M., Ramesh, R., and Jani, R. A.: 18O depletion in monsoon rain relates to large scale organized convection rather than the amount of rainfall, Sci. Rep., 4, 1–5, https://doi.org/10.1038/srep05661, 2014.
Lekshmy, P. R., Midhun, M., and Ramesh, R.: Spatial variation of amount effect over peninsular India and Sri Lanka: Role of seasonality, Geophys. Res. Lett., 42, 5500–5507, https://doi.org/10.1002/2015GL064517, 2015.
Lekshmy, P. R., Midhun, M., and Ramesh, R.: Role of moisture transport from Western Pacific region on water vapor isotopes over the Bay of Bengal, Atmos. Res., 265, 105895, https://doi.org/10.1016/j.atmosres.2021.105895, 2022.
Li, L. and Chakraborty, P.: Slower decay of landfalling hurricanes in a warming world, Nature 587, 230–234, https://doi.org/10.1038/s41586-020-2867-7, 2020.
Liebmann, B. and Smith, C. A.: Description of a complete (interpolated) outgoing longwave radiation dataset, B. Am. Meteorol. Soc., 77, 1275–1277, 1996.
Liu, Z., Tian, L., Yao, T., and Yu, W.: Seasonal deuterium excess in Nagqu precipitation: Influence of moisture transport and recycling in the middle of Tibetan Plateau, Environ. Geol., 55, 1501–1506, https://doi.org/10.1007/s00254-007-1100-4, 2008.
Midhun, M., Lekshmy, P. R., and Ramesh, R.: Hydrogen and oxygen isotopic compositions of water vapor over the Bay of Bengal during monsoon, Geophys. Res. Lett., 40, 6324–6328, https://doi.org/10.1002/2013GL058181, 2013.
Midhun, M., Lekshmy, P. R., Ramesh, R., Yoshimura, K., Sandeep, K. K., Kumar, S., Sinha, R., Singh, A., and Srivastava, S.: The effect of monsoon circulation on the stable isotopic composition of rainfall, J. Geophys. Res.-Atmos., 123, 5205–5221, https://doi.org/10.1029/2017JD027427, 2018.
Mohapatra, M., Srivastava, A. K., Balachandran, S., and Geetha, B.: Inter-annual variation and trends in Tropical Cyclones and Monsoon Depressions over the North Indian Ocean, Observed Climate Variability and Change over the Indian Region, Springer Geology, 89–106, https://doi.org/10.1007/978-981-10-2531-0_6, 2016.
Munksgaard, N. C., Zwart, C., Kurita, N., Bass, A., Nott, J., and Bird, M. I.: Stable isotope anatomy of tropical cyclone ita, North-Eastern Australia, April 2014, PLoS One, 10, 1–15, https://doi.org/10.1371/journal.pone.0119728, 2015.
Noone, D.: Pairing measurements of the water vapor isotope ratio with humidity to deduce atmospheric moistening and dehydration in the tropical midtroposphere, J. Climate, 25, 4476–4494, https://doi.org/10.1175/JCLI-D-11-00582.1, 2012.
Pandya, U., Khandelval, S., Sanghvi, H., Joshi, E., Vekaria, G.L., Jaaffrey, S. N. A., and Soni, M.: Cyclone “TAUKTAE”-Observed through data & satellite images, https://www.irjmets.com/pastvolumeissue.php (last access: 5 May 2022), 2021.
Paul, S. and Chowdhury, S.: Investigation of the character and impact of tropical cyclone Yaas: a study over coastal districts of West Bengal, India, Saf. Extrem. Environ., 3, 219–235, https://doi.org/10.1007/s42797-021-00044-y, 2021.
Payne, V. H., Noone, D., Dudhia, A., Piccolo, C., and Grainger, R. G.: Global satellite measurements of HDO and implications for understanding the transport of water vapour into the stratosphere, Q. J. Roy. Meteor. Soc., 133, 1459–1471, https://doi.org/10.1002/qj.127, 2007.
Pfahl, S. and Sodemann, H.: What controls deuterium excess in global precipitation?, Clim. Past, 10, 771–781, https://doi.org/10.5194/cp-10-771-2014, 2014.
Rahul, P., Ghosh, P., Bhattacharya, S. K., and Yoshimura, K.: Controlling factors of rainwater and water vapor isotopes at Bangalore, India: Constraints from observations in 2013 Indian monsoon, J. Geophys. Res., 121, 13936–13952, https://doi.org/10.1002/2016JD025352, 2016.
Rajeev, A. and Mishra, V.: Observational evidence of increasing compound tropical cyclone-moist heat extremes in India, Earths Future, 10, e2022EF002992, https://doi.org/10.1029/2022ef002992, 2022.
Risi, C., Bony, S., and Vimeux, F.: Influence of convective processes on the isotopic composition (δ18O and δD) of precipitation and water vapor in the tropics: 2. Physical interpretation of the amount effect, J. Geophys. Res.-Atmos., 113, 1–12, https://doi.org/10.1029/2008JD009943, 2008.
Sánchez-Murillo, R., Durán-Quesada, A. M., Esquivel-Hernández, G., Rojas-Cantillano, D., Birkel, C., Welsh, K., Sánchez-Llull, M., Alonso-Hernández, C. M., Tetzlaff, D., Soulsby, C., Boll, J., Kurita, N., and Cobb, K. M.: Deciphering key processes controlling rainfall isotopic variability during extreme tropical cyclones, Nat. Commun., 10, 1–10, https://doi.org/10.1038/s41467-019-12062-3, 2019.
Saranya, P., Krishan, G., Rao, M. S., Kumar, S., and Kumar, B.: Controls on water vapor isotopes over Roorkee, India: Impact of convective activities and depression systems, J. Hydrol., 557, 679–687, https://doi.org/10.1016/j.jhydrol.2017.12.061, 2018.
Singh, A., Jani, R. A., and Ramesh, R.: Spatiotemporal variations of the ä18O–salinity relation in the northern Indian Ocean, Deep-Sea Res. Pt. I, 57, 1422–1431, https://doi.org/10.1016/j.dsr.2010.08.002, 2010.
Steen-Larsen, H. C., Sveinbjörnsdottir, A. E., Peters, A. J., Masson-Delmotte, V., Guishard, M. P., Hsiao, G., Jouzel, J., Noone, D., Warren, J. K., and White, J. W. C.: Climatic controls on water vapor deuterium excess in the marine boundary layer of the North Atlantic based on 500 days of in situ, continuous measurements, Atmos. Chem. Phys., 14, 7741–7756, https://doi.org/10.5194/acp-14-7741-2014, 2014.
Sun, C., Tian, L., Shanahan, T. M., Partin, J. W., Gao, Y., Piatrunia, N., and Banner, J.: Isotopic variability in tropical cyclone precipitation is controlled by Rayleigh distillation and cloud microphysics, Commun. Earth Environ., 3, 50, https://doi.org/10.1038/s43247-022-00381-1, 2022.
Tian, L., Masson-Delmotte, V., Stievenard, M., Yao, T., and Jouzel, J.: Tibetan Plateau summer monsoon northward extent revealed by measurements of water stable isotopes, J. Geophys. Res., 106, 28081–28088, https://doi.org/10.1029/2001JD900186, 2001a.
Tian, L., Yao, T., Numaguti, A., and Sun, W.: Stable isotope variations in monsoon precipitation on the Tibetan Plateau, J. Meteorol. Soc. Jpn., 79, 959–966, https://doi.org/10.2151/jmsj.79.959, 2001b.
Tian, L., Yu, W., Schuster, P. F., Wen, R., Cai, Z., Wang, D., Shao, L., Cui, J., and Guo, X.: Control of seasonal water vapor isotope variations at Lhasa, southern Tibetan Plateau, J. Hydrol., 580, 124237, https://doi.org/10.1016/j.jhydrol.2019.124237, 2020.
Uemura, R., Matsui, Y., Yoshimura, K., Motoyama, H., and Yoshida, N.: Evidence of deuterium excess in water vapor as an indicator of ocean surface conditions, J. Geophys. Res.-Atmos., 113, D19114,, https://doi.org/10.1029/2008jd010209, 2008.
Verma, K. and Gupta, A.: Cyclone Tauktae: Cyclones, Their Impacts and Disasters Risk Management, https://www.researchgate.net/profile/Anil-Gupta-9/publication/ 354450767_Cyclone_Tauktae_Cyclones_Their_Impacts_and_ Disasters_Risk_Management/links/6138ff0ec76de21e319f6c3f/ Cyclone-Tauktae-Cyclones-Their-Impacts-and-Disasters-Risk-Management.pdf (last access: 11 July 2023), 2021.
Villarini, G., Smith, J. A., Baeck, M. L., Marchok, T., and Vecchi, G. A.: Characterization of rainfall distribution and flooding associated with US landfalling tropical cyclones: Analyses of Hurricanes Frances, Ivan, and Jeanne (2004), J. Geophys. Res.-Atmos., 116, D23116, https://doi.org/10.1029/2011jd016175, 2011.
Wang, G., Lan, H., and Liu, Z.: Stable isotope record of super typhoon Lekima (2019), Atmos. Res., 264, 105822, https://doi.org/10.1016/j.atmosres.2021.105822, 2021.
Wei, Z., Yoshimura, K., Okazaki, A., Ono, K., Kim, W., Yokoi, M., and Lai, C. T.: Understanding the variability of water isotopologues in near-surface atmospheric moisture over a humid subtropical rice paddy in Tsukuba, Japan, J. Hydrol., 533, 91–102, https://doi.org/10.1016/j.jhydrol.2015.11.044, 2016.
Worden, J., Noone, D., and Bowman, K.: Importance of rain evaporation and continental convection in the tropical water cycle, Nature, 445, 528–532, https://doi.org/10.1038/nature05508, 2007.
Xu, T., Sun, X., Hong, H., Wang, X., Cui, M., Lei, G., Gao, L., Liu, J., Lone, M. A., and Jiang, X.: Stable isotope ratios of typhoon rains in Fuzhou, Southeast China, during 2013–2017, J. Hydrol., 570, 445–453, https://doi.org/10.1016/j.jhydrol.2019.01.017, 2019.
Yao, T., Zhang, X., Guan, H., Zhou, H., Hua, M., and Wang, X.: Climatic and environmental controls on stable isotopes in atmospheric water vapor near the surface observed in Changsha, China, Atmos. Environ., 189, 252–263, https://doi.org/10.1016/j.atmosenv.2018.07.008, 2018.
Yoshimura, K.: Stable Water Isotopes in Climatology, Meteorology, and Hydrology: A Review, J. Meteorol. Soc. Jpn., 93, 513–533, https://doi.org/10.2151/jmsj.2015-036, 2015.
Yu, W., Yao, T., Tian, L., Ma, Y., Ichiyanagi, K., Wang, Y., and Sun, W.: Relationships between δ18O in precipitation and air temperature and moisture origin on a south-north transect of the Tibetan Plateau, Atmos. Res., 87, 158–169, https://doi.org/10.1016/j.atmosres.2007.08.004, 2008.
Yu, W., Yao, T., Tian, L., Ma, Y., Wen, R., Devkota, L. P., Wang, W., Qu, D., and Chhetri, T. B.: Short-term variability in the dates of the Indian monsoon onset and retreat on the southern and northern slopes of the central Himalayas as determined by precipitation stable isotopes, Clim. Dynam., 47, 159–172, https://doi.org/10.1007/s00382-015-2829-1, 2016.