the Creative Commons Attribution 4.0 License.
the Creative Commons Attribution 4.0 License.
 | 12 Mar 2024
Fire–precipitation interactions amplify the quasi-biennial variability in fires over southern Mexico and Central America
Yawen Liu
Yun Qian
Philip J. Rasch
Kai Zhang
Lai-yung Ruby Leung
Yuhang Wang
Minghuai Wang
Hailong Wang
Xin Huang
Xiu-Qun Yang
Fires have great ecological, social, and economic impact. However, fire prediction and management remain challenges due to a limited understanding of their roles in the Earth system. Fires over southern Mexico and Central America (SMCA) are a good example of this, greatly impacting local air quality and regional climate. Here we report that the spring peak (April–May) of fire activities in this region has a distinct quasi-biennial signal based on multiple satellite datasets measuring different fire characteristics. The variability is initially driven by quasi-biennial variations in precipitation. Composite analysis indicates that strong fire years correspond to suppressed ascending motion and weakened precipitation over the SMCA. The anomalous precipitation over the SMCA is further found to be mostly related to the East Pacific–North Pacific (EP-NP) pattern 2 months prior to the fire season. The positive phase of the EP-NP leads to enhanced precipitation over the eastern US but suppressed precipitation over the SMCA, similar to the spatial pattern of precipitation differences between strong and weak fire years. Meanwhile, the quasi-biennial signals in precipitation and fires appear to be amplified by their interactions through a positive feedback loop at short timescales. Model simulations show that in strong fire years, more aerosol particles are released and transported downstream over the Gulf of Mexico and the eastern US, where suspended light-absorbing aerosols warm the atmosphere and cause the ascending motion of the air aloft. Subsequently, a compensating downward motion is formed over the region of the fire source and ultimately suppresses precipitation and intensifies fires. Statistical analysis shows the different durations of the two-way interaction, where the fire suppression effect of precipitation lasts for more than 20 d, while fire leads to a decrease in precipitation at shorter timescales (3–5 d). This study demonstrates the importance of fire–climate interactions in shaping the fire activities on an interannual scale and highlights how precipitation–fire interactions at short timescales contribute to the interannual variability in both fire and precipitation.
- Article
(10438 KB) - Full-text XML
-
Supplement
(1299 KB) - BibTeX
- EndNote


Natural and human-induced fires are key features of the Earth system (Bowman et al., 2009). Large uncontrolled fires damage biodiversity, affect human health, and incur high economic costs (Knorr et al., 2017; Aguilera et al., 2021; Bowman et al., 2017). Comprehensive knowledge of the causes of fire, their variability, and the effects of climate is necessary to accommodate or manage fires effectively and to mitigate adverse societal impact.
Changes in climate alter fire regimes (Power et al., 2008; Jolly et al., 2015) because the occurrence and intensity of fires depend on meteorological factors such as precipitation, wind, and humidity (Flannigan et al., 2009; Marlon et al., 2008; Abram et al., 2021; Fang et al., 2021). Fires alter weather and climate as well: they are important sources of the aerosol particles that modify the Earth's energy and water budget, either by directly absorbing and scattering sunlight or by affecting cloud microphysical processes (Voulgarakis and Field, 2015; Jiang et al., 2020; Liu et al., 2018; Yue et al., 2022; Lu et al., 2018). There are many modes of interaction. The modes are complex, operate through a variety of mechanisms, and manifest on a large variety of timescales and space scales (Ding et al., 2021; Zhang et al., 2022). For example, Huang et al. (2023) have demonstrated that synoptic-scale fire–weather feedback plays a primary role in driving extreme fires in the Mediterranean and monsoon climate regimes over the US West Coast and southeastern Asia. On interannual scales, fires in equatorial Asia have been shown to affect sea surface temperature (SST), land temperature, and atmospheric stability and to influence El Niño–Southern Oscillation (ENSO) at 3–6-year timescales (Tosca et al., 2010). The extreme 2019–2020 Australian fires were also shown to contribute to the strong 2020–2022 La Niña event by enhancing cloud albedo, cooling and drying out the air, and forming positive feedback between the northward migration of the intertropical convergence zone and sea surface temperature cooling in the Niño 3.4 region (Fasullo et al., 2023). Moreover, at even longer timescales, fires can affect the accumulation of carbon dioxide and methane by modifying global features like the Hadley circulation that changes precipitation and temperature patterns and eventually affects forest ecosystems to produce feedback operating over decades and centuries (Crutzen and Andreae, 1990; Page et al., 2002; Tosca et al., 2013). Hence, it is necessary to explore fire characteristics with special consideration of their multi-scale variability and feedback.
From a global perspective, fires occur progressively more frequently towards the tropics (Mouillot and Field, 2005). Tropical savanna and forest burning contributes approximately 80 % of global open fire emissions (Bond et al., 2013). However, tropical regions also feature a great diversity of climate weather systems that affect fire occurrence and seasonality. In the tropical Northern Hemisphere, fires over tropical southern Mexico and Central America (SMCA) occur during the February–May dry season and peak in April–May (Magi et al., 2012). These fire activities have a substantial influence on local air quality and human health (e.g., over Mexico City (19–20° N, 98–100° W) and the Yucatán Peninsula (Crounse et al., 2009; Yokelson et al., 2007, 2009)). Fire emissions from the SMCA region also affect the eastern US after long-range transport (Kreidenweis et al., 2001; Lee et al., 2006; Rogers and Bowman, 2001). Understanding the processes that shape fire variability over this region is thus important locally (for air quality and fire management) and over broader regions.
Here, for the first time, we report a distinct quasi-biennial variability in fire activities over the southern Mexico and Central America region (SMCA; 10–25° N, 80–100° W) during the peak burning months (April–May) from 2003–2019 by validating different fire characteristics with the use of multiple independent datasets. We further explore the dominant causes of this quasi-biennial signal and provide concrete evidence for positive fire–precipitation feedback at short timescales to amplify the quasi-biennial signal based on model simulations.
2.1 Observations
Two sets of fire emission inventories were used to investigate the interannual variability in fire activities. The Global Fire Emissions Database Version 4.1 with small fires (GFEDv4.1s) is a bottom-up inventory that generates fire-consumed dry matter data using fire-burned areas combined with emission factors (Giglio et al., 2013; Randerson et al., 2012). GFEDv4.1s provides monthly mean fire-consumed dry matter in total and for individual fire types at a 0.25° spatial resolution. The Quick Fire Emissions Dataset (QFED) is a top-down emission inventory that generates fire emissions using empirical relationships between fire-consumed dry matter and fire radiative power (Koster et al., 2015). Daily emissions of fire-emitted species at a 0.1° horizontal resolution from QFED Version2.5 were examined. Since the interannual variations in different species are consistent, only the variation in fire-emitted black carbon (BC) is shown here. We focused on the fire activities after 2003 to exclude the influence of two extremely strong ENSO events, specifically the 1997–1998 El Niño event and the subsequent 1998–2000 La Niña event, which are among the most powerful ENSO events in recorded history.
We also examined the interannual variation in fire-induced changes in aerosol optical depth based on the Modern-Era Retrospective analysis for Research and Applications, Version 2 (MERRA-2) reanalysis data (Gelaro et al., 2017) and the Cloud-Aerosol Lidar and Infrared Pathfinder Satellite Observations (CALIPSO) Level 3 V4.2 dataset (Winker et al., 2013). For the MERRA-2 data, monthly mean BC aerosol optical depth (AOD) was used for a better comparison with the BC emission from QFED emission data. The CALIPSO product divides aerosol into six subtypes, and the gridded monthly mean 532 nm AOD for the biomass burning aerosol type under all-sky conditions was analyzed. We used the Moderate Resolution Imaging Spectroradiometer (MODIS) Version 6.1 gross primary productivity (GPP) product (MOD17A2H; Running et al., 2021), which measures the growth of terrestrial vegetation as a proxy for fuel load. A cumulative 8 d composite of GPP values is provided with a 500 m pixel size. The average of GPP in the month prior to the burning season (March) is examined. Interannual variations in the shortwave diffuse radiative fluxes on the surface, which are closely related to photosynthesis rates and primary productivity, are also analyzed using the photosynthetically active radiation from the Clouds and the Earth's Radiant Energy System (CERES) product (Su et al., 2007).
In order to investigate the influence of climate on fire activities, we analyzed the monthly mean temperature and maximum temperature from the Climatic Research Unit gridded Time Series (CRU TS) Version 4.06 (Harris et al., 2014). The dataset is constructed based on station observations and provides monthly data over the global land surface at a 0.5° resolution. Apart from the CRU TS dataset, two sets of satellite observations of precipitation were analyzed: the monthly Integrated Multi-satellitE Retrievals for GPM (IMERG) precipitation estimates at 0.1° and the 1 Degree Daily (Version 1.3), 2.5° monthly (Version 2.3) Global Precipitation Climatology Project (GPCP) precipitation estimates (Adler et al., 2018, 2017). IMERG is intended to inter-calibrate and merge satellite microwave precipitation estimates together with microwave-calibrated infrared satellite estimates and precipitation gauge analyses (Huffman et al., 2020). Monthly mean 500 hPa vertical velocity (ω) at 2.5° from the National Centers for Environmental Prediction and the National Center for Atmospheric Research (NCEP/NCAR) reanalysis (Kanamitsu et al., 2002) and 10 m wind speed at 0.25° from the European Centre for Medium-Range Weather Forecasts (ECMWF) Reanalysis v5 (ERA5) (Hersbach et al., 2020) were used in our work. We also calculated the near-surface relative humidity and vapor pressure deficit following Chiodi et al. (2021) with the use of 2 m temperature and dew point temperature from the ERA5 reanalysis data. In order to understand the interannual variation in precipitation, we examined the relationship between precipitation and 10 different teleconnection patterns, including the Atlantic Meridional Mode (AMM), the East Pacific–North Pacific Oscillation (EP-NP), ENSO, the North Atlantic Oscillation (NAO), the North Tropical Atlantic (NTA) index, the Pacific North American (PNA) index, the Tropical Northern Atlantic (TNA) index, the Tropical Southern Atlantic (TSA) index, the Western Hemisphere Warm Pool (WHWP), and the Quasi-biennial Oscillation (QBO). These indices and their detailed definitions can be obtained at https://psl.noaa.gov/data/climateindices/list/ (last access: July 2023).
2.2 Model experiment
The Community Earth System Model (CESM2.1.0) with the Community Atmosphere Model version 6 (CAM6) (Danabasoglu et al., 2020) was used to investigate the effect of fire-emitted aerosols on precipitation. The F2000 component set was used with the prescribed sea surface temperature in the year 2000. The horizontal resolution is set to 0.9° latitude by 1.25° longitude with 32 vertical levels. Two groups of simulations were conducted. Each was driven by the representative fire emissions in strong and weak fire years, referred to as Case_Strong and Case_Weak. The difference in variables (e.g., temperature and precipitation) between the two cases (Case_Strong minus Case_Weak) indicates the influence of or difference in feedback caused by stronger fire emissions. As our work focused on the influence of fire activities over the SMCA, only fire emissions over the SMCA region were considered. Since fire emissions and anthropogenic emissions are specified separately in CESM2, we modified the default fire emission inventory (van Marle et al., 2017) in CESM2.1.0 accordingly, while global anthropogenic emissions were kept unchanged and remained the same between cases. Given that composite analysis indicates fire emissions in weak fire years are approximately half that of those in strong fire years, we simply used the average of fire emissions during strong fire years in Case_Strong and reduced these by half in Case_Weak. More subtle changes in fire location between strong and weak fire years are thus ignored. Furthermore, global climate models have long been found to underestimate fire-induced changes in aerosols (Zhong et al., 2022). Hence, in order to ensure that the simulated difference in fire-induced AOD between Case_Strong and Case_Weak is comparable to observations, the default inventory is multiplied by a factor of 3. For each group, nine ensemble simulations were performed with slight differences in their initial conditions. The ensemble mean is calculated as the average of the nine members. All simulations start on 1 January with a 3-month spin-up time. Student's t test is used to identify statistically significant differences between Case_Strong and Case_Weak.
3.1 Biennial variability in fire activities
We focus on the southern Mexico and Central America region (SMCA) covering both the Yucatán Peninsula and Mexico City. Major fire types in this region consist of deforestation fires, savanna fires, and agricultural waste burning, which are estimated to consume 45.5 %, 42.1 %, and 12.40 %, respectively, of the total burned dry matter during the peak burning months (April–May) of the 17-year (2003–2019) study period.
As shown in Fig. 1a, GFEDv4.1s estimates of the regional sum of the total dry matter consumed by fire activities feature obvious quasi-biennial variability. Generally speaking, fire activities in odd-numbered years show higher consumption of dry matter than adjacent even-numbered years with the only exception being the year 2016, which might be related to a long-lasting El Niño event spanning 2014–2016. Composites of fire consumption of dry matter indicate enhanced fire activities along both sides of the high terrain in odd-numbered years, and the most profound difference appears over the border area between southern Mexico and Guatemala (Fig. S2 in the Supplement). The average amount of fire-consumed dry matter here differs between odd-numbered and even-numbered years by more than a factor of 6.
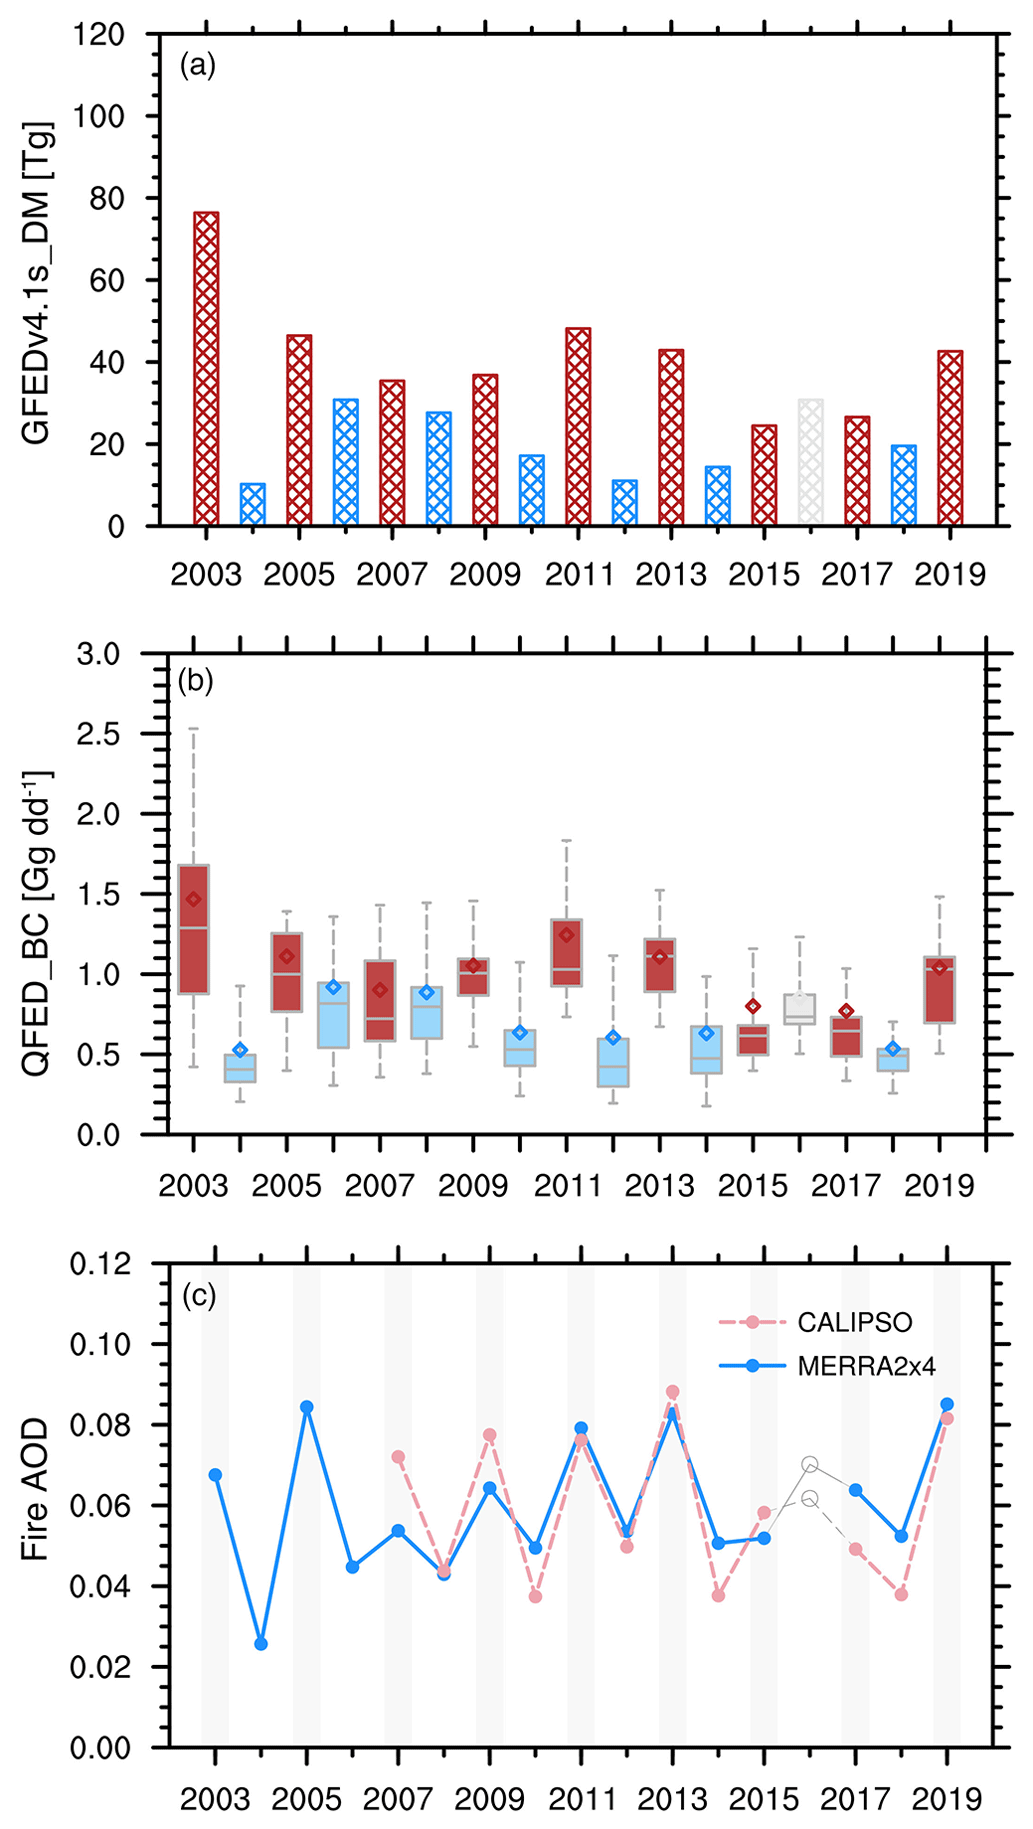
Figure 1Interannual variations in different fire characteristics during the peak burning season (April–May) over southern Mexico and Central America (SMCA). (a) Regional sum of the total dry matter consumed by fire activities based on the GFEDv4.1s emission data. (b) Distributions of the daily sum of fire-emitted black carbon (BC) over the SMCA based on QFED emission data. Boxes denote the 25th and 75th percentiles. Bars outside the boxes denote the 10th and 90th percentiles. Bars within the boxes denote the median values, and dots denote regional mean values. (c) Regional mean aerosol optical depth (AOD) of smoke aerosols from CALIPSO product and BC AOD from MERRA-2 reanalysis. The odd-numbered years with strong fires are denoted by the grey bars.
The quasi-biennial variability in fire activities is also evident when examining the fire emissions of typical fire-emitted species based on the QFED inventory (Fig. 1b). Similarly, fire-emitted BC in odd-numbered years is higher than that of the adjacent even-numbered years, when considering both regional mean and medium values. Furthermore, among the 9 odd-numbered years, fire activities in 2003, 2011, and 2013 show the highest three BC emissions, which is also consistent with the results from the GFEDv4.1s dataset. Hence, the two independent fire emission inventories agree on the interannual variation in fire activities.
Apart from cross-checking different fire emission inventories, we further validated the variability in fire activities by investigating fire-induced changes in AOD (Fig. 1c). BC AOD from the MERRA-2 reanalysis and AOD of biomass burning aerosol type from CALIPSO were adopted to represent fire activities. Basically, the interannual variation in fire-related AOD in both datasets agrees well with the estimates from fire inventories, thus providing additional support for the quasi-biennial variability in fire activities in the peak burning months over the SMCA. Overall, intercomparison between multiple datasets indicates a consistent quasi-biennial variability in different fire characteristics, including fire-consumed dry matter, fire-emitted aerosols, and fire-related changes in optical properties. Note that among the four datasets, the GFEDv4.1s inventory and MERRA-2 reanalysis provide data until the year 2023, and the quasi-biennial variability in the extended time series remains robust until 2023 (Fig. S1). To describe this quasi-biennial variability conveniently, we hereafter refer to the odd-numbered (even-numbered) years that have higher (lower) fire consumption of dry matter than adjacent years as strong (weak) fire years.
Table 1Correlations between the regional sum of fire-consumed dry matter based on the GFEDv4.1 data and regional mean values of different meteorological variables (including the monthly mean precipitation from IMERG dataset, mean temperature, maximum temperature from CRU dataset, and 10 m wind speed from ERA5 reanalysis) averaged in the peak fire season (April–May).
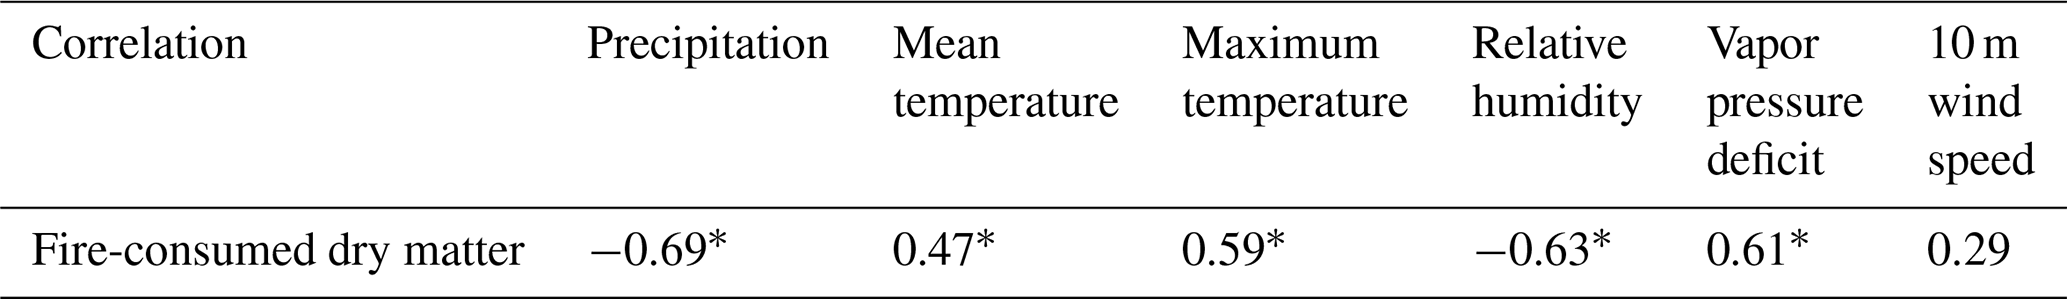
∗ The correlations that are statistically significant at the 90 % confidence level based on Student's t test.
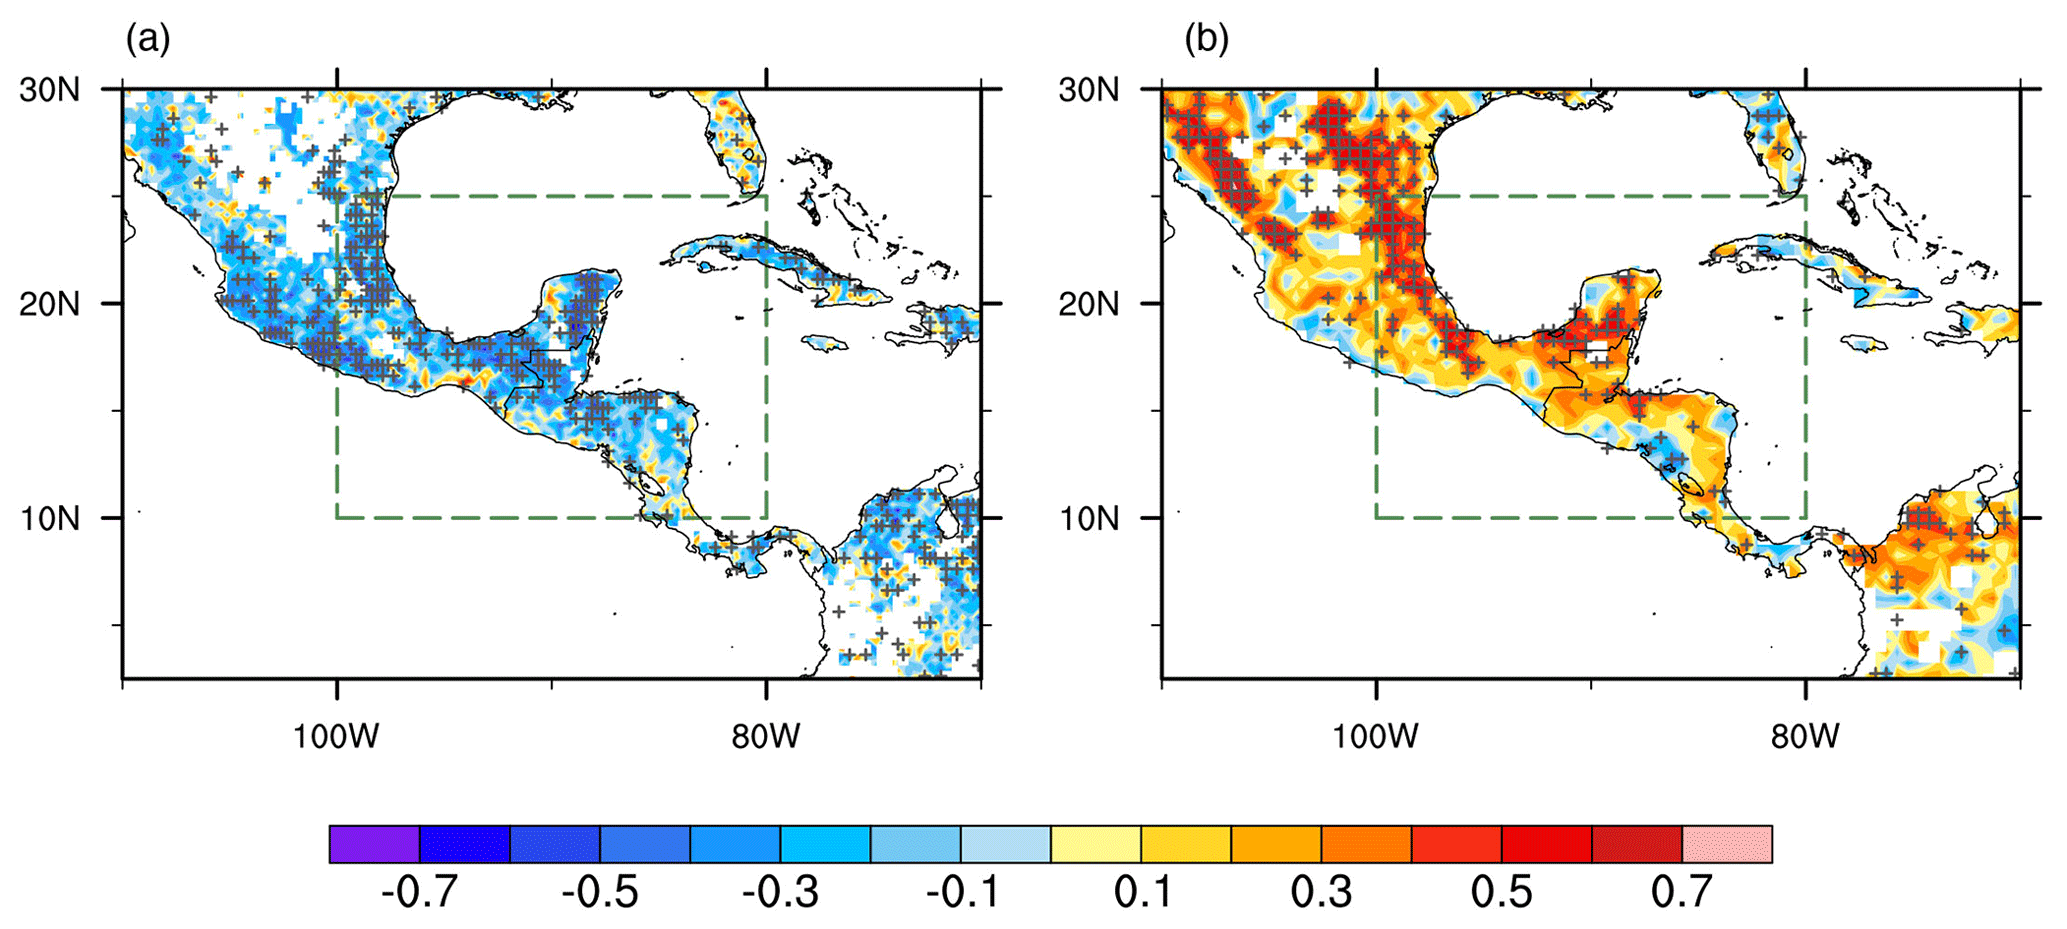
Figure 2The influence of meteorological factors on fire activities over the SMCA. Spatial distributions of grid-to-grid correlations between fire-consumed dry matter and (a) precipitation from IMERG and (b) maximum temperature from CRU during the peak fire season (April–May) from 2003–2019. Stippling indicates the correlations that are statistically significant at the 90 % confidence level based on Student's t test. The green boxes denote the SMCA region.
3.2 Dominant role of the biennial variability in precipitation
Fire activities are strongly affected by factors including fire ignition, fuel load, and climate weather conditions (Flannigan et al., 2005; Archibald, 2016; Ichoku et al., 2016; Veira et al., 2016). Fire ignition is affected by both natural lightning and human activities (Pechony and Shindell, 2009). Since there is no policy to regulate fire activities periodically, it is unlikely that human impact is the major driving force. Fuel availability may play a role in the interannual variation in fires. Having examined the GPP (surrogate for fuel load) prior to the burning season, we found little evidence regarding the role of fuel availability in contributing to the interannual variation in fires (Fig. S3). Lower values of GPP are found in some strong fire years compared to their adjacent years, e.g., the years 2003 and 2005. Correlations between regional GPP and fire-consumed dry matter are even slightly negative. Moreover, correlations between the regional mean diffuse radiative flux and fire-consumed dry matter are also statistically insignificant.
Close yet complex relationships between ambient conditions (e.g., humidity, temperature, and precipitation) and fire activities have been widely revealed in previous studies (Cary et al., 2006; Gillett et al., 2004; Prasad et al., 2008). For example, warm temperatures could increase fire activities by increasing evapotranspiration and also by lengthening fire duration, while both the timing and amount of precipitation could regulate fire behavior. To identify the climatic factors that might be responsible for the quasi-biennial variation in fire activities, we first examined the relationships between fire-consumed dry matter and different meteorological variables (Table 1). Temporal correlations of their regional mean values indicate that fire activities are enhanced by warmer mean and maximum temperature (R = 0.47 and 0.59) but are weakened by higher precipitation (R = −0.69). Although wind speed could affect the spread of fire activities, the insignificant correlation signifies a minor influence on the interannual scale (Fig. S3). Other meteorological metrics such as vapor pressure deficit (VPD) and relative humidity (RH) are also frequently used to help understand fire–meteorology interactions. Correlations in Table 1 indicate that higher VPD facilitates fire activities while higher RH depresses fire activities. Here, we found that the interannual variations in regional mean VPD and RH are in fact highly correlated with precipitation (R = −0.8 for VPD and R = 0.7 for RH) and temperature (R = 0.7 for VPD and R = −0.5 for RH) over the SMCA region.
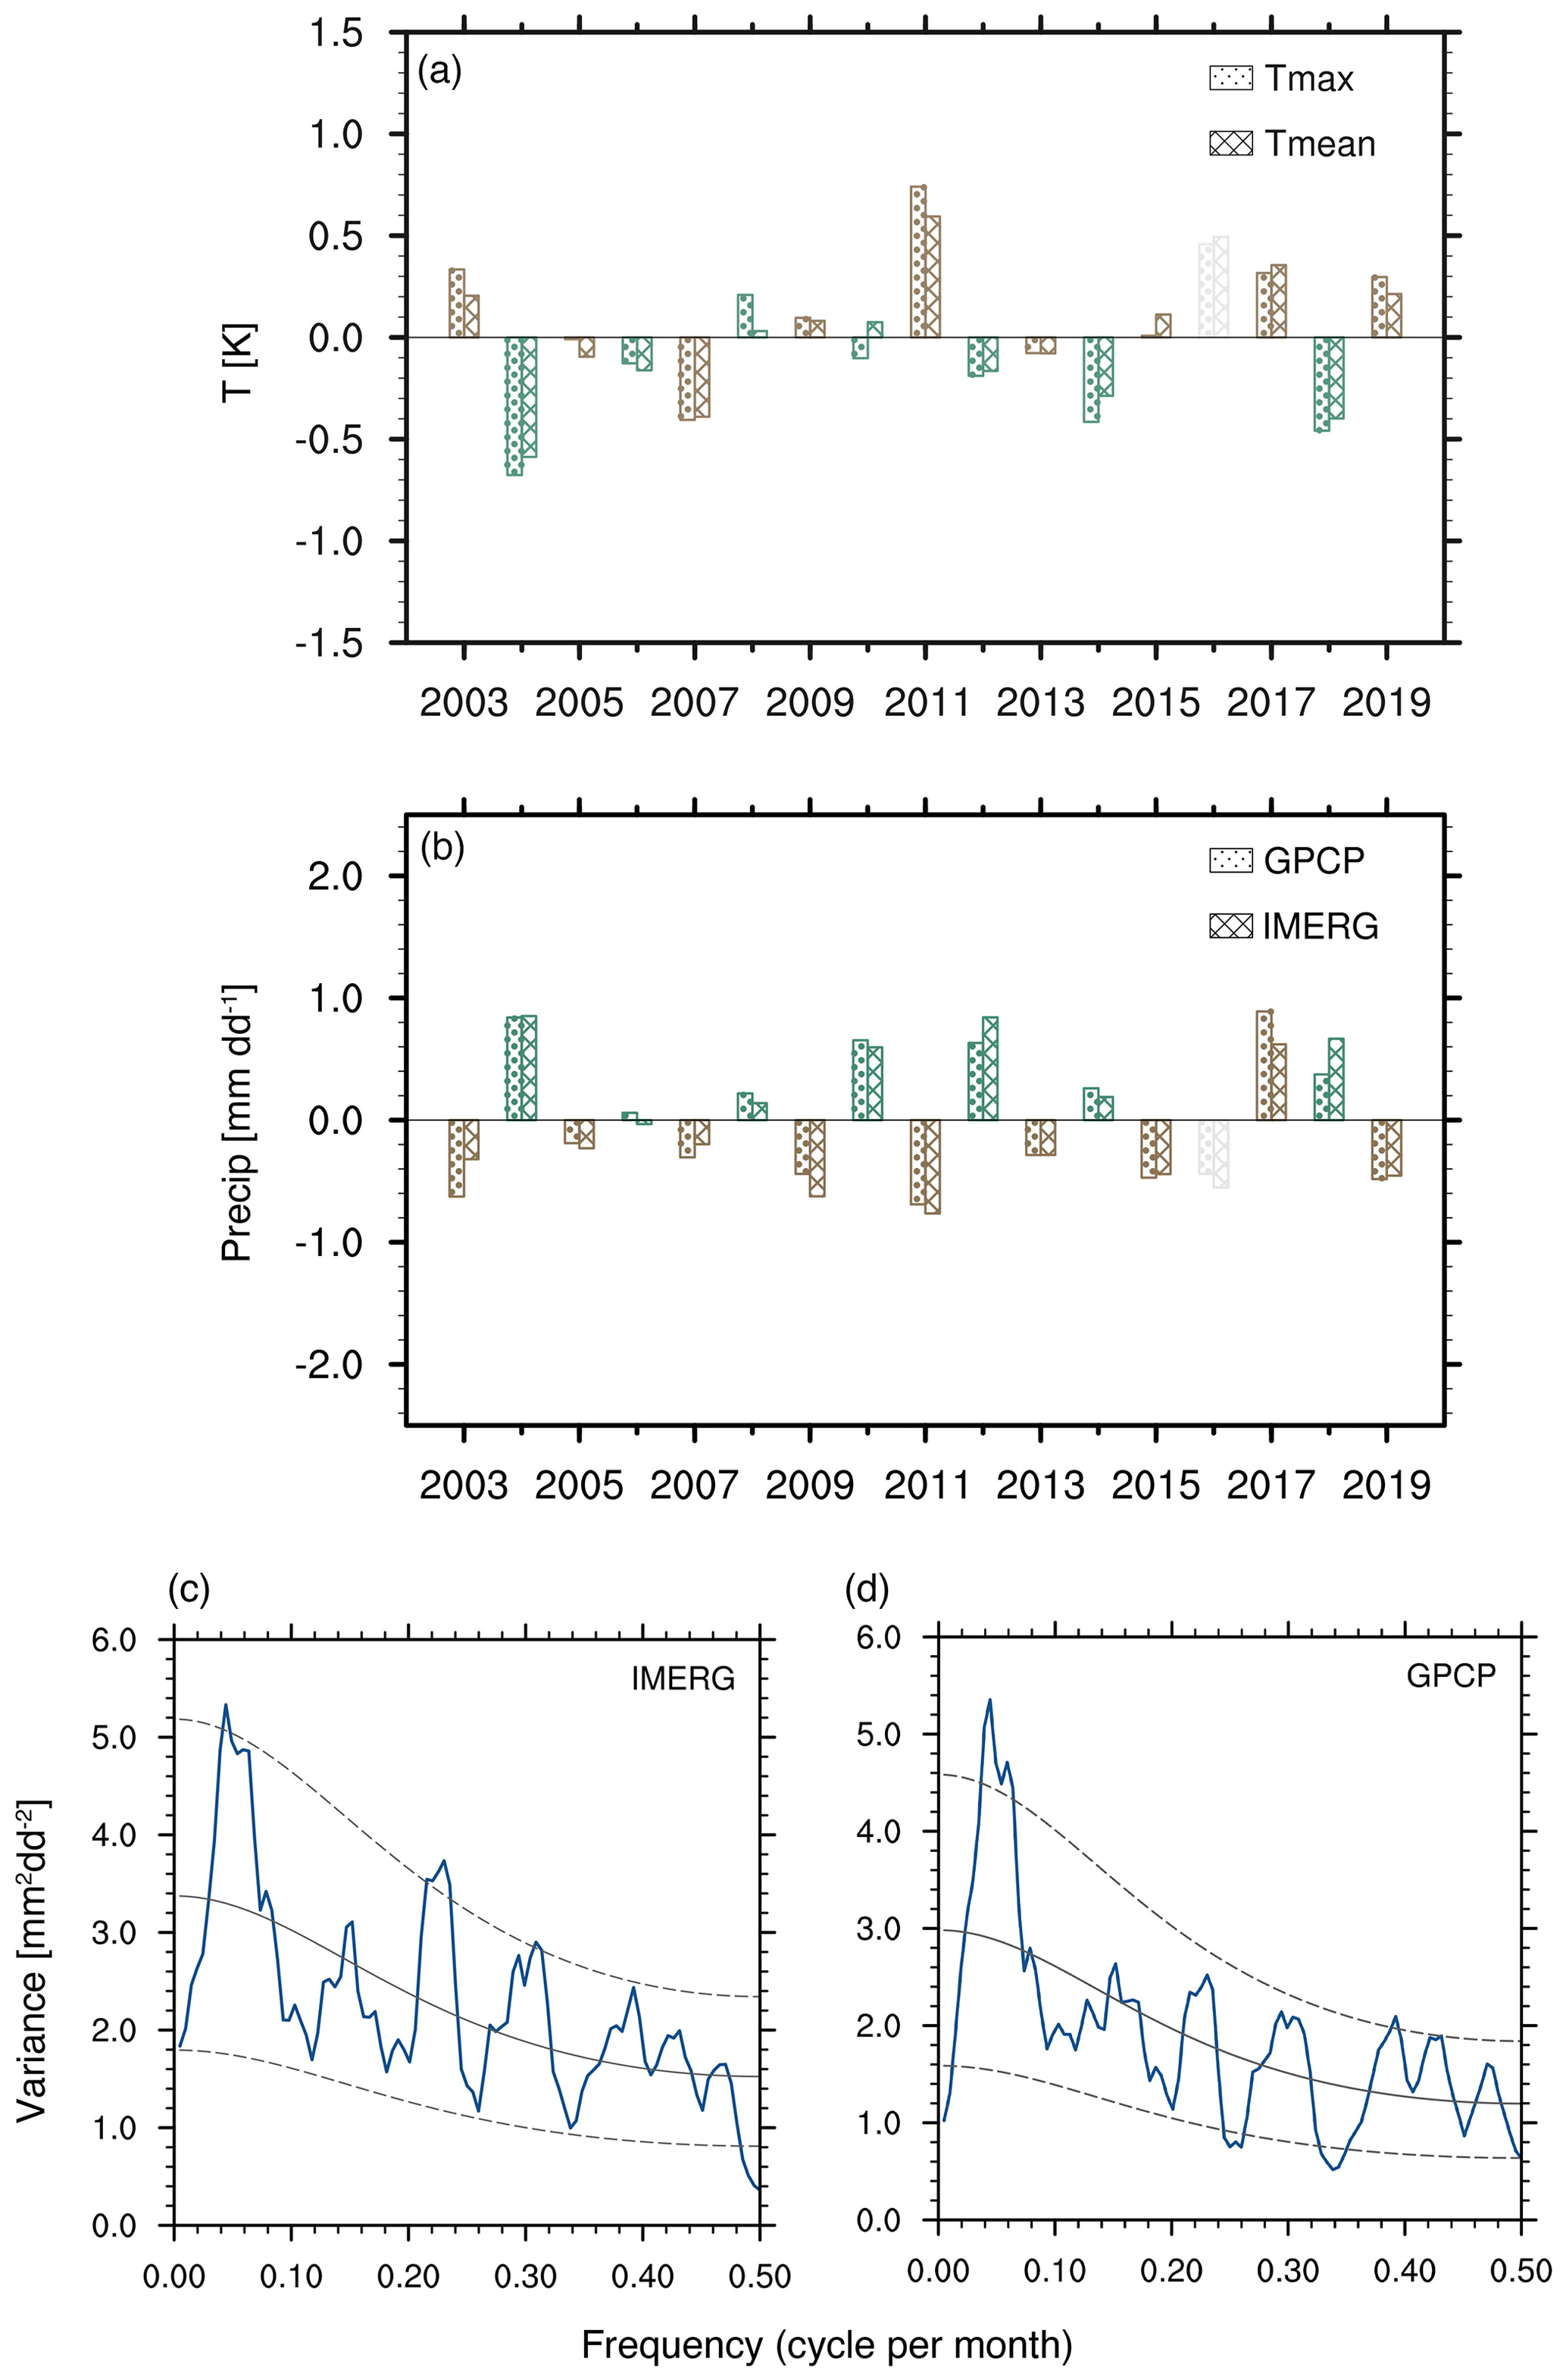
Figure 3Interannual variability in meteorological factors in peak fire season over the SMCA. Time series of the April–May (a) mean and maximum temperature and (b) mean precipitation anomalies (with respect to the 2003–2019 climatology mean) averaged over the SMCA (land only). (c) Spectral analysis of monthly mean precipitation averaged over the SMCA during 2003–2019. The solid black line and dashed lines represent the red noise curve and the 10 % and 90 % confidence interval. (d) Same as panel (c), but for precipitation from the GPCP dataset.
Figure 2 shows the spatial distribution of correlations of fire-consumed dry matter with precipitation and mean temperature during peak burning months. With respect to precipitation, negative correlations cover almost the entire SMCA region and are statistically significant over major fire source areas from the Yucatán Peninsula extending southwestward to the state of Chiapas. In contrast, positive correlations between fire-consumed dry matter and maximum temperature mainly appear over the northern part of the SMCA (southern Mexico), albeit with less influence over Central America (e.g., fire source areas in Guatemala). Hence, the interannual variability in precipitation affects the variation in fire activities over a wider spatial range. We next examined closely the time series of regional mean precipitation and temperature (Fig. 3). Here, regional mean values are calculated using data over land so that only climate conditions that could directly affect fire activities are considered. Two independent precipitation datasets show similar temporal evolution patterns. An obvious quasi-biennial variability is seen in regional mean precipitation. More-suppressed precipitation (compared to adjacent years) corresponds well to the strong fire years (excluding the year 2016). Furthermore, spectral analysis confirms a statistically significant periodicity of approximately 2 years (0.042 cycles per month) for precipitation, suggesting the mediating influence of precipitation on the quasi-biennial feature of fire activities. Meanwhile, the quasi-biennial signal is less apparent in mean and maximum temperatures. For instance, temperatures in the strong fire years of 2007 and 2009 are smaller in magnitude compared to adjacent weak fire years. Nevertheless, higher mean and maximum temperatures (compared to adjacent years) appear in 2003 and 2011, which, combined with the suppressed precipitation, contributed to the abnormally high fire-consumed dry matter during the 2 years. As a result, while both temperature and precipitation are critical in shaping fire activities over the SMCA region, precipitation plays a more fundamental role in formulating the quasi-biennial variability in fires.
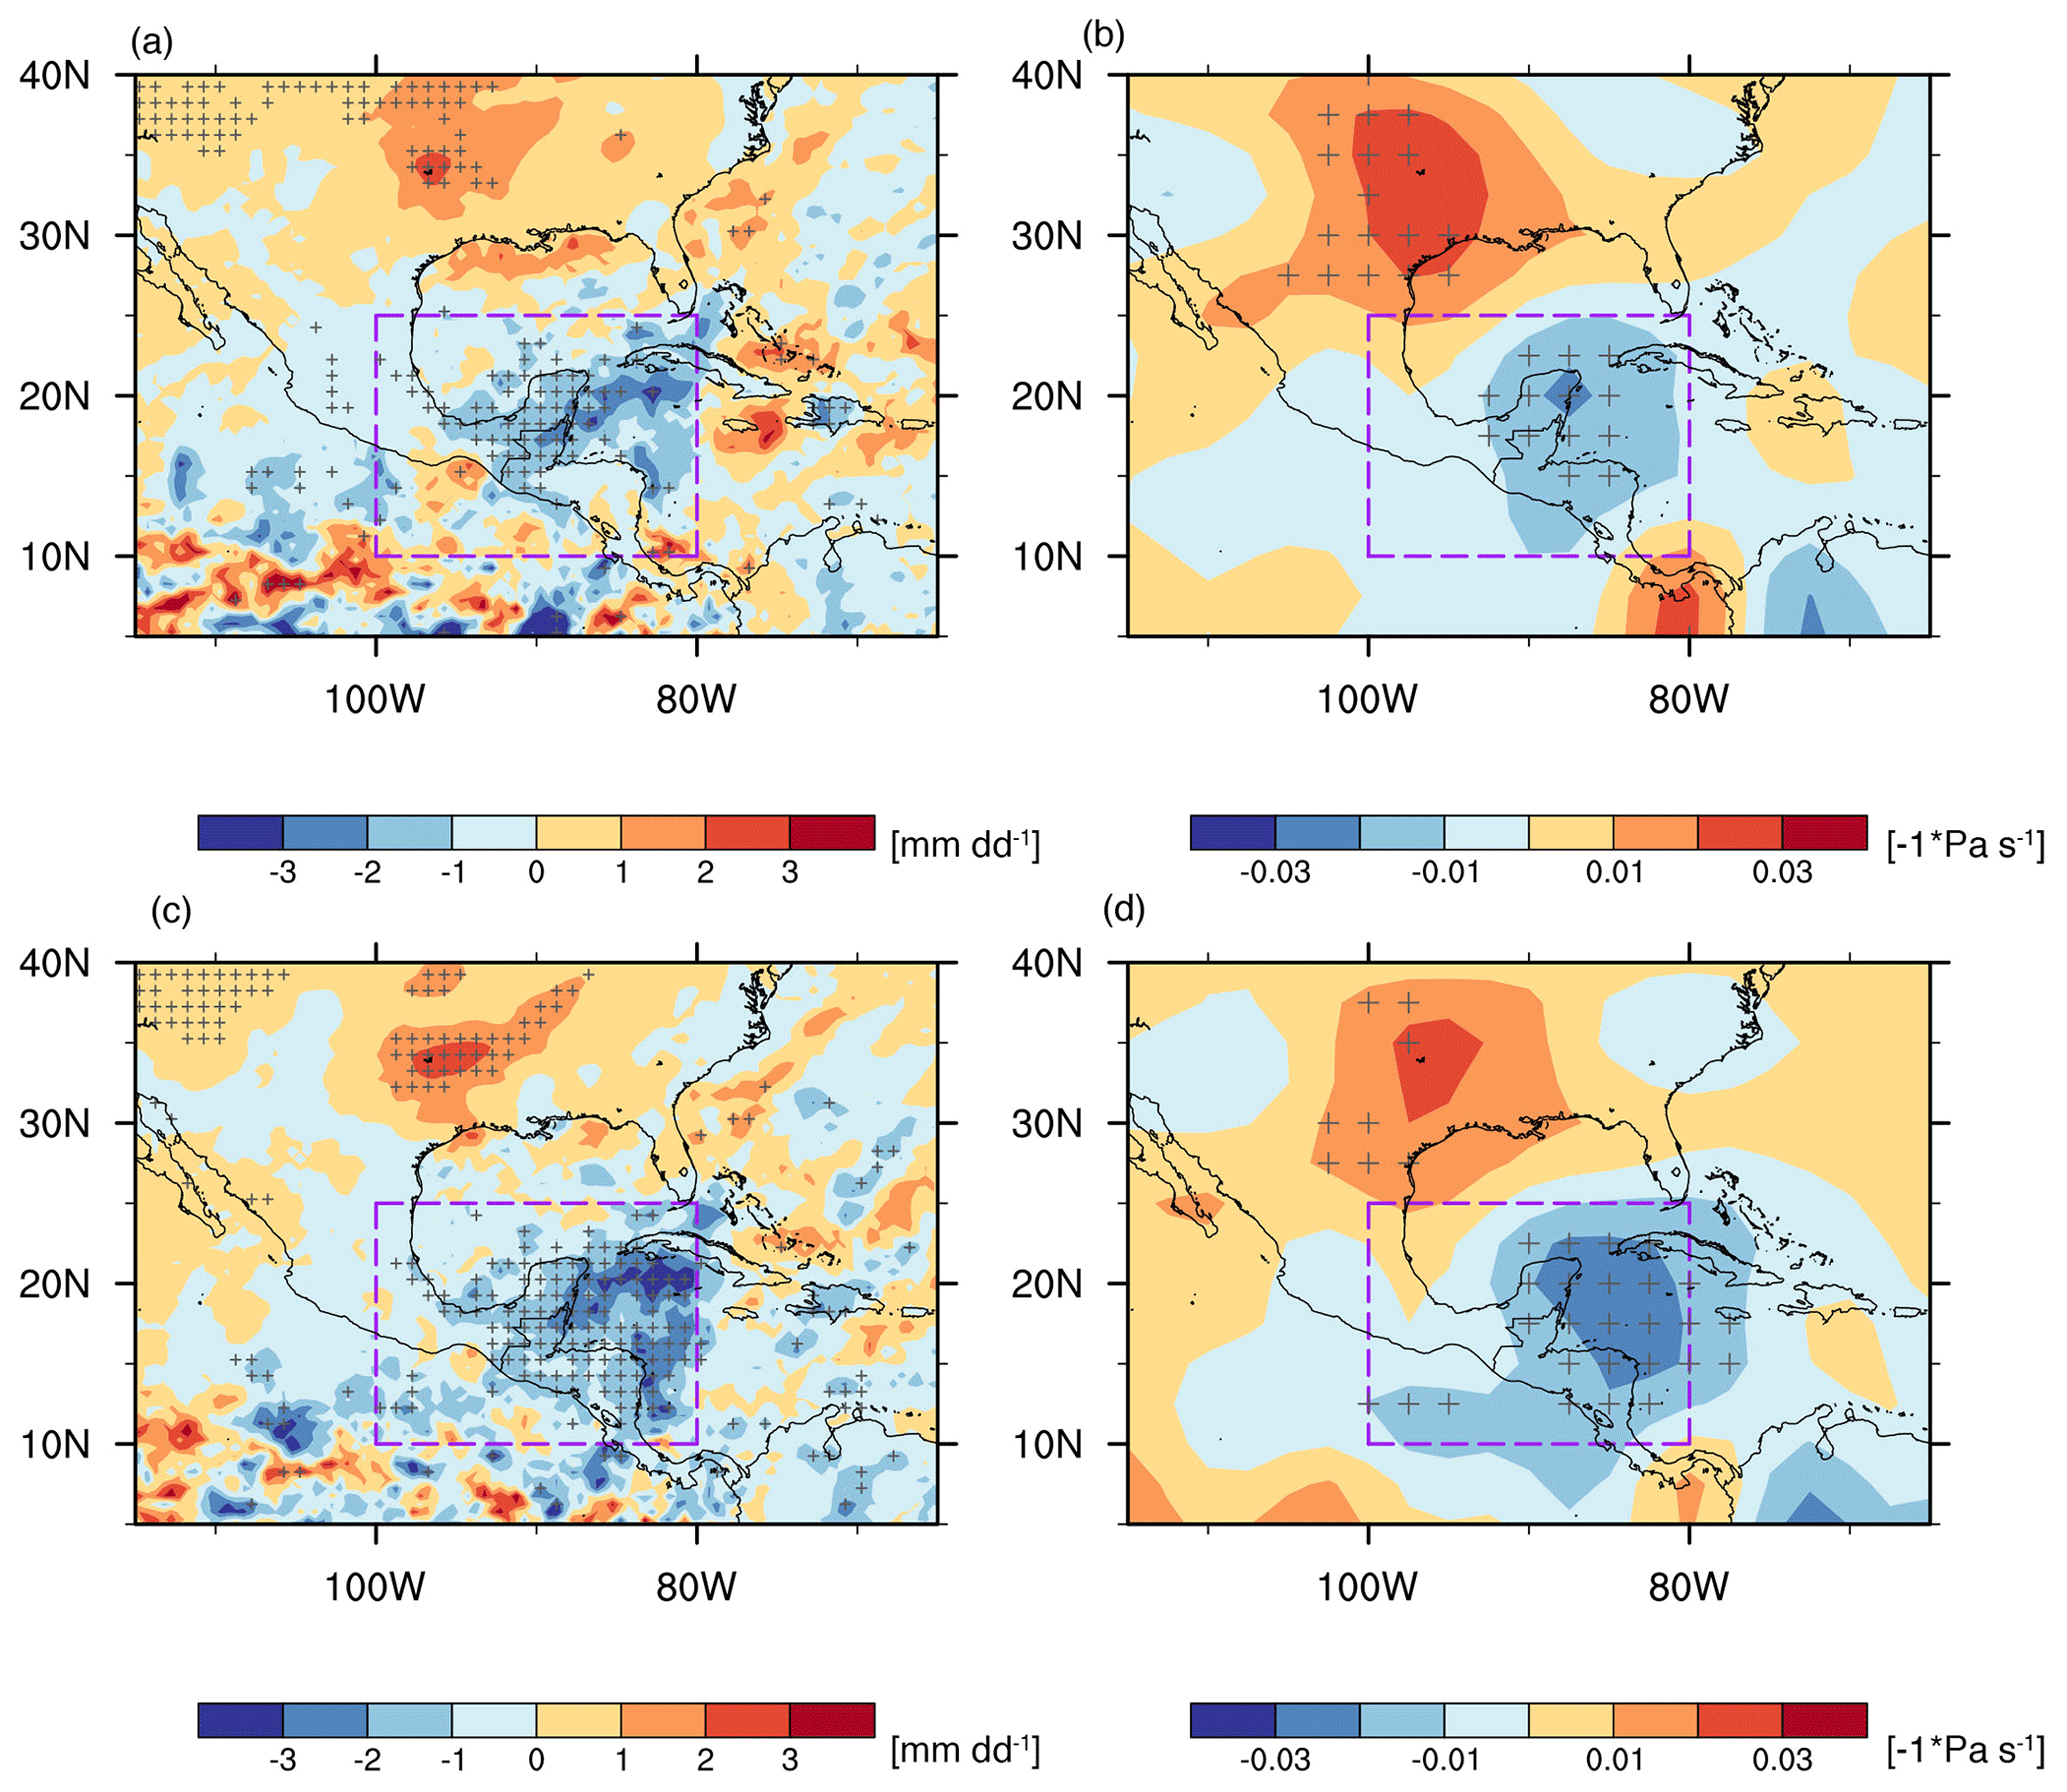
Figure 4Varying characteristics of precipitation and circulation. Differences in composites of (a) precipitation and (b) 500 hPa vertical pressure velocity (reversed signs) between strong and weak fire years. Stippling indicates the differences that are statistically significant at the 90 % confidence level based on Student's t test. Regressions of April–May mean (c) precipitation and (d) 500 hPa vertical velocity onto the regional mean precipitation over the SMCA (reversed signs) during 2003–2019. Stippling indicates regression coefficients that are statistically significant at the 90 % confidence level based on the Student's t test.
The leading role of precipitation in interannually varying fire activities is evident in the composite analysis, as shown by the contrast of reduced precipitation in strong fire years and enhanced precipitation in weak fire years (Fig. 4a). The composite analysis further shows that the anomalous precipitation is closely related to vertical motion, with stronger subsidence corresponding to weaker precipitation (Fig. 4b). It is worth noting that to the northwest of the SMCA region near the southeast US, composite precipitation and vertical velocity also differ significantly between strong and weak fire years, albeit with opposite signs. Consistently changing features of precipitation and vertical velocity are also captured when regressing the two variables onto the regional mean precipitation over the SMCA (Fig. 4c–d). The negative regression coefficients indicate a stronger upward (downward) motion corresponding to higher (weaker) precipitation. In sum, for a specific year, stronger subsidence and the subsequent suppression of precipitation tend to amplify fire activity in that year, and vice versa for a year with weakened subsidence and less of a suppression effect of precipitation. In this way, the quasi-biennial variability in precipitation leads to the same interannual variability in fire activities.
Precipitation patterns over the SMCA region and their variability are associated with complex physical forcing mechanisms, e.g., changes in sea surface temperature, low-level winds, and the strength and position of the Inter-Tropical Convergence Zone (ITCZ), and all of these processes could be modulated by large-scale modes of atmospheric and oceanic variability (Durán-Quesada et al., 2017; Perdigon-Morales et al., 2019; Amador et al., 2006). Here we chose 10 typical teleconnection patterns based on previous studies, for example, the El Niño–Southern Oscillation (ENSO), and examined their relationships with SMCA precipitation in the peak fire months. After calculating the correlations between April–May mean precipitation and the index in varying months (both simultaneously and prior to the fire season), we found that precipitation in the fire season is mostly affected by the East Pacific–North Pacific Oscillation (EP-NP) pattern in the previous 2 months (February–March). Generally, the positive phase of the EP-NP features negative height anomalies and an enhanced cyclonic circulation over the eastern United States (Athanasiadis et al., 2010). Consequently, in the following fire season, this causes anomalous upward and downward motion over the southeastern US and the SMCA region, respectively (Fig. S4), and enhances precipitation over the southeastern US yet suppresses precipitation over the SMCA region (Fig. 5). Hence, the EP-NP teleconnection results in an opposite responding pattern in precipitation and vertical velocity between the eastern US and the SMCA region. This further explains the similar contrasting spatial pattern that is found in the aforementioned composite and regression analysis.
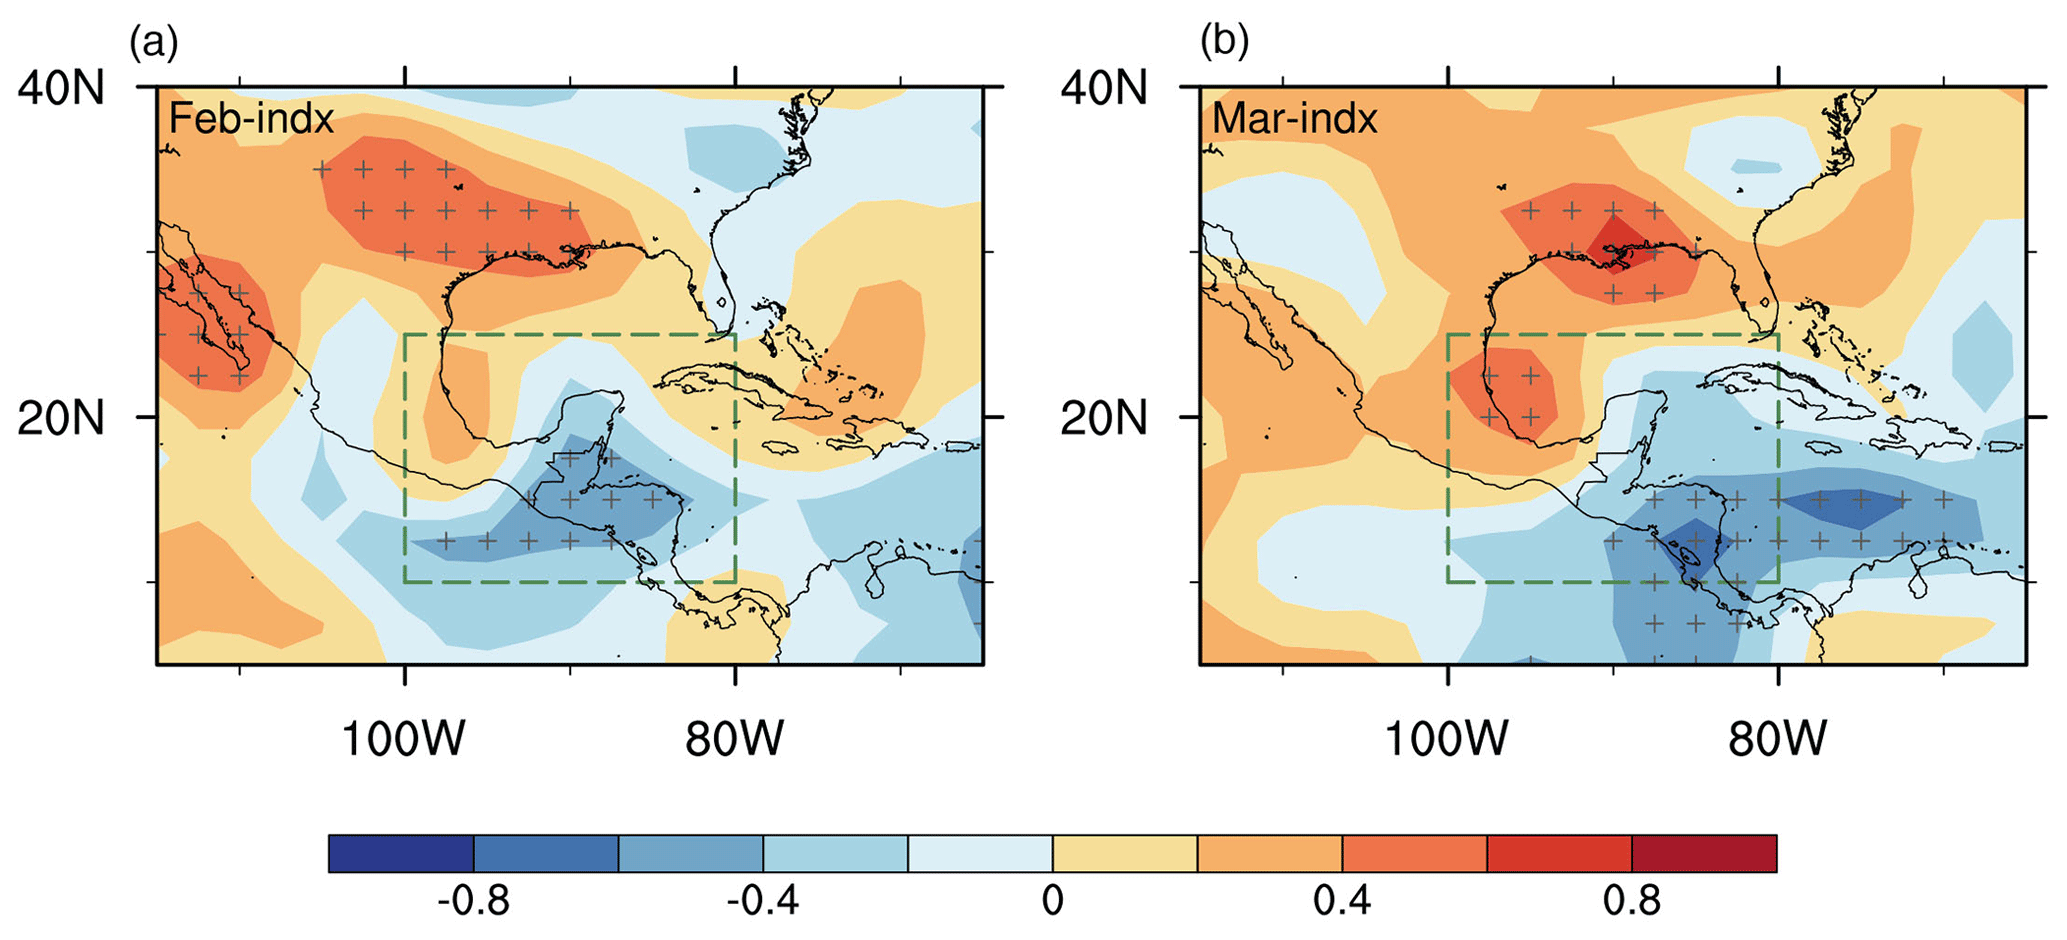
Figure 5Influence of the EP-NP teleconnection pattern on precipitation in peak fire season. Spatial distributions of correlations of the EP-NP index in (a) February and (b) March with the mean precipitation in the peak fire season (April–May) during 2003–2019. Stippling indicates the correlations that are statistically significant based on Student's t test.
3.3 Positive feedback between enhanced fire emissions and suppressed precipitation
Previous studies have found that fire-emitted aerosols can interact with synoptic weather, which in turn affects fire variability (Huang et al., 2023). In view of this, one concern is if fire and precipitation interact at short timescales (i.e., within individual fire seasons) in our case over the SMCA region and, if so, how this feedback modulates the quasi-biennial variability in precipitation and fire activities. We first calculated lead–lag correlations between daily precipitation and fire emissions to identify the short-term fire–precipitation interaction. As shown in Fig. 6, lead–lag correlations between regional mean precipitation and fire emission are generally similar regardless of whether fire activities in strong or weak fire years are considered. When precipitation leads, precipitation negatively correlates with fire emission for more than 20 d, signifying a long-lasting suppression effect of precipitation on fire activities. In other words, weakened precipitation enhances fire activities. Meanwhile, when fire leads, negative correlations indicate that increased fire activities further suppress precipitation at shorter timescales (3–5 d) through rapid adjustments. In short, there is a two-way interaction between precipitation and fire activities at short timescales with different durations, forming a positive feedback loop.
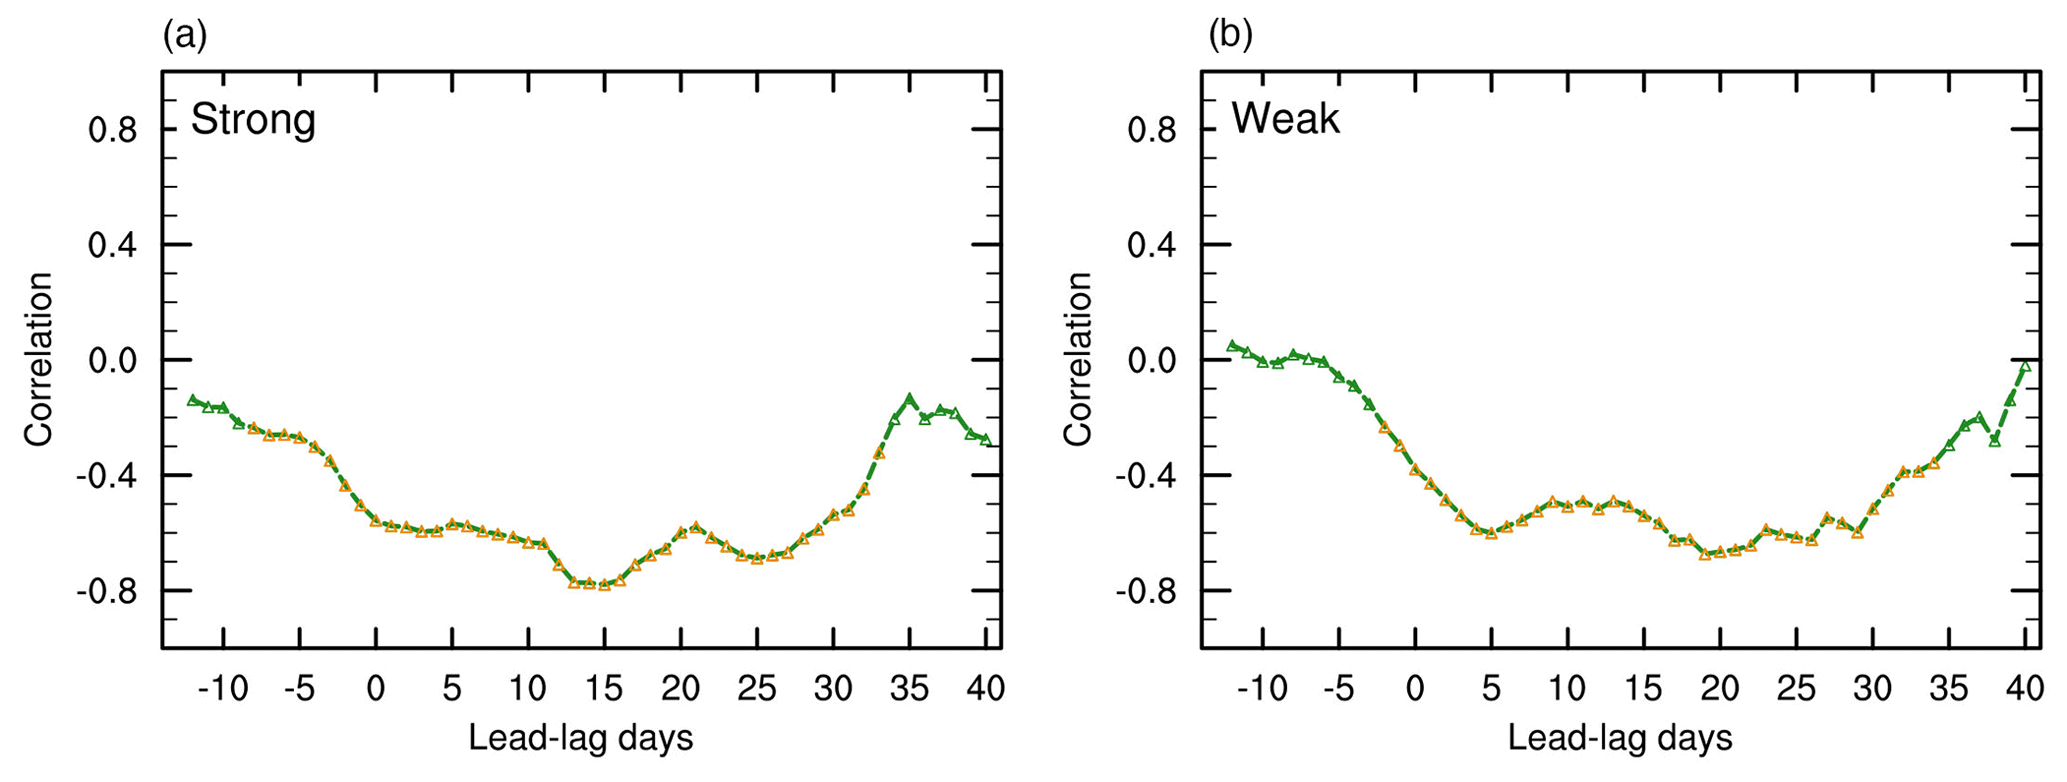
Figure 6Different durations of fire–precipitation interaction. Lead–lag correlations between regional mean daily precipitation and fire emission composites in (a) strong fire years and (b) weak fire years over the SMCA. Positive lead–lag days show that precipitation leads, while negative lead–lag days represent fire emissions leading. Correlations that are statistically significant at the 90 % confidence level based on Student's t test are marked with yellow triangles.
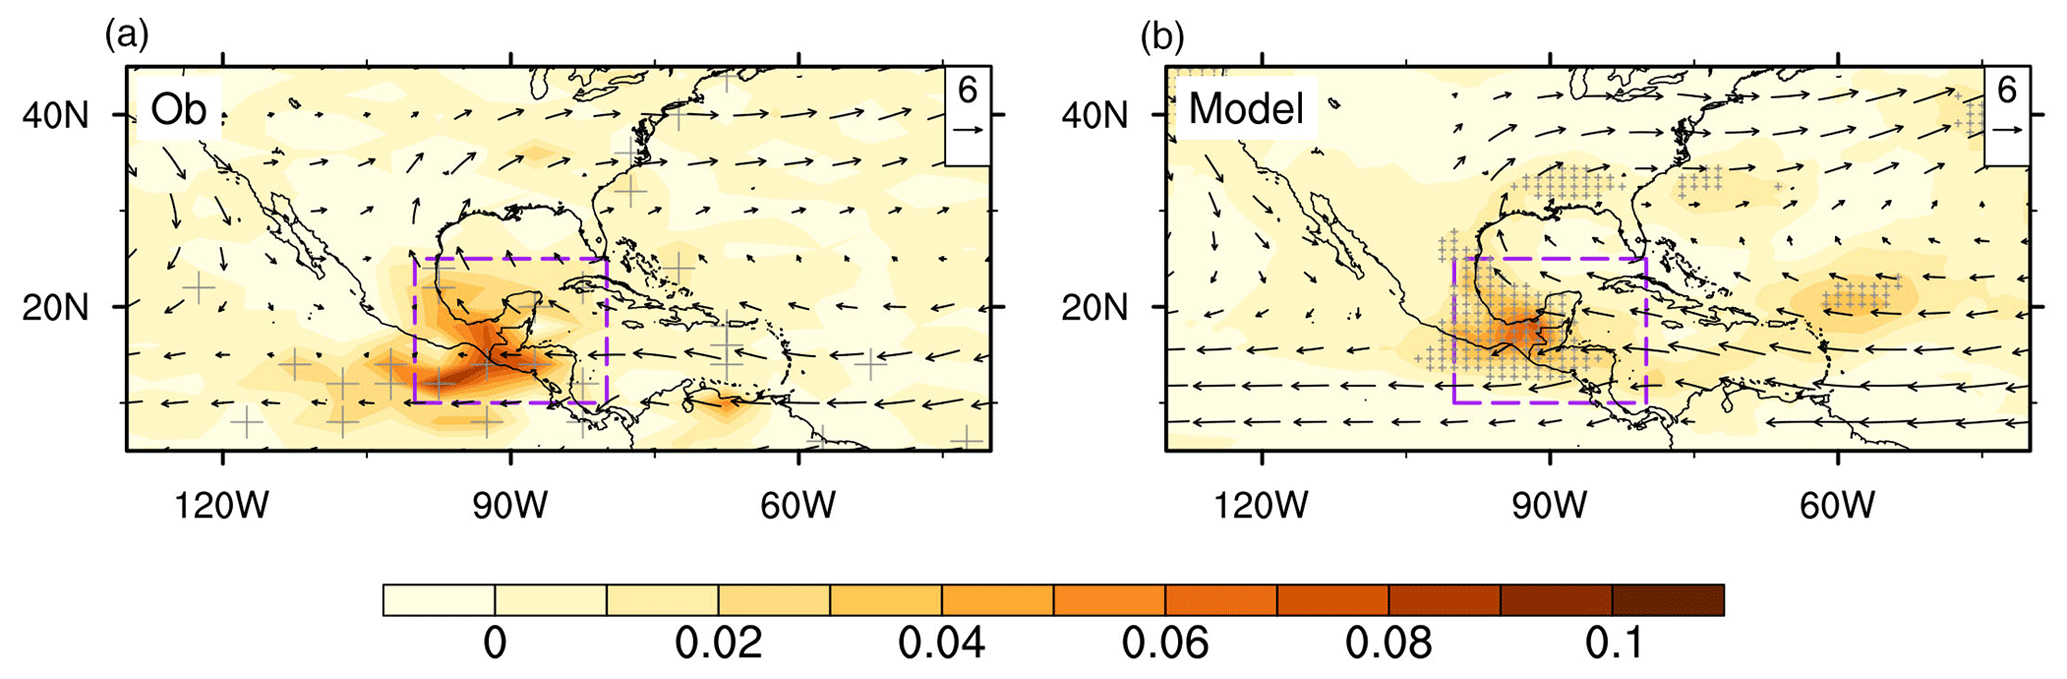
Figure 7Evaluation of model-simulated fire-induced AOD. (a) Spatial distribution of differences in biomass burning AOD between strong and weak fire years from CALIPSO data. (b) Differences in simulated AOD between Case_Strong and Case_Weak. Mean 850 hPa wind vectors from (a) NCEP reanalysis data averaged in all years and (b) model simulations averaged between both cases are overlaid onto the respective panels. Stippling indicates that the differences in AOD are statistically significant based on Student's t test.
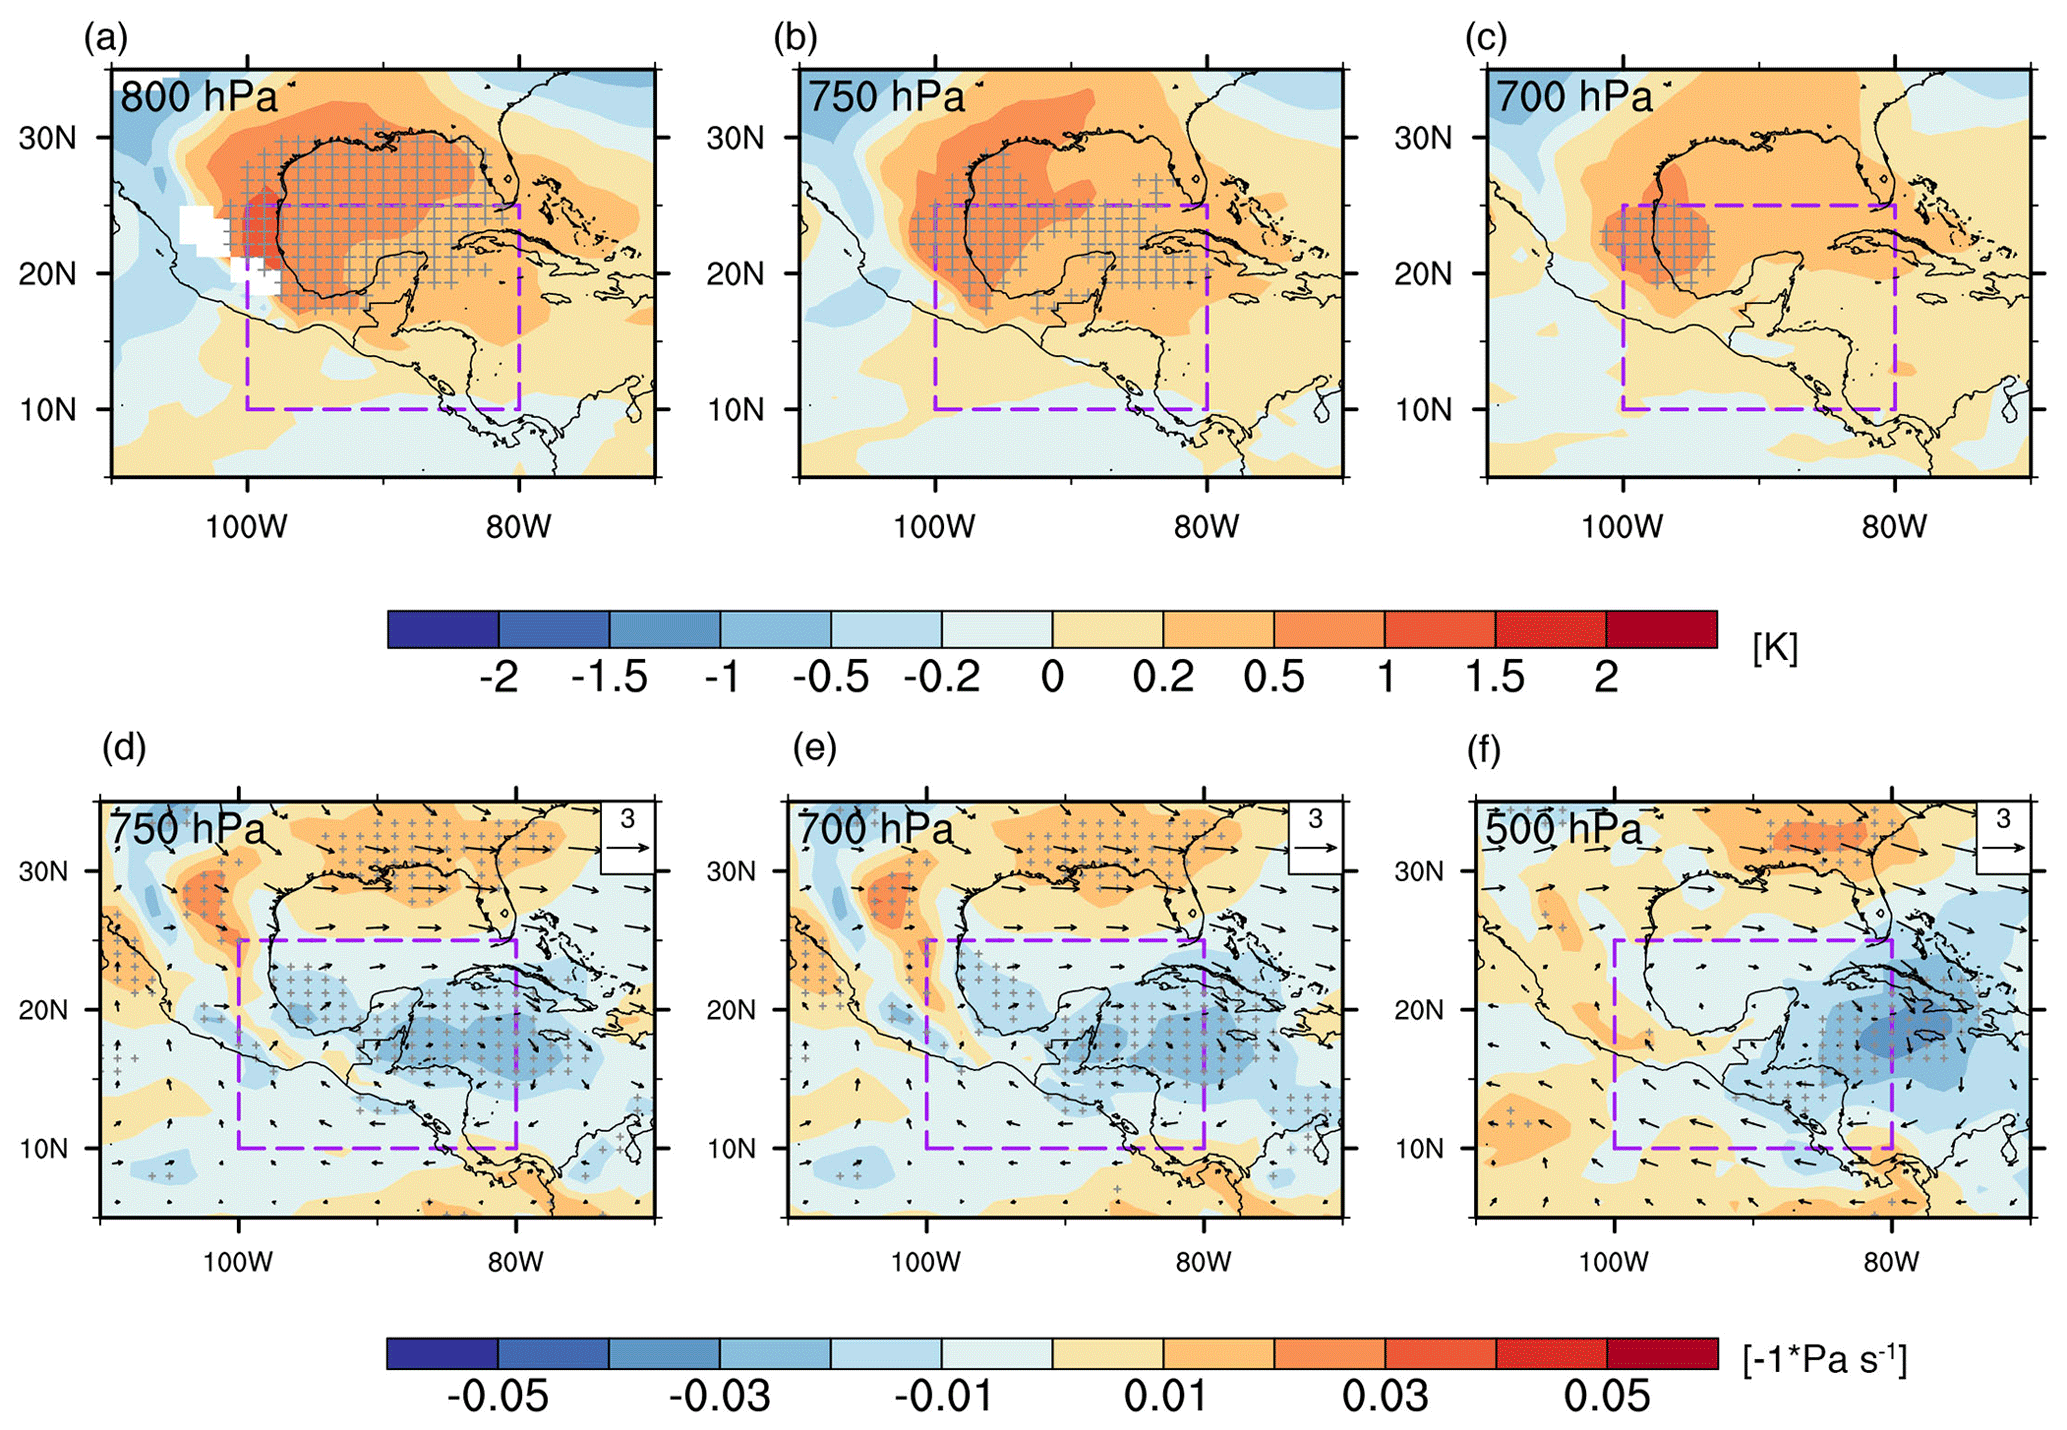
Figure 8Changes in meteorological variables induced by fire-emitted aerosols. Differences in (a–c) atmospheric temperature and (d–f) vertical pressure velocity (reversed signs and shaded colors) at different vertical levels between Case_Strong and Case_Weak. Changes in horizontal winds between the two cases are overlaid in (d)–(f). Stippling indicates the differences that are statistically significant at the 90 % confidence level based on Student's t test.
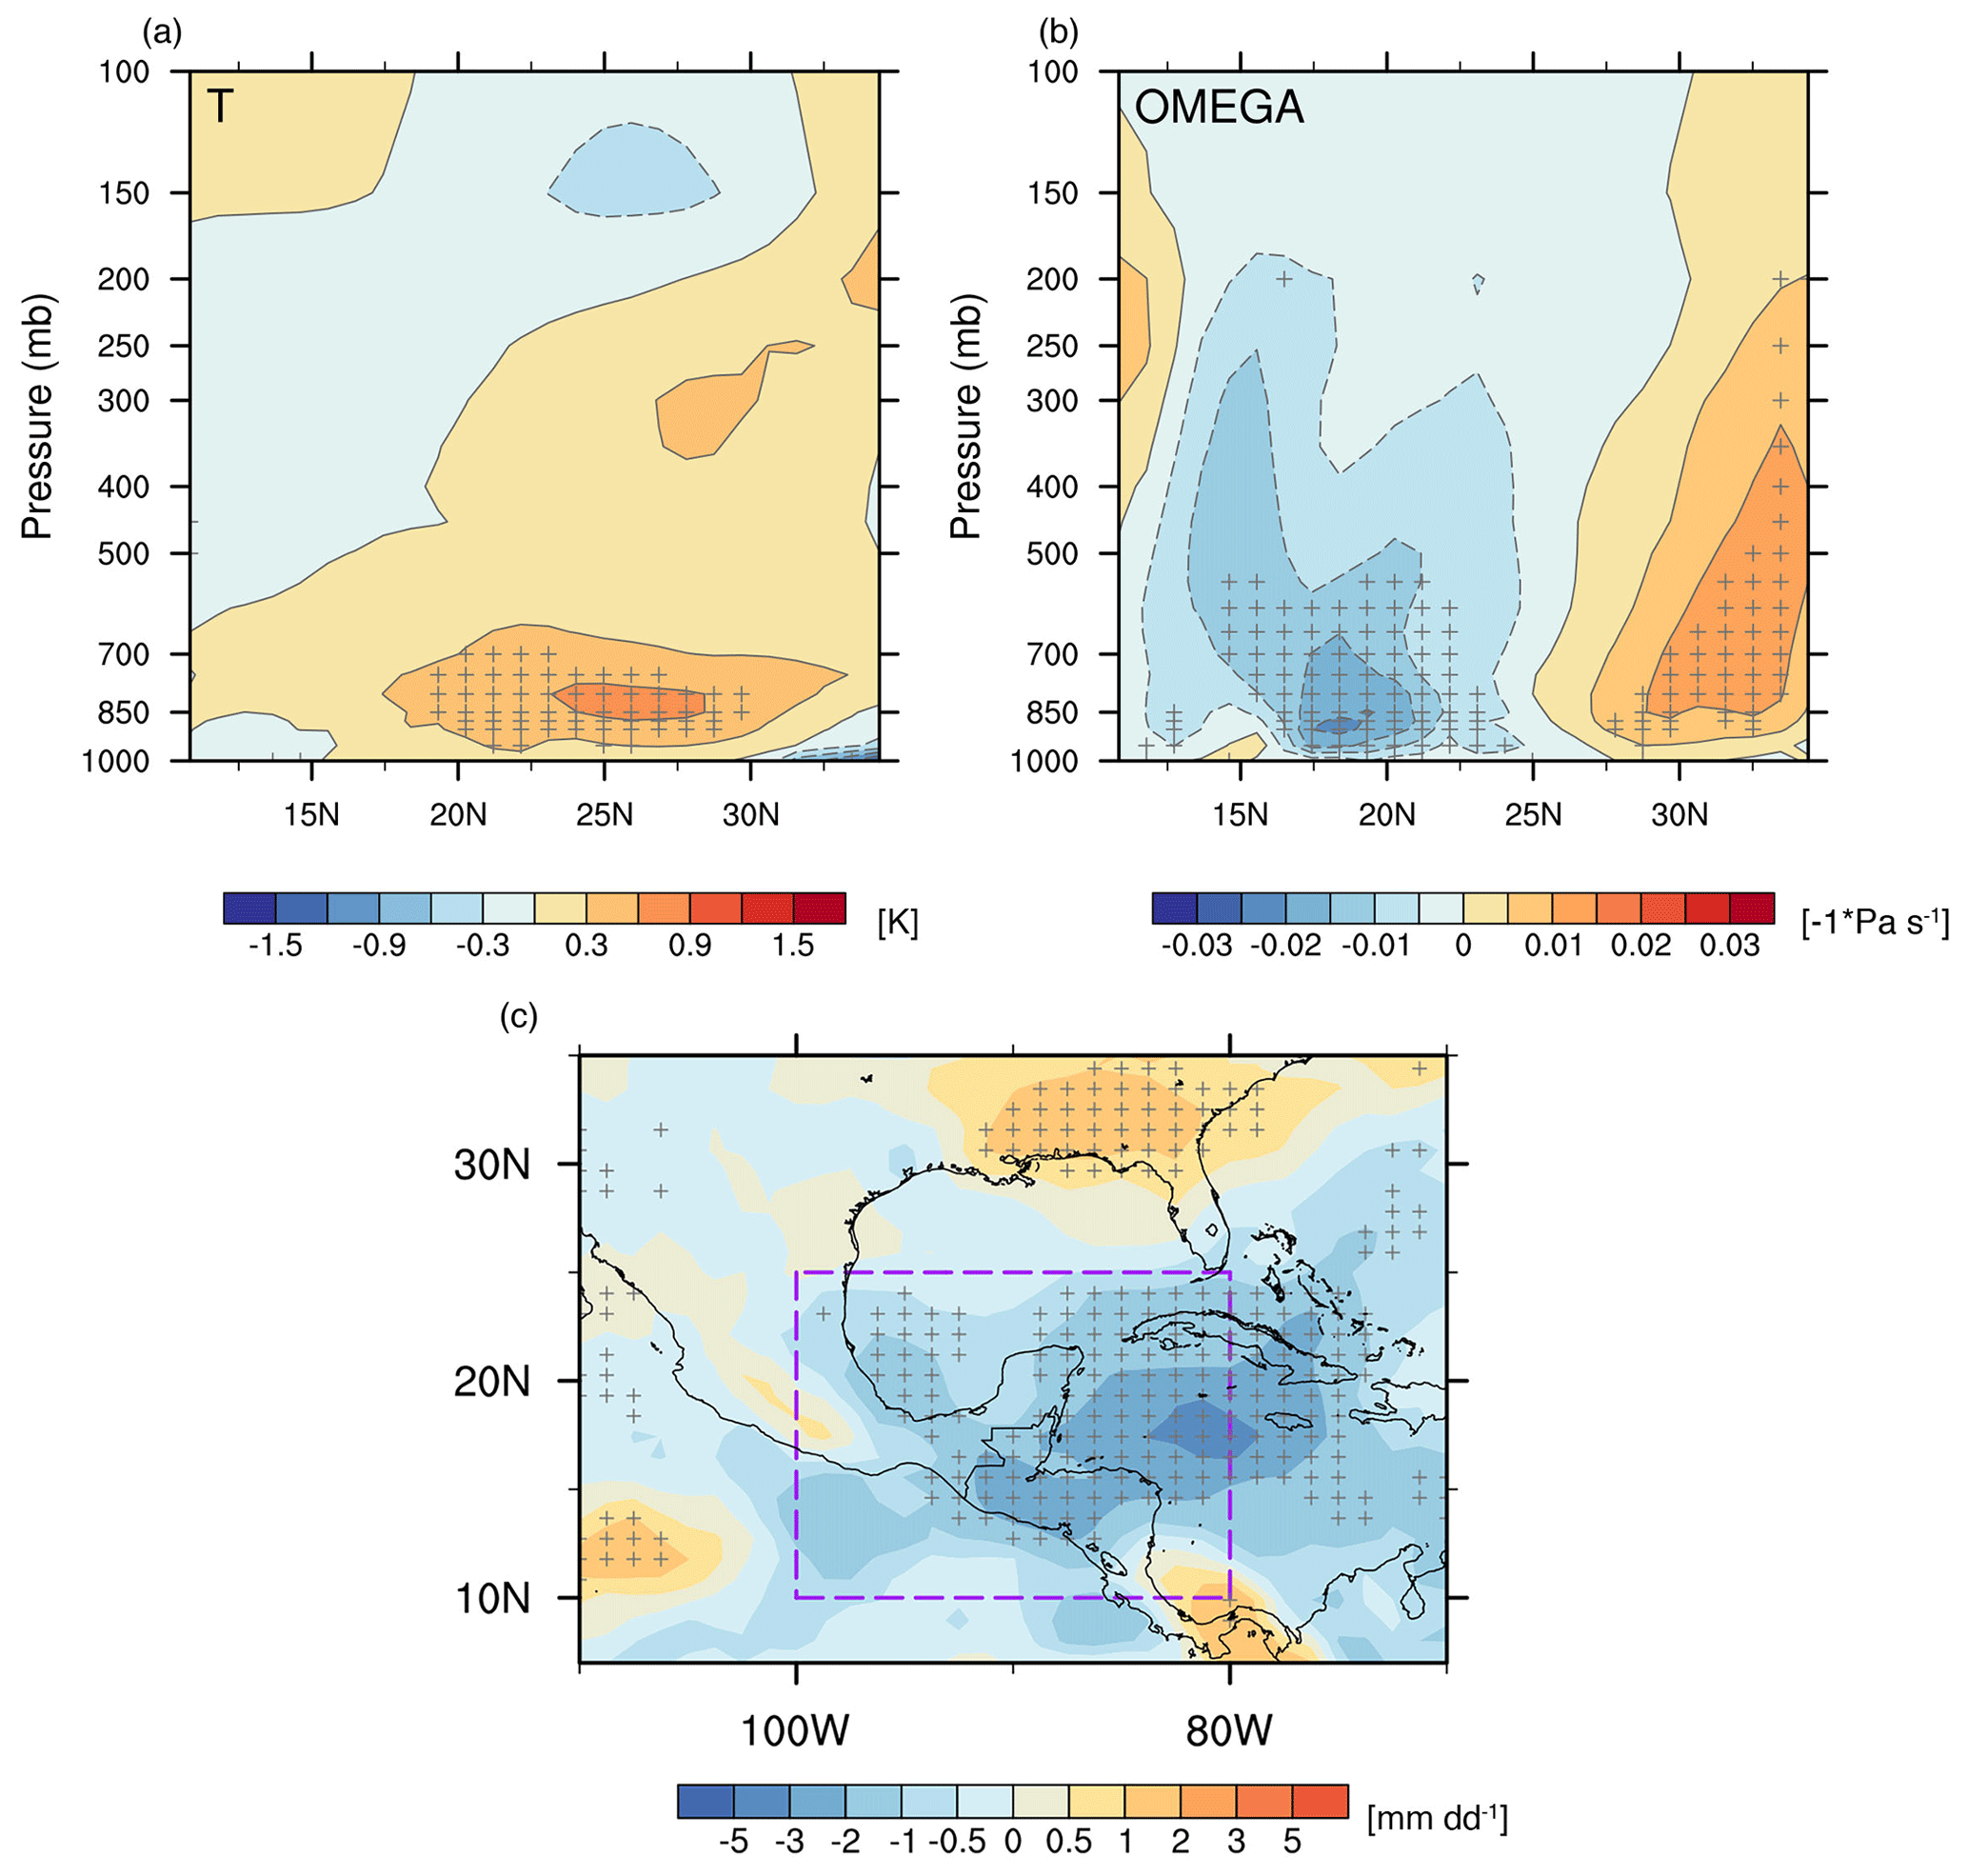
Figure 9Vertical slices of differences in (a) atmospheric temperature and (b) pressure velocity averaged along 80–100° W between Case_Strong and Case_Weak. (c) Differences in precipitation between Case_Strong and Case_Weak. Stippling indicates the differences that are statistically significant based on Student's t test.
We also conducted sensitivity simulations to investigate the underlying processes involved in the fire–precipitation feedback. Figure 7 shows the simulated difference in AOD (referred to as fire AOD) between Case_Strong and Case_Weak. Both the spatial pattern and magnitude agree well with the difference in AOD between strong and weak fire years based on CALIPSO observations. Compared to the spatial patterns of fire consumption in Fig. 7, we can clearly see two transport pathways of fire-emitted aerosols due to the continental divide of the Central Mexican Plateau. North of 15° N, fire-emitted aerosols are transported northward by the subtropical high, where large amounts accumulate over the downstream Gulf of Mexico due to the blocking effect of the high terrain, and the rest is further transported northward reaching the southeastern US; south of 15° N, prevailing easterlies transport fire-emitted aerosols directly westward, far away to the eastern Pacific.
Considering the northward pathway, with the stack of light-absorbing BC aerosols, the air temperature warms up by approximately 1–2 K, and this warming extends from 800 to 700 hPa where BC aerosols are suspended (Fig. 8a–c). Vertical slices of the temperature anomalies indicate significant warming to the north (downstream) of the fire source regions (Fig. 9a). In response to this warming, the air above the fire aerosol layers rises up (Fig. 8d–f). The anomalous ascending motion covers from the Gulf of Mexico to the southeastern US, with the maximum center located near the Gulf of Mexico. This abnormal ascending motion, on the one hand, enhances precipitation downstream from the fire source regions, and on the other hand forces a compensating anomalous descending motion over the SMCA region and suppresses precipitation over the fire source regions (Fig. 9b–c). This simulated opposite change in precipitation resembles the spatial pattern of the composite precipitation difference between strong and weak fire years (Fig. 4a), suggesting that fire–precipitation interaction reinforces the contrast in precipitation between strong and weak fire years. Therefore, the model simulations confirm a positive fire–precipitation feedback loop at the short timescale within the fire season. Although variations in RH could influence fire activities on interannual scales, the short-term feedback of fire aerosols on near-surface RH is much weaker compared to precipitation (Fig. S5).
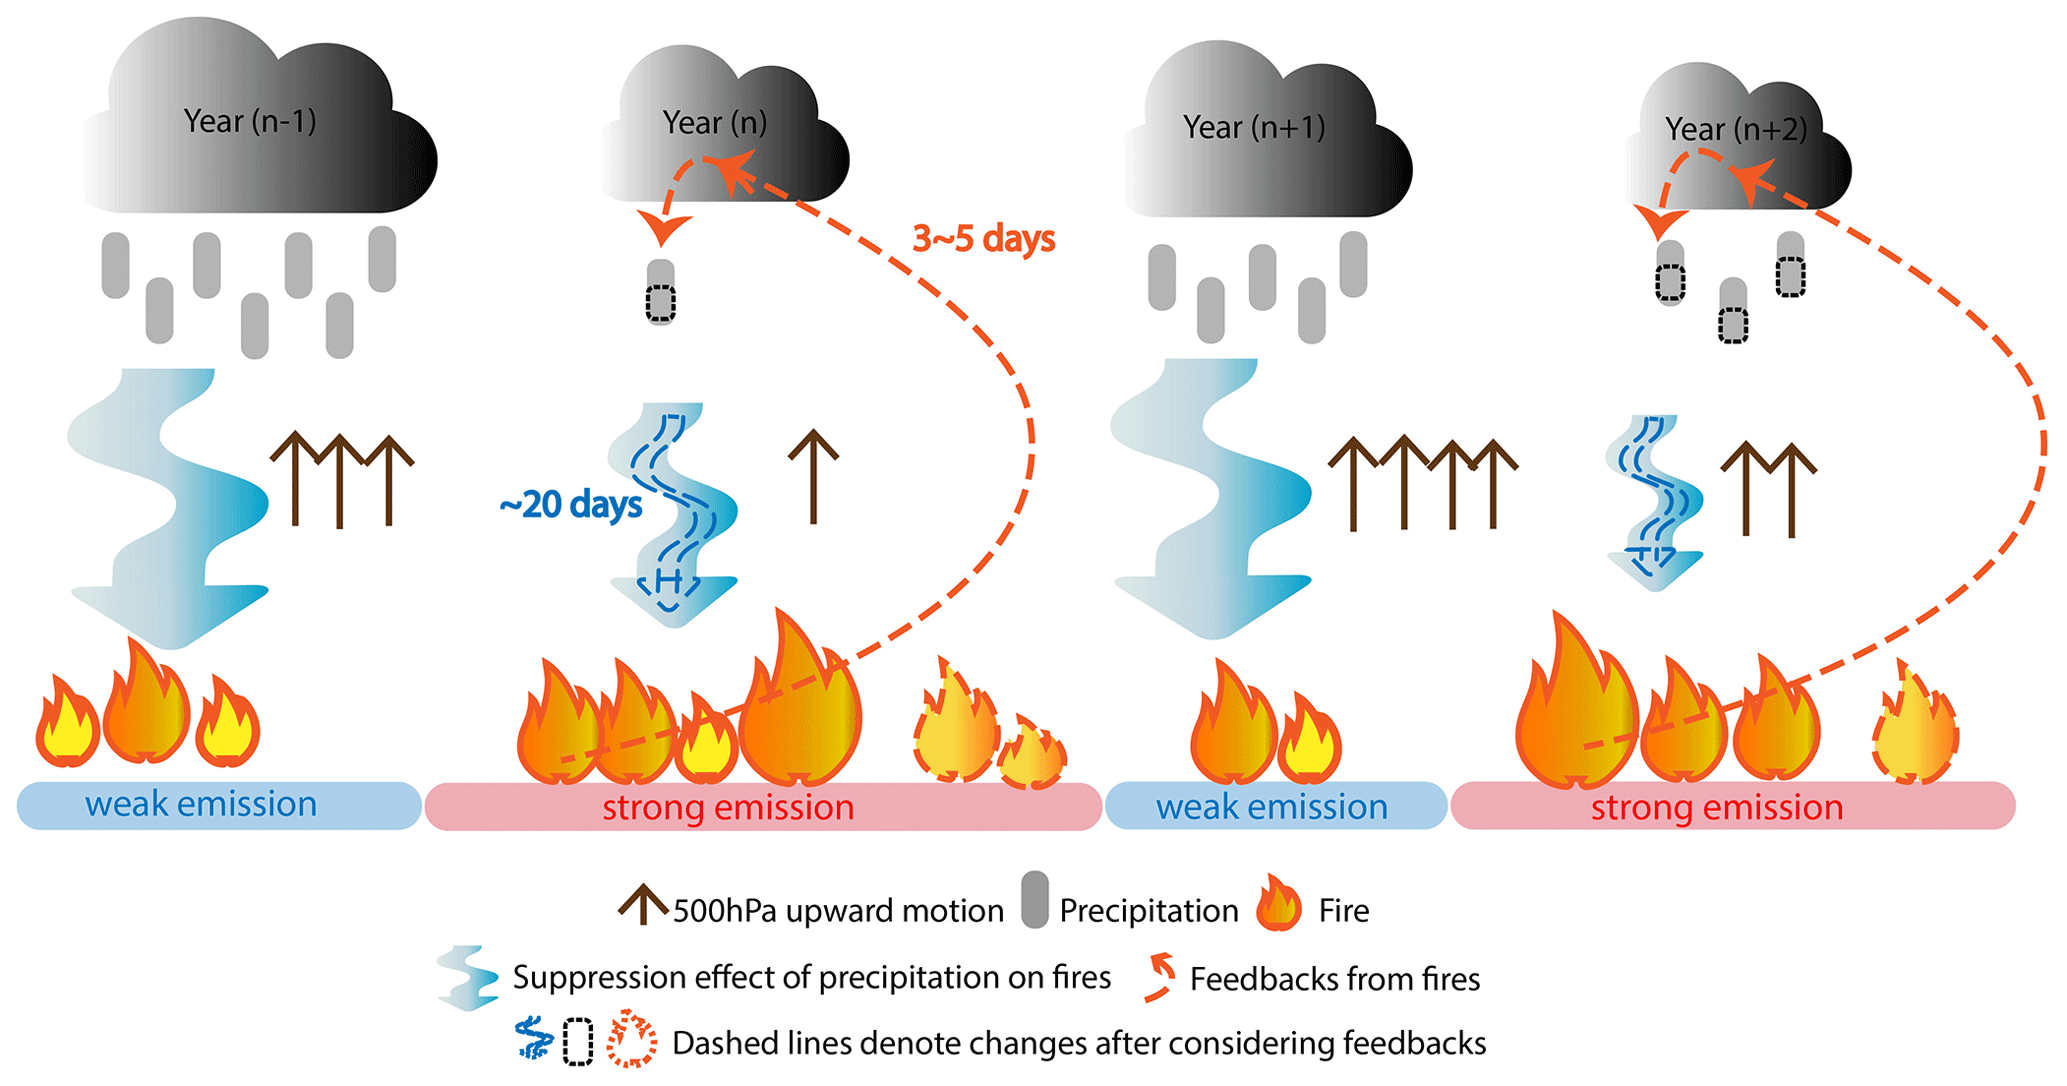
Figure 10A schematic diagram illustrating how multi-scale fire–precipitation interactions shape the quasi-biennial variability in fires over the SMCA. On the interannual scale, the quasi-biennially varying precipitation triggers a similar quasi-biennial variability in fire activities via its suppression effect. Compared to adjacent years, a weaker precipitation year will facilitate stronger fires. At short timescales within each fire season, there is a positive feedback loop between fire and precipitation (denoted by dashed lines). The suppression effect of precipitation lasts for approximately 20 d, while fires affect precipitation through a rapid adjustment of 3–5 d. In the weaker precipitation years, stronger fire activities emit more aerosols, which by mediating temperature and circulation, ultimately suppress precipitation over the fire source region. Such short-term interactions between precipitation and fire amplify the magnitude of anomalous fire and precipitation in individual years and enhance the quasi-biennial variability in both precipitation and fire.
As illustrated in Fig. 10, originally on the interannual scale, fire activities over the SMCA region exhibit a significant quasi-biennial variability that is predominantly determined by the quasi-biennial variation in precipitation. On this basis, there is an additional two-way interaction between fire and precipitation at short timescales. Typically, precipitation suppresses fire activities with a time lag of more than 20 d, while fire-emitted aerosols suppress precipitation by modifying circulations with a timescale of 3–5 d. That is to say, for a year with abnormally weak precipitation, fire activities would be amplified, which in turn further weakens precipitation. In this way, the short-term positive feedback loop ultimately enhances the quasi-biennial variability in precipitation and fire activities over the SMCA region.
Fires play an important role in the Earth system, and the complex interaction between fire activities and ambient conditions poses a great challenge to fire prediction and management. This study identifies a distinct quasi-biennial variability in fire activities over the SMCA region from 2003–2019 on the basis of different fire metrics. Both the bottom-up (GFEDv4.1s) and top-down (QFED) emission inventories show relatively higher fire consumption (or emission) in odd-numbered years than in adjacent even-numbered years, with the only exception being the year 2016. Moreover, fire-induced changes in AOD also reveal consistent quasi-biennial variation.
By examining the relationships between fire consumption and different meteorological variables, our analysis indicates that the quasi-biennial signal is dominated by quasi-biennially varying precipitation, while the influence of temperature is mostly reflected in a few extremely strong fire years. Typically, strong fire years correspond to suppressed upward motion and weakened precipitation. The quasi-biennial variability in precipitation is seen in the time series of the regional mean precipitation over the SMCA and the spectral analysis and is closely related to the EP-NP teleconnection pattern in the 2 months prior to the fire season. The positive phase of the EP-NP pattern implies enhanced precipitation over the southeastern US (downstream of the SMCA) but reduced precipitation over the SMCA region.
On the other hand, we also found that positive feedback exists between fire-emitted aerosols and precipitation at short timescales and acts to amplify the quasi-biennial oscillations in both fire and precipitation over the SMCA region. Lead–lag correlations between daily fire emission and precipitation suggest that the two-way interactions occur with different durations. The suppression effect of precipitation lasts for approximately 20 d, while fire-emitted aerosols weaken precipitation through rapid adjustments of 3–5 d. Furthermore, model simulations reveal that compared to weak fire years, more fire-emitted aerosols are transported downstream and accumulate near the Gulf of Mexico in strong fire years. These suspended light-absorbing BC aerosols warm the low-level atmosphere by 1–2 K and induce anomalous ascending motion aloft (700 hPa). A compensating descending motion is subsequently forced over the SMCA region, which ultimately suppresses precipitation over the fire source region and thus forms a positive feedback loop.
These findings provide useful information relevant to the fire control and mitigation of poor air quality over the SMCA region. Given that fire activities over the SMCA represent a typical tropical fire regime, our work may also provide new insight into some fundamental features of fires in the Earth system. The mechanism may also operate usefully elsewhere on the planet. While precipitation is demonstrated to play the primary role in determining the periodicity of fire activities over the SMCA region, the fundamental cause of the quasi-biennial variability in precipitation is unknown. Currently, we have only shown that the EP-NP teleconnection, among all selected indices, exerts the most influence on the interannual variability in precipitation. Other teleconnection patterns, e.g., ENSO, despite their insignificant correlations with SMCA precipitation, may affect circulation and precipitation over the southeastern US or over the neighboring Intra-Americas Sea (Anthony Chen and Taylor, 2002) and thus might more or less affect the precipitation over the SMCA region. Moreover, although we demonstrated that positive feedback between fire-emitted aerosols and precipitation exists at short timescales, the extent to which this feedback contributes to the quasi-biennial variability in fire activities remains unquantified due to the absence of coupled fire–climate interactions in current model simulations. Future efforts to quantify how different factors and feedback work together to shape the quasi-biennial variability in precipitation and fire activities using interactive fire–climate models would further benefit the prediction and management of fire activities over the SMCA region.
Figures were made with the NCAR Command Language version 6.6.2 (https://doi.org/10.5065/D6WD3XH5, NCAR, 2019).
The GFEDv4.1s fire emission data are available at https://www.globalfiredata.org/ (Randerson et al., 2023). The CRU TS v.4.06 can be found at https://crudata.uea.ac.uk/cru/data/hrg/ (CRU, 2023). The QFEDv2.5 data can be found at http://ftp.as.harvard.edu/gcgrid/data/ExtData/HEMCO/QFED/v2018-07/ (Global Modeling and Assimilation Office, 2023). The MODIS GPP data are available from https://doi.org/10.5067/MODIS/MOD17A2H.061 (Running et al., 2021). The MERRA-2 reanalysis data can be found at https://doi.org/10.5067/FH9A0MLJPC7N (Global Modeling and Assimilation Office, 2015). The IMERG precipitation dataset can be obtained from https://gpm.nasa.gov/data/imerg (Huffman et al., 2023). The GPCP dataset can be obtained from https://doi.org/10.7289/V5RX998Z (Adler et al., 2017). Teleconnection indices can be found at https://psl.noaa.gov/data/climateindices/list/ (Physical Sciences Laboratory, 2023a). The NCEP-NCAR reanalysis is obtained from https://www.esrl.noaa.gov/psd/data/gridded/data.ncep.reanalysis2.html (Physical Sciences Laboratory, 2023b). The CALIPSO product is available at https://doi.org/10.5067/CALIOP/CALIPSO/CAL_LID_L3_Tropospheric_APro_AllSky-Standard-V4-20 (NASA/LARC/SD/ASDC, 2019).
The supplement related to this article is available online at: https://doi.org/10.5194/acp-24-3115-2024-supplement.
YL and YQ formulated the presented idea. YQ, YW, and YL developed the theory. YL performed the computations and verified the methods. YQ, YL, and KZ wrote the first draft of the manuscript. All authors contributed to the interpretation of the results and writing and revision of the final paper.
At least one of the (co-)authors is a member of the editorial board of Atmospheric Chemistry and Physics. The peer-review process was guided by an independent editor, and the authors also have no other competing interests to declare.
Publisher’s note: Copernicus Publications remains neutral with regard to jurisdictional claims made in the text, published maps, institutional affiliations, or any other geographical representation in this paper. While Copernicus Publications makes every effort to include appropriate place names, the final responsibility lies with the authors.
We benefited from discussion of some aspects of this work with John M. Wallace and Dae-Hyun Kim. Yawen Liu is supported by the National Natural Science Foundation of China (grant no. 42325506). This research is also supported by the US Department of Energy Office of Science Biological and Environmental Research as part of the Regional and Global Model Analysis and Multi-Sector Dynamics program areas. The Pacific Northwest National Laboratory is operated on behalf of the DOE by the Battelle Memorial Institute under contract DE-AC05-76RL01830. We are grateful to the High-Performance Computing (HPC) and the Massive Data Center (MDC) at Nanjing University for the numerical calculations.
This research has been supported by the National Natural Science Foundation of China (grant no. 42325506).
This paper was edited by Duncan Watson-Parris and reviewed by Jatan Buch and one anonymous referee.
Abram, N. J., Henley, B. J., Sen Gupta, A., Lippmann, T. J. R., Clarke, H., Dowdy, A. J., Sharples, J. J., Nolan, R. H., Zhang, T. R., Wooster, M. J., Wurtzel, J. B., Meissner, K. J., Pitman, A. J., Ukkola, A. M., Murphy, B. P., Tapper, N. J., and Boer, M. M.: Connections of climate change and variability to large and extreme forest fires in southeast Australia, Commun. Earth Environ., 2, 8, https://doi.org/10.1038/s43247-020-00065-8, 2021.
Adler, R., Wang, J.-J., Sapiano, M., Huffman, G., Bolvin, D., Nelkin, E., and NOAA CDR Program: Global Precipitation Climatology Project (GPCP) Climate Data Record (CDR), Version 1.3 (Daily), NOAA National Centers for Environmental Information [data set], https://doi.org/10.7289/V5RX998Z, 2017.
Adler, R. F., Sapiano, M. R. P., Huffman, G. J., Wang, J. J., Gu, G. J., Bolvin, D., Chiu, L., Schneider, U., Becker, A., Nelkin, E., Xie, P. P., Ferraro, R., and Shin, D. B.: The Global Precipitation Climatology Project (GPCP) Monthly Analysis (New Version 2.3) and a Review of 2017 Global Precipitation, Atmosphere, 9, 138, https://doi.org/10.3390/atmos9040138, 2018.
Aguilera, R., Corringham, T., Gershunov, A., and Benmarhnia, T.: Wildfire smoke impacts respiratory health more than fine particles from other sources: observational evidence from Southern California, Nat. Commun., 12, 1493, https://doi.org/10.1038/s41467-021-21708-0, 2021.
Amador, J. A., Alfaro, E. J., Lizano, O. G., and Magana, V. O.: Atmospheric forcing of the eastern tropical Pacific: A review, Prog. Oceanogr., 69, 101–142, https://doi.org/10.1016/j.pocean.2006.03.007, 2006.
Anthony Chen, A. and Taylor, M. A.: Investigating the link between early season Caribbean rainfall and the El Niño + 1 year, Int. J. Climatol., 22, 87–106, https://doi.org/10.1002/joc.711, 2002.
Archibald, S.: Managing the human component of fire regimes: lessons from Africa, Philos. T. Roy. Soc. B, 371, 20150346, https://doi.org/10.1098/rstb.2015.0346, 2016.
Athanasiadis, P. J., Wallace, J. M., and Wettstein, J. J.: Patterns of Wintertime Jet Stream Variability and Their Relation to the Storm Tracks, J. Atmos. Sci., 67, 1361–1381, https://doi.org/10.1175/2009jas3270.1, 2010.
Bond, T. C., Doherty, S. J., Fahey, D., Forster, P., Berntsen, T., DeAngelo, B., Flanner, M., Ghan, S., Kärcher, B., and Koch, D.: Bounding the role of black carbon in the climate system: A scientific assessment, J. Geophys. Res.-Atmos., 118, 5380–5552, 2013.
Bowman, D. M., Balch, J. K., Artaxo, P., Bond, W. J., Carlson, J. M., Cochrane, M. A., D'Antonio, C. M., DeFries, R. S., Doyle, J. C., and Harrison, S. P.: Fire in the Earth system, Science, 324, 481–484, 2009.
Bowman, D. M. J. S., Williamson, G. J., Abatzoglou, J. T., Kolden, C. A., Cochrane, M. A., and Smith, A. M. S.: Human exposure and sensitivity to globally extreme wildfire events, Nat. Ecol. Evol., 1, 0058, https://doi.org/10.1038/s41559-016-0058, 2017.
Cary, G. J., Keane, R. E., Gardner, R. H., Lavorel, S., Flannigan, M. D., Davies, I. D., Li, C., Lenihan, J. M., Rupp, T. S., and Mouillot, F.: Comparison of the sensitivity of landscape-fire-succession models to variation in terrain, fuel pattern, climate and weather, Landscape Ecol., 21, 121–137, 2006.
Chiodi, A. M., Potter, B. E., and Larkin, N. K.: Multi-Decadal Change in Western US Nighttime Vapor Pressure Deficit, Geophys. Res. Lett., 48, e2021GL092830, https://doi.org/10.1029/2021GL092830, 2021.
Crounse, J. D., DeCarlo, P. F., Blake, D. R., Emmons, L. K., Campos, T. L., Apel, E. C., Clarke, A. D., Weinheimer, A. J., McCabe, D. C., Yokelson, R. J., Jimenez, J. L., and Wennberg, P. O.: Biomass burning and urban air pollution over the Central Mexican Plateau, Atmos. Chem. Phys., 9, 4929–4944, https://doi.org/10.5194/acp-9-4929-2009, 2009.
CRU (Climatic Research Unit): CRU TS v. 4.06, Climatic Research Unit (University of East Anglia) and Met Office [data set], https://crudata.uea.ac.uk/cru/data/hrg/, last access: 3 July 2023.
Crutzen, P. J. and Andreae, M. O.: Biomass Burning in the Tropics – Impact on Atmospheric Chemistry and Biogeochemical Cycles, Science, 250, 1669–1678, https://doi.org/10.1126/science.250.4988.1669, 1990.
Danabasoglu, G., Lamarque, J. F., Bacmeister, J., Bailey, D. A., DuVivier, A. K., Edwards, J., Emmons, L. K., Fasullo, J., Garcia, R., Gettelman, A., Hannay, C., Holland, M. M., Large, W. G., Lauritzen, P. H., Lawrence, D. M., Lenaerts, J. T. M., Lindsay, K., Lipscomb, W. H., Mills, M. J., Neale, R., Oleson, K. W., Otto-Bliesner, B., Phillips, A. S., Sacks, W., Tilmes, S., van Kampenhout, L., Vertenstein, M., Bertini, A., Dennis, J., Deser, C., Fischer, C., Fox-Kemper, B., Kay, J. E., Kinnison, D., Kushner, P. J., Larson, V. E., Long, M. C., Mickelson, S., Moore, J. K., Nienhouse, E., Polvani, L., Rasch, P. J., and Strand, W. G.: The Community Earth System Model Version 2 (CESM2), J. Adv. Model. Earth Sy., 12, e2019MS001916, https://doi.org/10.1029/2019MS001916, 2020.
Ding, K., Huang, X., Ding, A. J., Wang, M. H., Su, H., Kerminen, V. M., Petaja, T., Tan, Z. M., Wang, Z. L., Zhou, D. R., Sun, J. N., Liao, H., Wang, H. J., Carslaw, K., Wood, R., Zuidema, P., Rosenfeld, D., Kulmala, M., Fu, C. B., Poschl, U., Cheng, Y. F., and Andreae, M. O.: Aerosol-boundary-layer-monsoon interactions amplify semi-direct effect of biomass smoke on low cloud formation in Southeast Asia, Nat. Commun., 12, 6416, https://doi.org/10.1038/s41467-021-26728-4, 2021.
Durán-Quesada, A. M., Gimeno, L., and Amador, J.: Role of moisture transport for Central American precipitation, Earth Syst. Dynam., 8, 147–161, https://doi.org/10.5194/esd-8-147-2017, 2017.
Fang, K. Y., Yao, Q. C., Guo, Z. T., Zheng, B., Du, J. H., Qi, F. Z., Yan, P., Li, J., Ou, T. H., Liu, J., He, M. S., and Trouet, V.: ENSO modulates wildfire activity in China, Nat. Commun., 12, 1764, https://doi.org/10.1038/s41467-021-21988-6, 2021.
Fasullo, J. T., Rosenbloom, N., and Buchholz, R.: A multiyear tropical Pacific cooling response to recent Australian wildfires in CESM2, Sci. Adv., 9, eadg1213, https://doi.org/10.1126/sciadv.adg1213, 2023.
Flannigan, M. D., Logan, K. A., Amiro, B. D., Skinner, W. R., and Stocks, B.: Future area burned in Canada, Climatic Change, 72, 1–16, 2005.
Flannigan, M. D., Krawchuk, M. A., de Groot, W. J., Wotton, B. M., and Gowman, L. M.: Implications of changing climate for global wildland fire, Int. J. Wildland Fire, 18, 483–507, 2009.
Gelaro, R., McCarty, W., Suarez, M. J., Todling, R., Molod, A., Takacs, L., Randles, C. A., Darmenov, A., Bosilovich, M. G., Reichle, R., Wargan, K., Coy, L., Cullather, R., Draper, C., Akella, S., Buchard, V., Conaty, A., da Silva, A. M., Gu, W., Kim, G. K., Koster, R., Lucchesi, R., Merkova, D., Nielsen, J. E., Partyka, G., Pawson, S., Putman, W., Rienecker, M., Schubert, S. D., Sienkiewicz, M., and Zhao, B.: The Modern-Era Retrospective Analysis for Research and Applications, Version 2 (MERRA-2), J. Climate, 30, 5419–5454, https://doi.org/10.1175/Jcli-D-16-0758.1, 2017.
Giglio, L., Randerson, J. T., and Werf, G. R.: Analysis of daily, monthly, and annual burned area using the fourth-generation global fire emissions database (GFED4), J. Geophys. Res.-Biogeo., 118, 317–328, 2013.
Gillett, N., Weaver, A., Zwiers, F., and Flannigan, M.: Detecting the effect of climate change on Canadian forest fires, Geophys. Res. Lett., 31, L18211, https://doi.org/10.1029/2004GL020876, 2004.
Global Modeling and Assimilation Office (GMAO): tavgM_2d_aer_Nx: MERRA-2 monthly (p-coord, 0.625x0.5L42), version 5.12.4, Goddard Space Flight Center Distributed Active Archive Center (GSFC DAAC) [data set], Greenbelt, MD, USA, https://doi.org/10.5067/FH9A0MLJPC7N, 2015.
Global Modeling and Assimilation Office (GMAO): Quick Fire Emissions Dataset version 2.5, NASA Goddard Space Flight Center [data set], http://ftp.as.harvard.edu/gcgrid/data/ExtData/HEMCO/QFED/v2018-07/, last access: 1 July 2023.
Harris, I., Jones, P., Osborn, T., and Lister, D.: Updated high-resolution grids of monthly climatic observations – the CRU TS3. 10 Dataset, Int. J. Climatol., 34, 623–642, 2014.
Hersbach, H., Bell, B., Berrisford, P., Hirahara, S., Horanyi, A., Munoz-Sabater, J., Nicolas, J., Peubey, C., Radu, R., Schepers, D., Simmons, A., Soci, C., Abdalla, S., Abellan, X., Balsamo, G., Bechtold, P., Biavati, G., Bidlot, J., Bonavita, M., De Chiara, G., Dahlgren, P., Dee, D., Diamantakis, M., Dragani, R., Flemming, J., Forbes, R., Fuentes, M., Geer, A., Haimberger, L., Healy, S., Hogan, R. J., Holm, E., Janiskova, M., Keeley, S., Laloyaux, P., Lopez, P., Lupu, C., Radnoti, G., de Rosnay, P., Rozum, I., Vamborg, F., Villaume, S., and Thepaut, J. N.: The ERA5 global reanalysis, Q. J. Roy. Meteor. Soc., 146, 1999–2049, https://doi.org/10.1002/qj.3803, 2020.
Huang, X., Ding, K., Liu, J. Y., Wang, Z. L., Tang, R., Xue, L., Wang, H. K., Zhang, Q., Tan, Z. M., Fu, C. B., Davis, S. J., Andreae, M. O., and Ding, A. J.: Smoke-weather interaction affects extreme wildfires in diverse coastal regions, Science, 379, 457–461, https://doi.org/10.1126/science.add9843, 2023.
Huffman, G. J., Bolvin, D. T., Braithwaite, D., Hsu, K.-L., Joyce, R. J., Kidd, C., Nelkin, E. J., Sorooshian, S., Stocker, E. F., and Tan, J.: Integrated multi-satellite retrievals for the global precipitation measurement (GPM) mission (IMERG), Satellite Precipitation Measurement, Springer, Vol. 1, 343–353, ISBN: 3030245675, 2020.
Huffman, G., Bolvin, D., Braithwaite, D., Hsu, K., Joyce, R., and Xie, P.: Integrated Multi-satellite Retrievals for GPM (IMERG), NASA's Precipitation Processing Center [data set], https://gpm.nasa.gov/data/imerg, last access: 1 July 2023.
Ichoku, C., Ellison, L. T., Willmot, K. E., Matsui, T., Dezfuli, A. K., Gatebe, C. K., Wang, J., Wilcox, E. M., Lee, J., and Adegoke, J.: Biomass burning, land-cover change, and the hydrological cycle in Northern sub-Saharan Africa, Environm. Res. Lett., 11, 095005, https://doi.org/10.1088/1748-9326/11/9/095005, 2016.
Jiang, Y. Q., Yang, X. Q., Liu, X. H., Qian, Y., Zhang, K., Wang, M. H., Li, F., Wang, Y., and Lu, Z.: Impacts of Wildfire Aerosols on Global Energy Budget and Climate: The Role of Climate Feedbacks, J. Climate, 33, 3351–3366, https://doi.org/10.1175/Jcli-D-19-0572.1, 2020.
Jolly, W. M., Cochrane, M. A., Freeborn, P. H., Holden, Z. A., Brown, T. J., Williamson, G. J., and Bowman, D. M. J. S.: Climate-induced variations in global wildfire danger from 1979 to 2013, Nat. Commun., 6, 7537, https://doi.org/10.1038/ncomms8537, 2015.
Kanamitsu, M., Ebisuzaki, W., Woollen, J., Yang, S.-K., Hnilo, J., Fiorino, M., and Potter, G.: NCEP–DOE AMIP-II Reanalysis (R-2), B. Am. Meteorol. Soc., 83, 1631–1644, 2002.
Knorr, W., Dentener, F., Lamarque, J.-F., Jiang, L., and Arneth, A.: Wildfire air pollution hazard during the 21st century, Atmos. Chem. Phys., 17, 9223–9236, https://doi.org/10.5194/acp-17-9223-2017, 2017.
Koster, R. D., Darmenov, A. S., and da Silva, A. M.: The quick fire emissions dataset (QFED): Documentation of versions 2.1, 2.2 and 2.4, NASA Goddard Space Flight Center [data set], Greenbelt, MD, United States, https://ntrs.nasa.gov/citations/20180005253 (last access: 1 July 2023), 2015.
Kreidenweis, S. M., Remer, L. A., Bruintjes, R., and Dubovik, O.: Smoke aerosol from biomass burning in Mexico: Hygroscopic smoke optical model, J. Geophys. Res.-Atmos., 106, 4831–4844, 2001.
Lee, Y. S., Collins, D. R., Li, R., Bowman, K. P., and Feingold, G.: Expected impact of an aged biomass burning aerosol on cloud condensation nuclei and cloud droplet concentrations, J. Geophys. Res.-Atmos., 111, D22204, https://doi.org/10.1029/2005JD006464, 2006.
Liu, Y., Zhang, K., Qian, Y., Wang, Y., Zou, Y., Song, Y., Wan, H., Liu, X., and Yang, X.-Q.: Investigation of short-term effective radiative forcing of fire aerosols over North America using nudged hindcast ensembles, Atmos. Chem. Phys., 18, 31–47, https://doi.org/10.5194/acp-18-31-2018, 2018.
Lu, Z., Liu, X., Zhang, Z., Zhao, C., Meyer, K., Rajapakshe, C., Wu, C., Yang, Z., and Penner, J. E.: Biomass smoke from southern Africa can significantly enhance the brightness of stratocumulus over the southeastern Atlantic Ocean, P. Natl. Acad. Sci. USA, 115, 2924–2929, https://doi.org/10.1073/pnas.17137031, 2018.
Magi, B. I., Rabin, S., Shevliakova, E., and Pacala, S.: Separating agricultural and non-agricultural fire seasonality at regional scales, Biogeosciences, 9, 3003–3012, https://doi.org/10.5194/bg-9-3003-2012, 2012.
Marlon, J. R., Bartlein, P. J., Carcaillet, C., Gavin, D. G., Harrison, S. P., Higuera, P. E., Joos, F., Power, M., and Prentice, I.: Climate and human influences on global biomass burning over the past two millennia, Nat. Geosci., 1, 697–702, 2008.
Mouillot, F. and Field, C. B.: Fire history and the global carbon budget: a 1 × 1 fire history reconstruction for the 20th century, Glob. Change Biol., 11, 398–420, 2005.
NASA/LARC/SD/ASDC: CALIPSO Lidar Level 3 Tropospheric Aerosol Profiles, All Sky Data, Standard V4-20, NASA Langley Atmospheric Science Data Center DAAC [data set], https://doi.org/10.5067/CALIOP/CALIPSO/CAL_LID_L3_Tropospheric_APro_AllSky-Standard-V4-20, 2019.
NCAR: The NCAR Command Language, Version 6.6.2, UCAR/NCAR/CISL/TDD [code], Boulder, Colorado, https://doi.org/10.5065/D6WD3XH5, 2019.
Page, S. E., Siegert, F., Rieley, J. O., Boehm, H. D. V., Jaya, A., and Limin, S.: The amount of carbon released from peat and forest fires in Indonesia during 1997, Nature, 420, 61–65, https://doi.org/10.1038/nature01131, 2002.
Pechony, O. and Shindell, D.: Fire parameterization on a global scale, J. Geophys. Res.-Atmos., 114, D16115, https://doi.org/10.1029/2009JD011927, 2009.
Perdigon-Morales, J., Romero-Centeno, R., Barrett, B. S., and Ordonez, P.: Intraseasonal Variability of Summer Precipitation in Mexico: MJO Influence on the Midsummer Drought, J. Climate, 32, 2313–2327, https://doi.org/10.1175/Jcli-D-18-0425.1, 2019.
Physical Sciences Laboratory (PSL): Climate Indices: Monthly Atmospheric and Ocean Time Series, PSL [data set], https://psl.noaa.gov/data/climateindices/list/, last access: 1 July 2023a.
Physical Sciences Laboratory (PSL): NCEP/DOE Reanalysis II, PSL [data set], https://psl.noaa.gov/data/gridded/data.ncep.reanalysis2.html, last access: 1 July 2023b.
Power, M. J., Marlon, J., Ortiz, N., Bartlein, P. J., Harrison, S. P., Mayle, F. E., Ballouche, A., Bradshaw, R. H., Carcaillet, C., and Cordova, C.: Changes in fire regimes since the Last Glacial Maximum: an assessment based on a global synthesis and analysis of charcoal data, Clim. Dynam., 30, 887–907, 2008.
Prasad, V. K., Badarinath, K., and Eaturu, A.: Biophysical and anthropogenic controls of forest fires in the Deccan Plateau, India, J. Environ. Manage., 86, 1–13, 2008.
Randerson, J., Chen, Y., Werf, G., Rogers, B., and Morton, D.: Global burned area and biomass burning emissions from small fires, J. Geophys. Res.-Biogeo., 117, G04012, https://doi.org/10.1029/2012JG002128, 2012.
Randerson, J. T., van der Werf, G. R., Giglio, L., Collatz, G. J., and Kasibhatla, P. S.: Global Fire Emissions Database, Version 4.1s (GFEDv4.1s), ORNL DAAC [data set], Oak Ridge, Tennessee, USA, https://www.globalfiredata.org/, last access: 3 July 2023.
Rogers, C. M. and Bowman, K. P.: Transport of smoke from the Central American fires of 1998, J. Geophys. Res.-Atmos., 106, 28357–28368, 2001.
Running, S., Mu, Q., and Zhao, M.: MODIS/Terra Gross Primary Productivity 8-Day L4 Global 500 m SIN Grid V061, NASA EOSDIS Land Processes Distributed Active Archive Center [data set], https://doi.org/10.5067/MODIS/MOD17A2H.061, 2021.
Su, W., Charlock, T. P., And, F. G. R., and Rutan, D.: Photosynthetically active radiation from Clouds and the Earth's Radiant Energy System (CERES) products, J. Geophys. Res., 112, G02022, https://doi.org/10.1029/2006JG000290, 2007. Su, W., Charlock, T. P., Rose, F. G., and Rutan, D.: Photosynthetically active radiation from Clouds and the Earth's Radiant Energy System (CERES) products, J. Geophys. Res., 112, G02022, https://doi.org/10.1029/2006JG000290, 2007.
Tosca, M. G., Randerson, J. T., Zender, C. S., Flanner, M. G., and Rasch, P. J.: Do biomass burning aerosols intensify drought in equatorial Asia during El Niño?, Atmos. Chem. Phys., 10, 3515–3528, https://doi.org/10.5194/acp-10-3515-2010, 2010.
Tosca, M. G., Randerson, J. T., and Zender, C. S.: Global impact of smoke aerosols from landscape fires on climate and the Hadley circulation, Atmos. Chem. Phys., 13, 5227–5241, https://doi.org/10.5194/acp-13-5227-2013, 2013.
van Marle, M. J. E., Kloster, S., Magi, B. I., Marlon, J. R., Daniau, A.-L., Field, R. D., Arneth, A., Forrest, M., Hantson, S., Kehrwald, N. M., Knorr, W., Lasslop, G., Li, F., Mangeon, S., Yue, C., Kaiser, J. W., and van der Werf, G. R.: Historic global biomass burning emissions for CMIP6 (BB4CMIP) based on merging satellite observations with proxies and fire models (1750–2015), Geosci. Model Dev., 10, 3329–3357, https://doi.org/10.5194/gmd-10-3329-2017, 2017.
Veira, A., Lasslop, G., and Kloster, S.: Wildfires in a warmer climate: Emission fluxes, emission heights, and black carbon concentrations in 2090–2099, J. Geophys. Res.-Atmos., 121, 3195–3223, 2016.
Voulgarakis, A. and Field, R. D.: Fire influences on atmospheric composition, air quality and climate, Current Pollution Reports, 1, 70–81, 2015.
Winker, D. M., Tackett, J. L., Getzewich, B. J., Liu, Z., Vaughan, M. A., and Rogers, R. R.: The global 3-D distribution of tropospheric aerosols as characterized by CALIOP, Atmos. Chem. Phys., 13, 3345–3361, https://doi.org/10.5194/acp-13-3345-2013, 2013.
Yokelson, R. J., Urbanski, S. P., Atlas, E. L., Toohey, D. W., Alvarado, E. C., Crounse, J. D., Wennberg, P. O., Fisher, M. E., Wold, C. E., Campos, T. L., Adachi, K., Buseck, P. R., and Hao, W. M.: Emissions from forest fires near Mexico City, Atmos. Chem. Phys., 7, 5569–5584, https://doi.org/10.5194/acp-7-5569-2007, 2007.
Yokelson, R. J., Crounse, J. D., DeCarlo, P. F., Karl, T., Urbanski, S., Atlas, E., Campos, T., Shinozuka, Y., Kapustin, V., Clarke, A. D., Weinheimer, A., Knapp, D. J., Montzka, D. D., Holloway, J., Weibring, P., Flocke, F., Zheng, W., Toohey, D., Wennberg, P. O., Wiedinmyer, C., Mauldin, L., Fried, A., Richter, D., Walega, J., Jimenez, J. L., Adachi, K., Buseck, P. R., Hall, S. R., and Shetter, R.: Emissions from biomass burning in the Yucatan, Atmos. Chem. Phys., 9, 5785–5812, https://doi.org/10.5194/acp-9-5785-2009, 2009.
Yue, S., Zhu, J., Chen, S., Xie, Q., Li, W., Li, L., Ren, H., Su, S., Li, P., and Ma, H.: Brown carbon from biomass burning imposes strong circum-Arctic warming, One Earth, 5, 293–304, 2022.
Zhang, Y. W., Fan, J. W., Shrivastava, M., Homeyer, C. R., Wang, Y., and Seinfeld, J. H.: Notable impact of wildfires in the western United States on weather hazards in the central United States, P. Natl. Acad. Sci. USA, 119, e2207329119, https://doi.org/10.1073/pnas.2207329119, 2022.
Zhong, Q., Schutgens, N., van der Werf, G., van Noije, T., Tsigaridis, K., Bauer, S. E., Mielonen, T., Kirkevåg, A., Seland, Ø., Kokkola, H., Checa-Garcia, R., Neubauer, D., Kipling, Z., Matsui, H., Ginoux, P., Takemura, T., Le Sager, P., Rémy, S., Bian, H., Chin, M., Zhang, K., Zhu, J., Tsyro, S. G., Curci, G., Protonotariou, A., Johnson, B., Penner, J. E., Bellouin, N., Skeie, R. B., and Myhre, G.: Satellite-based evaluation of AeroCom model bias in biomass burning regions, Atmos. Chem. Phys., 22, 11009–11032, https://doi.org/10.5194/acp-22-11009-2022, 2022.