the Creative Commons Attribution 4.0 License.
the Creative Commons Attribution 4.0 License.
 | 11 Mar 2024
Morphological and optical properties of carbonaceous aerosol particles from ship emissions and biomass burning during a summer cruise measurement in the South China Sea
Cuizhi Sun
Yongyun Zhang
Baoling Liang
Min Gao
Xi Sun
Xue Ni
Qibin Sun
Hengjia Ou
Dexian Chen
Shengzhen Zhou
Carbonaceous aerosols constitute a crucial component of atmospheric marine aerosols among which black carbon (BC) and brown carbon (BrC) are important contributors to light absorption and hence the positive climatic radiative forcing in the marine atmosphere. We conducted month-long (5 May–9 June 2021) onboard sample collections and online measurements of carbonaceous aerosols to characterize their morphological and optical properties during a ship cruise in the South China Sea (SCS), covering a marine region of 11.9–24.5° N, 111.1–118.2° E. Single particles were collected by a single-particle sampler, and offline analyses were performed using a transmission electron microscope (TEM) coupled with energy-dispersive X-ray spectroscopy (EDS). Online measurements of BC in PM2.5 were made by a seven-wavelength aethalometer, and organic carbon (OC) and elemental carbon (EC) mass concentrations were measured by a semi-online analyzer. Feret diameters of the single particles during navigation and stop showed size distributions with the lognormal fitting peaks at 307 and 325 nm, respectively. The fresh (without coating) and aged BC particles (after removal of coating by the electron beams in the TEM) showed same median fractal dimensions (1.61), in contrast to their different median lacunarities (0.53 vs. 0.59). The aged BC particles showed narrower Feret diameters (229–2557 nm) during navigation than those (78–2926 nm) of freshly emitted BC from the ship's own exhaust during stop. Moreover, tar balls, as one important component of single particles from ship emissions and as the tracer of biomass burning, were identified with geometrical diameters of 160–420 nm in the TEM images. The EDS analyses showed those tar balls are mainly mixed with sea salt, organics, BC, and sulfate. We also found a significant fraction of aged BC in various mixing states (core–shell, embedded) with other components of the aerosol particles after long-range transport.
The campaign was further divided into several periods (the before-monsoon period, BMP; transition monsoon period, TMP; after-monsoon period, AMP; and ship pollution period, SPP) according to the wind direction during monsoon and the ship's own pollution. The median absorption Ångström exponent (AAE) values derived from all wavelengths were 1.14, 1.02, 1.08, and 1.06 for BMP, TMP, AMP, and SPP, respectively. Particularly, a median AAE value of 1.93 was obtained during two significant biomass burning events. These results showed that biomass burning (BB) and fossil fuel (FF) combustion contributed to 18 %–22 % and 78 %–82 % of all the BC light absorption without the two intense biomass burning events, during which BB and FF accounted for 42 % and 58 %, respectively. The two BB events originated from the Philippines and Southeast Asia before and after the summer monsoon. Our results demonstrated that BC can serve as the core of aged particles, but the fractal dimensions of BC aggregates were subject to little variation; moreover, such BC particles become much more aggregated after aging in the marine atmosphere, which further affects the light absorption of the BC particles in the SCS.
- Article
(12623 KB) - Full-text XML
-
Supplement
(2973 KB) - BibTeX
- EndNote


Carbonaceous aerosols (e.g., organic carbon (OC), elemental carbon (EC), and black carbon (BC)) profoundly impact regional and global climate (Corbin et al., 2019; Lu et al., 2020; Rabha and Saikia, 2020). As an important component of carbonaceous aerosols, BC can serve as a tracer of anthropogenic pollution once emitted from the incomplete combustion of fossil fuels and biomass burning. Moreover, BC particles are generally soot-aggregated with graphene-like layer microstructures which can be observed using electron microscopy (Adachi et al., 2019). BC and EC are two components of carbonaceous aerosols that are measured differently. BC is typically quantified based on its light-absorbing properties, while EC is measured using thermal–optical methods (Duarte et al., 2021). However, EC can also be referred to as graphitic carbon or soot, with some overlap in their definitions. Another important component of carbonaceous aerosols, BrC, represents a series of light-absorbing organic compounds, contributing significantly to the light absorption of atmospheric aerosols (Wang et al., 2020b). BrC and BC show different light absorption patterns as a wavelength function. BrC and BC can be distinguished by measuring the absorption spectra of aerosol particles at different wavelengths (Andreae and Gelencsér, 2006; Bond et al., 2013; Laskin et al., 2015; Li et al., 2020; Yus-Díez et al., 2021). Tar balls are commonly used as typical tracers of biomass and biofuel burning due to their composition of amorphous carbon. These particles also belong to BrC because they are light-absorbing organics (Adachi et al., 2019; Hand et al., 2005). Spherical tar balls emitted from biomass burning have been observed in cases of both wild fire burning (Adachi et al., 2019) and laboratory-generated tar ball particles (Tóth et al., 2014). In the atmosphere, biomass burning produces a significant number of tar balls, which are not deliquescent but can absorb water at high relative humidity (RH = ∼ 80 %), thereby affecting their ability to scatter and absorb light (Hand et al., 2005).
The optical properties of BC and BrC particles are affected by several factors including the emission source, coating component, particle size, morphology, and mixing state of the particles (Wei et al., 2020). The BC configuration in the single particles would influence their radiative effects (Luo et al., 2021). For example, core–shell BC particles show enhanced light absorption compared to bare BC particles, especially when BC particles are coated with absorptive materials such as BrC (Budhavant et al., 2020; Cappa et al., 2012; Shamjad et al., 2012; You et al., 2016). The “lensing effect” refers to the absorption enhancement if BC is coated with non-absorbing organic or inorganic materials (Luo et al., 2021; Yang et al., 2009). In contrast, if the BC coating materials are highly absorptive, no absorption enhancement may occur at shorter visible and UV wavelengths, a phenomenon known as the “shielding effect”. The shielding and lensing effects depend on the coating thickness over BC (Lack and Cappa, 2010). When BC is well mixed with BrC internally, its total absorption enhancement becomes smaller than the enhancements of counterparts that are not well mixed due to the absorptive coating that acts as a shield (Feng et al., 2021). Moreover, it is impossible for BC and other materials to be homogeneously distributed.
The extent to which BC and BrC contribute to light absorption in atmospheric aerosols can be assessed using the absorption Ångstrom exponent (AAE) (Wang et al., 2020a). The AAE is a parameter used to quantify the spectral dependence of aerosol light absorption. It is calculated by fitting a power-law relationship between the aerosol absorption and wavelengths over a given spectral range. The AAE is used to identify sources and types of aerosols, and a higher AAE value is associated with sources such as biomass burning or urban pollution, while a lower AAE value suggests absorption by larger particles, such as mineral dust or sea salt (Blanco-Donado, 2022; Duarte et al., 2021). However, many factors, such as mixing state, coating, particle size, refractive index, wavelength, and emission source, would affect the AAE values for BC and BrC aerosols, leading to large variations among different studies (Moschos et al., 2021). For example, a previous study showed that the AAE values derived from wavelengths of 405 and 781 nm are very sensitive to refractive index and particle diameter (Chylek et al., 2019). The AAE values of 0.8–1.6 at 470 and 950 nm are attributed to traffic emissions and fuel combustion (Ezani et al., 2021). Comparatively, those AAE values can be as large as 2.0 for ship emissions (Helin et al., 2021). Moreover, the recommended AAE value for fossil fuel (FF) and biomass burning (BB) is 1 and 2 (or higher), respectively (Liu et al., 2023). Other AAE values were also found in previous studies for FF (0.9) and BB (1.68) (Zotter et al., 2017) or FF (1.2) and BB (2.2) as the mostly used optical pair (Milinković et al., 2021). The AAE values of 1.4 and 1.7 for BC and BrC were set to be the lower and upper limits in the modeling study of biomass burning particles mixed with BC and BrC (Chylek et al., 2019). However, the use of constant AAE values for calculating the BC fractions from BB and FF led to large uncertainties without knowledge of the core size or coating thickness of the BC particles (Virkkula, 2021). Currently, the effect of the light absorption is not well known for the carbonaceous particles in the marine atmosphere due to scarce ship-based measurements.
The optical properties of BC and BrC particles can also be investigated through fractal dimension (Df) analysis based on the fractal properties of BC aggregates. Df illustrates how particles aggregate and grow, and it can be determined through box counting methods, ensemble methods, or soot parameter methods with transmission electron microscope (TEM) images (Pang et al., 2022). The Df values are mainly related to emission sources and aging process of the particles. Previous studies showed that the Df values of fresh BC particles tend to be small but become larger after aging because the particles are more compact due to coatings (Luo et al., 2022; Wang et al., 2017). Df values of 1.8 and 2.6 were used respectively for fluffy and compact BC particles in a numerical study to investigate the impact of the BC morphology on light absorption (Luo et al., 2021). Laboratory experiments simulating wildfires showed that the Df values of freshly emitted BC were in a range of 1.74–1.92 (Chakrabarty et al., 2006), compared to the range of 1.67–1.83 from a field study of the Las Conchas fire (China et al., 2013). A similar range of the Df values of 1.67–1.93 were found at a remote site in the southeastern Tibetan Plateau (Wang et al., 2017). The Df values obtained for the traffic emissions were as large as 3 (Wei et al., 2020). In addition to the emission sources and aging process, Df is also dependent on the particle size. A previous experimental study found that for polystyrene latex (PSL) particles, the Df values decreased with the increase in particle size up to 200 nm (H. Wu et al., 2013). Nevertheless, knowledge of the fractal dimension for carbonaceous particles in the marine atmosphere is currently very limited, hindering our ability to understand the aging process and the optical properties of these particles.
In the past years, carbonaceous aerosols in the marine atmosphere have been extensively studied on regional and global scales, focusing on the transport of anthropogenic emissions to the sea areas. The BC background concentrations in Antarctic and Arctic regions are below 20 ng m−3 (Fossum et al., 2022). The BC outflows from Asia to the Pacific Ocean exhibit seasonal variations and originate from anthropogenic and biomass burning sources in China, Siberia, and Southeast Asia (Matsui et al., 2013). Ship-based BC and EC measurements reveal significant influence of continental transport on remote oceanic regions, including the Bay of Bengal (Kedia et al., 2012), the Indian Ocean (Kompalli et al., 2021), the southern Indian Ocean and the Southern Ocean (Ueda et al., 2018), the North Sea (Bencs et al., 2020), the Antarctic (Chaubey et al., 2013; Schmale et al., 2019), the North Pacific (Taketani et al., 2016; Xing et al., 2014), the Arctic (Pankratova et al., 2021; Sharma et al., 2019), the northeast Atlantic (Fossum et al., 2022), the Yellow Sea (Kwak et al., 2022), and the western Pacific (Ma et al., 2022). However, to our knowledge, the BC mass concentrations have been found to vary significantly across different oceans and seasons, with levels from 3 to 2800 ng m−3, and to be influenced by anthropogenic activities and seasonal factors. The online BC measurements in the South China Sea (SCS) region are limited. An early study reported BC concentrations on Yongxing Island during the rainy season (16 May–20 June 2008) and the dry season (12 December 2008–8 January 2009), with average concentrations of 0.54 and 0.67 µg m−3, respectively (D. Wu et al., 2013). Recent studies conducted at coastal sites in the SCS found that BC concentrations are strongly impacted by land anthropogenic emissions (Wang et al., 2022). The time-resolved BC concentration varies with the vertical heights (T. Sun et al., 2020), and the carbonaceous materials of OC and EC account for 31 %–62 % in PM2.5 (Yan et al., 2018). Nevertheless, quantification of the light absorption potential of BC and BrC aerosols remains challenging due to the limited knowledge regarding the morphology, particle size, and mixing state of carbonaceous particles in the SCS (Kompalli et al., 2021). Furthermore, the atmosphere in the SCS is typically influenced by the southwesterly monsoon from May to August (Wang and Wu, 2020), which affects the air masses from Southeast Asia. In this study, we conducted ship-based measurements of BC, OC, and EC and single-particle sampling during summer (5 May–9 June 2021) in the SCS. The morphology (i.e., the fractal dimension and the size of the single BC particles) and light absorption properties of carbonaceous particles were characterized. The source origins, relationships between the Df and BC size, and the impact of summer monsoon on the light absorption of the BC particles are discussed.
2.1 Cruise route and instrumentation
The cruise measurements were carried out from 5 May to 9 June 2021, covering a marine area of 11.9–24.5° N, 111.1–118.2° E in the SCS. Single particles were collected on the TEM grids (3.05 mm I.D., copper meshed and covered with lacey carbon film) located on the front deck during ship navigation and stop using a single-stage particle sampler (DKL-2, Genstar Electronic Technology Co., Ltd., China), which is the same as other studies (Chen et al., 2023; Dong et al., 2018; Liu et al., 2021; Pang et al., 2022). The sampling flow rate and time were set at 1 L min−1 and 10 min, respectively, for each collection. The nozzle diameter of this single-cascade impactor is 0.3 mm. The particles with aerodynamic diameters above 0.2 µm were collected with a collection efficiency of 50 %, assuming a particle density of 1.5 kg m−3 (Marple and Olson, 2011). More details can be found in Sect. 1 in the Supplement. The mixing state and morphology of the single particles were analyzed utilizing a TEM (FEI Tecnai G2 Spirit, Holland) operated at an accelerating voltage of 120 kV, in conjunction with an energy-dispersive spectrometry (EDS; Bruker Nano GmbH Berlin, Esprit 1.9, Germany) instrument for elemental analysis. The thickness of the EDS detector (type XFlash 5060) is 0.45 mm, with a Si dead layer of 0.029 mm. Notably, in the EDS spectra, when analyzing particle composition, Cu should be excluded, and a considerable level of C and Si should be observed in the background signals due to the presence of Si in the detector and Cu and C in the TEM grid. The substrate holder of TEM was tilted 25° for thorough inspection during imaging and EDS analysis.
The sampling inlets were installed on the bow of the research vessel with a height of ∼ 15 m above sea level. The ship's own emissions (e.g., engine, cooking) were exhausted from the chimney on the stern with a linear distance of ∼ 22 m to the inlets. The BC mass concentrations were measured by an aethalometer (Model AE33, Magee Scientific, USA) with a time resolution of 1 min (Drinovec et al., 2015). Note that the BC mass concentrations derived from AE33 are referred to as equivalent BC mass concentrations due to the light absorption of both BC and BrC at 880 nm. The sampling air was regulated by a PM2.5 cyclone (BGI Inc., Waltham, MA, USA) and subsequently dried by a Nafion dryer (Model MD-700 series, Perma Pure Inc., USA) with a relative humidity below 40 % through the filter tape (type 8060) at a sample flow rate of 5 L min−1. Data corrections were made for the AE33 aethalometer that was employed, considering the multiple scattering parameters (C(λ)= 1.39) for the filter type, the leakage factor (ζ= 0.01), and the compensation parameters (Kmin= −0.005, Kmax= 0.015) used. The measured attenuation at seven wavelengths (seven channels) is used to determine the wavelength-dependent absorption coefficient. The mass absorption cross-sections (MACs; σair) applied in the BC calculations were 18.47, 14.54, 13.14, 11.58, 10.35, 7.77, and 7.19 m2 g−1 for wavelengths of 370, 470, 520, 590, 660, 880, and 950 nm, respectively (Ausmeel et al., 2020). The measured values at 880 nm (channel 6) are for black carbon concentration calculation and at 370 nm (channel 1) for UV particulate matter (UVPM) concentration (Drinovec et al., 2015). The detection limit of AE33 aethalometer is approximately 0.03 µg m−3 for a 1 min integration period and below 0.005 µg m−3 for a 1 h integration period. The instrument was automatically calibrated by zero air every day. Notably, significant spikes were observed during periods when the ship was stationary, when it was traveling at low speeds, and when the wind was blowing from the stern of the vessel.
The OC and EC concentrations were measured by a semi-continuous analyzer (Model-4, Sunset Laboratory Inc., USA) based on the optical attenuation and thermo-optical transmittance methods (Geron, 2009) under the NIOSH 5040 thermal–optical protocol (Lappi and Ristimaki, 2017). Similarly, the sampling air passed through a PM2.5 cyclone (BGI Inc., Waltham, MA, USA) and was dried by a Nafion dryer (Model MD-700 series, Perma Pure Inc., USA) with a relative humidity below 40 % at a flow rate of 8 L min−1. The air then passed through a denuder for the removal of volatile organic compounds (VOCs), and the particles were collected on the quartz filter with 45 min accumulation and 15 min analysis. The instrument was calibrated with the standard sucrose solution as recommended. The manufacturer-set detection limits are 0.4 and 0.2 µg m−3 for OC and EC, respectively (Brown et al., 2019). However, several previous studies showed that these values may vary substantially in a range of 0.04–2 and 0.001–0.5 µg m−3 for OC and EC, respectively, due to the artifact of the quartz filters (Bao et al., 2021; Bauer et al., 2009; Chen et al., 2017; Jung et al., 2011; Karanasiou et al., 2020; Park et al., 2018; Zhang et al., 2021). Here, we estimated the instrument noise (including contamination) of 0.15 and 0.012 µg m−3 for OC and EC based on 26 effective blank measurements, with 3 times the standard deviation (3σ) during the campaign. The limit of detection (LOD) for OC and EC is 0.18 and 0.19 µg m−3, respectively, calculated as 3 times the standard deviation of replicate measurements of a standard sucrose solution with a carbon content of 10.516 µg m−3. The Sunset analyzer also measures optical EC based on the transmission of 660 nm wavelength light through the quartz fiber filter employed for sampling, similar to the AE33 for optical BC measurements. Optical EC is defined as the apparent EC on the filter based on the measured apparent absorbance and the fixed absorption coefficient according to the user's manual of the Sunset . Both our study and a previous study (Brown et al., 2019) showed that the optical EC concentrations from Sunset were comparable with the BC concentrations from AE33. Note that the resultant optical EC concentrations from the instrument output may be overestimated due to the limitation of the filter-based optical measurements.
The measurements of solar radiation (SR), temperature (T), pressure (P), relative humidity (RH), relative wind direction (RWD), and relative wind speed (RWS) were provided by the automatic weather station (AWS430, Vaisala Inc., Finland) (Song et al., 2022) located on the front deck of the research vessel. This station comprises a range of integrated sensors, including a wind speed and direction sensor (model WMT702), a temperature and humidity sensor (model HMP155), and an atmospheric pressure sensor (model BARO-1). The cruise route for ship navigation is from the global positioning system (GPS) on board the ship (Seapath 330+, Kongsberg Inc., Norway).
2.2 Data analyses and processing
2.2.1 Analyses of single particles
A total of 34 samples (15 during navigation and 19 at stop) were analyzed, and more than 20 bright-field TEM images were randomly captured for each sample except for those at the center of the grids where particles were easily overlapped. A total of 15624 single particles were statistically analyzed to obtain morphology information (i.e., the Feret diameter, area, perimeter) for each particle using the software ImageJ (1.53q, National Institute of Health, USA) (Cheng et al., 2021; Schindelin et al., 2012). In the analysis of particle size, the Feret diameter is defined as the distance between the parallel tangential lines that constrain the particle perpendicularly. In this study, we applied the Feret diameter as the longest distance between any two points along the boundary of the selected particles. Moreover, we utilized “geometrical diameter” to describe the size of tar balls with circular shape, which signifies the distance between two points located on the surface of a geometric shape, with this line passing through the shape's center. Using geometrical diameter is suitable to quantify the size of the observed tar balls which excluded any coatings or additional materials. Specifically, we employed TEM data acquisition software to measure the geometrical diameters of observed tar balls. The Df values of the BC particles were estimated using the box counting method using the plugin FracLac. An example is given in the Supplement (Sect. S2, Fig. S1) to show how to calculate Df using the software. A detailed description of the procedure using the box counting method and the software ImageJ can be found in the Supplement. The Df values are very sensitive to the fill extent and sizes of the particles. A previous study showed low fractal dimensions when the particles contain void volumes (Peyronel et al., 2010).
The ship's own emissions can be identified using various measures, for example, high CO and NOx concentrations (L. Sun et al., 2020), high BC concentrations (Alroe et al., 2020; Shank et al., 2012), regular cooking emissions (Cai et al., 2020), and wind speeds/directions between the ship stop and start operation (Ausmeel et al., 2020; Kwak et al., 2022). The contribution of ship emissions to BC sources in the marine atmosphere depends on engine types, operation modes, fuel types, and loadings (Gagne et al., 2021; Jiang et al., 2018; Karjalainen et al., 2022; Lack and Corbett, 2012; Wu et al., 2021; Zhao et al., 2020). Here, we classify two sampling modes (navigation vs. stop) of single-particle analyses according to ship operation and relative wind direction/speed. In this study, the relative wind direction/speed is relative to the ship heading. The navigation mode is constrained by the relative wind direction of 0–80 or 280–360° and the relative wind speed greater than 5 m s−1, averaged for every 10 min (consistent with the collection time of TEM samples). The stop mode is set with the relative wind direction of greater than 80° and less than 280° or the relative wind speed lower than 5 m s−1. The navigation mode samples are mainly from marine air and air masses of long-range transport, while the stop mode collected air masses which are mixed with the ship's own emissions. The wind speed and relative wind speed are calculated by Eq. (1) (Aijjou et al., 2020).
where VR is the relative wind, Vs is the ship speed, Vw is the true wind speed, and α is the angle between the ship heading and the true wind direction.
The temporal profiles of ship heading directions and relative wind direction/speed are shown in the Supplement (Sect. 3, Fig. S2). Details of the two sampling modes (navigation vs. stop) on a vector average of 10 min are listed in Table S1 and Fig. S3. Here, we distinguished the ship's own emissions (research vessel) from those of other ships or long-range transport based on the following criteria: low relative wind speed (< 5 m s−1), relative wind direction encompassing ship exhaust (80–280°), and a substantial AE33-derived hourly averaged BC mass concentration (> 2 µg m−3). Other ship emissions far from the research vessel are treated as a part of the transported air masses in this study.
2.2.2 BC, OC, EC and optical EC data
In this study, BC data obtained from the AE33 aethalometer are referred to as BC, while data from the analyzer are expressed as thermal OC, thermal EC, and optical EC. Here, we averaged the BC mass concentrations over 1 min and excluded those below the detection limit of 0.03 µg m−3 to minimize the variations. We also removed the ship's own emissions which are characterized by spikes in particle number concentrations according to the wind directions (Fossum et al., 2022). BC mass concentration was calculated using Eqs. (2)–(3) which are cited from the AE33 aethalometer user's manual (v1.54).
where ATN is optical attenuation, I0 is reference signal, and I is spot signal.
where BC is black carbon concentration, S is spot area, F1 is measured flow, ζ is leakage factor, σair is the mass absorption cross-section (MAC), C is multiple scattering parameter, k is compensation parameter, and t is time.
AAE was calculated according to Eq. (4) using the light absorption at wavelengths of 470 and 950 nm, which are built-in algorithms in the AE33 aethalometer as described elsewhere (Helin et al., 2021; Kang et al., 2022; Milinković et al., 2021; Zotter et al., 2017). This method serves as a two-composition source apportionment for BC emitted from fossil fuels and biomass burning (AAE model), which applied AAE = 1 for fossil fuel and AAE = 2 for biomass. The calculations for BC(BB) and BC(FF) are shown in Eqs. (5)–(7), which refer to the AE33 aethalometer user's manual and publication (Sandradewi et al., 2008). The optical absorption coefficient is the sum of biomass burning and fossil fuel burning contributions. Basic equations are using Beer–Lambert's law.
where σabs is the aerosol absorption coefficient, σair is the mass absorption cross-section (MAC), and σabs= BC ⋅ σair. λ1=470 nm and λ2=950 nm.
where σabs (470 nm)FF and σabs (950 nm)FF are the aerosol absorption coefficients at wavelengths of 470 and 950 nm for fossil fuel (FF), σabs (470 nm)BB and σabs (950 nm)BB are the aerosol absorption coefficients at wavelengths of 470 and 950 nm for biomass burning (BB), and AAEFF and AAEBB are equals to 1 and 2, respectively.
Alternatively, AAE can be obtained from the negative slope of linear regression between the log-transformed σabs and all the wavelength spectra so that hourly AAE values (all λ) can be obtained following a similar method in Retama et al. (2022). Details are shown in the Supplement (Sect. 4, Fig. S4). Here, we define Delta-C as the difference between the concentration derived from the aforementioned UVPM data (at 370 nm) and BC concentration (at 880 nm). This Delta-C parameter was employed as an indicator of smoke from biomass burning in previous wood biomass burning studies (Harrison, 2020; Zhang et al., 2017).
The OC and EC (thermal) concentrations lower than the instrument noise (0.15 and 0.012 µg m−3 for OC and EC, respectively) were excluded. Additional data were removed for those with laser correction factors below 0.88 and calibration peak areas lower than the initial calibration levels (within 10 %), and a total of 551 h data was used for further analysis. In comparison, the Sunset optical EC (at 660 nm) is generally consistent with the Magee AE33 aethalometer derived BC (at 880 nm) within 9 % (Brown et al., 2019), which is shown in Sect. 3.3. The EC concentration data from Sunset were considered to show ship pollution and were discarded when the BC concentrations from the AE33 aethalometer were higher than 2 µg m−3, in addition to those with relative wind directions of 80–280° regardless of the BC concentrations, as mentioned before.
2.2.3 HYSPLIT backward trajectory and MODIS fire data
The backward trajectories were calculated using NOAA HYSPLIT (Hybrid Single-Particle Lagrangian Integrated Trajectory) (v5.2.1) at heights of 100, 500, and 1000 m above ground level (AGL). Daily meteorological data with 1.0° × 1.0° spatial resolution for trajectory calculation were downloaded from the global data assimilation system (GADS) (ftp://arlftp.arlhq.noaa.gov/pub/archives/gdas1/, last access: 31 March 2023). Here, we calculated the 72 h back trajectories of air masses arriving at the single-particle sampling sites along the cruise route.
Moderate Resolution Imaging Spectrometer (MODIS) data are available from the Near-real-time MODIS Collection 6 products (https://firms.modaps.eosdis.nasa.gov/download/, last access: 31 March 2023). Here, we selected a region of 0–30° N, 102–127° E, fully covering the campaign area. The number of fire hotspots was counted each day during the campaign, with a confidence level of higher or equal to 80 % as recommended (Giglio et al., 2020). A detailed description of the fire detection algorithms is available online (https://modis-fire.umd.edu/files/MODIS_C6_C6.1_Fire_User_Guide_1.0.pdf, last access: 10 June 2023).
3.1 Overview
Figure 1 shows the time series of ship cruise route and the single-particle sampling locations during ship navigation (marked as solid triangles) and stop (marked as open squares) over the SCS during the campaign. The cruise sequences are AB→C→D→EB→D→A, with AB and EB being a non-stop cruise, otherwise the ship stopped occasionally along the arrow routes for other research tasks. Figure 2 shows the time series of the meteorological variables (i.e., solar radiation (SR), temperature, pressure, relative humidity (RH), wind direction (WD), and wind speed (WS) during the whole campaign (5 May–9 June 2021). The measurements were conducted mostly on sunny days prior to 2 June, as shown by the SR data. Subsequently, it became rainy and cloudy due to the summer monsoon in the SCS. One notable meteorological feature during the campaign was the occurrence of the summer monsoon starting from 27 May close to the site E, during which (27 May–1 June) an increase in RH (∼ 9 % from campaign-averaged 78.7 % to monsoon period-averaged 85.6%) and a slight decrease in pressure (∼ 0.2 % from 1007.4 to 1005.4 hPa) were observed. Meanwhile, the wind directions were mainly southerly during this period and later changed to southwest.
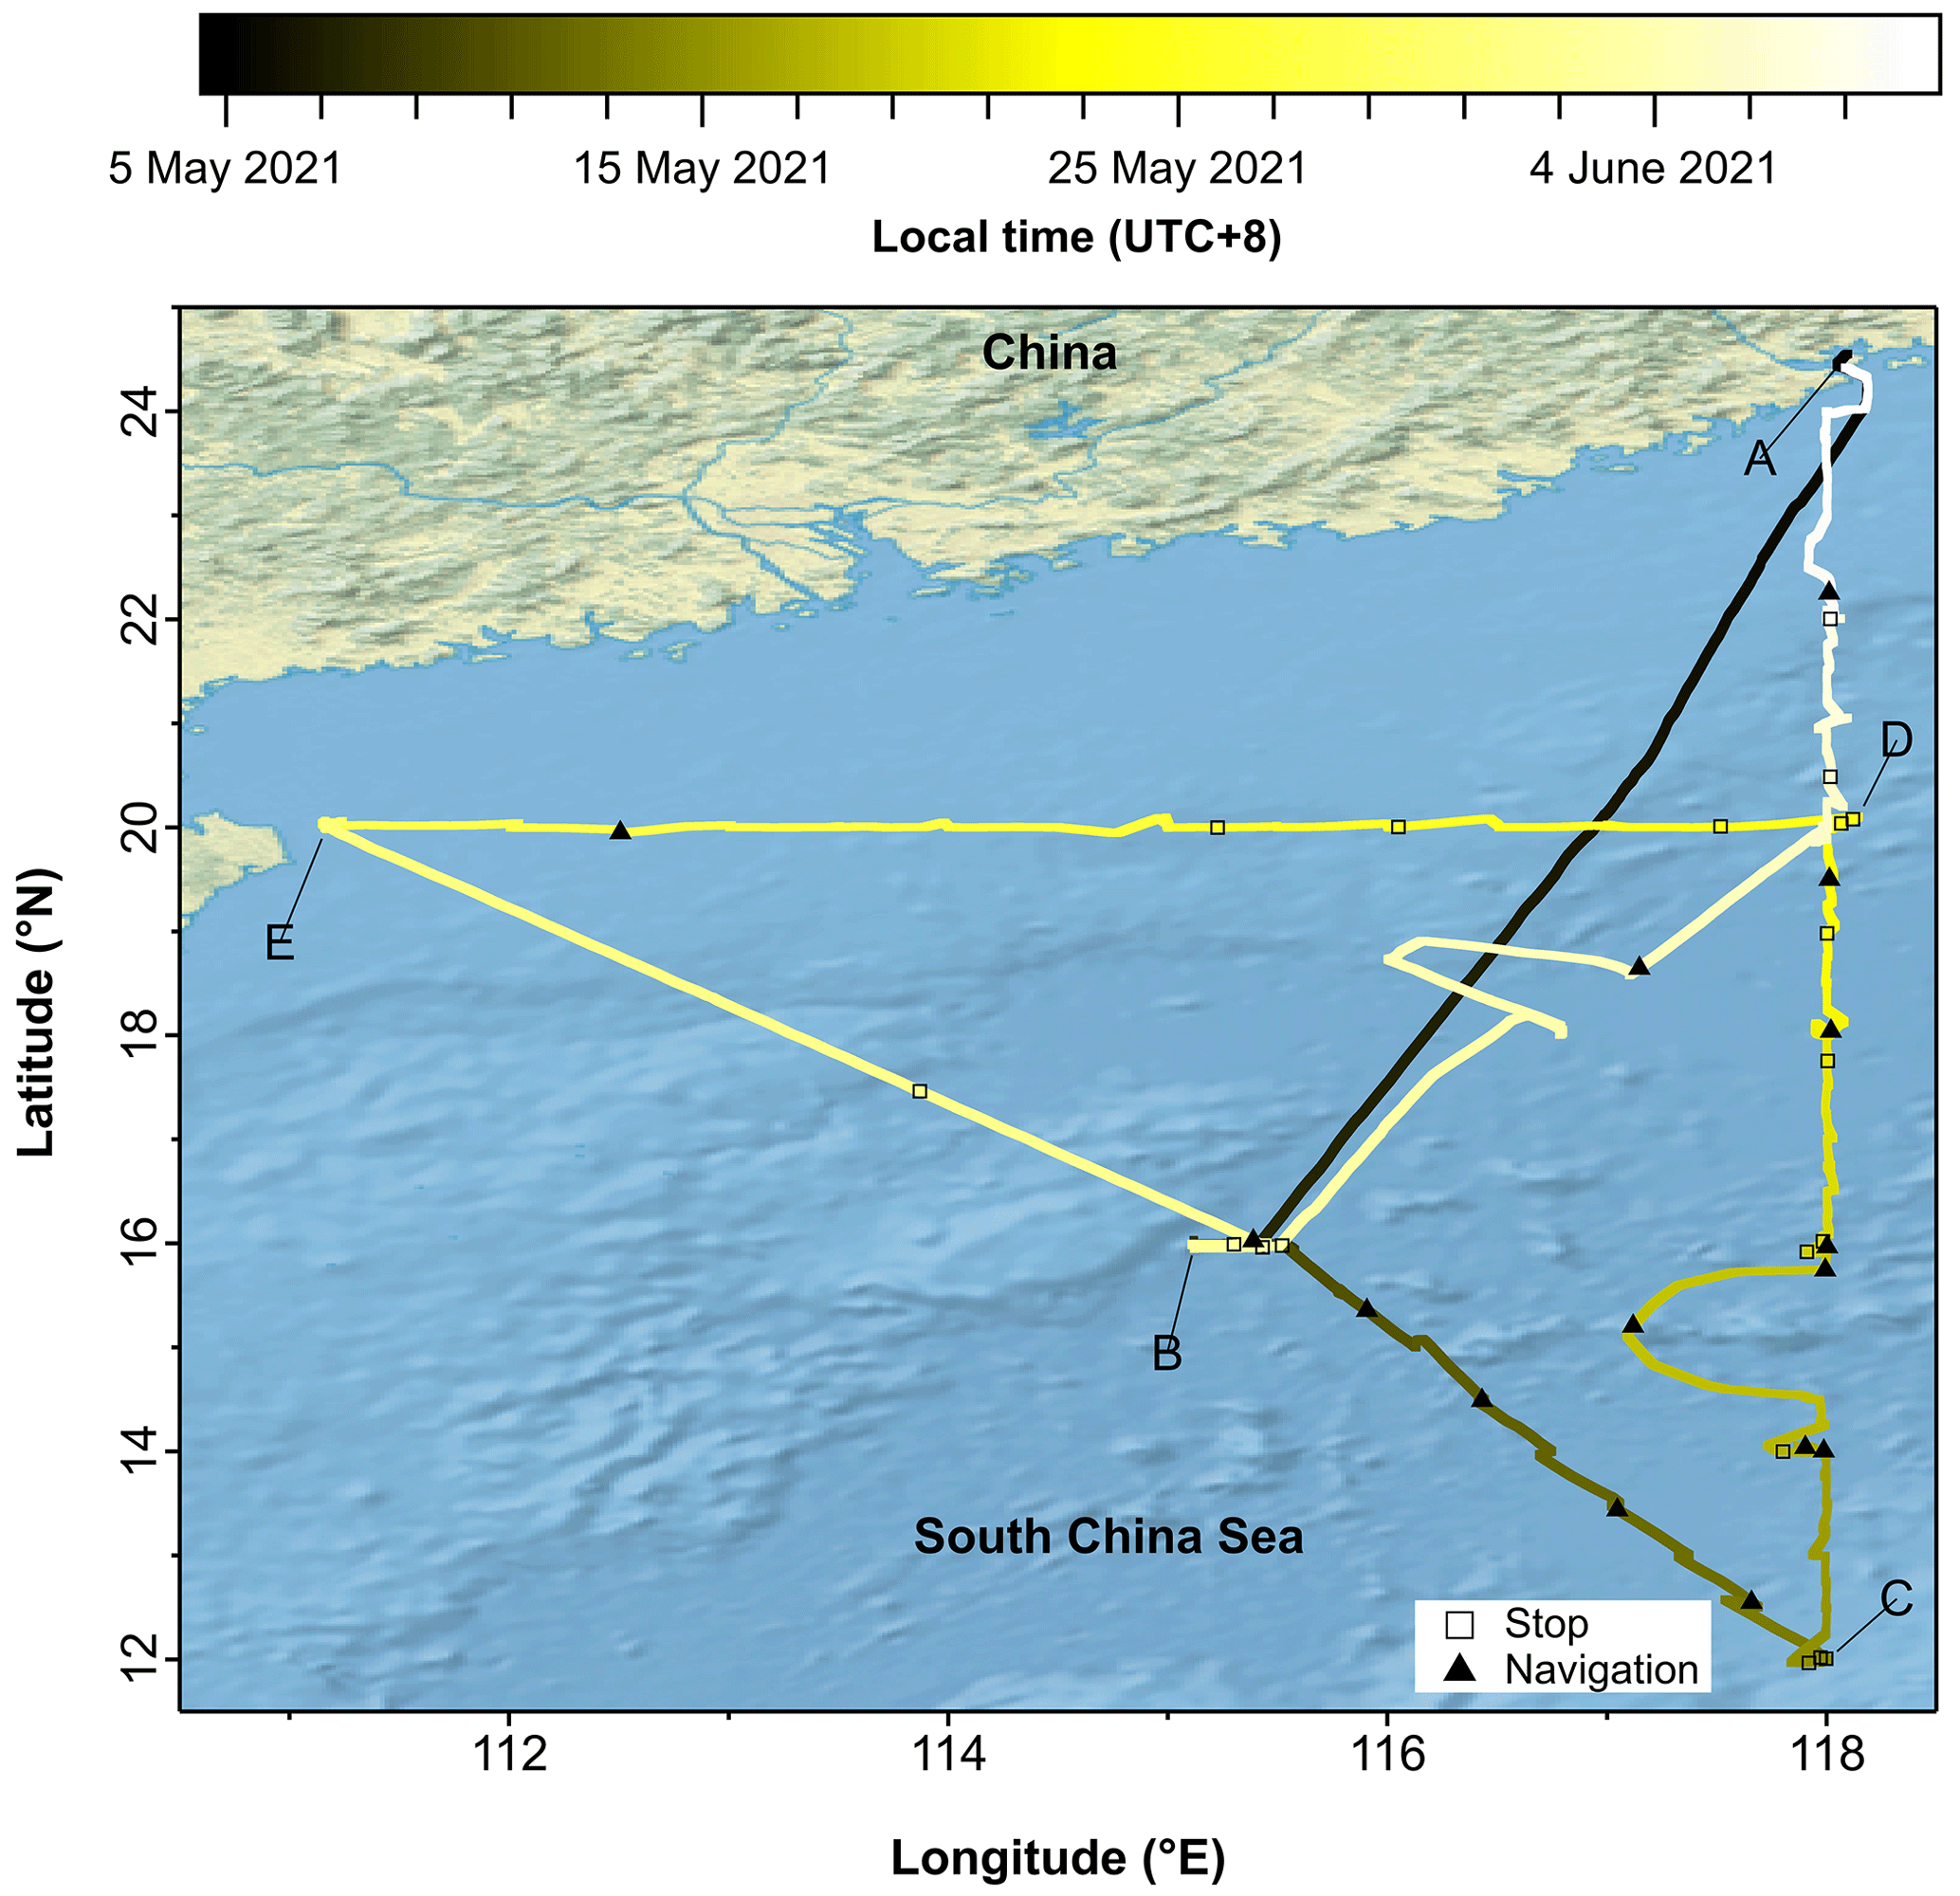
Figure 1Map of the cruise route for the campaign in the South China Sea during 5 May–9 June 2021. The ship route is dated by the intensity bar at the top. The open squares and solid triangles indicate the single-particle sampling location, collected during stop and navigation, respectively.
It should be noted that Typhoon 202103 (CHOI-WAN) traveled across B→D, resulting in a bulge in the middle of the cruise route to avoid the typhoon during 3–5 June 2021. The typhoon track is available online (http://agora.ex.nii.ac.jp/digital-typhoon/summary/wnp/s/202103.html.en, last access: 25 March 2023). The typhoon was initiated at 02:00:00 LT on 31 May and dissipated at 14:00:00 on 5 June 2021 (Fig. S5 in the Supplement). It passed over our cruise route from 3 to 5 June 2021. While no significant increase in absolute wind speed was seen in Fig. 2, a significant increase in relative wind speed was shown in Fig. S2, along with an obvious decrease in atmospheric pressure during the typhoon period (Fig. S5). The measured relative humidity increased from 27 May to 1 June, prior to the presence of the typhoon, which can be attributed to the decrease in ambient temperature during this period.
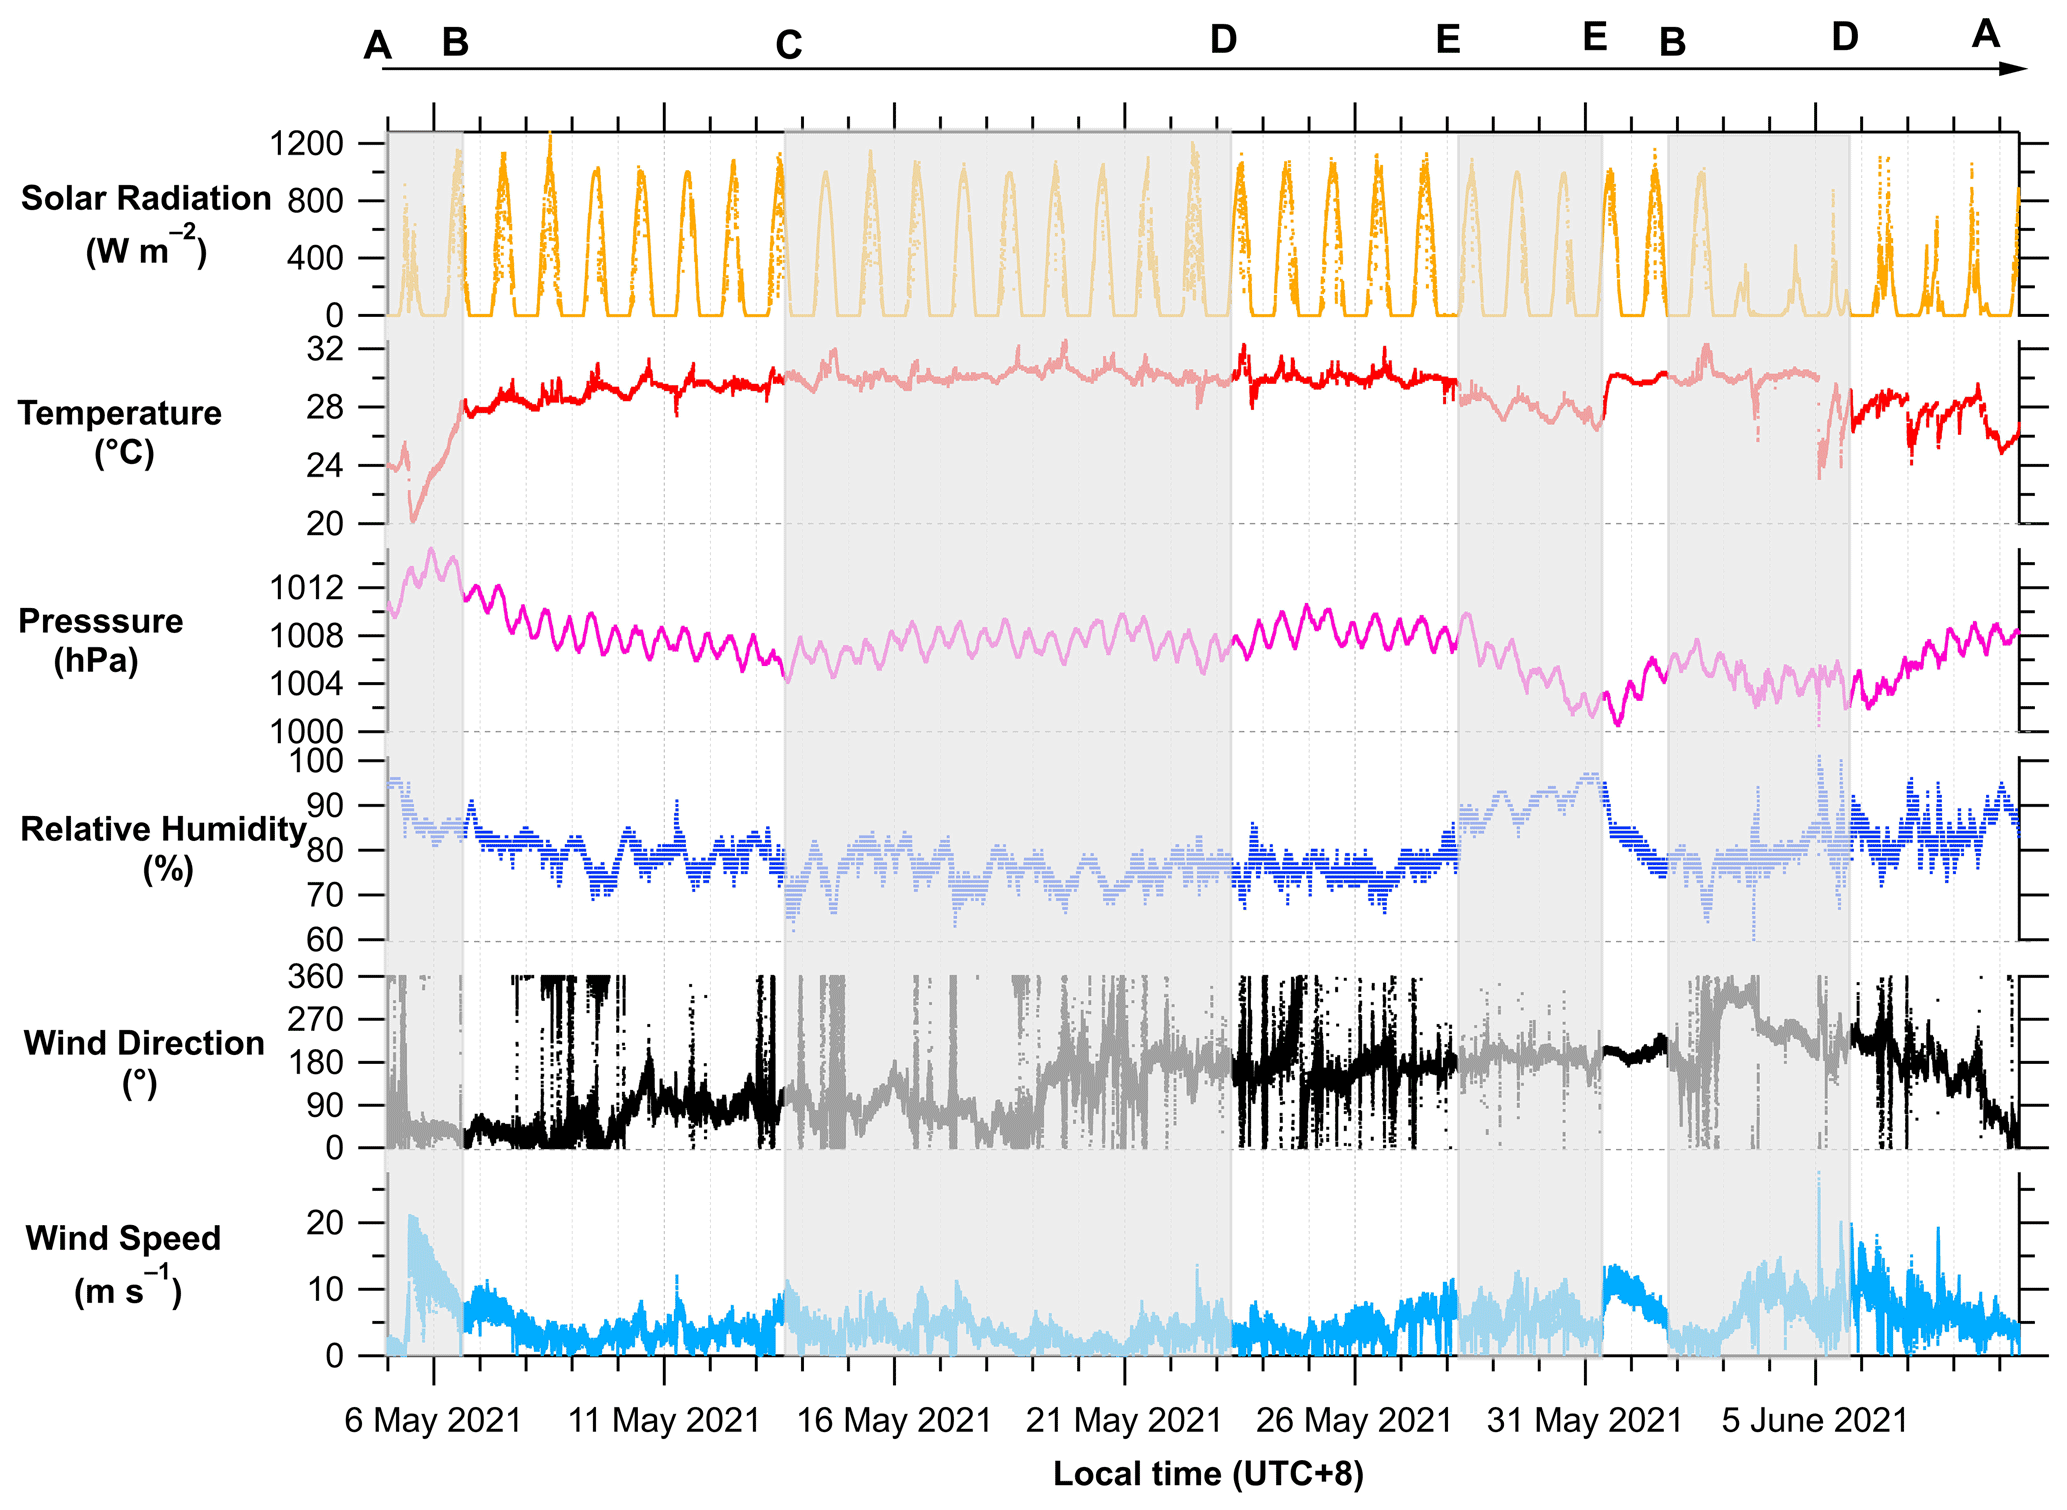
Figure 2Time series of meteorological variables of solar radiation (SR), temperature, pressure, relative humidity (RH), wind direction (WD), and wind speed (WS) during the campaign. The time resolution is 1 min for all the data except for WS and WD (3 s). All data points are shown in a dot style. The shaded and unshaded areas sequentially indicate the cruise routes from AB, B→C, C→D, D→E, E→E (ship stop), EB, B→D, and D→A, as marked in Fig. 1.
Figure 3 shows the time series of the mass concentrations of carbonaceous aerosol components in PM2.5 (i.e., BC, UVPM, OC, and EC) during the whole campaign. Frequently high spikes of the mass concentrations of carbonaceous aerosol components were observed due to the ship pollution from the research vessel. We notice that ship pollution was significantly pronounced on the first 2 d after the ship left the harbor and on the last 3–4 d before the ship returned to the harbor, during which the spikes of BC and UVPM concentrations were measured by the Magee AE33 aethalometer with a relative wind direction of 80–280°. Before 8 May and after 5 June, higher UVPM, OC, and EC concentrations were observed, which can be attributed to significant fresh ship emissions from the research vessel, as evidenced by simultaneous higher BC concentrations. Similar spikes in BC concentrations were observed during other measurement periods, either preceding or following the monsoon period, which were caused by emissions from the frequent stops and starts of the ship. Note that no significant diurnal trend for OC was observed during those aforementioned periods.
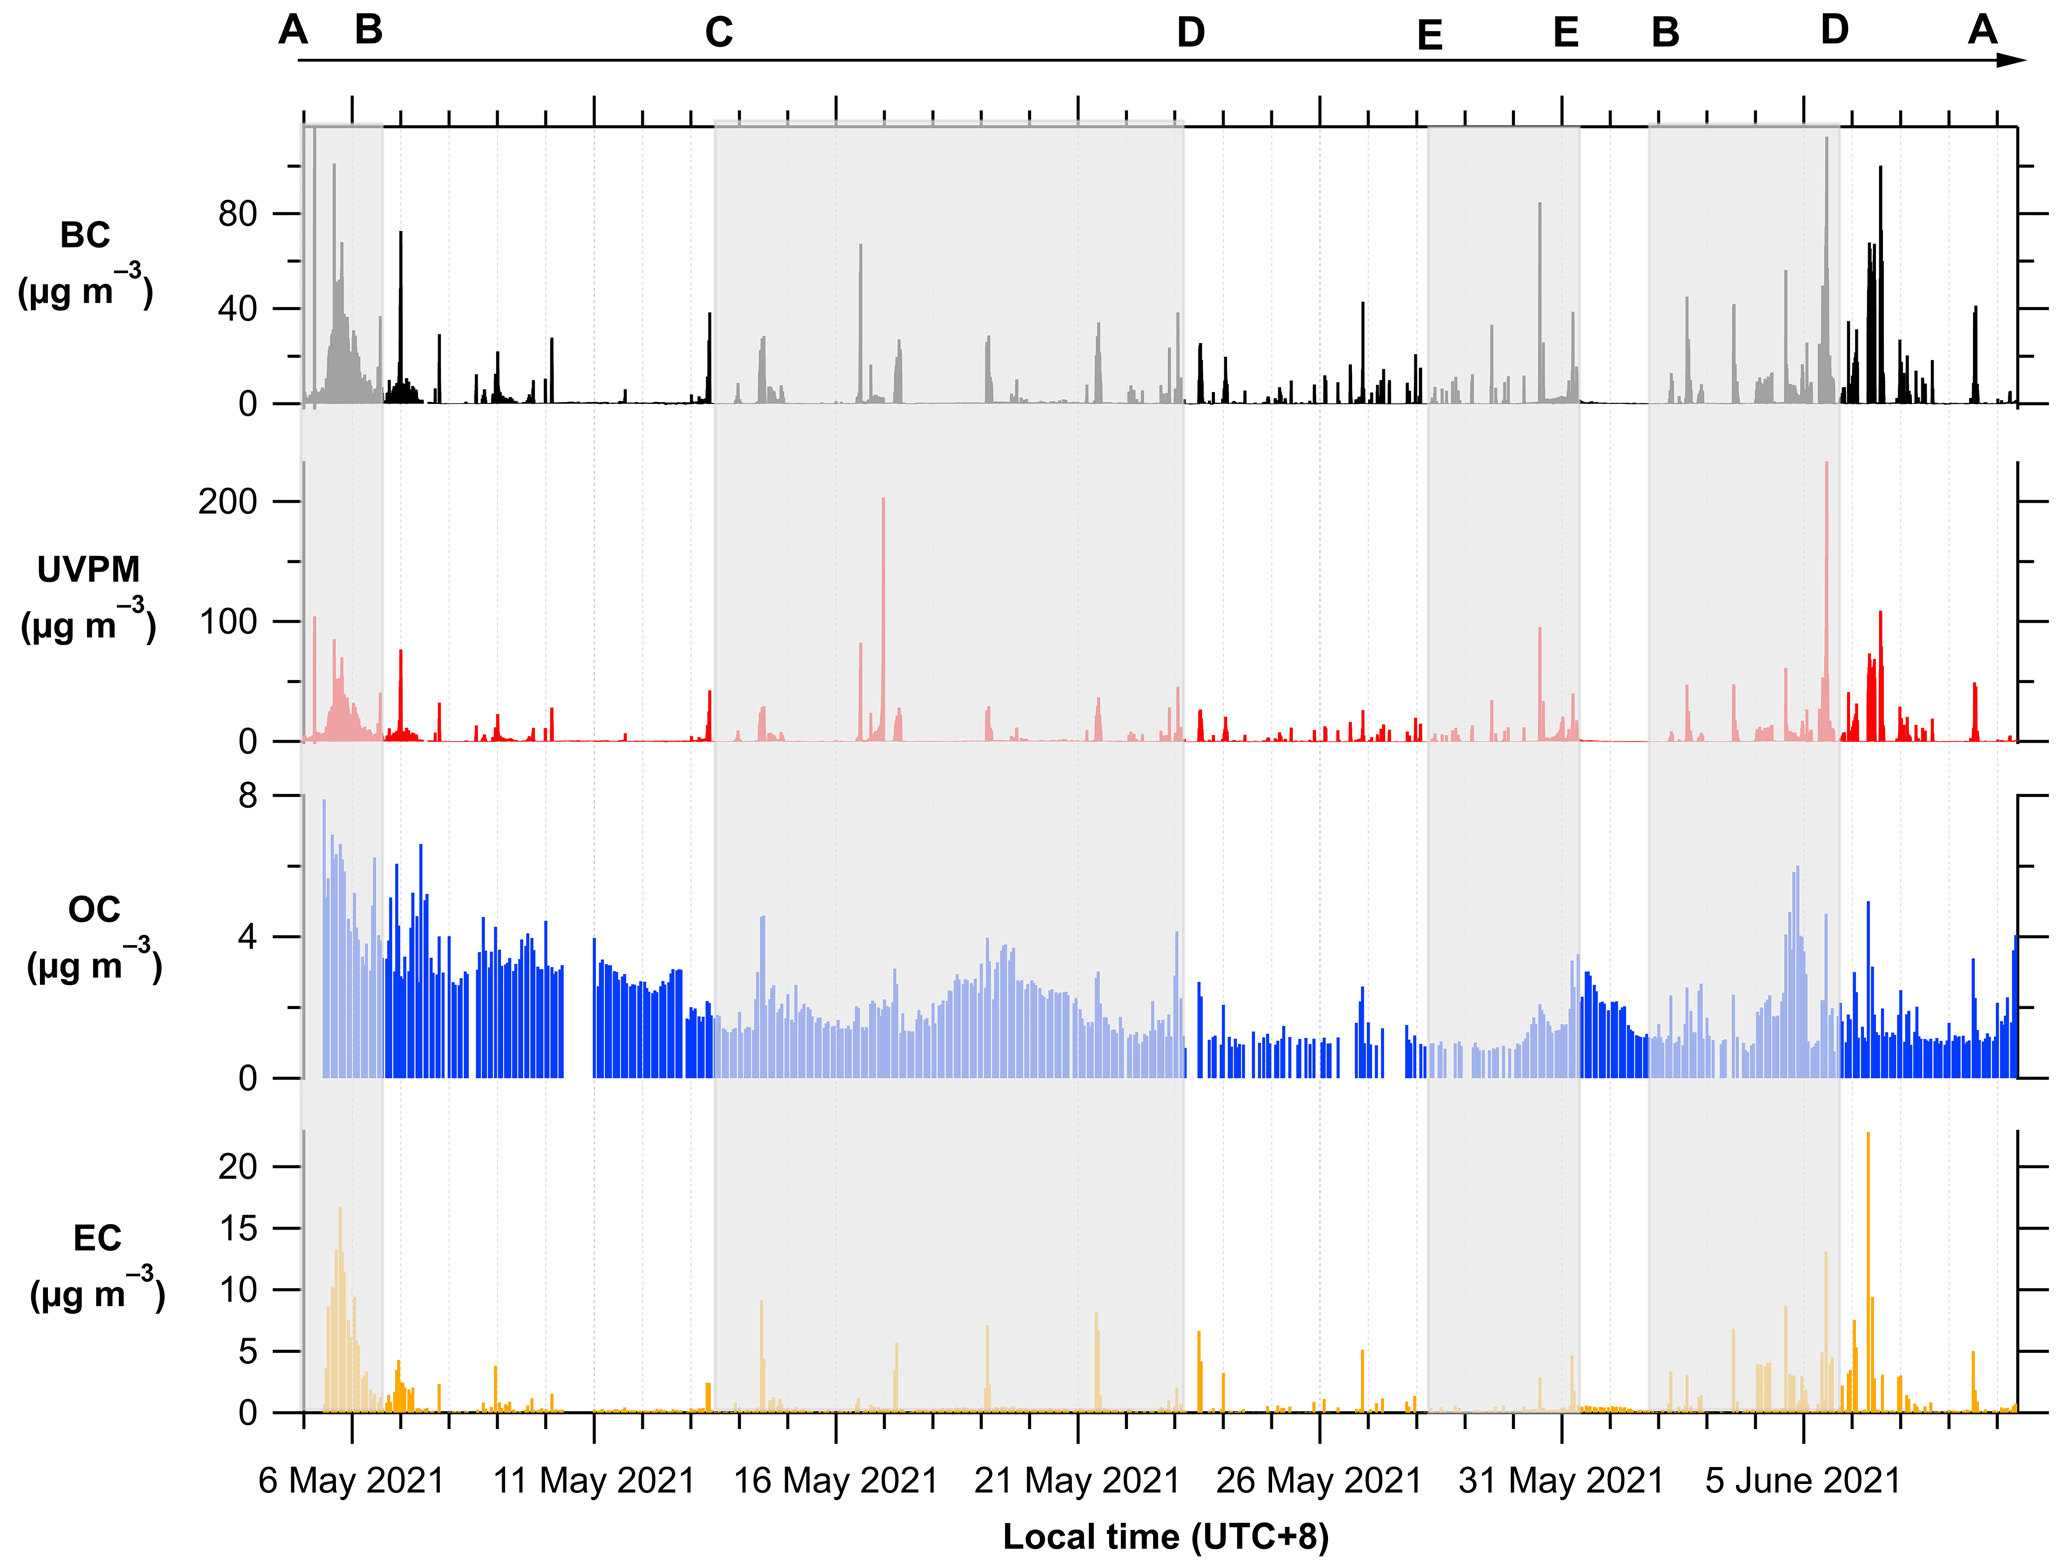
Figure 3Time series of the mass concentration of black carbon (BC), ultraviolet particle matter (UVPM), organic carbon (OC), and elemental carbon (EC) in PM2.5 during the campaign. The time resolution is 1 min for all the data except for OC and EC (1 h). All data points are shown in stick-to-zero style. The shaded and unshaded areas sequentially indicate the cruise routes from AB, B→C, C→D, D→E, E→E (ship stop), EB, B→D, and D→A, as marked in Fig. 1.
Figure 4 shows the time series of fire spot distribution and the 72 h backward trajectories at three levels aboveground (100, 500, and 1000 m) over the SCS during the campaign. Only a few backward trajectories are shown to avoid massive overlapping. Several fire spots located in the sea were attributed to oil or natural gas drilling processes which generate thermal energy, combustion, and exhaust. Such processes included the prevalent hydrocarbon exploration and production activities in this region. A comprehensive cartographic representation of these endeavors within the SCS can be accessed via the online platforms (https://amti.csis.org/south-china-sea-energy-exploration-and-development/, last access: 31 March 2023). Note that since the ship moved along the cruise route, the air mass backward trajectories also changed with the movement of the ship. For example, significant biomass burning was detected in Laos, northern Vietnam, and the Philippines during 15–24 May, as indicated by the corresponding fire spots. However, the back trajectories to the sampling route (C→D) during this period were mainly from the Philippines.
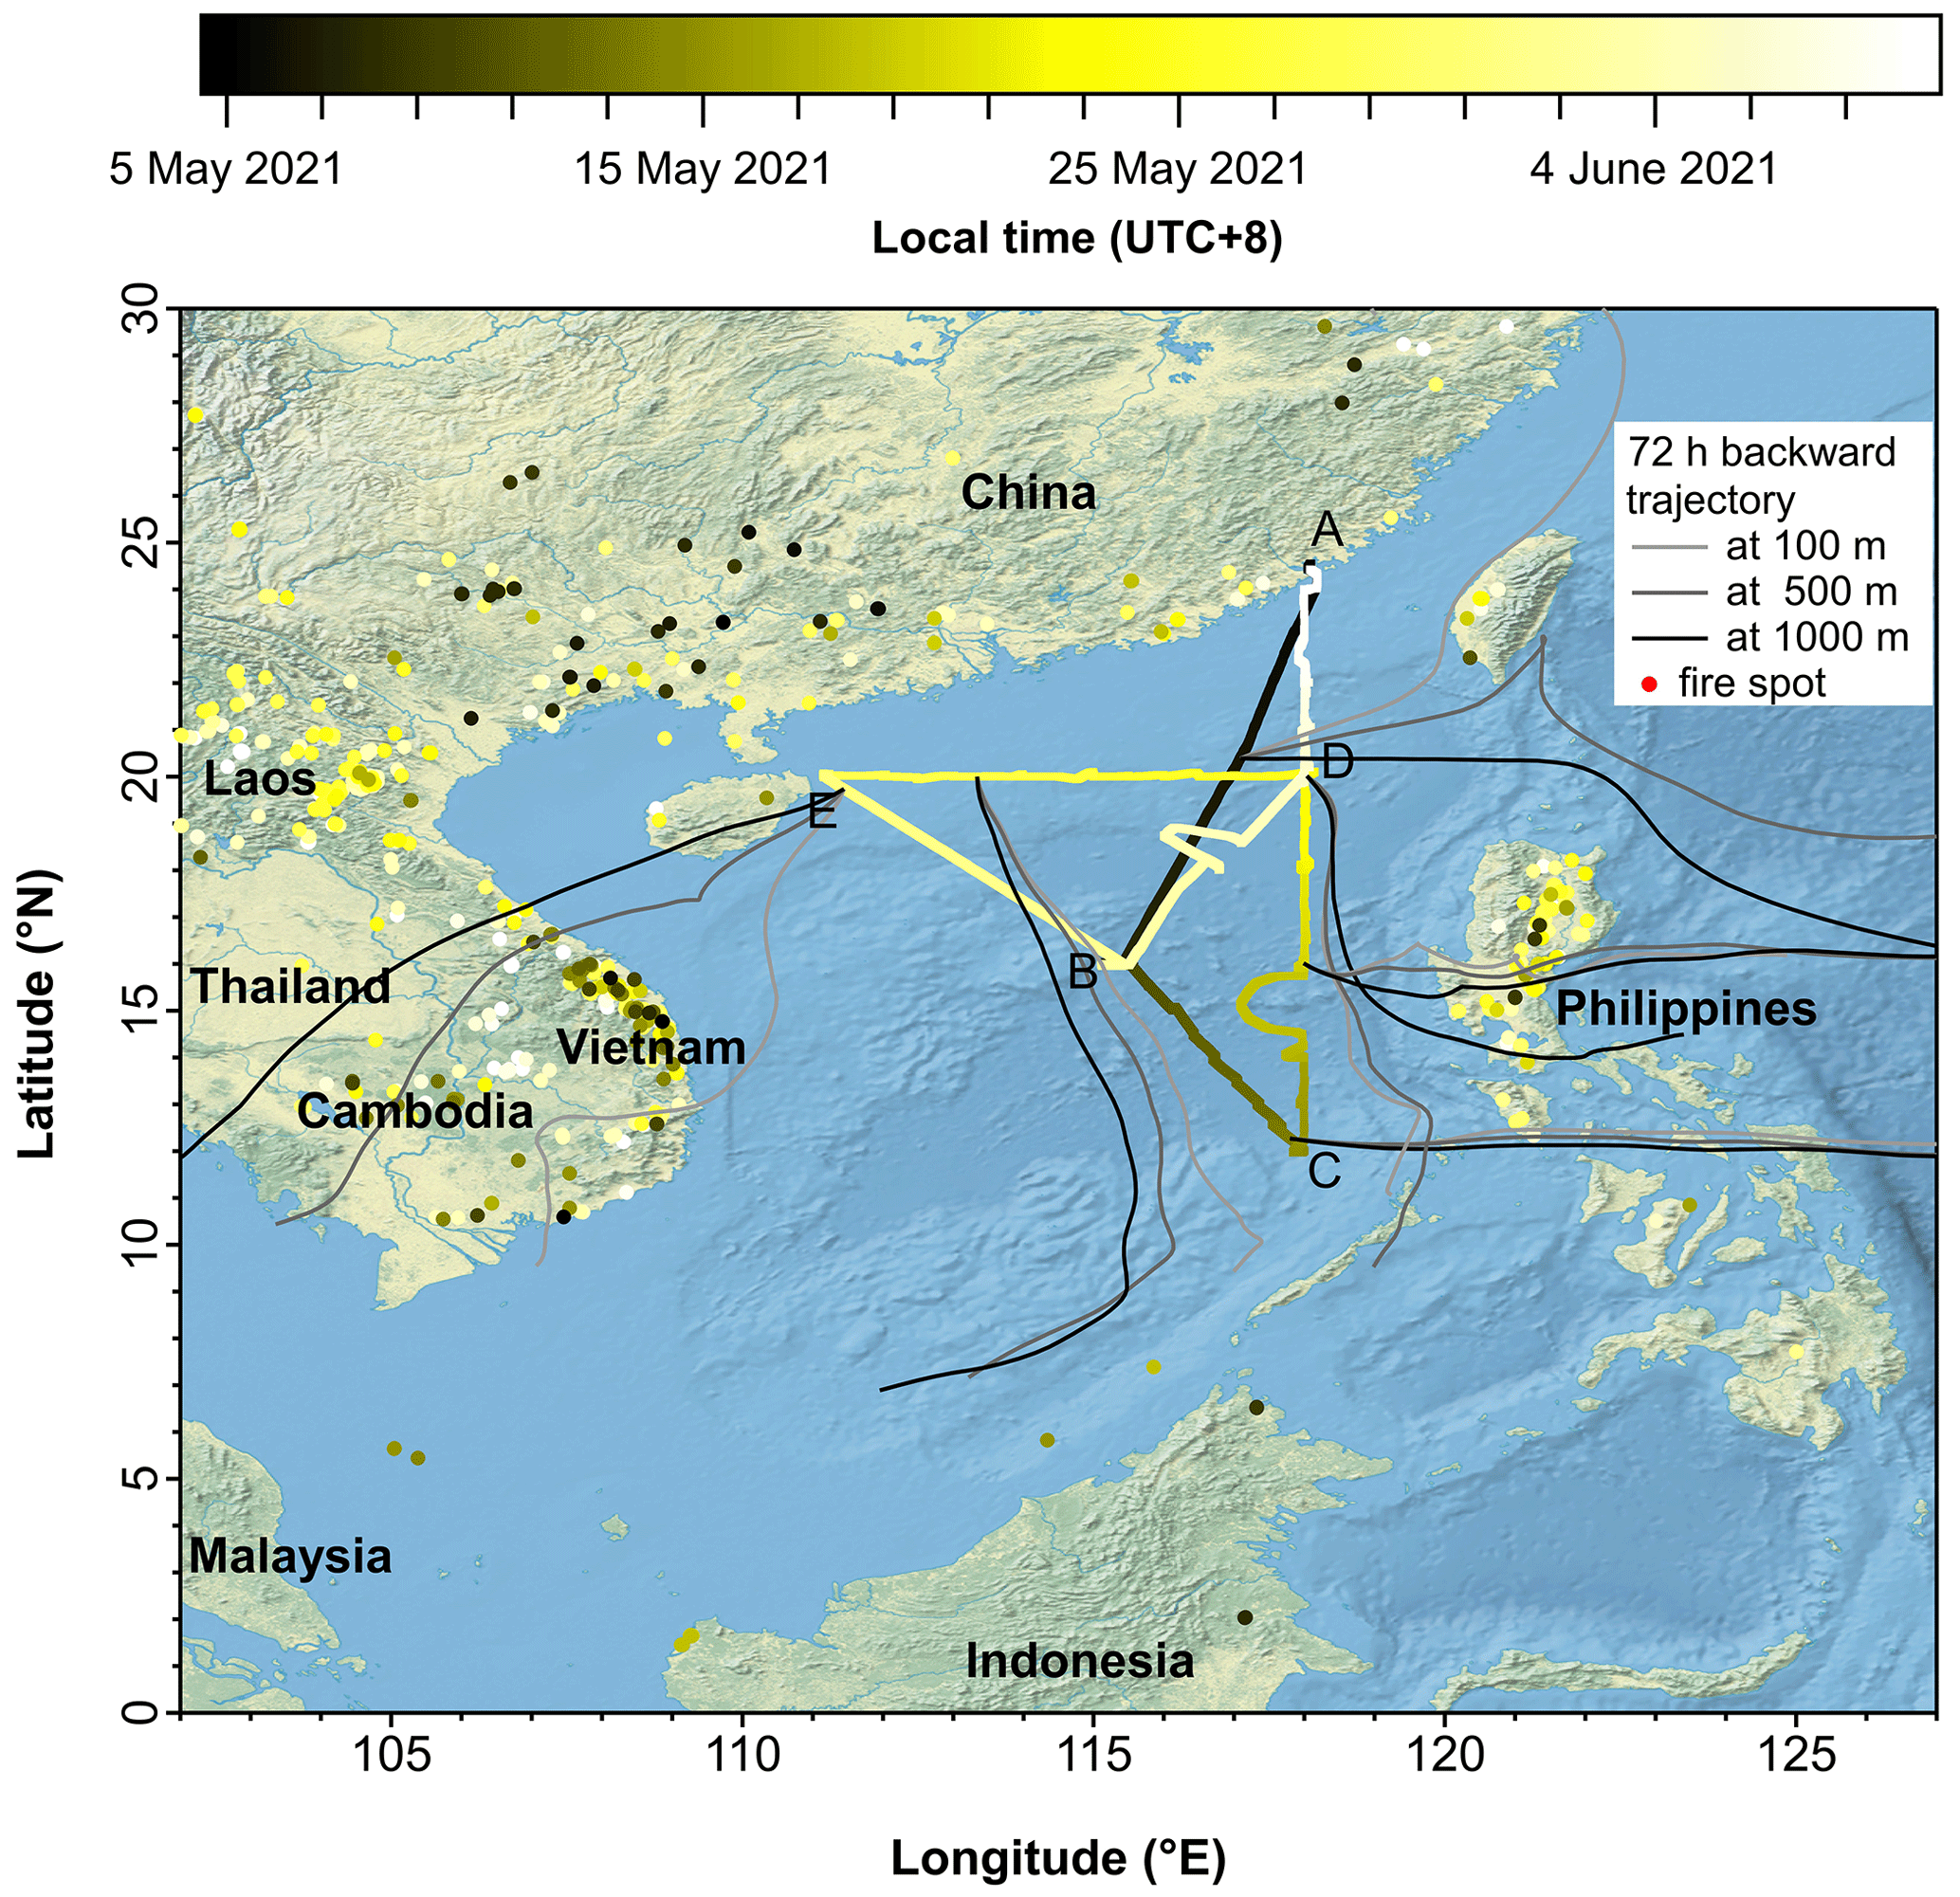
Figure 4Time series of the fire spot distribution and the 72 h backward trajectories over the South China Sea (SCS) during the campaign. The solid circles were dated by the intensity bar at the top, representing the detected fire spots using the MODIS satellite with a confidence threshold of > 80 %. The light-grey, grey, and black 72 h backward trajectories were obtained at AGL heights of 100, 500, and 1000 m using the HYSPLIT model.
Here, we classified the campaign period into several groups based on the cruise route, change of wind direction during monsoon, backward trajectories, and ship pollution, as listed in Table 1: (1) BMP-1 (before-monsoon period 1), AB route mainly with northeast wind direction during 5–9 May; (2) BMP-2, B→C→D route close to the Philippines primarily with southeast wind direction during 10–22 May; (3) BMP-3, D→E close to mainland China with the same wind direction as BMP-2 during 23–26 May; (4) TMP (transition monsoon period), EB route with south wind direction during 27 May–1 June; (5) AMP (after-monsoon period), B→D→A route with southwest wind direction during 2–9 June; and (6) SPP (ship pollution period), ∼ 35 % of the online measurement data could be attributed to this category in this study due to the interference from the research vessel own emissions.
Table 1Classification of the campaign period during 5 May–9 June 2021. N/A indicates that the monsoon period has not been classified.
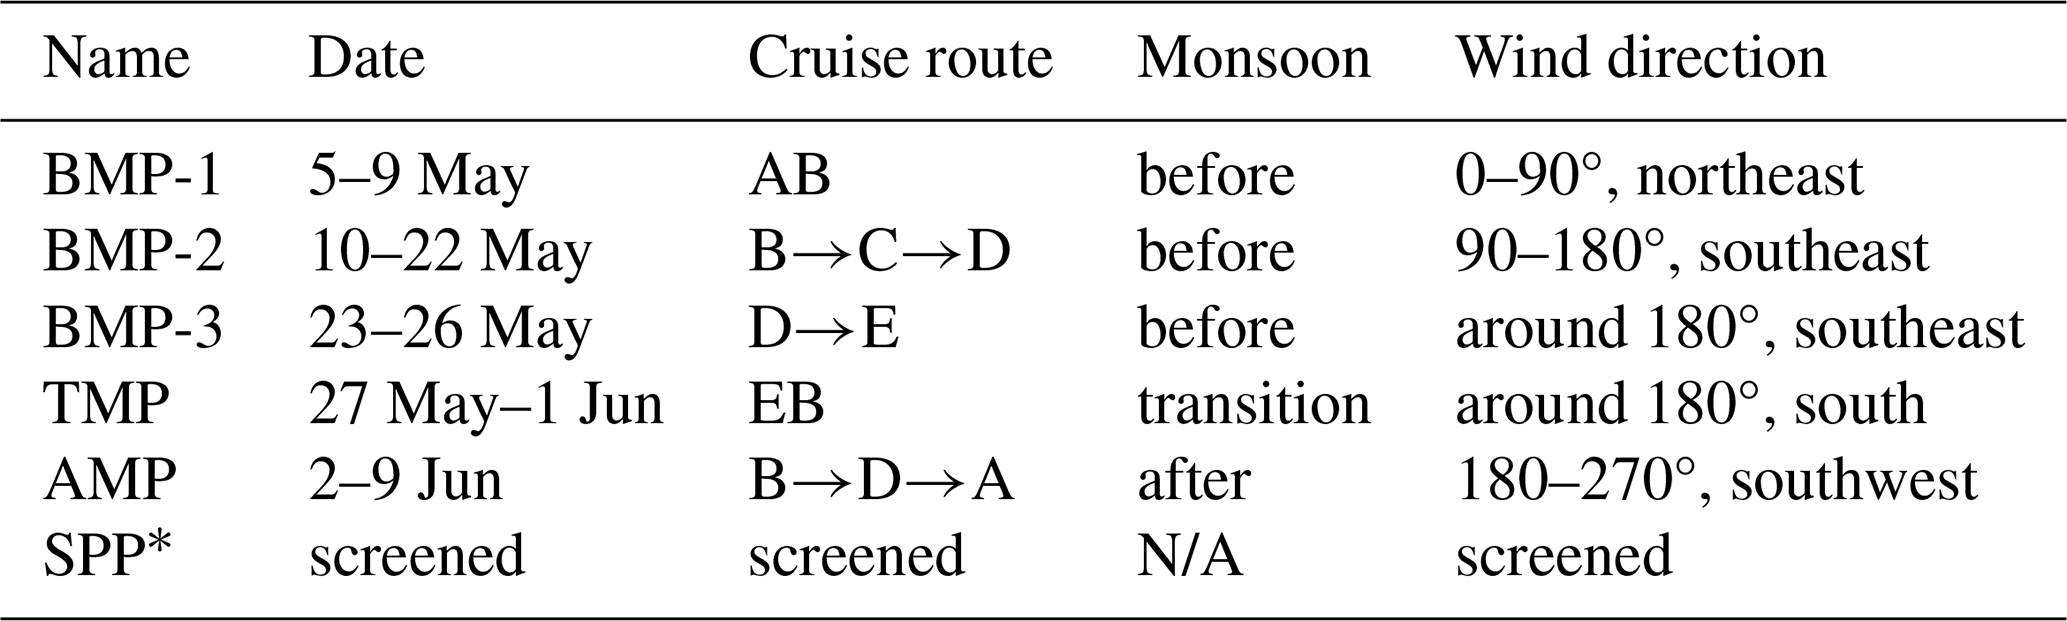
∗ Ship pollution period is screened based on BC concentration and relative wind direction as mentioned in Sect. 2.
3.2 Single-particle analysis of BC and tar balls
Particle size distribution and composition and size-dependent BC fractals were investigated based on TEM images. The Feret diameter is commonly used in microscopy for particle size analysis (Zefirov et al., 2018). The size distribution of all the single particles from the analyzed TEM images is depicted in Fig. 5. The distribution is represented with histograms starting at 50 nm, a width interval of 20 nm, and a bin number of 200. The choice of bin width may vary depending on cases, but it is close to the quotient value of the square root of the measured particle number divided by the overall width of the distribution (Pabst and Gregorova, 2007). Moreover, lognormal fitting is used for the peak size identification of particle size distribution (Rice et al., 2013). Figure 5a shows a fitted peak Feret diameter of 307 nm for a total of 6613 particles from 15 samples during navigation, while a fitted peak Feret diameter of 325 nm was obtained for a total of 9011 particles from 19 samples during stop (Fig. 5b). Note that we could not successfully obtain a bimodal or multi-peak fit for the data of the stop cases using multi-peak fitting function in the Igor Pro software, as shown in Fig. S6. Hence, we believe that single peak fitting best described the distribution in our stop cases, as illustrated in Fig. 5. Particles collected during navigation were predominantly aged at high wind speeds, while particles during stop were mixed significantly with freshly emitted particles from the ship's own exhaust and from other merchant ships or those from long-range transport, possibly leading to the variation of the size distribution. Although the bimodal distribution was observed from particles in the indoor air, which was likely caused by fresh emissions and secondary formation (Pipal et al., 2021), we did not obtain significant bimodal peaks for both navigation and stop particles.
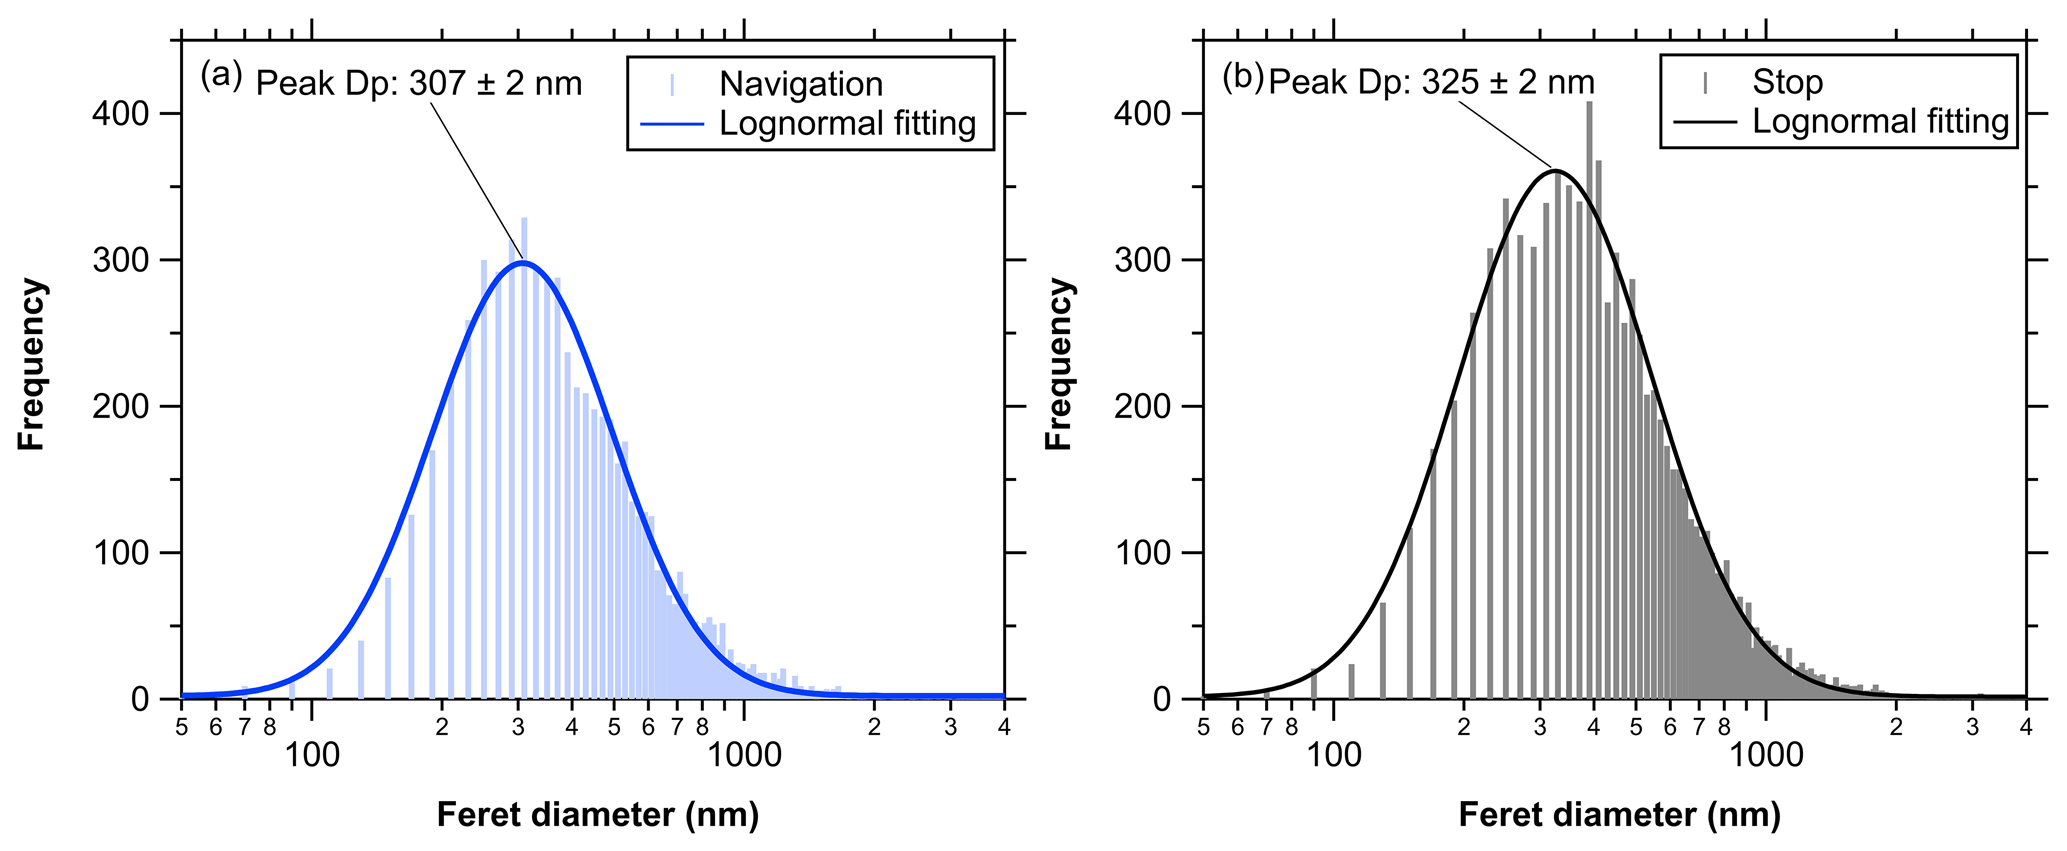
Figure 5Lognormal fitting of particle size distribution using Feret diameter determined from the TEM images with the ImageJ analysis during navigation (a) and stop (b). The histograms are set with a bin starting at 50 nm, a bin width of 20 nm, and a total bin number of 200.
We obtained characteristic values for the particle shape descriptors such as circularity (0.7±0.2) and aspect ratio (1.2±0.3) for all the particles collected during navigation and stop, implying that these particles are not perfectly spherical and may vary in their mixing states. Figure 6 (top images) shows a comparison of the mixing states during navigation (a–c) and stop (d–f) from typical BC TEM images. The BC particles collected during navigation are in the embedded (a), external (b), or core–shell (c) mixing states classified with the methods which are based on single-particle analysis of island and mountain samples across the East China Sea and Japan (Adachi et al., 2014; C. Sun et al., 2020). More TEM images for the heavily coated internal and external BC particles from navigation can be found in the Supplement (Sect. 7, Fig. S7). The EDS analysis showed that the single particles during navigation were predominantly composed of carbon (C), oxygen (O), sulfur (S), potassium (K), sodium (Na), chloride (Cl), magnesium (Mg), and calcium (Ca) (Fig. S8), indicating that those BC particles were coated with sulfate, sea salt, and organics. Furthermore, small externally mixed BC particles can be transported over the sea and easily coated during long-range transport. Under the TEM electron beam, these coated volatile components were easily vaporized to expose the BC fractal frame (Fig. S7d–f).
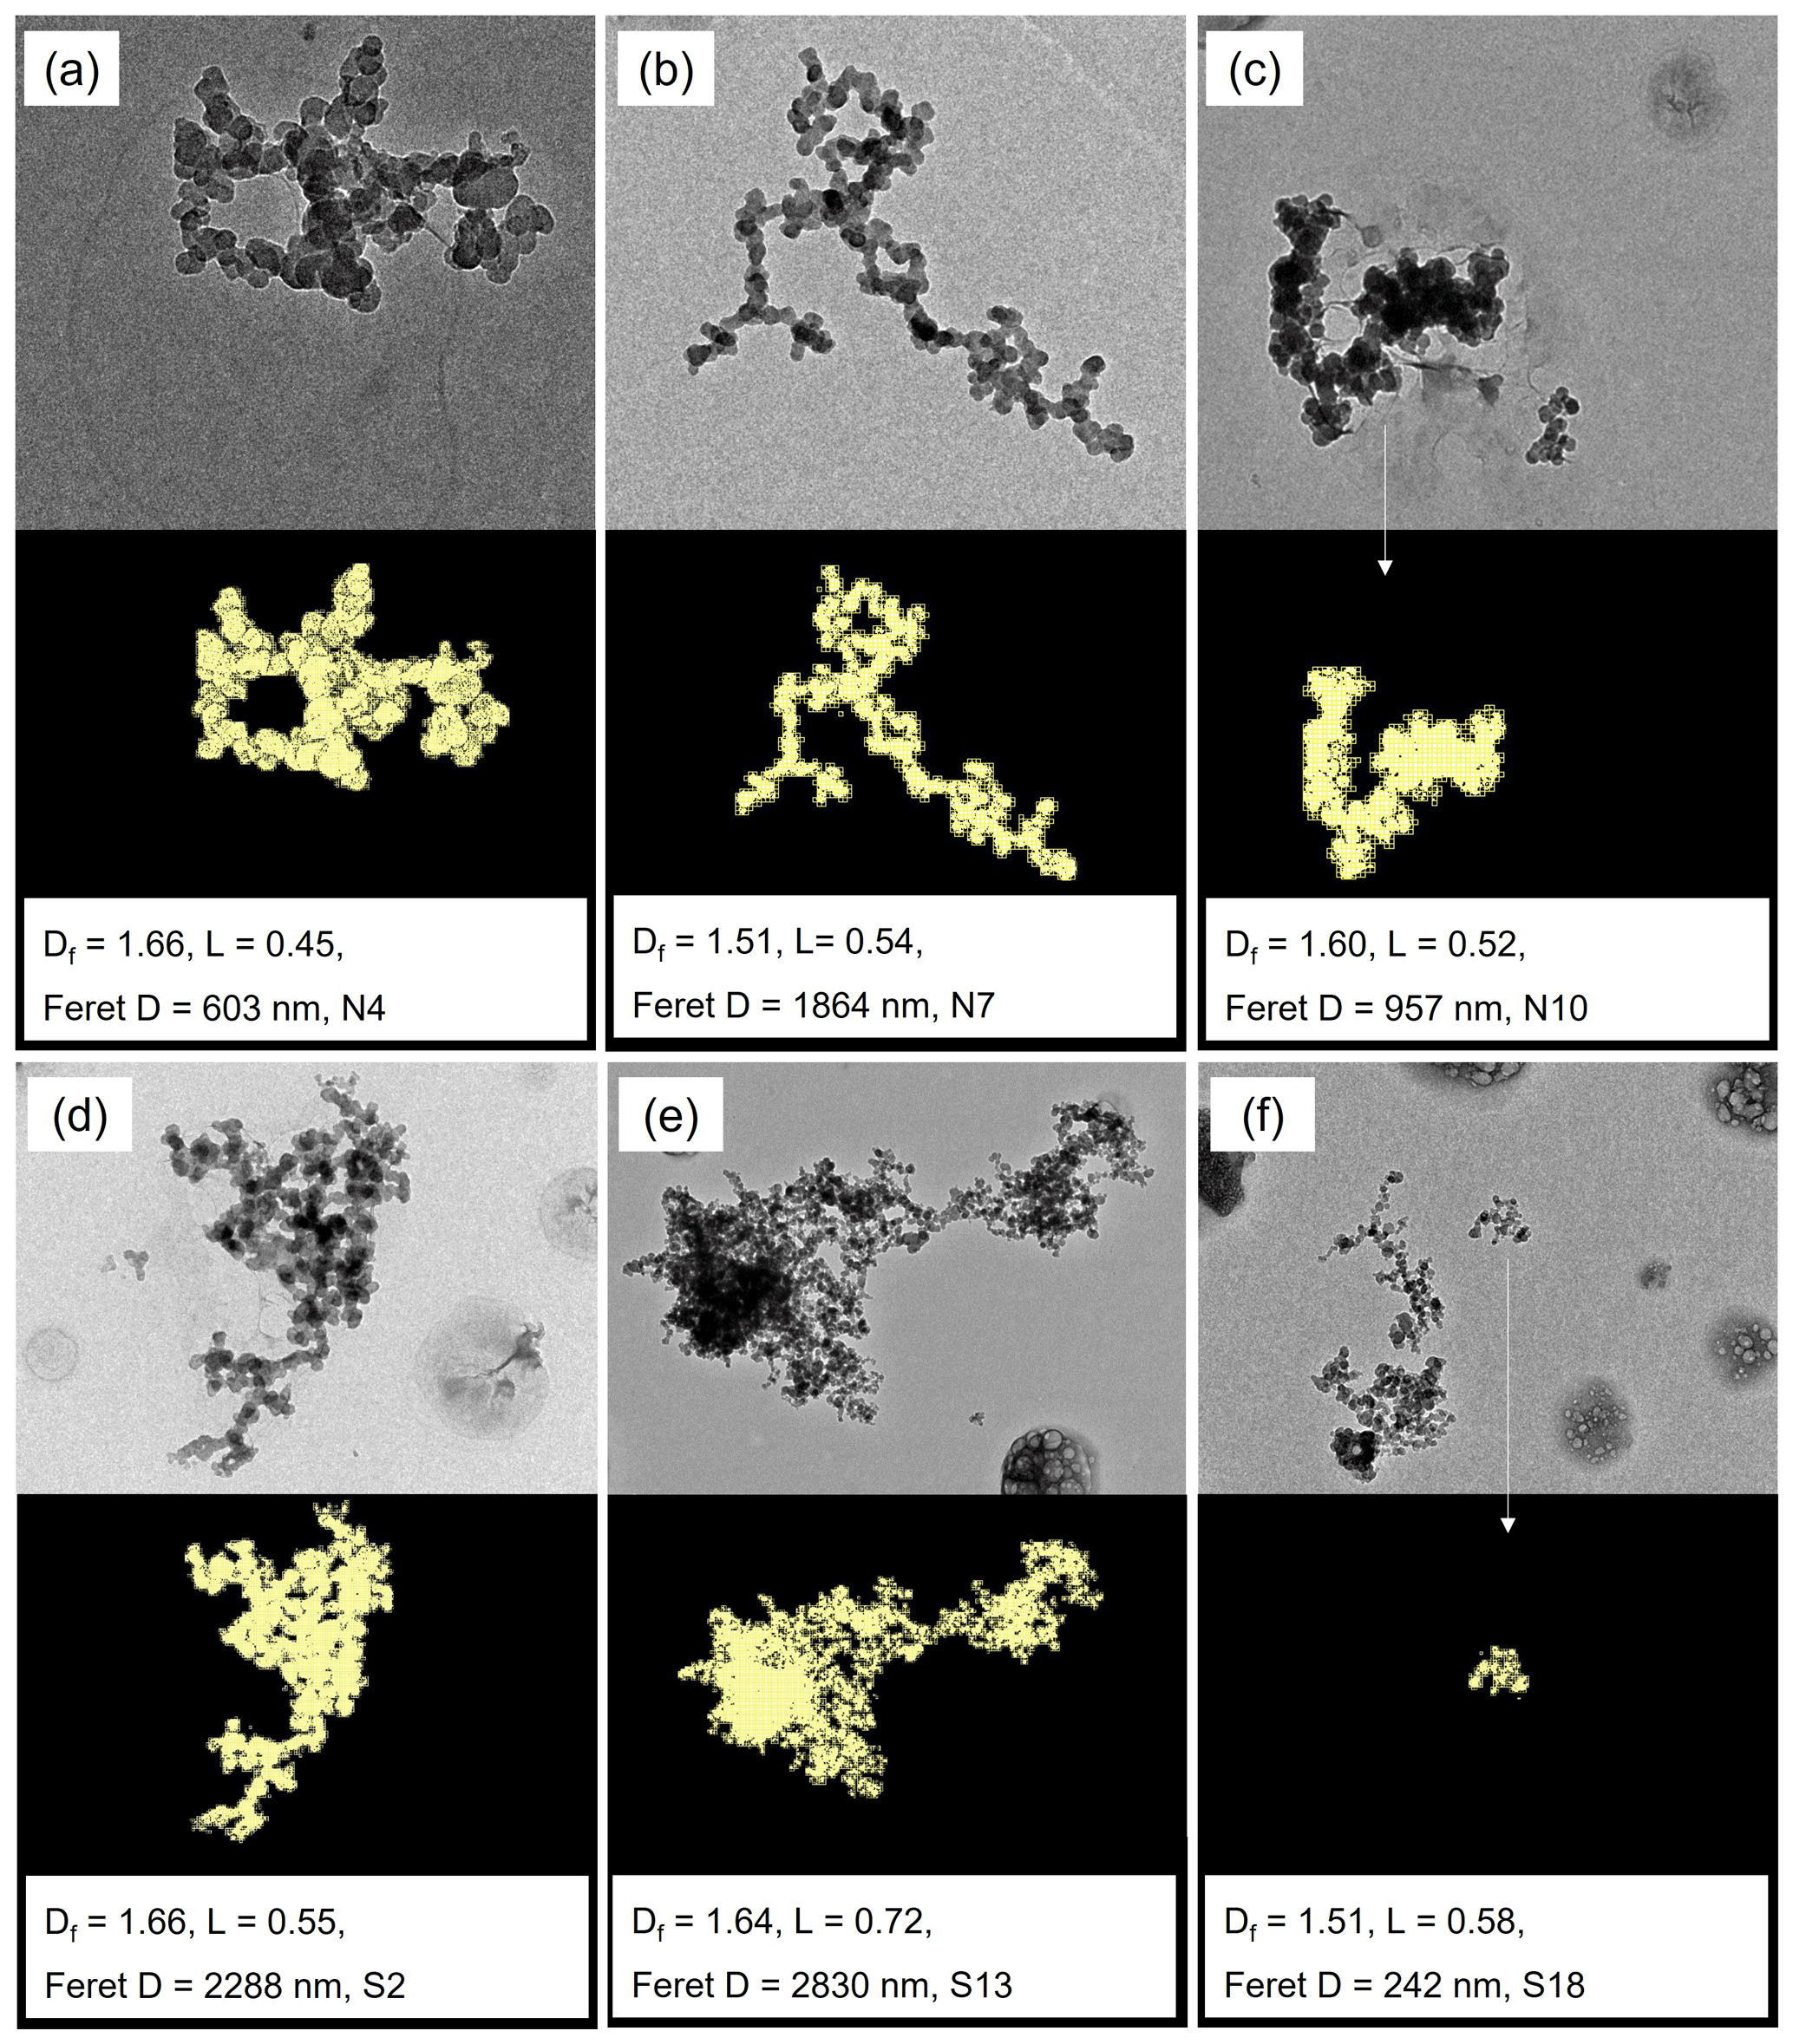
Figure 6Examples of the BC TEM images and their corresponding Feret diameter (D), fractal dimension (Df), and lacunarity (L) based on the box counting method from the fractal analysis: (a)–(c) BC particles collected during navigation and (d)–(f) during stop. More sampling information can be found in Table S1 of the Supplement (serial numbers N4, N7, N10, S2, S13, S18, etc.).
Comparatively, a mixture of aged BC particles and much larger fresh BC particles, as well as smaller scattered BC particles during stop, was found (Fig. 6d–f), likely emitted from other ships (Fig. 6d) and the research vessel (e, f). These TEM images showed that the compressed BC particles are typically more aged and atmospherically processed, while the fractal BC particles are fresh. Moreover, EDS analysis showed that sulfate formed from aqueous processes and less viscous organic coating indicate an aging process. Those BC particles with Feret diameters larger than 2 µm during stop were fractal aggregates which could unlikely survive due to deposition during long-range transport. In addition, heavily coated internal BC particles were found during stop due to the mixing between ship pollution and the marine air (Fig. S9). Moreover, such particles could also be condensation of organics during the cooling process after they were emitted from the ship engine. The bottom panels of Fig. 6a–f show the corresponding images obtained by box counting in fractal analysis with the resultant Df, Feret diameter (D), lacunarity (L), and sampling number underneath for each TEM sample image. Figure 7 shows Df and L as a function of D for some representative BC particles during both navigation and stop. The BC particles showed narrower Feret diameters (229–2557 nm) during navigation than those (78–2926 nm) of BC from the ship's own emissions during stop. The Df values during navigation were in a range of 1.28–1.77 with a median of 1.61, while the Df values during stop were 1.43–1.76 with a median of 1.61, indicating no significant differences of Df for the exposed BC particles during navigation and stop. Note that the particles in Fig. 7 include pure BC and BC without thick coatings. These particles were exposed to the electron beam, and volatile coatings were removed so that the morphology of BC was clearly shown regardless of the mixing state of the original BC particles (Fig. S7). Most BC particles were below 1 µm in Feret diameter during navigation (Fig. 7), while their sizes cover a wide range below 3 µm during stop, implying that the aged BC particles become smaller after long-range transport. Despite only a total of 134 BC data points shown in Fig. 7, the results are still statistically meaningful due to the wide range of BC sizes covered in our analysis. Note that the size change of a BC particle cannot be determined because the original size of the particle is unknown before the removal of the coatings. Comparatively, the lacunarities during navigation (0.34–0.82, median: 0.53) and stop (0.34–0.92, median: 0.59) were slightly different, with the former being smaller than the latter, indicating that the lacunarity tended to become smaller (∼ 10 %) after coating or aging of the BC particles.
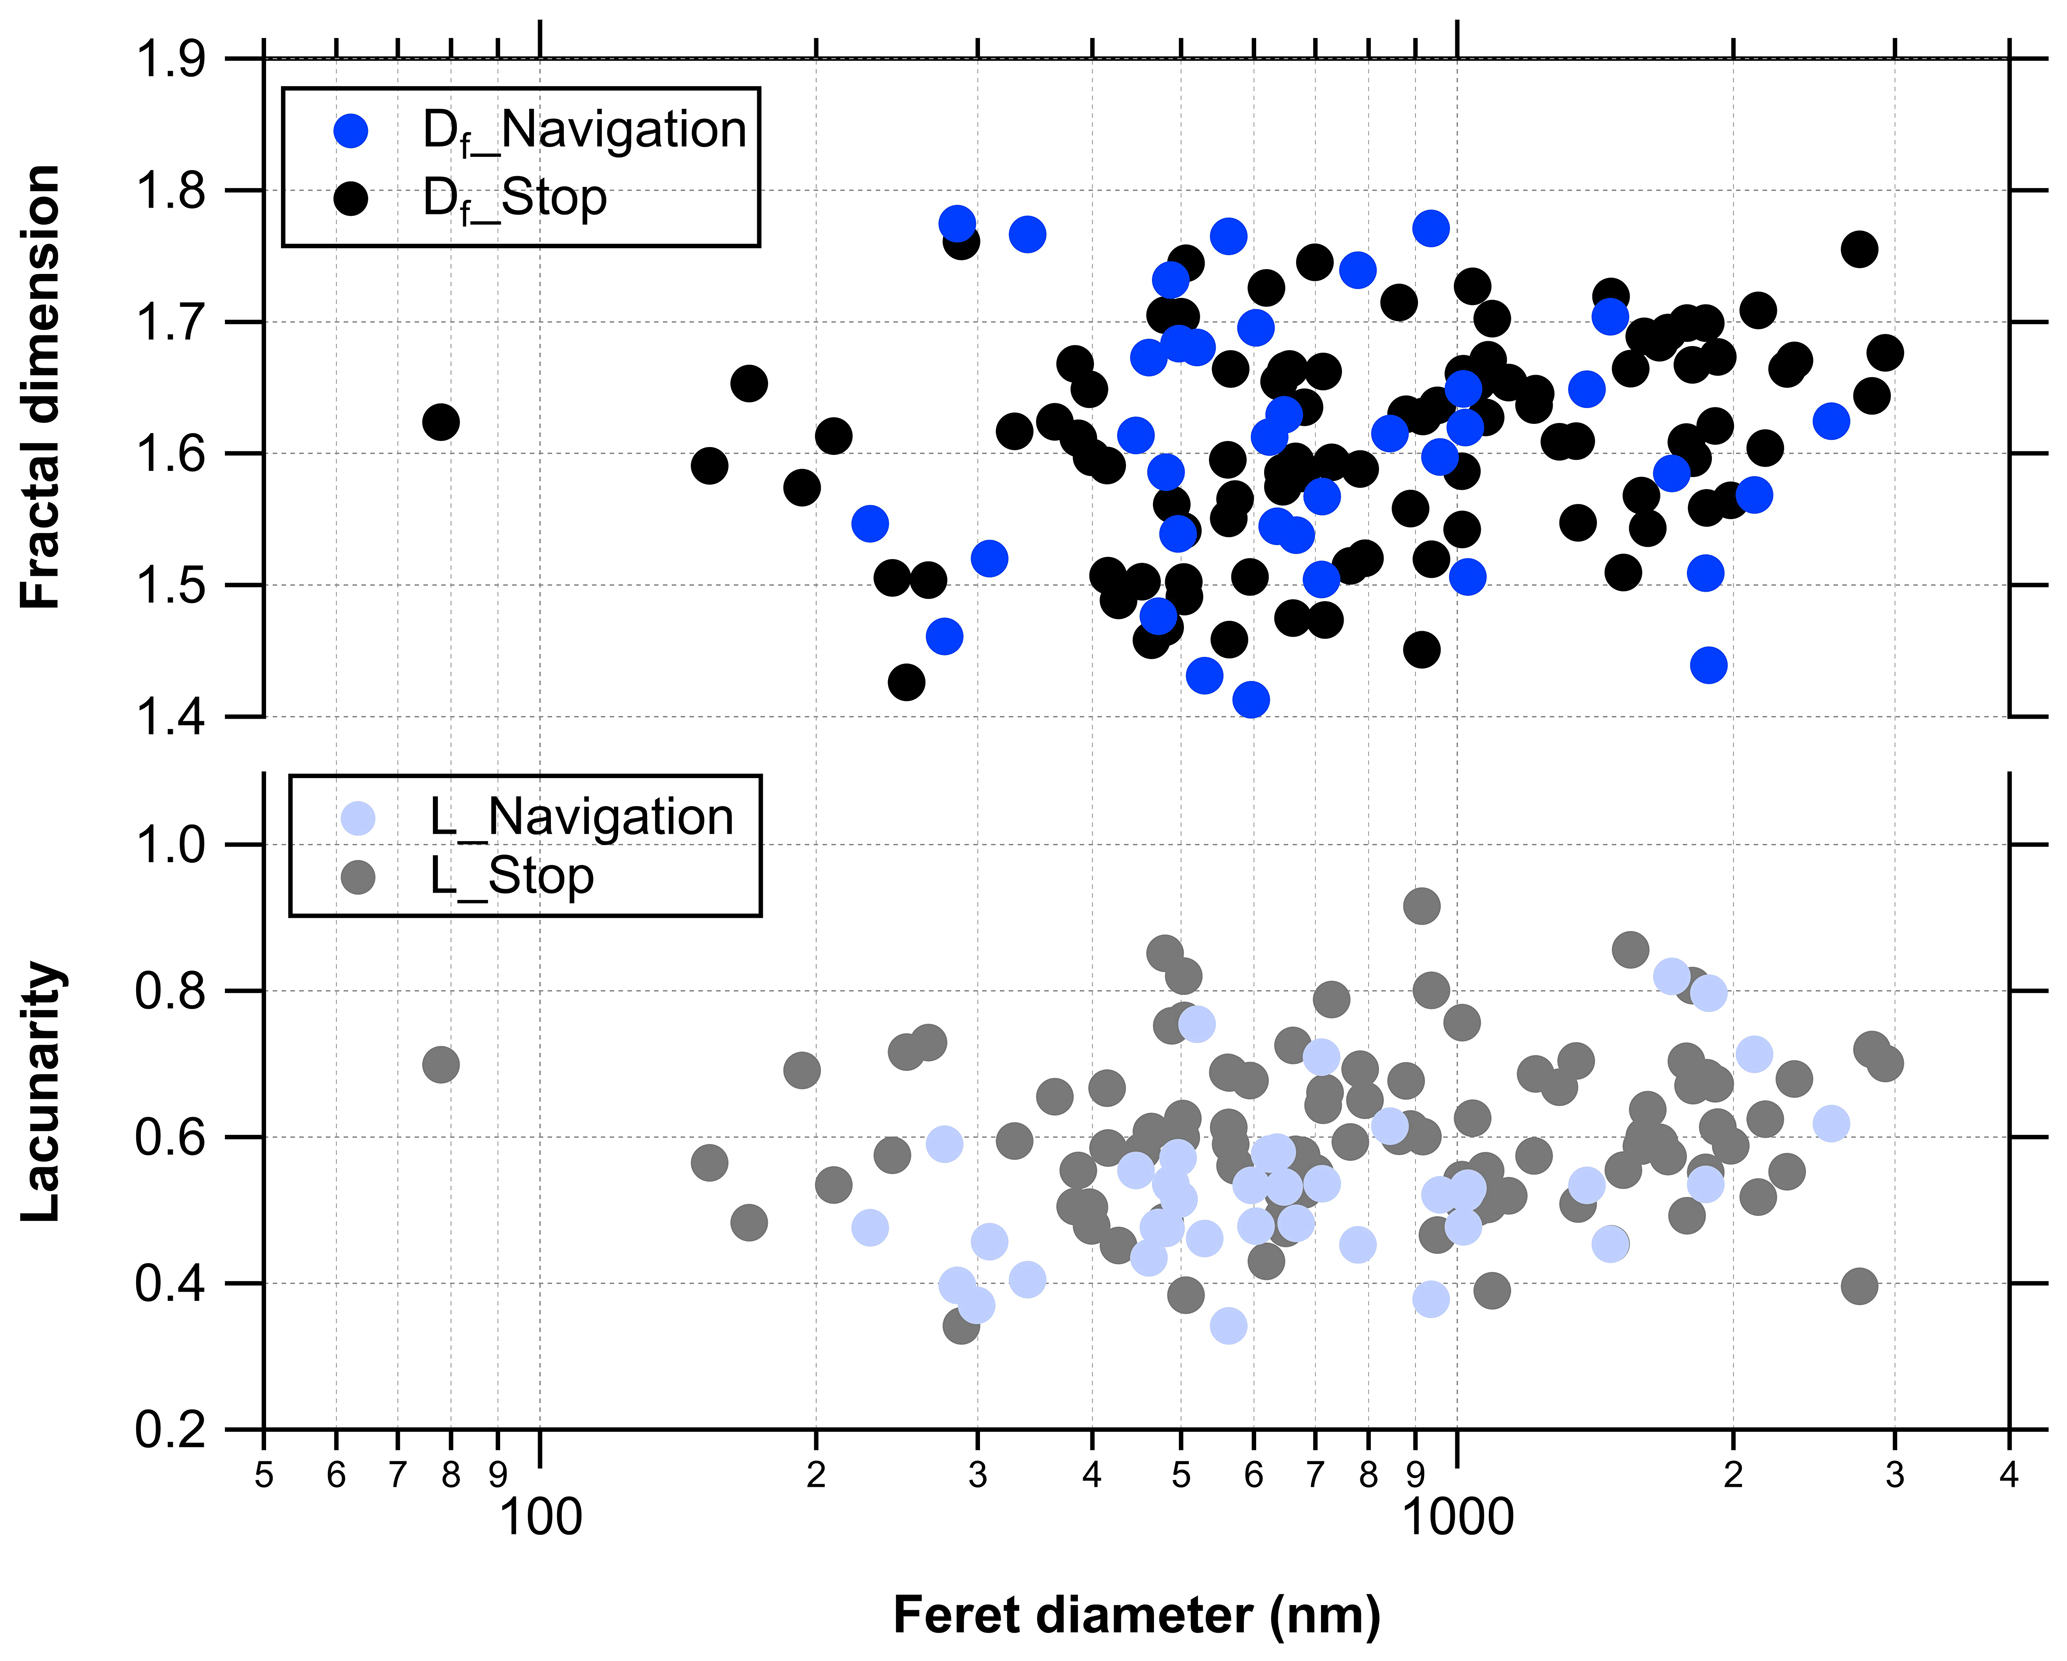
Figure 7The size-dependent fractal dimension (Df) and lacunarity (L) for each BC particle during navigation and stop. A total number of 134 data points are shown in Fig. 6.
Tar balls were frequently observed during the campaign with an estimated sample fraction of about 11.8 %. Fractal-like tar ball aggregates were usually found in wildfire smokes (Girotto et al., 2018); however, in this study, spherical tar ball particles were observed in the marine atmosphere and were mixed with sea salt (Fig. 8a and d for TEM image and EDS spectrum, respectively), organic carbon, and sulfate (Fig. 8b and e) from the samples collected on 27 May during navigation. In contrast, the particles collected on 1 June were found to be amorphous carbon agglomerates (Fig. 8c and f) which were referred to OC. During these days, the wind directions were from the southwest, with air masses originating from both the Philippines and Southeast Asia. The shape difference between the tar ball spheres and the amorphous carbon agglomerates may be related to the type of biomass burning or the origin of the ship engines. Similar particle morphologies were found in other studies on brown carbon during aircraft measurements over the Yellow Sea in 2001 (Zhu et al., 2013). Tar balls mixed with BC during stop were also observed (Fig. S10), with geometrical diameters of 160–420 nm, much larger than nano-soot spheres (40–50 nm) (Fig. S11). In comparison, the laboratory-generated tar balls were measured to have AAE values of 2.7–3.4, with an average of 2.9 at 467–652 nm (Hoffer et al., 2016).
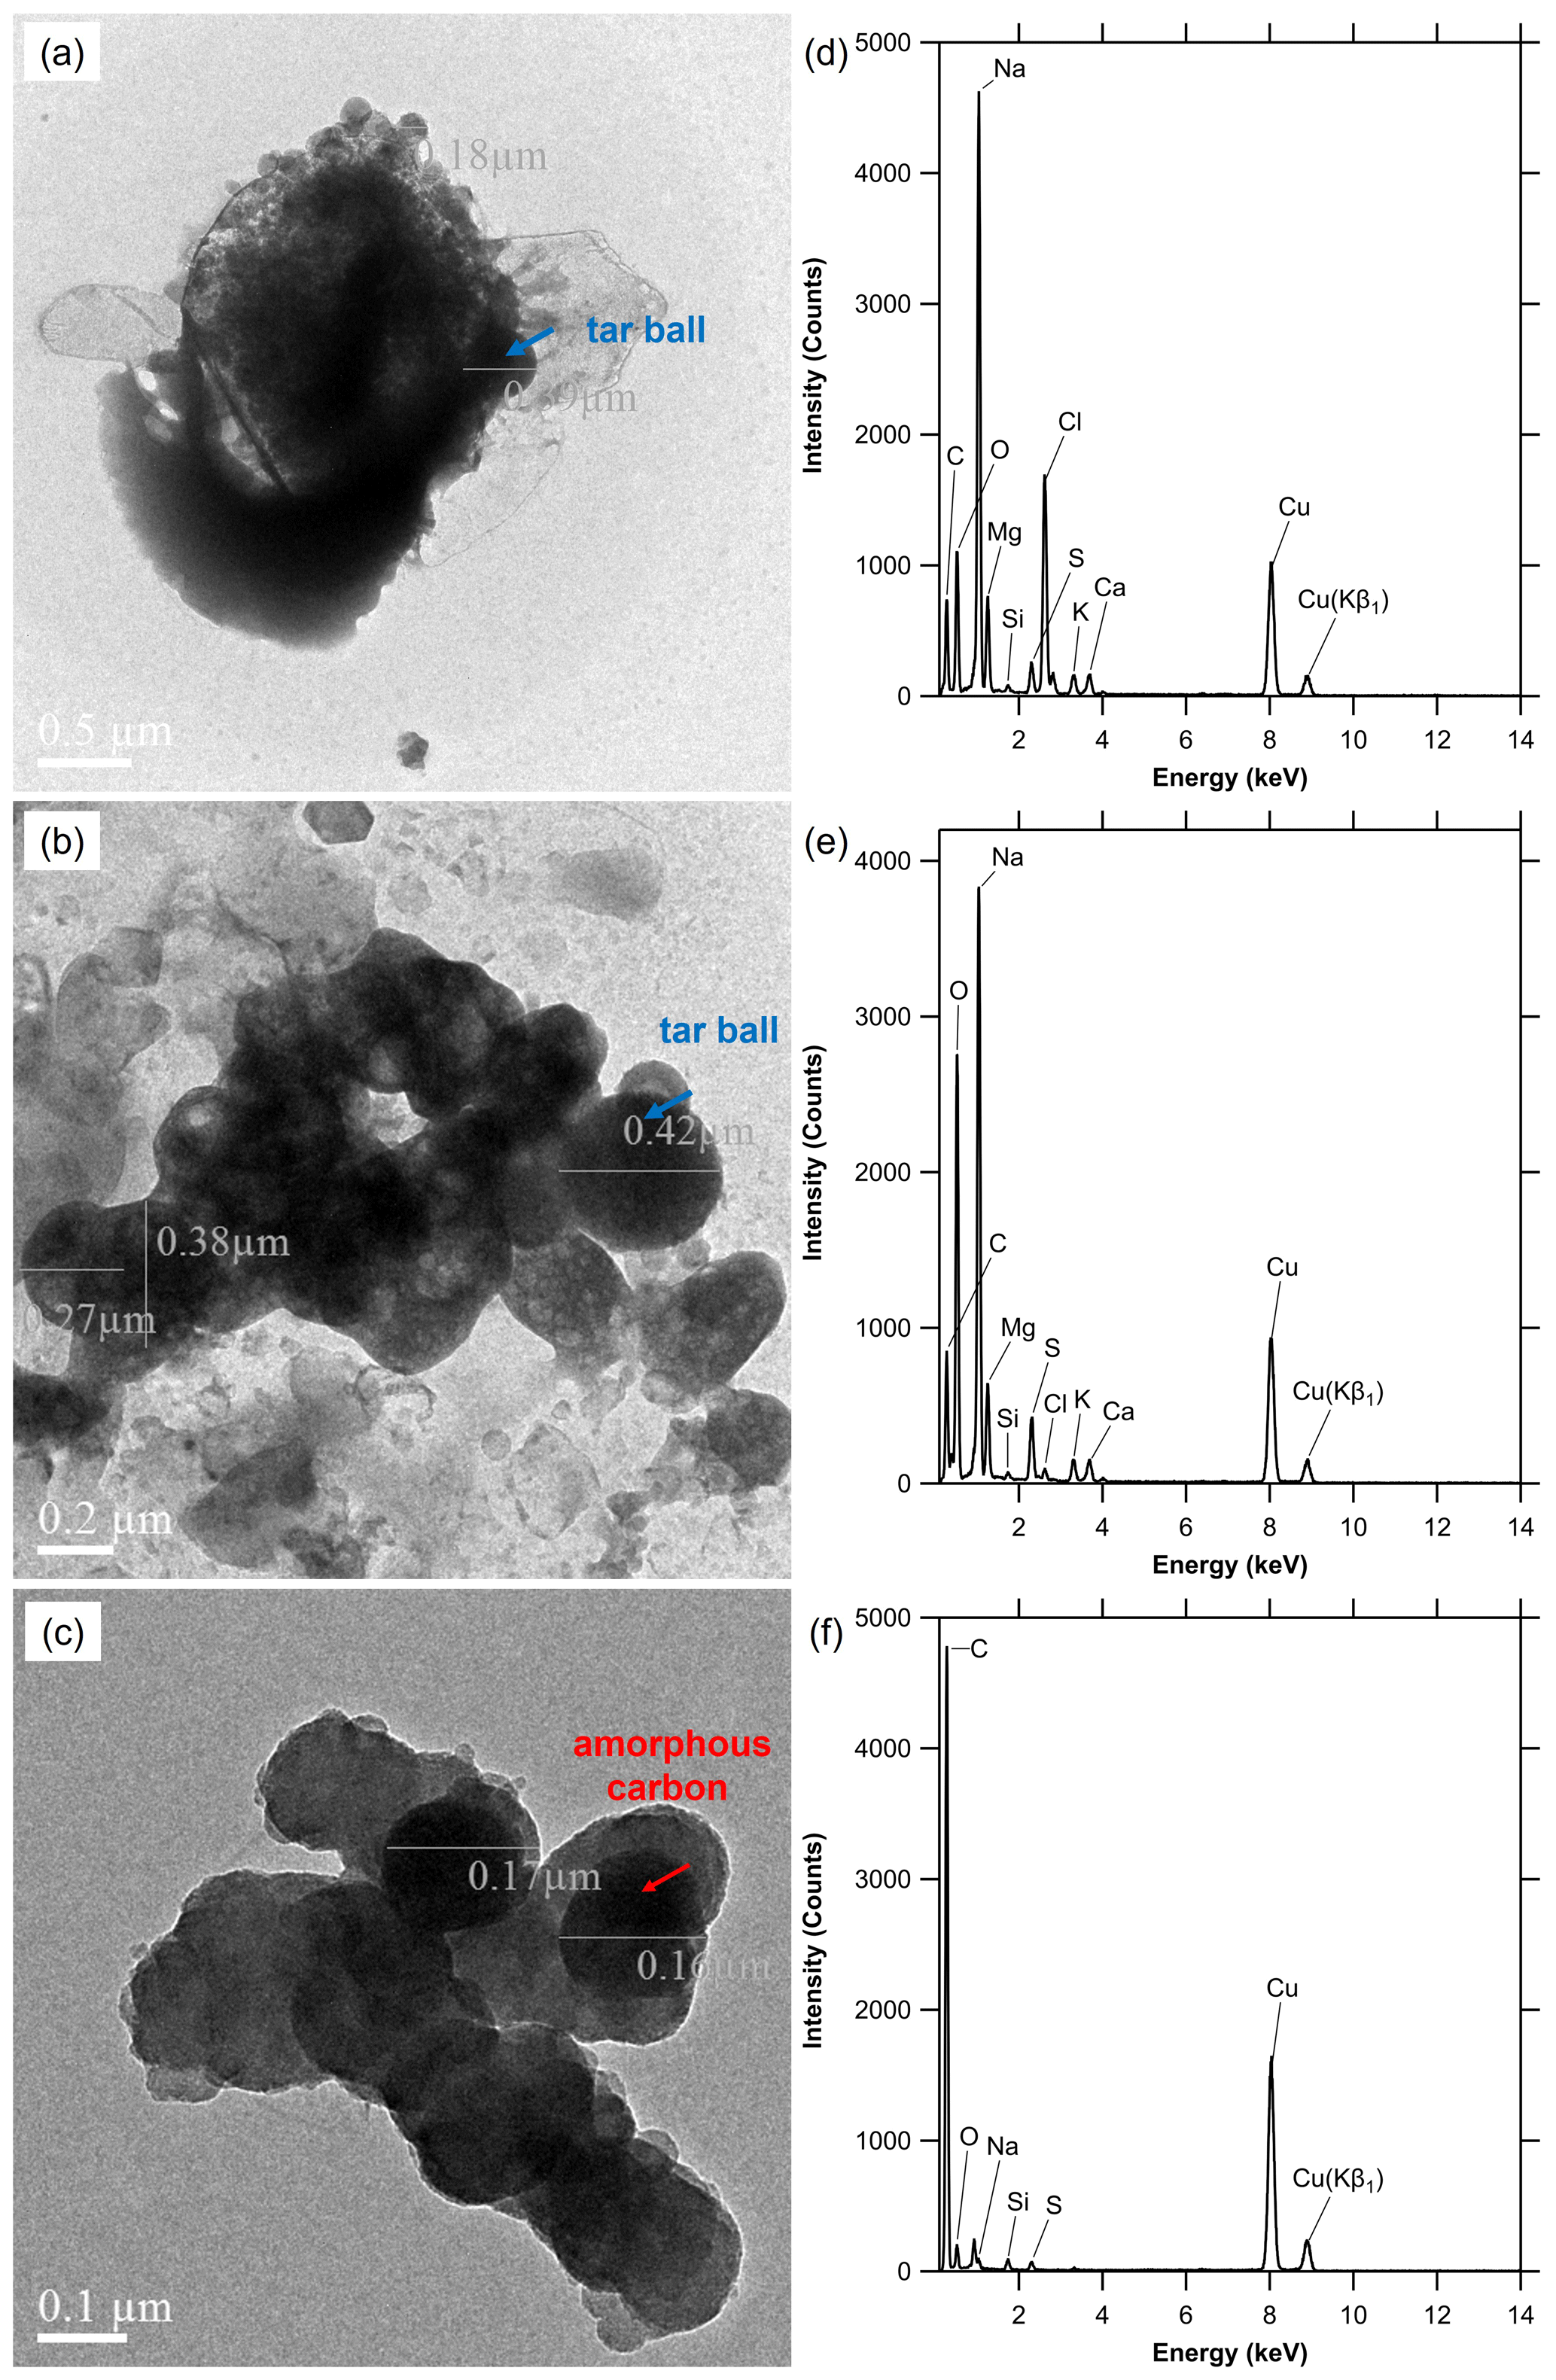
Figure 8The example TEM images and their corresponding EDS spectra of particles collected during navigation: tar balls mixed with sea salt (a, d) at 08:55:00 LT on 27 May 2021, tar balls mixed with OC and sulfate (b, e), and amorphous carbon agglomerates mixed with sulfate (c, f) at 18:07:00 LT on 1 June 2021. The EDS spectra were collected by focusing the electron beam in the TEM, and the illuminated area covers the center of the particle for elemental analysis. The blue arrows indicate tar balls, and the red arrow indicates amorphous carbon. The EDS is obtained from beam focus on the center of the particle.
3.3 Light absorption of carbonaceous aerosols
The BC concentrations measured by the Magee AE33 aethalometer agree excellently with the optical EC concentrations obtained from the Sunset analyzer, as evidenced by a linear regression coefficient of 0.97. The BC measurements obtained from the AE33 instrument do not agree with the OC, EC values, yet their overall trends exhibit consistency. However, the BC concentrations were considerably higher than the thermal EC concentrations, exhibiting linear regression coefficients of 1.66 and 1.55, respectively. These findings, presented in Fig. S12 of Sect. 8 in the Supplement, are in line with previous research conducted by Brown et al. (2019). The ratios can be used as an indicator for the source origins of the air masses. Figure 9 shows the distribution of the ratios and the corresponding EC concentrations. The median ratios are 8.14, 5.20, 6.35, and 2.63 for the classified periods BMP, TMP, AMP, and SPP, respectively. Notably, EC median mass concentrations (0.24, 0.25 and 0.17 µg m−3) for the marine air masses during BMP (0.013–0.69 µg m−3), TMP (0.015–0.60 µg m−3), and AMP (0.014–0.74 µg m−3) were lower than the median concentration (1.70 µg m−3) during SPP. Compared with Fig. 9d, the scattered higher ratios in Fig. 9a, b, and c are caused by the very low EC concentrations. The presence of extremely low EC concentrations, often falling below or near the detection limit, can introduce discrepancies in the calculation of the split, ultimately resulting in inaccurate EC concentrations (Bauer et al., 2009). In addition, this study revealed a significant variation in EC concentrations during SPP, ranging from 0.15 to 22.8 µg m−3. Previous studies showed that the ratio could be characterized by various sources, ranging from 1.37–1.71 for residential cooking stoves, 1.63–2.23 for rural emissions, 1.05–1.24 for diesel exhaust, and 0.80–1.12 for urban environments (Khan et al., 2012). A low ratio (<3) corresponded to the predominant contribution of the primary OC in submicron particles reported in a previous study in the southern Indian Ocean, northern Indian Ocean, and Bay of Bengal (Neusüß, 2002). Here, the median ratio of 2.63 during SPP is much higher than the characteristic values of diesel combustion, most likely because the sample air during SPP is composed of marine air and the ship's own exhaust. Our results are consistent with a recent study which showed that the diesel combustion from ships accounted for 15 % of BrC in the total light absorption at a coastal site in Shanghai during June–July, 2021 (Kang et al., 2022). In contrast, the ratios during other periods (i.e., BMP, TMP and AMP) were even much higher (5.20–8.13), indicating that the aerosols were highly aged during the long-range transport of biomass burning aerosols. This is also consistent with our recent study in the SCS which showed that during monsoon periods in the summer of 2019, the biomass burning organic aerosols became aged through atmospheric processes during transport (Q. Sun et al., 2023).
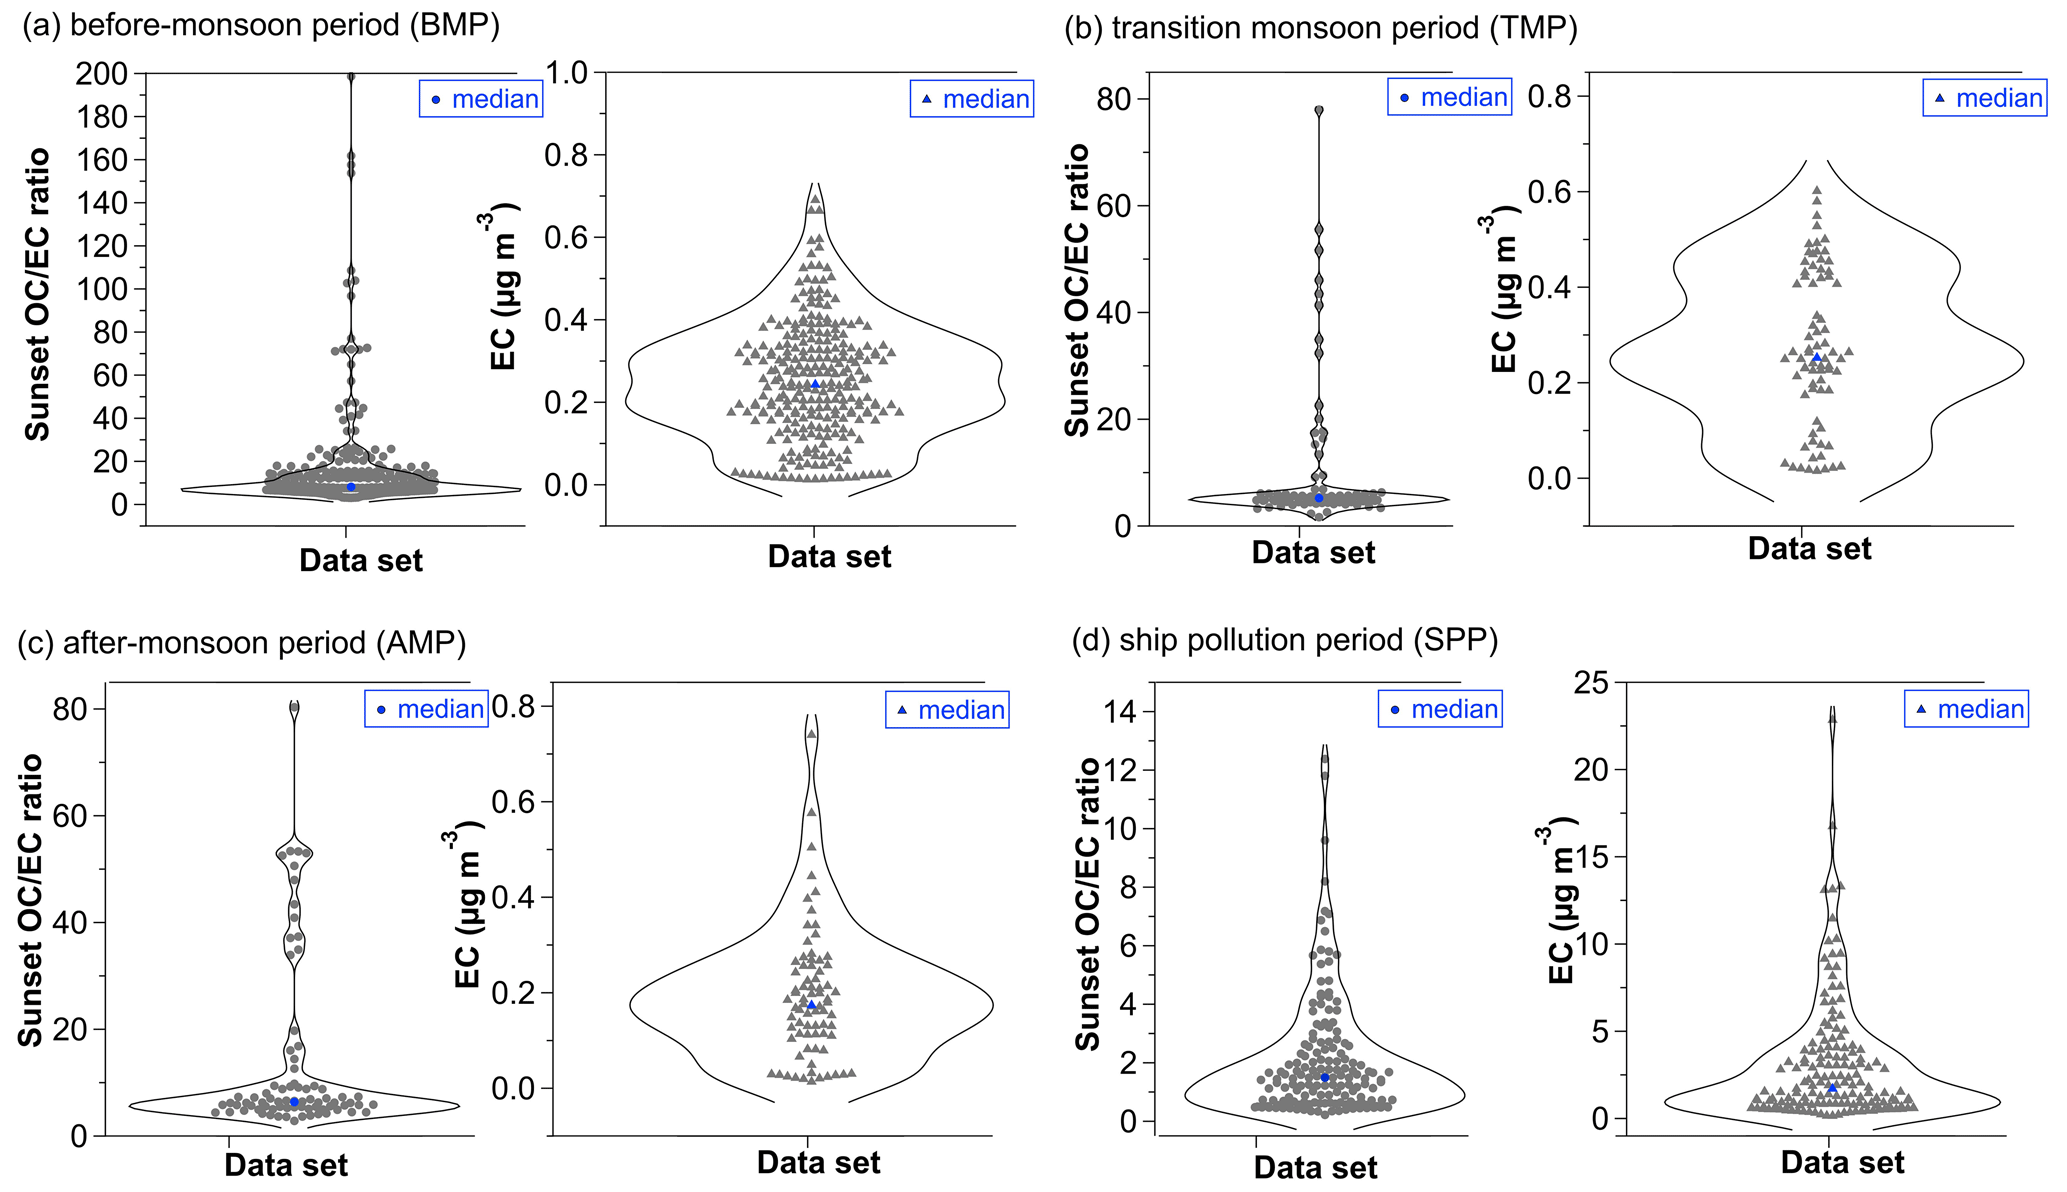
Figure 9Violin plots of the ratios and EC concentrations for the (a) before-monsoon period (BMP), (b) transition monsoon period (TMP), (c) after-monsoon period (AMP), and (d) ship pollution period (SPP) due to the ship's own pollution, based on the data from the Sunset analyzer. The blue solid circles and triangles indicate median values of Sunset ratios and EC mass concentrations, respectively. The total data points are 551 in the data set, with a concentration range of 0.76–7.90 µg m−3 for OC and 0.013–22.84 for EC µg m−3. In particular, all OC data are above a LOD of 0.18 µg m−3, while 29% of EC data are below a LOD of 0.19 µg m−3.
The long-range biomass burning transport affects the air mass in the SCS. Figure 10 illustrates the wavelength-dependent mass concentration measured by the AE33 aethalometer during the campaign, showing (a) an example of a ship plume (15:00:00 on 5 May–01:00:00 on 6 May) and (b, c) two significant biomass burning events during BMP (BB-1: 15:00:00–23:00:00 on 16 May) and during TMP (BB-2: 15:00:00 on 30 May–00:00:00 on 31 May). The ship plumes, predominantly emitted from fossil fuel combustion, showed similar absorption at all seven wavelengths. In contrast, significant absorption at low wavelengths was detected during the biomass burning events, a phenomenon also observed in other field measurements in urban cities and towns where air masses were susceptible to biomass burning (Zhang et al., 2017). A comparison of the two methods for AAE calculation is presented in the Supplement (Sect. 4, Fig. S4). The fitting results demonstrate that the AAE calculated for all wavelengths was lower than the AAE calculated for only 470 and 950 nm wavelengths. The fitting slope is 0.78, and the determination coefficient (R2) is 0.98, indicating a strong correlation between the two methods.
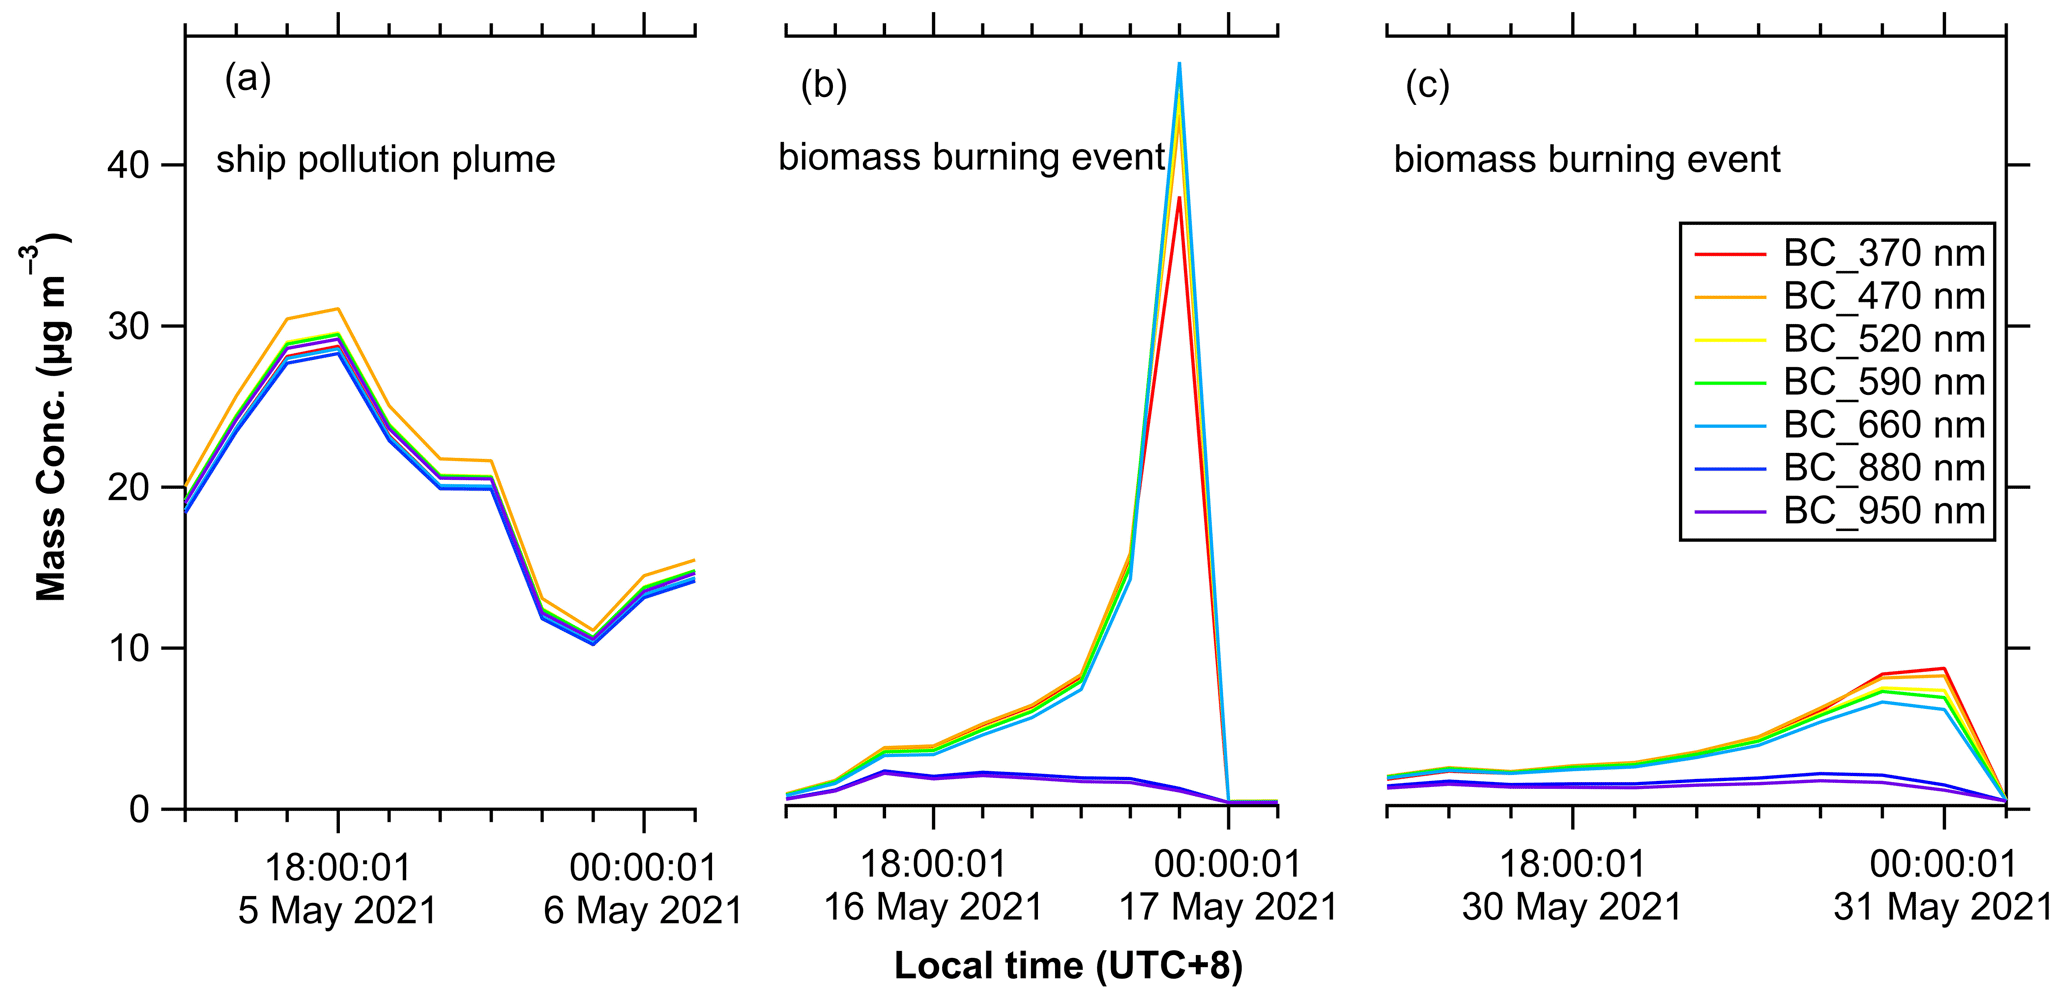
Figure 10The wavelength-dependent mass concentration from AE33 aethalometer for (a) an example of a ship pollution plume and (b, c) two significant biomass burning events during this campaign.
Figure 11 shows the hourly averaged AAE derived from all wavelengths as a function of the BC concentrations by AE33 aethalometer with the median (range) AAE values of 1.14 (0.57–1.48), 1.02 (0.51–1.36), 1.08 (0.54–1.42), and 1.06 (0.65–1.37), respectively, for the classified periods (BMP, TMP, AMP, and SPP), and the corresponding BC median (range) mass concentrations of 0.28 (0.033–1.17), 0.14 (0.042–2.86), 0.17 (0.055–1.08), and 3.01 (0.21–36.5) µg m−3, respectively. Like EC, ship pollution led to emissions of high BC concentrations, reaching as high as 36.5 µg m−3. The median BC concentrations decreased significantly during TMP and AMP, likely due to the increase in the RH which further increased the scavenging of the BC particles during navigation, as reported previously (Girach et al., 2014). Note that the biomass burning events were excluded from the above calculations and are further discussed below.
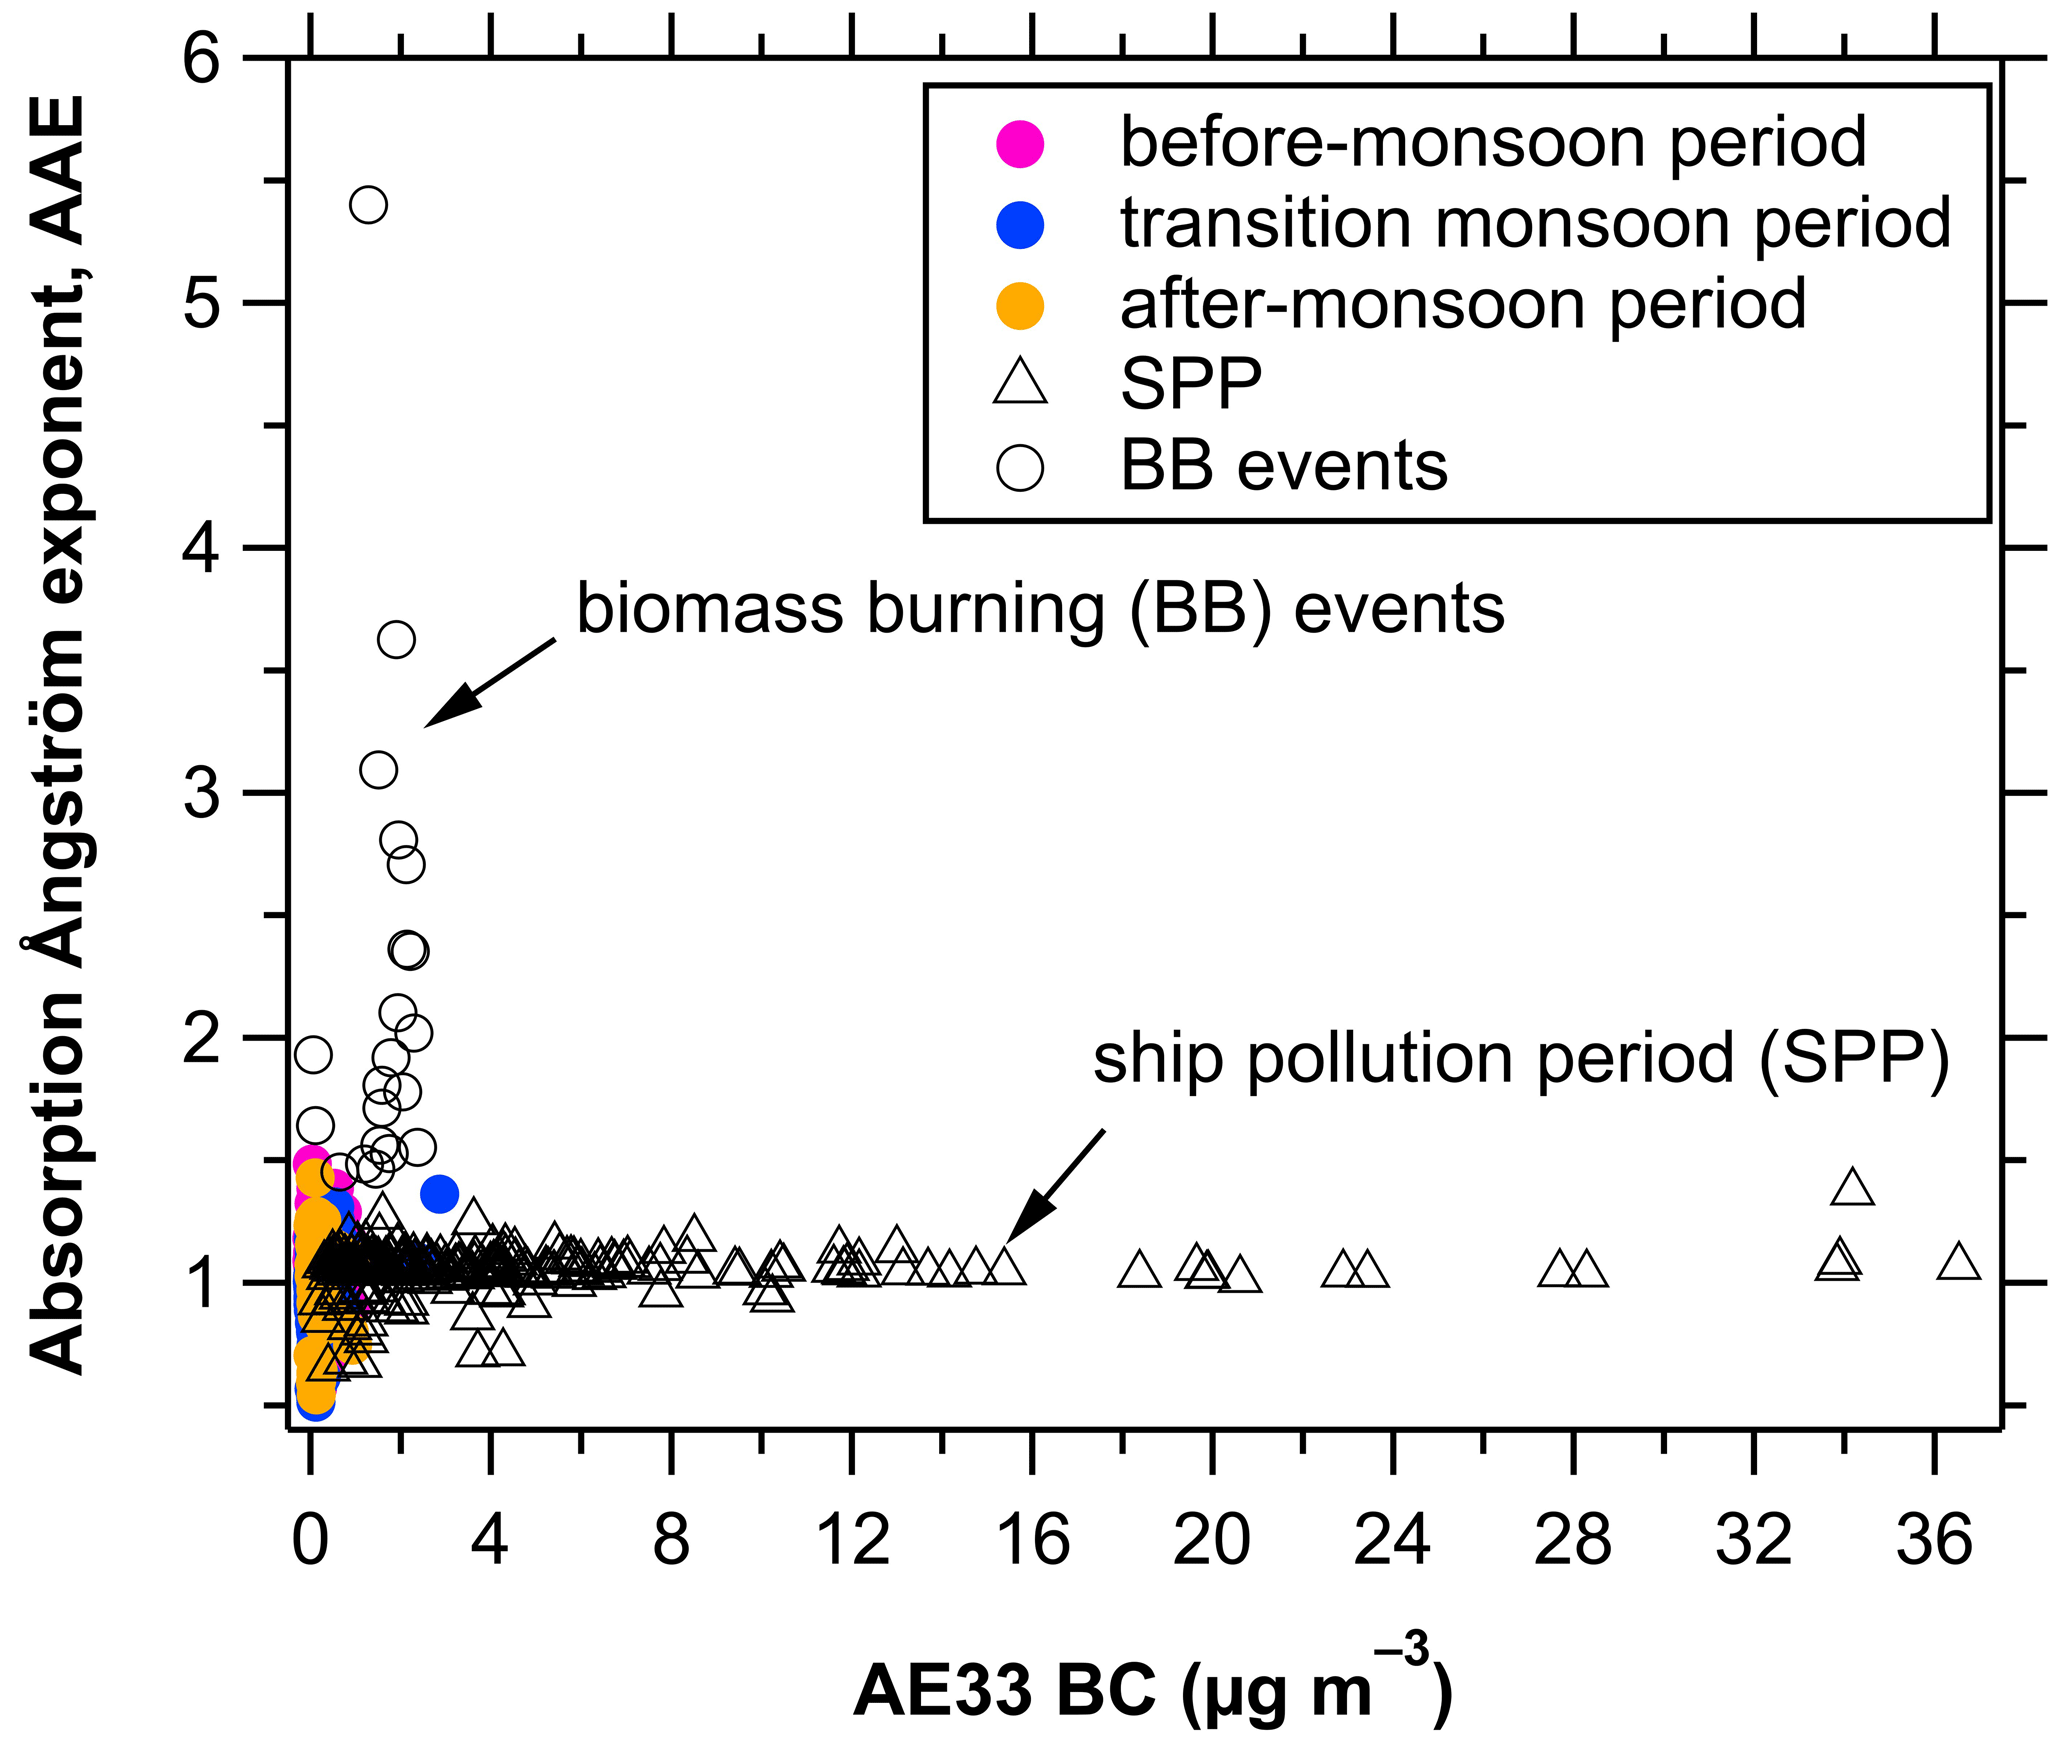
Figure 11The absorption Ångström exponent (AAE; all wavelengths) vs. AE33 BC concentration for the before-monsoon period (BMP), transition monsoon period (TMP), after-monsoon period (AMP), and ship pollution period (SPP).
During the biomass burning events, the correlations of AAE with AE33 BC and Delta-C concentrations are respectively shown in Figs. 11 and 12, characterized by very high median AAE values (1.85 and 1.86, respectively for BB-1 and BB-2) and BC concentrations (1.93 and 1.67 µg m−3). The BC mass concentration ranged from 1.45 to 3.62 µg m−3 during biomass burning events based on light absorption at wavelength of 880 nm. The mass concentration in Fig. 10 corresponds to BC mass concentration obtained at each wavelength. We have emphasized that BC mass concentration in this study is equivalent BC at individual wavelengths. Notably, efficient light absorption of BrC in the range at 370–660 nm was observed during the biomass burning events, while no significant wavelength-dependent BC concentrations were found during the ship's own pollution (Fig. 10a). The AAE values below 1 in Fig. 11 are not noises, in some cases due to aerosols from fossil fuel (Ezani et al., 2021), and in other cases, they can be even lower than 0.5 when paired with wavelengths of 470 and 660 nm (Laing et al., 2020). The higher AAE values imply much stronger absorption of non-BC light-absorbing particles (BrC) at shorter (UV–Vis) wavelengths, which mainly originated from the biomass burning emissions (Ponczek et al., 2022). Moreover, the median ratios were 5.03 and 5.29 respectively for the two biomass burning events, even much higher than those for SPP (Fig. 9). The 72 h backward trajectories also showed that the BB-1 air masses mainly originated from the Philippines, while the BB-2 air masses were from the mainland Vietnam, both with high densities of fire spots (Fig. 4). The AAE values were also highly correlated with the Delta-C values with a determination coefficient (R2) of 0.92 (Fig. 12), further demonstrating a significant contribution of BrC to the AAE enhancement. In addition, we further correlated the observed high AAE values with the Delta-C values for the two biomass burning events and confirmed that these high AAE values (1.45–3.62) were indeed attributed to biomass burning rather than ship emitted tar balls which covered an AAE range of 2.7–3.7 at 405 and 781 nm wavelengths in a previous wood burning study (Chylek et al., 2019).
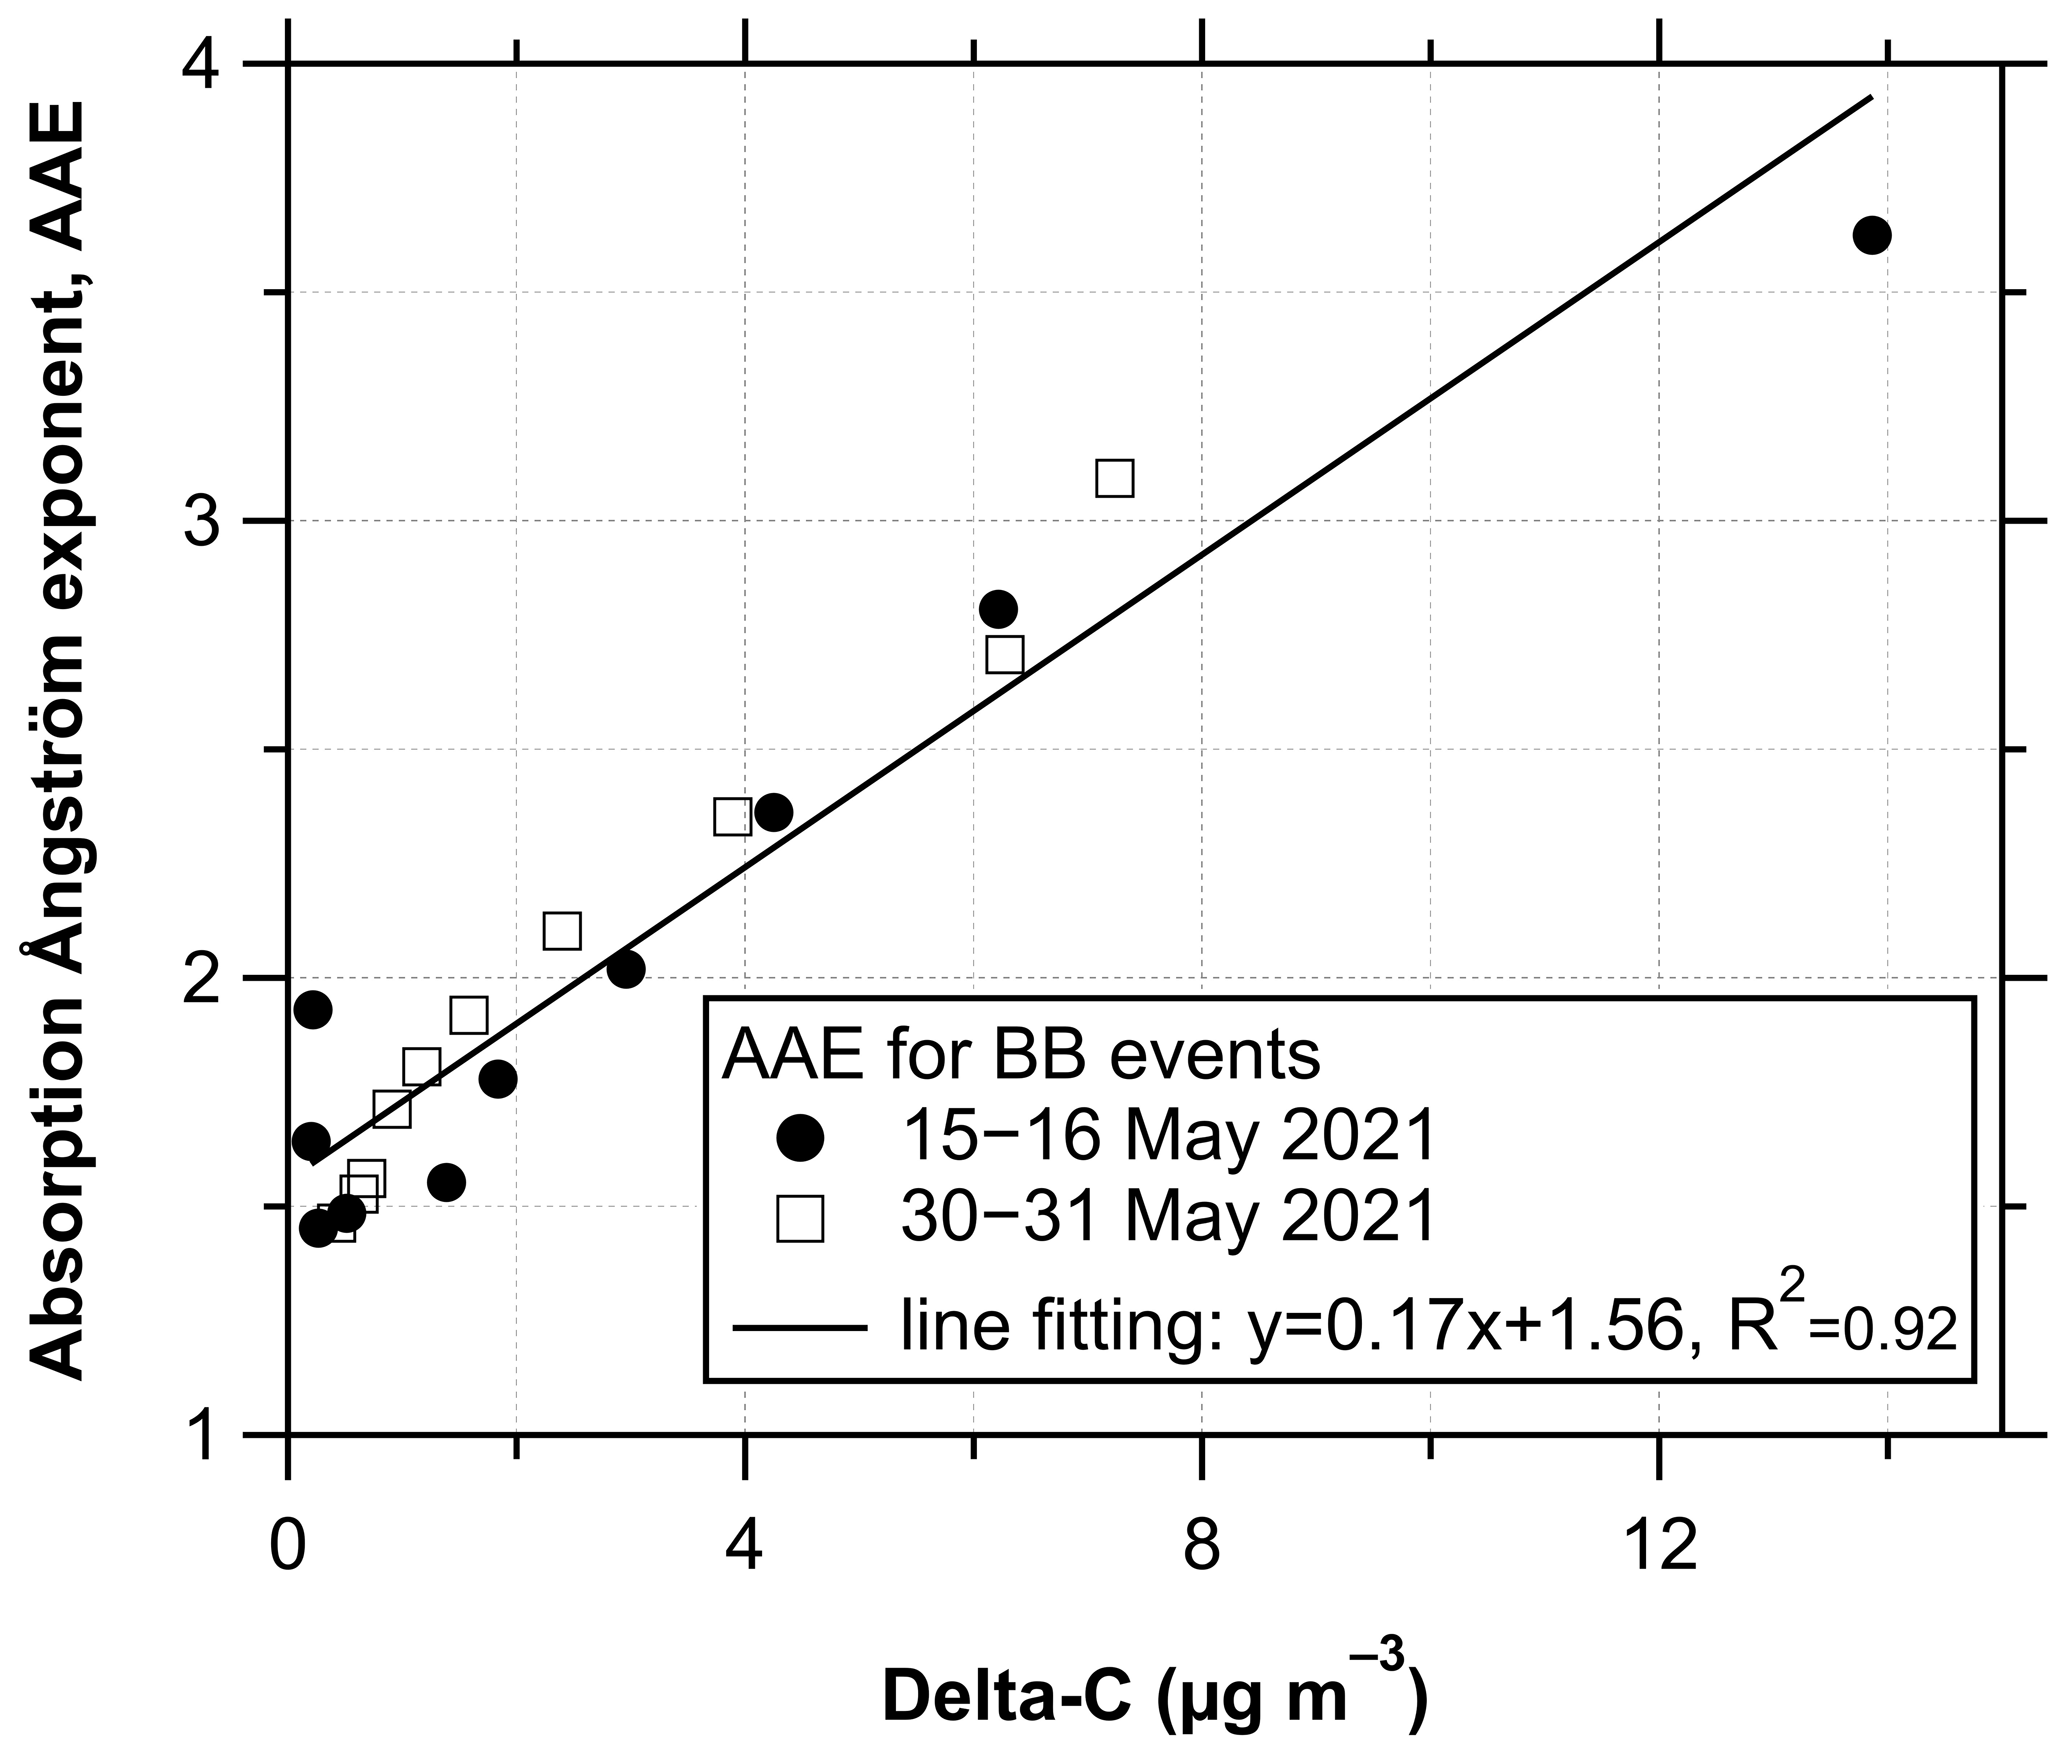
Figure 12The absorption Ångström exponent (AAE) vs. the Delta-C concentration for the two biomass burning events: BB-1 at 06:00:00–07:00:00 LT on 15 May and 15:00:00–22:00:00 LT on 16 May during BMP and BB-2 at 15:00:00–23:00:00 LT on 30 May and 00:00:00 LT on 31 May during TMP. The BB-1 and BB-2 data points are marked by solid circles and open squares, respectively. Delta-C is the difference between the concentration derived from the aforementioned UVPM data (at 370 nm) and BC concentration (at 880 nm).
Our study found that the AAE values from all wavelengths for the marine atmosphere and ship pollution were 1.02–1.14 and 1.06, respectively, except for a higher AAE value (1.93) during the two biomass burning events. The AAE values for ship pollution are dependent on the fuel types and loading conditions (Laskin et al., 2015). For example, heavy fuel oil operated at high loads can result in AAE values (at 470/950 nm and hereafter unless specified) of 2.0, while the intermediate fuel oil has an AAE value of 1.3 at high loads (Helin et al., 2021). In addition, the presence of tar balls may contribute to the enhancement of BrC absorption as mentioned in Sect. 3.2, as tar balls from ship emission have higher AAE values (2.5–6.0 depending on the wavelengths) (Corbin et al., 2019). The occurrence of tar balls in this study was about 12% in the analyzed single samples. These tar balls were likely aged during long-range transport from biomass burning and hence affected the light absorption of BrC in the SCS.
3.4 BC sources from fossil fuel vs. biomass burning
The source origins of BC particles can be investigated using the AAE model. In the model, we employed respectively the characteristic AAE values of 1 and 2 for FF and BB to calculate their corresponding BC concentrations, namely BC(FF) and BC(BB). Figure 13 shows the time series of BC(FF) and BC(BB) for different classified periods. The BC(FF) and BC(BB) values were much higher before the monsoon than during/after the monsoon, except for the periods during BB-1 and BB-2 with significantly high BC(FF) and BC(BB) values (peaks > 1 µg m−3), while high BC(FF) values were seen during SPP. Table 2 summarizes the average concentrations and the ranges of BC(FF) and BC(BB), along with their corresponding fractions. In general, both the average BC(FF) and BC(BB) values were low during BMP, TMP, and AMP, compared to those during the biomass burning events and SPP. BC(FF) contributed over 80 % of ship pollution during SPP, whilst the BC(BB) could contribute to more than 40 % of the total black carbon during the two BB events. We hence conclude that fossil fuel combustion is the major contributor to the light absorption of BC except during the seasonal biomass burning events, and biomass burning can have a profound contribution to the BC light absorption in the SCS.
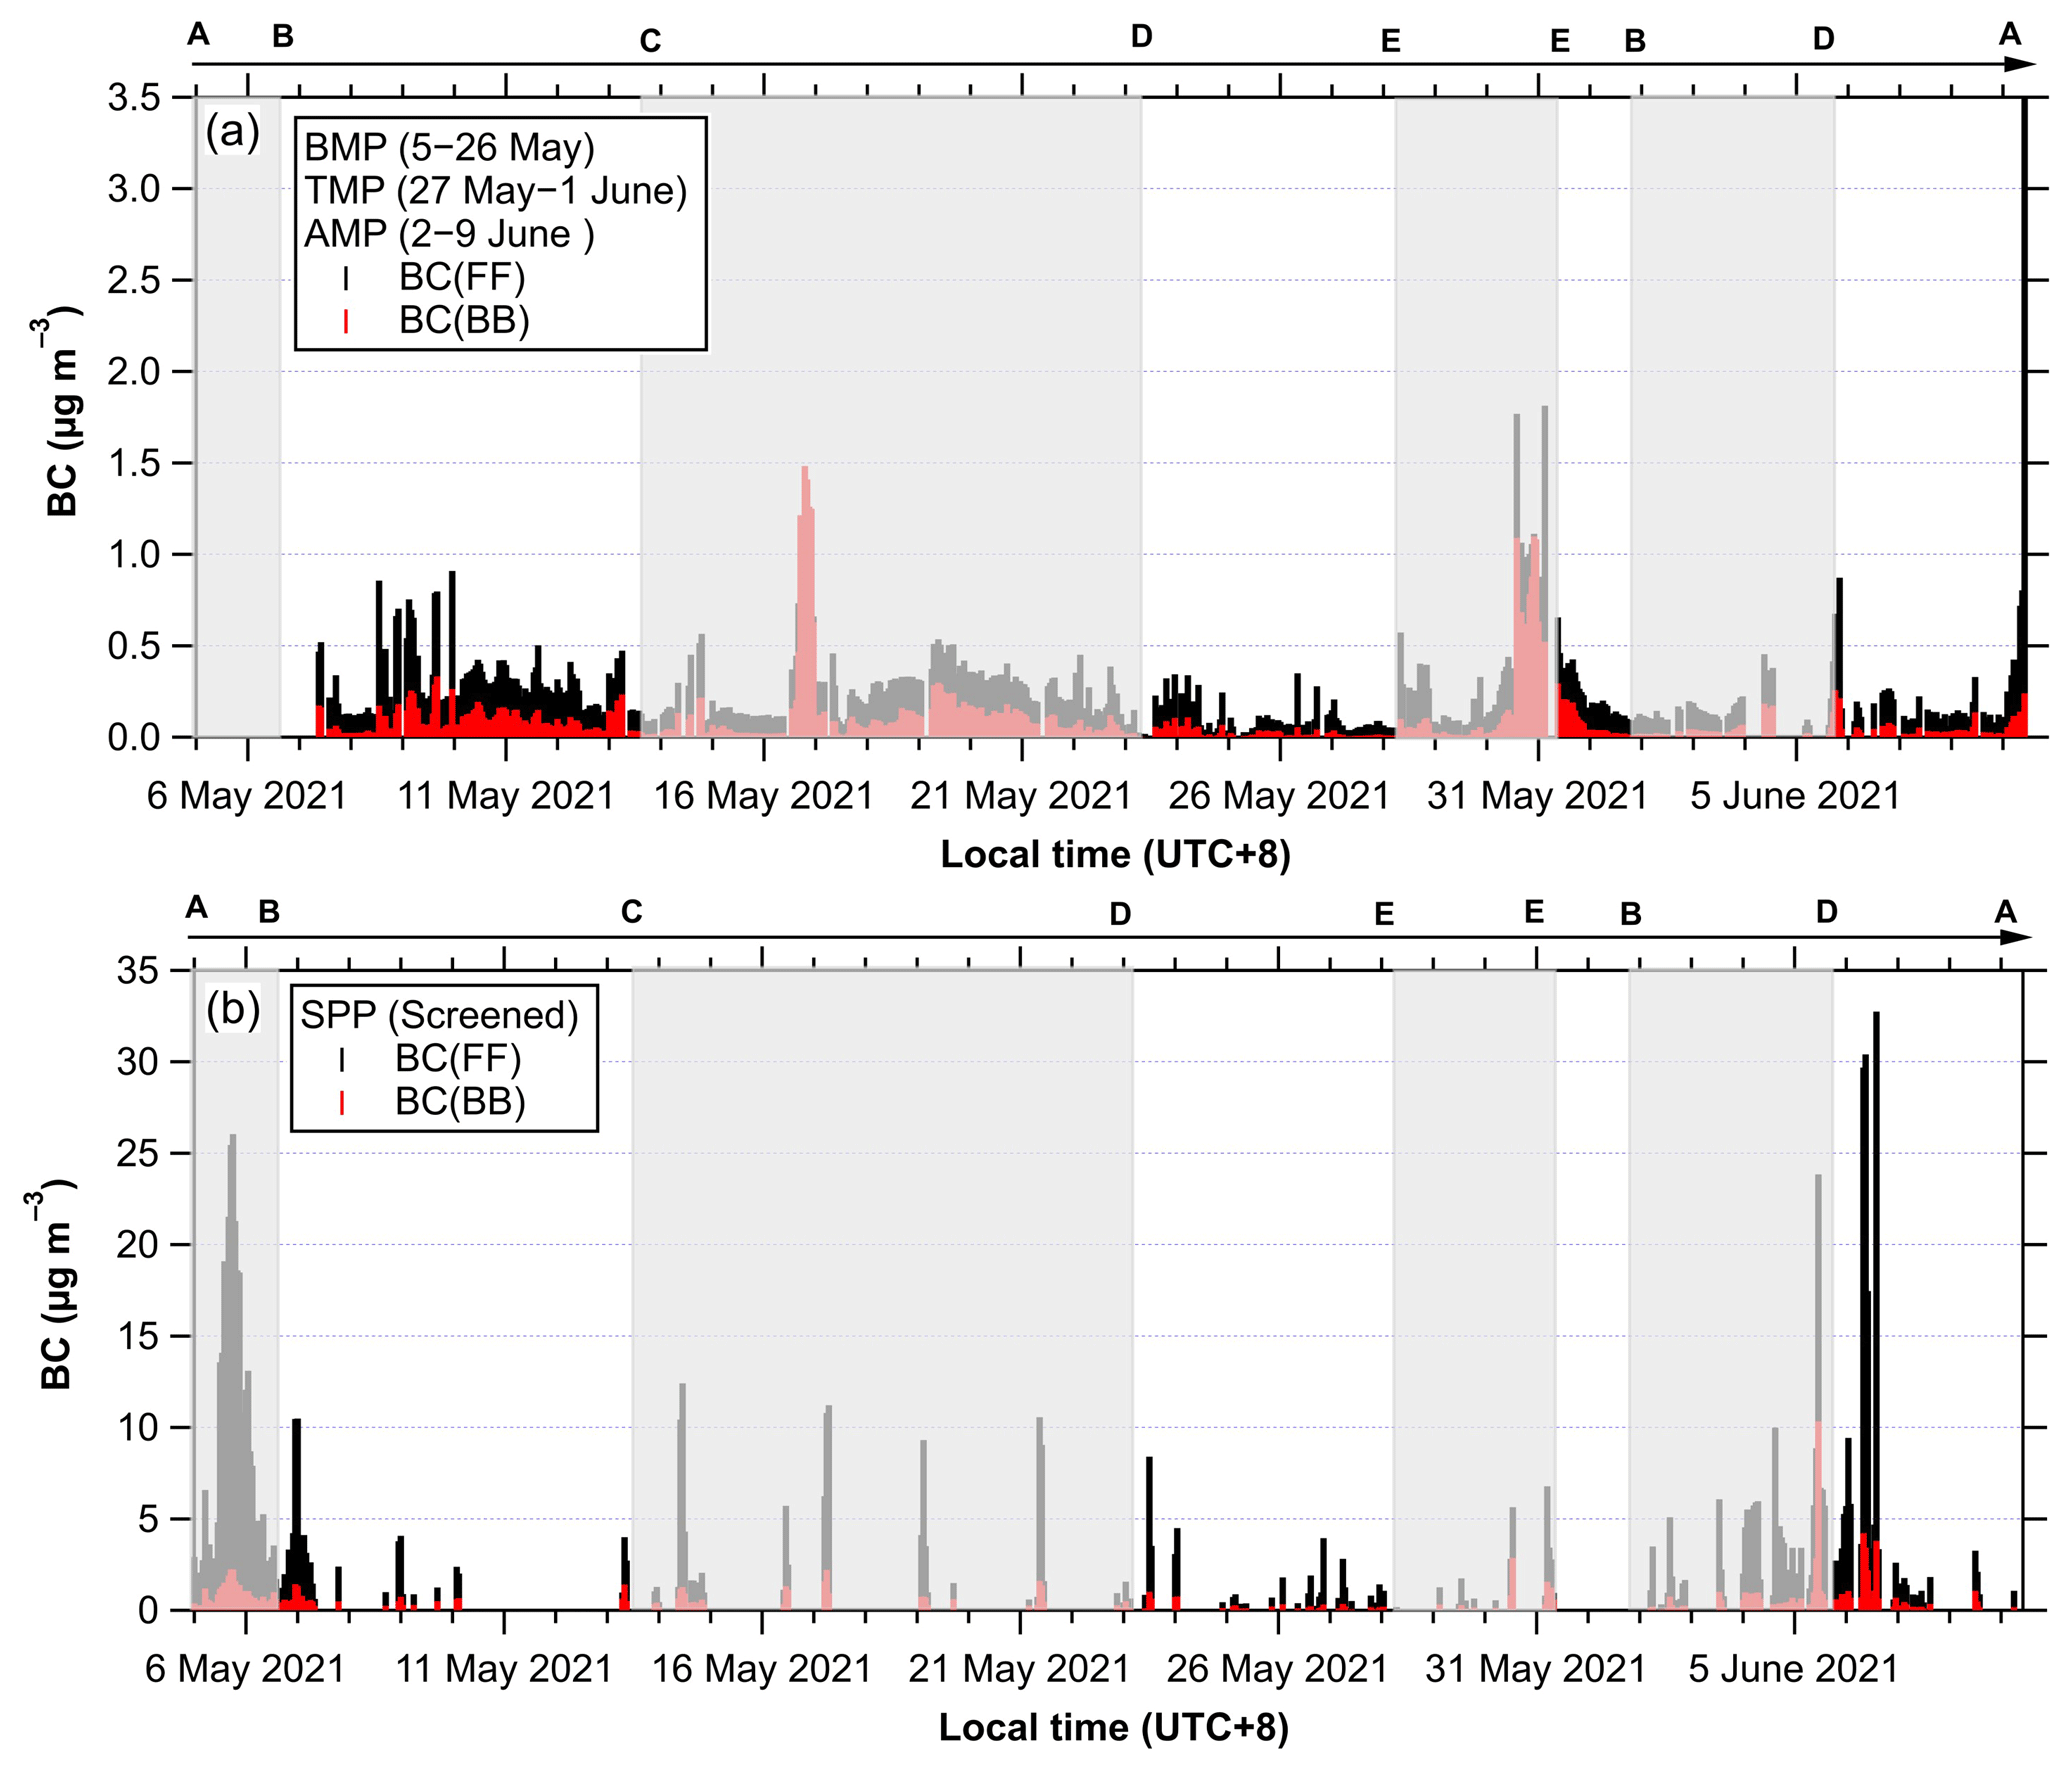
Figure 13Source apportionment of the BC particles using the two-component AAE model (AAE = 1 for fossil fuel (FF) and AAE = 2 for biomass burning (BB) for the (a) before-monsoon period (BMP), transition monsoon period (TMP), after-monsoon period (AMP), and (b) ship pollution period (SPP). The shaded and unshaded areas sequentially indicate the cruise routes from AB, B→C, C→D, D→E, E→E (ship stop), EB, B→D, and D→A, as marked in Fig. 1.
Table 2Source apportionment of BC based on the two-component AAE model.
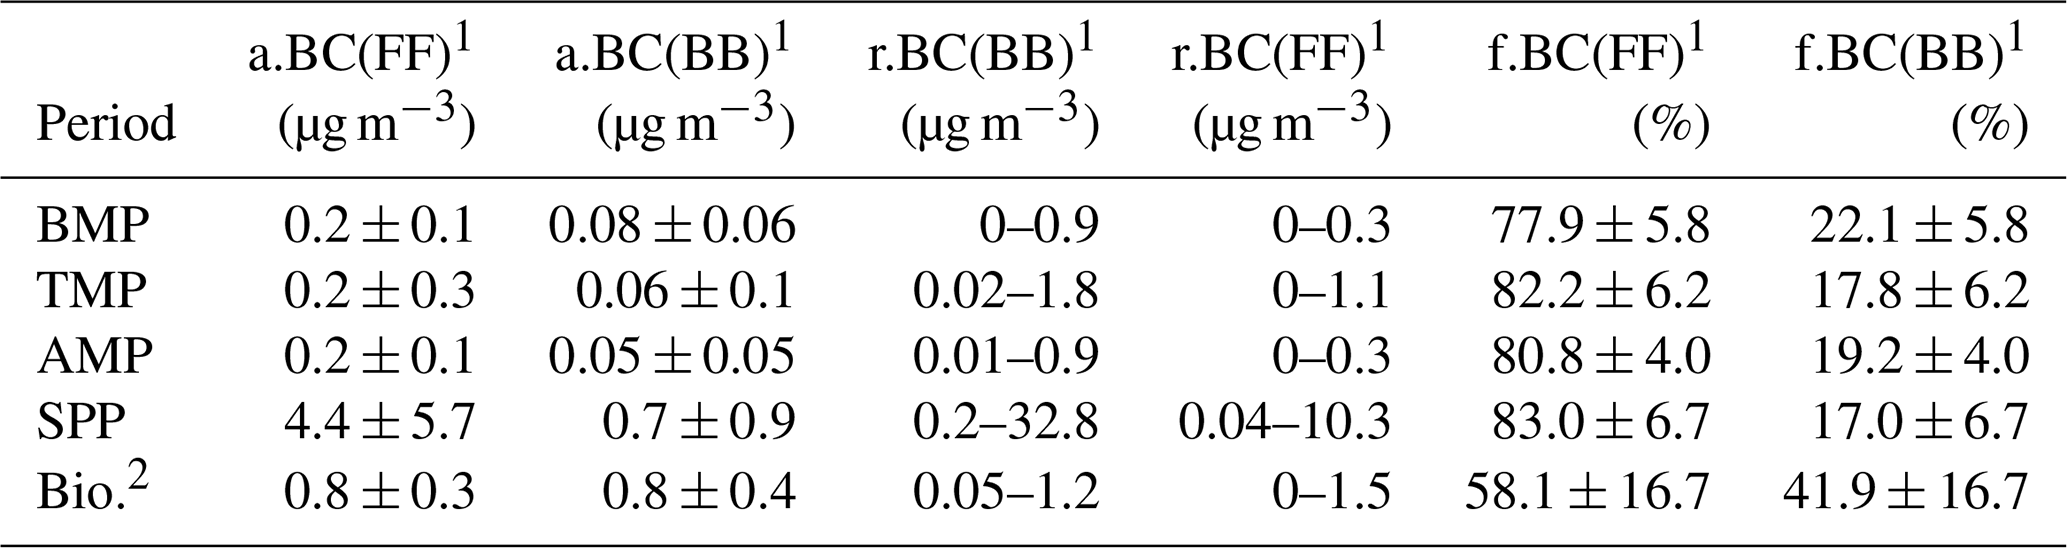
1 “a” stands for average, “r” for range, and “f” for fraction. 2 Bio. stands for the two biomass burning events as noted in the main text.
Active biomass burning pollution during January–May in Southeast Asia occurs routinely because of crop residue and sugar cane burning. A previous study showed that during dry and wet seasons, the annual contribution of BC(BB) was 11 % and 30 % respectively in peninsular India (Soyam, 2021) based on the two-component AAE model (Drinovec et al., 2015; Yus-Díez et al., 2021). Table 3 summarizes the BC concentrations, AAE values, and the corresponding fraction of biomass burning (or fossil fuel) in previous and present studies for the marine atmosphere conducted at coastal sites or ship-based cruise measurements using the AE series instrument. The BC(FF) and BC(BB) fractions of 58 % and 42 % were obtained respectively during the two BB events, while they accounted for 78 %–83 % and 18 %–22 % during other periods, similar to those found at the coastal site in the central Adriatic (79 % and 21 %) and significantly different from those reported at a coastal site in the East China Sea (Yu et al., 2018). However, observation data are still lacking on the contribution of BC from fossil fuel vs. biomass burning in the sea regions, which warrants more future studies during different seasons.
Table 3Summary of AAE values, mass concentrations, and the relevant fractions for the BC particles in PM2.5 from coast site and cruise measurements using the AE series aethalometer.
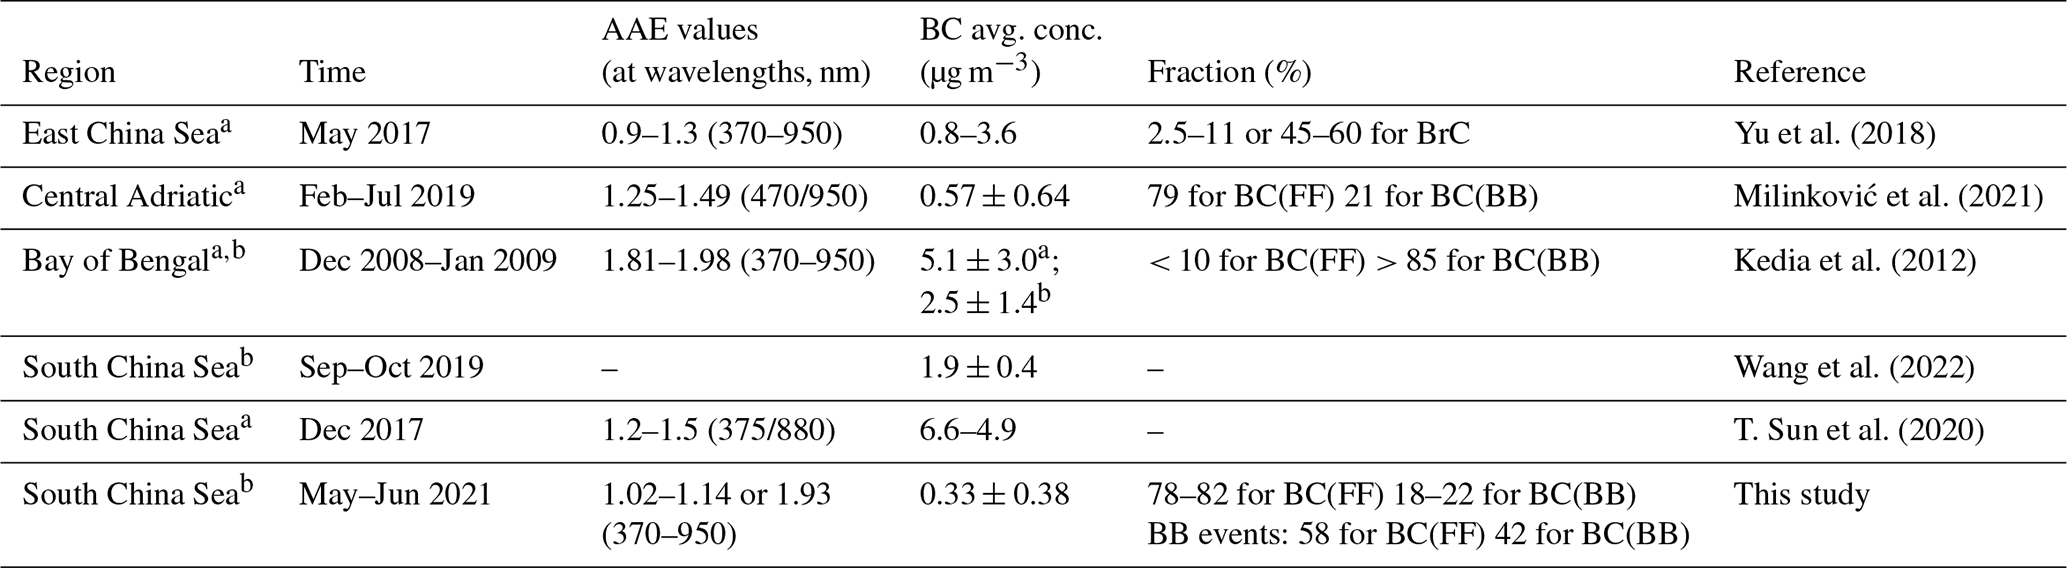
a Coastal site measurement. b Cruise (remote) measurement.
3.5 Limitation of this study
This cruise campaign for carbonaceous aerosols has several limitations which might need to be made aware of due to the time and area coverage constraints. The presence of other light-absorption aerosol components, polluted dusts, and oil and gas drilling emissions, as well as fishery policy, may contribute to the uncertainties in the AAE model used for the BC source apportionment in this study. Firstly, the composition of aerosols and refractive index may strongly affect the AAE calculation. The source apportionment of BC for biomass burning and fossil fuel is based on the AAE two-component model which only considered BC(BB) and BC(FF) as the light absorption materials. An AAE range of 0.9–1.4 is used for pure BC from fossil fuel emissions, while it is 1.68–2.2 for biomass burning as mentioned earlier. The current AAE two-component model does not include other potential light-absorbing materials, such as mineral dust and biological particles (Pileci et al., 2021). Interestingly, two types of possible biological particles were observed during the campaign (Fig. S13, in the Supplement, Sect. 9). A similar type of biological particles was observed and identified as brochosomes in another campaign near the East China Sea (Fu et al., 2012). However, more future studies are needed to identify the types and species of biological particles and to evaluate their contributions to the light-absorption.
Secondly, based on the Cloud-Aerosol Lidar & Infrared Satellite Observation (CALIPSO) data on 15 May and 7 June when the orbit just passed over the SCS region and the Southeast Asia (Figs. S14 and S15, in the Supplement, Sect. 10), we found the presence of polluted dust in the vertical profile over the Philippines, Indonesia, Thailand and Malaysia. Long-range transport of dust may affect our measured AAE data. Thirdly, oil and natural gas drilling (Liu and Li, 2021) is active in the SCS region, and the distribution map is available online (https://www.oilmap.xyz/, last access: 31 March 2023). These activities potentially contribute to the BC emissions (Cordes et al., 2016), and these BC are similar to those of continental emitted BC from incomplete burning of oil or natural gas.
Lastly, Chinese fishery policy enacts fishing prohibition for about 3 and a half months every year in the SCS during summer, which corresponds to 1 May–16 August in the year 2021, within 12° N of our campaign region. Therefore, the cruise measurements mainly captured ship emissions from the commercial ships in the SCS whose routes are available online (https://www.marinetraffic.com/en/ais/home/centerx:116.6/centery:20.5/zoom:4, last access: 31 March 2023). The average BC mass concentrations (∼0.2 µg m−3 for BC(FF) and 0.05–0.08 µg m−3 for BC(BB) are only limited to data of about a month and the coverage area. Hence, more future measurements covering more seasons and wider areas are needed to better understand the morphology and optical properties of the carbonaceous aerosols in the SCS.
As important components of carbonaceous aerosols, BC and BrC in the marine atmosphere may exert significantly positive climatic radiative forcing through light absorption on the regional and global scales. However, quantification of their absorption potential is tremendously challenging due to little knowledge on the microphysical properties, such as morphology, particle size, and mixing state of BC or BrC in the marine region such as SCS. This ship-based study is intended to investigate the morphological and optical properties of the BC particles in the SCS during summer using a combined online aethalometer, semi-online analyzer, and offline TEM/EDS analyses. The results showed that the lognormal fitted Feret diameter distribution of the single-particle peaks at 325 nm when the ship stopped, while it peaks at 307 nm when the ship navigated. This minor difference in the size distribution could be attributed to the distinguishable air mass origins of the ship's own emissions for the former and the mixed other ship emissions and long-range transport for the latter. Furthermore, the Feret diameters of the single particles spread much more narrowly during navigation (229–2557 nm) than those of the freshly emitted particles during stop (78–2926 nm). In addition, the two types of single particles have the same median fractal dimension values (1.61) but different lacunarity values (0.53 vs. 0.59), indicating their different aging degrees. The aged BC particles are present in various mixing states (core–shell, embedded, external) with other aerosol components after long-range transport. Interestingly, a fraction of single particles were identified as tar balls with geometrical diameters of 160–420 nm which were primarily mixed with sea salt, organics, BC, and sulfate, and those tar balls were found to originate from either ship emissions or long-range transport of biomass burning.
Since the marine atmosphere is mainly subject to the influence of biomass burning and fossil fuel combustion, a two-component (BB and FF) AAE model was employed to evaluate the source contributions to the light absorption of the BC particles. The modeling results indicated that BB and FF contributed respectively to 18 %–22 % and 78 %–82 % of all the BC light absorption except for a substantial percentage of 42 % for BB (hence 58 % for FF) during the two observed significant biomass burning events. The results from trajectory calculations showed that biomass burning was predominantly from the Philippines and South East Asia before and after the summer monsoon during the cruise campaign. However, this highly simplified two-component AAE model may have substantial uncertainties in the evaluation of the source contributions when other sources of BC particles were present, and those included dust, biological materials, and oil and gas drilling emissions during the measurements. Nevertheless, this study demonstrates that emissions from commercial ships and biomass burning from Southeast Asia contribute to the enhanced light absorption of the BC particles in the SCS, especially during the crop harvest seasons before the monsoon, and the aged BC particles became more aggregated after long-range transport of air masses containing biomass burning emissions.
Data for the figures and tables of this study can be downloaded from https://doi.org/10.5281/zenodo.10546755 (Sun et al., 2024).
The supplement related to this article is available online at: https://doi.org/10.5194/acp-24-3043-2024-supplement.
JZ, CZS, and SZZ planned the cruise campaign. CZS, YYZ, BLL, MG, and XS performed the measurements. CZS performed the data analysis and wrote the original draft. CZS and DXC were responsible for funding acquisition. JZ and SZZ were responsible for funding acquisition and supervision. All authors reviewed and edited the manuscript.
The contact author has declared that none of the authors has any competing interests.
Publisher’s note: Copernicus Publications remains neutral with regard to jurisdictional claims made in the text, published maps, institutional affiliations, or any other geographical representation in this paper. While Copernicus Publications makes every effort to include appropriate place names, the final responsibility lies with the authors.
We gratefully acknowledge the NOAA Air Resources Laboratory (ARL) for the provision of the HYSPLIT transport and dispersion model and READY website (https://www.ready.noaa.gov, last access: 30 June 2023) used in this publication. We acknowledge the use of data and imagery from NASA's Fire Information for Resource Management System (FIRMS) (https://earthdata.nasa.gov/firms, last access: 30 June 2023), part of NASA's Earth Observing System Data and Information System (EOSDIS). Additional support from the crew of the vessel Tan Kah Kee is greatly acknowledged.
The Guangdong Basic and Applied Basic Research Foundation (grant nos. 2022A1515011864, 2021A1515011556), the National Natural Science Foundation of China (NSFC) (grant nos. 42175115, 42205108), the Guangdong Major Project of Basic and Applied Basic Research (grant no. 2020B0301030004), the Science and Technology Program of Guangdong Province (Science and Technology Innovation Platform Category) (grant no. 2019B121201002), and the Guangdong Province Key Laboratory for Climate Change and Natural Disaster Studies (grant no. 2020B1212060025). This study was also supported by the Southern Marine Science and Engineering Guangdong Laboratory (Zhuhai) through its South China Sea Monsoon Experiment cruise (grant no. SML2021SI1002).
This paper was edited by Alexander Laskin and reviewed by two anonymous referees.
Adachi, K., Zaizen, Y., Kajino, M., and Igarashi, Y.: Mixing state of regionally transported soot particles and the coating effect on their size and shape at a mountain site in Japan, J. Geophys. Res.-Atmos., 119, 5386–5396, https://doi.org/10.1002/2013jd020880, 2014.
Adachi, K., Sedlacek, A. J., III, Kleinman, L., Springston, S. R., Wang, J., Chand, D., Hubbe, J. M., Shilling, J. E., Onasch, T. B., Kinase, T., Sakata, K., Takahashi, Y., and Buseck, P. R.: Spherical tarball particles form through rapid chemical and physical changes of organic matter in biomass-burning smoke, P. Natl. Acad. Sci. USA, 116, 19336–19341, https://doi.org/10.1073/pnas.1900129116, 2019.
Aijjou, A., Bahatti, L., and Raihani, A.: Wind energy for shipboard electric power needs, Int. J. Adv. Comput. Sci. Appl., 9, 168–177, https://doi.org/10.30534/ijatcse/2020/2491.52020, 2020.
Alroe, J., Cravigan, L. T., Miljevic, B., Johnson, G. R., Selleck, P., Humphries, R. S., Keywood, M. D., Chambers, S. D., Williams, A. G., and Ristovski, Z. D.: Marine productivity and synoptic meteorology drive summer-time variability in Southern Ocean aerosols, Atmos. Chem. Phys., 20, 8047–8062, https://doi.org/10.5194/acp-20-8047-2020, 2020.
Andreae, M. O. and Gelencsér, A.: Black carbon or brown carbon? The nature of light-absorbing carbonaceous aerosols, Atmos. Chem. Phys., 6, 3131–3148, https://doi.org/10.5194/acp-6-3131-2006, 2006.
Ausmeel, S., Eriksson, A., Ahlberg, E., Sporre, M. K., Spanne, M., and Kristensson, A.: Ship plumes in the Baltic Sea Sulfur Emission Control Area: Chemical characterization and contribution to coastal aerosol concentrations, Atmos. Chem. Phys., 20, 9135–9151, https://doi.org/10.5194/acp-20-9135-2020, 2020.
Bao, M., Zhang, Y.-L., Cao, F., Lin, Y.-C., Wang, Y., Liu, X., Zhang, W., Fan, M., Xie, F., Cary, R., Dixon, J., and Zhou, L.: Highly time-resolved characterization of carbonaceous aerosols using a two-wavelength Sunset thermal–optical carbon analyzer, Atmos. Meas. Tech., 14, 4053–4068, https://doi.org/10.5194/amt-14-4053-2021, 2021.
Bauer, J. J., Yu, X.-Y., Cary, R., Laulainen, N., and Berkowitz, C.: Characterization of the Sunset semi-continuous carbon aerosol analyzer, J. Air Waste Manag. Assoc., 59, 826–833, https://doi.org/10.3155/1047-3289.59.7.826, 2009.
Bencs, L., Horemans, B., Buczyńska, A. J., Deutsch, F., Degraeuwe, B., Van Poppel, M., and Van Grieken, R.: Seasonality of ship emission related atmospheric pollution over coastal and open waters of the North Sea, Atmos. Environ.: X., 7, 100077, https://doi.org/10.1016/j.aeaoa.2020.100077, 2020.
Blanco-Donado, E. P.: Source identification and global implications of black carbon, Geosci. Front., 13, 101149, https://doi.org/10.1016/j.gsf.2021.101149, 2022.
Bond, T. C., Doherty, S. J., Fahey, D. W., Forster, P. M., Berntsen, T., DeAngelo, B. J., Flanner, M. G., Ghan, S., Kärcher, B., Koch, D., Kinne, S., Kondo, Y., Quinn, P. K., Sarofim, M. C., Schultz, M. G., Schulz, M., Venkataraman, C., Zhang, H., Zhang, S., Bellouin, N., Guttikunda, S. K., Hopke, P. K., Jacobson, M. Z., Kaiser, J. W., Klimont, Z., Lohmann, U., Schwarz, J. P., Shindell, D., Storelvmo, T., Warren, S. G., and Zender, C. S.: Bounding the role of black carbon in the climate system: a scientific assessment, J. Geophys. Res.-Atmos., 118, 5380–5552, https://doi.org/10.1002/jgrd.50171, 2013.
Brown, S., Minor, H., O'Brien, T., Hameed, Y., Feenstra, B., Kuebler, D., Wetherell, W., Day, R., Tun, R., Landis, E., and Rice, J.: Review of Sunset OC/EC instrument measurements during the EPA's Sunset carbon evaluation project, Atmosphere (Basel), 10, 287, https://doi.org/10.3390/atmos10050287, 2019.
Budhavant, K., Andersson, A., Holmstrand, H., Bikkina, P., Bikkina, S., Satheesh, S. K., and Gustafsson, Ö.: Enhanced light-absorption of black carbon in rainwater compared with aerosols over the Northern Indian Ocean, J. Geophys. Res.-Atmos., 125, e2019JD031246, https://doi.org/10.1029/2019jd031246, 2020.
Cai, M., Liang, B., Sun, Q., Zhou, S., Chen, X., Yuan, B., Shao, M., Tan, H., and Zhao, J.: Effects of continental emissions on cloud condensation nuclei (CCN) activity in the northern South China Sea during summertime 2018, Atmos. Chem. Phys., 20, 9153–9167, https://doi.org/10.5194/acp-20-9153-2020, 2020.
Cappa, C. D., Onasch, T. B., Massoli, P., Worsnop, D. R., Bates, T. S., Cross, E. S., Davidovits, P., Hakala, J., Hayden, K. L., Jobson, B. T., Kolesar, K. R., Lack, D. A., Lerner, B. M., Li, S.-M., Mellon, D., Nuaaman, I., Olfert, J. S., Petäjä, T., Quinn, P. K., Song, C., Subramanian, R., Williams, E. J., and Zaveri, R. A.: Radiative absorption enhancements due to the mixing state of atmospheric black carbon, Science, 337, 1078, https://doi.org/10.1126/science.1223447, 2012.
Chakrabarty, R. K., Moosmüller, H., Garro, M. A., Arnott, W. P., Walker, J., Susott, R. A., Babbitt, R. E., Wold, C. E., Lincoln, E. N., and Hao, W. M.: Emissions from the laboratory combustion of wildland fuels: particle morphology and size, J. Geophys. Res., 111, D07204, https://doi.org/10.1029/2005jd006659, 2006.
Chaubey, J. P., Moorthy, K. K., Babu, S. S., and Gogoi, M. M.: Spatio-temporal variations in aerosol properties over the oceanic regions between coastal India and Antarctica, J. Atmos. Sol. Terr. Phys., 104, 18–28, https://doi.org/10.1016/j.jastp.2013.08.004, 2013.
Chen, D., Cui, H., Zhao, Y., Yin, L., Lu, Y., and Wang, Q.: A two-year study of carbonaceous aerosols in ambient PM2.5 at a regional background site for western Yangtze River Delta, China, Atmos. Res., 183, 351–361, https://doi.org/10.1016/j.atmosres.2016.09.004, 2017.
Chen, X., Ye, C., Wang, Y., Wu, Z., Zhu, T., Zhang, F., Ding, X., Shi, Z., Zheng, Z., and Li, W.: Quantifying evolution of soot mixing state from transboundary transport of biomass burning emissions, iScience, 26, 108125, https://doi.org/10.1016/j.isci.2023.108125, 2023.
Cheng, Z., Sharma, N., Tseng, K. P., Kovarik, L., and China, S.: Direct observation and assessment of phase states of ambient and lab-generated sub-micron particles upon humidification, RSC Adv., 11, 15264–15272, https://doi.org/10.1039/d1ra02530a, 2021.
China, S., Mazzoleni, C., Gorkowski, K., Aiken, A. C., and Dubey, M. K.: Morphology and mixing state of individual freshly emitted wildfire carbonaceous particles, Nat. Commun., 4, 2122, https://doi.org/10.1038/ncomms3122, 2013.
Chylek, P., Lee, J. E., Romonosky, D. E., Gallo, F., Lou, S., Shrivastava, M., Carrico, C. M., Aiken, A. C., and Dubey, M. K.: Mie scattering captures observed optical properties of ambient biomass burning plumes assuming uniform black, brown, and organic carbon mixtures, J. Geophys. Res.-Atmos., 124, 11406–11427, https://doi.org/10.1029/2019jd031224, 2019.
Corbin, J. C., Czech, H., Massabò, D., de Mongeot, F. B., Jakobi, G., Liu, F., Lobo, P., Mennucci, C., Mensah, A. A., Orasche, J., Pieber, S. M., Prévôt, A. S. H., Stengel, B., Tay, L. L., Zanatta, M., Zimmermann, R., El Haddad, I., and Gysel, M.: Infrared-absorbing carbonaceous tar can dominate light absorption by marine-engine exhaust, Clim. Atmos. Sci., 2, 12, https://doi.org/10.1038/s41612-019-0069-5, 2019.
Cordes, E. E., Jones, D. O. B., Schlacher, T. A., Amon, D. J., Bernardino, A. F., Brooke, S., Carney, R., DeLeo, D. M., Dunlop, K. M., Escobar-Briones, E. G., Gates, A. R., Génio, L., Gobin, J., Henry, L.-A., Herrera, S., Hoyt, S., Joye, M., Kark, S., Mestre, N. C., Metaxas, A., Pfeifer, S., Sink, K., Sweetman, A. K., and Witte, U.: Environmental impacts of the deep-water oil and gas industry: a review to guide management strategies, Front. Environ. Sci., 4, 58, https://doi.org/10.3389/fenvs.2016.00058, 2016.
Dong, Z., Kang, S., Qin, D., Shao, Y., Ulbrich, S., and Qin, X.: Variability in individual particle structure and mixing states between the glacier–snowpack and atmosphere in the northeastern Tibetan Plateau, The Cryosphere, 12, 3877–3890, https://doi.org/10.5194/tc-12-3877-2018, 2018.
Drinovec, L., Močnik, G., Zotter, P., Prévôt, A. S. H., Ruckstuhl, C., Coz, E., Rupakheti, M., Sciare, J., Müller, T., Wiedensohler, A., and Hansen, A. D. A.: The “dual-spot” Aethalometer: an improved measurement of aerosol black carbon with real-time loading compensation, Atmos. Meas. Tech., 8, 1965–1979, https://doi.org/10.5194/amt-8-1965-2015, 2015.
Duarte, R. M. B. O., Gomes, J. F. P., Querol, X., Cattaneo, A., Bergmans, B., Saraga, D., Maggos, T., Di Gilio, A., Rovelli, S., and Villanueva, F.: Advanced instrumental approaches for chemical characterization of indoor particulate matter, Appl. Spectrosc. Rev., 57, 705–745, https://doi.org/10.1080/05704928.2021.2018596, 2021.
Ezani, E., Dhandapani, S., Heal, M. R., Praveena, S. M., Khan, M. F., and Ramly, Z. T. A.: Characteristics and source apportionment of black carbon (BC) in a suburban area of Klang Valley, Malaysia, Atmosphere, 12, 784, https://doi.org/10.3390/atmos12060784, 2021.
Feng, X., Wang, J., Teng, S., Xu, X., Zhu, B., Wang, J., Zhu, X., Yurkin, M. A., and Liu, C.: Can light absorption of black carbon still be enhanced by mixing with absorbing materials?, Atmos. Environ., 253, 118358, https://doi.org/10.1016/j.atmosenv.2021.118358, 2021.
Fossum, K. N., Ovadnevaite, J., Liu, D., Flynn, M., O'Dowd, C., and Ceburnis, D.: Background levels of black carbon over remote marine locations, Atmos. Res., 271, 106119, https://doi.org/10.1016/j.atmosres.2022.106119, 2022.
Fu, H., Zhang, M., Li, W., Chen, J., Wang, L., Quan, X., and Wang, W.: Morphology, composition and mixing state of individual carbonaceous aerosol in urban Shanghai, Atmos. Chem. Phys., 12, 693–707, https://doi.org/10.5194/acp-12-693-2012, 2012.
Gagne, S., Couillard, M., Gajdosechova, Z., Momenimovahed, A., Smallwood, G., Mester, Z., Thomson, K., Lobo, P., and Corbin, J. C.: Ash-decorated and ash-painted soot from residual and distillate-fuel combustion in four marine engines and one aviation engine, Environ. Sci. Technol., 55, 6584–6593, https://doi.org/10.1021/acs.est.0c07130, 2021.
Geron, C.: Carbonaceous aerosol over a Pinus taeda forest in Central North Carolina, USA, Atmos. Environ., 43, 959–969, https://doi.org/10.1016/j.atmosenv.2008.10.053, 2009.
Giglio, L., Schroeder, W., Hall, J. V., and Justice, C. O.: MODIS collection 6 active fire product user's guide revision C, University of Maryland, National Oceanic and Atmospheric Administration, 63 pp., https://modis-fire.umd.edu/files/MODIS_C6_Fire_User_Guide_C.pdf (last access: 30 June 2023), 2020.
Girach, I. A., Nair, V. S., Babu, S. S., and Nair, P. R.: Black carbon and carbon monoxide over Bay of Bengal during W_ICARB: source characteristics, Atmos. Environ., 94, 508–517, https://doi.org/10.1016/j.atmosenv.2014.05.054, 2014.
Girotto, G., China, S., Bhandari, J., Gorkowski, K., Scarnato, B. V., Capek, T., Marinoni, A., Veghte, D. P., Kulkarni, G., Aiken, A. C., Dubey, M., and Mazzoleni, C.: Fractal-like tar ball aggregates from wildfire smoke, Environ. Sci. Technol. Lett., 5, 360–365, https://doi.org/10.1021/acs.estlett.8b00229, 2018.
Hand, J. L., Malm, W. C., Laskin, A., Day, D., Lee, T., Wang, C., Carrico, C., Carrillo, J., Cowin, J. P., Collett, J., and Iedema, M. J.: Optical, physical, and chemical properties of tar balls observed during the Yosemite Aerosol Characterization Study, J. Geophys. Res., 110, D21210, https://doi.org/10.1029/2004jd005728, 2005.
Harrison, R. M.: Airborne particulate matter, Philos. Trans. R. Soc. A, 378, 20190319, https://doi.org/10.1098/rsta.2019.0319, 2020.
Helin, A., Virkkula, A., Backman, J., Pirjola, L., Sippula, O., Aakko-Saksa, P., Väätäinen, S., Mylläri, F., Järvinen, A., Bloss, M., Aurela, M., Jakobi, G., Karjalainen, P., Zimmermann, R., Jokiniemi, J., Saarikoski, S., Tissari, J., Rönkkö, T., Niemi, J. V., and Timonen, H.: Variation of absorption Ångström exponent in aerosols from different emission sources, J. Geophys. Res.-Atmos., 126, e2020JD034094, https://doi.org/10.1029/2020jd034094, 2021.
Hoffer, A., Tóth, A., Nyirő-Kósa, I., Pósfai, M., and Gelencsér, A.: Light absorption properties of laboratory-generated tar ball particles, Atmos. Chem. Phys., 16, 239–246, https://doi.org/10.5194/acp-16-239-2016, 2016.
Jiang, Y., Yang, J., Gagné, S., Chan, T. W., Thomson, K., Fofie, E., Cary, R. A., Rutherford, D., Comer, B., Swanson, J., Lin, Y., Van Rooy, P., Asa-Awuku, A., Jung, H., Barsanti, K., Karavalakis, G., Cocker, D., Durbin, T. D., Miller, J. W., and Johnson, K. C.: Sources of variance in BC mass measurements from a small marine engine: Influence of the instruments, fuels and loads, Atmos. Environ., 182, 128–137, https://doi.org/10.1016/j.atmosenv.2018.03.008, 2018.
Jung, J., Kim, Y. J., Lee, K. Y., Kawamura, K., Hu, M., and Kondo, Y.: The effects of accumulated refractory particles and the peak inert mode temperature on semi-continuous organic carbon and elemental carbon measurements during the CAREBeijing 2006 campaign, Atmos. Environ., 45, 7192–7200, https://doi.org/10.1016/j.atmosenv.2011.09.003, 2011.
Kang, H., Shang, X., Abdumutallip, M., Chen, Y., Li, L., Wang, X., Li, C., Ouyang, H., Tang, X., Wang, L., Rudich, Y., and Chen, J.: Accurate observation of black and brown carbon in atmospheric fine particles via a versatile aerosol concentration enrichment system (VACES), Sci. Total Environ., 837, 155817, https://doi.org/10.1016/j.scitotenv.2022.155817, 2022.
Karanasiou, A., Panteliadis, P., Perez, N., Minguillon, M. C., Pandolfi, M., Titos, G., Viana, M., Moreno, T., Querol, X., and Alastuey, A.: Evaluation of the Semi-Continuous OCEC analyzer performance with the EUSAAR2 protocol, Sci. Total Environ., 747, 141266, https://doi.org/10.1016/j.scitotenv.2020.141266, 2020.
Karjalainen, P., Teinila, K., Kuittinen, N., Aakko-Saksa, P., Bloss, M., Vesala, H., Pettinen, R., Saarikoski, S., Jalkanen, J. P., and Timonen, H.: Real-world particle emissions and secondary aerosol formation from a diesel oxidation catalyst and scrubber equipped ship operating with two fuels in a SECA area, Environ. Pollut., 292, 118278, https://doi.org/10.1016/j.envpol.2021.118278, 2022.
Kedia, S., Ramachandran, S., Rajesh, T. A., and Srivastava, R.: Aerosol absorption over Bay of Bengal during winter: Variability and sources, Atmos. Environ., 54, 738–745, https://doi.org/10.1016/j.atmosenv.2011.12.047, 2012.
Khan, B., Hays, M. D., Geron, C., and Jetter, J.: Differences in the OC/EC ratios that characterize ambient and source aerosols due to thermal-optical analysis, Aerosol Sci. Technol., 46, 127–137, https://doi.org/10.1080/02786826.2011.609194, 2012.
Kompalli, S. K., Babu, S. N. S., Moorthy, K. K., Satheesh, S. K., Gogoi, M. M., Nair, V. S., Jayachandran, V. N., Liu, D., Flynn, M. J., and Coe, H.: Mixing state of refractory black carbon aerosol in the South Asian outflow over the northern Indian Ocean during winter, Atmos. Chem. Phys., 21, 9173–9199, https://doi.org/10.5194/acp-21-9173-2021, 2021.
Kwak, N., Lee, H., Maeng, H., Seo, A., Lee, K., Kim, S., Lee, M., Cha, J. W., Shin, B., and Park, K.: Morphological and chemical classification of fine particles over the Yellow Sea during spring, 2015–2018, Environ. Pollut., 305, 119286, https://doi.org/10.1016/j.envpol.2022.119286, 2022.
Lack, D. A. and Cappa, C. D.: Impact of brown and clear carbon on light absorption enhancement, single scatter albedo and absorption wavelength dependence of black carbon, Atmos. Chem. Phys., 10, 4207–4220, https://doi.org/10.5194/acp-10-4207-2010, 2010.
Lack, D. A. and Corbett, J. J.: Black carbon from ships: a review of the effects of ship speed, fuel quality and exhaust gas scrubbing, Atmos. Chem. Phys., 12, 3985–4000, https://doi.org/10.5194/acp-12-3985-2012, 2012.
Laing, J. R., Jaffe, D. A., and Sedlacek, I. I. I. A. J.: Comparison of filter-based absorption measurements of biomass burning aerosol and background aerosol at the Mt. Bachelor Observatory, Aerosol Air Qual. Res., 20, 663–678, https://doi.org/10.4209/aaqr.2019.06.0298, 2020.
Lappi, M. K. and Ristimaki, J. M.: Evaluation of thermal optical analysis method of elemental carbon for marine fuel exhaust, J. Air Waste Manag. Assoc., 67, 1298–1318, https://doi.org/10.1080/10962247.2017.1335251, 2017.
Laskin, A., Laskin, J., and Nizkorodov, S. A.: Chemistry of atmospheric brown carbon, Chem. Rev., 115, 4335–4382, https://doi.org/10.1021/cr5006167, 2015.
Li, J., Zhang, Q., Wang, G., Li, J., Wu, C., Liu, L., Wang, J., Jiang, W., Li, L., Ho, K. F., and Cao, J.: Optical properties and molecular compositions of water-soluble and water-insoluble brown carbon (BrC) aerosols in northwest China, Atmos. Chem. Phys., 20, 4889–4904, https://doi.org/10.5194/acp-20-4889-2020, 2020.
Liu, J. and Li, X.: Recent advances on natural gas hydrate exploration and development in the South China Sea, Energy Fuels, 35, 7528–7552, https://doi.org/10.1021/acs.energyfuels.1c00494, 2021.
Liu, L., Zhang, J., Zhang, Y., Wang, Y., Xu, L., Yuan, Q., Liu, D., Sun, Y., Fu, P., Shi, Z., and Li, W.: Persistent residential burning-related primary organic particles during wintertime hazes in North China: insights into their aging and optical changes, Atmos. Chem. Phys., 21, 2251–2265, https://doi.org/10.5194/acp-21-2251-2021, 2021.
Liu, X., Zhu, R., Jin, B., Zu, L., Wang, Y., Wei, Y., and Zhang, R.: Emission characteristics and light absorption apportionment of carbonaceous aerosols: a tunnel test conducted in an urban with fully enclosed use of E10 petrol, Environ. Res., 216, 114701, https://doi.org/10.1016/j.envres.2022.114701, 2023.
Lu, Q., Liu, C., Zhao, D., Zeng, C., Li, J., Lu, C., Wang, J., and Zhu, B.: Atmospheric heating rate due to black carbon aerosols: Uncertainties and impact factors, Atmos. Res., 240, 104891, https://doi.org/10.1016/j.atmosres.2020.104891, 2020.
Luo, J., Zhang, Y., and Zhang, Q.: Effects of black carbon morphology on brown carbon absorption estimation: from numerical aspects, Geosci. Model Dev., 14, 2113–2126, https://doi.org/10.5194/gmd-14-2113-2021, 2021.
Luo, J., Li, Z., Zhang, C., Zhang, Q., Zhang, Y., Zhang, Y., Curci, G., and Chakrabarty, R. K.: Regional impacts of black carbon morphologies on shortwave aerosol–radiation interactions: a comparative study between the US and China, Atmos. Chem. Phys., 22, 7647–7666, https://doi.org/10.5194/acp-22-7647-2022, 2022.
Ma, Y., Zhang, X., Xin, J., Zhang, W., Wang, Z., Liu, Q., Wu, F., Wang, L., Lyu, Y., Wang, Q., and Ma, Y.: Mass and number concentration distribution of marine aerosol in the Western Pacific and the influence of continental transport, Environ. Pollut., 298, 118827, https://doi.org/10.1016/j.envpol.2022.118827, 2022.
Marple, V. A. and Olson, B. A.: Sampling and measurement using inertial, gravitational, centrifugal, and thermal techniques, in: aerosol measurement: principles, techniques, and applications, edited by: Kulkarni, P., Baron, P. A., and Willeke, K., John Wiley and Sons, Hoboken, New Jersey, USA, 129–151, https://doi.org/10.1002/9781118001684.ch8, 2011.
Matsui, H., Koike, M., Kondo, Y., Oshima, N., Moteki, N., Kanaya, Y., Takami, A., and Irwin, M.: Seasonal variations of Asian black carbon outflow to the Pacific: contribution from anthropogenic sources in China and biomass burning sources in Siberia and Southeast Asia, J. Geophys. Res.-Atmos., 118, 9948–9967, https://doi.org/10.1002/jgrd.50702, 2013.
Milinković, A., Gregorič, A., Grgičin, V. D., Vidič, S., Penezić, A., Kušan, A. C., Alempijević, S. B., Kasper-Giebl, A., and Frka, S.: Variability of black carbon aerosol concentrations and sources at a Mediterranean coastal region, Atmos. Pollut. Res., 12, 101221, https://doi.org/10.1016/j.apr.2021.101221, 2021.
Moschos, V., Gysel-Beer, M., Modini, R. L., Corbin, J. C., Massabò, D., Costa, C., Danelli, S. G., Vlachou, A., Daellenbach, K. R., Szidat, S., Prati, P., Prévôt, A. S. H., Baltensperger, U., and El Haddad, I.: Source-specific light absorption by carbonaceous components in the complex aerosol matrix from yearly filter-based measurements, Atmos. Chem. Phys., 21, 12809–12833, https://doi.org/10.5194/acp-21-12809-2021, 2021.
Neusüß, C.: Carbonaceous aerosol over the Indian Ocean: OC/EC fractions and selected specifications from size-segregated onboard samples, J. Geophys. Res., 107, INX2-30, https://doi.org/10.1029/2001jd000327, 2002.
Pabst, W. and Gregorova, E.: Characterization of particles and particle systems, ICT Prague, 122 pp., 2007.
Pang, Y., Wang, Y., Wang, Z., Zhang, Y., Liu, L., Kong, S., Liu, F., Shi, Z., and Li, W.: Quantifying the fractal dimension and morphology of individual atmospheric soot aggregates, J. Geophys. Res.-Atmos., 127, e2021JD036055, https://doi.org/10.1029/2021jd036055, 2022.
Pankratova, N. V., Belikov, I. B., Belousov, V. A., Kopeikin, V. M., Skorokhod, A. I., Shtabkin, Y. A., Malafeev, G. V., and Flint, M. V.: Concentration and isotopic composition of methane, associated gases, and black carbon over Russian Arctic Seas (shipborne measurements), Oceanology, 60, 593–602, https://doi.org/10.1134/s0001437020050197, 2021.
Park, S., Yu, G.-H., and Lee, S.: Optical absorption characteristics of brown carbon aerosols during the KORUS-AQ campaign at an urban site, Atmos. Res., 203, 16–27, https://doi.org/10.1016/j.atmosres.2017.12.002, 2018.
Peyronel, M. F., Acevedo, N. C., and Marangoni, A. G.: Structural and mechanical properties of fats and their implications for food quality, in: Chemical deterioration and physical instability of food and beverages, edited by: Skibsted, L. H., Risbo, J., and Andersen, M. L., Woodhead Publishing Limited, Abington Hall, Granta Park, Great Abington, Cambridge CB21 6AH, UK, 216–259, https://doi.org/10.1533/9781845699260.2.216, 2010.
Pileci, R. E., Modini, R. L., Bertò, M., Yuan, J., Corbin, J. C., Marinoni, A., Henzing, B., Moerman, M. M., Putaud, J. P., Spindler, G., Wehner, B., Müller, T., Tuch, T., Trentini, A., Zanatta, M., Baltensperger, U., and Gysel-Beer, M.: Comparison of co-located refractory black carbon (rBC) and elemental carbon (EC) mass concentration measurements during field campaigns at several European sites, Atmos. Meas. Tech., 14, 1379–1403, https://doi.org/10.5194/amt-14-1379-2021, 2021.
Pipal, A. S., Rohra, H., Tiwari, R., and Taneja, A.: Particle size distribution, morphometric study and mixing structure of accumulation and ultrafine aerosols emitted from indoor activities in different socioeconomic micro-environment, Atmos. Pollut. Res., 12, 101–111, https://doi.org/10.1016/j.apr.2021.02.015, 2021.
Ponczek, M., Franco, M. A., Carbone, S., Rizzo, L. V., Monteiro dos Santos, D., Morais, F. G., Duarte, A., Barbosa, H. M. J., and Artaxo, P.: Linking the chemical composition and optical properties of biomass burning aerosols in Amazonia, Environ. Sci. Atmos., 2, 252–269, https://doi.org/10.1039/d1ea00055a, 2022.
Rabha, S. and Saikia, B. K.: An environmental evaluation of carbonaceous aerosols in PM10 at micro- and nano-scale levels reveals the formation of carbon nanodots, Chemosphere, 244, 125519, https://doi.org/10.1016/j.chemosphere.2019.125519, 2020.
Retama, A., Ramos-Cerón, M., Rivera-Hernández, O., Allen, G., and Velasco, E.: Aerosol optical properties and brown carbon in Mexico City, Environ. Sci. Atmos., 2, 315–334, https://doi.org/10.1039/d2ea00006g, 2022.
Rice, S. B., Chan, C., Brown, S. C., Eschbach, P., Han, L., Ensor, D. S., Stefaniak, A. B., Bonevich, J., Vladar, A. E., Hight Walker, A. R., Zheng, J., Starnes, C., Stromberg, A., Ye, J., and Grulke, E. A.: Particle size distributions by transmission electron microscopy: an interlaboratory comparison case study, Metrologia, 50, 663–678, https://doi.org/10.1088/0026-1394/50/6/663, 2013.
Sandradewi, J., Prévôt, A. S. H., Szidat, S., Perron, N., Alfarra, M. R., Lanz, V. A., Weingartner, E., and Baltensperger, U.: Using aerosol light absorption measurements for the quantitative determination of wood burning and traffic emission contributions to particulate matter, Environ. Sci. Technol., 42, 3316–3323, https://doi.org/10.1021/es702253m, 2008.
Schindelin, J., Arganda-Carreras, I., Frise, E., Kaynig, V., Longair, M., Pietzsch, T., Preibisch, S., Rueden, C., Saalfeld, S., Schmid, B., Tinevez, J.-Y., White, D. J., Hartenstein, V., Eliceiri, K., Tomancak, P., and Cardona, A.: Fiji: an open-source platform for biological-image analysis, Nat. Methods, 9, 676–682, https://doi.org/10.1038/nmeth.2019, 2012.
Schmale, J., Baccarini, A., Thurnherr, I., Henning, S., Efraim, A., Regayre, L., Bolas, C., Hartmann, M., Welti, A., Lehtipalo, K., Aemisegger, F., Tatzelt, C., Landwehr, S., Modini, R. L., Tummon, F., Johnson, J. S., Harris, N., Schnaiter, M., Toffoli, A., Derkani, M., Bukowiecki, N., Stratmann, F., Dommen, J., Baltensperger, U., Wernli, H., Rosenfeld, D., Gysel-Beer, M., and Carslaw, K. S.: Overview of the Antarctic Circumnavigation Expedition: Study of Preindustrial-like aerosols and their climate effects (ACE-SPACE), B. Am. Meteorol. Soc., 100, 2260–2283, https://doi.org/10.1175/bams-d-18-0187.1, 2019.
Shamjad, P. M., Tripathi, S. N., Aggarwal, S. G., Mishra, S. K., Joshi, M., Khan, A., Sapra, B. K., and Ram, K.: Comparison of experimental and modeled absorption enhancement by black carbon (BC) cored polydisperse aerosols under hygroscopic conditions, Environ. Sci. Technol., 46, 8082–8089, https://doi.org/10.1021/es300295v, 2012.
Shank, L. M., Howell, S., Clarke, A. D., Freitag, S., Brekhovskikh, V., Kapustin, V., McNaughton, C., Campos, T., and Wood, R.: Organic matter and non-refractory aerosol over the remote Southeast Pacific: oceanic and combustion sources, Atmos. Chem. Phys., 12, 557–576, https://doi.org/10.5194/acp-12-557-2012, 2012.
Sharma, S., Barrie, L. A., Magnusson, E., Brattström, G., Leaitch, W. R., Steffen, A., and Landsberger, S.: A factor and trends analysis of multidecadal lower tropospheric observations of Arctic aerosol composition, black carbon, ozone, and mercury at Alert, Canada, J. Geophys. Res.-Atmos., 124, 14133–14161, https://doi.org/10.1029/2019jd030844, 2019.
Song, X., Xie, X., Qiu, B., Cao, H., Xie, S.-P., Chen, Z., and Yu, W.: Air-sea latent heat flux anomalies induced by oceanic submesoscale processes: an observational case study, Front. Mar. Sci., 9, 850207, https://doi.org/10.3389/fmars.2022.850207, 2022.
Soyam, P. S.: Black carbon aerosols over a semi-arid rain shadow location in Peninsular India: temporal variability and sources, J. Earth Syst. Sci., 130, 95, https://doi.org/10.1007/s12040-021-01610-5, 2021.
Sun, C., Adachi, K., Misawa, K., Cheung, H. C., Chou, C. C. K., and Takegawa, N.: Mixing state of black carbon particles in Asian outflow observed at a remote site in Taiwan in the spring of 2017, J. Geophys. Res.-Atmos., 125, e2020JD032526, https://doi.org/10.1029/2020jd032526, 2020.
Sun, C., Zhang, Y., Liang, B., Gao, M., Sun, X., Li, F., Ni, X., Sun, Q., Ou, H., Chen, D., Zhou, S., and Zhao, J.: Comprehensive data on meteorology, black carbon, organic carbon, elemental carbon, and aerosol morphology from the South China Sea summer expedition in 2021, Zenodo [data set], https://doi.org/10.5281/zenodo.10546755, 2024.
Sun, L., Chen, T., Jiang, Y., Zhou, Y., Sheng, L., Lin, J., Li, J., Dong, C., Wang, C., Wang, X., Zhang, Q., Wang, W., and Xue, L.: Ship emission of nitrous acid (HONO) and its impacts on the marine atmospheric oxidation chemistry, Sci. Total Environ., 735, 139355, https://doi.org/10.1016/j.scitotenv.2020.139355, 2020.
Sun, Q., Liang, B., Cai, M., Zhang, Y., Ou, H., Ni, X., Sun, X., Han, B., Deng, X., Zhou, S., and Zhao, J.: Cruise observation of the marine atmosphere and ship emissions in South China Sea: aerosol composition, sources, and the aging process, Environ. Pollut., 316, 120539, https://doi.org/10.1016/j.envpol.2022.120539, 2023.
Sun, T., Wu, C., Wu, D., Liu, B., Sun, J. Y., Mao, X., Yang, H., Deng, T., Song, L., Li, M., Li, Y. J., and Zhou, Z.: Time-resolved black carbon aerosol vertical distribution measurements using a 356-m meteorological tower in Shenzhen, Theor. Appl. Climatol., 140, 1263–1276, https://doi.org/10.1007/s00704-020-03168-6, 2020.
Taketani, F., Miyakawa, T., Takashima, H., Komazaki, Y., Pan, X., Kanaya, Y., and Inoue, J.: Shipborne observations of atmospheric black carbon aerosol particles over the Arctic Ocean, Bering Sea, and North Pacific Ocean during September 2014, J. Geophys. Res.-Atmos., 121, 1914–1921, https://doi.org/10.1002/2015jd023648, 2016.
Tóth, A., Hoffer, A., Nyirö-Kósa, I., Pósfai, M., and Gelencsér, A.: Atmospheric tar balls: aged primary droplets from biomass burning?, Atmos. Chem. Phys., 14, 6669–6675, https://doi.org/10.5194/acp-14-6669-2014, 2014.
Ueda, S., Osada, K., Hara, K., Yabuki, M., Hashihama, F., and Kanda, J.: Morphological features and mixing states of soot-containing particles in the marine boundary layer over the Indian and Southern oceans, Atmos. Chem. Phys., 18, 9207–9224, https://doi.org/10.5194/acp-18-9207-2018, 2018.
Virkkula, A.: Modeled source apportionment of black carbon particles coated with a light-scattering shell, Atmos. Meas. Tech., 14, 3707–3719, https://doi.org/10.5194/amt-14-3707-2021, 2021.
Wang, G., Chen, J., Xu, J., Yun, L., Zhang, M., Li, H., Qin, X., Deng, C., Zheng, H., Gui, H., Liu, J., and Huang, K.: Atmospheric processing at the sea-land interface over the South China Sea: secondary aerosol formation, aerosol acidity, and role of sea salts, J. Geophys. Res.-Atmos., 127, e2021JD036255, https://doi.org/10.1029/2021jd036255, 2022.
Wang, Q., Liu, H., Ye, J., Tian, J., Zhang, T., Zhang, Y., Liu, S., and Cao, J.: Estimating absorption Ångström exponent of black carbon aerosol by coupling multiwavelength absorption with chemical composition, Environ. Sci. Technol., 8, 121–127, https://doi.org/10.1021/acs.estlett.0c00829, 2020a.
Wang, Q., Liu, H., Wang, P., Dai, W., Zhang, T., Zhao, Y., Tian, J., Zhang, W., Han, Y., and Cao, J.: Optical source apportionment and radiative effect of light-absorbing carbonaceous aerosols in a tropical marine monsoon climate zone: the importance of ship emissions, Atmos. Chem. Phys., 20, 15537–15549, https://doi.org/10.5194/acp-20-15537-2020, 2020b.
Wang, Y., Liu, F., He, C., Bi, L., Cheng, T., Wang, Z., Zhang, H., Zhang, X., Shi, Z., and Li, W.: Fractal dimensions and mixing structures of soot particles during atmospheric processing, Environ. Sci. Technol., 4, 487–493, https://doi.org/10.1021/acs.estlett.7b00418, 2017.
Wang, Y. L. and Wu, C. R.: Nonstationary El Nino teleconnection on the post-summer upwelling off Vietnam, Sci. Rep., 10, 13319, https://doi.org/10.1038/s41598-020-70147-2, 2020.
Wei, X., Zhu, Y., Hu, J., Liu, C., Ge, X., Guo, S., Liu, D., Liao, H., and Wang, H.: Recent progress in impacts of mixing state on optical properties of black carbon aerosol, Curr. Pollut. Rep., 6, 380–398, https://doi.org/10.1007/s40726-020-00158-0, 2020.
Wu, D., Wu, C., Liao, B., Chen, H., Wu, M., Li, F., Tan, H., Deng, T., Li, H., Jiang, D., and Yu, J. Z.: Black carbon over the South China Sea and in various continental locations in South China, Atmos. Chem. Phys., 13, 12257–12270, https://doi.org/10.5194/acp-13-12257-2013, 2013.
Wu, H., Lattuada, M., and Morbidelli, M.: Dependence of fractal dimension of DLCA clusters on size of primary particles, Adv. Colloid Interface Sci., 195, 41–49, https://doi.org/10.1016/j.cis.2013.04.001, 2013.
Wu, Y., Liu, D., Wang, X., Li, S., Zhang, J., Qiu, H., Ding, S., Hu, K., Li, W., Tian, P., Liu, Q., Zhao, D., Ma, E., Chen, M., Xu, H., Ouyang, B., Chen, Y., Kong, S., Ge, X., and Liu, H.: Ambient marine shipping emissions determined by vessel operation mode along the East China Sea, Sci. Total Environ., 769, 144713–144721, https://doi.org/10.1016/j.scitotenv.2020.144713, 2021.
Xing, J., Bian, L., Hu, Q., Yu, J., Sun, C., and Xie, Z.: Atmospheric black carbon along a cruise path through the Arctic Ocean during the fifth Chinese Arctic Research Expedition, Atmosphere, 5, 292–306, https://doi.org/10.3390/atmos5020292, 2014.
Yan, J., Chen, L., Zhao, S., Zhang, M., Lin, Q., and Li, L.: Impact of marine and continental sources on aerosol characteristics using an on-board SPAMS over southeast sea, China, Environ. Sci. Pollut. Res., 25, 30659–30670, https://doi.org/10.1007/s11356-018-2902-5, 2018.
Yang, M., Howell, S. G., Zhuang, J., and Huebert, B. J.: Attribution of aerosol light absorption to black carbon, brown carbon, and dust in China – interpretations of atmospheric measurements during EAST-AIRE, Atmos. Chem. Phys., 9, 2035–2050, https://doi.org/10.5194/acp-9-2035-2009, 2009.
You, R., Radney, J. G., Zachariah, M. R., and Zangmeister, C. D.: Measured wavelength-dependent absorption enhancement of internally mixed black carbon with absorbing and nonabsorbing materials, Environ. Sci. Technol., 50, 7982–7990, https://doi.org/10.1021/acs.est.6b01473, 2016.
Yu, G.-H., Park, S., Shin, S.-K., Lee, K.-H., and Nam, H.-G.: Enhanced light absorption due to aerosol particles in ship plumes observed at a seashore site, Atmos. Pollut. Res., 9, 1177–1183, https://doi.org/10.1016/j.apr.2018.05.005, 2018.
Yus-Díez, J., Bernardoni, V., Močnik, G., Alastuey, A., Ciniglia, D., Ivančič, M., Querol, X., Perez, N., Reche, C., Rigler, M., Vecchi, R., Valentini, S., and Pandolfi, M.: Determination of the multiple-scattering correction factor and its cross-sensitivity to scattering and wavelength dependence for different AE33 Aethalometer filter tapes: a multi-instrumental approach, Atmos. Meas. Tech., 14, 6335–6355, https://doi.org/10.5194/amt-14-6335-2021, 2021.
Zefirov, V. V., Elmanovich, I. V., Levin, E. E., Abramchuk, S. S., Kharitonova, E. P., Khokhlov, A. A., Kondratenko, M. S., and Gallyamov, M. O.: Synthesis of manganese oxide electrocatalysts in supercritical carbon dioxide, J. Mater. Sci., 53, 9449–9462, https://doi.org/10.1007/s10853-018-2242-3, 2018.
Zhang, K. M., Allen, G., Yang, B., Chen, G., Gu, J., Schwab, J., Felton, D., and Rattigan, O.: Joint measurements of PM2.5 and light-absorptive PM in woodsmoke-dominated ambient and plume environments, Atmos. Chem. Phys., 17, 11441–11452, https://doi.org/10.5194/acp-17-11441-2017, 2017.
Zhang, X., Trzepla, K., White, W., Raffuse, S., and Hyslop, N. P.: Intercomparison of thermal–optical carbon measurements by Sunset and Desert Research Institute (DRI) analyzers using the IMPROVE_A protocol, Atmos. Meas. Tech., 14, 3217–3231, https://doi.org/10.5194/amt-14-3217-2021, 2021.
Zhao, J., Zhang, Y., Yang, Z., Liu, Y., Peng, S., Hong, N., Hu, J., Wang, T., and Mao, H.: A comprehensive study of particulate and gaseous emissions characterization from an ocean-going cargo vessel under different operating conditions, Atmos. Environ., 223, 117286, https://doi.org/10.1016/j.atmosenv.2020.117286, 2020.
Zhu, J., Crozier, P. A., and Anderson, J. R.: Characterization of light-absorbing carbon particles at three altitudes in East Asian outflow by transmission electron microscopy, Atmos. Chem. Phys., 13, 6359–6371, https://doi.org/10.5194/acp-13-6359-2013, 2013.
Zotter, P., Herich, H., Gysel, M., El-Haddad, I., Zhang, Y., Močnik, G., Hüglin, C., Baltensperger, U., Szidat, S., and Prévôt, A. S. H.: Evaluation of the absorption Ångström exponents for traffic and wood burning in the Aethalometer-based source apportionment using radiocarbon measurements of ambient aerosol, Atmos. Chem. Phys., 17, 4229–4249, https://doi.org/10.5194/acp-17-4229-2017, 2017.