the Creative Commons Attribution 4.0 License.
the Creative Commons Attribution 4.0 License.
 | 05 Mar 2024
Tropical tropospheric aerosol sources and chemical composition observed at high altitude in the Bolivian Andes
C. Isabel Moreno
Radovan Krejci
Jean-Luc Jaffrezo
Gaëlle Uzu
Andrés Alastuey
Marcos F. Andrade
Valeria Mardóñez
Alkuin Maximilian Koenig
Diego Aliaga
Claudia Mohr
Laura Ticona
Fernando Velarde
Luis Blacutt
Ricardo Forno
David N. Whiteman
Alfred Wiedensohler
Patrick Ginot
Paolo Laj
The chemical composition of PM10 and non-overlapping PM2.5 was studied at the summit of Mt. Chacaltaya (5380 m a.s.l., lat. −16.346950°, long. −68.128250°) providing a unique long-term record spanning from December 2011 to March 2020. The chemical composition of aerosol at the Chacaltaya Global Atmosphere Watch (GAW) site is representative of the regional background, seasonally affected by biomass burning practices and by nearby anthropogenic emissions from the metropolitan area of La Paz–El Alto. Concentration levels are clearly influenced by seasons with minima occurring during the wet season (December to March) and maxima occurring during the dry and transition seasons (April to November). Ions, total carbon (EC + OC), and saccharide interquartile ranges for concentrations are 558–1785, 384–1120, and 4.3–25.5 ng m−3 for bulk PM10 and 917–2308, 519–1175, and 3.9–24.1 ng m−3 for PM2.5, respectively, with most of the aerosol seemingly present in the PM2.5 fraction. Such concentrations are overall lower compared to other high-altitude stations around the globe but higher than Amazonian remote sites (except for OC). For PM10, there is dominance of insoluble mineral matter (33 %–56 % of the mass), organic matter (7 %–34 %), and secondary inorganic aerosol (15 %–26 %). Chemical composition profiles were identified for different origins: EC, NO, NH, glucose, and C2O for the nearby urban and rural areas; OC, EC, NO, K+, acetate, formate, levoglucosan, and some F− and Br− for biomass burning; MeSO, Na+, Mg2+, K+, and Ca2+ for aged marine emissions from the Pacific Ocean; arabitol, mannitol, and glucose for biogenic emissions; Na+, Ca2+, Mg2+, and K+ for soil dust; and SO, F−, and some Cl− for volcanism. Regional biomass burning practices influence the soluble fraction of the aerosol between June and November. The organic fraction is present all year round and has both anthropogenic (biomass burning and other combustion sources) and natural (primary and secondary biogenic emissions) origins, with the mass ratio being practically constant all year round (10.5 ± 5.7, IQR 8.1–13.3). Peruvian volcanism has dominated the SO concentration since 2014, though it presents strong temporal variability due to the intermittence of the sources and seasonal changes in the transport patterns. These measurements represent some of the first long-term observations of aerosol chemical composition at a continental high-altitude site in the tropical Southern Hemisphere.
- Article
(4654 KB) - Full-text XML
-
Supplement
(2789 KB) - BibTeX
- EndNote


Aerosol particles are important climate forcers. Recent estimates suggest that the impact of these aerosols on global climate falls within the range of −2.0 to −0.6 W m−2 (Forster et al., 2021). This impact, known as aerosol effective radiative forcing, is characterized by a high level of spatial and temporal heterogeneity (Szopa et al., 2021). Aerosol chemical composition, being key to determine climate-relevant properties of aerosol particles such as hygroscopicity and refractive index, has recently been listed as an aerosol essential climate variable, as defined by the Global Climate Observing System (GCOS) of the Atmosphere Ocean Panel on Climate (WMO, 2022). While aerosol chemical composition can be measured in near-real time via mass spectrometry techniques or approximated through a combination of indirect observations, actual determination by chemical analysis of aerosol filters remains the simplest solution for providing precise and quasi-exhaustive knowledge of aerosol constituents (EMEP Manual for Sampling and Analysis, 2020).
In recent decades, great progress has been made in long-term monitoring of aerosol properties, but many temporal and spatial observational gaps remain. South America is one of the regions with under-sampled essential climate variables. In this region, aerosol chemical composition is available for urban and suburban locations (e.g., Jorquera and Barraza, 2013; Barbosa, 2014; Jorquera, 2008; Olson et al., 2021; Mardoñez et al., 2023; Custodio et al., 2019) and for intensive measurement campaigns in the Brazilian Amazonia (Artaxo et al., 2009; Martin et al., 2010, 2017, and references therein). For urban areas, the traffic-associated markers are unsurprisingly dominant and each location presents its specificities. However, it is noteworthy that emissions associated with agricultural practices exert a significant influence at a continental scale, influencing the air quality in urban areas located far from the sources (e.g., Longo et al., 2009; Custodio et al., 2019; Martin et al., 2010; Giglio et al., 2013; Mardoñez et al., 2023; Estellano et al., 2008). The studies in Amazonia permitted characterization of biomass combustion sources (e.g., Schkolnik et al., 2005; Fuzzi et al., 2007; Kundu et al., 2010b, a) and natural emissions of the Amazonian environment (e.g., Graham, 2002; Elbert et al., 2007; Claeys et al., 2004).
For the Andean region, measurements of background aerosol chemical composition are in general lacking. However, a small number of studies of certain sources of atmospheric aerosols at high altitude are available. Some of them are based on the analysis of ice cores (Correia et al., 2003; de Angelis et al., 2003; Brugger et al., 2019; Hong et al., 2004; Magalhães et al., 2019), but these results have not been translated into an equivalent atmospheric chemical composition. Other studies focus on the characterization of atmospheric aerosols (e.g., Adams et al., 1977; Bianchi et al., 2021; Scholz et al., 2023; Chauvigné et al., 2019; Van Espen and Adams, 1983) during limited time periods.
The objective of this work is to study aerosol chemical composition based on multiyear observations at the Chacaltaya Global Atmosphere Watch (GAW) station. The aerosol at Chacaltaya exhibits influences from different provenances, including planetary boundary layer air masses influenced by the metropolitan area of La Paz and El Alto, as well as long-range-transported air masses (Aliaga et al., 2021; Wiedensohler et al., 2018; Chauvigné et al., 2019). It is interesting to note that more than 4 decades ago it was considered a background site with very little anthropogenic influence (Adams et al., 1977; Van Espen and Adams, 1983; Cautreels et al., 1977; Adams et al., 1983). Our study presents the chemical composition of PM10 and PM2.5 for major soluble ions, saccharides, and EC–OC obtained at this site between December 2011 and March 2020. This 9-year record is analyzed in light of possible source regions and transport characteristics, providing unique information on the main drivers influencing the regional aerosol composition of the Altiplano and adjacent Andes.
With this analysis, we will complement some knowledge gaps for the Andean region, particularly regarding the seasonality and the source identification of the aerosol observed at high altitude. We will also situate the Chacaltaya observations in a global and regional context. Additionally, two specific cases are included. The first focuses on the influence of volcanism on the site. The second includes a short-term study of mass and mass closure at this site.
2.1 Location and climatology
The Chacaltaya GAW station (lat. −16.350500°, long. −68.131389°, 5240 m a.s.l.) is currently the highest site in the GAW network. It is located some 1400 m above the Altiplano high plateau (mean elevation of about 3750 m a.s.l.), bordered to the west by the Cordillera Occidental, which includes a volcanic arc, and to the east by the Cordillera Oriental. Mt. Chacaltaya lies within the northern segment of the Cordillera Oriental (called the Cordillera Real), which trends SE–NW. The semi-arid Altiplano incorporates Lake Titicaca. Mt. Chacaltaya is located about 40 km from the nearest part of the lake and about 15 km north of the La Paz–El Alto conurbation. El Alto (La Paz) is a fast-growing city, with its population having increased from approximately 60 000 (595 000) inhabitants in 1976 to 921 000 (782 000) inhabitants in 2012 (Censos de población y vivienda, 2021). In the Peruvian branch of the Cordillera Occidental there are two active volcanoes: Sabancaya (5976 m a.s.l.) and Ubinas (5672 m a.s.l.). Beyond the Cordillera Real, there is a lower and parallel mountain belt known as the Subandes (paramo and montane forest locally referred to as the Yungas), and beyond them are the Amazonian lowlands. The valleys of the Cordillera Real and the Subandes are often steep, forested, and sparsely populated.
General atmospheric circulation shows a pronounced annual cycle of changing dry and wet seasons, typical of the tropical zone. Regional climatological information is well described in other works (Espinoza et al., 2020, and references therein). At Chacaltaya station, the mean atmospheric pressure is 534 hPa, which is about half of the value at sea level; the mean temperature is around 0 °C, and annual precipitation (mostly solid) is 865 mm in water equivalent depth (Perry et al., 2017). Four seasons are defined for this region based on the circulation and precipitation changes: (1) the wet season (monsoon-like season) from December to March, bringing 65 %–70 % of the annual precipitation to Chacaltaya; (2) the wet-to-dry transition season in April; (3) the dry season from May to August, with long periods without precipitation that can span more than 40 consecutive days (Andrade et al., 2017); and finally (4) the dry-to-wet transition season from September to November used to mark the onset of the rainy season that has become quite dry over the last decades (Espinoza et al., 2019). During the wet season, air masses predominantly originate from the lowlands situated northeast of the Altiplano plateau (Fig. 1). Before reaching Chacaltaya, these air masses are typically funneled through the nearby valleys to the north, resulting in a prevailing northerly influence on the short-range transport (Aliaga et al., 2021; Chauvigné et al., 2019; Perry et al., 2017; Vimeux et al., 2005). In the dry and dry-to-wet seasons, winds with a westerly component blow over the Altiplano towards the station, bringing mineral dust to Chacaltaya station along with biomass burning tracers (Chauvigné et al., 2019). Biomass burning emissions are transported to the Altiplano through the Subandes valleys east of the Cordillera Real (Bourgeois et al., 2015; Magalhães et al., 2019). On an annual basis, less than 10 % of air masses arrive in the region directly from the Pacific Ocean (Chauvigné et al., 2019; Perry et al., 2017).
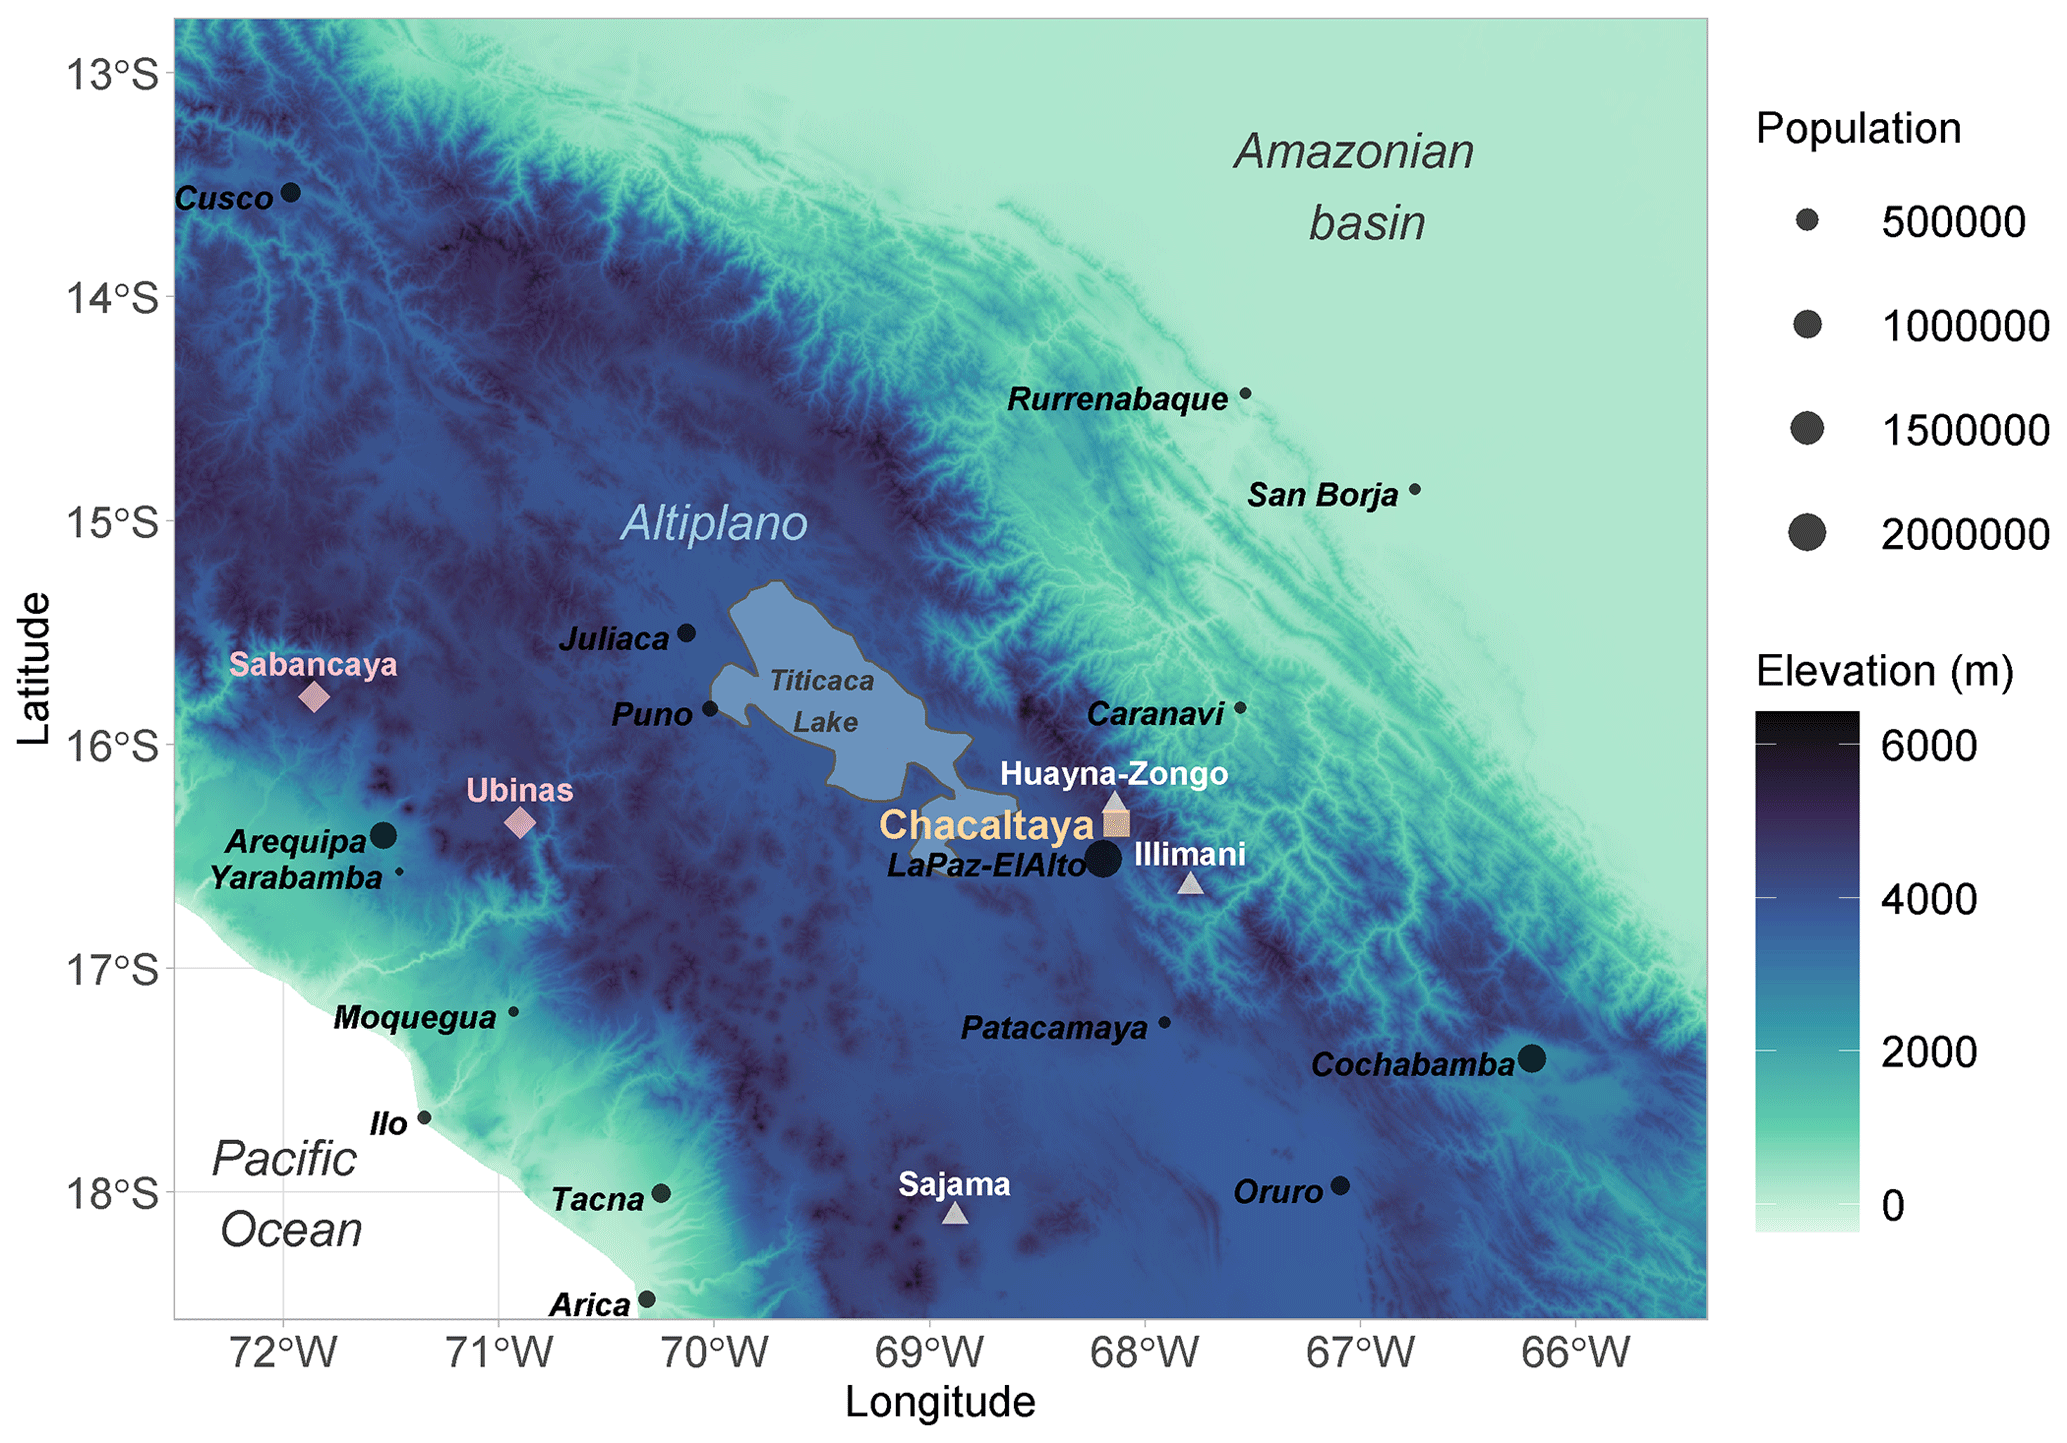
Figure 1Location map. The square is the Chacaltaya GAW station, rhombuses are currently active volcanoes, triangles are other mountain sites where ice core studies were performed, and circles are urban sites with populations higher than 40 000 inhabitants (estimates for 2020 from World Population Review, 2022). Elevation is from the NOAA National Centers for Environmental Information (2022), and Lake Titicaca shape is from Natural Earth (2022).
Chacaltaya station is frequently influenced by the atmospheric boundary layer (Collaud Coen et al., 2018). During daytime, the Altiplano is subjected to intense solar radiation heating (Zaratti and Forno, 2003), resulting in a highly convective planetary boundary layer (PBL). The diurnal development of the PBL routinely brings air pollutants from the nearby conurbation to Chacaltaya (Wiedensohler et al., 2018; Chauvigné et al., 2019) all year round and without a clear seasonality (around 24 % of the air masses have a PBL influence independently of the long-range origin, Aliaga et al., 2021). After sunset, the station is frequently situated within a residual layer (RL) (Fig. S2), which acts as a barrier, trapping pollutants and keeping them confined until late in the evening. Purely free-tropospheric (FT) intrusions have been observed for some very short time periods during the night (Scholz et al., 2023; Zha et al., 2023).
2.2 Aerosol sampling
Aerosol samples were collected on Pallflex pre-baked (at 500–550 °C) quartz filters (Ø = 150 mm) using a high-volume sampler (HiVol) that was installed in a small concrete hut at the northwestern ridge of Mt. Chacaltaya some 120 m above the main station building (5380 m a.s.l., lat. −16.346950°, long. −68.128250°, Fig. S1 in the Supplement), with few exceptions (very few samples were taken at the main observatory). The site is accessible only by foot from the main observatory. This HiVol consisted of a DIGITEL HVS DPM10/30/00 inlet with interchangeable impactor plates for 10 and 2.5 µm aerodynamical sizes coupled to an Elmo-Rietschle G-BH7 vacuum pump, regulated to work at a nominal flow rate of 30 ± 6 m3 h−1 in ambient conditions. The volume of sampled air was obtained from readings of a Honeywell Elster Quantometer QA at the start and end of the sampling period. Note that given the low atmospheric pressure at Chacaltaya, the sampled volume almost doubles (1.89) the equivalent sampled volume at sea level. Each filter collected was folded, then wrapped in aluminum foil, sealed in a polyethylene plastic bag (sandwich Ziploc bag), and kept at −10 °C prior to shipping to the Institute des Géosciences de l'Environnement (IGE, Grenoble) where the water-soluble fractions (ions and sugars) and EC–OC were analyzed. Samples were sent once a year to the IGE and analyzed up to 3 years after the sample was taken. Except during transportation, filters were stored at −18 °C.
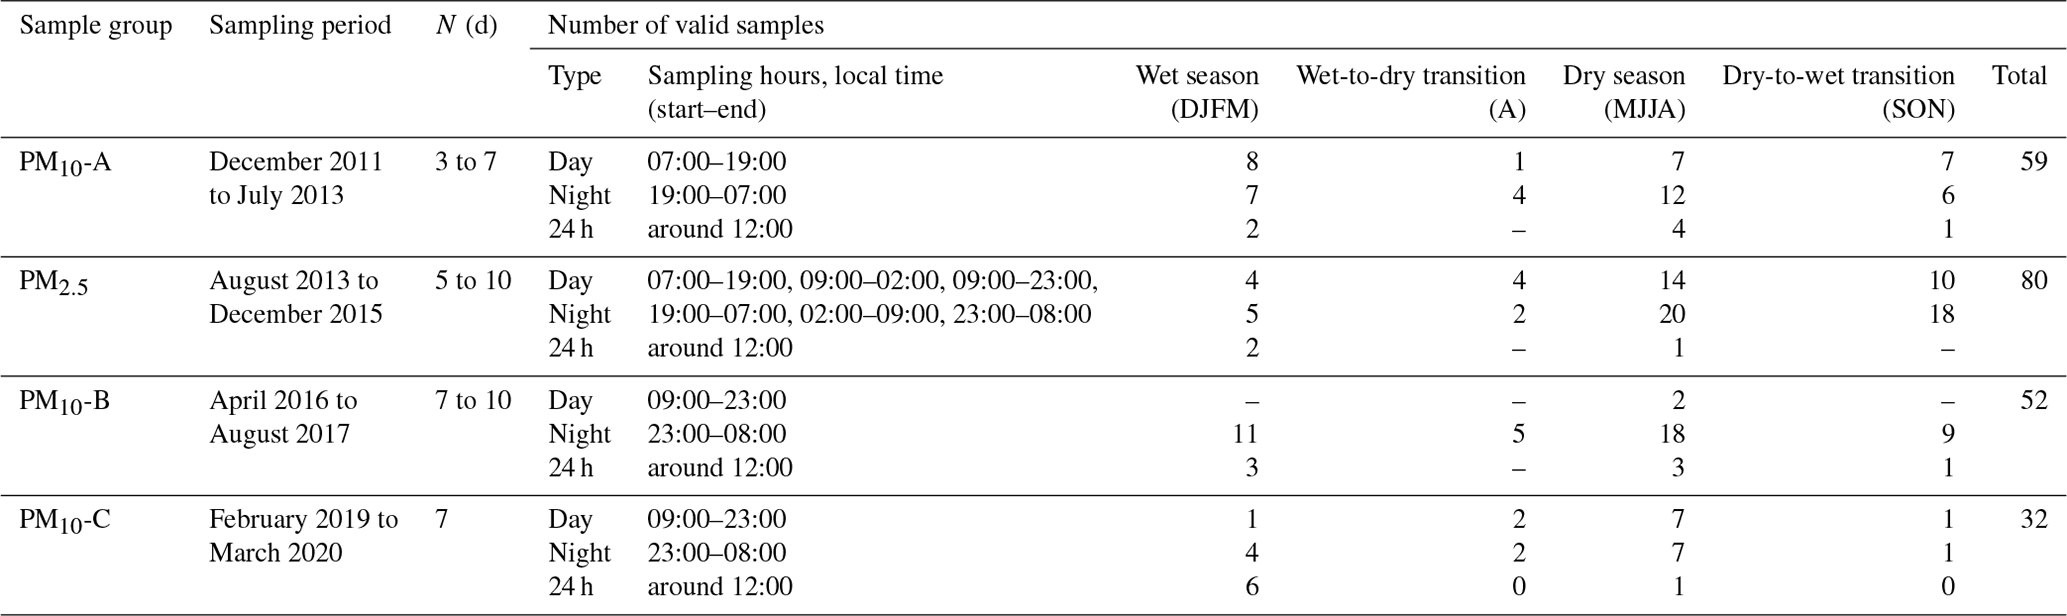
The vacuum pump was controlled by a timer to sequentially obtain diurnal and nocturnal samples, and it ran for several consecutive days in order to accumulate enough mass for the analysis. When the timer was badly set, samples could still be used as 24 h samples. Sampling periods shorter than 24 h in total caused several species to fall below the quantification limit, especially during the core of the wet season. Therefore, later in the experiment, sampling periods of at least 7 d were preferred, although some samples extended up to 10 d when it was impossible to access the hut due to bad weather. The night and daytime sampling was tested for several split times in the hope of capturing purely lower free-tropospheric air, which finally proved unsuccessful (as seen in Table S7). Once the diurnal city influence was clearly identified at Chacaltaya (Wiedensohler et al., 2018), nighttime sampling (23:00 to 08:00) was preferred in order to try to better characterize regional aerosol characteristics, minimizing the city influence. Details of the sampling are presented in Table 1.
Table 1Sampling characteristics for high-volume samples at Chacaltaya station and the number of samples per season. PM10 was divided into three batches (A, B, C) following important gap periods. N stands for the number of consecutive days for sampling (intermittently for day and night samples). Sampling time (start, end, and duration) is indicated in hours and minutes. Local time (BOT) corresponds to UTC−4.
Until 1 July 2016, the inlet lacked an inner water collection system (Fig. S1). As a result, during the wet season, several filters presented marks of water runoff or were drenched. These samples were not analyzed and this led to under-sampling of the rainy season, particularly January. No vaseline was used on the impactor plate, and therefore the samples may have had an influence of particles bouncing off, especially prior to the installation of the inner water collection system, which also acts as a barrier for it.
The HiVol sampler worked from December 2011 until March 2020, with PM10 samples not overlapping with PM2.5. Overall, sampling logistics are challenging and there are five gaps in the dataset that can be gathered into three groups: (1) gaps due to wet samples, difficult conditions to access the sampling hut due to snowfall, and/or lightning producing power outages at the sampling hut (December 2013 to April 2014, December 2014 to January 2015, and January 2016 to April 2016); (2) a gap due to a broken-down flowmeter (August 2017 to December 2018); and (3) a gap due to electric line maintenance followed by a period of social unrest that made it impossible to access the station (September 2019 to January 2020). The data series ended in March 2020 due to the COVID-19 lockdown and the theft of the pump while the station remained closed.
In total, 67 field blanks and 242 samples were collected (aside from those lost due to drenching), from which 6 samples were excluded from the analysis because the flow was too high (> 36 m3 h−1) and 13 because of specific events (San Juan bonfire festivity) or if the sampled volume was small (< 300 m3). Some of the latter were helpful as study cases for particular conditions or events but are not presented here. The remaining 223 valid samples are detailed in Table 1. The number of field blanks is very large, which is essential in order to achieve good contamination control on the data.
2.3 Mass and elemental composition
For nine PM10 samples (taken every 2 months from April 2016 to August 2017), additional analyses were performed at IDAEA (Spain). Gravimetric concentrations of particulate matter were obtained by weighing the filters, prior to sampling and post-sampling, after 48h stabilization at 20 °C and 50 % relative humidity. After gravimetric analysis the concentrations of major and trace elements in particulate matter were determined by following the methodology described elsewhere (Querol et al., 2001; Rodríguez et al., 2011; Ripoll et al., 2015). In short, a fraction from each filter was fully acid-digested using an HNO3 : HF : HClO4 mixture. The acidic solution obtained was analyzed by inductively coupled plasma atomic emission spectrometry (ICP-AES) and ICP–mass spectrometry (ICP-MS) for the determination of major (Al, Ca, Cu, Fe, K, Mg, Mn, Na, P, and S) and trace elements (Li, Be, Sc, Ti, V, Cr, Mn, Co, Ni, Cu, Zn, Ga, Ge, As, Se, Rb, Sr, Y, Zr, Nb, Mo, Cd, Sn, Sb, Cs, Ba, REE, W, Ti, Pb, Bi, Th, and U), respectively. Two samples were discarded due to instrumental problems (power outage, filter badly set).
The elemental composition was used to calculate the mineral matter (MM) contribution to the samples using Eq. (1):
where SiO2 was estimated from Al and CO from Ca (Alastuey et al., 2016).
2.4 Ions and carbonaceous matter
Samples were analyzed for their content of soluble ions, elemental and organic carbon, and sugar derivatives using subsampled fractions of the collection filters. Carbonaceous matter was analyzed using a thermo-optical method on a Sunset Lab analyzer (Birch and Cary, 1996) as described by Aymoz et al. (2007). Carbonaceous matter is subdivided in organic carbon (OC), which is the volatile and non-light-absorbing fraction, and elementary carbon (EC), which is optically absorptive, using the EUSAAR2 protocol (Cavalli et al., 2010). For the analyses of ions and sugars, filter punches (typically of about 10 cm2) were first extracted into ultrapure water for 20 min in a vortex shaker and then filtered using a 0.22 µm Acrodisc filter. Soluble anions (F−, Cl−, Br−, NO, SO) and cations (Na+, Li+, NH, K+, Mg2+, Ca2+) were analyzed by ionic chromatography (IC, Thermo Fisher ICS 3000) equipped with AS/AG 11HC and CS/CG 12A columns for anion and cation analyses, respectively. Methanesulfonate (MeSO) and carboxylic acids were also quantified in the same anionic run (Jaffrezo et al., 1998).
Anhydrosugar, sugar alcohol, and primary saccharide analyses were achieved using an HPLC with pulsed amperometric detection. A first set of equipment was used until March 2016, consisting of a Dionex DX500 equipped with a three-column Metrosep (Carb 1-Guard + A Supp 15–150 + Carb 1–150), the analytical run being isocratic with 70 mM sodium hydroxide eluent, followed by a gradient cleaning step with a 120 mM NaOH eluent. This analytical technique enables detection of anhydrous saccharides (levoglucosan and its stereoisomers mannosan and galactosan), polyols (arabitol, sorbitol, mannitol), and glucose. A second set of equipment was used after this date, with a Thermo-Fisher ICS 5000+ HPLC equipped with a 4 mm diameter Metrosep Carb 2 × 150 mm column and 50 mm pre-column. The analytical run is isocratic with 15 % of an eluent of sodium hydroxide (200 mM) and sodium acetate (4 mM) and 85 % water at 1 mL min−1 (Samake et al., 2019). The blank value was subtracted from the concentrations for both ions and sugars. Detection and quantification limits are presented in Table S1 in the Supplement.
Further chemical species were determined with IC or HPLC-PAD. However, acetate, pyruvate, NO, and sorbitol were excluded from the database due to experimental uncertainty and possible artifacts. From 2015 onwards, aerosol concentrations of inositol, glycerol, erythritol, xylitol, threalose, and rhamnose were also obtained, but results are not included here due to the incompleteness of the data series and because for sorbitol, xylitol, and rhamnose, most of the values were below the quantification limit. Formate, F−, Cl−, and NO of PM10-C were excluded from the analysis because, for this particular batch, the filters were analyzed 3 years after the sampling took place and acidic losses (Witz et al., 1990; Ashbaugh and Eldred, 2004) seem to have occurred.
2.5 Statistical analysis
Concentration measurements are not distributed normally and there are some outliers for individual species in certain samples. Therefore, we used nonparametric statistical methods in order to describe the datasets. The strength of the relationship between species concentrations was evaluated with the Kendall rank correlation method (τ) instead of the typical Pearson's coefficient to avoid outliers skewing the relationship. Comparison of average values between two datasets was made with the Wilcoxon rank-sum test. Statistical significance was set at p<0.05 unless otherwise indicated. The median is a better statistic to describe our data, and hence the concentrations are reported as the median () ± standard deviation (σ) in the paper or by their interquartile range (IQR). However, most of the literature reports mean average concentration, and therefore we will use it in the comparative figures. Mean and median concentrations and standard deviation for all species can be found in the Supplement. In order to find a structure in the seasonality patterns, the species were grouped by two clustering methods: k-means and hierarchical clustering (Govender and Sivakumar, 2020; Abdalla, 2022). For both cases, the variable to be analyzed was the monthly median concentration based on the Euclidean distance. The hierarchical clustering was made using the Ward method (Govender and Sivakumar, 2020, and references therein).
2.6 Air mass origin
HYSPLITv 4.8 (Hybrid Single-Particle Lagrangian Integrated Trajectory, Stein et al., 2015) back trajectories were used to assess the origin of the air masses for each sample collected. 4 d hourly (96) back trajectories were obtained for each sample without taking into account regional precipitation data. Only the periods when the high-volume sampler was working were selected (e.g., removing power outage periods). This produced on average 67 ± 38 air mass back trajectories per sample for PM2.5 and 94 ± 47 for PM10.
Previous studies at this site used HYSPLIT back trajectories based on the WRF model nested in three domains down to 1 km resolution, with ERA-interim data as boundary conditions (Chauvigné et al., 2019; Koenig et al., 2021). Nevertheless, this high-resolution dataset spans only until September 2016, and therefore a new set of back trajectories covering our entire sampling period was obtained. The new back-trajectory dataset was based on ERA-5 reanalysis, which has a ∼ 30 km horizontal resolution. The starting point of the back trajectory was set at 1500 m a.g.l. (of the ERA-5 defined topography), which corresponds to 528 hPa in the pixel containing the station coordinates. Selection of this initial pixel was done to overcome the influence of the coarse topography of the reanalysis data. This choice, however, produces a long-range biased back trajectory due to the higher wind speed at upper levels. Moreover, the difference in the horizontal resolution (1 km vs ∼ 30 km) and the very complex topography of this region result in the ERA-5 back trajectories missing some transport features in the short range (for instance, funneling of the winds north of the station). In spite of this, there is overall agreement of both back-trajectory results at an annual scale (Fig. S14).
Being aware of all this, we used the ERA-5 back trajectories for the study of volcanism origin in our record (Sect. 3.5). We plotted each sample on a polar grid centered on Chacaltaya. We then counted for each cell of the polar grid the number of hours that each trajectory passed over it, producing a higher density of points for the most common pathways followed by the air masses (as in Koenig et al., 2021), and then classified the samples based on their dominant air mass origins.
2.7 Source apportionment
Source apportionment was performed with the software EPA PMF v.5.0.14 following the recommendations of Belis et al. (2019). A total of 15 species were used: OC, EC, C2O, MeSO, SO, NH, Br−, Na+, K+, Mg2+, Ca2+, levoglucosan, arabitol, mannitol, and glucose. Organic carbon is adjusted for the carbon contribution of organic species using Eq. (2). Nitrate, Cl−, and F− were not used because they are grouped into a factor that only represents their absence in batch PM10-C.
Given the characteristics of our sampling schedule and the high altitude, the measured species present a low range of concentrations. Plus, they are quite mixed during transport, making general variability low and colinearity high. Complete information on the source apportionment setup can be found in the Supplement.
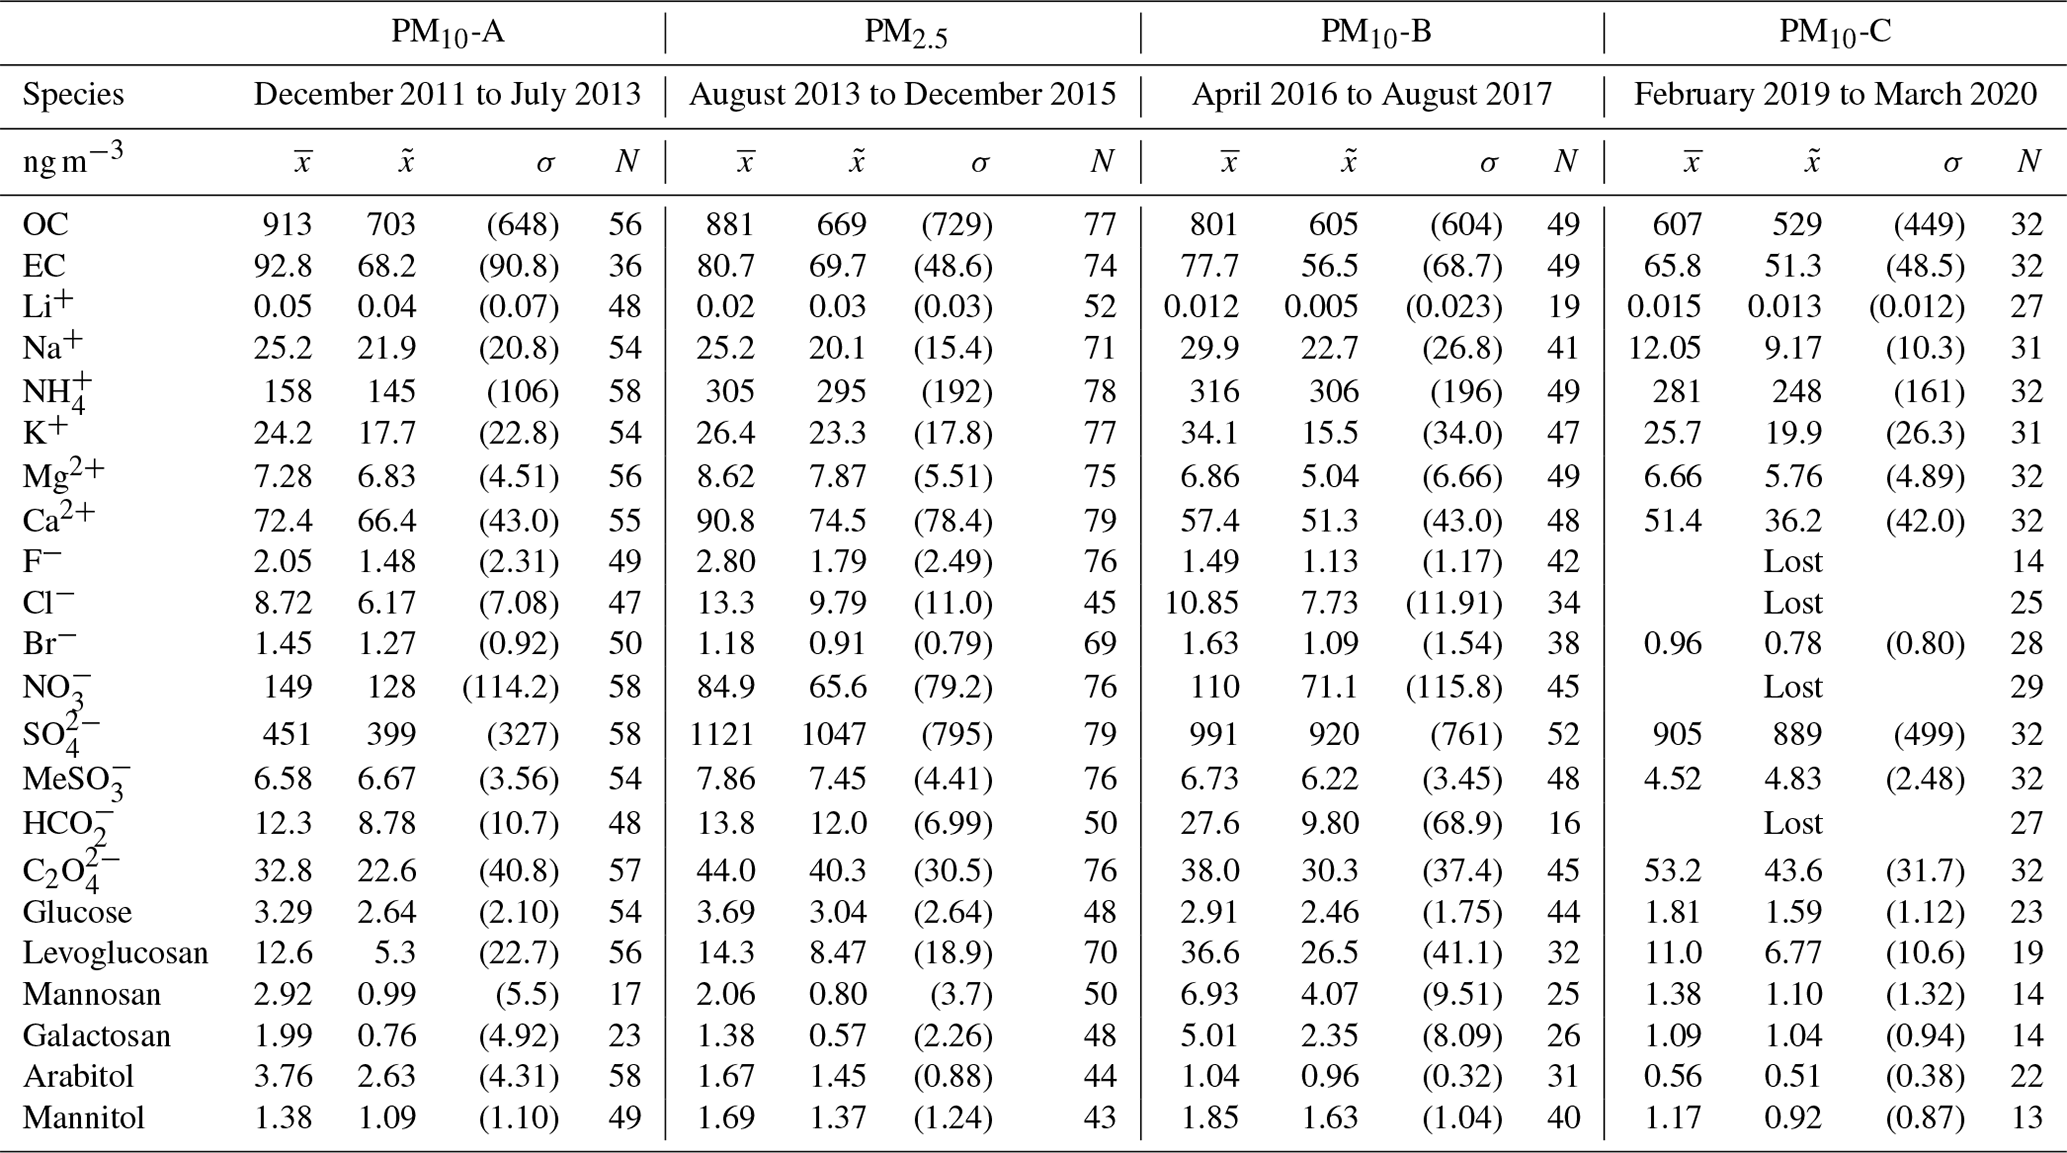
Mass concentrations were transformed to standard cubic meters (1013 hPa, 0 °C) for all the sites used in this work (ambient concentrations in the Supplement). Concentrations are reported by pooling day, night, and 24 h samples (Table 2) because day and nighttime concentrations were statistically similar for the majority of the species (Table S7). Although PM2.5 and PM10 measurements were not simultaneous, we have compared the average mass concentrations for major species considering that the two fractions were sampled during long enough periods (> 1 year). For the three PM10 groups, there was variability from group to group and season to season, indicating highly variable environmental controls. Nevertheless, concentrations in PM10 and PM2.5 were statistically similar for most of the species, particularly in the wet season (DJFM). This hints at a predominant concentration of most species in the PM2.5 fraction, long-range transport of small particles, less emission of coarse material in the wet months, and in some cases co-emitting or co-located sources.
Table 2Bulk mass concentration (ng m−3) of EC, OC, and species measured in Mt. Chacaltaya aerosol. The mean (σ), median (), standard deviation (σ), and number of samples above the quantification limit (N) are reported. Volume is measured in standard cubic meters (1013 hPa, 0 °C). Data segregated by seasons and also in ambient conditions can be found in the Supplement.
3.1 General composition of particulate matter and comparison to other sites
3.1.1 Dominant ions and carbonaceous species
PM10 and PM2.5 samples were collected during non-overlapping periods. Mass concentrations determined at Chacaltaya for ions, total carbon (EC + OC), and saccharides present an interquartile range of 917 to 2308, 519 to 1175, and 3.9 to 24.1 ng m−3 for PM2.5, respectively, and 558 to 1785, 384 to 1120, and 4.3 to 25.5 ng m−3 for bulk PM10. Chacaltaya PM10 is compared to other available high-altitude sites (Northern Hemisphere) and other selected sites in South America listed in Table 3 and presented in Fig. 2.
Table 3Sites used in the comparison in Figs. 2 and 3. The ABL-TopoIndex classifies high-altitude sites according to the influence of the atmospheric boundary layer on them (the lower the value, the less influenced by the convective planetary boundary layer; Collaud Coen et al., 2018), which is available for some of the sites.
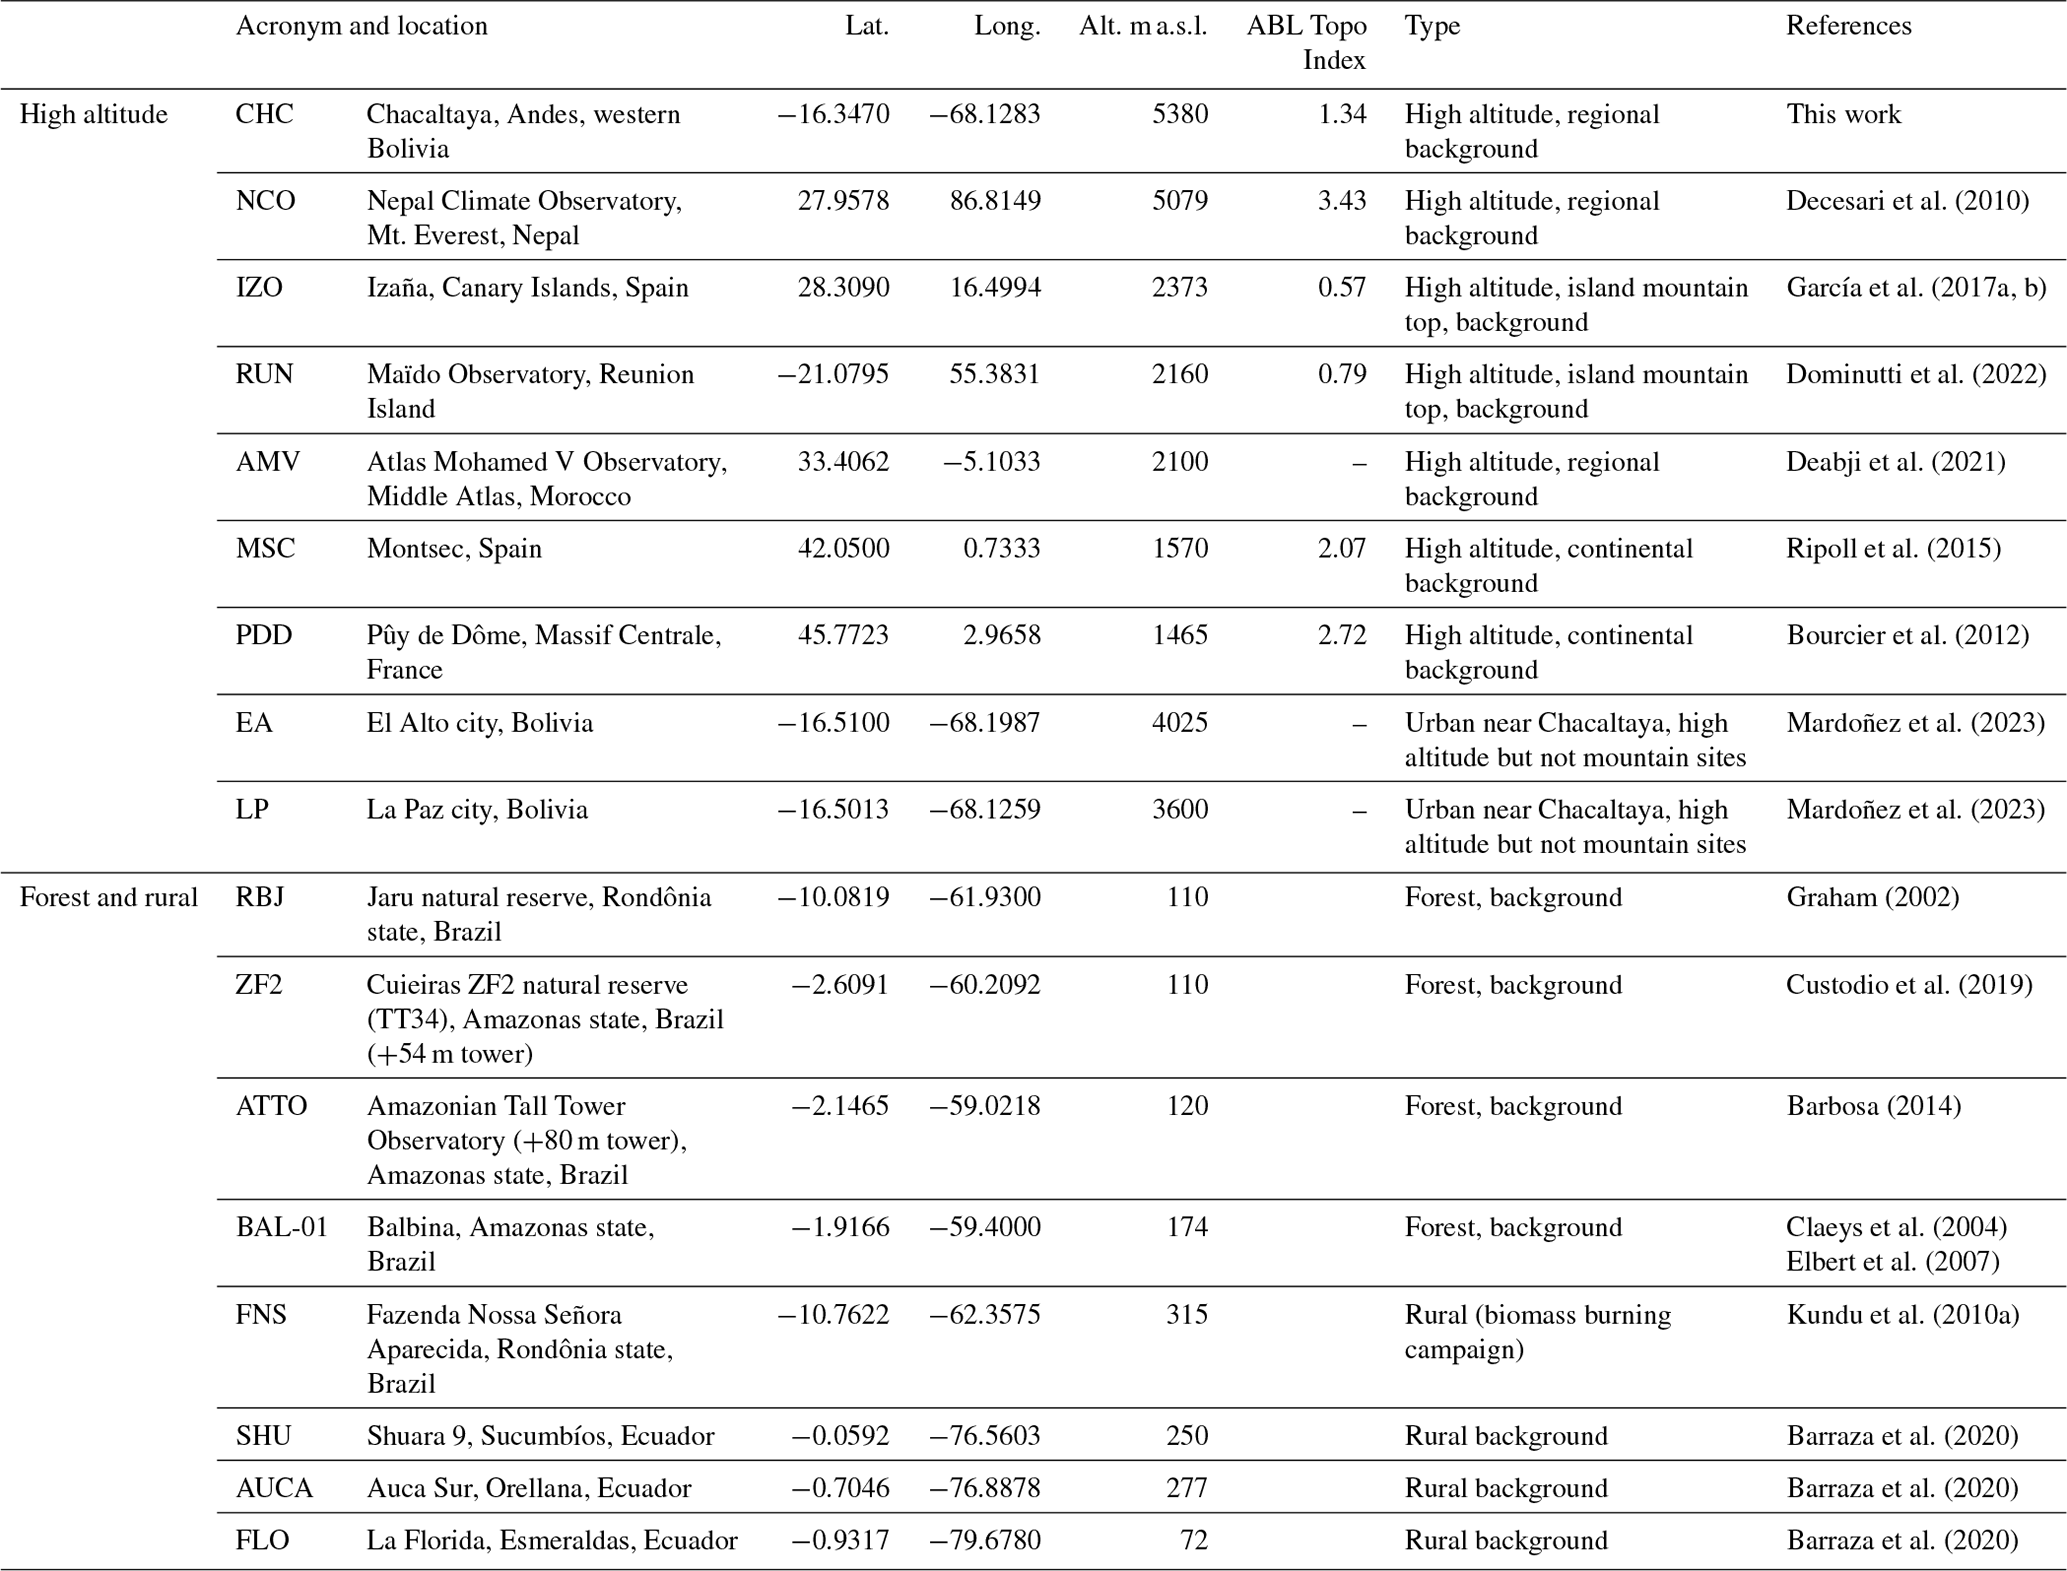

Figure 2Aerosol chemical composition at standard conditions of several sites compared to Chacaltaya. PM10 is reported for all the sites, except for ATTO which has only PM2.5 information. Note that Na+, K+, Mg2+, Ca2+ are not available for IZO, MSC; and EC, OC for ATTO.
Ions and EC–OC concentrations at Chacaltaya station are lower than other high-altitudes sites, with the exception of EC–OC for the subtropical station of Izaña and the tropical station of Maïdo, for which concentration levels are similar to Chacaltaya. For Izaña, nitrate stands out as a long-range pollutant transported to the observatory (Rodríguez et al., 2011), while for Chacaltaya its concentration is proportionally lower. In Chacaltaya, nitrate is likely related to both long-range transport to the region (Mardoñez et al., 2023) that includes biomass burning and the short-range influence of traffic emissions from below the station (diurnal cycle of PM1 NO related to transport through the convective boundary layer, Bianchi et al., 2021).
Mt. Atlas presents a higher load of anions and cations relative to Mt. Chacaltaya, mostly related to important dust and urban influences at a broad regional scale. Pûy de Dôme, Montsec, and Mt. Everest present a higher influence of pollution (SO, NO, EC, OC) compared to Mt. Chacaltaya because the former lie in populated western Europe and are influenced by regional pollution (Bourcier et al., 2012; Ripoll et al., 2015; Querol et al., 2013) and because the latter is influenced by long-range northern Asiatic pollution in spite of its remote location (Bonasoni et al., 2010; Decesari et al., 2010). EC, OC, and chloride concentrations at Chacaltaya can be more than 5 times lower than urban sites in the region, and Cl− is also lower than sites influenced by relatively fresh and unchanged marine aerosol (such as ATTO, Barbosa, 2014). Combustion tracers (OC, EC, K+, Sect. 3.3) at Chacaltaya are lower compared to sites shown in Fig. 2. Chacaltaya concentrations are similar to the tropical broadleaf forest site of Cuieras ZF2, with the exception of a significantly higher OC, K+, and Na+ contribution at ZF2 due to the important influence of both biomass burning and biogenic emissions at the forest site.
For Chacaltaya, OC and SO are the two dominant components identified, both adding up to 70 % of the measured mass of each size fraction, followed by NH (which neutralizes sulfate) and NO, which together contribute 17 % to the aerosol mass. The dominance of OC and sulfate is similar to most of the other sites shown in Fig. 2, but sources are different. For instance, for the Cuieras forest site, OC alone represents 70 % due natural and biomass burning influences. At Izaña, sulfate is mainly related to long-range transport of anthropogenic emissions (Rodríguez et al., 2011; García et al., 2017a), and at Mt. Everest, OC and sulfate emissions are heavily influenced by coal burning (Bonasoni et al., 2010; Decesari et al., 2010). At Chacaltaya, sulfate can have a variety of sources: sea salt, soil dust (Surkyn et al., 1983), marine secondary aerosol (Scholz et al., 2023), and volcanism (Aliaga et al., 2021). The impact of coal combustion in Chacaltaya is discarded given that coal is not used in the tropical Andes as corroborated by the absence of lignite markers in the samples (Fig. S11). Sea salt sulfate contributions account only for 3 % for PM10-A and 1 % for PM10-B, PM10-C, and PM2.51. The soil dust contribution to sulfate is 8 %, and volcanism accounts for at least 80 % on average in our record (Sect. 3.2). Organic carbon is notably related to regional biomass burning (Sect. 3.3), emissions from the nearby urban area, and long-range transport (Sect. 3.2), though in the wet season, some of it has been related to natural sources (Zha et al., 2023). NH is discussed in Sect. 3.3. Although Chacaltaya ion concentrations are lower than Northern Hemisphere stations, this Andean site doubles the total soluble fraction (Σions= 1.7 µg m−3 in PM2.5) measured at the pristine Amazonian Tall Tower Observatory (Σions= 0.7 µg m−3 in PM2.5 from Barbosa, 2014).
In summary, the Chacaltaya GAW station is a regional background site with relatively low ion and EC–OC concentrations when compared to other high-altitude stations in the world and low-altitude background stations in the region (with the notable exception of the Amazonian Tall Tower Observatory).
3.1.2 Organic and elemental carbon
Elemental carbon (EC) is related to fine particles directly emitted by combustion processes (typically traffic and biomass burning) and organic carbon (OC) to both primary and secondary organic aerosol (SOA). The ratio is used as a proxy for the nature of carbonaceous primary sources (Salma et al., 2004) but also of the aging of aerosols (Waked et al., 2014). The mass ratio in Chacaltaya was 10.4 ± 4.5 (IQR 8.0–12.3) for bulk PM10 and 11.0 ± 7.2 (IQR 8.1–15.0) for PM2.5, similar to sites classified as “rural” (8–11 Querol et al., 2013), but the interquartile range also encompasses the “remote site” classification (12–15 Querol et al., 2013). This mass ratio is much higher than the observed for urban areas in South America (e.g., El Alto 2.6 ± 1.1 from Mardoñez et. al, 2023; Jaciara 2.0 ± 1.2, Campo Novo dos Parecis 3.0 ± 1.9, from Custodio et al., 2019) and closer to the natural environment of Cuieiras forest (12.2 ± 2.2 for PM10 and 6.6 ± 1.0 for PM2.5 Custodio et al., 2019). It is lower than for remote locations where aerosol arrives quite aged (13 in Siberia, Mikhailov et al., 2017; 12 in remote China, Zhang et al., 2008; 12–15 for Izaña and Montsec, Querol et al., 2013) and forest burning emissions near the source (14.5, Watson and Chow, 2001).
In Chacaltaya, the ratio is quite similar over the year: the median value is 10.5 ± 7.0 for DJFM, 8.6 ± 2.7 for April, 10.4 ± 6.0 for MJJA, and 10.9 ± 4.5 for SON. Not even the outstanding biomass burning season (JAS) produces a ratio (10.4 ± 4.4) different from the rest of the year. This is in contrast to what has been observed at other sites such as Mt. Atlas, where the ratio showed marked seasonality (summer: 11.2, winter: 2.2; Deabji et al., 2021). The measured ratios and their uniformity over the year seem to be influenced by two factors: first, air masses that are relatively aged during long-range transport and second the quick transformation (in ca. 2 h) of short-range urban emissions such as observed over other urban areas (DeCarlo et al., 2008). According to the source apportionment study (Sect. 3.2), 71 % of the organic carbon is related to long-range transport and 29 % to nearby urban emissions.
Secondary organic aerosol was estimated for bulk PM10 using the Castro et al. (1999) approximation2, and it was found that SOA contributes approximately 50 % of the OC mass during the dry season and 69 % during the wet season for the entire data series. During the wet season, other organic markers such as formate, oxalate, arabitol, mannitol, and glucose are present, suggesting that important SOA formation processes are not only due to anthropogenic but also to natural precursors.
3.1.3 Saccharides
In Fig. 3 we present a comparison of arabitol, mannitol, and glucose for several sites. Arabitol and mannitol are emitted along with fungal and fern spores (Bauer et al., 2008; Elbert et al., 2007; Graham et al., 2003) but also found in leaves, pollens, and green algal lichens (Medeiros et al., 2006; Jia et al., 2010). Glucose is related to plant fragments (Pietrogrande et al., 2014; Graham et al., 2003), suspended soil from cultivated land (Rogge et al., 2007), biomass burning products, and pollen (Elbert et al., 2007; Kundu et al., 2010a; Claeys et al., 2010). The concentrations of these primary biogenic aerosols in Chacaltaya are highly variable, as can be seen in PM10-A, PM10-B, and PM10-C bar plots. Saccharide data for high-altitude sites are scarce, but for what is available, Chacaltaya bulk PM10 concentrations (glucose 2.9 ± 1.9 ng m−3, arabitol 1.4 ± 3.4 ng m−3, mannitol 1.5 ± 1.l ng m−3) are similar to other semi-arid environments such as Mt. Everest and Mt. Atlas but lower than Maïdo observatory in the tropical Southern Ocean and rural sites either from tropical (Brazil, Ecuador; Fig. 3) or extratropical regions (e.g., France form Samake et al., 2019). This is interesting because even though the highly productive Amazonian forest is on the windward side (Fig. 1) of the observatory it does not seem to have a big influence at our site in terms of saccharides, probably due to dilution, loss of coarse primary biogenic aerosol in transport, and/or unstudied degradation mechanisms of sugars along the way.
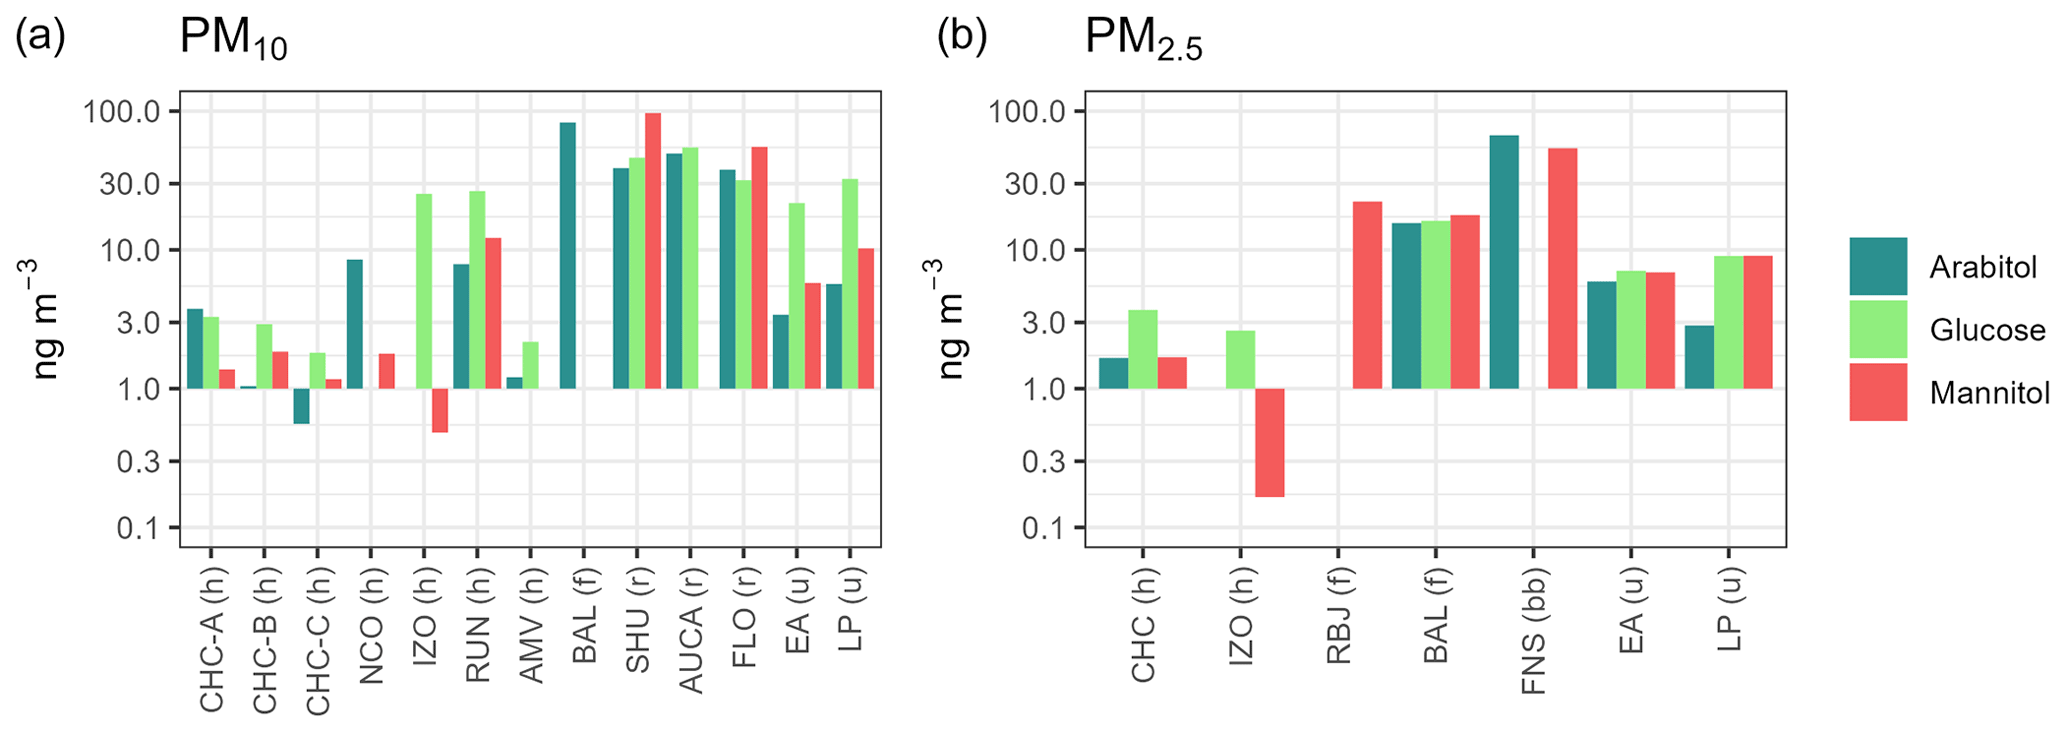
Figure 3Comparison of biogenic markers (mean concentrations) among different sites in standard cubic meters for PM10 (a) and PM2.5 (b). Mind the logarithmic scale. For AMV, only cases without Saharan dust influences were included. IZO, RUN, and FNS data are for short-term campaigns. When a species is not plotted, it indicates that it was not measured at the site.
In general, polyols tend to be more concentrated in PM10 than in PM2.5 (Yttri et al., 2007; Samake et al., 2019; Elbert et al., 2007; Brighty et al., 2022; Zhang et al., 2010), especially in dry conditions (Rathnayake et al., 2017), but they are shifted to PM2.5 when the cells rupture under moist conditions (Rathnayake et al., 2017; Yttri et al., 2007) and therefore they are not very affected by rainout. This difference between PM10 and PM2.5 is not pronounced at Chacaltaya, likely indicating fragmented biogenic material that is present mostly in PM2.5 and/or loss of coarse material during long-range transport. The loss of coarse material even for short distances seems to be supported by the difference from measurements in the nearby conurbation. In fact, glucose in LP-EA shows a pronounced difference between PM10 and PM2.5, but this difference is not translated to Chacaltaya
At Chacaltaya, mannitol concentrations are similar for PM10 and PM2.5, while for arabitol this is not so clear. Their correlation is poor to moderate (τ= 0.54, 0.29, 0.47, and 0.54 for PM2.5, PM10-A, PM10-B, and PM10-C, respectively), contrary to what was found for a significant number of sites (Marynowski and Simoneit, 2022, and references therein), indicating emissions of endemic fungal species. Maximum values of arabitol were found in the PM10-A fraction, but later on (Fig. S3) concentrations show a significant decrease. Glucose correlates moderately well with mannitol except for PM10-C (τ= 0.67, 0.51, 0.67, and 0.27) where it correlates with arabitol (τ= 0.36, 0.30, 0.43, 0.67), the explanation for which remains unclear.
3.2 Source apportionment
Tests were made for four to six factors and different species and constraints. The results were statistically sound for four constrained factors, but a single source per factor was not achieved (with the exception of the “biomass burning” factor). The concentration of the species in each factor is presented in Table 4, and more details of the source apportionment results can be found in the Supplement. Briefly, the obtained factors are the following:
-
“westward”, containing volcanic (SO), ammonium, and marine (MeSO, cations) contributions;
-
“soil dust and bromide”, containing soil dust tracers, bromide, and OC;
-
“biomass burning” defined by levoglucosan, K+, and OC, being the only factor fully resolved for a single source; and
-
“combustion” characterized by EC, oxalate, and OC that seems to represent both urban and biomass burning emissions.
Table 4Concentrations of each species per factor in ng m−3 at STP.
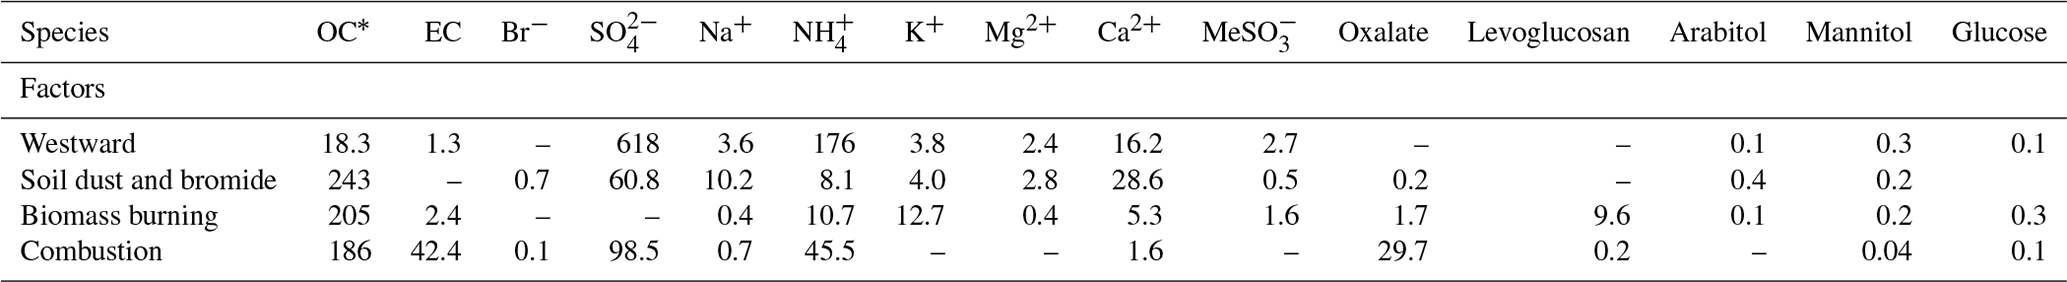
The first two factors are related to species whose seasonality is defined by atmospheric circulation changes, with lowest concentrations during the wet months (Sect. 3.3.1). The last two factors also have a common seasonality, characterized by the regional influence of biomass burning (Sect. 3.3.2). The mixed “westward” factor appeared almost unchanged in every test made and it seems to represent transport through the low free troposphere.
Some caveats must be taken into account. For instance, for MeSO 57 % was assigned to the “westward” factor, 34 % to “biomass burning”, and the rest divided between the other two factors. However, the “westward” factor is defined by the step increase in SO after 2013 (Sect. 3.4), and this is pulling along MeSO. We know that MeSO contributions did not change along with sulfate after 2013 (Table 6, Fig. S16). Therefore, we are aware that the division of this species into several factors is not necessarily due to a geochemical reason but to the lack of other species (that were not measured) to help better constrain the solutions.
This said, even if the source apportionment gives valuable results, it cannot fully resolve the sources at this site, and in consequence we use it in combination with the next section.
3.3 Observed seasonality of the atmospheric species
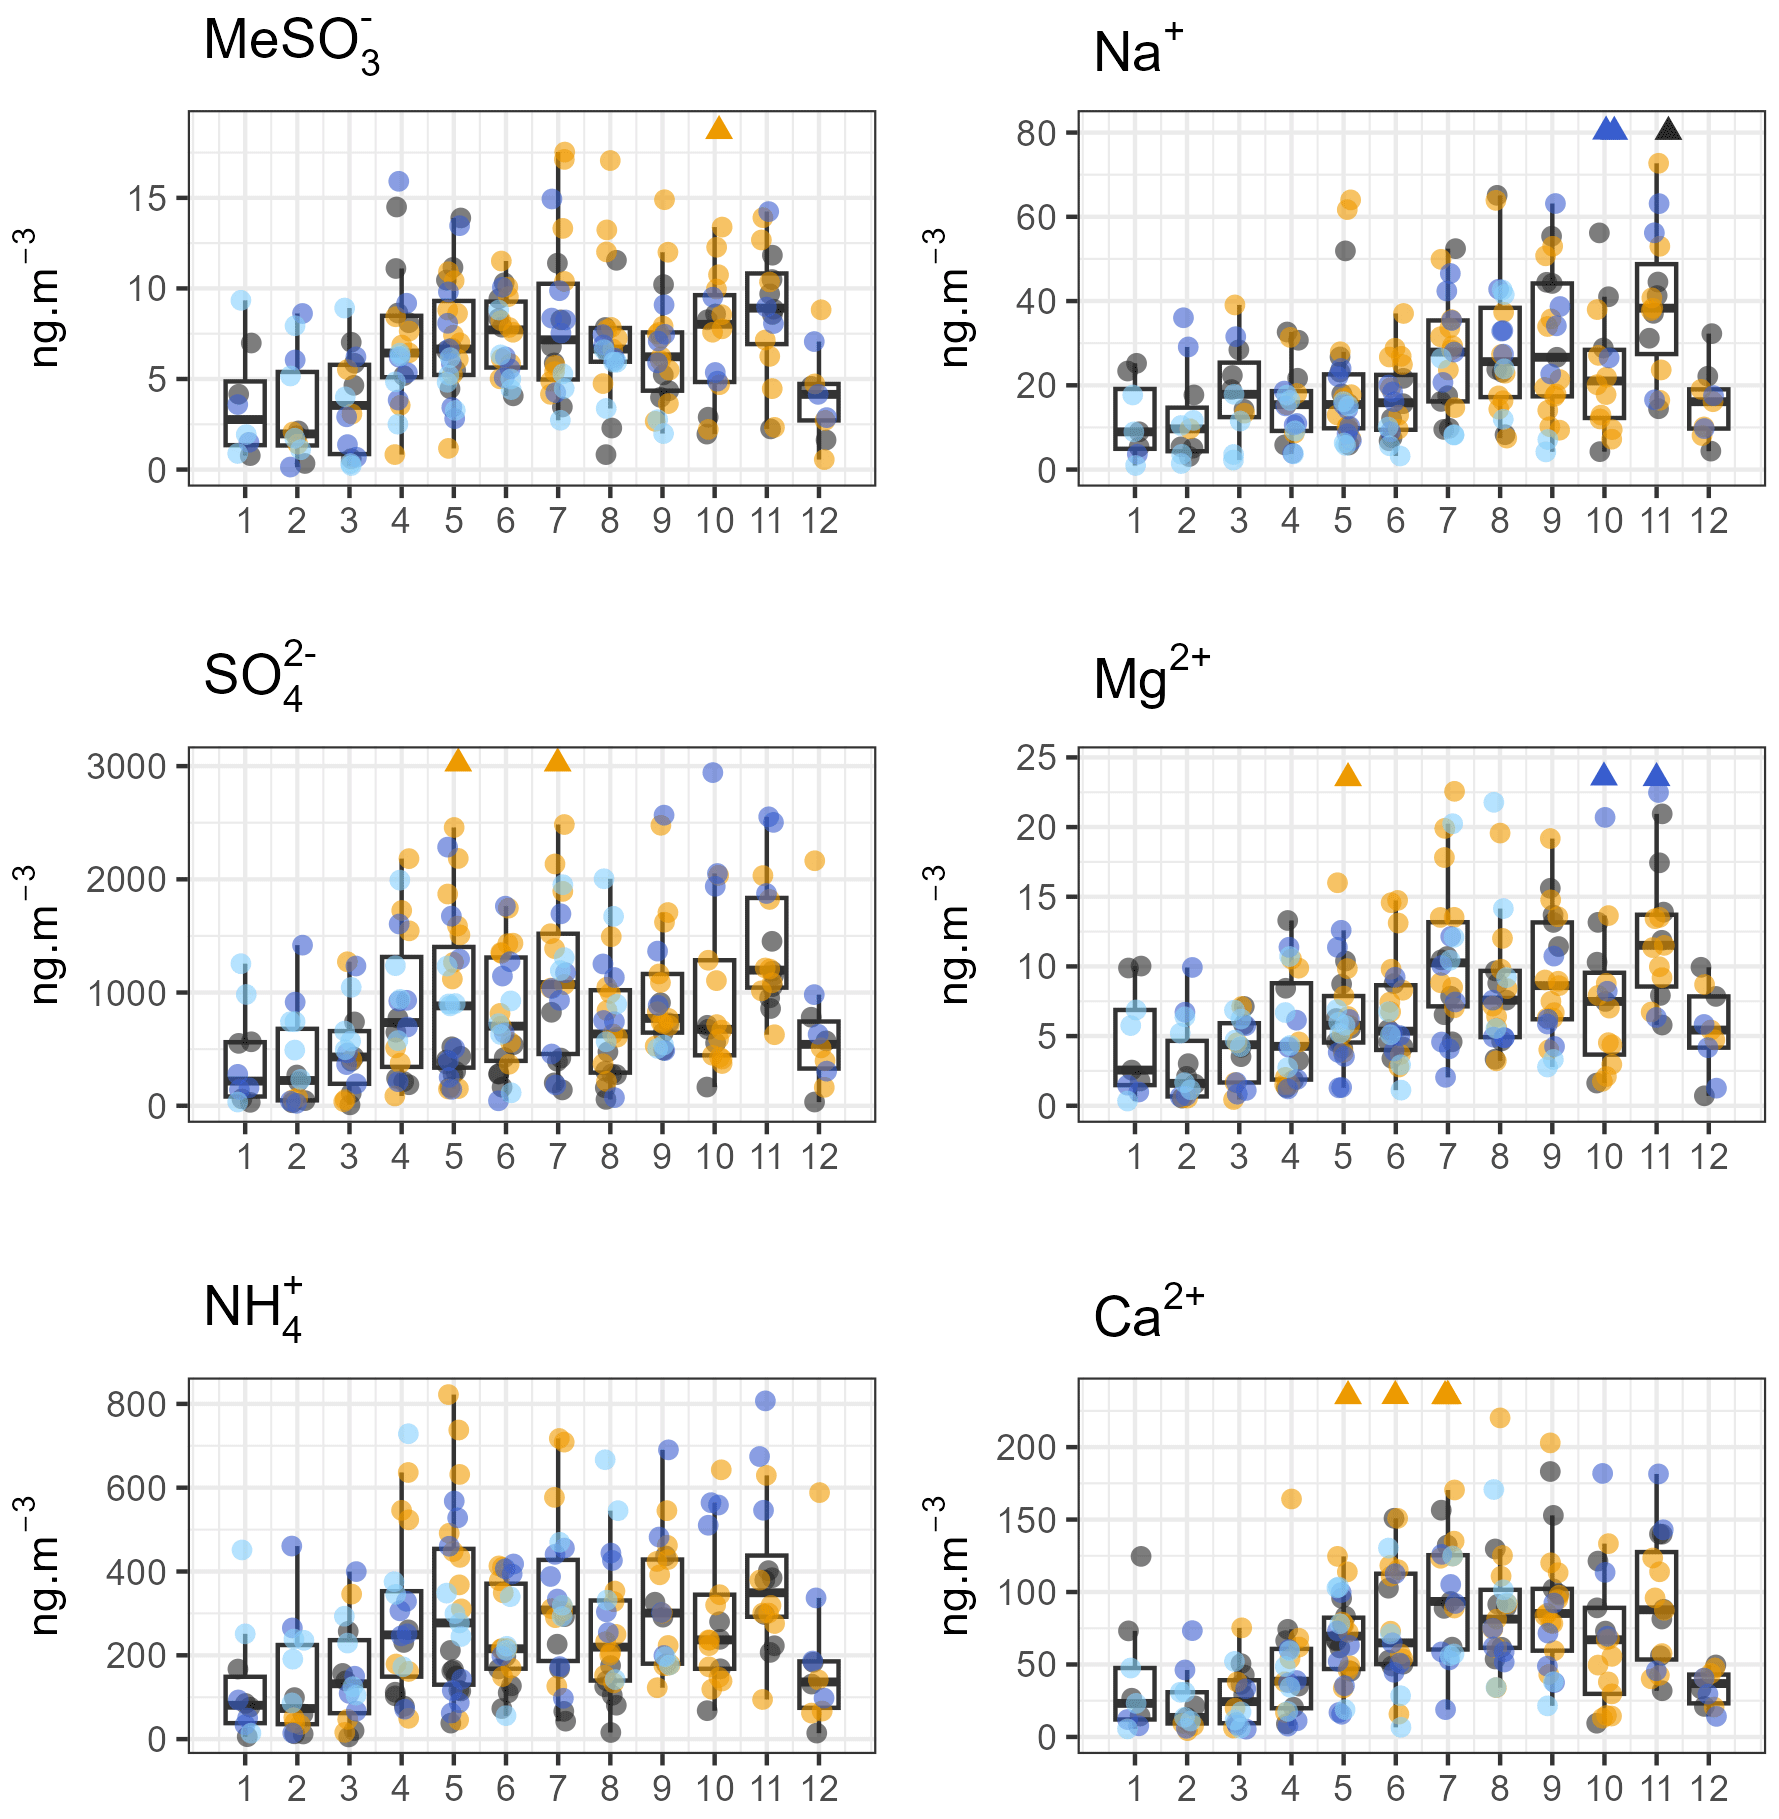
Long-term series (Fig. S3) show clear seasonality for most of the species, and seasonal patterns were obtained from monthly box plots. The number of samples available per month is presented in Fig. 4, which shows that at least 10 samples per month were available. In Figs. 5, 6, and 7 monthly box plots for each species are presented. The box plots were made by aggregating all the sampled periods. Seasonal patterns can be classified into three principal groups based on clustering of their normalized median monthly concentrations (Fig. S15). These groups are (1) species with high concentration during the dry months, (2) species with maximum concentration between June and November, and (3) species with unclear seasonality patterns. However, there are nuances within this classification and they will be discussed in the text.
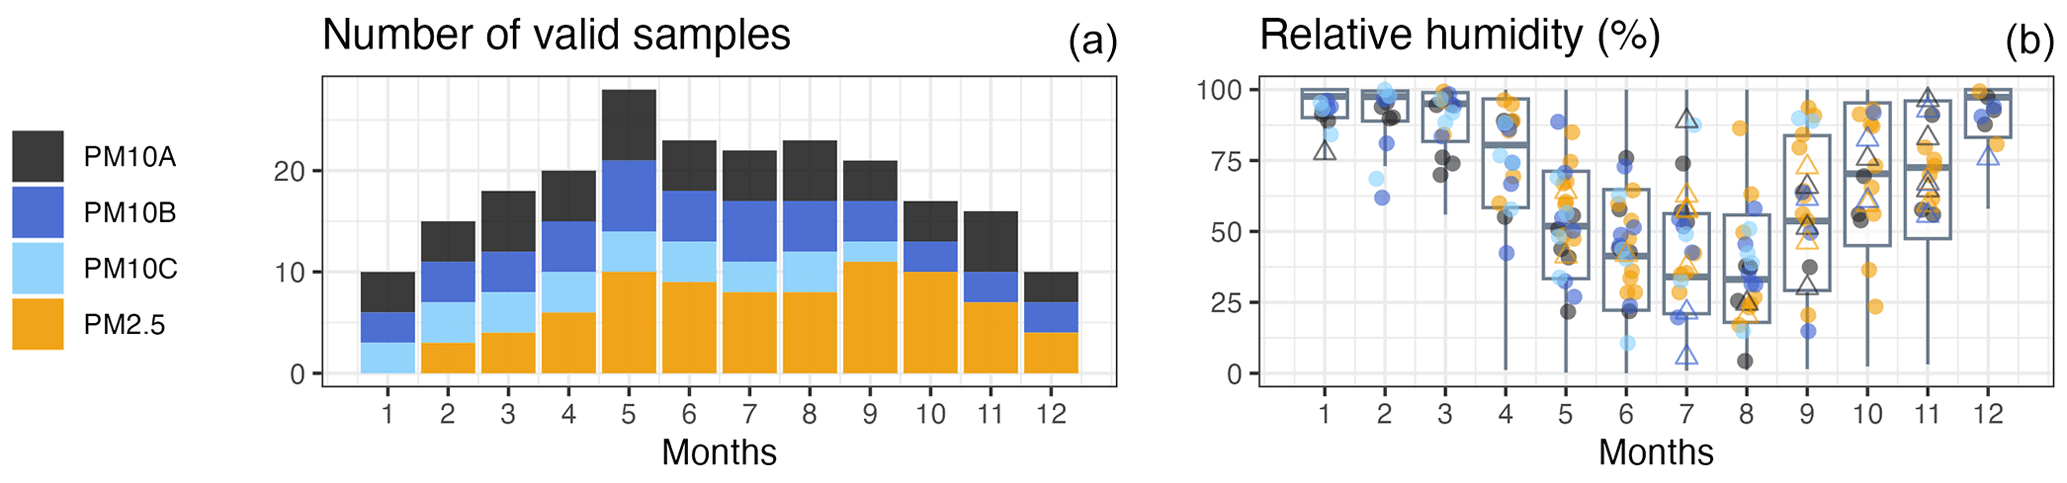
Figure 4The number of valid samples per month used in this study. The color represents the sampling period (see Table 1 for details).
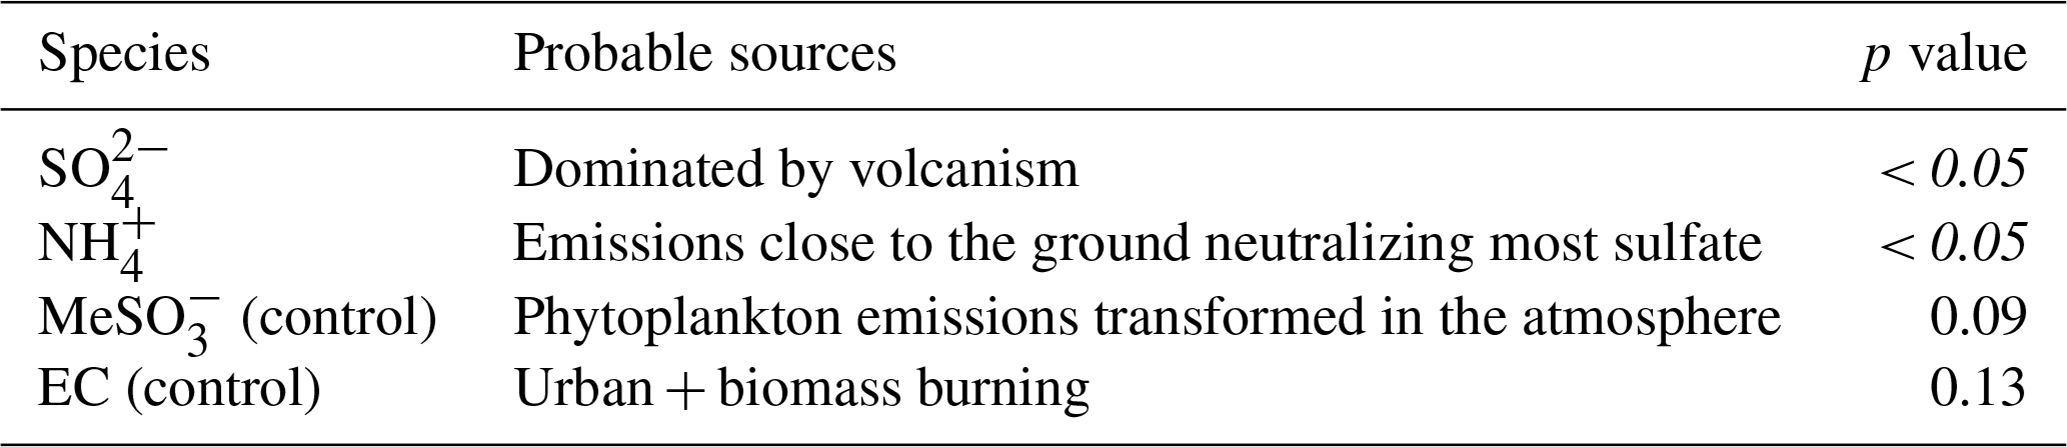
3.3.1 Species with low concentration during the wet months
The ions MeSO , SO, NH, Na+, Mg2+, and Ca2+ present a seasonality opposed to the seasonality of moisture (Fig. 4b) and related to the seasonal increase in westerlies at the station (Scholz et al., 2023), having the lowest values in the wet season (DJFM) and higher values during the dry months of the year, with an abrupt transition between November and December (Fig. 5). In the wet season, air masses arrive mostly from Amazonia (N, NE, Fig. S7), typically along with precipitation, and these species can be affected by rainout or simply not be emitted (such as mineral dust from wet soils). For the rest of the year, air resides more over the Altiplano, arriving at the station from three main directions as identified by Chauvigné et al (2019) and shown in Fig. S7: east–southeast (Amazonia and Chaco), northwest (Manu, Madidi, national parks), and west (eastern Bolivia, southern Peru). The further the air mass travels, the lower the influence from the surface (Aliaga et al., 2021). All these species arrive together at the station due to the large-scale atmospheric circulation seasonality but have different sources.
Sulfate and ammonia correlate well (τ= 0.81), likely because of the formation of HNH4SO4 and (NH4)2SO4 that can be transported over long distances. Sulfate sources are mentioned in Sect. 3.1. Ammonium is produced by litter or wood burning in the nearby conurbation (Mardoñez et al., 2023), but it can also be produced by the decomposition of animal excreta and fertilizers in nearby rural environments. It presents a pronounced diurnal cycle in Chacaltaya for PM1 related to transport from below the station through the convective boundary layer (Bianchi et al., 2021). Methanesulfonate is a well-known tracer of phytoplankton emissions (Finlayson-Pitts and Pitts Jr., 1999), as biogenic dimethyl sulfide is transformed into MeSO in the atmosphere. Median MeSO concentrations in Chacaltaya (bulk PM10: 6.03 ± 3.40, PM2.5 7.45 ± 4.41 ng m−3) are twice the concentration at La Paz–El Alto. It has been shown that MeSO is transported to Chacaltaya from the Pacific Ocean (at least 330 km from the station but as far as > 1600 km) through the low free troposphere with a negligible contribution from Lake Titicaca (Scholz et al., 2023). Most MeSO is associated with the factor “westward” that represents both volcanic and marine influences that tend to arrive through the low free troposphere.
The ions Ca2+, Mg2+, and Na+ seem to have both a continental and marine origin. The median Ca Mg2+ mass ratio is 8.8 ± 4.1 and 10.6 ± 4.7 for bulk PM10 and PM2.5, respectively, with slightly higher values in the dry season (12.1 ± 3.6 and 11.2 ± 3.6), in agreement with very dry soils and strong winds typical of that time of the year. Indeed, the Ca Mg2+ mass ratio is closer to continental station values (PM10: Mt. Atlas 10.8, El Alto 10.3; PM2.5: Arequipa 8.8, El Alto 9.5) than to sea salt (0.31 Keene et al., 1986). Non-sea-salt Ca2+ accounts for 97 % of Ca2+, and for PM10-B, the median soluble fraction for Ca2+, Mg2+, and Na+ was 30 ± 25 %, 10 ± 8 %, and 10 ± 18 %, respectively, indicating an important crustal influence. This is confirmed by the source apportionment study in which the “soil dust and bromide” factor contains 55 % of the Ca2+, 50 % Mg2+, and 69 % Na+ (and 20 % of K+), and a marine source accounts for 31 % Ca2+, 43 % Mg2+, and 24 % Na+ (“westward” factor, which also includes 18 % of K+). The marine contribution was also hinted at by the clustering of Mg2+ and Na+ (Fig. S15), and it is in agreement with a marine source composed by Br, Cl, I, Mg, and Na affecting this site as hypothesized by Adams et al. (1977). Finally, and in agreement with our findings, SO, Ca2+, Mg2+, and Na+ were identified as a group of species influencing the region from the long range (Mardoñez et al., 2023).
3.3.2 Species with maxima concentration between June and November
Levoglucosan, K+, NO, EC, OC, formate, oxalate, F−, Cl−, and Br− constitute another group that is presented in Fig. 6. They follow the same seasonality as levoglucosan, a proxy for biomass burning emissions, which shows concentrations above the annual average between June and November, with maximum concentrations between July and September. For this group, the transport conditions are essentially the same as in the previously described group. However, the main difference is that this group is heavily influenced by the seasonal activity of a dominant source, namely human-induced fires related to agriculture and deforestation. The regions active in terms of burning for June to November (within the range of 4 d back trajectories) are located in the Amazonian (Bolivia east of the Andes and Brazilian states neighboring Bolivia, particularly those part of the “deforestation arc”) and Gran Chaco (southern Bolivia, northern Argentina, and Paraguay) basins (Carmona-Moreno et al., 2005; Giglio et al., 2013; Dutra et al., 2022). Southern Peru and Altiplano grassland fires have a very small influence compared to the aforementioned regions (Bradley and Millington, 2006).
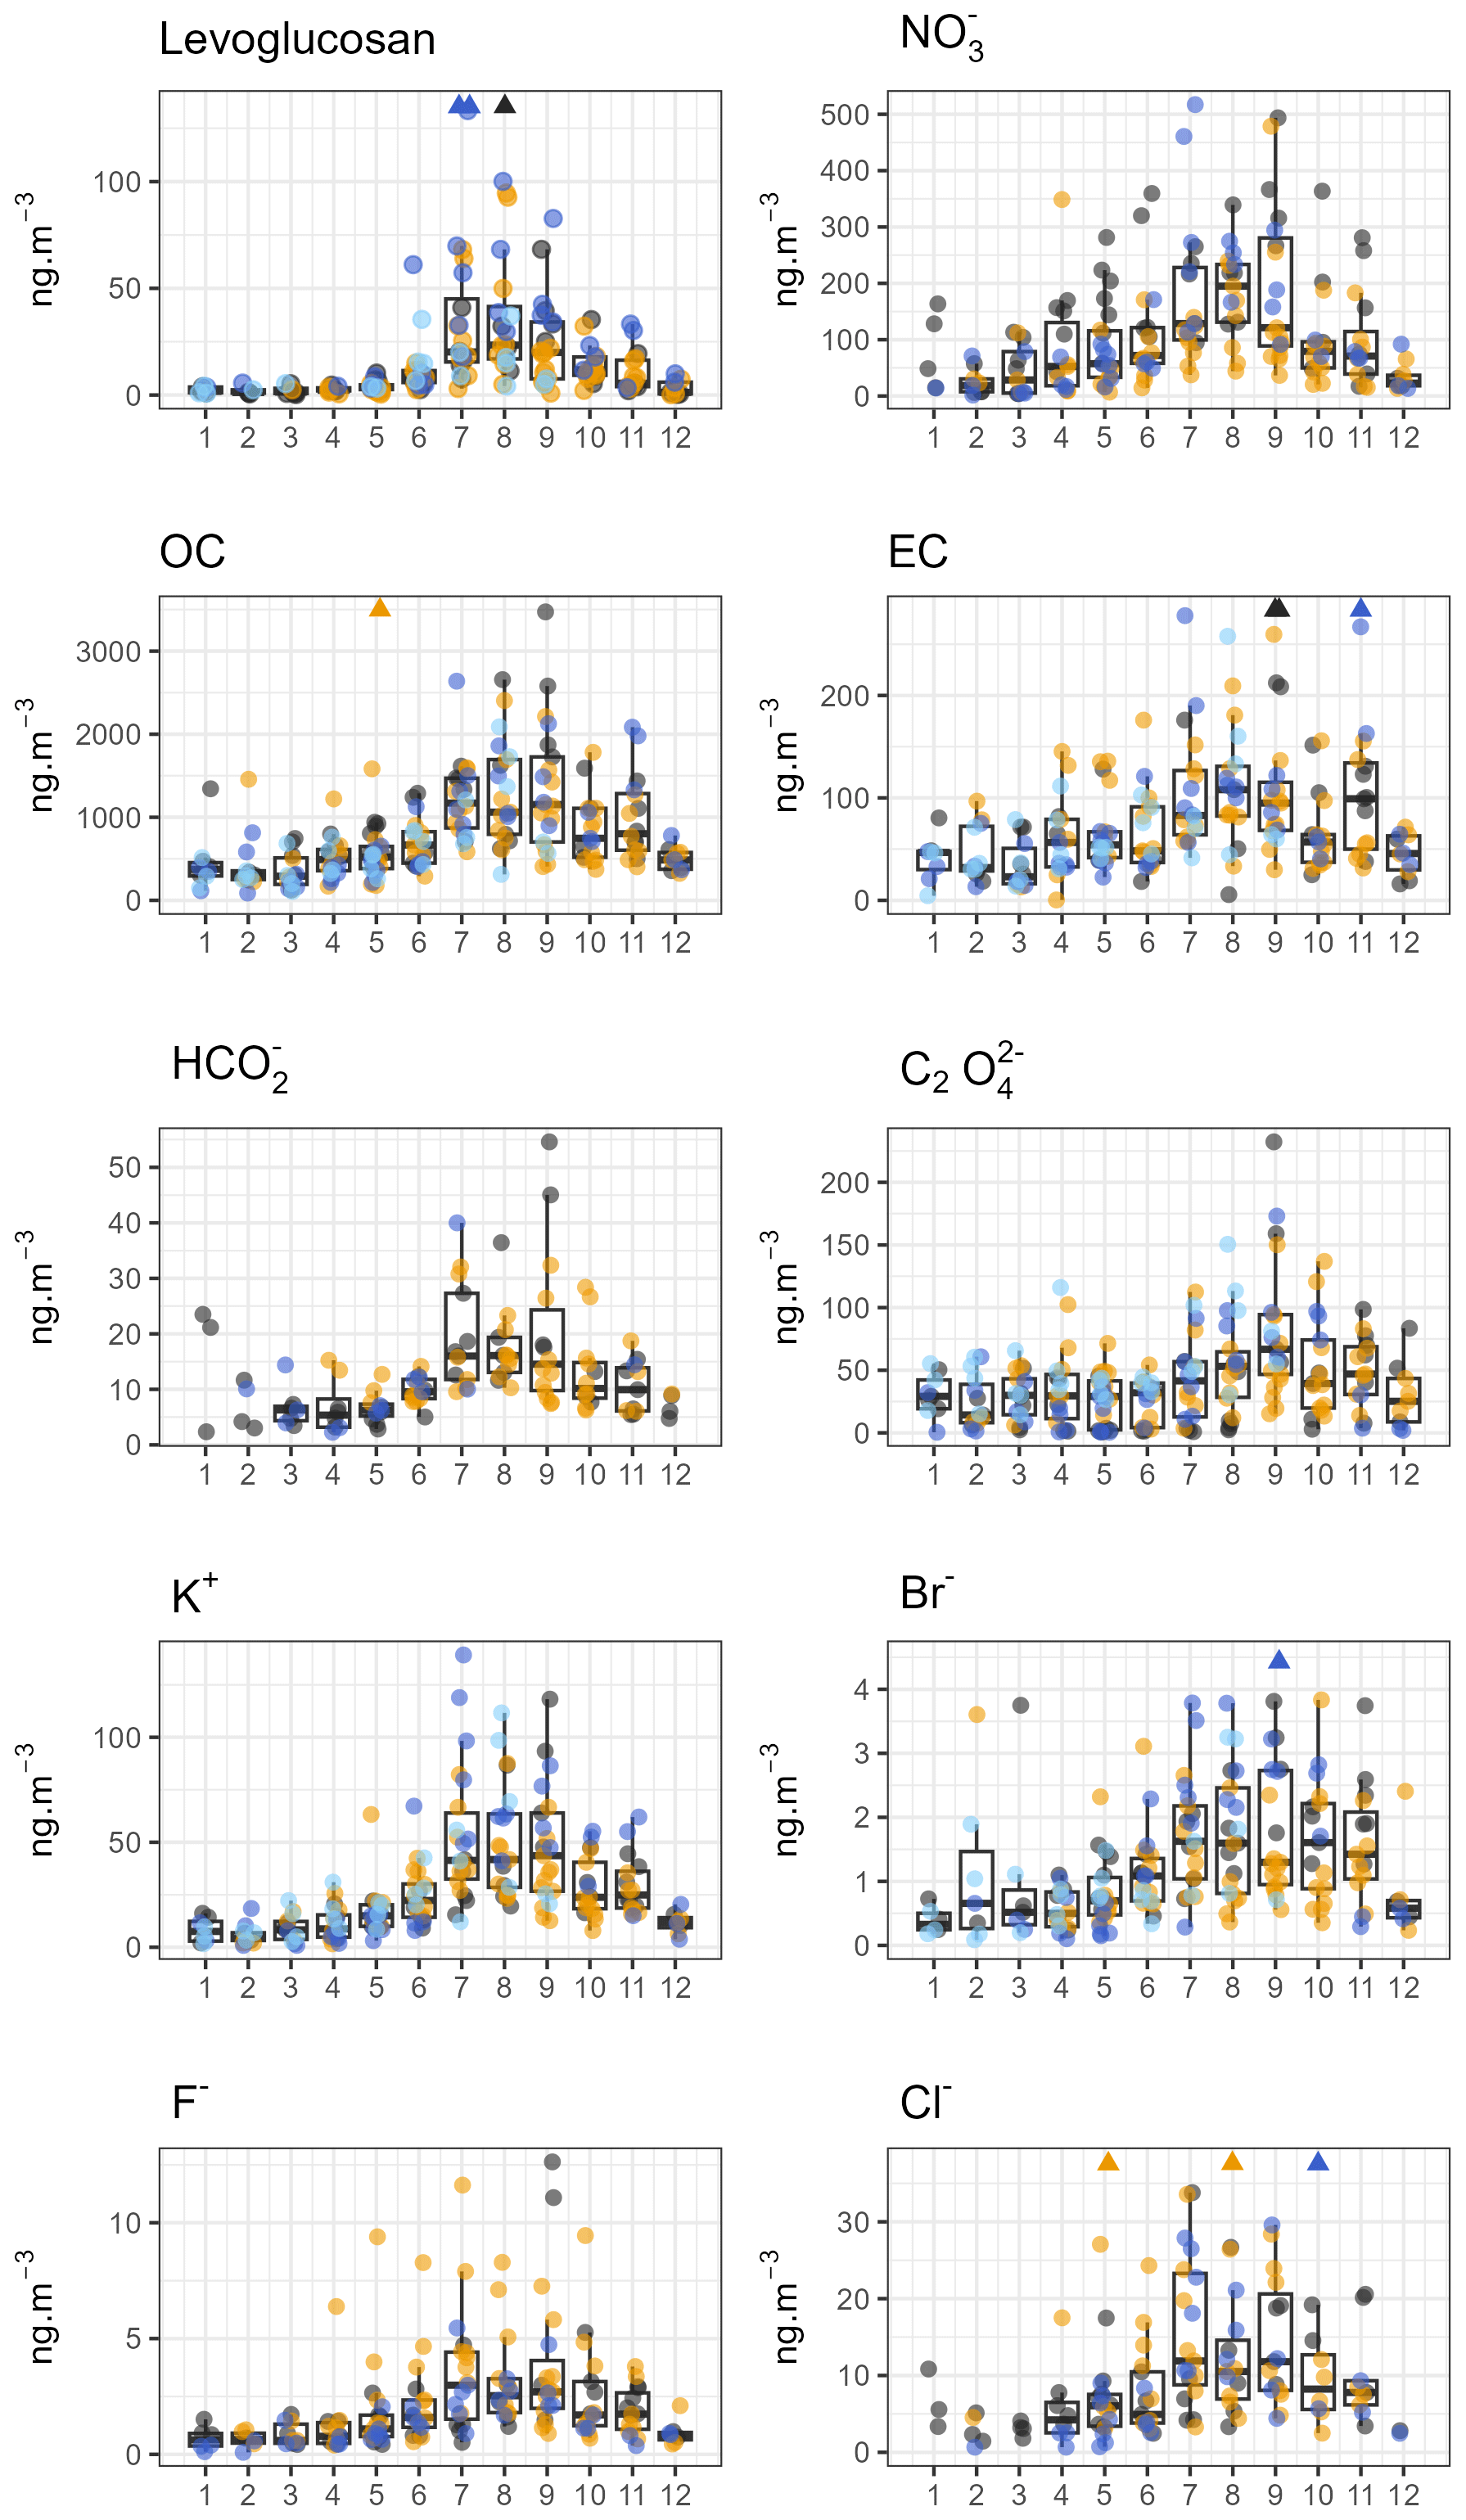
Figure 6Monthly box plots for Chacaltaya with all samples together (same color scale as Fig. 4). F−, Cl−, formate, and NO are not included for PM10-C due to suspected losses. Box plots were produced with at least five points, with top, middle, and bottom lines for the 75th percentile, median, and 25th percentile, respectively, and the whiskers for the 5 % and 95 % confidence intervals. Extreme outliers are plotted as triangles, and their values are in the Supplement. Species with maximum concentrations between June and November.
Levoglucosan stereoisomer ratios can be used to assess the substrate that was burned (Marynowski and Simoneit, 2022; Xu et al., 2019). For the entire data series, the interquartile range of the mass ratio of levoglucosan to mannosan is 9.3–21.5 and mannosan to galactosan is 0.94–1.67, depicting a wide variety of sources, with grass, duff and litter, and hardwood being the main burning substrates, as well as a few events of peat fires (Fig. S11). All this includes agricultural waste burning and also probably land clearing due to the hardwood fingerprint (forests being changed to pasture sites). Note, however, that mannosan and galactosan are usually below the quantification limit in the wet months, and therefore ratios between December and April cannot be calculated even if levoglucosan is present. For the wet season the burning source is hypothesized to be nearby small-scale fires (such as those observed in the close urban area, Mardoñez et al., 2023).
Fluoride and bromide are not important constituents of vegetation, but plants can bio-accumulate halogens in polluted environments (Jayarathne et al., 2014), so for the burning season the species may release agrochemicals to the atmosphere. Indeed, F− was observed in rainwater samples affected by agrochemicals (Zunckel et al., 2003) and in high concentrations > 100 ng m−3 near anthropogenic burning sources (Kundu et al., 2010a).
The transport mechanism of smoke to this site is complex. Burning emissions, along with other organic pollutants, are transported to the Andes (Magalhães et al., 2019; Estellano et al., 2008) through what would be the free troposphere from an Amazonian point of view (1–4 km a.s.l., Andreae et al., 1988; Kundu et al., 2010b) and a regional residual layer from the Altiplano point of view (> 5 km a.s.l., Fig. S2). Additionally, smoke goes upslope in the valleys (Bourgeois et al., 2015), as observed in the higher influence of smoke on aerosol mass in the La Paz valley (17 % in mass) than in the Altiplano (13 %, Mardoñez et al., 2023). Once the smoke arrives to the Altiplano, it is picked up by convection and transported with the PBL development to the station (along with urban pollutants, natural emissions, etc.). Hence, although the smoke primarily travels from east to west towards the Andes, it also reaches the mountains through a bottom-up flow originating from the western side of the Cordillera Real.
Finally, the source apportionment study (Sect. 3.2) is able to divide the species of this group into three factors.
-
“Biomass burning” with a classical signature of burned vegetation containing 98 % of the total levoglucosan burden, 62 % of K+, 31 % of OC*, 5 % of EC, and 5 % of C2O, along with a marginal contribution of cations (3% Na+, 5 % of NH, 7 % Mg2+, and 10 % Ca2+).
-
“Combustion” which follows the biomass burning seasonality (Fig. S8) but seems to have a dominant urban origin. It is composed of 92 % of the EC burden, 94 % of C2O, 29 % of OC*, 15 % of Br−, and 2 % of levoglucosan (along with 13 % SO, 4 % Na+, 19 % NH, 3 % Ca2+). Given that EC is a typical traffic marker (Jorquera and Barraza, 2013; Mardoñez et al., 2023) and that oxalate, another urban pollution marker (Kawamura and Kaplan, 1987), is clustered with it (Fig. S15), we assign this factor to the nearby urban area. Nevertheless, biogenic emissions of oxalate (Kundu et al., 2010b), oxidation of different carboxylic acids (Yang et al., 2014), and in-cloud formation of C2O (Zhang et al., 2017) are also probably involved in the formation of oxalate.
-
The “soil dust and bromide” factor includes 85 % of the Br− burden, 37 % of OC*, 20 % of K+, and cations. The assignment of K+ to this factor seems correct as it can also have a mineral origin such as silico aluminates (clay minerals and feldspars), but it is unclear why bromide and OC* are ascribed to it.
All this contrasts with a study performed more than 40 years ago, when biomass burning contributed only marginally to the aerosol composition at Chacaltaya (Adams et al., 1977; Van Espen and Adams, 1983).
3.3.3 Species with individual seasonality patterns
No straight seasonal pattern can be inferred for Li+, arabitol, mannitol, and glucose from Fig. 7. Hence, for these species, it seems that there are other drivers of their climatology, as they do not completely fit into the narrative of a clear emission source (such as the levoglucosan group) or the circulation pattern change (MeSO group).
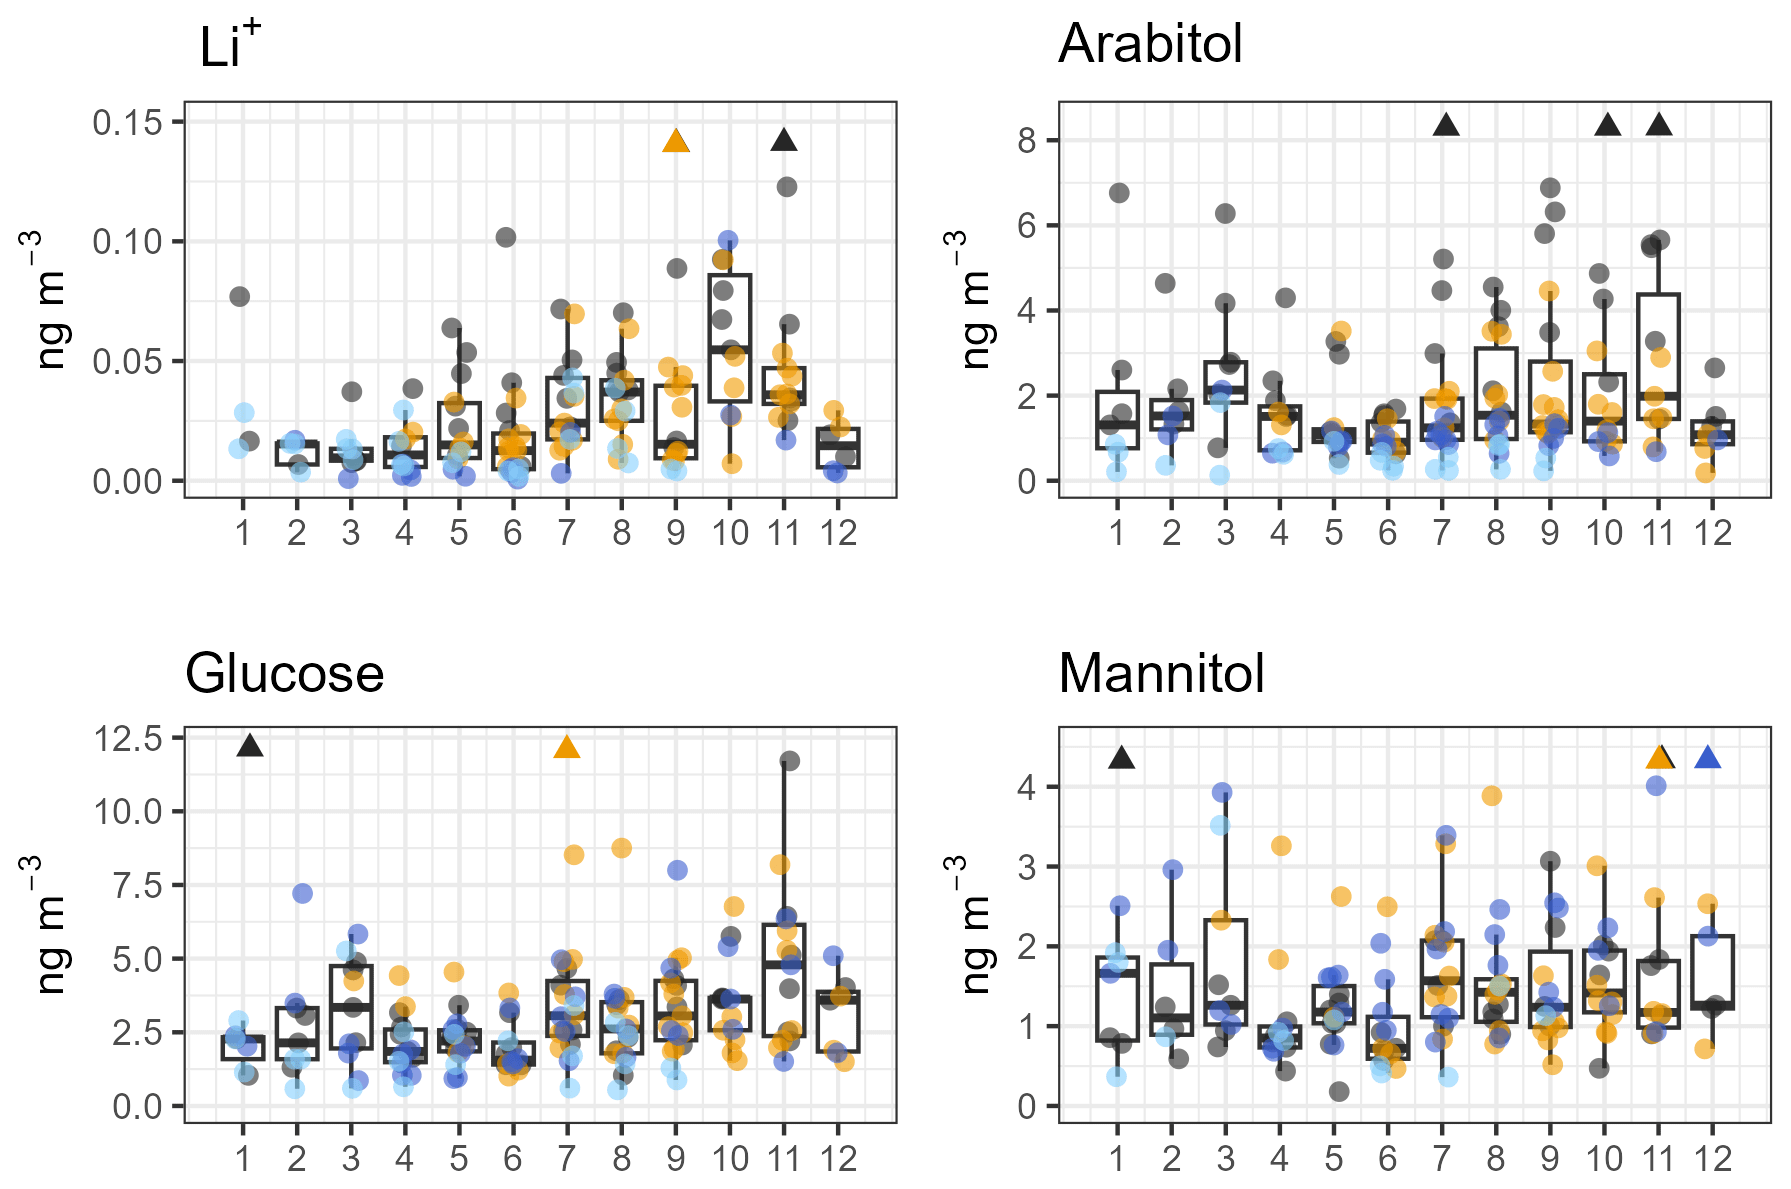
Glucose, mannitol, and arabitol present high variability, even during the wet season, when biogenic activity is enhanced with rain, high atmospheric moisture content, and warm conditions.
These poylols have not been resolved in a single source origin (Sect. 3.2). What we know is that glucose tends to be transported within the planetary boundary layer to the station (Table S7) and its sources seem to be dominated by emissions below the station as fragmented vegetation and pollen. Arabitol and glucose are mostly found in the “soil dust” factor (67 % and 62 %, respectively), in line with a pollen origin in the Chacaltaya region from the Altiplano grasslands within a radius of 200–300 km (Brugger et al., 2019). They also have an influence of biomass burning (23 % and 22 %, respectively). Mannitol, in contrast, seems to be influenced by several sources: “biomass burning” (27 %), “soil dust” (28 %), and “westward” (38 %) factors, but these results need to be confirmed with other studies.
Average soluble lithium contributions (0.03 ± 0.05 ng m−3) are barely higher than the quantification limit. However, elemental Li concentrations are higher (0.18 to 0.38 ng m−3) for air masses with non-Amazonian origins (N, NNE, air masses, 0.04 to 0.05 ng m−3).
3.4 Special case: increased sulfate contribution after 2013
The increased concentration of SO in PM2.5, PM10-B, and PM10-C compared to PM10-A (Table 2) calls for more in-depth analysis. In Table 5, we detected that the sulfate increase in our data series was statistically significant. In fact, PM2.5 sampling (2013–2015) coincides with the onset of degassing volcanic activity in the upwind Arequipa and Moquegua regions in 2014 (Global Volcanism Program, 2023). Volcanoes are known sources of SO2, which is transformed into SO in the atmosphere (Eatough et al., 1994), though they can also directly emit SO (Allen et al., 2002). This increase in regional volcanic activity is the main hypothesis for mass concentrations of sulfate in PM2.5 being higher than those of PM10. Before the onset of volcanic degassing in the region, the mean sulfate concentration in Chacaltaya was 451 ng m−3, and after it started, Chacaltaya concentrations become > 900 ng m−3 (Table 2). Frequent tropospheric volcanic activity has been documented in the region through ice core analysis, though the sources were not identified at the time (de Angelis et al., 2003). Recently one source has been identified as the Sabancaya volcano, with sulfate being dominantly from volcanic origin in PM1 when the station is under westerly air influence (Aliaga et al., 2021). However, Ubinas has also been in an active phase since 2006 (Moussallam et al., 2017, and references therein). Both volcanoes are located upwind of Chacaltaya, and therefore their emissions can arrive together when transport conditions are favorable (Sect. 3.3). Indeed, F−, a typical volcanic marker (Aiuppa et al., 2009, de Angelis et al., 2003), was detected in 81 % the samples and more frequently (94 %) and with higher concentrations in the early eruptive period (2014–2015, yellow dots in Fig. 6). Moreover, a hint toward a volcanic origin of chloride is found in some samples with high Cl− content coinciding with the onset of eruptive activity of Peruvian volcanoes (Table S2). For Br−, a volcanic origin seems unlikely because of the very low values of HBr measured in emissions from Sabancaya volcano in 2015 (Yves Moussallam, personal communication, 2020).
Table 5Results of the two-sided Mann–Kendall test merging all sampling periods. Values statistically significant are in italics.
To assess the influence of Peruvian volcanism in the sulfate burden, at the station, we group all samples that have a west (W) or northwest (NW) origin based on ERA-5 back trajectories and compare them with SO2 emissions for both Sabancaya (400 km away from Chacaltaya) and Ubinas (300 km), which are available on an annual basis (Carn et al., 2017; Fioletov et al., 2023). Chacaltaya SO data from filter sampling were added up, using years with at least 9 months of data, to obtain the annual accumulated value and also the annual mean. The results are presented in Fig. 8.
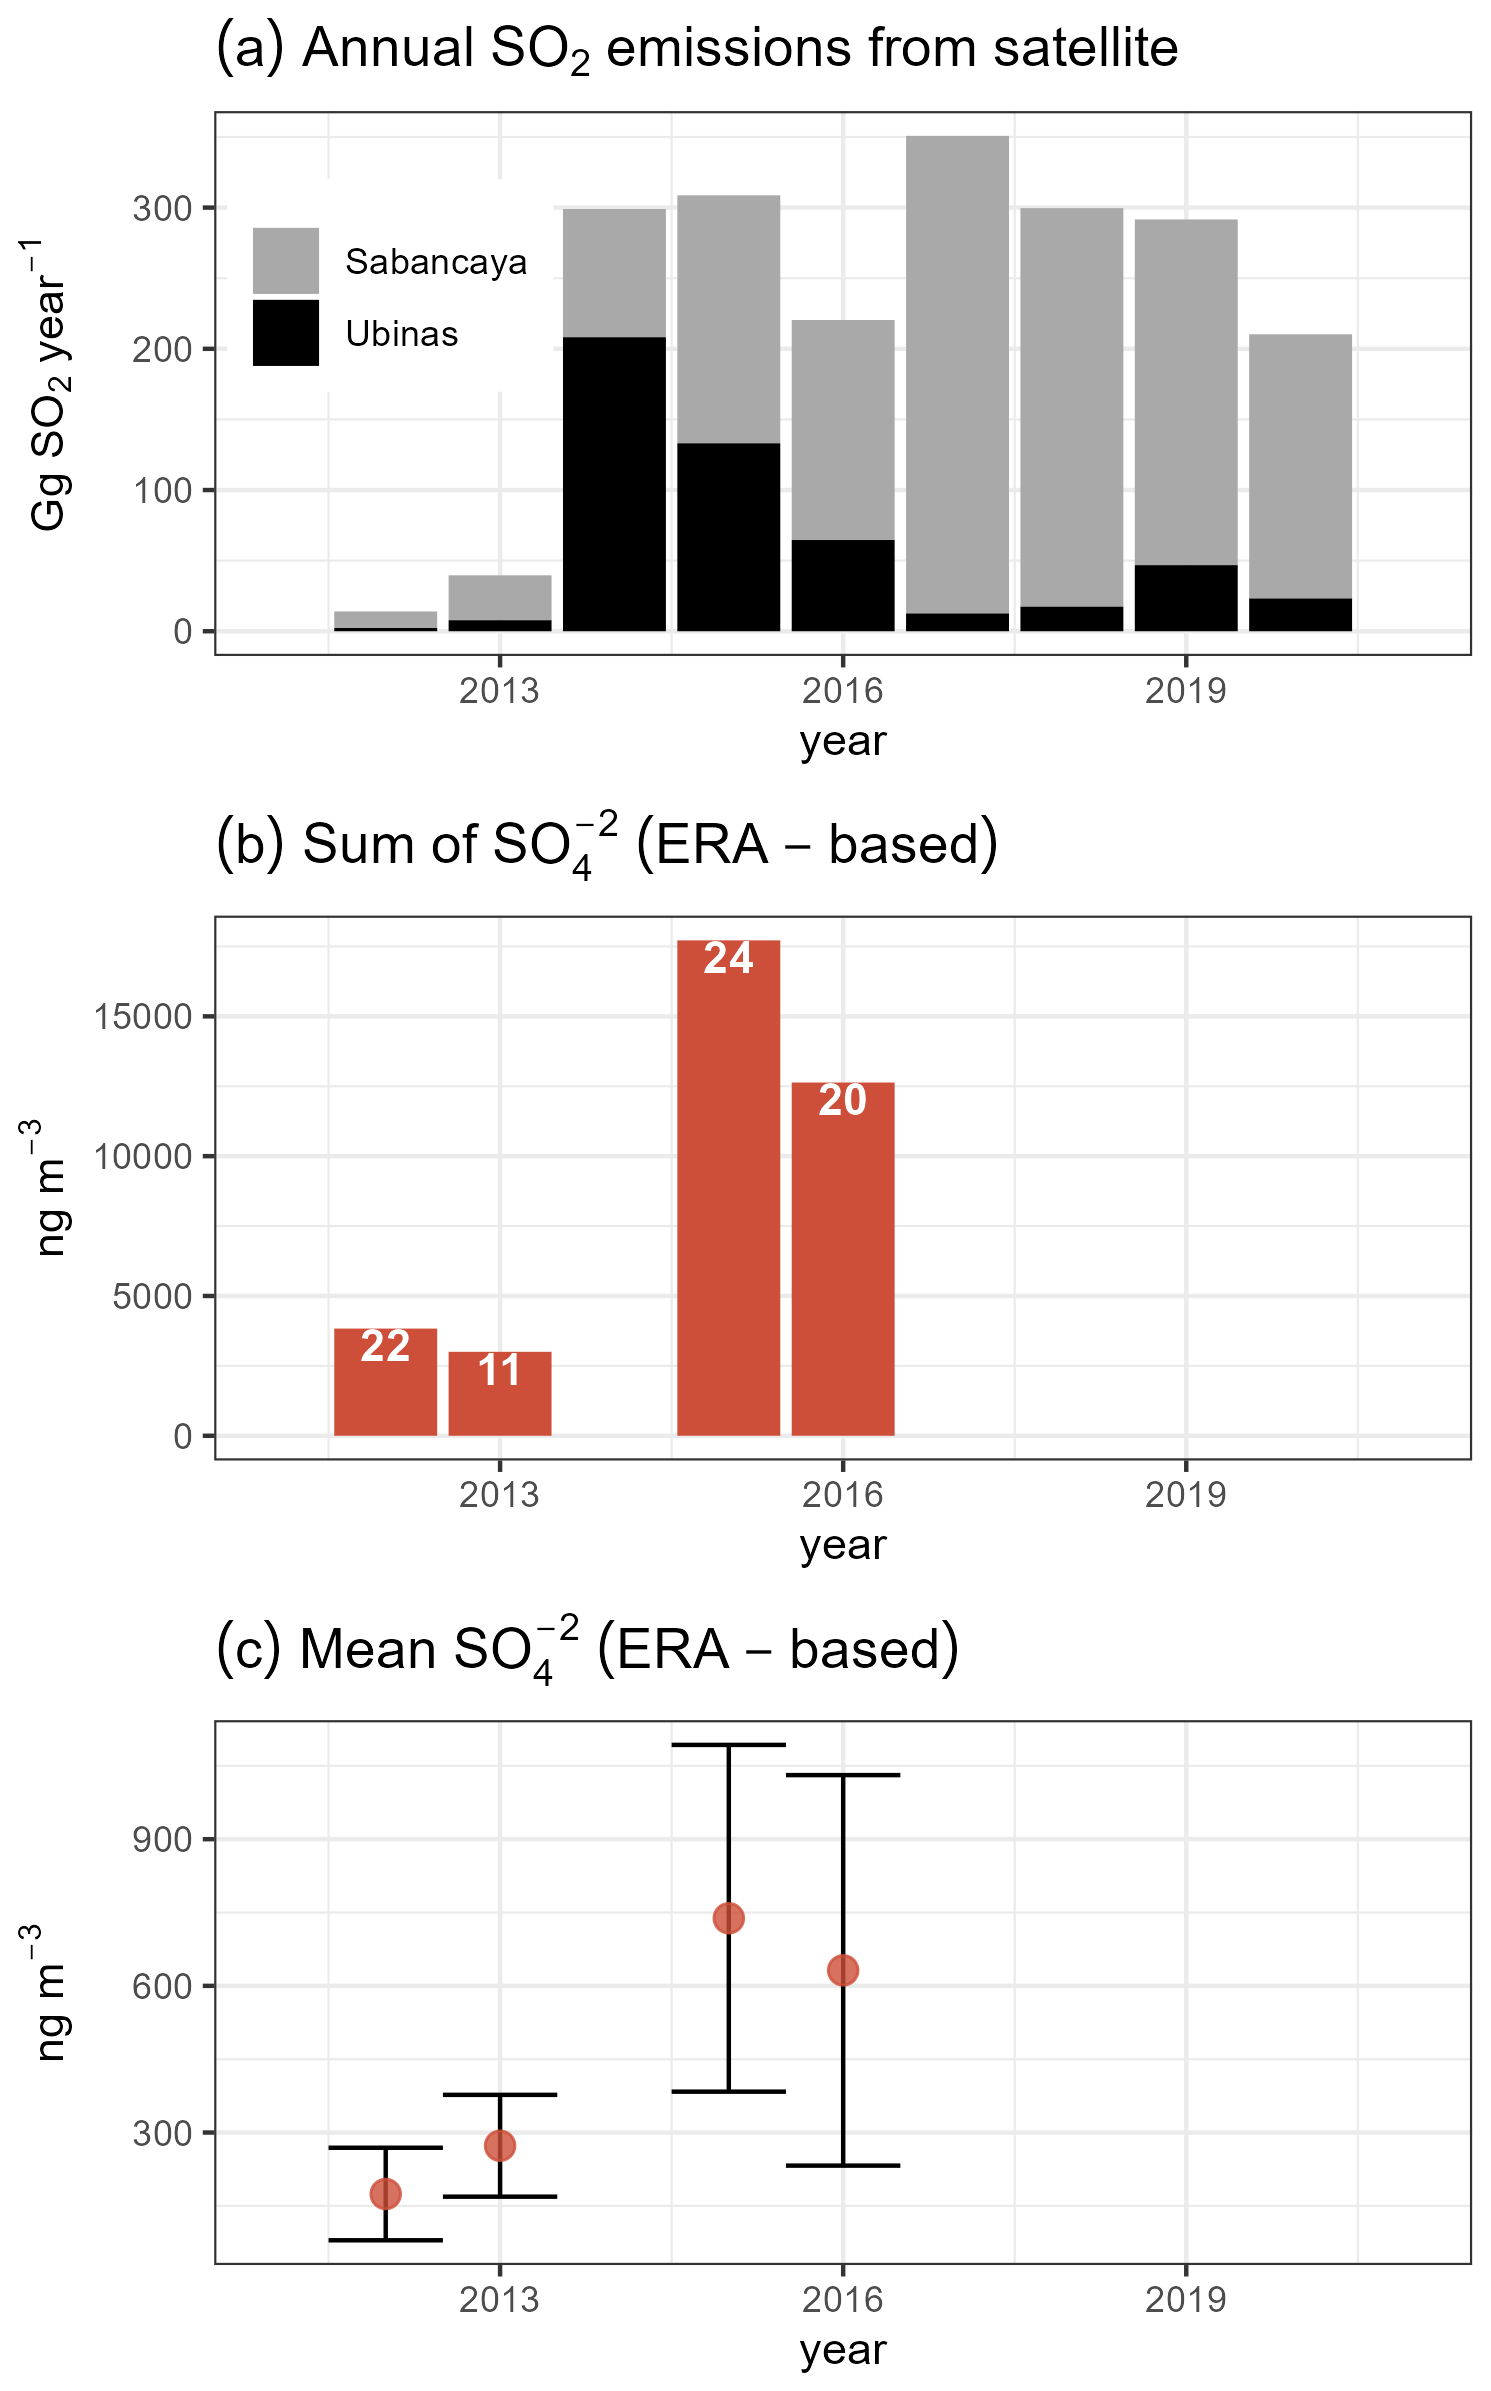
Figure 8Study case for volcanic transport. Only years with at least 9 months of filter data were used. (a) Annual SO2 emissions for Sabancaya (grey) and Ubinas (black) from the global catalog of SO2 emissions (Fioletov et al., 2023) (b) Accumulated SO measured in the filters taken under W and/or NW influence grouped per year based on ERA-5 back trajectories. The number of samples used is in white inside the bars. (c) Mean concentration and standard deviation for the selected samples.
As observed from satellite detection, the aforementioned volcanoes have been in an active degassing phase since 2014 and the total sulfate detected at the station (sum of sulfate, Fig. 8b) is in agreement with the sharp increase in SO2 emissions (Fig. 8a). Even the mean sulfate concentration per sample is significantly higher after 2014 (Fig. 8c). Note that the years 2012–2013 are statistically different from 2015–2016. As a control case, MeSO transport was also calculated (Fig. S16), indicating a relatively constant marine source with few circulation changes over the studied period. Moreover, as pointed out by Olson et al. (2021), Sabancaya emissions do not seem to subside and influence nearby locations below the vent (volcanism contributes only 9 % of the measured sulfate in the city of Arequipa), which seems to also be the case at La Paz and El Alto, where long-range secondary sulfate contributes only 8 % of the aerosol mass (Mardoñez et al., 2023). Therefore, we hypothesize that volcanic emissions are readily transported aloft, directly influencing high-altitude sites downwind such as Chacaltaya, as detected by the “westward” factor of the source apportionment study. In consequence, the statistically significant increase in SO of our samples from 2014 onwards seems to be mostly related to an intensified degassing process of Peruvian volcanoes, leading to a regional increase in H2SO4.
3.5 Short-term study: mass and mass closure
Most of the samples were not weighted, but a subset of them does have information on aerosol mass for PM10. This is presented in Table 6. PM10 mass ranges from 2.4 to 22.6 µg m−3 (at ambient conditions: 1.1–12.0 µg m−3). Even though this dataset is limited in temporal extent, it is consistent with measurements made at mountain sites, like Pûy de Dôme in France (5.6 ± 4.6 µg m−3, Bourcier et al., 2012), Mt. Atlas in Morocco (11.8–14.5 µg m−3, Deabji et al., 2021), Mt. Everest in Nepal (10 µg m−3, Decesari et al., 2010), Montsec in Spain (2.9–20.6 µg m−3; Ripoll et al., 2015), and Izaña in the Canary Islands (10.9–50.5 µg m−3; García et al., 2017a, b). The highest measured mass coincides with a dry month and the start of the eruptions of Sabancaya volcano in November 2016 (Moussallam et al., 2017).
Table 6Chacaltaya STP concentrations of PM10 total mass, mineral matter (MM), secondary inorganic aerosol (SIA), elemental carbon (EC), the sum of trace and rare elements (TE), organic matter minimum and maximum estimations, and the fraction of non-determined (ND) aerosol, with its range defined by the OM variation. No ion data for B49 and B50. For ambient conditions, divide concentrations by 1.88.
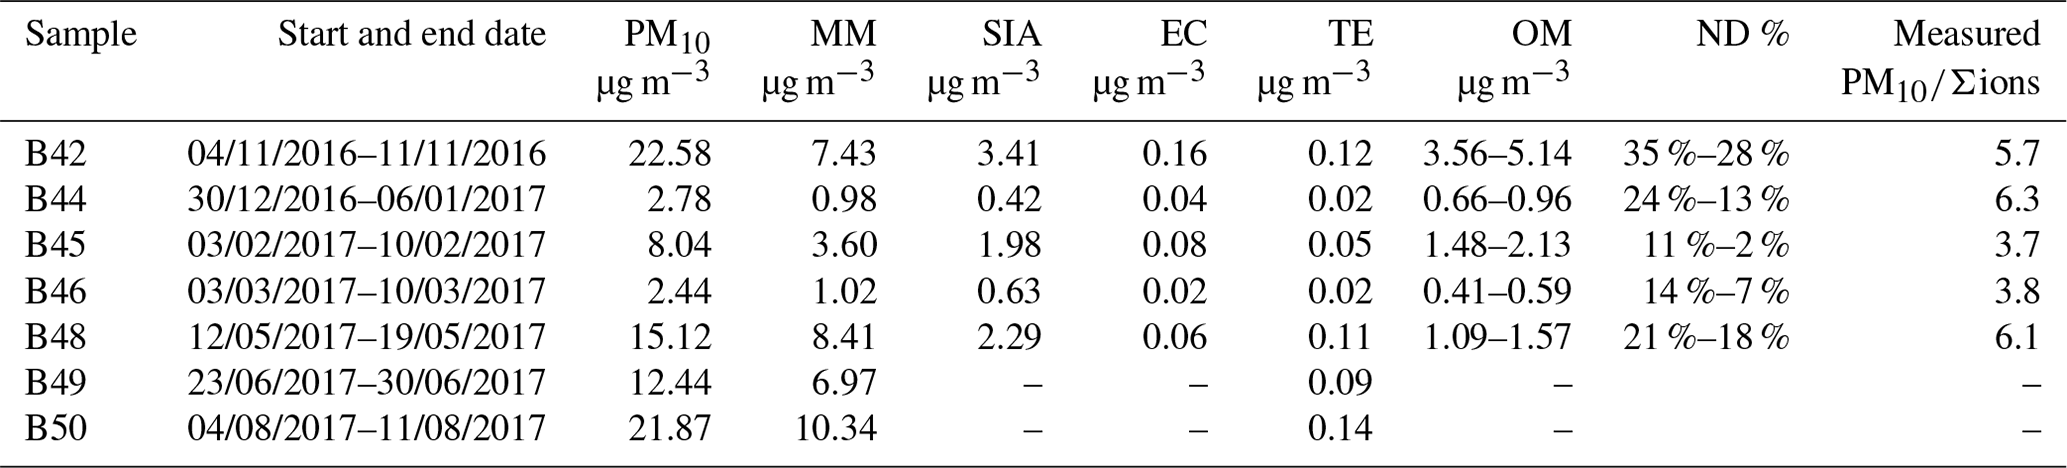
For mass closure estimation, organic matter (OM) was calculated based on OC concentrations. As source contributions vary with the seasons, it is not possible to assign a single conversion factor between OC and OM. Therefore, it was estimated for two cases: a minimum value using a factor of 1.8 as for other mountain sites and a maximum value using a factor of 2.6 as for aged aerosol (Cozic et al., 2008; Chow et al., 2015, and references therein), so organic contributions were estimated to range from 7 % to 34 % for the available series.
The contribution of mineral dust is very important, especially for the dry season, accounting for 33 %–56 % of PM10. This fraction is higher than in La Paz–El Alto, where mineral dust contributes 20 %–35 % of the mass (Mardoñez et al., 2023). Secondary inorganic aerosol (SIA = NH NO SO) ranged from 15 % to 26 %, with all sulfur found in soluble form. The unaccounted for fraction (ND) is related to heteroatoms and water content, and it usually ranges from 20 % to 40 % (Tsyro, 2005; Hueglin et al., 2005). For our case, the non-determined fraction ranged from 2 % to 35 %, being particularly lower in the wet season. This may be due to wash-out of hygroscopic species and maybe also to fewer heteroatoms present in the organic fraction, though this is still under study.
In this study, we present a unique long-term record of the chemical composition of aerosol sampled at the Chacaltaya station, the highest in the GAW network. The information is valuable in a region otherwise poorly characterized, documenting the variability of an essential climate variable in the tropical Andes.
Concentration levels of PM10 range from 2.4 to 22.6 µg m−3 STP, confirming that the site is regularly influenced by nearby sources such as rural emissions and urban pollution and that the air sampled at 5380 m a.s.l. is not purely free-tropospheric. The station is representative of the regional background in a radius of 200–1600 km, with the distance from the site depending on the transport conditions. Loss of coarse particles along the way seems important.
The seasonality of several species has been described for the first time in the region, showing the lowest concentrations for most species during the wet months (December to March) and maximum concentrations during the dry months (April to November). This is due to the marked seasonality of both the transport conditions and intensity of source emissions.
Between June and November (though with absolute maxima from July to September), the high concentrations of an important number of species (EC, OC, K+, Br−, F−, Cl−, NO, formate, oxalate, and levoglucosan) are related to agricultural practices, which include biomass burning. Biomass burning practices clearly influence regional aerosol composition, contrary to what was found at this site 4 decades ago, when deforestation (and subsequent land use change) was just beginning in Amazonia and therefore the Andean aerosol was only marginally influenced by biomass burning emissions.
This study also reports key organic compounds emitted by direct biogenic emissions. The sugar alcohols arabitol and mannitol are not strongly correlated, which marks a different behavior compared to other documented sites. Other biogenic sources (K+) are also detected during the wet season, but additional studies are needed to fully understand the behavior of primary biogenic aerosols in the Amazonian and Andean regions. All this gains relevance in a period when deforestation is advancing rapidly in the region, and therefore documentation of its effects on the aerosol chemical composition is needed.
The cities of La Paz and El Alto clearly affect the aerosol chemical composition with EC, NO, and oxalate as traffic indicators and 29 % of the total OC* burden. The surrounding activities over the Altiplano include NH from agricultural activities and litter burning and glucose likely related to vascular vegetation debris (grasslands, agriculture). Additionally, insoluble mineral matter represents an important fraction (33 %–56 %) of the aerosol, originating from dry soils. All these are transported from below the station along with the development of the convective planetary boundary layer and are likely to have an impact on a wide scale at high altitude in the region.
The ratio encompasses a range similar to rural and remote background sites and does not have a marked seasonality, likely due to the dominant influence of long-range transport (accounting for 71 % of OC*) and the constant aging processes that take place at high altitude in the tropical altitude region all year round in spite of the change in circulation patterns and source activity.
Sustained volcanic degassing from Sabancaya and Ubinas is hypothesized to influence the regional background of sulfate, especially at high altitude, as emissions are directly vented out above 5000 m a.s.l., where conditions for long-range transport are met. Interestingly, as active volcanoes lie on the path between the Pacific Ocean and Chacaltaya, their emissions arrive along with aged marine air masses. The recent unveiling of those volcanic sources can help reinterpret paleorecords in light of the current knowledge of transport conditions to the tropical Andes. These measurements constitute one of the first long-term observations of aerosol chemical composition at a high-altitude site in the tropical Southern Hemisphere. The high altitude poses numerous challenges when it comes to maintaining sample collection and analysis. However, these efforts have yielded valuable insights into this specific region, allowing us to effectively track and comprehend the natural and anthropogenic influences at play.
Data are available through the WMO/GAW WDCA monitoring database (EBAS) currently hosted at the Norwegian Institute for Air Research (NILU) at https://ebas-data.nilu.no/ (last access: 19 February 2024) for Mount Chacaltaya.
The supplement related to this article is available online at: https://doi.org/10.5194/acp-24-2837-2024-supplement.
CIM, FV, and LT performed the fieldwork. FV generated the back-trajectory data, and LT, AMK, and DA contributed to their treatment. AA made the mass and elemental measurements possible; JLJ supervised the chemical analyses and provided most of the funding for doing them. CIM, RK, GU, AA, and PL conceptualized the paper. CIM curated and analyzed the data and prepared the paper with contributions from all co-authors.
At least one of the (co-)authors is a member of the editorial board of Atmospheric Chemistry and Physics. The peer-review process was guided by an independent editor, and the authors also have no other competing interests to declare.
Publisher's note: Copernicus Publications remains neutral with regard to jurisdictional claims made in the text, published maps, institutional affiliations, or any other geographical representation in this paper. While Copernicus Publications makes every effort to include appropriate place names, the final responsibility lies with the authors.
We acknowledge all the personnel of IIF-UMSA for assisting with the station functioning (Mabel Agramont, Pedro Miranda), maintenance (Natalio Choque, Edwin Cusi, Tito Zabaleta), and electric troubleshooting (Fabricio Avila, Iván Rivero), as well as the IRD (Institut de Recherche pour le Développement) delegation in Bolivia for assisting with logistics and customs clearance for the instruments. The research activities at the global GAW station are supported by an international consortium that includes the UMSA, the IRD, the Leibniz Institute for Tropospheric Research, the Consejo Superior de Investigaciones Científicas (CSIC), the Laboratoire des Sciences du Climat et de l’Environnement (LSCE), and the University of Stockholm.
Many people are to be thanked at IDAEA and IGE for the analyses of the overall series of filters, essentially non-permanent engineers from the IGE Air Quality Group (Antoine Waked, Céline Charlet, Fanny Donaz, Fanny Masson, Sylvie Ngo, Vincent Lucaire, Anthony Vella, Claire Verin, Rhabira Elazzouzi), together with many students and trainees.
We thank Stefano Decesari (ISAC-CNR) for making chemistry of the Nepal Climate Observatory available, Danilo Custodio (USP, HZH) for clarifying the details of Mato Grosso cities, and Yves Moussallam (Columbia University) for sharing Sabancaya plume composition.
The instrumental deployment was supported by the French Ministère de la Recherche under ACTRIS-FR activities, the Centre National de la Recherche Scientifique (CNRS) under the SNO-CLAP program, and the Observatoire de Sciences de l’Univers de Grenoble under Labex OSUG@2020. Analytical aspects of this research have been supported at IGE by the Air-O-Sol platform within Labex OSUG@2020 (ANR10 LABX56).
This paper was edited by Ivan Kourtchev and reviewed by Héctor Jorquera and one anonymous referee.
Abdalla, H. I.: A Brief Comparison of K-means and Agglomerative Hierarchical Clustering Algorithms on Small Datasets, in: Proceeding of 2021 International Conference on Wireless Communications, Networking and Applications, Singapore, 623–632, https://doi.org/10.1007/978-981-19-2456-9_64, 2022.
Adams, F., Dams, R., Guzman, L., and Winchester, J. W.: Background aerosol composition on Chacaltaya mountain, Bolivia, Atmos. Environ., 11, 629–634, https://doi.org/10.1016/0004-6981(77)90116-0, 1977.
Adams, F., Van Espen, P., and Maenhaut, W.: Aerosol composition at Chacaltaya, Bolivia, as determined by size-fractionated sampling, Atmos. Environ., 17, 1521–1536, https://doi.org/10.1016/0004-6981(83)90306-2, 1983.
Aiuppa, A., Baker, D. R., and Webster, J. D.: Halogens in volcanic systems, Chem. Geol., 263, 1–18, https://doi.org/10/bfkwsx, 2009.
Alastuey, A., Querol, X., Aas, W., Lucarelli, F., Pérez, N., Moreno, T., Cavalli, F., Areskoug, H., Balan, V., Catrambone, M., Ceburnis, D., Cerro, J. C., Conil, S., Gevorgyan, L., Hueglin, C., Imre, K., Jaffrezo, J.-L., Leeson, S. R., Mihalopoulos, N., Mitosinkova, M., O'Dowd, C. D., Pey, J., Putaud, J.-P., Riffault, V., Ripoll, A., Sciare, J., Sellegri, K., Spindler, G., and Yttri, K. E.: Geochemistry of PM10 over Europe during the EMEP intensive measurement periods in summer 2012 and winter 2013, Atmos. Chem. Phys., 16, 6107–6129, https://doi.org/10.5194/acp-16-6107-2016, 2016.
Aliaga, D., Sinclair, V. A., Andrade, M., Artaxo, P., Carbone, S., Kadantsev, E., Laj, P., Wiedensohler, A., Krejci, R., and Bianchi, F.: Identifying source regions of air masses sampled at the tropical high-altitude site of Chacaltaya using WRF-FLEXPART and cluster analysis, Atmos. Chem. Phys., 21, 16453–16477, https://doi.org/10.5194/acp-21-16453-2021, 2021.
Allen, A. G., Oppenheimer, C., Ferm, M., Baxter, P. J., Horrocks, L. A., Galle, B., McGonigle, A. J. S., and Duffell, H. J.: Primary sulfate aerosol and associated emissions from Masaya Volcano, Nicaragua: Primary sulfate aerosol from Masaya volcano, J. Geophys. Res., 107, ACH 5-1–ACH 5-8, https://doi.org/10.1029/2002JD002120, 2002.
Andrade, M., Moreno, I., Calle, J. M., Ticona, L., Blacutt, L., Lavado-Casimiro, W., Sabino, E., Huerta, A., Aybar, C., Hunziker, S., Brönnimann, S., Imfield, N., Zamuriano, M., Yager, K., and Valdivia, C.: Climate and extreme events from the Central Altiplano of Peru and Bolivia, 1981–2010, edited by: Andrade, M. F., Geographica Bernensia, 188 pp., https://boris.unibe.ch/108978/1/GB_Climate_Atlas_Altiplano_lores.pdf (last access: 19 February 2024), 2017.
Andreae, M. O., Browell, E. V., Garstang, M., Gregory, G. L., Hill, G. F., Jacob, D. J., Pereira, M. C., Sachse, G. W., Setzer, A. W., Dias, P. L. S., Talbot, R. W., Torres, A. L., and Wofsy, S. C.: Biomass-burning emissions and associated haze layers over Amazonia, J. Geophys. Res.-Atmos., 93, 1509–1527, https://doi.org/10/btrgnr, 1988.
Artaxo, P., Rizzo, L. V., Paixão, M., de Lucca, S., Oliveira, P. H., Lara, L. L., Wiedemann, K. T., Andreae, M. O., Holben, B., Schafer, J., Correia, A. L., and Pauliquevis, T. M.: Aerosol particles in Amazonia: Their composition, role in the radiation balance, cloud formation, and nutrient cycles, in: Geophysical Monograph Series, vol. 186, edited by: Keller, M., Bustamante, M., Gash, J., Silva Dias, P., Keller, M., Bustamante, M. C., Gash, J., and Silva Dias, P., American Geophysical Union, Washington, D. C., 233–250, https://doi.org/10.1029/2008GM000778, 2009.
Ashbaugh, L. L. and Eldred, R. A.: Loss of Particle Nitrate from Teflon Sampling Filters: Effects on Measured Gravimetric Mass in California and in the IMPROVE Network, J. Air Waste Manage., 54, 93–104, https://doi.org/10.1080/10473289.2004.10470878, 2004.
Aymoz, G., Jaffrezo, J. L., Chapuis, D., Cozic, J., and Maenhaut, W.: Seasonal variation of PM10 main constituents in two valleys of the French Alps. I: fractions, Atmos. Chem. Phys., 7, 661–675, https://doi.org/10.5194/acp-7-661-2007, 2007.
Barbosa, C. G. G.: Monitoramento de material particulado fino na cidade de Manaus para avaliaçao des potenciais riscos à saude da populaçao e caracterizaçao de material particulado em ambient de floresta (ATTO – Amazonian Tall Tower Observatory) – Amazonas, Brasil, Master Degree dissertation, Universidade Federal do Paraná, Brazil, 106 pp., https://acervodigital.ufpr.br/handle/1884/35919 (last access: 19 February 2024), 2014.
Barraza, F., Uzu, G., Jaffrezo, J.-L., Schreck, E., Budzinski, H., Le Menach, K., Dévier, M.-H., Guyard, H., Calas, A., Perez, M.-I., Villacreces, L.-A., and Maurice, L.: Contrasts in chemical composition and oxidative potential in PM10 near flares in oil extraction and refining areas in Ecuador, Atmos. Environ., 223, 117302, https://doi.org/10.1016/j.atmosenv.2020.117302, 2020.
Bauer, H., Claeys, M., Vermeylen, R., Schueller, E., Weinke, G., Berger, A., and Puxbaum, H.: Arabitol and mannitol as tracers for the quantification of airborne fungal spores, Atmos. Environ., 42, 588–593, https://doi.org/10/c8ct3g, 2008.
Belis, C. A., Favez, O., Mircea, M., Diapouli, E., Manousakas, M.-I., Vratolis, S., Gilardoni, S., Paglione, M., Decesari, S., Mocnik, G., Mooibroek, D., Salvador, P., Takahama, S., Vecchi, R., and Paatero, P.: European guide on air pollution source apportionment with receptor models – Revised version 2019, EUR 29816 EN, Publications Office of the European Union, Luxembourg, ISBN 978-92-76-09001-4, https://doi.org/10.2760/439106, 2019.
Bianchi, F., Sinclair, V. A., Aliaga, D., Zha, Q., Scholz, W., Wu, C., Heikkinen, L., Modini, R., Partoll, E., Velarde, F., Moreno, I., Gramlich, Y., Huang, W., Leiminger, M., Enroth, J., Peräkylä, O., Marinoni, A., Xuemeng, C., Blacutt, L., Forno, R., Gutierrez, R., Ginot, P., Uzu, G., Facchini, M. C., Gilardoni, S., Gysel-Beer, M., Cai, R., Petäjä, T., Rinaldi, M., Saathoff, H., Sellegri, K., Worsnop, D., Artaxo, P., Hansel, A., Kulmala, M., Wiedensohler, A., Laj, P., Krejci, R., Carbone, S., Andrade, M., and Mohr, C.: The SALTENA experiment: Comprehensive observations of aerosol sources, formation and processes in the South American Andes, B. Am. Meteorol. Soc., 103, E212–E229, https://doi.org/10/gmqgv2, 2021.
Birch, M. E. and Cary, R. A.: Elemental Carbon-Based Method for Monitoring Occupational Exposures to Particulate Diesel Exhaust, Aerosol Sci. Technol., 25, 221–241, https://doi.org/10/cnnhxc, 1996.
Bonasoni, P., Laj, P., Marinoni, A., Sprenger, M., Angelini, F., Arduini, J., Bonafè, U., Calzolari, F., Colombo, T., Decesari, S., Di Biagio, C., di Sarra, A. G., Evangelisti, F., Duchi, R., Facchini, MC., Fuzzi, S., Gobbi, G. P., Maione, M., Panday, A., Roccato, F., Sellegri, K., Venzac, H., Verza, GP., Villani, P., Vuillermoz, E., and Cristofanelli, P.: Atmospheric Brown Clouds in the Himalayas: first two years of continuous observations at the Nepal Climate Observatory-Pyramid (5079 m), Atmos. Chem. Phys., 10, 7515–7531, https://doi.org/10.5194/acp-10-7515-2010, 2010.
Bourcier, L., Sellegri, K., Chausse, P., Pichon, J. M., and Laj, P.: Seasonal variation of water-soluble inorganic components in aerosol size-segregated at the puy de Dôme station (1,465 m a.s.l.), France, J. Atmos. Chem., 69, 47–66, https://doi.org/10/f33tfm, 2012.
Bourgeois, Q., Ekman, A. M. L., and Krejci, R.: Aerosol transport over the Andes from the Amazon Basin to the remote Pacific Ocean: A multiyear CALIOP assessment: Aerosol transport over the Andes, J. Geophys. Res.-Atmos., 120, 8411–8425, https://doi.org/10/f3nfkx, 2015.
Bradley, A. V. and Millington, A. C.: Spatial and temporal scale issues in determining biomass burning regimes in Bolivia and Peru, Int. J. Remote Sens., 27, 2221–2253, https://doi.org/10.1080/01431160500396550, 2006.
Brighty, A., Jacob, V., Uzu, G., Borlaza, L., Conil, S., Hueglin, C., Grange, S. K., Favez, O., Trébuchon, C., and Jaffrezo, J.-L.: Cellulose in atmospheric particulate matter at rural and urban sites across France and Switzerland, Atmos. Chem. Phys., 22, 6021–6043, https://doi.org/10.5194/acp-22-6021-2022, 2022.
Brugger, S. O., Gobet, E., Osmont, D., Behling, H., Fontana, S. L., Hooghiemstra, H., Morales-Molino, C., Sigl, M., Schwikowski, M., and Tinner, W.: Tropical Andean glacier reveals colonial legacy in modern mountain ecosystems, Quaternary Sci. Rev., 220, 1–13, https://doi.org/10/gmrzgb, 2019.
Carmona-Moreno, C., Belward, A., Malingreau, J.-P., Hartley, A., Garcia-Alegre, M., Antonovskiy, M., Buchshtaber, V., and Pivovarov, V.: Characterizing interannual variations in global fire calendar using data from Earth observing satellites, Glob. Change Biol., 11, 1537–1555, https://doi.org/10/bhkpnh, 2005.
Carn, S. A., Fioletov, V. E., McLinden, C. A., Li, C., and Krotkov, N. A.: A decade of global volcanic SO2 emissions measured from space, Sci. Rep., 7, 44095, https://doi.org/10/f9tdsj, 2017.
Castro, L. M., Pio, C. A., Harrison, R. M., and Smith, D. J. T.: Carbonaceous aerosol in urban and rural European atmospheres: estimation of secondary organic carbon concentrations, Atmos. Environ., 33, 2771–2781, https://doi.org/10/fg78qp, 1999.
Cautreels, W., Van Cauwenberghe, K., and Guzman, L. A.: Comparison between the organic fraction of suspended matter at a background and an urban station, Sci. Total Environ., 8, 79–88, https://doi.org/10.1016/0048-9697(77)90063-8, 1977.
Cavalli, F., Viana, M., Yttri, K. E., Genberg, J., and Putaud, J.-P.: Toward a standardised thermal-optical protocol for measuring atmospheric organic and elemental carbon: the EUSAAR protocol, Atmos. Meas. Tech., 3, 79–89, https://doi.org/10.5194/amt-3-79-2010, 2010.
Chauvigné, A., Aliaga, D., Sellegri, K., Montoux, N., Krejci, R., Močnik, G., Moreno, I., Müller, T., Pandolfi, M., Velarde, F., Weinhold, K., Ginot, P., Wiedensohler, A., Andrade, M., and Laj, P.: Biomass burning and urban emission impacts in the Andes Cordillera region based on in situ measurements from the Chacaltaya observatory, Bolivia (5240 m a.s.l.), Atmos. Chem. Phys., 19, 14805–14824, https://doi.org/10.5194/acp-19-14805-2019, 2019.
Chow, J. C., Lowenthal, D. H., Chen, L.-W. A., Wang, X., and Watson, J. G.: Mass reconstruction methods for PM2.5: a review, Air Qual. Atmos. Hlth., 8, 243–263, https://doi.org/10.1007/s11869-015-0338-3, 2015.
Claeys, M., Graham, B., Vas, G., Wang, W., Vermeylen, R., Pashynska, V., Cafmeyer, J., Guyon, P., Andreae, M. O., Artaxo, P., and Maenhaut, W.: Formation of Secondary Organic Aerosols Through Photooxidation of Isoprene, Science, 303, 1173–1176, https://doi.org/10.1126/science.1092805, 2004.
Censos de población y vivienda: https://www.ine.gob.bo/index.php/censos-y-banco-de-datos/censos/, last access: 12 February 2021.
Claeys, M., Kourtchev, I., Pashynska, V., Vas, G., Vermeylen, R., Wang, W., Cafmeyer, J., Chi, X., Artaxo, P., Andreae, M. O., and Maenhaut, W.: Polar organic marker compounds in atmospheric aerosols during the LBA-SMOCC 2002 biomass burning experiment in Rondônia, Brazil: sources and source processes, time series, diel variations and size distributions, Atmos. Chem. Phys., 10, 9319–9331, https://doi.org/10.5194/acp-10-9319-2010, 2010.
Collaud Coen, M., Andrews, E., Aliaga, D., Andrade, M., Angelov, H., Bukowiecki, N., Ealo, M., Fialho, P., Flentje, H., Hallar, A. G., Hooda, R., Kalapov, I., Krejci, R., Lin, N.-H., Marinoni, A., Ming, J., Nguyen, N. A., Pandolfi, M., Pont, V., Ries, L., Rodríguez, S., Schauer, G., Sellegri, K., Sharma, S., Sun, J., Tunved, P., Velasquez, P., and Ruffieux, D.: Identification of topographic features influencing aerosol observations at high altitude stations, Atmos. Chem. Phys., 18, 12289–12313, https://doi.org/10.5194/acp-18-12289-2018, 2018.
Correia, A., Freydier, R., Delmas, R. J., Simões, J. C., Taupin, J.-D., Dupré, B., and Artaxo, P.: Trace elements in South America aerosol during 20th century inferred from a Nevado Illimani ice core, Eastern Bolivian Andes (6350 m asl), Atmos. Chem. Phys., 3, 1337–1352, https://doi.org/10.5194/acp-3-1337-2003, 2003.
Cozic, J., Verheggen, B., Weingartner, E., Crosier, J., Bower, K. N., Flynn, M., Coe, H., Henning, S., Steinbacher, M., Henne, S., Collaud Coen, M., Petzold, A., and Baltensperger, U.: Chemical composition of free tropospheric aerosol for PM1 and coarse mode at the high alpine site Jungfraujoch, Atmos. Chem. Phys., 8, 407–423, https://doi.org/10.5194/acp-8-407-2008, 2008.
Custodio, D., Alves, C., Jomolca, Y., and de Castro Vasconcellos, P.: Carbonaceous components and major ions in PM10 from the Amazonian Basin, Atmos. Res., 215, 75–84, https://doi.org/10/gnpd5v, 2019.
Deabji, N., Fomba, K. W., El Hajjaji, S., Mellouki, A., Poulain, L., Zeppenfeld, S., and Herrmann, H.: First insights into northern Africa high-altitude background aerosol chemical composition and source influences, Atmos. Chem. Phys., 21, 18147–18174, https://doi.org/10.5194/acp-21-18147-2021, 2021.
De Angelis, M., Simões, J., Bonnaveira, H., Taupin, J.-D., and Delmas, R. J.: Volcanic eruptions recorded in the Illimani ice core (Bolivia): 1918–1998 and Tambora periods, Atmos. Chem. Phys., 3, 1725–1741, https://doi.org/10.5194/acp-3-1725-2003, 2003.
DeCarlo, P. F., Dunlea, E. J., Kimmel, J. R., Aiken, A. C., Sueper, D., Crounse, J., Wennberg, P. O., Emmons, L., Shinozuka, Y., Clarke, A., Zhou, J., Tomlinson, J., Collins, D. R., Knapp, D., Weinheimer, A. J., Montzka, D. D., Campos, T., and Jimenez, J. L.: Fast airborne aerosol size and chemistry measurements above Mexico City and Central Mexico during the MILAGRO campaign, Atmos. Chem. Phys., 8, 4027–4048, https://doi.org/10.5194/acp-8-4027-2008, 2008.
Decesari, S., Facchini, M. C., Carbone, C., Giulianelli, L., Rinaldi, M., Finessi, E., Fuzzi, S., Marinoni, A., Cristofanelli, P., Duchi, R., Bonasoni, P., Vuillermoz, E., Cozic, J., Jaffrezo, J. L., and Laj, P.: Chemical composition of PM10 and PM1 at the high-altitude Himalayan station Nepal Climate Observatory-Pyramid (NCO-P) (5079 m a.s.l.), Atmos. Chem. Phys., 10, 4583–4596, https://doi.org/10.5194/acp-10-4583-2010, 2010.
de Magalhães, N., Evangelista, H., Condom, T., Rabatel, A., and Ginot, P.: Amazonian Biomass Burning Enhances Tropical Andean Glaciers Melting, Sci. Rep., 9, 16914, https://doi.org/10/ggfsd4, 2019.
Dutra, D. J., Anderson, L. O., Fearnside, P. M., Graça, P. M. L. D. A., Yanai, A. M., Dalagnol, R., Burton, C., Jones, C., Betts, R., and Aragão, L. E. O. E. C. D.: Fire Dynamics in an Emerging Deforestation Frontier in Southwestern Amazonia, Brazil, Fire, 6, 2, https://doi.org/10.3390/fire6010002, 2022.
Eatough, D. J., Caka, F. M., and Farber, R. J.: The Conversion of SO2 to Sulfate in the Atmosphere, Isr. J. Chem., 34, 301–314, https://doi.org/10.1002/ijch.199400034, 1994.
Elbert, W., Taylor, P. E., Andreae, M. O., and Pöschl, U.: Contribution of fungi to primary biogenic aerosols in the atmosphere: wet and dry discharged spores, carbohydrates, and inorganic ions, Atmos. Chem. Phys., 7, 4569–4588, https://doi.org/10.5194/acp-7-4569-2007, 2007.
EMEP Manual for Sampling and Analysis: https://projects.nilu.no//ccc/manual/index.html, last access: 21 January 2020.
Espinoza, J. C., Ronchail, J., Marengo, J. A., and Segura, H.: Contrasting North–South changes in Amazon wet-day and dry-day frequency and related atmospheric features (1981–2017), Clim. Dynam., 52, 5413–5430, https://doi.org/10/gmrzgv, 2019.
Espinoza, J. C., Garreaud, R., Poveda, G., Arias, P. A., Molina-Carpio, J., Masiokas, M., Viale, M., and Scaff, L.: Hydroclimate of the Andes Part I: Main Climatic Features, Front. Earth Sci., 8, 64, https://doi.org/10/ggpv65, 2020.
Estellano, V. H., Pozo, K., Harner, T., Franken, M., and Zaballa, M.: Altitudinal and Seasonal Variations of Persistent Organic Pollutants in the Bolivian Andes Mountains, Environ. Sci. Technol., 42, 2528–2534, https://doi.org/10/fqszr7, 2008.
Finlayson-Pitts, B. J. and Pitts Jr, J. N.: Chemistry of the upper and lower atmosphere: theory, experiments, and applications, Elsevier, ISBN 9780122570605, 1999.
Fioletov, V. E., McLinden, C. A., Griffin, D., Abboud, I., Krotkov, N., Leonard, P. J. T., Li, C., Joiner, J., Theys, N., and Carn, S.: Version 2 of the global catalogue of large anthropogenic and volcanic SO2 sources and emissions derived from satellite measurements, Earth Syst. Sci. Data, 15, 75–93, https://doi.org/10.5194/essd-15-75-2023, 2023.
Forster, P. M., Storelvmo, T., Armour, K. C., Collins, W. D., Dufresne, J.-L., Frame, D. J., Lunt, D. J., Mauritsen, T., Palmer, M. D., Watanabe, M., Wild, M., and Zhang, H.: The Earth's Energy Budget, Climate Feedbacks and Climate Sensitivity, in: Climate Change 2021: The Physical Science Basis. Contribution of Working Group I to the Sixth Assessment Report of the Intergovernmental Panel on Climate Change, edited by: Masson-Delmotte, V., Zhai, P., Pirani, A., Connors, S. L., Péan, C., Berger, S., Caud, N., Chen, Y., Goldfarb, L., Gomis, M. I., Huang, M., and Leitzell, K., Cambridge University Press, Cambridge, United Kingdom and New York, NY, USA, 923–1054, https://doi.org/10.1017/9781009157896.009, 2021.
Fuzzi, S., Decesari, S., Facchini, M. C., Cavalli, F., Emblico, L., Mircea, M., Andreae, M. O., Trebs, I., Hoffer, A., Guyon, P., Artaxo, P., Rizzo, L. V., Lara, L. L., Pauliquevis, T., Maenhaut, W., Raes, N., Chi, X., Mayol-Bracero, O. L., Soto-García, L. L., Claeys, M., Kourtchev, I., Rissler, J., Swietlicki, E., Tagliavini, E., Schkolnik, G., Falkovich, A. H., Rudich, Y., Fisch, G., and Gatti, L. V.: Overview of the inorganic and organic composition of size-segregated aerosol in Rondônia, Brazil, from the biomass-burning period to the onset of the wet season, J. Geophys. Res., 112, D01201, https://doi.org/10/b674dx, 2007.
García, M. I., Rodríguez, S., and Alastuey, A.: Impact of North America on the aerosol composition in the North Atlantic free troposphere, Atmos. Chem. Phys., 17, 7387–7404, https://doi.org/10.5194/acp-17-7387-2017, 2017a.
García, M. I., van Drooge, B. L., Rodríguez, S., and Alastuey, A.: Speciation of organic aerosols in the Saharan Air Layer and in the free troposphere westerlies, Atmos. Chem. Phys., 17, 8939–8958, https://doi.org/10.5194/acp-17-8939-2017, 2017b.
Giglio, L., Randerson, J. T., and van der Werf, G. R.: Analysis of daily, monthly, and annual burned area using the fourth-generation global fire emissions database (GFED4): Analysis of burned area, J. Geophys. Res.-Biogeo., 118, 317–328, https://doi.org/10/f4vrmh, 2013.
Global Volcanism Program: Volcanoes of the World (VOTW) Database Information, Smithsonian Institution [data set], https://doi.org/10.5479/si.GVP.VOTW5-2022.5.0, last access: 18 April 2023.
Govender, P. and Sivakumar, V.: Application of k-means and hierarchical clustering techniques for analysis of air pollution: A review (1980–2019), Atmos. Pollut. Res., 11, 40–56, https://doi.org/10.1016/j.apr.2019.09.009, 2020.
Graham, B.: Water-soluble organic compounds in biomass burning aerosols over Amazonia1. Characterization by NMR and GC-MS, J. Geophys. Res., 107, 8047, https://doi.org/10/bhhr39, 2002.
Graham, B., Guyon, P., Taylor, P. E., Artaxo, P., Maenhaut, W., Glovsky, M. M., Flagan, R. C., and Andreae, M. O.: Organic compounds present in the natural Amazonian aerosol: Characterization by gas chromatography-mass spectrometry: organic compounds in Amazonian aerosols, J. Geophys. Res., 108, 4766, https://doi.org/10.1029/2003JD003990, 2003.
Hong, S., Barbante, C., Boutron, C., Gabrielli, P., Gaspari, V., Cescon, P., Thompson, L., Ferrari, C., Francou, B., and Maurice-Bourgoin, L.: Atmospheric heavy metals in tropical South America during the past 22 000 years recorded in a high altitude ice core from Sajama, Bolivia, J. Environ. Monitor., 6, 322–326, https://doi.org/10/cctt35, 2004.
Hueglin, C., Gehrig, R., Baltensperger, U., Gysel, M., Monn, C., and Vonmont, H.: Chemical characterisation of PM2.5, PM10 and coarse particles at urban, near-city and rural sites in Switzerland, Atmos. Environ., 39, 637–651, https://doi.org/10.1016/j.atmosenv.2004.10.027, 2005.
Jaffrezo, J. L., Calas, N., and Bouchet, M.: Carboxylic acids measurements with ionic chromatography, Atmos. Environ., 32, 2705–2708, https://doi.org/10/bgkjk3, 1998.
Jayarathne, T., Stockwell, C. E., Yokelson, R. J., Nakao, S., and Stone, E. A.: Emissions of Fine Particle Fluoride from Biomass Burning, Environ. Sci. Technol., 48, 12636–12644, https://doi.org/10.1021/es502933j, 2014.
Jia, Y., Bhat, S., and Fraser, M. P.: Characterization of saccharides and other organic compounds in fine particles and the use of saccharides to track primary biologically derived carbon sources, Atmos. Environ., 44, 724–732, https://doi.org/10/bkr8qx, 2010.
Jorquera, H.: Source apportionment of PM10 and PM2.5 at Tocopilla, Chile (22°05′ S, 70°12′ W), Environ. Monit. Assess., 153, 235, https://doi.org/10/c4xgdn, 2008.
Jorquera, H. and Barraza, F.: Source apportionment of PM10 and PM2.5 in a desert region in northern Chile, Sci. Total Environ., 444, 327–335, https://doi.org/10/f4q487, 2013.
Kawamura, K. and Kaplan, I. R.: Motor exhaust emissions as a primary source for dicarboxylic acids in Los Angeles ambient air, Environ. Sci. Technol., 21, 105–110, https://doi.org/10/dxc8qn, 1987.
Keene, W. C., Pszenny, Alexander, A. P., Galloway, J. N., and Hawley, M.: Sea-salt corrections and interpretation of constituent ratios in marine precipitation, J. Geophys. Res.-Atmos., 91, 6647–6658, https://doi.org/10.1029/JD091iD06p06647, 1986.
Koenig, A. M., Magand, O., Laj, P., Andrade, M., Moreno, I., Velarde, F., Salvatierra, G., Gutierrez, R., Blacutt, L., Aliaga, D., Reichler, T., Sellegri, K., Laurent, O., Ramonet, M., and Dommergue, A.: Seasonal patterns of atmospheric mercury in tropical South America as inferred by a continuous total gaseous mercury record at Chacaltaya station (5240 m) in Bolivia, Atmos. Chem. Phys., 21, 3447–3472, https://doi.org/10.5194/acp-21-3447-2021, 2021.
Kundu, S., Kawamura, K., Andreae, T. W., Hoffer, A., and Andreae, M. O.: Diurnal variation in the water-soluble inorganic ions, organic carbon and isotopic compositions of total carbon and nitrogen in biomass burning aerosols from the LBA-SMOCC campaign in Rondônia, Brazil, J. Aerosol Sci., 41, 118–133, https://doi.org/10/d4mxb5, 2010a.
Kundu, S., Kawamura, K., Andreae, T. W., Hoffer, A., and Andreae, M. O.: Molecular distributions of dicarboxylic acids, ketocarboxylic acids and α-dicarbonyls in biomass burning aerosols: implications for photochemical production and degradation in smoke layers, Atmos. Chem. Phys., 10, 2209–2225, https://doi.org/10.5194/acp-10-2209-2010, 2010b.
Longo, K. M., Freitas, S. R., Andreae, M. O., Yokelson, R. J., and Artaxo, P.: Biomass Burning in amazonia: Emissions, Long-range transport of smoke and Its regional and remote Impacts, in: Geophysical Monograph Series, Vol. 186, edited by: Keller, M., Bustamante, M., Gash, J., and Silva Dias, P., American Geophysical Union, Washington, D. C., 207–232, https://doi.org/10.1029/2008gm000847, 2009.
Mardoñez, V., Pandolfi, M., Borlaza, L. J. S., Jaffrezo, J.-L., Alastuey, A., Besombes, J.-L., Moreno R., I., Perez, N., Močnik, G., Ginot, P., Krejci, R., Chrastny, V., Wiedensohler, A., Laj, P., Andrade, M., and Uzu, G.: Source apportionment study on particulate air pollution in two high-altitude Bolivian cities: La Paz and El Alto, Atmos. Chem. Phys., 23, 10325–10347, https://doi.org/10.5194/acp-23-10325-2023, 2023.
Martin, S. T., Andreae, M. O., Artaxo, P., Baumgardner, D., Chen, Q., Goldstein, A. H., Guenther, A., Heald, C. L., Mayol-Bracero, O. L., McMurry, P. H., Pauliquevis, T., Pöschl, U., Prather, K. A., Roberts, G. C., Saleska, S. R., Silva Dias, M. A., Spracklen, D. V., Swietlicki, E., and Trebs, I.: Sources and properties of Amazonian aerosol particles, Rev. Geophys., 48, RG2002, https://doi.org/10/bxf6nz, 2010.
Martin, S. T., Artaxo, P., Machado, L., Manzi, A. O., Souza, R. a. F., Schumacher, C., Wang, J., Biscaro, T., Brito, J., Calheiros, A., Jardine, K., Medeiros, A., Portela, B., Sá, S. S. de, Adachi, K., Aiken, A. C., Albrecht, R., Alexander, L., Andreae, M. O., Barbosa, H. M. J., Buseck, P., Chand, D., Comstock, J. M., Day, D. A., Dubey, M., Fan, J., Fast, J., Fisch, G., Fortner, E., Giangrande, S., Gilles, M., Goldstein, A. H., Guenther, A., Hubbe, J., Jensen, M., Jimenez, J. L., Keutsch, F. N., Kim, S., Kuang, C., Laskin, A., McKinney, K., Mei, F., Miller, M., Nascimento, R., Pauliquevis, T., Pekour, M., Peres, J., Petäjä, T., Pöhlker, C., Pöschl, U., Rizzo, L., Schmid, B., Shilling, J. E., Dias, M. A. S., Smith, J. N., Tomlinson, J. M., Tóta, J., and Wendisch, M.: The Green Ocean Amazon Experiment (GoAmazon2014/5) Observes Pollution Affecting Gases, Aerosols, Clouds, and Rainfall over the Rain Forest, B. Am. Meteorol. Soc., 98, 981–997, https://doi.org/10.1175/BAMS-D-15-00221.1, 2017.
Marynowski, L. and Simoneit, B. R. T.: Saccharides in atmospheric particulate and sedimentary organic matter: Status overview and future perspectives, Chemosphere, 288, 132376, https://doi.org/10.1016/j.chemosphere.2021.132376, 2022.
Medeiros, P. M., Conte, M. H., Weber, J. C., and Simoneit, B. R. T.: Sugars as source indicators of biogenic organic carbon in aerosols collected above the Howland Experimental Forest, Maine, Atmos. Environ., 40, 1694–1705, https://doi.org/10/c9d88b, 2006.
Mikhailov, E. F., Mironova, S., Mironov, G., Vlasenko, S., Panov, A., Chi, X., Walter, D., Carbone, S., Artaxo, P., Heimann, M., Lavric, J., Pöschl, U., and Andreae, M. O.: Long-term measurements (2010–2014) of carbonaceous aerosol and carbon monoxide at the Zotino Tall Tower Observatory (ZOTTO) in central Siberia, Atmos. Chem. Phys., 17, 14365–14392, https://doi.org/10.5194/acp-17-14365-2017, 2017.
Moussallam, Y., Tamburello, G., Peters, N., Apaza, F., Schipper, C. I., Curtis, A., Aiuppa, A., Masias, P., Boichu, M., Bauduin, S., Barnie, T., Bani, P., Giudice, G., and Moussallam, M.: Volcanic gas emissions and degassing dynamics at Ubinas and Sabancaya volcanoes; implications for the volatile budget of the central volcanic zone, J. Volcanol. Geoth. Res., 343, 181–191, https://doi.org/10/gbz77j, 2017.
Natural Earth: http://www.naturalearthdata.com, last access: 26 October 2022.
NOAA National Centers for Environmental Information: ETOPO 2022 15 Arc-Second Global Relief Model, NOAA National Centers for Environmental Information, https://doi.org/10.25921/fd45-gt74, last access: 26 October 2022
Olson, E., Michalski, G., Welp, L., Larrea Valdivia, A. E., Reyes Larico, J., Salcedo Peña, J., Fang, H., Magara Gomez, K., and Li, J.: Mineral dust and fossil fuel combustion dominate sources of aerosol sulfate in urban Peru identified by sulfur stable isotopes and water-soluble ions, Atmos. Environ., 260, 118482, https://doi.org/10/gpbm3k, 2021.
Perry, L. B., Seimon, A., Andrade-Flores, M. F., Endries, J. L., Yuter, S. E., Velarde, F., Arias, S., Bonshoms, M., Burton, E. J., Winkelmann, I. R., Cooper, C. M., Mamani, G., Rado, M., Montoya, N., and Quispe, N.: Characteristics of Precipitating Storms in Glacierized Tropical Andean Cordilleras of Peru and Bolivia, Ann. Am. Assoc. Geogr., 107, 309–322, https://doi.org/10/gmrzgw, 2017.
Pietrogrande, M. C., Bacco, D., Visentin, M., Ferrari, S., and Casali, P.: Polar organic marker compounds in atmospheric aerosol in the Po Valley during the Supersito campaigns – Part 2: Seasonal variations of sugars, Atmos. Environ., 97, 215–225, https://doi.org/10.1016/j.atmosenv.2014.07.056, 2014.
Querol, X., Alastuey, A., Rodriguez, S., Plana, F., Mantilla, E., and Ruiz, C. R.: Monitoring of PM10 and PM2.5 around primary particulate anthropogenic emission sources, Atmos. Environ., 35, 845–858, https://doi.org/10.1016/S1352-2310(00)00387-3, 2001.
Querol, X., Alastuey, A., Viana, M., Moreno, T., Reche, C., Minguillón, M. C., Ripoll, A., Pandolfi, M., Amato, F., Karanasiou, A., Pérez, N., Pey, J., Cusack, M., Vázquez, R., Plana, F., Dall'Osto, M., de la Rosa, J., Sánchez de la Campa, A., Fernández-Camacho, R., Rodríguez, S., Pio, C., Alados-Arboledas, L., Titos, G., Artíñano, B., Salvador, P., García Dos Santos, S., and Fernández Patier, R.: Variability of carbonaceous aerosols in remote, rural, urban and industrial environments in Spain: implications for air quality policy, Atmos. Chem. Phys., 13, 6185–6206, https://doi.org/10.5194/acp-13-6185-2013, 2013.
Rathnayake, C. M., Metwali, N., Jayarathne, T., Kettler, J., Huang, Y., Thorne, P. S., O'Shaughnessy, P. T., and Stone, E. A.: Influence of rain on the abundance of bioaerosols in fine and coarse particles, Atmos. Chem. Phys., 17, 2459–2475, https://doi.org/10.5194/acp-17-2459-2017, 2017.
Ripoll, A., Minguillón, M. C., Pey, J., Pérez, N., Querol, X., and Alastuey, A.: Joint analysis of continental and regional background environments in the western Mediterranean: PM1 and PM10 concentrations and composition, Atmos. Chem. Phys., 15, 1129–1145, https://doi.org/10.5194/acp-15-1129-2015, 2015.
Rodríguez, S., Alastuey, A., Alonso-Pérez, S., Querol, X., Cuevas, E., Abreu-Afonso, J., Viana, M., Pérez, N., Pandolfi, M., and de la Rosa, J.: Transport of desert dust mixed with North African industrial pollutants in the subtropical Saharan Air Layer, Atmos. Chem. Phys., 11, 6663–6685, https://doi.org/10.5194/acp-11-6663-2011, 2011.
Rogge, W. F., Medeiros, P. M., and Simoneit, B. R. T.: Organic marker compounds in surface soils of crop fields from the San Joaquin Valley fugitive dust characterization study, Atmos. Environ., 41, 8183–8204, https://doi.org/10.1016/j.atmosenv.2007.06.030, 2007.
Salma, I., Chi, X., and Maenhaut, W.: Elemental and organic carbon in urban canyon and background environments in Budapest, Hungary, Atmos. Environ., 38, 27–36, https://doi.org/10.1016/j.atmosenv.2003.09.047, 2004.
Samaké, A., Jaffrezo, J.-L., Favez, O., Weber, S., Jacob, V., Albinet, A., Riffault, V., Perdrix, E., Waked, A., Golly, B., Salameh, D., Chevrier, F., Oliveira, D. M., Bonnaire, N., Besombes, J.-L., Martins, J. M. F., Conil, S., Guillaud, G., Mesbah, B., Rocq, B., Robic, P.-Y., Hulin, A., Le Meur, S., Descheemaecker, M., Chretien, E., Marchand, N., and Uzu, G.: Polyols and glucose particulate species as tracers of primary biogenic organic aerosols at 28 French sites, Atmos. Chem. Phys., 19, 3357–3374, https://doi.org/10.5194/acp-19-3357-2019, 2019.
Schkolnik, G., Falkovich, A. H., Rudich, Y., Maenhaut, W., and Artaxo, P.: New Analytical Method for the Determination of Levoglucosan, Polyhydroxy Compounds, and 2-Methylerythritol and Its Application to Smoke and Rainwater Samples, Environ. Sci. Technol., 39, 2744–2752, https://doi.org/10/fb54s8, 2005.
Scholz, W., Shen, J., Aliaga, D., Wu, C., Carbone, S., Moreno, I., Zha, Q., Huang, W., Heikkinen, L., Jaffrezo, J. L., Uzu, G., Partoll, E., Leiminger, M., Velarde, F., Laj, P., Ginot, P., Artaxo, P., Wiedensohler, A., Kulmala, M., Mohr, C., Andrade, M., Sinclair, V., Bianchi, F., and Hansel, A.: Measurement report: Long-range transport and the fate of dimethyl sulfide oxidation products in the free troposphere derived from observations at the high-altitude research station Chacaltaya (5240 m a.s.l.) in the Bolivian Andes, Atmos. Chem. Phys., 23, 895–920, https://doi.org/10.5194/acp-23-895-2023, 2023.
Stein, A. F., Draxler, R. R., Rolph, G. D., Stunder, B. J. B., Cohen, M. D., and Ngan, F.: NOAA's HYSPLIT Atmospheric Transport and Dispersion Modeling System, B. Am. Meteorol. Soc., 96, 2059–2077, https://doi.org/10.1175/BAMS-D-14-00110.1, 2015.
Surkyn, P., Waele, J. D., and Adams, F.: Laser Microprobe Mass Analysis for Source Identification of Air Particulate Mattert, Matter, Int. J. Environ. An. Ch., 13, 257–274, https://doi.org/10.1080/03067318308071598, 1983.
Szopa, S., Naik, V., Adhikary, B., Paulo, A., Berntsen, T., Collins, W. D., Fuzzi, S., Gallardo, L., Kiendler-Scharr, A., Klimont, Z., Liao, H., Unger, N., and Zanis, P.: Short-lived Climate Forcers, in: Climate Change 2021: The Physical Science Basis. Contribution of Working Group I to the Sixth Assessment Report of the Intergovernmental Panel on Climate Change, edited by: Masson-Delmotte, V., Zhai, P., Pirani, A., Connors, S. L., Péan, C., Berger, S., Caud, N., Chen, Y., Goldfarb, L., Gomis, M. I., Huang, M., Leitzell, K., Lonnoy, E., Matthews, J. B. R., Yelekçi, O., Yu, R., and Zhou, B., Cambridge University Press, Cambridge, United Kingdom and New York, NY, USA, 817–922, https://doi.org/10.1017/9781009157896.008, 2021.
Tsyro, S. G.: To what extent can aerosol water explain the discrepancy between model calculated and gravimetric PM10 and PM2.5?, Atmos. Chem. Phys., 5, 515–532, https://doi.org/10.5194/acp-5-515-2005, 2005.
Van Espen, P. and Adams, F.: The application of principal component and factor analysis procedures to data for element concentrations in aerosols from a remote region, Anal. Chim. Acta, 150, 153–161, https://doi.org/10/bsdrq2, 1983.
Vimeux, F., Gallaire, R., Bony, S., Hoffmann, G., and Chiang, J.: What are the climate controls on δD in precipitation in the Zongo Valley (Bolivia)? Implications for the Illimani ice core interpretation, Earth Planet. Sc. Lett., 240, 205–220, https://doi.org/10/bwrzcs, 2005.
Waked, A., Favez, O., Alleman, L. Y., Piot, C., Petit, J.-E., Delaunay, T., Verlinden, E., Golly, B., Besombes, J.-L., Jaffrezo, J.-L., and Leoz-Garziandia, E.: Source apportionment of PM10 in a north-western Europe regional urban background site (Lens, France) using positive matrix factorization and including primary biogenic emissions, Atmos. Chem. Phys., 14, 3325–3346, https://doi.org/10.5194/acp-14-3325-2014, 2014.
Watson, J. G. and Chow, J. C.: Source characterization of major emission sources in the Imperial and Mexicali Valleys along the US/Mexico border, Sci. Total Environ., 276, 33–47, https://doi.org/10.1016/S0048-9697(01)00770-7, 2001.
Wiedensohler, A., Andrade, M., Weinhold, K., Müller, T., Birmili, W., Velarde, F., Moreno, I., Forno, R., Sanchez, M. F., Laj, P., Ginot, P., Whiteman, D. N., Krejci, R., Sellegri, K., and Reichler, T.: Black carbon emission and transport mechanisms to the free troposphere at the La Paz/El Alto (Bolivia) metropolitan area based on the Day of Census (2012), Atmos. Environ., 194, 158–169, https://doi.org/10/gfm363, 2018.
Witz, S., Eden, R. W., Wadley, M. W., Dunwoody, C., Papa, R. P., and Torre, K. J.: Rapid Loss of Particulate Nitrate, Chloride and Ammonium on Quartz Fiber Filters During Storage, J. Air Waste Manage., 40, 53–61, https://doi.org/10.1080/10473289.1990.10466666, 1990.
WMO: The 2022 GCOS ECVs Requirements, World Meteorological Organization, https://library.wmo.int/idurl/4/58111 (last access: 19 February 2024), 2022.
World Population Review: https://worldpopulationreview.com/, last access: 12 October 2022.
Xu, J., Jia, C., He, J., Xu, H., Tang, Y.-T., Ji, D., Yu, H., Xiao, H., and Wang, C.: Biomass burning and fungal spores as sources of fine aerosols in Yangtze River Delta, China – Using multiple organic tracers to understand variability, correlations and origins, Environ. Pollut., 251, 155–165, https://doi.org/10.1016/j.envpol.2019.04.090, 2019.
Yang, F., Gu, Z., Feng, J., Liu, X., and Yao, X.: Biogenic and anthropogenic sources of oxalate in PM2.5 in a mega city, Shanghai, Atmos. Res., 138, 356–363, https://doi.org/10.1016/j.atmosres.2013.12.006, 2014.
Yttri, K. E., Dye, C., and Kiss, G.: Ambient aerosol concentrations of sugars and sugar-alcohols at four different sites in Norway, Atmos. Chem. Phys., 7, 4267–4279, https://doi.org/10.5194/acp-7-4267-2007, 2007.
Zaratti, F. and Forno, R.: La radiación ultravioleta en Bolivia, 1st edn., Bolivia, ISBN 99905-0-338-9, 2003.
Zha, Q., Aliaga, D., Krejci, R., Sinclair, V., Wu, C., Ciarelli, G., Scholz, W., Heikkinen, L., Partoll, E., Gramlich, Y., Huang, W., Leiminger, M., Enroth, J., Peräkylä, O., Cai, R., Chen, X., Koenig, A. M., Velarde, F., Moreno, I., Petäjä, T., Artaxo, P., Laj, P., Hansel, A., Carbone, S., Kulmala, M., Andrade, M., Worsnop, D., Mohr, C., and Bianchi, F.: Oxidized organic molecules in the tropical free troposphere over Amazonia, Natl. Sci. Rev., 11, nwad138, https://doi.org/10.1093/nsr/nwad138, 2023.
Zhang, G., Lin, Q., Peng, L., Yang, Y., Fu, Y., Bi, X., Li, M., Chen, D., Chen, J., Cai, Z., Wang, X., Peng, P., Sheng, G., and Zhou, Z.: Insight into the in-cloud formation of oxalate based on in situ measurement by single particle mass spectrometry, Atmos. Chem. Phys., 17, 13891–13901, https://doi.org/10.5194/acp-17-13891-2017, 2017.
Zhang, T., Engling, G., Chan, C.-Y., Zhang, Y.-N., Zhang, Z.-S., Lin, M., Sang, X.-F., Li, Y. D., and Li, Y.-S.: Contribution of fungal spores to particulate matter in a tropical rainforest, Environ. Res. Lett., 5, 024010, https://doi.org/10/dqS9j4, 2010.
Zhang, X. Y., Wang, Y. Q., Zhang, X. C., Guo, W., and Gong, S. L.: Carbonaceous aerosol composition over various regions of China during 2006, J. Geophys. Res., 113, D14111, https://doi.org/10/dw28cm, 2008.
Zunckel, M., Saizar, C., and Zarauz, J.: Rainwater composition in northeast Uruguay, Atmos. Environ., 37, 1601–1611, https://doi.org/10.1016/S1352-2310(03)00007-4, 2003.