the Creative Commons Attribution 4.0 License.
the Creative Commons Attribution 4.0 License.
 | 29 Feb 2024
Composition and sources of carbonaceous aerosol in the European Arctic at Zeppelin Observatory, Svalbard (2017 to 2020)
Are Bäcklund
Franz Conen
Sabine Eckhardt
Nikolaos Evangeliou
Markus Fiebig
Anne Kasper-Giebl
Avram Gold
Hans Gundersen
Cathrine Lund Myhre
Stephen Matthew Platt
David Simpson
Jason D. Surratt
Sönke Szidat
Martin Rauber
Kjetil Tørseth
Martin Album Ytre-Eide
Zhenfa Zhang
Wenche Aas
We analyzed long-term measurements of organic carbon, elemental carbon, and source-specific organic tracers from 2017 to 2020 to constrain carbonaceous aerosol sources in the rapidly changing Arctic. Additionally, we used absorption photometer (Aethalometer) measurements to constrain equivalent black carbon (eBC) from biomass burning and fossil fuel combustion, using positive matrix factorization (PMF).
Our analysis shows that organic tracers are essential for understanding Arctic carbonaceous aerosol sources. Throughout 2017 to 2020, levoglucosan exhibited bimodal seasonality, reflecting emissions from residential wood combustion (RWC) in the heating season (November to May) and from wildfires (WFs) in the non-heating season (June to October), demonstrating a pronounced interannual variability in the influence of WF. Biogenic secondary organic aerosol (BSOA) species (2-methyltetrols) from isoprene oxidation was only present in the non-heating season, peaking in July to August. Warm air masses from Siberia led to a substantial increase in 2-methyltetrols in 2019 and 2020 compared to 2017 to 2018. This highlights the need to investigate the contribution of local sources vs. long-range atmospheric transport (LRT), considering the temperature sensitivity of biogenic volatile organic compound emissions from Arctic vegetation. Tracers of primary biological aerosol particles (PBAPs), including various sugars and sugar alcohols, showed elevated levels in the non-heating season, although with different seasonal trends, whereas cellulose had no apparent seasonality. Most PBAP tracers and 2-methyltetrols peaked during influence of WF emissions, highlighting the importance of measuring a range of source-specific tracers to understand sources and dynamics of carbonaceous aerosol. The seasonality of carbonaceous aerosol was strongly influenced by LRT episodes, as background levels are extremely low. In the non-heating season, the organic aerosol peak was as influenced by LRT, as was elemental carbon during the Arctic haze period.
Source apportionment of carbonaceous aerosol by Latin hypercube sampling showed mixed contributions from RWC (46 %), fossil fuel (FF) sources (27 %), and BSOA (25 %) in the heating season. In contrast, the non-heating season was dominated by BSOA (56 %), with lower contributions from WF (26 %) and FF sources (15 %).
Source apportionment of eBC by PMF showed that FF combustion dominated eBC (70±2.7 %), whereas RWC (22±2.7 %) was more abundant than WF (8.0±2.9 %). Modeled BC concentrations from FLEXPART (FLEXible PARTicle dispersion model) attributed an almost equal share to FF sources (51±3.1 %) and to biomass burning. Both FLEXPART and the PMF analysis concluded that RWC is a more important source of (e)BC than WF. However, with a modeled RWC contribution of 30±4.1 % and WF of 19±2.8 %, FLEXPART suggests relatively higher contributions to eBC from these sources. Notably, the BB fraction of EC was twice as high as that of eBC, reflecting methodological differences between source apportionment by LHS and PMF. However, important conclusions drawn are unaffected, as both methods indicate the presence of RWC- and WF-sourced BC at Zeppelin, with a higher relative BB contribution during the non-heating season.
In summary, organic aerosol (281±106 ng m−3) constitutes a significant fraction of Arctic PM10, although surpassed by sea salt aerosol (682±46.9 ng m−3), mineral dust (613±368 ng m−3), and typically non-sea-salt sulfate SO (314±62.6 ng m−3), originating mainly from anthropogenic sources in winter and from natural sources in summer.
- Article
(4054 KB) - Full-text XML
-
Supplement
(775 KB) - BibTeX
- EndNote


The Arctic is warming significantly faster than the rest of the planet due to Arctic amplification (Serreze and Barry, 2011; Schmale et al., 2021). These rapid changes affect atmospheric transport and the removal of Arctic aerosols (Jiao and Flanner, 2016), aerosol relative source contributions (Heslin-Rees et al., 2020), vegetation, and the carbon cycle (Kramshøj et al., 2016).
Long-range atmospheric transport (LRT) of air masses from lower latitudes is an important driver of the Arctic aerosol burden, since local emissions are relatively much lower (e.g., Quinn et al., 2007). However, the importance of LRT may be decreasing, since low-latitude anthropogenic aerosol emissions are declining (Collaud Coen et al., 2020), while high-latitude sources are increasing in importance. These include, for example, increased wildfires (WFs) (McCarty et al., 2021), sea salt aerosol (SSA) (Heslin-Rees et al., 2020), eolian mineral dust (MD) following glacial retreat (Groot Zwaaftink et al., 2016), and primary biological aerosol particles (PBAPs) due to thawing permafrost and Arctic greening (Myers-Smith et al., 2020), which is also likely increasing biogenic volatile organic compound emission rates and hence biogenic secondary organic aerosol (BSOA) (Hallquist et al., 2009). These changes in sources may also change Arctic aerosol physicochemical properties and hence their climate impact. Some PBAPs are efficient ice-nucleating particles at high temperatures (Tobo et al., 2019), while BSOA might act as cloud condensation nuclei or influence their activity (Riipinen et al., 2011) and have negative feedback to the Arctic climate (Paasonen et al., 2009). Given its relevance for the Arctic climate, there is a marked interest in exploring the concentration, activation temperature, composition, sources, origin, and seasonality of Arctic ice-nucleating particles and cloud condensation nuclei, as shown by Creamean et al. (2018, 2019, 2020, 2022), Hartmann et al. (2019, 2020), and Pereira Freitas et al. (2023). The aerosol indirect effect is particularly important in the Arctic, as mixed-phase clouds have a long lifetime, possibly due to a lack of ice-nucleating particles (Solomon et al., 2018); thus, changes in ice-nucleating particles are deemed more important than cloud condensation nuclei with regard to Arctic cloud radiative properties (Solomon et al., 2018).
Understanding changes in local aerosol emissions and formation, shifts in aerosol LRT, and thus alterations in aerosol chemical composition are essential for understanding their climate impact and the evolving Arctic environment. Long-term observations are crucial to such an understanding. This is especially true for carbonaceous aerosol (CA), though the situation is somewhat more favorable for black carbon (BC), as it has been a focus of attention due to its significant impact on climate and albedo (Clarke and Noone, 1985; Pueschel and Kinne, 1995; Hansen and Nazarenko, 2004; Elefteriadis et al., 2009; Hirdmann et al., 2010). A second exception is methane sulfonic acid (MSA) with a time series from 1977 at Alert (Sharma et al., 2019) and 1980 at Barrow (Quinn et al., 2009), though its role in aerosol formation, growth, and radiative forcing is still a matter of ongoing research (Hodshire et al., 2019).
Significant contributions to organic matter (OM) of Eurasian origin to Arctic haze (AH) have been suggested since the 1970s (Quinn et al., 2007), quantified mostly as a residual fraction (Quinn et al., 2002) or from measurements of selected organic species (Li et al., 1993). Even short-term, direct measurements of organic carbon (OC) or OM are scarce (e.g., Hansen et al., 2014; Barrett et al., 2015; Ferrero et al., 2019), limiting our understanding of even basic parameters such as seasonality, annual mean, or interannual variability. The nearly 2-year-long study of Ricard et al. (2002) at Sevettjärvi (Finland) is one of three exceptions, though it is at a latitude of < 70° N and hence not representative of the high Arctic with, e.g., lower AH and more biogenic volatile organic compounds in summer. Barrett and Sheesley (2017) report 1 year of OC data at Barrow, whereas Moschos et al. (2022) presented the most comprehensive study on Arctic organic aerosol (OA) to this date, with up to 3 years of data from eight Arctic sites.
OC levels are not useful in elucidating sources per se, and supporting information is generally needed. For example, elemental carbon (EC) (or equivalent black carbon, eBC) demonstrates the presence of OC from fossil fuel (FF) combustion and biomass burning (BB), essential to source apportionment efforts and monitoring of the otherwise unperturbed Arctic atmosphere. Winiger et al. (2019) attributed 25±16 % of EC to BB in winter and 42±19 % in summer by radiocarbon (14C) analysis in their pan-Arctic study. Further separation of BB into residential wood combustion (RWC), WF, and agricultural waste burning requires the inclusion of satellite observations such as MODIS (Moderate Resolution Imaging Spectroradiometer) (Giglio et al., 2003) and transport modeling (Stohl et al., 2006), although seasonality can be a useful qualifier. Stohl et al. (2013) pointed to gas and oil industry flaring as a major source, contributing 42 % to the Arctic annual mean BC surface concentrations. The 14C analysis by Barrett et al. (2015) shows that contemporary OC from biogenic emissions dominated in summer, while contemporary and fossil OC levels were approximately equally large in winter. Moschos et al. (2022) used positive matrix factorization (PMF) on spectral data derived from water-soluble organic carbon extracts and analyzed offline using an aerosol mass spectrometer. Their study identified three factors dominated by anthropogenic sources (oxygenated organic aerosol, Arctic haze, and primary organic aerosol) and three factors associated with natural emissions (methane sulfonic-acid-related organic aerosol, primary biological organic aerosol, and biogenic secondary organic aerosol). These factors exhibited distinct seasonal patterns, with the first three dominating in winter and the latter three in summer.
Source-specific organic tracers identified in the Arctic include levoglucosan, mannosan, and galactosan (e.g., von Schneidemesser et al., 2009; Fu et al., 2013; Zangrando et al., 2013; Hu et al., 2013a; Yttri et al., 2014; Feltracco et al., 2020), which are combustion products of cellulose and hemicellulose serving to trace biomass burning emissions (Simoneit et al., 1999). Sugars, sugar alcohols (here glucose, fructose, trehalose, arabitol, and mannitol), and cellulose are used for tracing PBAP (Graham et al., 2003; Elbert et al., 2007; Sanchez-Ochoa et al., 2007), with sugar alcohols typically associated with yeast and fungal spores, and sugars linked to pollen, fern spores, and other giant bioaerosol (Graham et al., 2003). Cellulose, a primary component of plant cell walls, is used to trace plant debris (Sanchez-Ochoa et al., 2007). Sugars and sugar alcohols have previously been detected in Arctic aerosol (e.g., Fu et al., 2009a, 2013; Feltracco et al., 2020), but cellulose has not been reported in these studies. Oxidation products of isoprene (e.g., 2-methyltetrols), monoterpenes (e.g., 3-methyl-1,2,3-butane-tricarboxylic acid), and sesquiterpenes (e.g., β-caryophyllinic acid) are all BSOA species previously detected in the Arctic aerosol (Fu et al., 2009b, 2013; Hansen et al., 2014; Hu et al., 2013). Most studies measuring organic tracers in the Arctic have been limited to short time periods or specific seasons, lacking a comprehensive understanding of the seasonal, annual, and interannual variability in the sources and their impact on Arctic CA. Notable exceptions are the 1-year study of Hansen et al. (2014) and Yttri et al. (2014), along with the multiseasonal investigation of Feltracco et al. (2020).
Lack of long-term OA measurements limits knowledge of Arctic aerosol mass closure. Furthermore, OA speciation, needed for source attribution and for studying its impact on cloud condensation nuclei and ice-nucleating particles is scarce. Here, we present 4 years of OC and EC, organic tracer, and eBCBB and eBCFF measurements made at the high Arctic Zeppelin Observatory (Ny-Ålesund, Svalbard), providing multiyear insights to Arctic CA and the fundamental knowledge needed to understand changes in Arctic cloud condensation nuclei and ice-nucleating particles and hence the impact of a changing Arctic on regional and global climate.
2.1 Sampling site
The Zeppelin Observatory (78°5′ N, 11°5′ E; 472 m above sea level, a.s.l.) is located on Mount Zeppelin on the 20 km long and 10 km wide Brøggerhalvøya, 2 km south of the remote Ny-Ålesund settlement on the west coast of the Spitsbergen island in the Svalbard archipelago (Norway; Fig. 1; Platt et al., 2022). The 26 km long Kongsfjorden to the northeast and the 88 km long Forlandet straight in the west surround the peninsula. The observatory lies in the northern Arctic tundra zone, surrounded by barren ground largely consisting of bare stones and occasionally a thin layer of topsoil with scarce ground vegetation, mostly growing on plains at lower altitudes, as well as snowpacks and glaciers. There is very little influence of emissions from the Ny-Ålesund settlement, as the observatory is typically above the boundary layer.
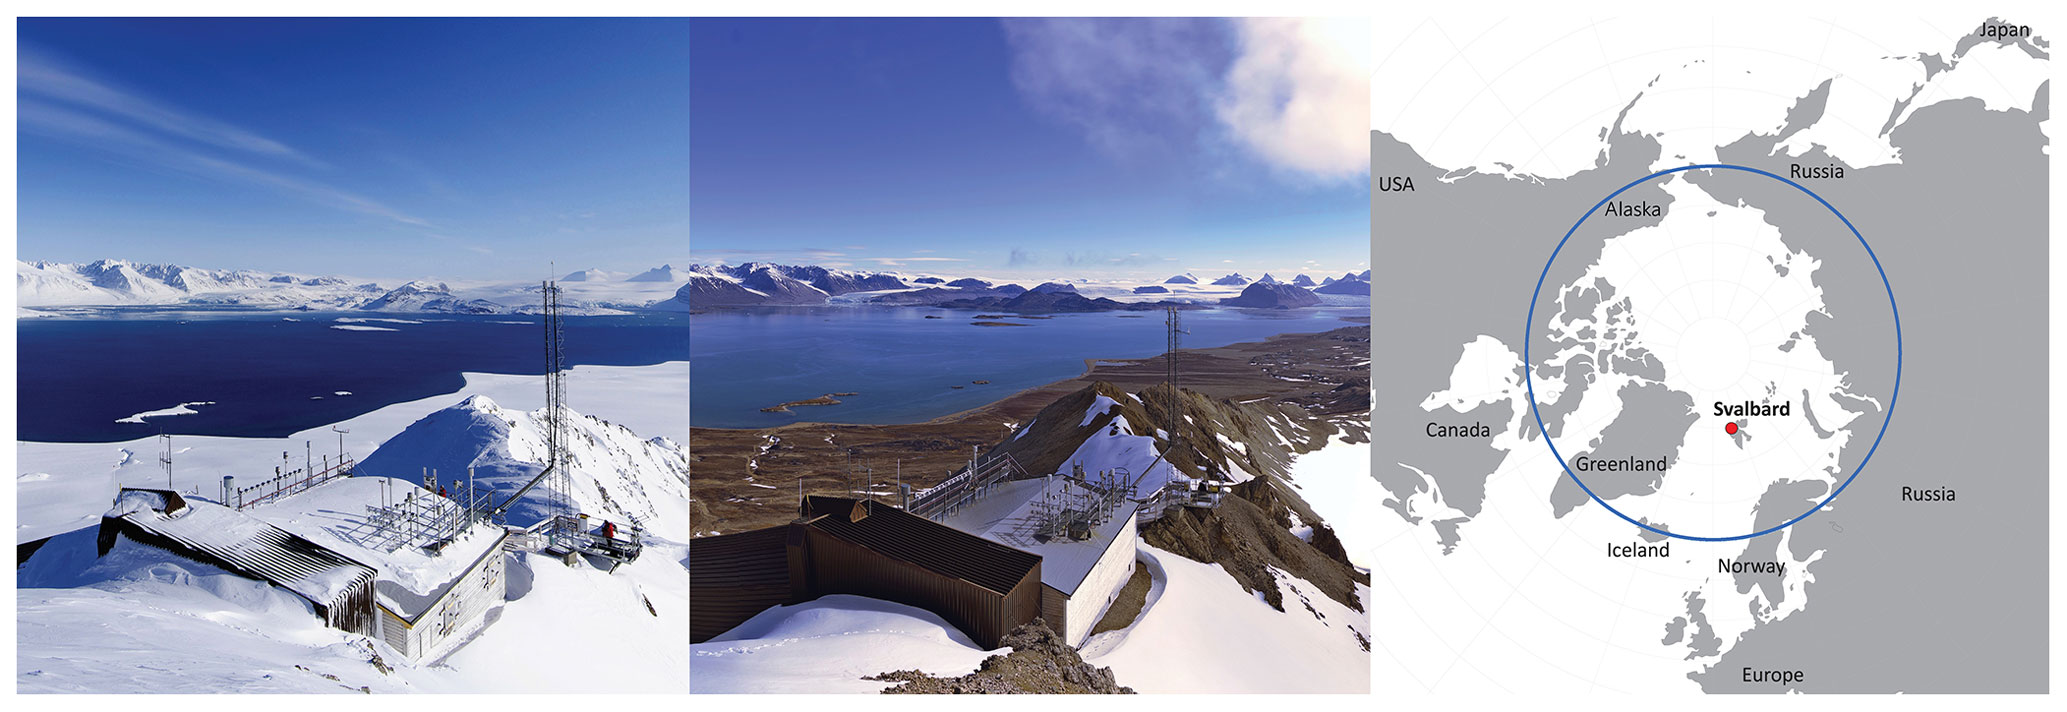
Figure 1The Zeppelin Observatory located at Mount Zeppelin (472 m a.s.l.) close to the Ny-Ålesund settlement at Svalbard (78°54′0′′ N, 11°53′0′′ E) in winter (left panel) and summer (middle panel). The blue line on the map shows the Arctic Circle (66° N) (right panel). (Photo: Ove Hermansen, NILU; map: Finn Bjørklid, NILU).
The Svalbard climate reflects its high northern latitude but is moderated by the North Atlantic Current, with substantially higher temperatures than at corresponding latitudes in continental Russia and Canada, particularly in winter. Hence, the Kongsfjorden basin is considered relatively verdant due to its favorable microclimate, and ∼ 180 plant species, 380 mosses, and 600 lichens are registered on the Svalbard archipelago (Vegetation in Svalbard, 2023). However, a short growing season (June to August), 4 months of polar night, and 8 to 9 months of snow (Fig. 2) do not provide optimal conditions for growth (Karlsen et al., 2014). Annual precipitation in western Svalbard is around 400 mm.
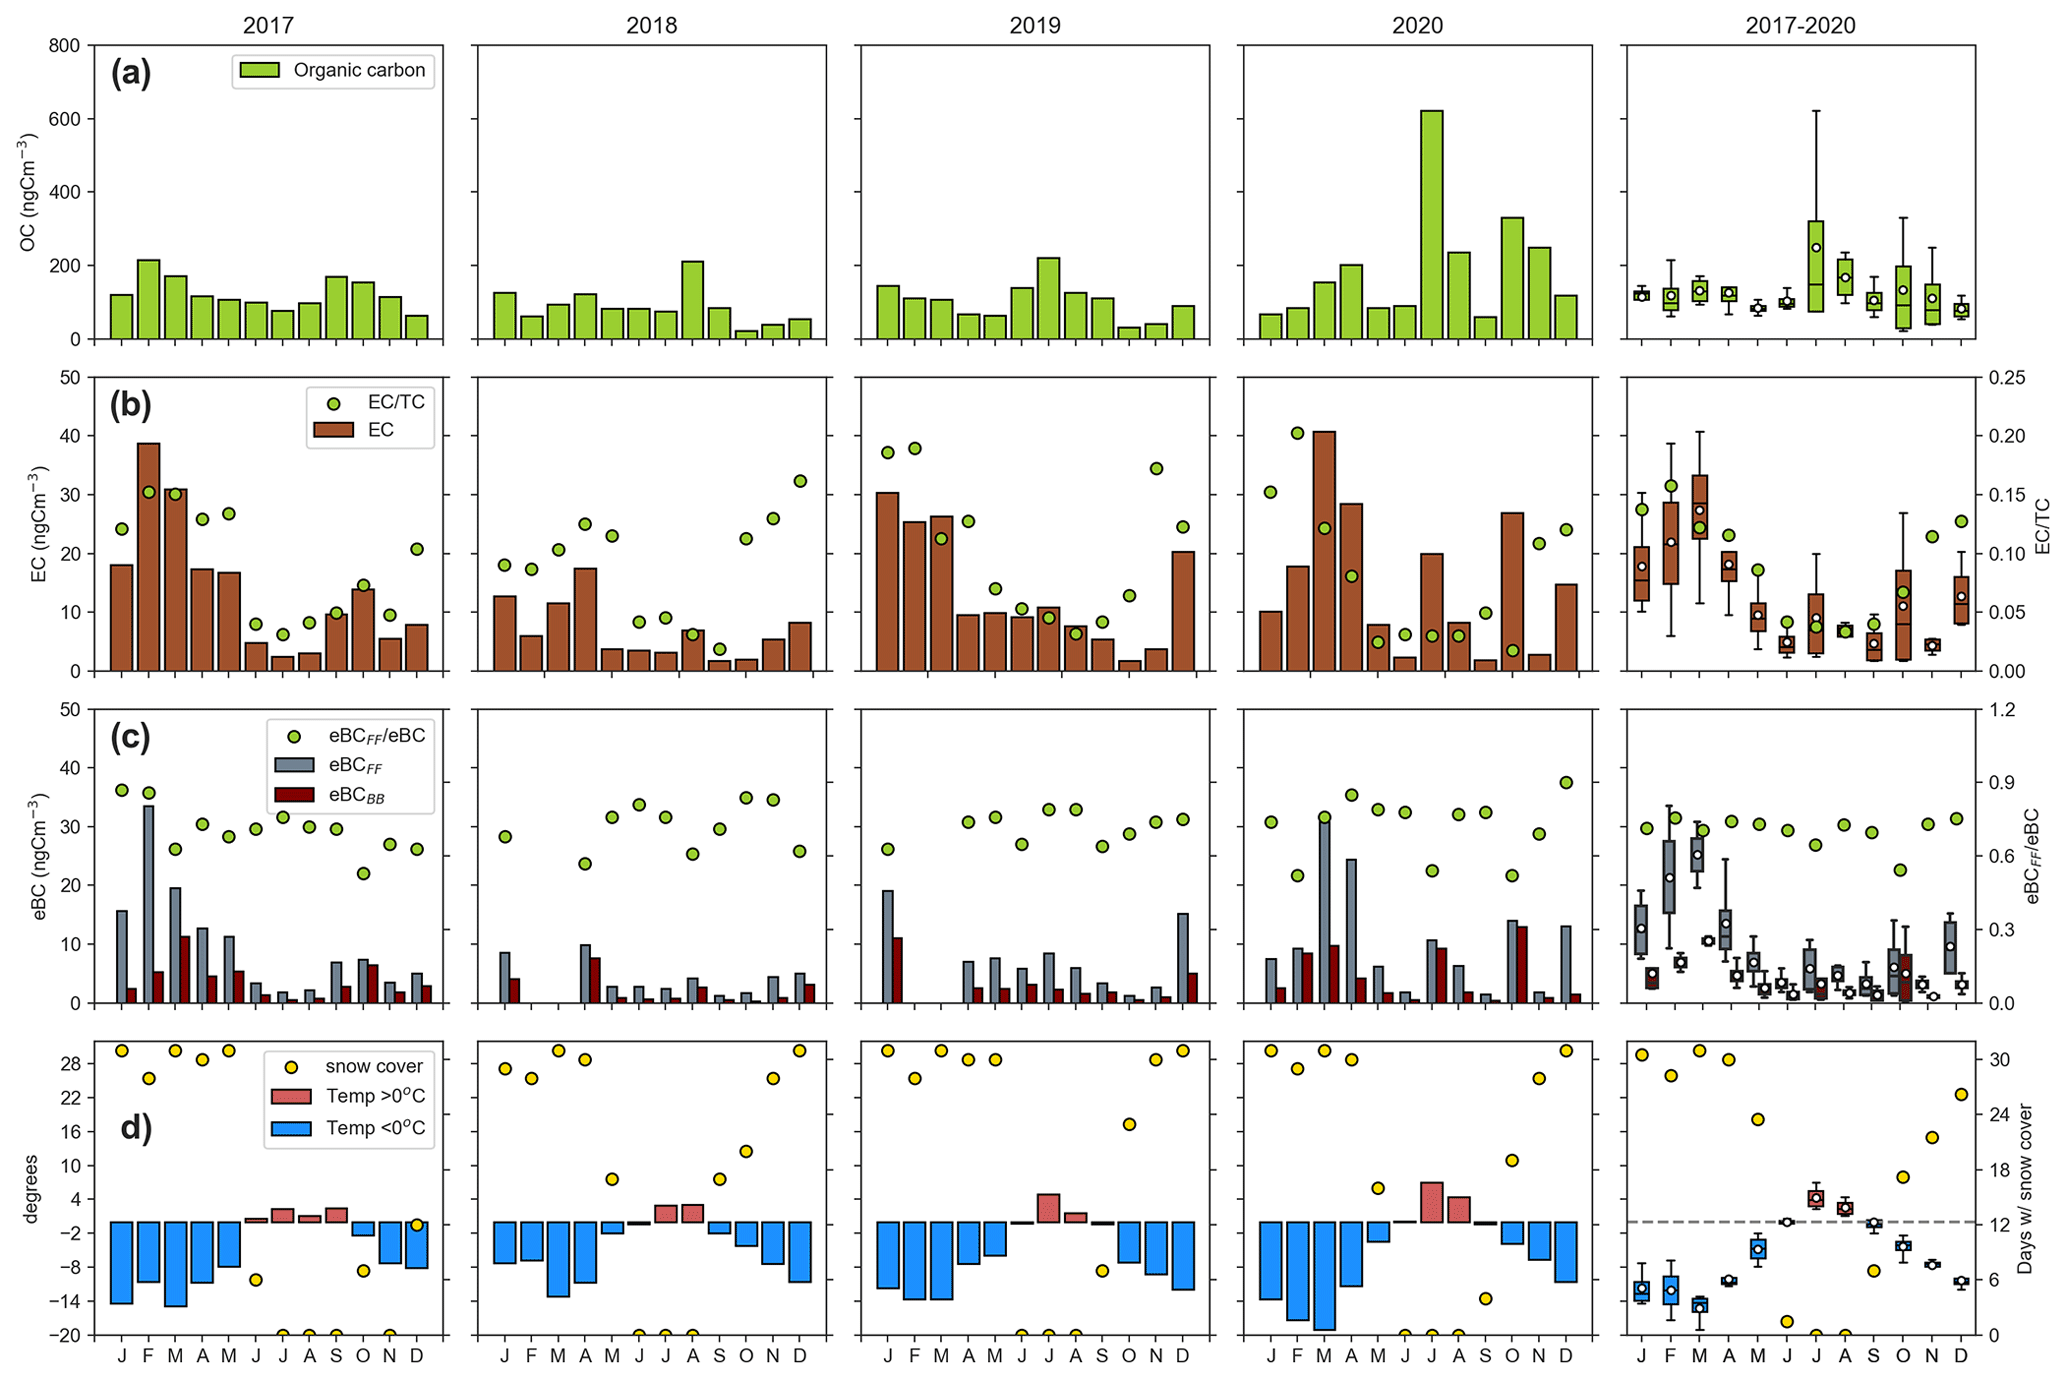
Figure 2Panels show monthly mean concentrations for 2017 to 2020 and box plots (mean, 25th, 50th, 75th percentiles, and interquartile range (IQR)) for 2017 to 2020 at Zeppelin Observatory for (a) OC, (b) EC and EC TC, (c) eBCBB, eBCFF, and eBCFF/eBC. (d) Ambient temperature and days with snow on the ground. Concentrations in panels (a)–(c) are measured in the PM10 size fraction.
The Zeppelin Observatory is part of many networks, including the European Evaluation and Monitoring Program (EMEP, https://www.emep.int/, last access: 31 January 2024), the Global Atmospheric Watch Programme (GAW, https://public.wmo.int/en/programmes, last access: 31 January 2024), and the Arctic Monitoring and Assessment Programme (AMAP, https://www.amap.no/, last access: 31 January 2024) and is included in the EU infrastructure ACTRIS (Aerosols, Clouds and Trace gases Research InfraStructure Network, https://www.actris.eu/, last access: 31 January 2024)
2.2 Sampling, handling, and storage of ambient aerosol filter samples
We used a Digitel high-volume sampler (PM10 inlet, flow rate of 666 L min−1, and filter face velocity of 72.1 cm s−1) to obtain ambient aerosol filter samples. We placed the sampling inlet 2 m above the observatory roof and 7 m above ground level. We collected aerosol particles on pre-fired (850 °C; 3 h) quartz fiber filters (Pallflex Tissuquartz 2500QAT-UP; 150 mm in diameter) at a weekly time resolution. There was some variability in the sampling time, typically due to harsh weather conditions. We used a quartz fiber filter behind quartz fiber filter (QBQ) setup to estimate the positive sampling artifact of OC (McDow and Huntzicker, 1990). We shipped the filters in their respective filter holders, wrapped in baked aluminum foil, and placed them in double ziplock bags. Before exposure and analysis, we stored the samples in a freezer (−18 °C). For each 1.5 month of sampling, we assigned one field blank, which was treated in the same manner regarding the preparation, handling, transport, and storage as the exposed filters, except that they were not inserted in the sampler.
We collected the aerosol filter samples from 5 January 2017 to 4 January 2021, as part of the Norwegian national monitoring program (Aas et al., 2020)
2.3 Measurement of OC and EC
We performed thermal–optical analysis (TOA) using the Sunset Laboratory, Inc., OC EC aerosol analyzer. We used the transmission for charring correction and operated the instrument according to the EUSAAR-2 temperature program (Cavalli et al., 2010). As part of the joint EMEP/ACTRIS quality assurance and quality control effort, we regularly intercompared the performance of the OC EC instrument (e.g., Cavalli et al., 2016).
2.4 Measurement of organic tracers
2.4.1 Monosaccharide anhydrides, 2-methyltetrols, sugars, and sugar alcohols
We determined concentrations of monosaccharide anhydrides, sugar alcohols, 2-methyltetrols, monomeric, and dimeric sugars in PM10 filter samples using ultra-performance liquid chromatography (UPLC) (Vanquish UHPLC, Thermo Fisher Scientific) in combination with Q Exactive™ Plus Orbitrap (Thermo Fisher Scientific) operated in the negative electrospray ionization (ESI) mode, with a resolution of 70 000 FWHM (full width at half maximum) at 200 Da.
We added an isotopically labeled internal standard to filter punches (2×1.5 cm2) which were submerged in precleaned tetrahydrofuran (THF) (2 mL) in separate screw-neck amber glass vials, which we subjected to ultrasonic extraction (30 min). We transferred the solute to a centrifuge tube using pipetting and repeated this step twice. Afterward, we evaporated the solute to 0.4 mL, spun it (10 min; 2000 rpm, revolutions per minute), and transferred and evaporated it to dryness in a screw-neck amber glass vial. The sample volume was redissolved in 0.25 mL precleaned THF/Milli-Q water (55:45) and placed in a Whirlmix before analysis. The extraction procedure was equal to that of Dye and Yttri (2005). We used two columns in series for separation (two 3.0 mm × 150 mm HSS T3, 1.8 µm; Waters Inc.), using isocratic elution (Milli-Q; 18.2 MΩ), and flushing with acetonitrile (high purity) at the end of the run. The Milli-Q water was purified using an EDS-Pak Polisher containing activated coal (Merck KGaA, Darmstadt, Germany) and a LC-Pak cartridge (Merck KGaA, Darmstadt, Germany) containing reversed-phase silica.
We identified all species based on the retention time and mass spectra of authentic standards, using isotope-labeled standards of levoglucosan, galactosan, mannitol, arabitol, trehalose, and glucose as recovery standards (Table S1 in Yttri et al., 2021). The limit of detection (LOD) was 1 to 3 pg m−3 for the monosaccharide anhydrides, 1 pg m−3 for the 2-methyltetrols, 4 pg m−3 for the sugar alcohols, 6 pg m−3 for the dimeric sugars, and 8 pg m−3 for the monomeric sugars.
2.4.2 Measurement of cellulose
We based the analysis of free cellulose on the saccharification of cellulose and subsequently quantified the glucose produced, following the method by Kunit and Puxbaum (1996). We switched the final detection of glucose from a photometric method to HPAEC PAD (high-performance anion exchange chromatography with pulsed amperometric detection), similar to Qi et al. (2020). We extracted filter aliquots with a citrate buffer (0.05 M citric acid) adjusted to pH 4 and added thymol to a final concentration of 0.05 % to prevent bacterial growth. We enhanced extraction by ultrasonic agitation. We added enzymes (Trichoderma reesei cellulase; Aspergillus niger cellobiase), which had been precleaned by ultrafiltration to reduce glucose blanks, for saccharification. We stopped saccharification (at 45 °C) after 24 h by heating the samples to 80 °C. We analyzed glucose on a Dionex ICS-3000 equipped with a CarboPac MA1 column, using a sodium hydroxide gradient reaching from 480 mM NaOH to 630 mM. We corrected the results with the free glucose contained in the samples.
2.5 Radiocarbon measurements
We conducted 14C-measurements of total carbon (TC) and EC by complete combustion of the untreated quartz fiber filter and after removal of OC, respectively, using thermal–optical analysis (760 °C; pure O2) coupled with an online measurement in an accelerator mass spectrometer (Agrios et al., 2015). For a detailed description of the analytical method and data processing, see Rauber et al. (2023).
Selection criteria for samples subject to radiocarbon analysis
We picked one–two filter samples for each month of the year from samples collected from 2017 to 2018 to capture the seasonal variability in the source composition (Table S3 in the Supplement). No valid solution was found for the samples on 5–13 December 2017 when using the Latin hypercube sampling (LHS) approach (Sect. 2.8), hence the low coverage for December (6 %) compared to September (77 %). We pooled two consecutive samples for the months of June, July, August, September, October, and December to meet the LOD (3 µg C) for EC. Moreover, we aimed for the front : back filter carbon content ratio > 3, but this criterion was not met for one of the samples in June, September, and October and for two samples in December.
We analyzed 14C–TC on both front and back filters, while 14C–EC was analyzed only on front filters. To measure 14C–EC, we used three circular punches (22 mm diameter) from the filter sample aliquot (16.6 cm2). We used the remaining front filter area (5.2 cm2) for 14C–TC analysis, along with an equivalent area of the back filter.
2.6 Measurement of the aerosol absorption coefficient by multiwavelength Aethalometer
We obtained measurements of aerosol absorption coefficient (Babs) using a seven-wavelength (370, 470, 520, 590, 660, 880, and 950 nm) absorption photometer (AE33 Aethalometer, Magee Scientific) downstream of a PM10 inlet, yielding equivalent black carbon (eBC) by normalization with co-located EC measurements. We determined two eBC categories using a novel application of positive matrix factorization (PMF) (Yttri et al., 2021). These categories were based on the aerosol Ångstrøm exponent (AAE), with one having a low AAE (∼ 1), resulting from efficient combustion of mainly liquid fossil fuel, denoted eBCFF, and the other having a high AAE (∼ 1.6), mainly associated with biomass burning (eBCBB) and possibly residential coal combustion.
2.7 Auxiliary data
We downloaded concentrations of SO, Cl−, Na+, K+, Mg2+, Ca2+, Al, Fe, Mn, and Ti from the EBAS data repository (https://ebas-data.nilu.no/, last access: 31 January 2024). Inorganic anions and cations were obtained using a NILU (Norwegian Institute for Air Research) stacked filter unit (SFU) collecting aerosol particles on Teflon filters (2 µm pore; 47 mm Zefluor Teflon, Gelman Sciences). The SFU has a downward-facing inlet that effectively reduces the sampling efficiency for aerosol particles with an equivalent aerodynamic diameter (EAD) larger than 10 µm (Groot Zwaaftink et al., 2022). Elements were obtained from paper filters (Whatman 41) using a high-volume air sampler, with an inlet discriminating against aerosol particles with an EAD larger than 3 µm.
We calculated sea salt (ss) aerosol (SSA) according to Eqs. (1)–(5), and mineral dust (MD) according to Eqs. (6) and (7). We assumed Al, Fe, Mn, and Ti to be associated exclusively with mineral dust and present as Al2O3, Fe2O3, MnO, and TiO2 (Alastuey et al., 2016). Si data were not available and thus estimated based on an empirical factor (Eq. 7), which was assumed to be present as SiO2.
2.8 Source apportionment of carbonaceous aerosol by Latin hypercube sampling
We used a Latin hypercube sampling (LHS) approach (Gelenscer et al., 2007; Yttri et al., 2011b) for the source apportionment of CA, using 14C, organic tracers, and OC and EC measurements from 13 samples (Table S3) as input. We quantified the following seven CA fractions: EC from the combustion of biomass (ECbb) and fossil fuel (ECff), OC from the combustion of biomass (OCbb) and from fossil fuel sources (OCff), primary biological aerosol particles (OCPBAP), being the sum of plant debris (OCpbc) and fungal spores (OCpbs), and secondary organic aerosol (SOA) from biogenic precursors (OCBSOA). Our calculations were based on similar equations and emission ratios (ERs) to those presented in Yttri et al. (2011b), except that we used 14C–EC to calculate OCBB and ECBB. We have provided updated equations and ERs in Tables S1 to S2. At a remote site like Zeppelin, where BB emissions originate from distant source regions, 14C–EC seems a better option for apportioning BB emission than levoglucosan, assuming the significant depletion of levoglucosan under such conditions. Calculated concentrations and fractions of the CA categories are presented in Tables S3 and S4. The NH season was covered by 98 d, while the heating (H) season was covered by 54 d.
2.9 FLEXPART modeling
We calculated BC concentrations at Zeppelin using the Lagrangian particle dispersion model FLEXPART (FLEXible PARTicle dispersion model) version 10.4 (Pisso et al., 2019). FLEXPART released computational particles every 3 h for the whole study period at the Zeppelin Observatory, which were tracked backward in time. The model was driven by ERA5 (Hersbach et al., 2020) assimilated meteorological analyses from the European Centre for Medium-Range Weather Forecasts (ECMWF) with 137 vertical layers, a horizontal resolution of 0.5° × 0.5°, and 1 h temporal resolution. We kept the particles in the simulation for 30 d after release, sufficient to include most BC emissions arriving at the site, given a typical BC lifetime of 1 week (Bond et al., 2013). FLEXPART simulates the dry and wet deposition of gases or aerosols (Grythe et al., 2017), turbulence (Cassiani et al., 2015), and unresolved mesoscale motions (Stohl et al., 2005) and includes a deep convection scheme (Forster et al., 2007). Footprint emission sensitivities were calculated at spatial resolution of 0.5° × 0.5°. We assumed that BC has a density of 1500 kg m−3, following a logarithmic size distribution with an aerodynamic mean diameter of 0.25 µm and a logarithmic standard deviation of 0.3 (Long et al., 2013).
The footprint emission sensitivities express the probability of any release occurring in each grid cell to reach the receptor site. When coupled with gridded emissions from any emission inventory, it can be converted to the modeled concentration at the receptor site. To derive the contribution to the receptor BC from different sources, we combined each gridded emission sector (e.g., gas flaring and transportation) with the footprint emission sensitivity. We used anthropogenic emissions from the latest version (v6b) of the ECLIPSE (Evaluating the CLimate and Air Quality ImPacts of Short-livEd Pollutants) dataset, which is an upgraded version of the previous version 5a, as described by Klimont et al. (2017). The inventory (provided with a spatial resolution of 0.5° × 0.5°; monthly) includes the following:
-
industrial combustion (IND), with emissions from industrial boilers and industrial production processes;
-
energy production (ENE), with combustion processes in power plants and generators;
-
residential (domestic) and commercial sector (DOM), with combustion in heating, cooking stoves, and boilers in households, public, and commercial buildings;
-
waste treatment and disposal sector (WST), with emissions from waste incineration and treatment;
-
transport sector (TRA), with emissions from all land-based transport of goods, animals, and persons on road and off-road networks, including domestic shipping and aviation;
-
emissions from international shipping activities (SHP); and
-
gas flaring (FLR), with emissions from oil and gas facilities.
The ECLIPSEv6b dataset provides emission data at 5-year intervals. These emissions are then interpolated to annual emissions, according to the trend in geographical areas considered in ECLIPSE (Klimont et al., 2017). The temporal variation in the emissions of all sectors was provided by IIASA (Klimont et al., 2017). WF emissions were adopted from the Global Fire Emission Dataset version 4.1 (GFEDv4.1). The product combines satellite information on fire activity and vegetation productivity to estimate the gridded monthly burned area and fire emissions, as well as scalars that we can use to calculate higher temporal resolution emissions. All data are publicly available for use in large-scale atmospheric and biogeochemical modeling (van der Werf et al., 2017). Emission factors to compute BC emissions are based on Akagi et al. (2011). The spatial resolution of the current version (v4) is of 0.25° × 0.25° (daily).
To distinguish between modeled BCbb and BCff, we combined contributions to receptor concentrations from (i) DOM and WF and (ii) ENE, FLR, IND, WST, SHP, and TRA, respectively.
Monthly mean concentrations of OC, EC, and organic tracers at Zeppelin Observatory are presented in Figs. 2 and 3 and annual and seasonal means in Table 1. Our study is the first presenting eBCBB and eBCFF data (Fig. 2) derived from multiwavelength Aethalometer measurements in the Arctic, and we compare them with BCBB and BCFF data obtained from the FLEXPART model (Table 3; Figs. 4 and S1 in the Supplement) and with ECBB and ECFF data from the LHS approach (Sect. 3.2.2) (Tables 4 and S3 to S4). CA source apportionment by the LHS approach is presented in Fig. 5 and Tables S3 to S4. We discuss our data according to the periods June to October, representing the growing season and the non-heating season (NH season), and November to May, covering the non-growing season and the heating season (H season). These are obviously not absolute definitions. Phenomena of high relevance to the Arctic aerosol, such as boreal WF emissions, thus largely reside in the NH season, whereas the accumulation of anthropogenic emissions from Eurasia in winter and spring, known as AH, is part of the H season. Comparison is made with Birkenes Observatory (southern Norway), representative of the lowest CA levels in regional background Europe (Yttri et al., 2021) (Tables S5 and S6), with Ispra, a regional background site in the Po Valley (northern Italy), one of Europe's most polluted regions (Table 5S), and the Trollhaugen Observatory (Antarctica) (Table S7).
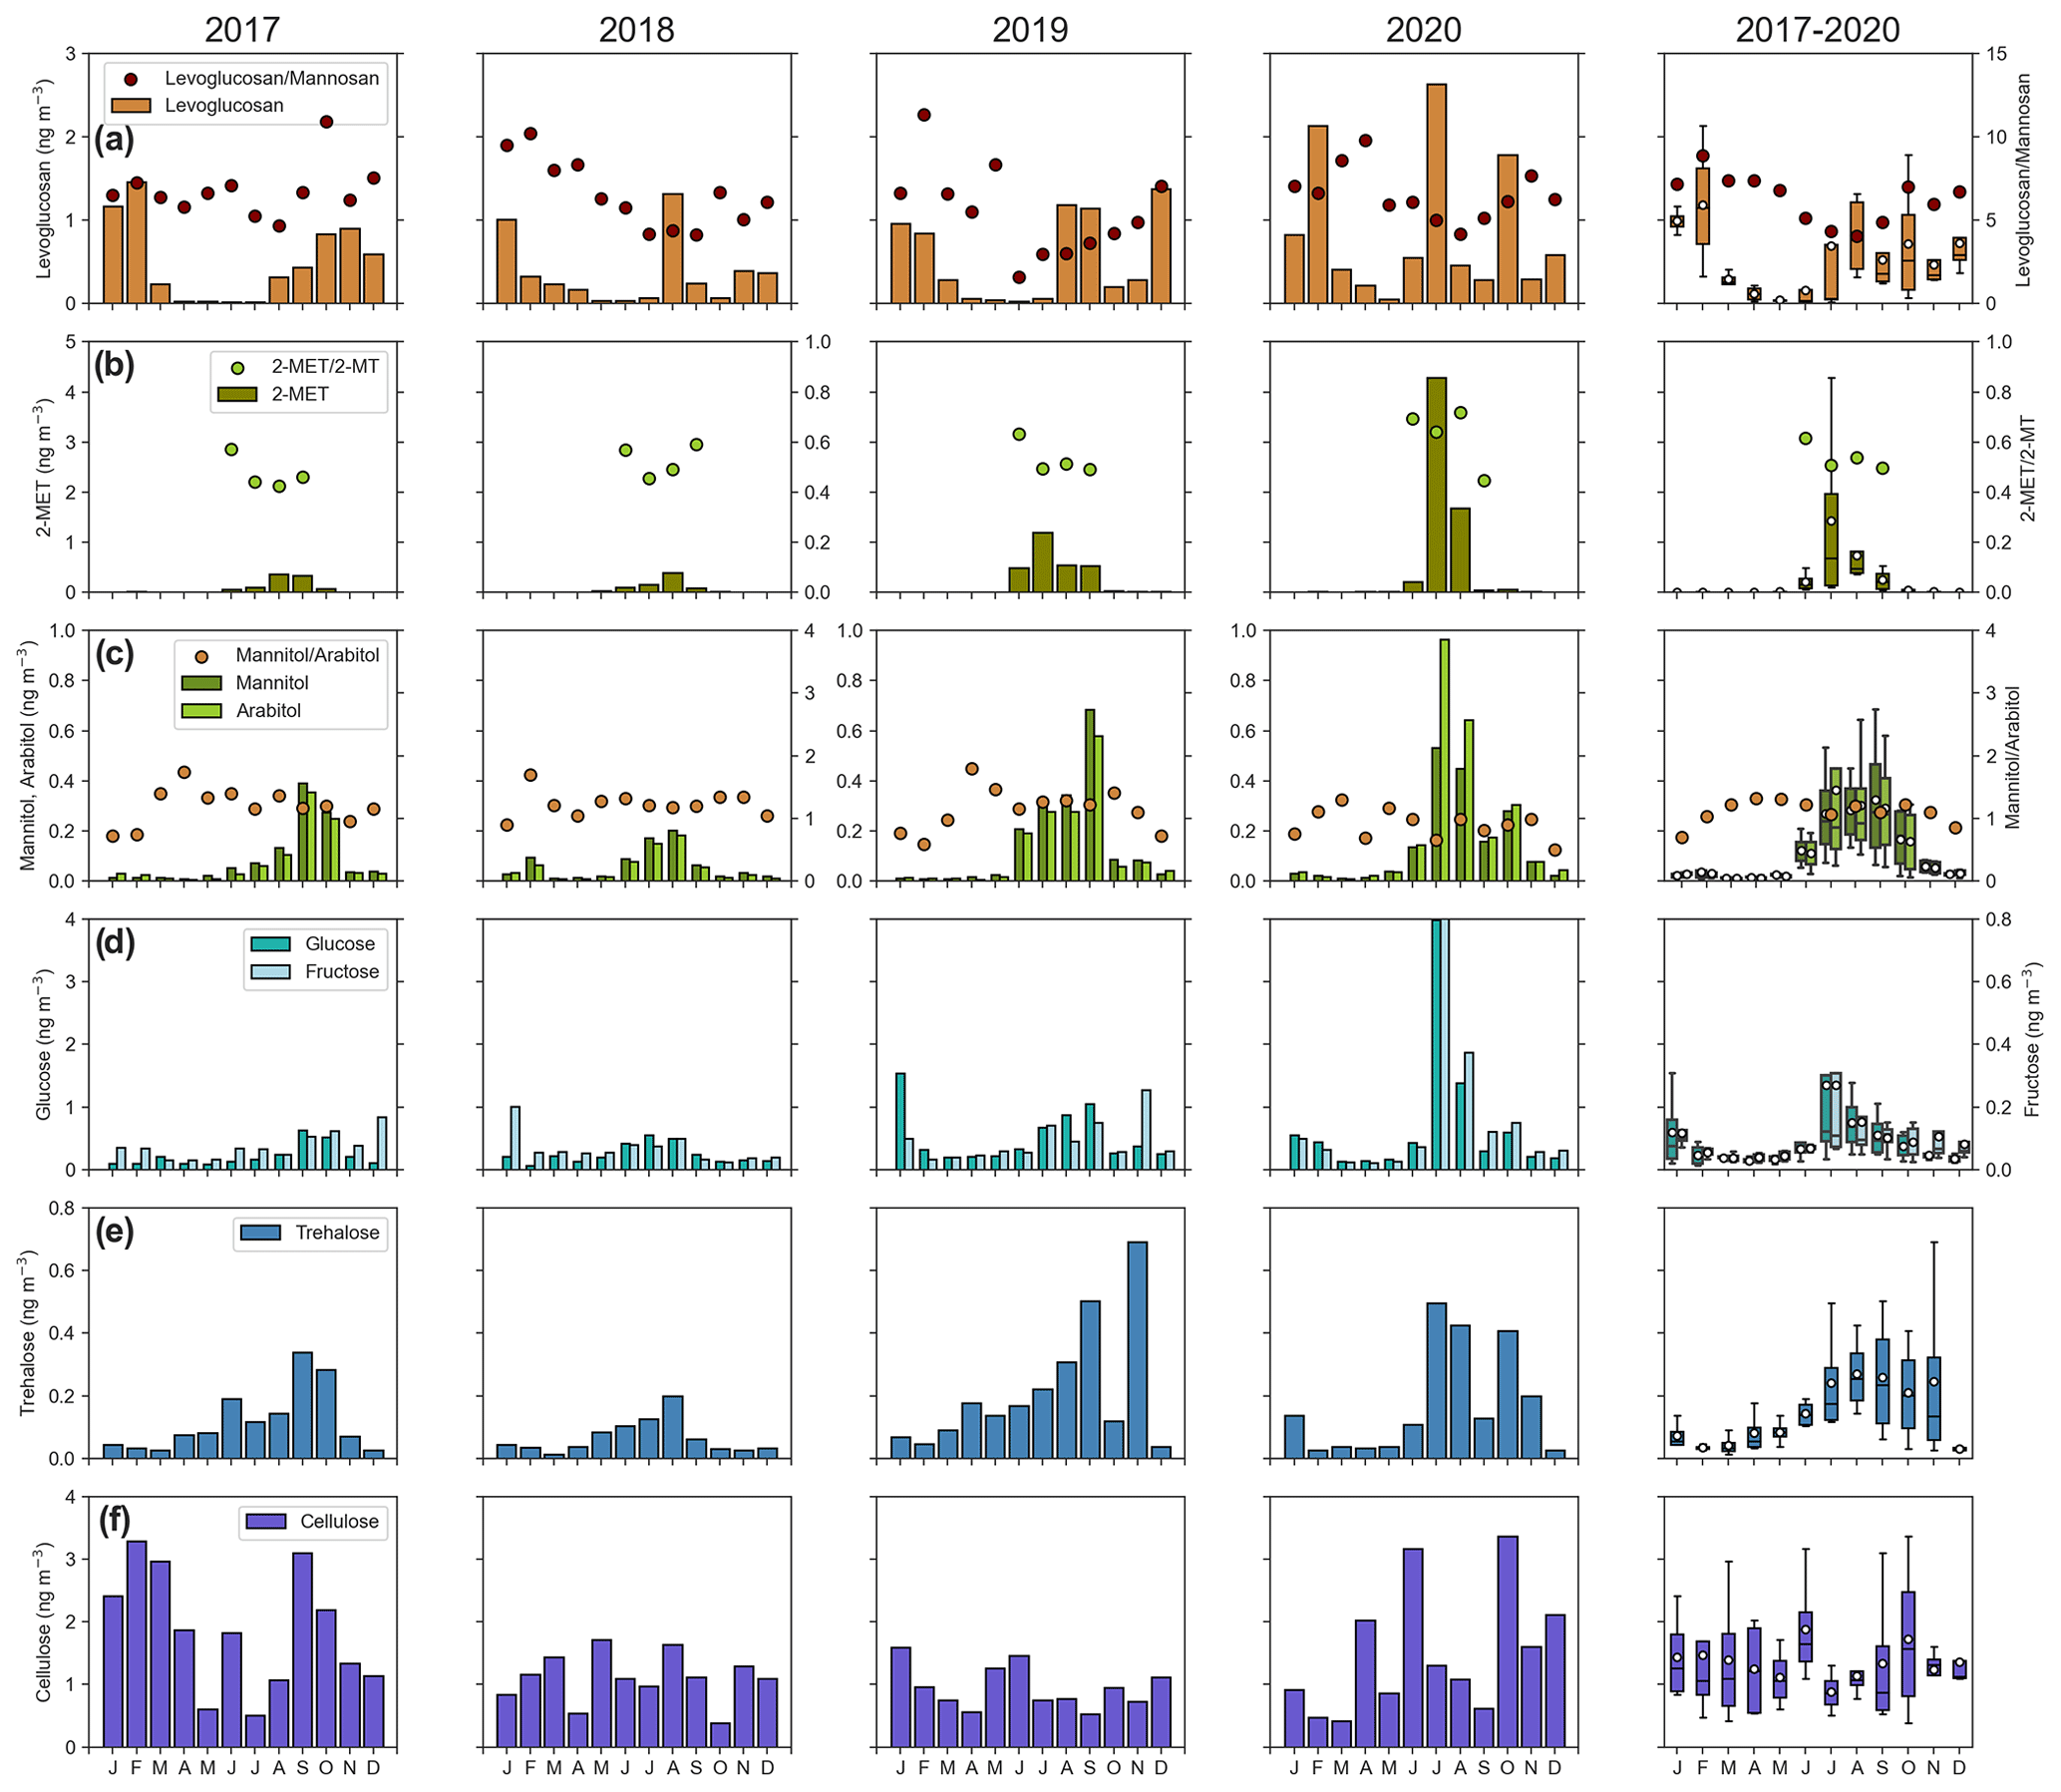
Figure 3Panels show monthly mean concentrations for 2017 to 2020 and box plots (mean, 25th, 50th, 75th percentiles, and IQR) for 2017 to 2020 at Zeppelin Observatory for (a) levoglucosan and levoglucosan/mannosan; (b) 2-methylerythritol (2-MET) and 2-MT/2-MET; (c) mannitol and arabitol and mannitol/arabitol; (d) fructose and glucose; (e) trehalose; and (f) cellulose. All variables are measured in the PM10 size fraction.
Table 1Annual and seasonal mean concentrations of OC, OCB (OC on backup filters), EC, TC, and organic tracers at Zeppelin Observatory from 2017 to 2020. Note that DJF is for December to February, MAM is for March to May, JJA is for June to August, and SON is for September to November.
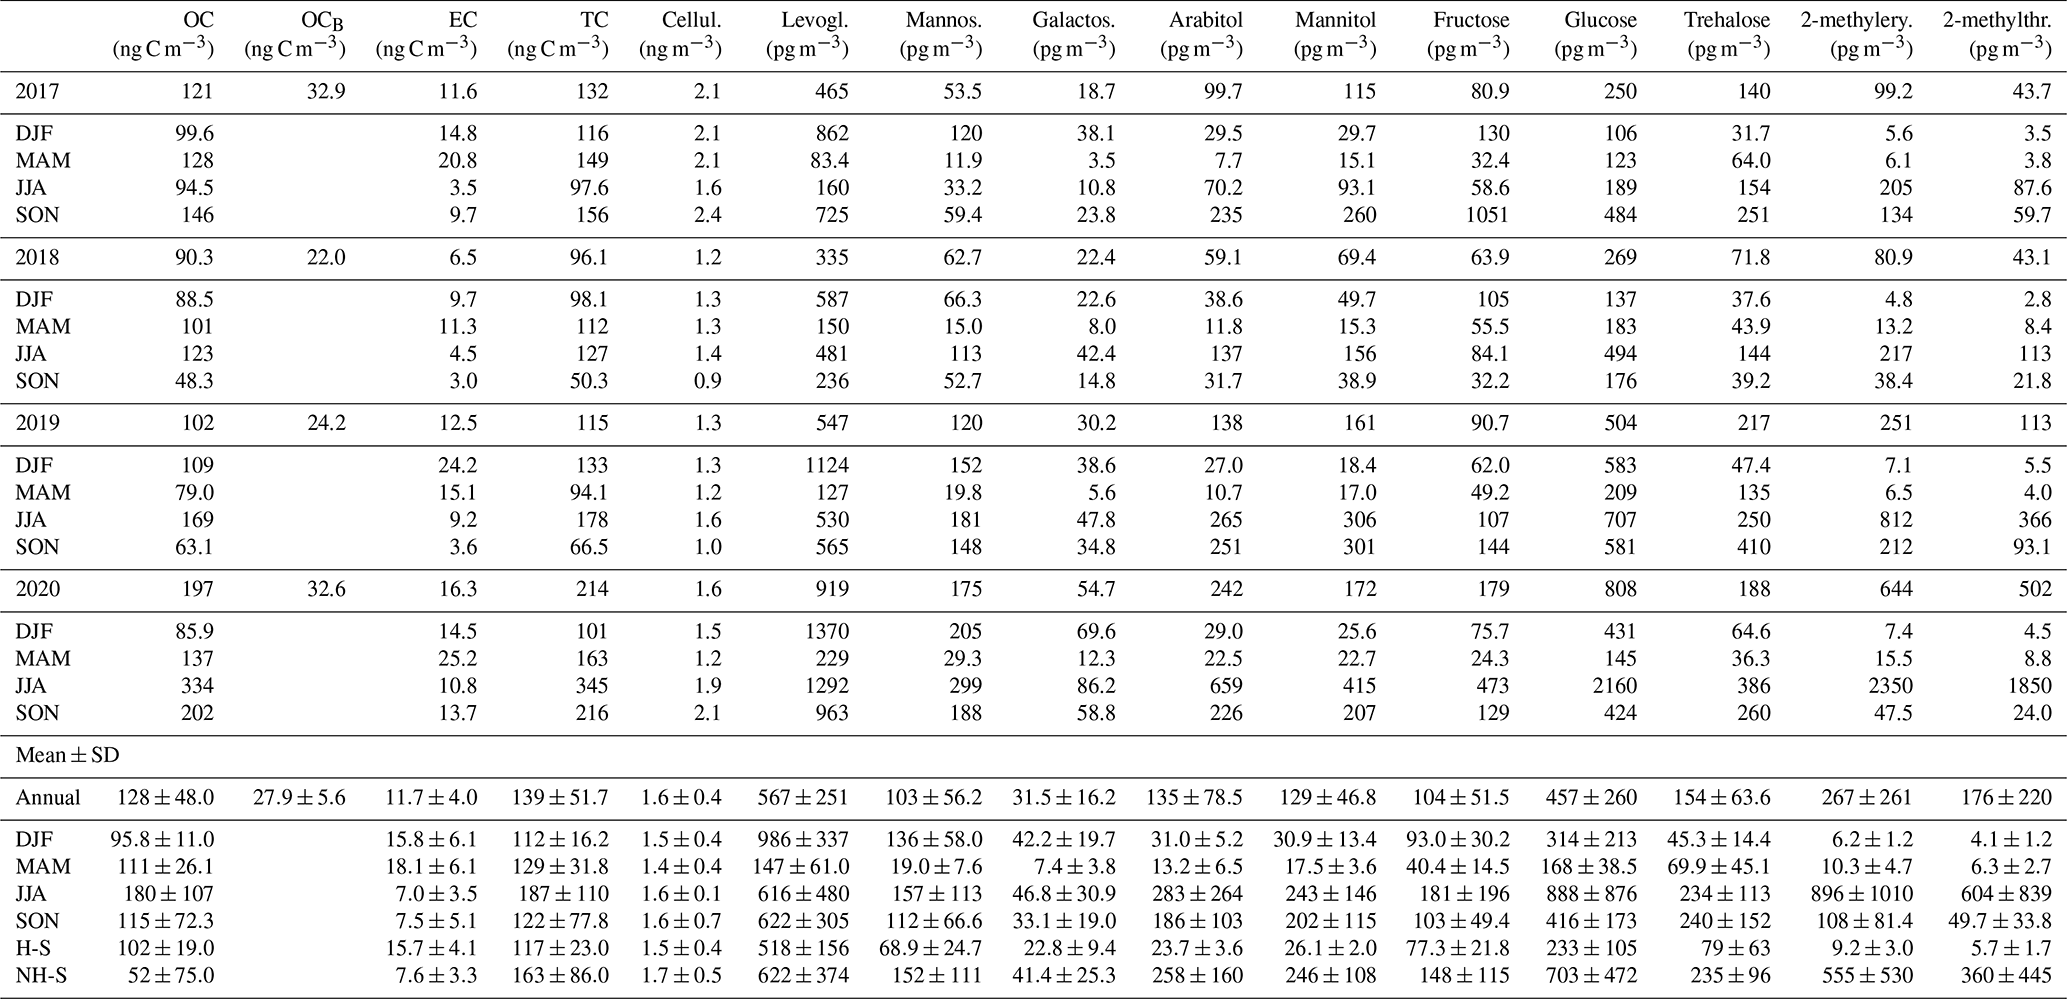
Note: H-S is the heating season (November–May); NH-S is the non-heating season (June–October).
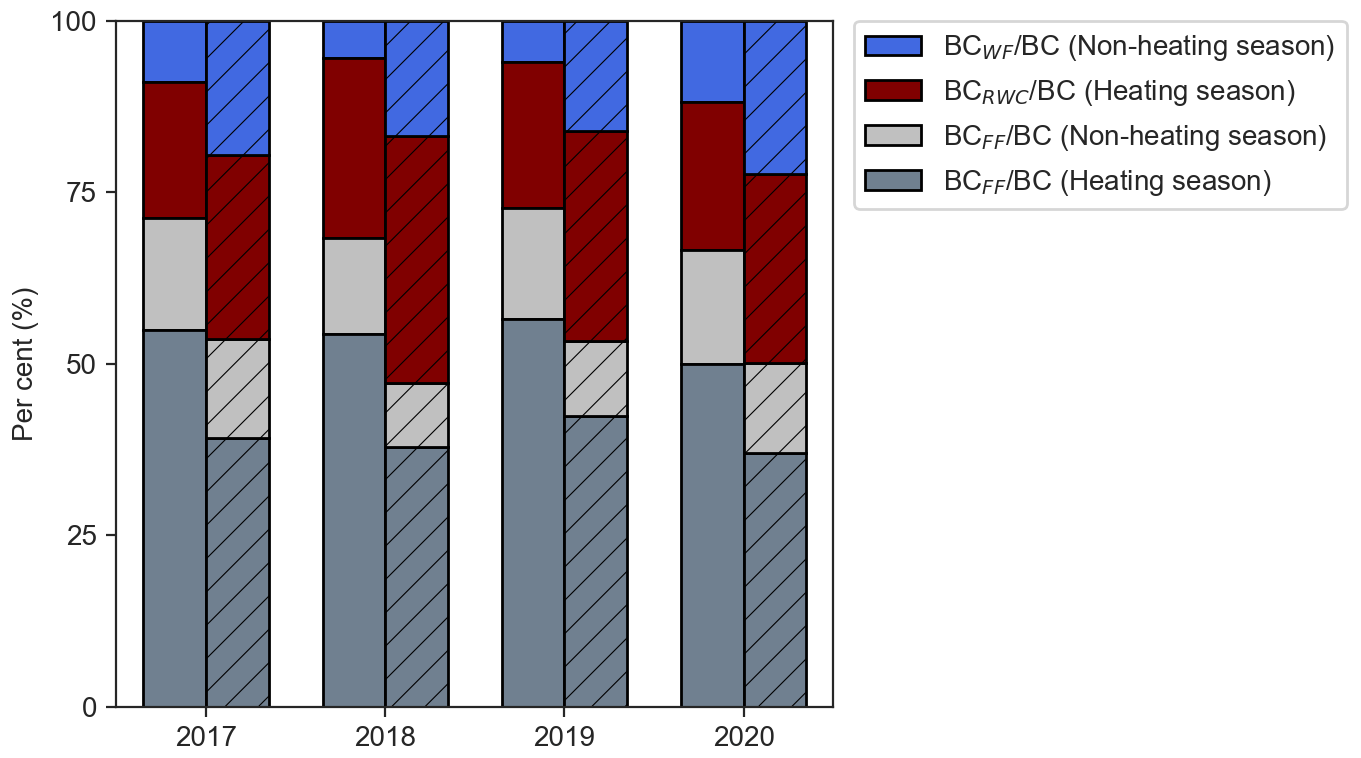
Figure 4eBC (PMF) (without diagonal lines) and BC (FLEXPART) (with diagonal lines) apportioned to biomass burning (BB) and fossil fuel (FF) combustion according to the heating season and non-heating season. BB is denoted wildfire (WF) in summer and residential wood combustion (RWC) in winter. These figures refer to the Zeppelin Observatory (2017 to 2020). For simplicity, we state BC for all methods, while the correct term is eBC for PMF and BC for FLEXPART.
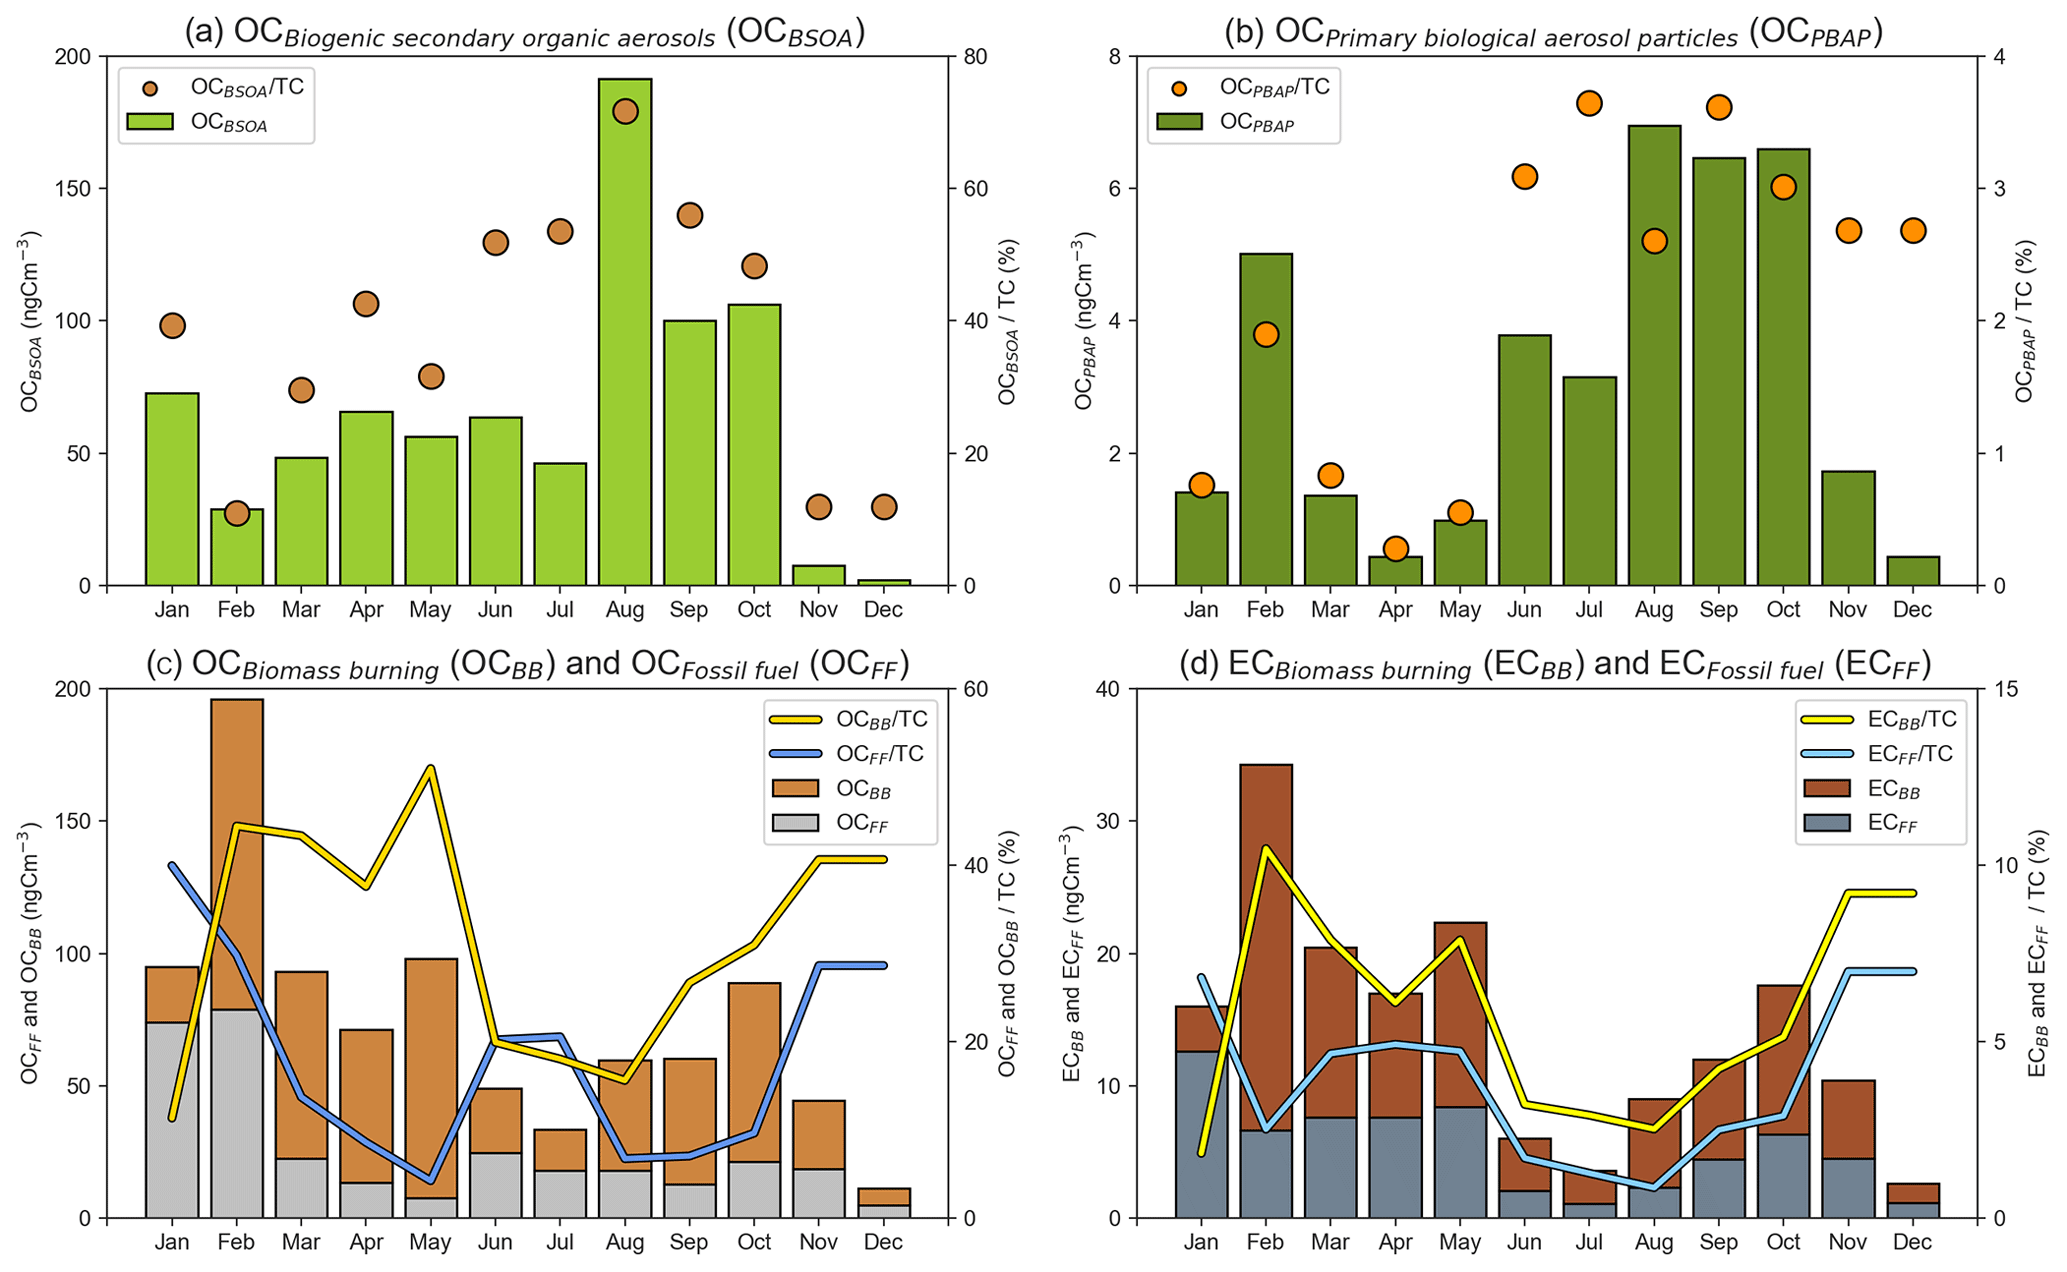
Figure 5Source apportionment using the LHS approach (Sect. 2.8). Panels show monthly mean concentrations and relative contributions for samples collected in 2017 to 2018 at Zeppelin Observatory for (a) biogenic secondary organic aerosol (OCBSOA) and OC; (b) primary biological aerosol particles (OCPBAP), being the sum of fungal spores (OCPBS) and plant debris (OCPBC), and OC; (c) biomass burning (OCBB, OC) and fossil fuel sources (OCFF, OC); and (d) fossil fuel (ECFF, EC) and biomass burning (ECBB, EC).
3.1 Elemental carbon and organic carbon
The interannual variabilities in EC (34 %) and OC (38 %) were comparable to SO (40 %). Like OC, SO can have both primary or secondary sources, originate from LRT or local emissions, and stem from natural and anthropogenic sources. Notably, its time series spans back to 1991 (Platt et al., 2022). The annual mean concentrations ranged from 6.5 to 16.3 ng carbon (C) m−3 for EC and from 90.3 to 197 ng C m−3 for OC. These levels are amongst the lowest globally but still notably higher compared to Antarctica (1.9 ng EC m−3; 12.2 ng OC m−3) (Table S7) (Rauber et al., 2024). Particulate OC (OCP) had an estimated conservative concentration of 68.3 to 165 ng C m−3 after accounting for the positive sampling artifact (OCB). CA levels were particularly high in 2020 due to a major LRT episode in July (Sect. 3.6.1), with EC and OC increased by factors of 1.6 and 1.9, respectively, compared to the mean of the previous 3 years. For SO, the increase in 2020 was only 1.25.
The annual mean concentration of OM (281±106 ng m−3) was less than for sea salt aerosol, mineral dust, and even non-sea-salt (nss) SO, although not for all 4 years considered (OM > nss SO for 2020) (Table 2).
Table 2Estimated annual mean concentrations (Eqs. 1–7) of sea salt aerosol (SSA), mineral dust (MD), non-sea-salt sulfate (nss SO), organic matter (OM = OC ×2.2; Turpin and Lim, 2001), and elemental carbon (EC) at Zeppelin Observatory from 2017 to 2020 (units in ng m−3).
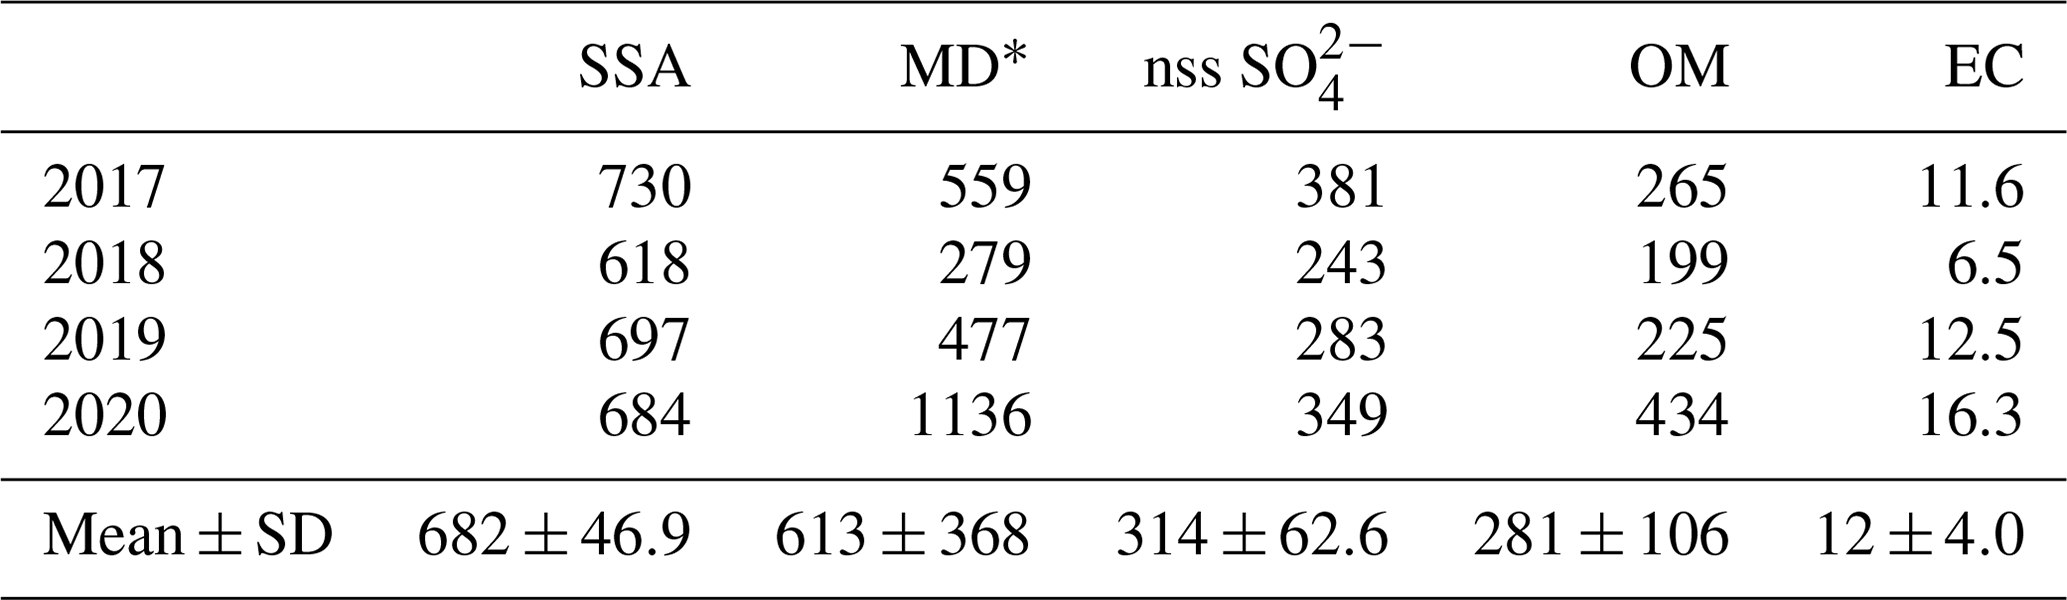
* 3 µm EAD size fraction (10 µm EAD for other variables).
Elevated EC concentration in the H season corresponds with the AH phenomenon (Shaw, 1995) and is consistent to that previously shown for eBC (Eleftheriadis et al., 2009) and SO (Quinn et al., 2007; Platt et al., 2022). However, three of the four highest weekly EC concentrations occurred in the NH season (Sect. 3.6). The mean EC concentration in the NH season was 5 times lower than at the Birkenes Observatory and close to 2 orders of magnitude lower than Ispra. EC increased by a factor of 2 during the H season compared to the NH season, due to more efficient transport of air masses to the Arctic in winter (Ottar, 1989) and by AH accumulation in winter and spring (Shaw, 1995). The EC level at Zeppelin in the NH season was 8 times lower than at Birkenes and nearly 60 times lower than at Ispra.
OC levels at Zeppelin was 7 times lower than at the Norwegian mainland both for the H and NH seasons. In the H season, levels at Zeppelin were more than 50 times lower than in the polluted Po Valley region, while slightly more than 1 order of magnitude lower in the NH season.
OC seasonality (Fig. 2) was characterized by a dip in May and June, which is a transition period between the elevated levels seen for the AH period and the midsummer. Contemporaneous measurements of organic tracers (BB, BSOA, and PBAP), EC, eBCBB, and eBCFF largely explained the seasonality. EC was elevated throughout the AH period, pointing to a dominant contribution of OC from the combustion of FF and BB, whereas BSOA and PBAP tracers (except for cellulose) did not start increasing until June. Note that Fu et al. (2009b) found terpene oxidation products, such as 3-methyl-1,2,3-butane-tricarboxylicacid (3-MBTCA) to be elevated compared to most isoprene oxidation products during the AH period at Alert (Canadian Arctic) and that only isoprene oxidation products were measured in the present study. Furthermore, results presented in Sect. 3.5 suggest a 25 % BSOA contribution to CA, even in winter. The BB tracer levoglucosan experienced a significant decrease from February to March, suggesting that OC from fossil sources became more prominent as the AH period progressed. However, we speculate that there was a substantial degradation of levoglucosan, starting from the end of the polar night (15 February) or as daylight hours increased, as no similar decrease was observed for eBCBB. This degradation might be due to factors such as aerosol particle scavenging by low-level Arctic clouds, which is known to peak in early spring for BC (Zieger et al., 2023), and subsequent depletion by water-phase reactions. BB, BSOA, and PBAP tracers typically peaked in July and August, but whereas BSOA tracers decreased abruptly in early fall, PBAP tracers persisted to late fall, whereas BB tracers, EC, eBCBB, and eBCFF started increasing again towards the end of the year.
Of the 10 highest OC concentrations, 8 were observed in the NH season, while for EC, 7 of the 10 highest concentrations were observed in the H season. Low emissions within the Arctic make OC, and EC, seasonality susceptible to LRT episodes, and we find that the OC peak in the NH season is as strongly influenced by LRT as is EC during AH. We discuss three of these episodes in Sect. 3.6.
3.2 Biomass burning and fossil fuel combustion sources
3.2.1 Levoglucosan
Annual mean levoglucosan concentrations ranged from 0.335 to 0.919 ng m−3, which is comparable to the annual mean (0.680 ng m−3) reported for Zeppelin for March 2008 to March 2009 (Yttri et al., 2014). The interannual variability was 40 %, similar to major aerosol constituents such as OC and SO. In 2020, the annual mean was twice as high as the mean of the previous 3 years, with an increase attributed to elevated monthly means (∼ 2 ng m−3) in February, July, and October (Fig. 3).
Increased levels and peak concentrations of levoglucosan in the H season reflected RWC emissions, as shown by Yttri et al. (2014). Increased levels in July and August were not shown by Yttri et al. (2014), partly due to missing data, although impact from wild and agricultural fires was predicted by modeling. In the present study, increased levels in July and August were a hallmark of the levoglucosan time series, pointing to the importance of WF emissions. FLEXPART model transport of modeled BC emissions also showed a substantial influence of WF emissions for July and August (2017 to 2020) (Fig. S1). The levoglucosan concentration in the 2020 NH season was ∼ 3 times higher than the average of the 3 previous years, demonstrating a pronounced interannual variability in WF influence at Zeppelin. The levoglucosan to mannosan ratio (L M) was lower for the NH season (4.8±1.2) compared to the H season (7.5±1.9) (Fig. 3; Table S6) and might reflect a shift from WF and agricultural waste burning in the NH season to RWC in the H season. Our findings correspond with L M ratios below 5 in summer at Gruvebadet (Ny-Ålesund) (Feltracco et al., 2020). However, we did not observe the very high L M ratios, occasionally exceeding 40, that have been attributed to emissions from crop residue burning in Asia during the spring.
3.2.2 ECBB and ECFF obtained from radiocarbon measurements and LHS
Tracer-based LHS source apportionment found that BB was the primary source of EC in all but one sample (Tables S3 and S4). On average, 61±15 % of EC was attributed to BB, with this percentage varying by season, with 67±5 % in the NH season when EC levels were low and influenced by WF, and 57±18 % in the H season when RWC dominated. Our results showed a much higher BB fraction in the H season than Winiger et al. (2019) for the H season from 2012 to 2013 (36 % to 39 %), whereas it matched that of the AH period in 2009 (57±21 %) (Winiger et al., 2015). The BB fraction in NH season was slightly higher than the 58 % to 62 % range for the NH season in 2013 (Winiger et al., 2019). Notably, differences in the sample preparation and in 14C analytical protocol should be considered, along with interannual variability, to seek an explanation for the observed differences.
The weekly maximum BB fraction of EC in February 2017 (81 %) was somewhat lower than the extremely high (95 % to 98 %) daily BB fractions during AH at Zeppelin in 2009 (Winiger et al., 2015). Although no conclusive explanation was given for the extreme values reported by Winiger et al. (2015), it cannot be excluded that BB emissions can dominate for an entire week. eBCBB apportioned by PMF (Sect. 3.2.3) supports nearly exclusive (90 %) BB contributions for 24 h (Fig. S2) but not for an entire week (80 %) (not shown). Notably, Kongsfjorden has around 20 cabins and a few research stations, and wood is used for heating in these facilities when in use. Hence, emissions from these sources cannot be excluded. The weekly minimum BB fraction for January 2018 (21 %) was much lower compared to the lowest percentage reported by Winiger et al. (2015) (39 %). FLEXPART footprints for the February 2017 and the January 2018 samples were similar, covering northwestern Russia and northeastern Greenland (not shown) and providing no further insight to their extreme values, and thus “highlights the complexity of BC in the Arctic atmosphere, where the generally low BC levels may be strongly influenced by point sources or occasional combustion practices” (Winiger et al., 2015).
3.2.3 eBC from biomass burning and fossil fuel combustion obtained from PMF and FLEXPART modeling
The eBC (sum of eBCBB and eBCFF) and EC time series were similar, with enhanced levels during AH, a small increase in midsummer, and a slight increase towards the end of the year. FF was the major fraction of eBC annually (70±2.7 %), in the H season (71±2.7 %), and in the NH season (67±6.7 %) (Table 3; Fig. 4).
Table 3Annual, heating season, and non-heating season contributions of BB and FF to eBC (PMF) and BC (FLEXPART). BB is denoted RWC in the heating season and WF in the non-heating season. Heating season and non-heating season contributions of levoglucosan are included. This refers to Zeppelin Observatory from 2017 to 2020. The unit is percent (%).
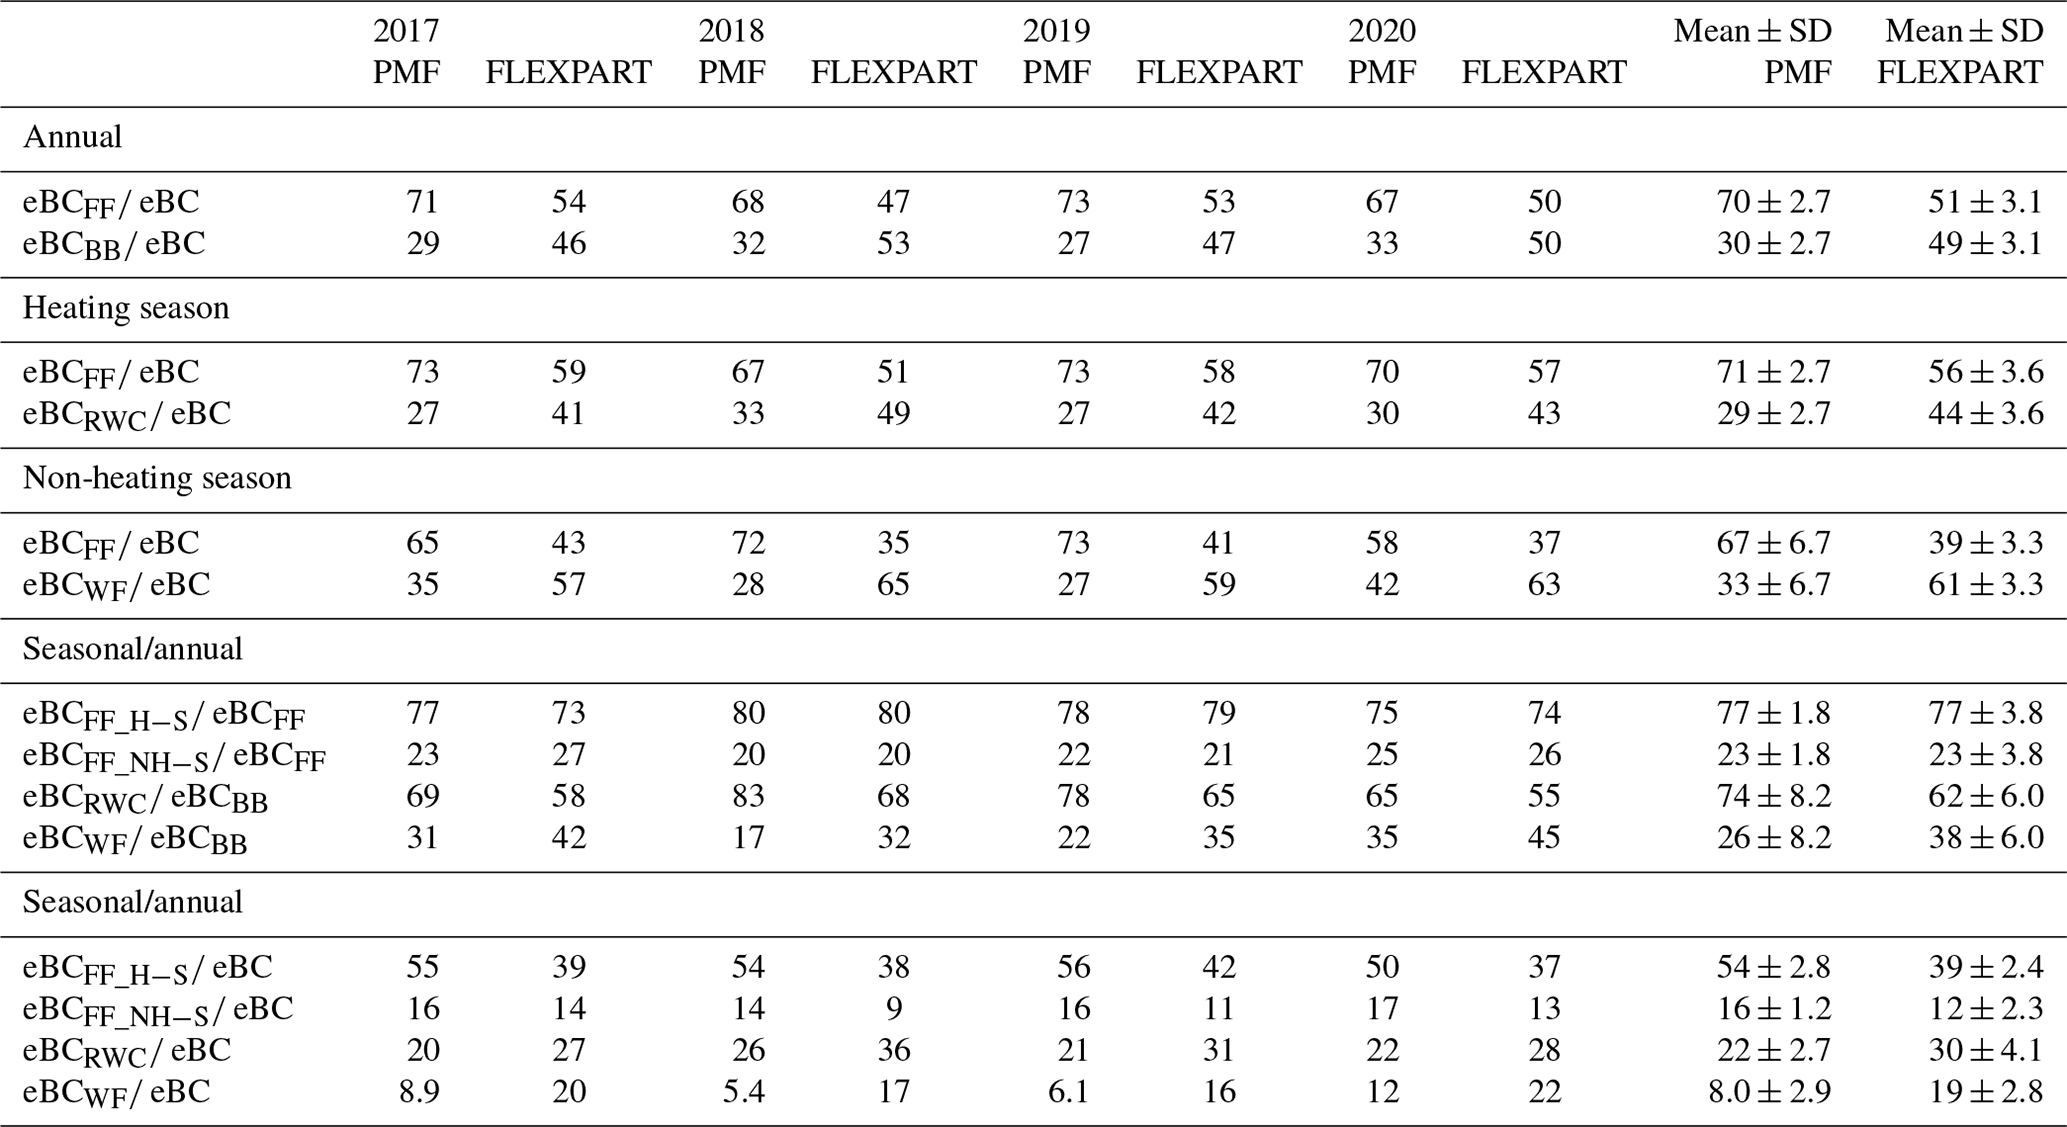
Note: eBC is the equivalent black carbon; FF is the fossil fuel; BB is the biomass burning; H-S is the heating season; NH-S is the non-heating season; Levo is the levoglucosan; WF is the wildfire; and RWC is the residential wood combustion. For simplicity, we state eBC for both PMF and FLEXPART methods, while the correct term is BC for FLEXPART.
Previous modeling studies indicate that WF is the primary source of Arctic BC during summers (Stohl et al., 2013; McCarty et al., 2021). The 14C EC measurements support this for Zeppelin but not for other high Arctic observatories (Table 4; Winiger et al., 2019). In our study, 27 %–42 % of eBC was attributed to WF emissions in the NH season, which is lower than previous findings. Our estimate assumes that all eBCBB in the NH season comes from WF emissions (eBCWF) and from residential wood combustion emissions (eBCRWC) in the H season. Neither eBCWF nor eBCRWC dominated on a monthly basis (Fig. S3), although they came close in October 2017, July 2020, and October 2020, accounting for 46 % to 48 %. The annual contribution of eBCWF to eBC was estimated to be 5.4 % to 12 %, while eBCRWC contributed 20 % to 26 %, highlighting that RWC is a larger source of eBC compared to WF.
Table 4BB and FF fractions of BC (monthly weighted) obtained by different approaches (PMF, FLEXPART, and Radiocarbon; LHS) for non-heating season and heating season. Means are based on identical time periods (see Table S3). JJASO is for June to October, and NDJFMAM is for November to May.
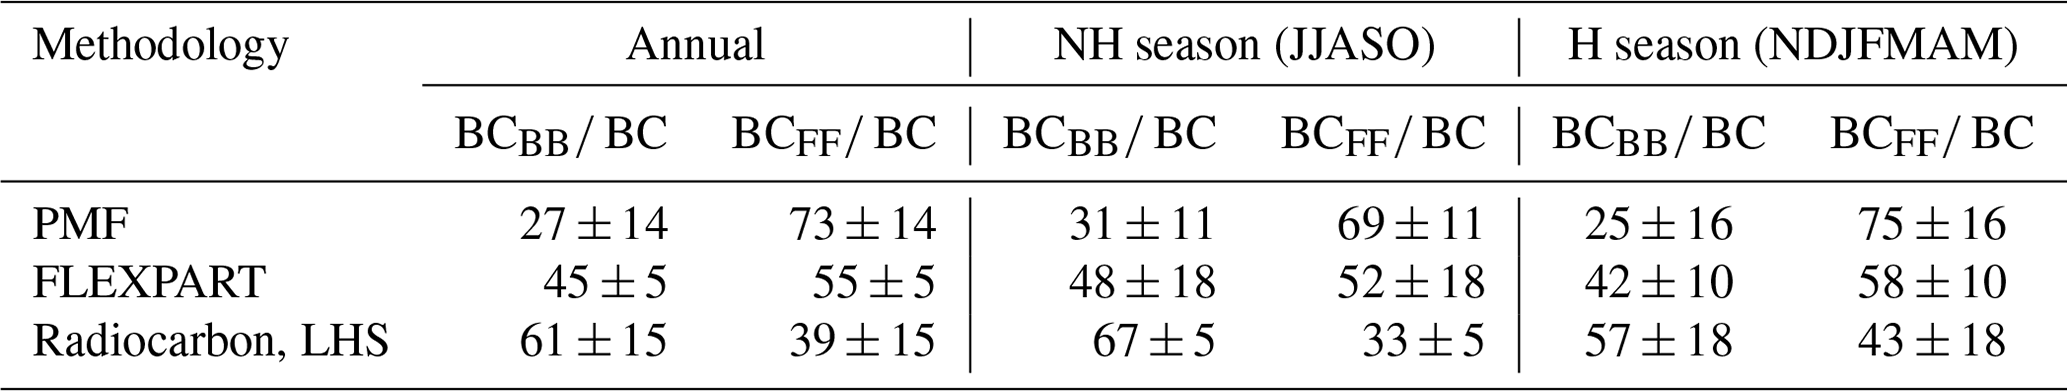
Note that for simplicity we state BC for all methods, while the correct term is eBC for PMF, BC for FLEXPART, and EC for Radiocarbon, LHS.
FLEXPART predicted an almost equal share of BC from BB and FF annually, whereas BCFF (56±3.6 %) dominated in the H season and BCBB (61±3.3 %) in the NH season (Table 3), similar to results found in Stohl et al. (2013). For a direct comparison, BCWF (and BCRWC) was calculated similarly from FLEXPART BCBB output as eBCWF from eBCBB by PMF; i.e., BCWF equals all BCBB in the NH season, whereas BCRWC equals all BCBB in the H season. Comparing this proxy BCWF with the FLEXPART-modeled BCWF provided a ratio of 0.97 to 1.09 for 2017 to 2020, indicating that the BCWF proxy is a sound approximation. With 16 % to 22 % of BC attributed to WF and 27 % to 36 % to RWC annually (Fig. 4; Table 3), FLEXPART concludes, in the same way as PMF, that RWC > WF but suggests higher percentages for WF and RWC fractions.
Neither PMF nor FLEXPART seem to fully reflect the predominant role of BC from WF above 50° N, which McCarty et al. (2021) suggest are larger than the emissions from anthropogenic residential combustion, transportation, and flaring combined. In 2020, 56 % of the BC emissions north of 65° N were attributed to open biomass burning by McCarty et al. (2021), whereas 12 % (PMF) and 22 % (FLEXPART) of (e)BC was attributed to WF at Zeppelin for 2020 in the present study. Spatial variability and vertical distribution of the emissions might explain part of the discrepancy, as might midlatitude emissions below 65° N, being less influenced by WF. Vertically resolved BC concentrations in the Arctic in spring and summer, based on aircraft measurements, show a decrease with increasing altitude (Jurányi et al., 2023), but this remains yet to be confirmed for BC from WF.
For the BB tracer levoglucosan, the fraction observed in the NH season (36 % to 64 %), corresponding to the WF fraction, was higher than seen for both eBCWF (17 % to 35 %) (PMF) and BCWF (32 % to 45 %) (FLEXPART). However, the degradation of levoglucosan during LRT and lack of representative (e)BC levoglucosan ERs for a vast number of fuel categories, vegetation types, and combustion conditions implies considerable uncertainty in deriving the RWC WF (e)BC split using this technique.
Comparing PMF results to the few samples subjected to 14C measurements and source apportionment by tracer-based LHS showed that these two approaches were on opposite ends of the scale, with FLEXPART in between (Table 4). Radiocarbon measurements and LHS estimated a BB fraction twice as high as the PMF approach, but all three methods agreed on a higher BB fraction in the NH season than in the H season. Notably, BB and FF fractions of eBC derived from PMF were more aligned with those from radiocarbon measurements at Zeppelin in 2012 to 2013 (Winiger et al., 2019) and with fractions derived from levoglucosan measurements at Zeppelin in winter 2008 to 2009 (Yttri et al., 2014). However, interannual variability makes such a comparison indicative only. Consideration of methodological differences is essential. Crucial steps of 14C–EC measurements include preventing EC loss during OC removal and avoiding OC mixing with the minor EC fraction, thus impacting its modern vs. fossil fuel signature. The advancements in the analytical approach used in this study (Rauber et al., 2023) specifically aimed to improve these critical steps. Additionally, eBC derived from Aethalometer measurements provides no information on the age of carbon undergoing combustion but reflects the wavelength dependence of the absorption linked to the combustion condition (Garg et al., 2016). Consequently, the eBCFF factor obtained by PMF could also contain emissions from combustion of biofuels, observed as modern carbon by 14C measurements. Conversely, emissions from coal combustion might contribute to the eBCBB factor. Terms like liquid fuel instead of fossil fuel and solid fuel instead of biomass burning could be more appropriate, but we maintain the notation for comparability with 14C-based apportionment and Aethalometer model studies (Sandradewi et al., 2008). Applying the Aethalometer model approach with an Ångstrøm exponent pair of (1,2) (Sandradewi et al., 2008) and (0.9,1.68) (Zotter et al., 2017), yields annual eBCBB contributions of 32 % and 29 %, supporting our more novel PMF approach (27±14 %) (Table 4). Furthermore, we note that the Ångstrøm exponents obtained from the PMF (1,1.6) are consistent with the distribution of Ångstrøm exponents observed at various sites across Europe (e.g., Tobler et al., 2021). Despite the differences in the estimated contribution size from biomass vs. fossil fuel sources between 14C–EC measurements and eBC by PMF, important conclusions drawn are unaffected. For instance, both methods indicate the presence of residential wood combustion and wildfire-sourced black carbon at Zeppelin, with a higher relative BB contribution during the non-heating season.
Nearly exclusive (90 %) contributions to eBC were seen for both eBCBB and eBCFF for periods of 24 h (Fig. S2; upper left panel). This corresponds with 24 h 14C–EC data from Zeppelin dominated (EC fbb> 95 %) by contemporary carbon (Winiger et al., 2015) and 14C–EC data dominated (EC fff> 95 %) by fossil carbon observed at other high Arctic sites (Winiger et al., 2019). Exclusive contributions were most frequent for eBCFF and seen for 1.1 % of the dataset compared to 0.1 % for eBCBB. Hence, with a few exceptions, eBCBB and eBCFF co-appear.
3.3 Biogenic secondary organic aerosol – 2-methyltetrols
The 2-methyltetrols (here the sum of 2-methylerythritol and 2-methylthreitol) are primarily formed from the acid-catalyzed multiphase chemistry of isoprene epoxydiols (IEPOX) (Surratt et al., 2010; Lin et al., 2012; Cui et al., 2018), which are important low-NOx oxidation products of isoprene (Paulot et al., 2009), the biogenic volatile organic compound (500 Tg C yr−1) emitted in the highest amount globally (Williams and Koppmann, 2007), and an important source of BSOA (Hallquist et al., 2009; Nozière et al., 2015). Their low-level presence in the Arctic has been demonstrated in only a few studies covering a few months (e.g., Fu et al., 2009b). We discuss their level, seasonality, sources, and LRT vs. local formation over 4 consecutive years.
The 2-methyltetrol concentrations at Zeppelin were at the lower range of those reported in Europe (Ion et al., 2005; Kourtchev et al., 2005, 2008a, b), North America (Cahill et al., 2006; Xia and Hopke; 2006; Cui et al., 2018), South America (Claeys et al., 2010), and Asia (Fu et al., 2010) and consistent with levels observed at Alert in the Canadian Arctic (Fu et al., 2009b). The duration of the elevated 2-methyltetrol concentrations during the peak of the interannual cycle at Zeppelin appears quite like that at the Birkenes Observatory (southern Norway) 2300 km further south. With an onset in June and peak concentrations in July and August, the time series at Zeppelin is delayed by half a month compared to Birkenes (Fig. 6 in Yttri et al., 2021), although concentrations drop by mid-October at both sites. The annual mean 2-methyltetrol concentration was 3 times lower at Zeppelin compared to Birkenes in 2017 and 5 times lower in 2018. In 2019, the 2-methyltetrol level at Zeppelin increased by a factor of 3 compared to 2017 to 2018 and in 2020 by a factor of 9, and thus for 2020, the annual mean at Zeppelin (1.15 ng m−3) was nearly twice as high as the highest annual mean seen at Birkenes (0.610 ng m−3 in 2018).
The atmospheric lifetime of isoprene is < 4 h, whereas the lifetime of 2-methyltetrols is unknown (Wennberg et al., 2018) and the amount attributed to formation from locally emitted isoprene vs. LRT 2-methyltetrols remains an open question. The 2-methyltetrol level at Birkenes increases by nearly a factor of 20 when leaves unfold in May (Yttri et al., 2021). Consequently, the effect of leaves unfolding 0.5 to 1.5 months earlier in continental Europe (the leaves of Betula pubescens unfold 2.1 d later at 100 km along a south to north transect in Europe; Rötzer and Chmielewski, 2001) does not seem to have an influence, suggesting that the 2-methyltetrol level largely reflect local formation. At Svalbard, there are no forests and hardly any trees, but still there is vegetation (including mosses and lichens) that emits isoprene that can have emission rates that are considerably higher than those observed at southern latitudes (Kramshøj et al., 2016). Circumpolar land masses are situated further away from Zeppelin than continental Europe from Birkenes, thus local formation of 2-methyltetrols might be important also at Svalbard. Marine sources of isoprene cannot be excluded, particularly in remote marine areas (Liakakou et al., 2007), although macro algae seem to favor dimethyl sulfide (DMS) formation rather than isoprene in the Arctic (Dani and Loreto, 2017). Furthermore, time series of 2-methyltetrols and MSA at Zeppelin (Sharma et al., 2012) do not co-vary, suggesting a non-marine origin of 2-methyltetrols.
The increased 2-methyltetrol level at Zeppelin in 2019 to 2020 occurred during summer. From 30 June to 11 August 2020, weekly mean concentrations ranged from 5.9 to 28 ng m−3 for 4 out of 6 weeks, being up to 5 times higher than the highest weekly mean at Birkenes (5.6 ng m−3) for 2017 to 2018. We recognize that levoglucosan was elevated (1.0 to 6.0 ng m−3) for these 4 weeks and that air masses were influenced by WF emissions in western Russia (Fig. 6; Sect. 3.6.1). We are left speculating how WF might have augmented 2-methyltetrol levels. Isoprene emissions are enhanced by increased temperature, and a fire plume provides favorable conditions for BSOA formation and aerosol surface area for condensation. Notably, 2-methyltetrols are semi volatile (Lopez-Hilfiker et al., 2016) and at high OA loadings increased partitioning to the aerosol phase will occur. Furthermore, transport time was short (Fig. S3), which is favorable concerning the potential degradation of 2-methyltetrols. Increased formation from local isoprene emissions is likely, as ambient temperature at Zeppelin was unprecedentedly high in this period (see Sect. 3.6.1 and Fig. 6 for details). The elevated 2-methyltetrol concentration (3.7 ng m−3) seen for the warm period in the beginning of July 2019 was not nearly as high as for July and August 2020 and levoglucosan (0.04 ng m−3) was not increased.
The 2-methyltetrols (here ng C m−3) contributed up to 0.34 % to OC monthly in the NH season in 2019 and 0.56 % in 2020, being clearly higher compared to the 2 previous years (0.14 % and 0.23 %), which in turn was higher than the highest monthly mean values at Birkenes (0.09 % and 0.12 %). Compared to rural central Europe (0.68 % in June) (Ion et al., 2005) and boreal forest Finland (0.88 % in the July to August transition) (Kourtchev et al., 2005), the highest contributions at Zeppelin in 2020 are slightly lower.
Multiyear time series of 2-methyltetrols are rare, particularly in areas with low-NOx concentrations (Nozière et al., 2011; Cui et al., 2018). We find that the NH season drop in the 2-methylthreitol to 2-methylerythritol ratio was much more pronounced at Birkenes (0.36±0.11) than at Zeppelin (0.54±0.12) (Table S6). A NH season drop is also observed the Hyytiälä observatory (boreal forest Finland) (Kourtchev et al., 2005). Elevated ratios were observed at Zeppelin in July (0.83) and August (0.70) 2020 when influenced by WF emissions, being substantially higher compared to July–August (0.45±0.04) of previous years. With the exceptions mentioned, the mean ratio for the NH season at Zeppelin agrees with the upper range (0.25 to 0.58) reported by others (Claeys et al., 2010). This relates to the formation mechanism of 2-methyltetrols outlined by Bates et al. (2014), which shows a 1:2 relationship between cis-ß-IEPOX and trans-ß-IEPOX, accounting for > 97 % of observed IEPOX, and which are the precursors of 2-methylthreitol and 2-methylerythritol, respectively. Notably, 2-methyltetrols can also result from the degradation of IEPOX-derived organosulfates through hydrolysis of tertiary ones (Darer et al., 2011); however, these species were not measured in the present study.
There are studies suggesting a biological (enzymatic) origin of 2-methyltetrols, as there is an enantiomer excess of both 2-C-methyl-D-erythritol and 2-C-methylthreitol (Nozière et al., 2011; González et al., 2014; Jacobsen and Anthonsen, 2015). If the 2-methyltetrol formation was exclusively abiotic, resulting from atmospheric oxidation of isoprene (Claeys et al., 2004), then there would be a racemic mixture of the 2-methyltetrols. This is consistent with the known production of the 2-methylerythritol D-form by plants, algae, and microorganisms (Anthonsen et al., 1976, 1980; Dittrich and Angyal, 1988; Ahmed et al., 1996; Duvold et al., 1997; Sagner et al., 1998; Enomoto et al., 2004). Consequently, it can be questioned if 2-methyltetrols are exclusive tracers of BSOA from atmospheric oxidation of isoprene; e.g., a 30 % to 67 % biological contribution was calculated for May to December for the Aspvreten site (Sweden) (Nozière et al., 2011). Unfortunately, the analysis done in the present study does not allow for a proper investigation of a potential biological contribution. Cahill et al. (2006) argued for a biological source based on the correlation between 2-methyltetrol and the PBAP tracers of glucose (r2=0.732) and fructose (r2=0.644) for 11 samples. At Zeppelin, r2 for 2-methyltetrols vs. fructose (0.951), glucose (0.946), and arabitol (0.801) appears elevated in the NH season but drops substantially (r2= 0.052–0.437) when excluding the extreme values in July and August 2020. At Birkenes, the correlation was non-existent (r2= 0.000–0.025). Source apportionment of CA by PMF at Birkenes showed that the factor explaining 94 % of the 2-methyltetrols explained only 6 % of the PBAP tracers and that the factor explaining 89 % of the PBAP tracers explained only 2.5 % of the 2-methyltetrols (Yttri et al., 2021). Hence, statistics do not argue for a common source of 2-methyltetrols, or a fraction of 2-methyltetrols, and PBAP tracers. Further, 2-methylerythritol vs. 2-methylthreitol correlated highly both at Zeppelin (r2=0.971) and at Birkenes (r2=0.889), suggesting one dominating source (abiotic secondary formation), corresponding to findings by El-Haddad et al. (2011). However, potential mechanisms by which biologically formed 2-methyltetrols are released to the atmosphere are not known; thus, a biological contribution cannot be excluded.
3.4 Primary biological aerosol particles
The interest in PBAP has grown over the last 2 decades, with rising awareness of its contribution to the OA budget (e.g., Waked et al., 2014; Yttri et al., 2021; Moschos et al., 2022) and as a source of warm ice-nucleating particles, which are deemed more important than cloud condensation nuclei regarding Arctic cloud radiative properties (Solomon et al., 2018). We address a handful of PBAP tracers, discuss their levels, seasonality, and sources, including cellulose, measured in Arctic aerosol for the first time.
3.4.1 Sugars and sugar alcohols
Annual mean concentrations of sugars and sugar alcohols were 1 to 2 orders of magnitude lower at Zeppelin compared to Birkenes, reflecting the modestly vegetated Arctic and that PBAP mainly have a local origin (Samaké et al., 2019). This contrasts with the factors for 2-methyltetrols (≤ 5), which are secondarily formed species with a stronger regional character but might also relate to the temperature sensitive high flux of biogenic volatile organic compounds for Arctic vegetation (Kramshøj et al., 2016). Higher levels of primary biological organic aerosol (PBOA) at Gruvebadet (50 m a.s.l.), 1 km south of Ny-Ålesund, compared to the Zeppelin Observatory (472 m a.s.l.) (Moschos et al., 2022), indicate a local contribution associated with the more verdant lower altitude areas. However, maximum concentrations of sugars and sugar alcohols were observed for the LRT episode 22–27 July 2020 (Sect. 3.6.1), explaining 29 % of the annual sugars and sugar alcohols loading. We are left speculating about the LRT fraction of PBAP vs. that of local origin, but LRT likely makes a larger contribution to PBAP in the Arctic than for more vegetated southerly biomes.
All species experienced a modest increase in June, coinciding with the onset of the growing season, but evolved differently after that, suggesting a mixture of sources, highlighting the importance of measuring a broad spectrum of PBAP tracers. Arabitol and mannitol were elevated throughout summer before successively declining towards the end of the year, and fructose and glucose started decreasing immediately after the peak level in July, whereas trehalose experienced comparable levels from July to November. Snow cover can be decisive for PBAP levels (Yttri et al., 2007a, b) and probably more so for the non-forested Arctic. However, our data do not explicitly demonstrate an influence of the snow cover, e.g., the seasonality of trehalose (and cellulose; Sect. 3.4.2).
The composition of sugars and sugar alcohols at Zeppelin (Table 1) and Birkenes (Table S5) varied, reflecting different biomes. Glucose was the most abundant sugar, regardless of the season, at Zeppelin. At Birkenes, glucose dominated only in winter, while arabitol and mannitol were more prominent in summer. Trehalose levels were comparable or slightly higher than arabitol and mannitol at Zeppelin but lower at Birkenes. Samaké et al. (2020) showed how only a few genera of fungi and bacteria were responsible for the sugar and sugar alcohol containing PBAP in PM10 filter samples at a rural site in France and that these were associated with leaves rather than soil material. This strong association between sugars and sugar alcohols and vegetation likely explain the very low levels of these PBAP tracers at Zeppelin compared to Birkenes. Samaké et al. (2020) point to the fungus Cladosporium sp. when explaining ambient aerosol levels of arabitol, mannitol, and trehalose, as do Yttri et al. (2007b) for Birkenes. The annual mean mannitol to arabitol ratio was comparable between Zeppelin (1.1±0.5) and Birkenes (1.0±0.0) (Table S6) and to values reported for the Nordic countries (Yttri et al., 2011a). Mannitol and arabitol were highly correlated in the NH season (r2=0.983) when levels were elevated, and the mannitol to arabitol ratio variability was minor, suggesting one common source dominating. However, four samples with a mannitol to arabitol ratio ≥ 3 in the April to May transition could indicate influence from another source. Mannitol is considered the most abundant naturally occurring polyol, which is present and produced in a wide range of living organisms (Tonon et al., 2017) and accounts for 25 % of the dry weight of macroalgae for certain parts of the year (Horn et al., 2000); however, our data for Zeppelin suggest that fungal spores are decisive for arabitol and mannitol present in the Arctic aerosol. Assuming all mannitol was associated with fungal spores, their carbon content contributed 0.5±0.2 % to OC annually when applying the lower OC mannitol ratio (5.2) of Bauer et al. (2002), whereas the highest monthly mean was seen for September (1.5±1.2 %). The contribution reached 5 % for only two of the weekly samples. Using the higher OC mannitol ratio (10.8) would double these estimates.
Glucose is a building block of natural dimers and polymers and a ubiquitous primary molecular energy source and thus an important PBAP. Small amounts of glucose are present in RWC emissions (Nolte et al., 2001) and are increased in air masses influenced by forest fire smoke (Medeiros et al., 2006). Notably, 9 of the 10 samples highest in glucose were also highly increased with respect to levoglucosan and were all collected in the NH season (Table S8), demonstrating WF as an important source of glucose brought to the Arctic by LRT. A largely similar finding was made for the other sugars and sugar alcohols. Previous studies do not seem to link fungal-related sugars and sugar alcohols (arabitol, mannitol, and trehalose) with WF emissions (e.g., Table 5 in Medeiros et al., 2006) or with RWC emissions; e.g., levoglucosan and sugar alcohols end up in different factors in PMF studies (Waked et al., 2014; Yttri et al., 2021). This might partly be due to lack of correlation between levoglucosan and sugar alcohols for an entire dataset. Indeed, low correlations between levoglucosan and sugar alcohols (; ) were obtained considering the entire dataset for Zeppelin, although the data presented in Table S8 clearly demonstrate a connection between WF and sugar alcohols.
We estimated a 7 %–15 % contribution of PBAP to OC annually, using an OC to PBAPTracers emission ratio (ER) of 14.6±2.1 (Groot Zwaaftink et al., 2022), derived from measurements in the boreonemoral zone (Yttri et al., 2021), keeping in mind that such an ER would be site specific.
3.4.2 Cellulose
Cellulose was the most abundant organic tracer analyzed (annual mean concentration of 1.6±0.4 ng m−3), but levels were much lower than in rural areas of continental Europe (annual mean of 16.3–284 ng m−3) (Sánchez-Ochoa et al., 2007; Brighty et al., 2022), likely due to the sparse vegetation at Svalbard. The highest monthly means were seen for June followed by October, but there was no pronounced seasonality for cellulose as seen for the other PBAP tracers (Sect. 3.4.1). This corresponds with findings made by Sánchez-Ochoa et al. (2007), who pointed to a minor seasonality “with higher winter levels than expected”, and that of Puxbaum and Tenze-Kunit (2003), who associated increased cellulose levels in spring with “seed production and repulsing of other cellulose containing plant material” and “production of leaf litter” in the fall. High wind speed might be a driving force for generation and entrainment of cellulose containing aerosol particles that is more pronounced in winter, and particularly in the harsh Arctic climate, but possibly limited by snow cover. In the recent study by Brighty et al. (2022), a clear seasonality was shown, with increased levels in the summer and fall at French and Swiss rural sites.
Size distribution measurement of cellulose is limited and inconclusive, with the highest concentrations reported both for the fine (Puxbaum and Tenze-Kunit, 2003) and the coarse mode (Yttri et al., 2011b; Brighty et al., 2022). Lack of comparable seasonality between nearby sites indicates that local sources dominate (Brighty et al., 2022), but with a certain fraction associated with fine aerosol, LRT is a possibility. Cellulose did not correlate with other PBAP tracers or levoglucosan, corresponding to the findings by Brighty et al. (2022), but this does not exclude co-emission (see Sect. 3.4.1). A minor fraction (0.08 %) of RWC emissions was attributed to cellulose in a combustion study by Schmidl et al. (2008), but we found no strong connection between the samples highest in cellulose and levoglucosan, whereas we did for the other PBAP tracers and levoglucosan, or between cellulose and the other PBAP tracers (Table S8). The lack of resemblance between cellulose and other PBAP tracers and BB aerosol should be explored further.
Cellulose (here ng C m−3) made a 1.0±0.3 % contribution to OC annually, corresponding to the lower range reported for rural background sites along an east–west transect across Europe (0.7 %–3.9 %) (Sánchez-Ochoa et al., 2007) but substantially lower compared to French (3.2±2.4 %) and Swiss (5.9±4.4 %) rural background sites (Brighty et al., 2022).
The contribution of plant debris (here ng C m−3) was estimated from cellulose (Puxbaum and Tenze Kunit, 2003; Yttri et al., 2011a, b) as a 2.0±0.6 % contribution to OC annually and thus somewhat higher than for fungal spores (0.5 %–1.1 %). On a monthly basis, 4 % to 6 % contributions were observed in all seasons. Weekly samples (n=23) with a high (5 % to 12 %) plant debris contribution were associated with low OC levels (mean 53 ng C m−3; 22th percentile). Plant debris and OC were correlated (r2=0.707), suggesting that plant debris is a driver of observed OC levels at low concentrations. We did not observe a similar feature for fungal spores.
3.5 Source apportionment of carbonaceous aerosol by Latin hypercube sampling
Source apportionment of CA (here TC) by the LHS approach showed that natural sources dominated in the NH season (85 %) and anthropogenic in the H season (73 %), assuming all biomass burning emissions originated from WF in the NH season and from RWC in H season (Fig. 5). Even without attributing BB emissions to WF, natural sources still dominated in the NH season (60 %).
BSOA (56 %) was the major natural source in the NH season, followed by WF (26 %) and PBAP (3.2 %). Compared to previous studies (Yttri et al., 2011a, b), we found a lower PBAP fraction, which we attributed to the less vegetated Arctic environment. Note that the LHS approach underestimates the PBAP fraction by only accounting for fungal spores and plant debris, thus apportioning a part of PBAP to BSOA (Yttri et al., 2021). The PBAP fraction increased to 11 % when using an OC to PBAPTracers emission ratio (ER) of 14.6±2.1 (Groot Zwaaftink et al., 2022) including the sum of arabitol, mannitol, glucose, and trehalose. Note that this ER was obtained from measurements in the boreonemoral zone and was thus more representative of LRT than local PBAP sources.
RWC (46 %) was the major fraction in the H season, followed by FF (27 %) and BSOA (25 %), whereas PBAP (1.4 %) was negligible, even when considering the upper estimate (2.7 %) obtained using the ER by Groot Zwaaftink et al. (2022). The absence of 2-methyltetrols in winter indicated that BSOA was formed from oxidation of mono- and sesquiterpenes and dimethyl sulfide, which seem more abundant in the Arctic winter than oxidation products of isoprene (Fu et al., 2009b; Sharma et al., 2012). Further, modeling studies suggest that increased condensation may explain wintertime BSOA (Simpson et al., 2007), which might be particularly relevant for the low Arctic temperatures.
Our source apportionment results for Zeppelin align with findings from rural background sites in Europe (e.g., Gelencsér et al., 2007; Genberg et al., 2011; Gilardoni et al., 2011; Glasius et al., 2018; Yttri et al., 2011b), where RWC dominates during the H season and BSOA dominate in the NH season. Rerunning the analysis, using levoglucosan instead of 14C–EC for apportionment of BB emissions, lowered the contribution from WF in the NH season from 26 % to 4.4 %. However, the contribution from natural sources remained consistent, as BSOA accounted for the modern carbon redistributed from WF. In the H season, the contribution from RWC decreased from 46 % to 8.9 %, making BSOA (62 %) and natural sources (64 %) the major fractions, even in the H season. Hence, the choice of tracer (levoglucosan vs. 14C–EC) would lead to different results and conclusions for Zeppelin.
3.6 LRT episodes outside the AH period
LRT episodes are decisive for CA levels and seasonality observed at Zeppelin. We analyzed in detail the three episodes with the highest weekly means of OC, which also had three of the four highest weekly means of EC (Figs. 6 to 8). All these episodes had air masses originating from NW Eurasia.
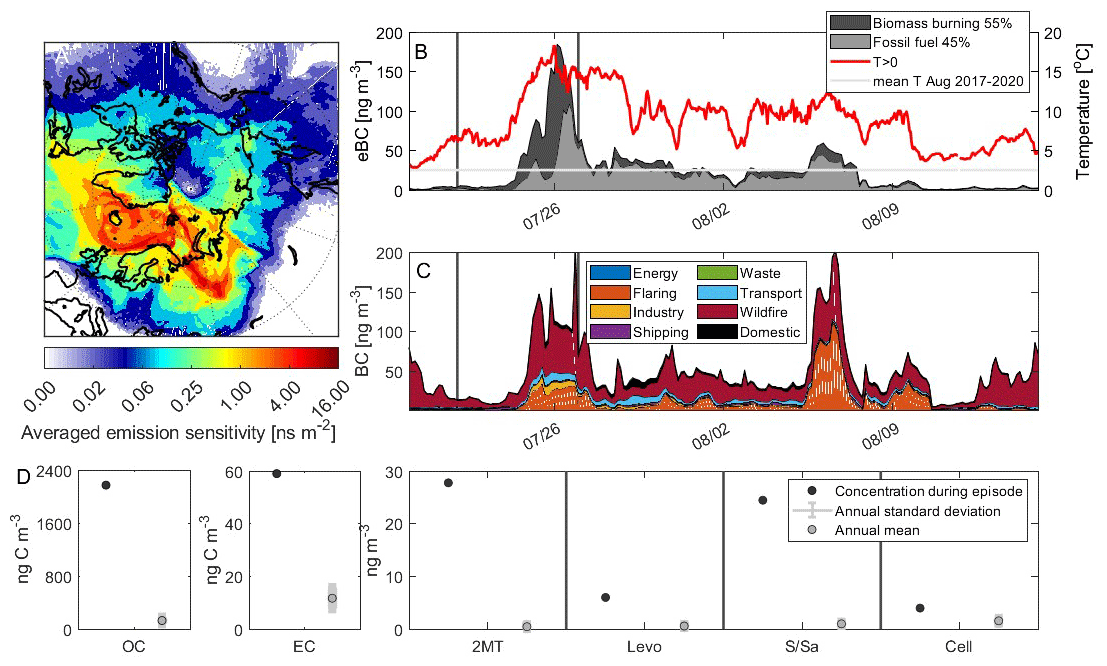
Figure 6LRT episode at Zeppelin Observatory covered by filter sample collected 22–27 July 2020. (a) Averaged footprint sensitivity for sample collected 22–27 July 2020 and (b) hourly time series of eBCBB and eBCFF (PMF) and ambient temperature. The period covered by the filter sample is defined by the vertical dark gray lines. (c) Hourly time series of modeled BC concentrations from different source categories and (d) concentrations of OC, EC, and organic tracers (2MT is for 2-methyltetrols; Levo is for levoglucosan; S and SA are for sugars and sugar alcohols; cell is for cellulose) obtained for the filter sample compared to the long-term annual mean and its standard deviation.
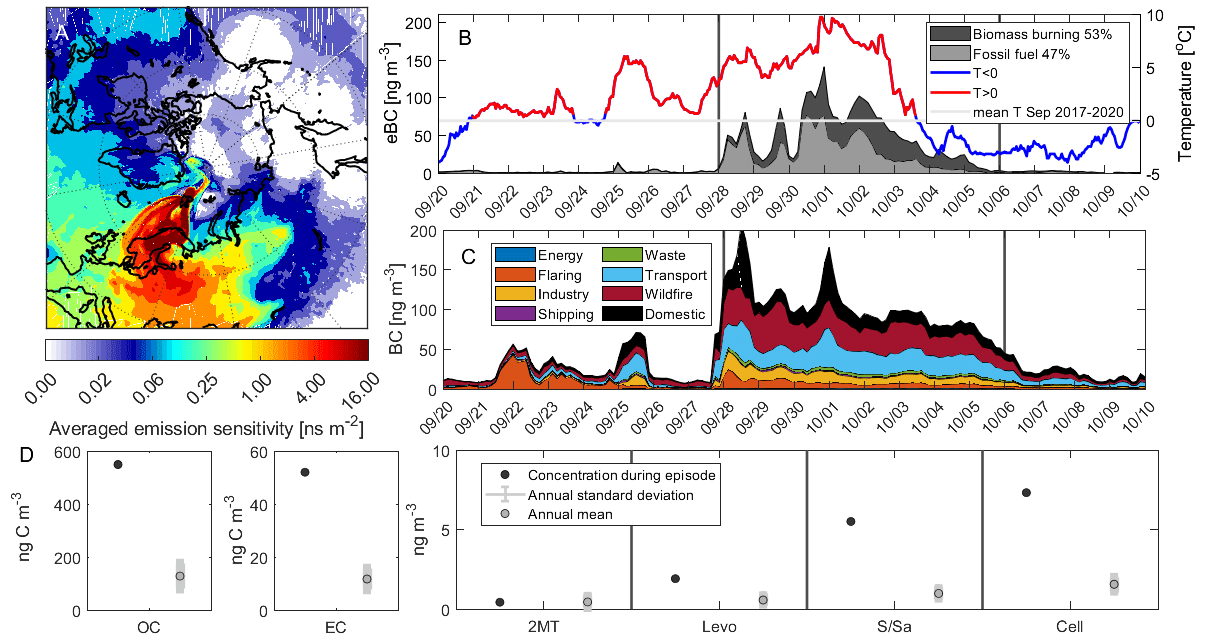
Figure 7Same as Fig. 6 but for 28 September–6 October 2017.
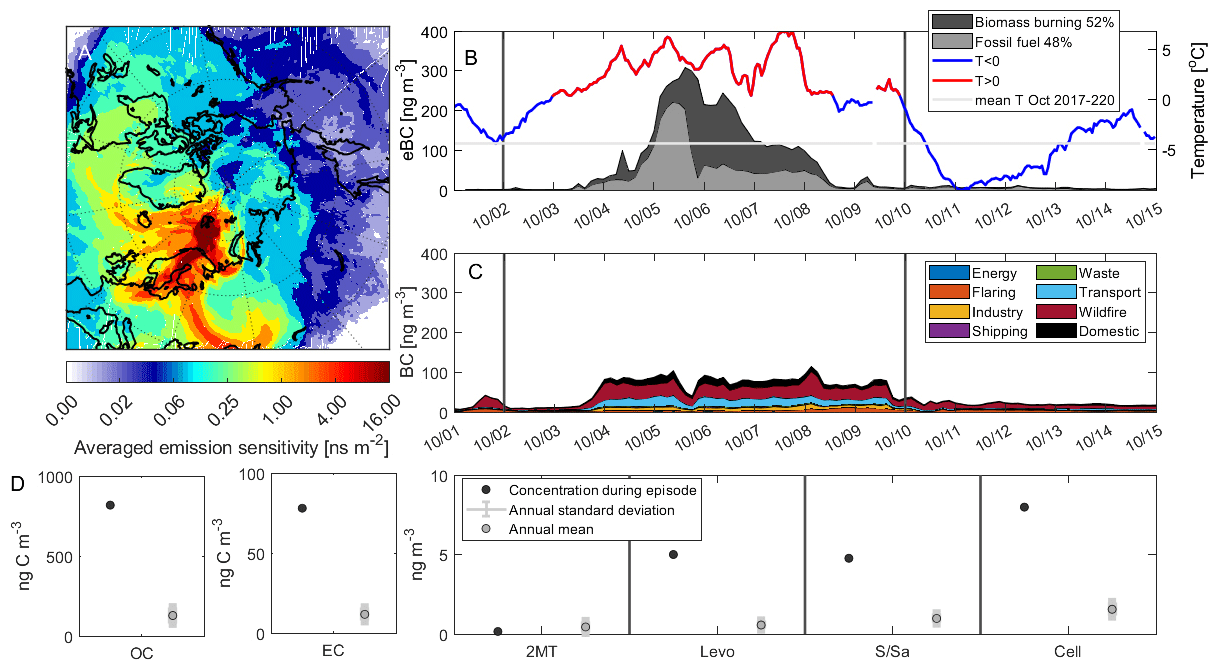
Figure 8Same as Fig. 6 but for 2–10 October 2020.
3.6.1 Episode 1 (22 to 27 July 2020) – WF, BSOA, and PBAP
In the transition from July to August 2020, CA levels were high, with peak concentrations from 22–27 July (2172 ng C m−3 for OC and 59 ng C m−3 for EC). These levels were the highest in 4 years of observations, explaining 21 % of the annual OC loading but only 7 % of EC. However, levels were still lower than the record-high concentrations (3.5 µg C m−3 for OC and 0.24 µg C m−3 for EC) observed in the April to May transition 2006, caused by emissions from wild and agricultural fires in Eastern Europe (Stohl et al., 2007). All tracers (except cellulose) experienced maximum values during this episode, but 2-methyltetrols, glucose, fructose, and arabitol were the most elevated when compared to the long-term annual mean and to the enhancement seen for OC. The FLEXPART footprint clearly shows an influence from WF in the Khanty–Mansi district (western Russia) (Fig. 6), corroborating to the high levoglucosan concentration (6.0 ng m−3). Source apportionment by PMF attributed 55 % of eBC to BB, whereas FLEXPART calculated 62 %, with WF (95 %) as the totally dominating fraction. Flaring was the dominating fossil fuel source category according to FLEXPART, explaining 58 % of BC from fossil fuel sources.
The plume transport time from the source region to the Zeppelin Observatory was short, at fewer than 7 d for 67 % of eBC observed at Zeppelin 25 to 27 July (Fig. S3), whereas on average only 30 % of the observed eBC reaches the Arctic station after such short time. This might have contributed to the high level of 2-methyltetrols, which are indicated to have short atmospheric lifetimes (Yttri et al., 2021), in addition to the arguments raised in Sect. 3.3. Certain PBAP, such as fungal spores (Bauer et al., 2002; Yttri et al., 2007b), are small enough to be transported over long distances, even between continents (Prospero et al., 2005), and pyroconvection might bring larger-sized PBAP to altitudes that enable LRT (e.g., Groot Zwaaftink et al., 2022). PBAP contributed 14 % of OC, using the OC to PBAPTracers ER by Groot Zwaaftink et al. (2022).
The high CA level coincided with a prolonged period (24 to 29 July) of high temperatures, which were unprecedented since temperature measurements were initiated at Zeppelin (1998), caused by intrusions of warm air masses from Siberia; i.e., T> 10 °C for 111 consecutive hours, mean °C, and TMax= 18.2 °C. A disproportionally strong warming of the Arctic compared to the midlatitudes could create an important pathway of pollution to the Arctic (Stohl et al., 2007), and as for the LRT episode in spring 2006 (Stohl et al., 2007), emissions from WF at lower latitudes were essential in the deterioration of Arctic air quality also in July 2020.
3.6.2 Episode 2 (28 September to 6 October 2017) – a bit of everything
Air masses with a history over southwestern Russia and eastern, central, and northern Europe (including Scandinavia) (Fig. 7) increased the OC (549 ng C m−3) and EC (52 ng C m−3) concentrations at Zeppelin to levels corresponding to 14 % of their annual loading. Source apportionment by the LHS suggested that BSOA (57 %) and BB (32 %) dominated CA (Table S4). Certain PBAP tracers (arabitol, mannitol, and trehalose) were enhanced beyond that of OC, reflecting the seasonal peak in fungal spores, but PBAP contributed only 3 % to CA (Table S4). An upper estimate of 13 % was obtained using the OC to PBAPTracers ER by Groot Zwaaftink et al. (2022). PMF apportioned 47 % of eBC to BB, comparing well with FLEXPART (51 %) (ascribing 62 % of BB to WF) and LHS (58 %). FLEXPART apportioned the majority of BC from FF combustion to traffic (55 %). The mean ambient temperature during the episode was enhanced compared to the long-term mean, as seen for all three episodes described.
3.6.3 Episode 3 (2 to 10 October 2020) – wildfires and mineral dust
This episode (Fig. 8) was studied by Groot Zwaaftink et al. (2022), combining surface and remote sensing observations and transport model simulations to understand its origin and development, whereas we in the present study focused on its carbonaceous aerosol content. Briefly, the EC level (78 ng C m−3) was the highest in 4 years of observations, whereas the OC level (818 ng C m−3) was much lower than observations made during the July 2020 (Sect. 3.6.1) episode, explaining 15 % and 13 % of the annual EC and OC loading, respectively (Fig. 9). Levoglucosan (5.0 ng m−3) was the only organic tracer elevated beyond that of OC, supporting FLEXPART calculations pointing to WF emissions in Ukraine and southern Russia as being one of two major sources of air pollution for this episode. Source apportionment of eBC by PMF indicated an almost equal share of eBC from BB (52 %) and FF combustion (48 %), as does FLEXPART (BB = 57 % and FF = 43 %), with the majority of BB attributed to WF (72 %), while traffic was the major FF category (52 %). Mixing with mineral dust emissions from central Asia en route caused a mineral dust level of 1.9–2.6 µg m−3, likely explaining the presence of carbonate (20 ng C m−3; 100 ng CO m−3). Before entering the Arctic, the polluted air masses deteriorated the air quality in a large part of northern Europe, giving PM10 levels around 100 µg m−3 and the same aerosol particle chemical signature as described for Zeppelin. These levels violate EU air quality guidelines, which have daily mean limit values for PM10 of 50 µg m−3.
Lack of long-term OA measurements has been a limitation for understanding Arctic aerosol mass closure. Furthermore, OA speciation needed for source attribution and for studying the impact on cloud condensation nuclei and ice-nucleating particles is scarce. Our 4-year study at Zeppelin Observatory at Svalbard shed light on some of these topics, demonstrating that OA is a significant fraction of the Arctic PM10 aerosol particle mass, though less than sea salt aerosol and mineral dust, as well as typically non-sea-salt SO. LRT episodes in the non-heating season dominated by natural emissions and their impact on OA levels, seasonality, and composition received particular focus, showing that WFs also contribute to high BSOA and PBAP levels in the Arctic environment. The fraction of OA attributed to local sources vs. LRT is uncertain, particularly when experiencing intrusions of warm air masses from Siberia, as certain Arctic vegetation species have highly temperature sensitive biogenic volatile organic compounds emission rates. Arctic CA shares the same feature as CA in source regions in the mid latitudes (e.g., Gelencsér et al., 2007), i.e., natural sources, particularly BSOA, dominating in the non-heating season and anthropogenic emissions, predominantly RWC, in the heating season. The 9-fold increase in 2-methyltetrols observed for 2020 could be a harbinger of CA from natural sources increasing in the Arctic.
Contrary to both previous (Stohl et al., 2013; Winiger et al., 2019) and present (this study) modeling and radiocarbon studies, PMF did not predict WF as the major source of eBC at Zeppelin Observatory in the non-heating season. However, the predominant role of BC from WF emissions at northern latitudes stated by McCarty et al. (2021) was neither reflected by PMF nor by FLEXPART for 2017 to 2020. This calls for an investigation of whether the stated increase in BC from WF emissions for 2010–2020 at northern latitudes (McCarty et al., 2021) is reflected at Arctic ground level. Up to 2 decades of stored multiwavelength Aethalometer data for Arctic observatories, combined with the outlined PMF approach, enables such a trend study. Additionally, a pan-Arctic investigation is encouraged for studying the spatial variability in eBCBB and eBCFF, facilitated by the inexpensive, high time resolution multiwavelength Aethalometer measurements that are widespread across the Arctic observatories (EU Action on Black Carbon in the Arctic, 2019). Increased anthropogenic activity such as shipping oil and gas exploration in the Arctic, warrants further separation of eBC from FF combustion, which can be attempted using additional high time resolution data as input to our analysis. This appears particularly important for the flaring source, suggested by modeling to contribute 42 % to the annual mean BC surface concentration in the Arctic (Stohl et al., 2013), which remains to be confirmed by observations.
Our study shows a wide variability amongst different methods in apportioning BC according to FF and BB, warranting further investigation for a reliable abatement of sources relevant for BC in the Arctic. Still, the high time resolution observational signal of eBC from BB and FF combustion derived from Aethalometer measurements provide a hitherto unused tool important for assessing Arctic BC.
Continuation of the actual time series at Zeppelin Observatory is suited for revealing potential changes in the relative source composition of Arctic CA, be it from altered transport or changes in emissions. It is of special interest to monitor the frequency and magnitude of WF, how BSOA and PBAP concentrations develop, and if FF emissions change from increased anthropogenic activity in the polar region.
All data used in the present paper are open access and are available at http://ebas.nilu.no/ (NILU, 2023), except for the radiocarbon data, which are presented in Rauber et al. (2023, https://doi.org/10.5194/amt-16-825-2023).
The supplement related to this article is available online at: https://doi.org/10.5194/acp-24-2731-2024-supplement.
SMP, KEY, and WA were responsible for conceptualizing the study. KEY wrote the original draft of the paper. WAA, SE, and KEY produced the figures. AB was responsible for collection of aerosol filter samples. HG analyzed the organic tracers, MR and SS did the radiocarbon measurements, and AKG was responsible for the cellulose analysis. MF, KEY, CLM, and WA carried out the data curation. NE and SE did the FLEXPART modeling, whereas DS and MAY did the LHS calculations. SMP and KEY undertook the formal analysis. JS, AG, and ZZ acquired resources. KT, CLM, and WA acquired funding. All co-authors contributed to writing, reviewing, and editing the final article.
At least one of the (co-)authors is a member of the editorial board of Atmospheric Chemistry and Physics. The peer-review process was guided by an independent editor, and the authors also have no other competing interests to declare.
Publisher's note: Copernicus Publications remains neutral with regard to jurisdictional claims made in the text, published maps, institutional affiliations, or any other geographical representation in this paper. While Copernicus Publications makes every effort to include appropriate place names, the final responsibility lies with the authors.
The research leading to these results has benefited from the Aerosols, Clouds, and Trace gases Research InfraStructure (ACTRIS) network, funding from the European Union Seventh Framework Programme (grant no. FP7/2007–2013) under ACTRIS-2 and grant no. 262254 (i.e., participation in interlaboratory comparison for thermal–optical analysis and QA and QC of measurements). Staff from the Norwegian Polar Institute are gratefully acknowledged for the changing of filters at the Zeppelin Observatory. We used ChatGPT 3.5 to condense and improve the language of specific sections in the review process of this paper. Avram Gold, Zhenfa Zhang, and Jason D. Surratt thank the U.S. National Science Foundation (NSF) for the financial support.
The Norwegian Ministry of Climate and Environment provided funding (grant no. 22/3615-4) to establish the OC EC and organic tracers time series used in the present study. Sabine Eckhardt and Nikolaos Evangeliou received funding from AMAP and the ABC-iCAP project (grant no. PI/2021/427-167). Avram Gold, Zhenfa Zhang, and Jason D. Surratt have been supported by the U.S. National Science Foundation (NSF) under Atmospheric and Geospace (AGS; grant no. 2001027) project for funding the synthesis of 2-methyltetrols used in this study.
This paper was edited by Daniel Knopf and reviewed by two anonymous referees.
Aas, W., Eckhardt, S., Fiebig, M., Solberg, S., and Yttri, K. E.: Monitoring of long-range transported air pollutants in Norway, annual report 2019, Miljødirektoratet rapport, NILU, Kjeller, Norway, M-1710/2020 NILU OR 4/2020, https://hdl.handle.net/11250/2659956 (last access: 31 January 2024), 2020.
Agrios, K., Salazar, G., Zhang, Y. L., Uglietti, C., Battaglia, M., Luginbuhl, M., Ciobanu, V. G., Vonwiller, M., and Szidat, S.: Online coupling of pure O2 thermo-optical methods – 14C AMS for source apportionment of carbonaceous aerosols, Nucl. Instrum. Meth. B, 361, 288–293, https://doi.org/10.1016/j.nimb.2015.06.008, 2015.
Ahmed, A. A., Abd el-Razek, M. H., Abu Mostafa, E. A., Williams, H. J., Scott, A. I., Reibenspies, J. H., and Mabry, T. J.: A new derivative of glucose and 2-C-methyl-D-erythritol from Ferula sinaica, J. Nat. Prod., 59, 1171–1173, 1996.
Akagi, S. K., Yokelson, R. J., Wiedinmyer, C., Alvarado, M. J., Reid, J. S., Karl, T., Crounse, J. D., and Wennberg, P. O.: Emission factors for open and domestic biomass burning for use in atmospheric models, Atmos. Chem. Phys., 11, 4039–4072, https://doi.org/10.5194/acp-11-4039-2011, 2011.
Alastuey, A., Querol, X., Aas, W., Lucarelli, F., Pérez, N., Moreno, T., Cavalli, F., Areskoug, H., Balan, V., Catrambone, M., Ceburnis, D., Cerro, J. C., Conil, S., Gevorgyan, L., Hueglin, C., Imre, K., Jaffrezo, J.-L., Leeson, S. R., Mihalopoulos, N., Mitosinkova, M., O'Dowd, C. D., Pey, J., Putaud, J.-P., Riffault, V., Ripoll, A., Sciare, J., Sellegri, K., Spindler, G., and Yttri, K. E.: Geochemistry of PM10 over Europe during the EMEP intensive measurement periods in summer 2012 and winter 2013, Atmos. Chem. Phys., 16, 6107–6129, https://doi.org/10.5194/acp-16-6107-2016, 2016.
Anthonsen, T., Hagen, S., Kazi, M. A., Shah, S. W., and Tagar, S.: 2-C-methyl-erythritol, a new branched alditol from convolvulus-glomeratus, Acta Chem. Scand. B, 30, 91–93, https://doi.org/10.3891/acta.chem.scand.30b-0091, 1976.
Anthonsen, T., Hagen, S., and Sallam, M. A. E.: Synthetic and spectroscopic studies of 2-C-methyl-erythritol and 2-C-methyl-threitol, Phytochemistry, 19, 2375–2377, https://doi.org/10.1016/s0031-9422(00)91030-6, 1980.
Barrett, T. E. and Sheesley, R. J.: Year-round optical properties and source characterization of Arctic organic carbon aerosols on the North Slope Alaska, J. Geophys. Res.-Atmos., 122, 9319–9331, https://doi.org/10.1002/2016jd026194, 2017.
Barrett, T. E., Robinson, E. M., Usenko, S., and Sheesley, R. J.: Source Contributions to Wintertime Elemental and Organic Carbon in the Western Arctic Based on Radiocarbon and Tracer Apportionment, Environ. Sci. Technol., 49, 11631–11639, https://doi.org/10.1021/acs.est.5b03081, 2015.
Bates, K. H., Crounse, J. D., St. Clair, J. M., Bennett, N. B., Nguyen, T. B., Seinfeld, J. H., Stoltz, B. M., and Wennberg, P. O.: Gas Phase Production and Loss of Isoprene Epoxydiols, J. Phys. Chem. A, 118, 1237–1246, https://doi.org/10.1021/jp4107958, 2014.
Bauer, H., Kasper-Giebl, A., Loflund, M., Giebl, H., Hitzenberger, R., Zibuschka, F., and Puxbaum, H.: The contribution of bacteria and fungal spores to the organic carbon content of cloud water, precipitation and aerosols, Atmos. Res., 64, 109–119, https://doi.org/10.1016/s0169-8095(02)00084-4, 2002.
Bond, T. C., Doherty, S. J., Fahey, D. W., Forster, P. M., Berntsen, T., DeAngelo, B. J., Flanner, M. G., Ghan, S., Karcher, B., Koch, D., Kinne, S., Kondo, Y., Quinn, P. K., Sarofim, M. C., Schultz, M. G., Schulz, M., Venkataraman, C., Zhang, H., Zhang, S., Bellouin, N., Guttikunda, S. K., Hopke, P. K., Jacobson, M. Z., Kaiser, J. W., Klimont, Z., Lohmann, U., Schwarz, J. P., Shindell, D., Storelvmo, T., Warren, S. G., and Zender, C. S.: Bounding the role of black carbon in the climate system: A scientific assessment, J. Geophys. Res.-Atmos., 118, 5380–5552, https://doi.org/10.1002/jgrd.50171, 2013.
Brighty, A., Jacob, V., Uzu, G., Borlaza, L., Conil, S., Hueglin, C., Grange, S. K., Favez, O., Trébuchon, C., and Jaffrezo, J.-L.: Cellulose in atmospheric particulate matter at rural and urban sites across France and Switzerland, Atmos. Chem. Phys., 22, 6021–6043, https://doi.org/10.5194/acp-22-6021-2022, 2022.
Cahill, T. M., Seaman, V. Y., Charles, M. J., Holzinger, R., and Goldstein, A. H.: Secondary organic aerosols formed from oxidation of biogenic volatile organic compounds in the Sierra Nevada Mountains of California, J. Geophys. Res.-Atmos., 111, D16312, https://doi.org/10.1029/2006jd007178, 2006.
Cassiani, M., Stohl, A., and Brioude, J.: Lagrangian Stochastic Modelling of Dispersion in the Convective Boundary Layer with Skewed Turbulence Conditions and a Vertical Density Gradient: Formulation and Implementation in the FLEXPART Model, Bound.-Lay. Meteorol., 154, 367–390, https://doi.org/10.1007/s10546-014-9976-5, 2015.
Cavalli, F., Viana, M., Yttri, K. E., Genberg, J., and Putaud, J.-P.: Toward a standardised thermal-optical protocol for measuring atmospheric organic and elemental carbon: the EUSAAR protocol, Atmos. Meas. Tech., 3, 79–89, https://doi.org/10.5194/amt-3-79-2010, 2010.
Cavalli, F., Alastuey, A., Areskoug, H., Ceburnis, D., Čech, J., Genberg, J., Harrison, R. M., Jaffrezo, J. L., Kiss, G., Laj, P., Mihalopoulos, N., Perez, N., Quincey, P., Schwarz, J., Sellegri, K., Spindler, G., Swietlicki, E., Theodosi, C., Yttri, K. E., Aas, W., and Putaud, J. P.: A European aerosol phenomenology-4: Harmonized concentrations of carbonaceous aerosol at 10 regional background sites across Europe, Atmos. Environ., 144, 133–145, https://doi.org/10.1016/j.atmosenv.2016.07.050, 2016.
Claeys, M., Graham, B., Vas, G., Wang, W., Vermeylen, R., Pashynska, V., Cafmeyer, J., Guyon, P., Andreae, M. O., Artaxo, P., and Maenhaut, W.: Formation of secondary organic aerosols through photooxidation of isoprene, Science, 303, 1173–1176, https://doi.org/10.1126/science.1092805, 2004.
Claeys, M., Kourtchev, I., Pashynska, V., Vas, G., Vermeylen, R., Wang, W., Cafmeyer, J., Chi, X., Artaxo, P., Andreae, M. O., and Maenhaut, W.: Polar organic marker compounds in atmospheric aerosols during the LBA-SMOCC 2002 biomass burning experiment in Rondônia, Brazil: sources and source processes, time series, diel variations and size distributions, Atmos. Chem. Phys., 10, 9319–9331, https://doi.org/10.5194/acp-10-9319-2010, 2010.
Clarke, A. D. and Noone, K. J.: Soot in the Arctic snowpack: a cause for perturbations in radiative transfer, Atmos. Environ., 19, 2045–2053, https://doi.org/10.1016/0004-6981(85)90113-1, 1985.
Collaud Coen, M., Andrews, E., Alastuey, A., Arsov, T. P., Backman, J., Brem, B. T., Bukowiecki, N., Couret, C., Eleftheriadis, K., Flentje, H., Fiebig, M., Gysel-Beer, M., Hand, J. L., Hoffer, A., Hooda, R., Hueglin, C., Joubert, W., Keywood, M., Kim, J. E., Kim, S.-W., Labuschagne, C., Lin, N.-H., Lin, Y., Lund Myhre, C., Luoma, K., Lyamani, H., Marinoni, A., Mayol-Bracero, O. L., Mihalopoulos, N., Pandolfi, M., Prats, N., Prenni, A. J., Putaud, J.-P., Ries, L., Reisen, F., Sellegri, K., Sharma, S., Sheridan, P., Sherman, J. P., Sun, J., Titos, G., Torres, E., Tuch, T., Weller, R., Wiedensohler, A., Zieger, P., and Laj, P.: Multidecadal trend analysis of in situ aerosol radiative properties around the world, Atmos. Chem. Phys., 20, 8867–8908, https://doi.org/10.5194/acp-20-8867-2020, 2020.
Creamean, J. M., Kirpes, R. M., Pratt, K. A., Spada, N. J., Maahn, M., de Boer, G., Schnell, R. C., and China, S.: Marine and terrestrial influences on ice nucleating particles during continuous springtime measurements in an Arctic oilfield location, Atmos. Chem. Phys., 18, 18023–18042, https://doi.org/10.5194/acp-18-18023-2018, 2018.
Creamean, J. M., Mignani, C., Bukowiecki, N., and Conen, F.: Using freezing spectra characteristics to identify ice-nucleating particle populations during the winter in the Alps, Atmos. Chem. Phys., 19, 8123–8140, https://doi.org/10.5194/acp-19-8123-2019, 2019.
Creamean, J. M., Hill, T. C. J., DeMott, P. J., Uetake, J., Kreidenweis, S., and Douglas, T. A.: Thawing permafrost: an overlooked source of seeds for Arctic cloud formation, Environ. Res. Lett., 15, 084022, https://doi.org/10.1088/1748-9326/ab87d3, 2020.
Creamean, J. M., Barry, K., Hill, T. C., Hume, C., DeMott, P. J., Shupe, M. D., Dahlke, S., Willmes, S., Schmale, J., Beck, I., Hoppe, C. J. M., Fong, A., Chamberlain, E., Bowman, J., Scharien, R., and Persson, O.: Annual cycle observations of aerosols capable of ice formation in central Arctic clouds, Nat. Commun., 13, 1–12, 2022.
Cui, T. Q., Zeng, Z. X., dos Santos, E. O., Zhang, Z. F., Chen, Y. Z., Zhang, Y., Rose, C. A., Budisulistiorini, S. H., Collins, L. B., Bodnar, W. M., de Souza, R. A. F., Martin, S. T., Machado, C. M. D., Turpin, B. J., Gold, A., Ault, A. P., and Surratt, J. D.: Development of a hydrophilic interaction liquid chromatography (HILIC) method for the chemical characterization of water-soluble isoprene epoxydiol (IEPOX)-derived secondary organic aerosol, Environ. Sci.-Proc. Imp., 20, 1524–1536, https://doi.org/10.1039/c8em00308d, 2018.
Dani, K. G. S. and Loreto, F.: Trade-Off Between Dimethyl Sulfide and Isoprene Emissions from Marine Phytoplankton, Trends Plant Sci., 22, 361–372, https://doi.org/10.1016/j.tplants.2017.01.006, 2017.
Darer, A. I., Cole-Filipiak, N. C., O'Connor, A. E., and Elrod, M. J.: Formation and Stability of Atmospherically Relevant Isoprene-Derived Organosulfates and Organonitrates, Environ. Sci. Technol., 45, 1895–1902, https://doi.org/10.1021/es103797z, 2011.
Dittrich, P. and Angyal, S. J.: 2-C-methyl-erythritol in leaves of Liriodendron-tulipifera, Phytochemistry, 27, 935–935, https://doi.org/10.1016/0031-9422(88)84125-6, 1988.
Duvold, T., Bravo, J. M., PaleGrosdemange, C., and Rohmer, M.: Biosynthesis of 2-C-methyl-D-erythritol, a putative C5 intermediate in the mevalonate independent pathway for isoprenoid biosynthesis, Tetrahedron Lett., 38, 4769–4772, https://doi.org/10.1016/s0040-4039(97)01045-9, 1997.
Dye, C. and Yttri, K.: Determination of monosaccharide anhydrides in atmospheric aerosols by use of high-performance liquid chromatography combined with high-resolution mass spectrometry, Anal. Chem., 77, 1853–1858, https://doi.org/10.1021/ac049461j, 2005.
Elbert, W., Taylor, P. E., Andreae, M. O., and Pöschl, U.: Contribution of fungi to primary biogenic aerosols in the atmosphere: wet and dry discharged spores, carbohydrates, and inorganic ions, Atmos. Chem. Phys., 7, 4569–4588, https://doi.org/10.5194/acp-7-4569-2007, 2007.
Eleftheriadis, K., Vratolis, S., and Nyeki, S.: Aerosol black carbon in the European Arctic: Measurements at Zeppelin station, Ny-Ålesund, Svalbard from 1998–2007, Geophys. Res. Lett., 36, L02809, https://doi.org/10.1029/2008GL035741, 2009.
El Haddad, I., Marchand, N., Temime-Roussel, B., Wortham, H., Piot, C., Besombes, J.-L., Baduel, C., Voisin, D., Armengaud, A., and Jaffrezo, J.-L.: Insights into the secondary fraction of the organic aerosol in a Mediterranean urban area: Marseille, Atmos. Chem. Phys., 11, 2059–2079, https://doi.org/10.5194/acp-11-2059-2011, 2011.
Enomoto, H., Kohata, K., Nakayama, M., Yamaguchi, Y., and Ichimura, K.: 2-C-methyl-D-erythritol is a major carbohydrate in petals of Phlox subulata possibly involved in flower development, J. Plant Physiol., 161, 977–980, https://doi.org/10.1016/j.jplph.2004.01.009, 2004.
EU Action on Black Carbon in the Arctic: Review of Observation Capacities and Data Availability for Black Carbon in the Arctic Region: EU Action on Black Carbon in the Arctic – Technical Report 1, 35 pp., https://www.amap.no/work-area/document/3058 (last access: 31 January 2024), 2019.
Feltracco, M., Barbaro, E., Tedeschi, S., Spolaor, A., Turetta, C., Vecchiato, M., Morabito, E., Zangrando, R., Barbante, C., and Gambaro, A.: Interannual variability of sugars in Arctic aerosol: Biomass burning and biogenic inputs, Sci. Total Environ., 706, 136089, https://doi.org/10.1016/j.scitotenv.2019.136089, 2020.
Ferrero, L., Sangiorgi, G., Perrone, M. G., Rizzi, C., Cataldi, M., Markuszewski, P., Pakszys, P., Makuch, P., Petelski, T., Becagli, S., Traversi, R., Bolzacchini, E., and Zielinski, T.: Chemical Composition of Aerosol over the Arctic Ocean from Summer ARctic EXpedition (AREX) 2011–2012 Cruises: Ions, Amines, Elemental Carbon, Organic Matter, Polycyclic Aromatic Hydrocarbons, n-Alkanes, Metals, and Rare Earth Elements, Atmosphere, 10, 54, https://doi.org/10.3390/atmos10020054, 2019.
Forster, C., Stohl, A., and Seibert, P.: Parameterization of convective transport in a Lagrangian particle dispersion model and its evaluation, J. Appl. Meteorol. Clim., 46, 403–422, https://doi.org/10.1175/jam2470.1, 2007.
Fu, P. Q., Kawamura, K., and Barrie, L. A.: Photochemical and Other Sources of Organic Compounds in the Canadian High Arctic Aerosol Pollution during Winter-Spring, Environ. Sci. Technol., 43, 286–292, https://doi.org/10.1021/es803046q, 2009a.
Fu, P. Q., Kawamura, K., Chen, J., and Barrie, L. A.: Isoprene, Monoterpene, and Sesquiterpene Oxidation Products in the High Arctic Aerosols during Late Winter to Early Summer, Environ. Sci. Technol., 43, 4022–4028, https://doi.org/10.1021/es803669a, 2009b.
Fu, P. Q., Kawamura, K., Kanaya, Y., and Wang, Z. F.: Contributions of biogenic volatile organic compounds to the formation of secondary organic aerosols over Mt Tai, Central East China, Atmos. Environ., 44, 4817–4826, https://doi.org/10.1016/j.atmosenv.2010.08.040, 2010.
Fu, P. Q., Kawamura, K., Chen, J., Charrière, B., and Sempéré, R.: Organic molecular composition of marine aerosols over the Arctic Ocean in summer: contributions of primary emission and secondary aerosol formation, Biogeosciences, 10, 653–667, https://doi.org/10.5194/bg-10-653-2013, 2013.
Garg, S., Chandra, B. P., Sinha, V., Sarda-Esteve, R., Gros, V., and Sinha, B.: Limitation of the Use of the Absorption Angstrom Exponent for Source Apportionment of Equivalent Black Carbon: a Case Study from the North West Indo-Gangetic Plain, Environ. Sci. Technol., 50, 814–824, https://doi.org/10.1021/acs.est.5b03868, 2016.
Gelencsér, A., May, B., Simpson, D., Sánchez-Ochoa, A., Kasper-Giebl, A., Puxbaum, H., Caseiro, A., Pio, C., and Legrand, M.: Source apportionment of PM2.5 organic aerosol over Europe: Primary/secondary, natural/anthropogenic, and fossil/biogenic origin, J. Geophys. Res.-Atmos., 112, D23S04, https://doi.org/10.1029/2006jd008094, 2007.
Genberg, J., Hyder, M., Stenström, K., Bergström, R., Simpson, D., Fors, E. O., Jönsson, J. Å., and Swietlicki, E.: Source apportionment of carbonaceous aerosol in southern Sweden, Atmos. Chem. Phys., 11, 11387–11400, https://doi.org/10.5194/acp-11-11387-2011, 2011.
Giglio, L., Descloitres, J., Justice, C. O., and Kaufman, Y. J.: An enhanced contextual fire detection algorithm for MODIS, Remote Sens. Environ., 87, 273–282, https://doi.org/10.1016/s0034-4257(03)00184-6, 2003.
Gilardoni, S., Vignati, E., Cavalli, F., Putaud, J. P., Larsen, B. R., Karl, M., Stenström, K., Genberg, J., Henne, S., and Dentener, F.: Better constraints on sources of carbonaceous aerosols using a combined 14C – macro tracer analysis in a European rural background site, Atmos. Chem. Phys., 11, 5685–5700, https://doi.org/10.5194/acp-11-5685-2011, 2011.
Glasius, M., Hansen, A. M. K., Claeys, M., Henzing, J. S., Jedynska, A. D., Kasper-Giebl, A., Kistler, M., Kristensen, K., Martinsson, J., Maenhaut, W., Nojgaard, J. K., Spindler, G., Stenstrom, K. E., Swietlicki, E., Szidat, S., Simpson, D., and Yttri, K. E.: Composition and sources of carbonaceous aerosols in Northern Europe during winter, Atmos. Environ., 173, 127–141, https://doi.org/10.1016/j.atmosenv.2017.11.005, 2018.
González, N. J. D., Borg-Karlson, A. K., Artaxo, P., Guenther, A., Krejci, R., Noziere, B., and Noone, K.: Primary and secondary organics in the tropical Amazonian rainforest aerosols: chiral analysis of 2-methyltetraols, Environ. Sci.-Proc. Imp., 16, 1413–1421, https://doi.org/10.1039/c4em00102h, 2014.
Graham, B., Guyon, P., Taylor, P. E., Artaxo, P., Maenhaut, W., Glovsky, M. M., Flagan, R. C., and Andreae, M. O.: Organic compounds present in the natural Amazonian aerosol: Characterization by gas chromatography-mass spectrometry, J. Geophys. Res., 108, 4766, https://doi.org/10.1029/2003JD003990, 2003.
Groot Zwaaftink, C. D., Grythe, H., Skov, H., and Stohl, A.: Substantial contribution of northern high-latitude sources to mineral dust in the Arctic, J. Geophys. Res.-Atmos., 121, 13678–13697, https://doi.org/10.1002/2016jd025482, 2016.
Groot Zwaaftink, C. D., Aas, W., Eckhardt, S., Evangeliou, N., Hamer, P., Johnsrud, M., Kylling, A., Platt, S. M., Stebel, K., Uggerud, H., and Yttri, K. E.: What caused a record high PM10 episode in northern Europe in October 2020?, Atmos. Chem. Phys., 22, 3789–3810, https://doi.org/10.5194/acp-22-3789-2022, 2022.
Grythe, H., Kristiansen, N. I., Groot Zwaaftink, C. D., Eckhardt, S., Ström, J., Tunved, P., Krejci, R., and Stohl, A.: A new aerosol wet removal scheme for the Lagrangian particle model FLEXPART v10, Geosci. Model Dev., 10, 1447–1466, https://doi.org/10.5194/gmd-10-1447-2017, 2017.
Hallquist, M., Wenger, J. C., Baltensperger, U., Rudich, Y., Simpson, D., Claeys, M., Dommen, J., Donahue, N. M., George, C., Goldstein, A. H., Hamilton, J. F., Herrmann, H., Hoffmann, T., Iinuma, Y., Jang, M., Jenkin, M. E., Jimenez, J. L., Kiendler-Scharr, A., Maenhaut, W., McFiggans, G., Mentel, Th. F., Monod, A., Prévôt, A. S. H., Seinfeld, J. H., Surratt, J. D., Szmigielski, R., and Wildt, J.: The formation, properties and impact of secondary organic aerosol: current and emerging issues, Atmos. Chem. Phys., 9, 5155–5236, https://doi.org/10.5194/acp-9-5155-2009, 2009.
Hansen, A. M. K., Kristensen, K., Nguyen, Q. T., Zare, A., Cozzi, F., Nøjgaard, J. K., Skov, H., Brandt, J., Christensen, J. H., Ström, J., Tunved, P., Krejci, R., and Glasius, M.: Organosulfates and organic acids in Arctic aerosols: speciation, annual variation and concentration levels, Atmos. Chem. Phys., 14, 7807–7823, https://doi.org/10.5194/acp-14-7807-2014, 2014.
Hansen, J. and Nazarenko, L.: Soot climate forcing via snow and ice albedos, P. Natl. Acad. Sci. USA, 101, 423–428, https://doi.org/10.1073/pnas.2237157100, 2004.
Hartmann, M., Blunier, T., Brugger, S. O., Schmale, J., Schwikowski, M., Vogel, A., Wex, H., and Stratmann, F.: Variation of Ice Nucleating Particles in the European Arctic Over the Last Centuries, Geophys. Res. Lett., 46, 4007–4016, https://doi.org/10.1029/2019gl082311, 2019.
Hartmann, M., Adachi, K., Eppers, O., Haas, C., Herber, A., Holzinger, R., Hunerbein, A., Jakel, E., Jentzsch, C., van Pinxteren, M., Wex, H., Willmes, S., and Stratmann, F.: Wintertime Airborne Measurements of Ice Nucleating Particles in the High Arctic: A Hint to a Marine, Biogenic Source for Ice Nucleating Particles, Geophys. Res. Lett., 47, e2020GL087770, https://doi.org/10.1029/2020gl087770, 2020.
Hersbach, H., Bell, B., Berrisford, P., Hirahara, S., Horanyi, A., Munoz-Sabater, J., Nicolas, J., Peubey, C., Radu, R., Schepers, D., Simmons, A., Soci, C., Abdalla, S., Abellan, X., Balsamo, G., Bechtold, P., Biavati, G., Bidlot, J., Bonavita, M., De Chiara, G., Dahlgren, P., Dee, D., Diamantakis, M., Dragani, R., Flemming, J., Forbes, R., Fuentes, M., Geer, A., Haimberger, L., Healy, S., Hogan, R. J., Holm, E., Janiskova, M., Keeley, S., Laloyaux, P., Lopez, P., Lupu, C., Radnoti, G., de Rosnay, P., Rozum, I., Vamborg, F., Villaume, S., and Thepaut, J. N.: The ERA5 global reanalysis, Q. J. Roy. Meteor. Soc., 146, 1999–2049, https://doi.org/10.1002/qj.3803, 2020.
Heslin-Rees, D., Burgos, M., Hansson, H.-C., Krejci, R., Ström, J., Tunved, P., and Zieger, P.: From a polar to a marine environment: has the changing Arctic led to a shift in aerosol light scattering properties?, Atmos. Chem. Phys., 20, 13671–13686, https://doi.org/10.5194/acp-20-13671-2020, 2020.
Hirdman, D., Sodemann, H., Eckhardt, S., Burkhart, J. F., Jefferson, A., Mefford, T., Quinn, P. K., Sharma, S., Ström, J., and Stohl, A.: Source identification of short-lived air pollutants in the Arctic using statistical analysis of measurement data and particle dispersion model output, Atmos. Chem. Phys., 10, 669–693, https://doi.org/10.5194/acp-10-669-2010, 2010.
Hodshire, A. L., Campuzano-Jost, P., Kodros, J. K., Croft, B., Nault, B. A., Schroder, J. C., Jimenez, J. L., and Pierce, J. R.: The potential role of methanesulfonic acid (MSA) in aerosol formation and growth and the associated radiative forcings, Atmos. Chem. Phys., 19, 3137–3160, https://doi.org/10.5194/acp-19-3137-2019, 2019.
Horn, S. J., Aasen, I. M., and Ostgaard, K.: Ethanol production from seaweed extract, J. Ind. Microbiol. Biot., 25, 249–254, https://doi.org/10.1038/sj.jim.7000065, 2000.
Hu, Q. H., Xie, Z. Q., Wang, X. M., Kang, H., and Zhang, P. F.: Levoglucosan indicates high levels of biomass burning aerosols over oceans from the Arctic to Antarctic, Sci. Rep.-UK, 3, 3119, https://doi.org/10.1038/srep03119, 2013.
Ion, A. C., Vermeylen, R., Kourtchev, I., Cafmeyer, J., Chi, X., Gelencsér, A., Maenhaut, W., and Claeys, M.: Polar organic compounds in rural PM2.5 aerosols from K-puszta, Hungary, during a 2003 summer field campaign: Sources and diel variations, Atmos. Chem. Phys., 5, 1805–1814, https://doi.org/10.5194/acp-5-1805-2005, 2005.
Jacobsen, E. E. and Anthonsen, T.: 2-C-Methyl-D-erythritol. Produced in plants, forms aerosols in the atmosphere. An alternative pathway in isoprenoid biosynthesis, Biocatal. Biotransfor., 33, 191–196, https://doi.org/10.3109/10242422.2015.1095677, 2015.
Jiao, C. Y. and Flanner, M. G.: Changing black carbon transport to the Arctic from present day to the end of 21st century, J. Geophys. Res.-Atmos., 121, 4734–4750, https://doi.org/10.1002/2015jd023964, 2016.
Jurányi, Z., Zanatta, M., Lund, M. T., Samset, B. H., Skeie, R. B., Sharma, S., Wendisch, M., and Herber, A.: Atmospheric concentrations of black carbon are substantially higher in spring than summer in the Arctic, Communications Earth & Environment, 4, 91, https://doi.org/10.1038/s43247-023-00749-x, 2023.
Karlsen, S. R., Elvebakk, A., Hogda, K. A., and Grydeland, T.: Spatial and Temporal Variability in the Onset of the Growing Season on Svalbard, Arctic Norway – Measured by MODIS-NDVI Satellite Data, Remote Sens.-Basel, 6, 8088–8106, https://doi.org/10.3390/rs6098088, 2014.
Klimont, Z., Kupiainen, K., Heyes, C., Purohit, P., Cofala, J., Rafaj, P., Borken-Kleefeld, J., and Schöpp, W.: Global anthropogenic emissions of particulate matter including black carbon, Atmos. Chem. Phys., 17, 8681–8723, https://doi.org/10.5194/acp-17-8681-2017, 2017.
Kourtchev, I., Ruuskanen, T., Maenhaut, W., Kulmala, M., and Claeys, M.: Observation of 2-methyltetrols and related photo-oxidation products of isoprene in boreal forest aerosols from Hyytiälä, Finland, Atmos. Chem. Phys., 5, 2761–2770, https://doi.org/10.5194/acp-5-2761-2005, 2005.
Kourtchev, I., Ruuskanen, T. M., Keronen, P., Sogacheva, L., Dal Maso, M., Reissell, A., Chi, X., Vermeylen, R., Kulmala, M., Maenhaut, W., and Claeys, M.: Determination of isoprene and α-/β-pinene oxidation products in boreal forest aerosols from Hyytiala, Finland: diel variations and possible link with particle formation events, Plant Biology, 10, 138–149, https://doi.org/10.1055/s-2007-964945, 2008a.
Kourtchev, I., Warnke, J., Maenhaut, W., Hoffmann, T., and Claeys, M.: Polar organic marker compounds in PM2.5 aerosol from a mixed forest site in western Germany, Chemosphere, 73, 1308–1314, https://doi.org/10.1016/j.chemosphere.2008.07.011, 2008b.
Kramshøj, M., Vedel-Petersen, I., Schollert, M., Rinnan, A., Nymand, J., Ro-Poulsen, H., and Rinnan, R.: Large increases in Arctic biogenic volatile emissions are a direct effect of warming, Nat. Geosci., 9, 349–352, https://doi.org/10.1038/ngeo2692, 2016.
Kunit, M. and Puxbaum, H.: Enzymatic determination of the cellulose content of atmospheric aerosols, Atmos. Environ., 30, 1233–1236, https://doi.org/10.1016/1352-2310(95)00429-7, 1996.
Li, S. M., Barrie, L. A., and Sirois, A.: Biogenic sulfur aerosol in the Arctic troposphere. 2. Trends and seasonal-variations, J. Geophys. Res.-Atmos., 98, 20623–20631, https://doi.org/10.1029/93jd02233, 1993.
Liakakou, E., Vrekoussis, M., Bonsang, B., Donousis, C., Kanakidou, M., and Mihalopoulos, N.: Isoprene above the Eastern Mediterranean: Seasonal variation and contribution to the oxidation capacity of the atmosphere, Atmos. Environ., 41, 1002–1010, https://doi.org/10.1016/j.atmosenv.2006.09.034, 2007.
Lin, Y. H., Zhang, Z. F., Docherty, K. S., Zhang, H. F., Budisulistiorini, S. H., Rubitschun, C. L., Shaw, S. L., Knipping, E. M., Edgerton, E. S., Kleindienst, T. E., Gold, A., and Surratt, J. D.: Isoprene Epoxydiols as Precursors to Secondary Organic Aerosol Formation: Acid-Catalyzed Reactive Uptake Studies with Authentic Compounds, Environ. Sci. Technol., 46, 250–258, https://doi.org/10.1021/es202554c, 2012.
Long, C. M., Nascarella, M. A., and Valberg, P. A.: Carbon black vs. black carbon and other airborne materials containing elemental carbon: Physical and chemical distinctions, Environ. Pollut., 181, 271–286, https://doi.org/10.1016/j.envpol.2013.06.009, 2013.
Lopez-Hilfiker, F. D., Mohr, C., D'Ambro, E. L., Lutz, A., Riedel, T. P., Gaston, C. J., Iyer, S., Zhang, Z., Gold, A., Surratt, J. D., Lee, B. H., Kurten, T., Hu, W. W., Jimenez, J., Hallquist, M., and Thornton, J. A.: Molecular Composition and Volatility of Organic Aerosol in the Southeastern US: Implications for IEPDX Derived SOA, Environ. Sci. Technol., 50, 2200–2209, https://doi.org/10.1021/acs.est.5b04769, 2016.
McCarty, J. L., Aalto, J., Paunu, V.-V., Arnold, S. R., Eckhardt, S., Klimont, Z., Fain, J. J., Evangeliou, N., Venäläinen, A., Tchebakova, N. M., Parfenova, E. I., Kupiainen, K., Soja, A. J., Huang, L., and Wilson, S.: Reviews and syntheses: Arctic fire regimes and emissions in the 21st century, Biogeosciences, 18, 5053–5083, https://doi.org/10.5194/bg-18-5053-2021, 2021.
McDow, S. R. and Huntzicker, J. J.: Vapor adsorption artifact in the sampling of organic aerosol: face velocity effects, Atmos. Environ., 24A, 2563–2571, https://doi.org/10.1016/0960-1686(90)90134-9, 1990.
Medeiros, P. M., Conte, M. H., Weber, J. C., and Simoneit, B. R. T.: Sugars as source indicators of biogenic organic carbon in aerosols collected above the Howland Experimental Forest, Maine, Atmos. Environ., 40, 1694–1705, https://doi.org/10.1016/j.atmosenv.2005.11.001, 2006.
Moschos, V., Dzepina, K., Bhattu, D., Lamkaddam, H., Casotto, R., Daellenbach, K. R., Canonaco, F., Rai, P., Aas, W., Becagli, S., Calzolai, G., Eleftheriadis, K., Moffett, C. E., Schnelle-Kreis, J., Severi, M., Sharma, S., Skov, H., Vestenius, M., Zhang, W., Hakola, H., Hellén, H., Huang, L., Jaffrezo, J.-L., Massling, A., Nøjgaard, J. K., Petäjä, T., Popovicheva, O., Sheesley, R. J., Traversi, R., Yttri, K. E., Schmale, J., Prévôt, A. S. H., Baltensperger, U., and El Haddad, I.: Equal abundance of summertime natural and wintertime anthropogenic Arctic organic aerosols, Nat. Geosci., 15, 196–202, https://doi.org/10.1038/s41561-021-00891-1, 2022.
Myers-Smith, I. H., Kerby, J. T., Phoenix, G. K., Bjerke, J. W., Epstein, H. E., Assmann, J. J., John, C., Andreu-Hayles, L., Angers-Blondin, S., Beck, P. S. A., Berner, L. T., Bhatt, U. S., Bjorkman, A. D., Blok, D., Bryn, A., Christiansen, C. T., Cornelissen, J. H. C., Cunliffe, A. M., Elmendorf, S. C., Forbes, B. C., Goetz, S. J., Hollister, R. D., de Jong, R., Loranty, M. M., Macias-Fauria, M., Maseyk, K., Normand, S., Olofsson, J., Parker, T. C., Parmentier, F. J. W., Post, E., Schaepman-Strub, G., Stordal, F., Sullivan, P. F., Thomas, H. J. D., Tommervik, H., Treharne, R., Tweedie, C. E., Walker, D. A., Wilmking, M., and Wipf, S.: Complexity revealed in the greening of the Arctic, Nat. Clim. Change, 10, 106–117, https://doi.org/10.1038/s41558-019-0688-1, 2020.
NILU (Norwegian Institute for Air Research): EBAS database, NILU, https://ebas.nilu.no/ (last access: 31 January 2024), 2023.
Nolte, C. G., Schauer, J. J., Cass, G. R., and Simoneit, B. R. T.: Highly polar organic compounds present in wood smoke and in the ambient atmosphere, Environ. Sci. Technol., 35, 1912–1919, https://doi.org/10.1021/es001420r, 2001.
Nozière, B., Gonzalez, N. J. D., Borg-Karlson, A. K., Pei, Y. X., Redeby, J. P., Krejci, R., Dommen, J., Prevot, A. S. H., and Anthonsen, T.: Atmospheric chemistry in stereo: A new look at secondary organic aerosols from isoprene, Geophys. Res. Lett., 38, L11807, https://doi.org/10.1029/2011gl047323, 2011.
Nozière, B., Kalberer, M., Claeys, M., Allan, J., D'Anna, B., Decesari, S., Finessi, E., Glasius, M., Grgic, I., Hamilton, J. F., Hoffmann, T., Iinuma, Y., Jaoui, M., Kahno, A., Kampf, C. J., Kourtchev, I., Maenhaut, W., Marsden, N., Saarikoski, S., Schnelle-Kreis, J., Surratt, J. D., Szidat, S., Szmigielski, R., and Wisthaler, A.: The Molecular Identification of Organic Compounds in the Atmosphere: State of the Art and Challenges, Chem. Rev., 115, 3919–3983, https://doi.org/10.1021/cr5003485, 2015.
Ottar, B.: Arctic air pollution: A Norwegian Perspective, Atmos. Environ., 23, 2349–2356, https://doi.org/10.1016/0004-6981(89)90248-5, 1989.
Paasonen, P., Asmi, A., Petaja, T., Kajos, M. K., Aijala, M., Junninen, H., Holst, T., Abbatt, J. P. D., Arneth, A., Birmili, W., van der Gon, H. D., Hamed, A., Hoffer, A., Laakso, L., Laaksonen, A., Leaitch, Paulot, F., Crounse, J. D., Kjaergaard, H. G., Kurten, A., St. Clair, J. M., Seinfeld, J. H., and Wennberg, P. O.: Unexpected Epoxide Formation in the Gas-Phase Photooxidation of Isoprene, Science, 325, 730–733, https://doi.org/10.1126/science.1172910, 2009.
Paulot, F., Crounse, J. D., Kjaergaard, H. G., Kurten, A., St Clair, J. M., Seinfeld, J. H., and Wennberg, P. O.: Unexpected Epoxide Formation in the Gas-Phase Photooxidation of Isoprene, Science, 325, 730–733, https://doi.org/10.1126/science.1172910, 2009.
Pereira Freitas, G. P., Adachi, K., Conen, F., Heslin-Rees, D., Krejci, R., Tobo, Y., Yttri, K. E., and Zieger, P. Regionally sourced bioaerosols drive high-temperature ice nucleating particles in the Arctic, Nat. Commun., 14, 5997, https://doi.org/10.1038/s41467-023-41696-7, 2023.
Pisso, I., Sollum, E., Grythe, H., Kristiansen, N. I., Cassiani, M., Eckhardt, S., Arnold, D., Morton, D., Thompson, R. L., Groot Zwaaftink, C. D., Evangeliou, N., Sodemann, H., Haimberger, L., Henne, S., Brunner, D., Burkhart, J. F., Fouilloux, A., Brioude, J., Philipp, A., Seibert, P., and Stohl, A.: The Lagrangian particle dispersion model FLEXPART version 10.4, Geosci. Model Dev., 12, 4955–4997, https://doi.org/10.5194/gmd-12-4955-2019, 2019.
Platt, S. M., Hov, Ø., Berg, T., Breivik, K., Eckhardt, S., Eleftheriadis, K., Evangeliou, N., Fiebig, M., Fisher, R., Hansen, G., Hansson, H.-C., Heintzenberg, J., Hermansen, O., Heslin-Rees, D., Holmén, K., Hudson, S., Kallenborn, R., Krejci, R., Krognes, T., Larssen, S., Lowry, D., Lund Myhre, C., Lunder, C., Nisbet, E., Nizzetto, P. B., Park, K.-T., Pedersen, C. A., Aspmo Pfaffhuber, K., Röckmann, T., Schmidbauer, N., Solberg, S., Stohl, A., Ström, J., Svendby, T., Tunved, P., Tørnkvist, K., van der Veen, C., Vratolis, S., Yoon, Y. J., Yttri, K. E., Zieger, P., Aas, W., and Tørseth, K.: Atmospheric composition in the European Arctic and 30 years of the Zeppelin Observatory, Ny-Ålesund, Atmos. Chem. Phys., 22, 3321–3369, https://doi.org/10.5194/acp-22-3321-2022, 2022.
Prospero, J. M., Blades, E., Mathison, G., and Naidu, R.: Interhemispheric transport of viable fungi and bacteria from Africa to the Caribbean with soil dust, Aerobiologia, 21, 1–19, https://doi.org/10.1007/s10453-004-5872-7, 2005.
Pueschel, R. F. and Kinne, S. A.: Physical and radiative properties of Arctic atmospheric aerosols, Sci. Total Environ., 160–161, 811–824, https://doi.org/10.1016/0048-9697(95)04414-v, 1995.
Puxbaum, H. and Tenze-Kunit, M.: Size distribution and seasonal variation of atmospheric cellulose, Atmos. Environ., 37, 3693–3699, https://doi.org/10.1016/s1352-2310(03)00451-5, 2003.
Qi, L., Vogel, A. L., Esmaeilirad, S., Cao, L., Zheng, J., Jaffrezo, J.-L., Fermo, P., Kasper-Giebl, A., Daellenbach, K. R., Chen, M., Ge, X., Baltensperger, U., Prévôt, A. S. H., and Slowik, J. G.: A 1-year characterization of organic aerosol composition and sources using an extractive electrospray ionization time-of-flight mass spectrometer (EESI-TOF), Atmos. Chem. Phys., 20, 7875–7893, https://doi.org/10.5194/acp-20-7875-2020, 2020.
Quinn, P. K., Miller, T. L., Bates, T. S., Ogren, J. A., Andrews, E., and Shaw, G. E.: A 3-year record of simultaneously measured aerosol chemical and optical properties at Barrow, Alaska, J. Geophys. Res.-Atmos., 107, AAC 8-1–AAC 8-15, https://doi.org/10.1029/2001jd001248, 2002.
Quinn, P. K., Shaw, G., Andrews, E., Dutton, E. G., Ruoho-Airola, T., and Gong, S. L.: Arctic haze: current trends and knowledge gaps, Tellus B, 59, 99–114, https://doi.org/10.1111/j.1600-0889.2006.00236.x, 2007.
Quinn, P. K., Bates, T. S., Schulz, K., and Shaw, G. E.: Decadal trends in aerosol chemical composition at Barrow, Alaska: 1976–2008, Atmos. Chem. Phys., 9, 8883–8888, https://doi.org/10.5194/acp-9-8883-2009, 2009.
Rauber, M., Salazar, G., Yttri, K. E., and Szidat, S.: An optimised organic carbon/elemental carbon (OC EC) fraction separation method for radiocarbon source apportionment applied to low-loaded Arctic aerosol filters, Atmos. Meas. Tech., 16, 825–844, https://doi.org/10.5194/amt-16-825-2023, 2023.
Rauber, M., Yttri, K. E., Szidat, S., et al.: Organic aerosols at Trollhaugen Observatory (Antarctica) in summer are dominated by marine sources, Sci. Rep.-UK, in preparation, 2024.
Ricard, V., Jaffrezo, J. L., Kerminen, V. M., Hillamo, R. E., Sillanpaa, M., Ruellan, S., Liousse, C., and Cachier, H.: Two years of continuous aerosol measurements in northern Finland, J. Geophys. Res.-Atmos., 107, ACH 10-1–ACH 10-17, https://doi.org/10.1029/2001jd000952, 2002.
Riipinen, I., Pierce, J. R., Yli-Juuti, T., Nieminen, T., Häkkinen, S., Ehn, M., Junninen, H., Lehtipalo, K., Petäjä, T., Slowik, J., Chang, R., Shantz, N. C., Abbatt, J., Leaitch, W. R., Kerminen, V.-M., Worsnop, D. R., Pandis, S. N., Donahue, N. M., and Kulmala, M.: Organic condensation: a vital link connecting aerosol formation to cloud condensation nuclei (CCN) concentrations, Atmos. Chem. Phys., 11, 3865–3878, https://doi.org/10.5194/acp-11-3865-2011, 2011.
Rötzer, T. and Chmielewski, F. M.: Phenological maps of Europe, Clim. Res., 18, 249–257, https://doi.org/10.3354/cr018249, 2001.
Sagner, S., Eisenreich, W., Fellermeier, M., Latzel, C., Bacher, A., and Zenk, M. H.: Biosynthesis of 2-C-methyl-D-erythritol in plants by rearrangement of the terpenoid precursor, 1-deoxy-D-xylulose 5-phosphate, Tetrahedron Lett., 39, 2091–2094, https://doi.org/10.1016/s0040-4039(98)00296-2, 1998.
Samaké, A., Jaffrezo, J.-L., Favez, O., Weber, S., Jacob, V., Canete, T., Albinet, A., Charron, A., Riffault, V., Perdrix, E., Waked, A., Golly, B., Salameh, D., Chevrier, F., Oliveira, D. M., Besombes, J.-L., Martins, J. M. F., Bonnaire, N., Conil, S., Guillaud, G., Mesbah, B., Rocq, B., Robic, P.-Y., Hulin, A., Le Meur, S., Descheemaecker, M., Chretien, E., Marchand, N., and Uzu, G.: Arabitol, mannitol, and glucose as tracers of primary biogenic organic aerosol: the influence of environmental factors on ambient air concentrations and spatial distribution over France, Atmos. Chem. Phys., 19, 11013–11030, https://doi.org/10.5194/acp-19-11013-2019, 2019.
Samaké, A., Bonin, A., Jaffrezo, J.-L., Taberlet, P., Weber, S., Uzu, G., Jacob, V., Conil, S., and Martins, J. M. F.: High levels of primary biogenic organic aerosols are driven by only a few plant-associated microbial taxa, Atmos. Chem. Phys., 20, 5609–5628, https://doi.org/10.5194/acp-20-5609-2020, 2020.
Sanchez-Ochoa, A., Kasper-Giebl, A., Puxbaum, H., Gelencser, A., Legrand, M., and Pio, C.: Concentration of atmospheric cellulose: A proxy for plant debris across a west-east transect over Europe, J. Geophys. Res.-Atmos., 112, D23S08, https://doi.org/10.1029/2006jd008180, 2007.
Sandradewi, J., Prevot, A. S. H., Szidat, S., Perron, N., Alfarra, M. R., Lanz, V. A., Weingartner, E., and Baltensperger, U.: Using aerosol light absorption measurements for the quantitative determination of wood burning and traffic emission contributions to particulate matter, Environ. Sci. Technol., 42, 3316–3323, https://doi.org/10.1021/es702253m, 2008.
Schmale, J., Zieger, P., and Ekman, A. M. L.: Aerosols in current and future Arctic climate, Nat. Clim. Change, 11, 95–105, https://doi.org/10.1038/s41558-020-00969-5, 2021.
Schmidl, C., Marr, L. L., Caseiro, A., Kotianova, P., Berner, A., Bauer, H., Kasper-Giebl, A., and Puxbaum, H.: Chemical characterisation of fine particle emissions from wood stove combustion of common woods growing in mid-European Alpine regions, Atmos. Environ., 42, 126–141, https://doi.org/10.1016/j.atmosenv.2007.09.028, 2008.
Serreze, M. C. and Barry, R. G.: Processes and impacts of Arctic amplification: A research synthesis, Global Planet. Change, 77, 85–96, https://doi.org/10.1016/j.gloplacha.2011.03.004, 2011.
Sharma, S., Chan, E., Ishizawa, M., Toom-Sauntry, D., Gong, S. L., Li, S. M., Tarasick, D. W., Leaitch, W. R., Norman, A., Quinn, P. K., Bates, T. S., Levasseur, M., Barrie, L. A., and Maenhaut, W.: Influence of transport and ocean ice extent on biogenic aerosol sulfur in the Arctic atmosphere, J. Geophys. Res.-Atmos., 117, D12209, https://doi.org/10.1029/2011JD017074, 2012.
Sharma, S., Barrie, L. A., Magnusson, E., Brattstrom, G., Leaitch, W. R., Steffen, A., and Landsberger, S.: A Factor and Trends Analysis of Multidecadal Lower Tropospheric Observations of Arctic Aerosol Composition, Black Carbon, Ozone, and Mercury at Alert, Canada, J. Geophys. Res.-Atmos., 124, 14133–14161, https://doi.org/10.1029/2019JD030844, 2019.
Shaw, G. E.: The arctic haze phenomenon, B. Am. Meteorol. Soc., 76, 2403–2413, https://doi.org/10.1175/1520-0477(1995)076<2403:tahp>2.0.co;2, 1995.
Simoneit, B. R. T., Schauer, J. J., Nolte, C. G., Oros, D. R., Elias, V. O., Fraser, M. P., Rogge, W. F., and Cass, G. R.: Levoglucosan, a tracer for cellulose in biomass burning and atmospheric particles, Atmos. Environ., 33, 173–182, https://doi.org/10.1016/s1352-2310(98)00145-9, 1999.
Simpson, D., Yttri, K. E., Klimont, Z., Kupiainen, K., Caseiro, A., Gelencser, A., Pio, C., Puxbaum, H., and Legrand, M.: Modeling carbonaceous aerosol over Europe: Analysis of the CARBOSOL and EMEP EC/OC campaigns, J. Geophys. Res.-Atmos., 112, D23S14, https://doi.org/10.1029/2006JD008158, 2007.
Solomon, A., de Boer, G., Creamean, J. M., McComiskey, A., Shupe, M. D., Maahn, M., and Cox, C.: The relative impact of cloud condensation nuclei and ice nucleating particle concentrations on phase partitioning in Arctic mixed-phase stratocumulus clouds, Atmos. Chem. Phys., 18, 17047–17059, https://doi.org/10.5194/acp-18-17047-2018, 2018.
Stohl, A., Forster, C., Frank, A., Seibert, P., and Wotawa, G.: Technical note: The Lagrangian particle dispersion model FLEXPART version 6.2, Atmos. Chem. Phys., 5, 2461–2474, https://doi.org/10.5194/acp-5-2461-2005, 2005.
Stohl, A., Andrews, E., Burkhart, J. F., Forster, C., Herber, A., Hoch, S. W., Kowal, D., Lunder, C., Mefford, T., Ogren, J. A., Sharma, S., Spichtinger, N., Stebel, K., Stone, R., Strom, J., Torseth, K., Wehrli, C., and Yttri, K. E.: Pan-Arctic enhancements of light absorbing aerosol concentrations due to North American boreal forest fires during summer 2004, J. Geophys. Res.-Atmos., 111, D22214, https://doi.org/10.1029/2006JD007216, 2006.
Stohl, A., Berg, T., Burkhart, J. F., Fjǽraa, A. M., Forster, C., Herber, A., Hov, Ø., Lunder, C., McMillan, W. W., Oltmans, S., Shiobara, M., Simpson, D., Solberg, S., Stebel, K., Ström, J., Tørseth, K., Treffeisen, R., Virkkunen, K., and Yttri, K. E.: Arctic smoke – record high air pollution levels in the European Arctic due to agricultural fires in Eastern Europe in spring 2006, Atmos. Chem. Phys., 7, 511–534, https://doi.org/10.5194/acp-7-511-2007, 2007.
Stohl, A., Klimont, Z., Eckhardt, S., Kupiainen, K., Shevchenko, V. P., Kopeikin, V. M., and Novigatsky, A. N.: Black carbon in the Arctic: the underestimated role of gas flaring and residential combustion emissions, Atmos. Chem. Phys., 13, 8833–8855, https://doi.org/10.5194/acp-13-8833-2013, 2013.
Surratt, J. D., Chan, A. W. H., Eddingsaas, N. C., Chan, M. N., Loza, C. L., Kwan, A. J., Hersey, S. P., Flagan, R. C., Wennberg, P. O., and Seinfeld, J. H.: Reactive intermediates revealed in secondary organic aerosol formation from isoprene, P. Natl. Acad. Sci. USA, 107, 6640–6645, https://doi.org/10.1073/pnas.0911114107, 2010.
Tobo, Y., Adachi, K., DeMott, P. J., Hill, T. C. J., Hamilton, D. S., Mahowald, N. M., Nagatsuka, N., Ohata, S., Uetake, J., Kondo, Y., and Koike, M.: Glacially sourced dust as a potentially significant source of ice nucleating particles, Nat. Geosci., 12, 253–258, https://doi.org/10.1038/s41561-019-0314-x, 2019.
Tobler, A. K., Skiba, A., Canonaco, F., Močnik, G., Rai, P., Chen, G., Bartyzel, J., Zimnoch, M., Styszko, K., Nęcki, J., Furger, M., Różański, K., Baltensperger, U., Slowik, J. G., and Prevot, A. S. H.: Characterization of non-refractory (NR) PM1 and source apportionment of organic aerosol in Kraków, Poland, Atmos. Chem. Phys., 21, 14893–14906, https://doi.org/10.5194/acp-21-14893-2021, 2021.
Tonon, T., Li, Y., and McQueen-Mason, S.: Mannitol biosynthesis in algae: more widespread and diverse than previously thought, New Phytol., 213, 1573–1579, https://doi.org/10.1111/nph.14358, 2017.
Turpin, B. J. and Lim, H. J.: Species contributions to PM2.5 mass concentrations: Revisiting common assumptions for estimating organic mass, Aerosol Sci. Tech., 35, 602–610, https://doi.org/10.1080/02786820119445, 2001.
van der Werf, G. R., Randerson, J. T., Giglio, L., van Leeuwen, T. T., Chen, Y., Rogers, B. M., Mu, M., van Marle, M. J. E., Morton, D. C., Collatz, G. J., Yokelson, R. J., and Kasibhatla, P. S.: Global fire emissions estimates during 1997–2016, Earth Syst. Sci. Data, 9, 697–720, https://doi.org/10.5194/essd-9-697-2017, 2017.
Vegetation in Svalbard: https://www.npolar.no/en/themes/vegetation-svalbard/, last access: 9 February 2023.
von Schneidemesser, E., Schauer, J. J., Hagler, G. S. W., and Bergin, M. H.: Concentrations and sources of carbonaceous aerosol in the atmosphere of Summit, Greenland, Atmos. Environ., 43, 4155–4162, https://doi.org/10.1016/j.atmosenv.2009.05.043, 2009.
Waked, A., Favez, O., Alleman, L. Y., Piot, C., Petit, J.-E., Delaunay, T., Verlinden, E., Golly, B., Besombes, J.-L., Jaffrezo, J.-L., and Leoz-Garziandia, E.: Source apportionment of PM10 in a north-western Europe regional urban background site (Lens, France) using positive matrix factorization and including primary biogenic emissions, Atmos. Chem. Phys., 14, 3325–3346, https://doi.org/10.5194/acp-14-3325-2014, 2014.
Wennberg, P. O., Bates, K. H., Crounse, J. D., Dodson, L. G., McVay, R. C., Mertens, L. A., Nguyen, T. B., Praske, E., Schwantes, R. H., Smarte, M. D., St Clair, J. M., Teng, A. P., Zhang, X., and Seinfeld, J. H.: Gas-Phase Reactions of Isoprene and Its Major Oxidation Products, Chem. Rev., 118, 3337–3390, https://doi.org/10.1021/acs.chemrev.7b00439, 2018.
Williams, J. and Koppmann, R. J.: Volatile organic compounds in the atmosphere: An overview, in: Volatile organic compounds in the atmosphere, edited by: Koppmann, R., Oxford, Blackwell Publishing, 1–19, https://doi.org/10.1002/9780470988657.ch1, 2007.
Winiger, P., Andersson, A., Yttri, K. E., Tunved, P., and Gustafsson, O.: Isotope-Based Source Apportionment of EC Aerosol Particles during Winter High-Pollution Events at the Zeppelin Observatory, Svalbard, Environ. Sci. Technol., 49, 11959–11966, https://doi.org/10.1021/acs.est.5b02644, 2015.
Winiger, P., Barrett, T. E., Sheesley, R. J., Huang, L., Sharma, S., Barrie, L. A., Yttri, K. E., Evangeliou, N., Eckhardt, S., Stohl, A., Klimont, Z., Heyes, C., Semiletov, I. P., Dudarev, O. V., Charkin, A., Shakhova, N., Holmstrand, H., Andersson, A., and Gustafsson, O.: Source apportionment of circum-Arctic atmospheric black carbon from isotopes and modeling, Science Advances, 5, eaau8052, https://doi.org/10.1126/sciadv.aau8052, 2019.
Xia, X. and Hopke, P. K.: Seasonal variation of 2-methyltetrols in ambient air samples, Environ. Sci. Technol., 40, 6934–6937, https://doi.org/10.1021/es060988i, 2006.
Yttri, K. E., Aas, W., Bjerke, A., Cape, J. N., Cavalli, F., Ceburnis, D., Dye, C., Emblico, L., Facchini, M. C., Forster, C., Hanssen, J. E., Hansson, H. C., Jennings, S. G., Maenhaut, W., Putaud, J. P., and Tørseth, K.: Elemental and organic carbon in PM10: a one year measurement campaign within the European Monitoring and Evaluation Programme EMEP, Atmos. Chem. Phys., 7, 5711–5725, https://doi.org/10.5194/acp-7-5711-2007, 2007a.
Yttri, K. E., Dye, C., and Kiss, G.: Ambient aerosol concentrations of sugars and sugar-alcohols at four different sites in Norway, Atmos. Chem. Phys., 7, 4267–4279, https://doi.org/10.5194/acp-7-4267-2007, 2007b.
Yttri, K. E., Simpson, D., Nøjgaard, J. K., Kristensen, K., Genberg, J., Stenström, K., Swietlicki, E., Hillamo, R., Aurela, M., Bauer, H., Offenberg, J. H., Jaoui, M., Dye, C., Eckhardt, S., Burkhart, J. F., Stohl, A., and Glasius, M.: Source apportionment of the summer time carbonaceous aerosol at Nordic rural background sites, Atmos. Chem. Phys., 11, 13339–13357, https://doi.org/10.5194/acp-11-13339-2011, 2011a.
Yttri, K. E., Simpson, D., Stenström, K., Puxbaum, H., and Svendby, T.: Source apportionment of the carbonaceous aerosol in Norway – quantitative estimates based on 14C, thermal-optical and organic tracer analysis, Atmos. Chem. Phys., 11, 9375–9394, https://doi.org/10.5194/acp-11-9375-2011, 2011b.
Yttri, K. E., Lund Myhre, C., Eckhardt, S., Fiebig, M., Dye, C., Hirdman, D., Ström, J., Klimont, Z., and Stohl, A.: Quantifying black carbon from biomass burning by means of levoglucosan – a one-year time series at the Arctic observatory Zeppelin, Atmos. Chem. Phys., 14, 6427–6442, https://doi.org/10.5194/acp-14-6427-2014, 2014.
Yttri, K. E., Canonaco, F., Eckhardt, S., Evangeliou, N., Fiebig, M., Gundersen, H., Hjellbrekke, A.-G., Lund Myhre, C., Platt, S. M., Prévôt, A. S. H., Simpson, D., Solberg, S., Surratt, J., Tørseth, K., Uggerud, H., Vadset, M., Wan, X., and Aas, W.: Trends, composition, and sources of carbonaceous aerosol at the Birkenes Observatory, northern Europe, 2001–2018, Atmos. Chem. Phys., 21, 7149–7170, https://doi.org/10.5194/acp-21-7149-2021, 2021.
Zangrando, R., Barbaro, E., Zennaro, P., Rossi, S., Kehrwald, N. M., Gabrieli, J., Barbante, C., and Gambaro, A.: Molecular Markers of Biomass Burning in Arctic Aerosols, Environ. Sci. Technol., 47, 8565–8574, https://doi.org/10.1021/es400125r, 2013.
Zieger, P., Heslin-Rees, D., Karlsson, L., Koike, M., Modini, R., and Krejci, R.: Black carbon scavenging by low-level Arctic clouds, Nat. Commun., 14, 5488, https://doi.org/10.1038/s41467-023-41221-w, 2023.
Zotter, P., Herich, H., Gysel, M., El-Haddad, I., Zhang, Y., Močnik, G., Hüglin, C., Baltensperger, U., Szidat, S., and Prévôt, A. S. H.: Evaluation of the absorption Ångström exponents for traffic and wood burning in the Aethalometer-based source apportionment using radiocarbon measurements of ambient aerosol, Atmos. Chem. Phys., 17, 4229–4249, https://doi.org/10.5194/acp-17-4229-2017, 2017.