the Creative Commons Attribution 4.0 License.
the Creative Commons Attribution 4.0 License.
 | 28 Feb 2024
Quantum yields of CHDO above 300 nm
Luc Vereecken
The photolysis of mono-deuterated formaldehyde, CHDO, is a critical process in the deuterium enrichment of stratospheric hydrogen formed from methane. In this work, a consistent description of the quantum yields of the molecular and radical channels of the CHDO photolysis is deduced from literature data. The fluorescence measurements of Miller and Lee (1978) provided a first data set to deduce the product quantum yields. An alternative analysis is based on the measured quantum-yield spectrum for the radical channel of the CD2O photolysis by McQuigg and Calvert (1969), which is corrected for wavelength dependency and combined with the CH2O quantum-yield spectrum to provide an approximation for CHDO. Both approaches provide consistent results. Finally, the findings of Troe (1984, 2007) enable the specification of the pressure dependence of the quantum yield for CH2O and CD2O and, hence, for CHDO. We find that the radical channel does not show a pressure dependence, whereas the molecular channel is dominated by tunneling and quenching processes. Simplified representations are given that are readily implemented in kinetic atmospheric models. As an example of their application, the altitude dependence of the ratio of and is provided. Also, the importance of the photolysis of formaldehyde on the yield of HD in the atmosphere is shown through the altitudinal dependence of the isotopic fractionation.
- Article
(4614 KB) - Full-text XML
- BibTeX
- EndNote


Measurements over the last few decades showed that molecular hydrogen, H2, in the stratosphere is enriched in deuterium compared to H2 in the troposphere (see, e.g., Ehhalt and Volz, 1976; Gerst and Quay, 2001; Rahn et al., 2003; Rice et al., 2003; Röckmann et al., 2003; McCarthy et al., 2004; Rhee et al., 2006). Gerst and Quay (2001) suggested that this enrichment could be due to the differential isotope fractionation in the photo-oxidation of methane. Measurements of the vertical profiles of the isotope content in H2 and CH4, available from 2003, allowed the interpretation and modeling of the observed enrichment (see, e.g., Pieterse et al., 2011). The methane photo-oxidation consists of various reaction steps, each of which contribute kinetic isotope effects, KIEs, that have to be considered (e.g., Feilberg et al., 2005; Mar et al., 2007). The last and most critical step in the reaction chain for producing the hydrogen isotope HD from the mono-deuterated isotopologue of formaldehyde, CHDO, is its photolysis.
Compared to CH2O, the available data for the mono-deuterated isotopologue CHDO are scarce. Only its spectrum was measured (MPI Mainz UV-VIS Spectral Atlas by Keller-Rudek et al., 2022). The quantum yields for the molecular and radical fragmentation branches of the CHDO photolysis, as well as the rate constants for the quenching reactions, were not measured at all or with insufficient accuracy. Thus, despite its importance for the atmospheric production of HD, the photolysis of CHDO is still poorly defined; at this time, it is the most uncertain factor in the overall fractionation of formaldehyde. For example, the measured or estimated fractionation factors for the molecular channel range from 1.08 to 1.82 (e.g., Feilberg et al., 2005; Rhee et al., 2006, Mar et al., 2007; Nilsson et al., 2009; Röckmann et al., 2010). Moreover, the measurements by Nilsson et al. (2009) are the only ones considering the pressure dependence of the fractionation factor due to Reactions (R3), (R4), and (R7) (see Table 1).
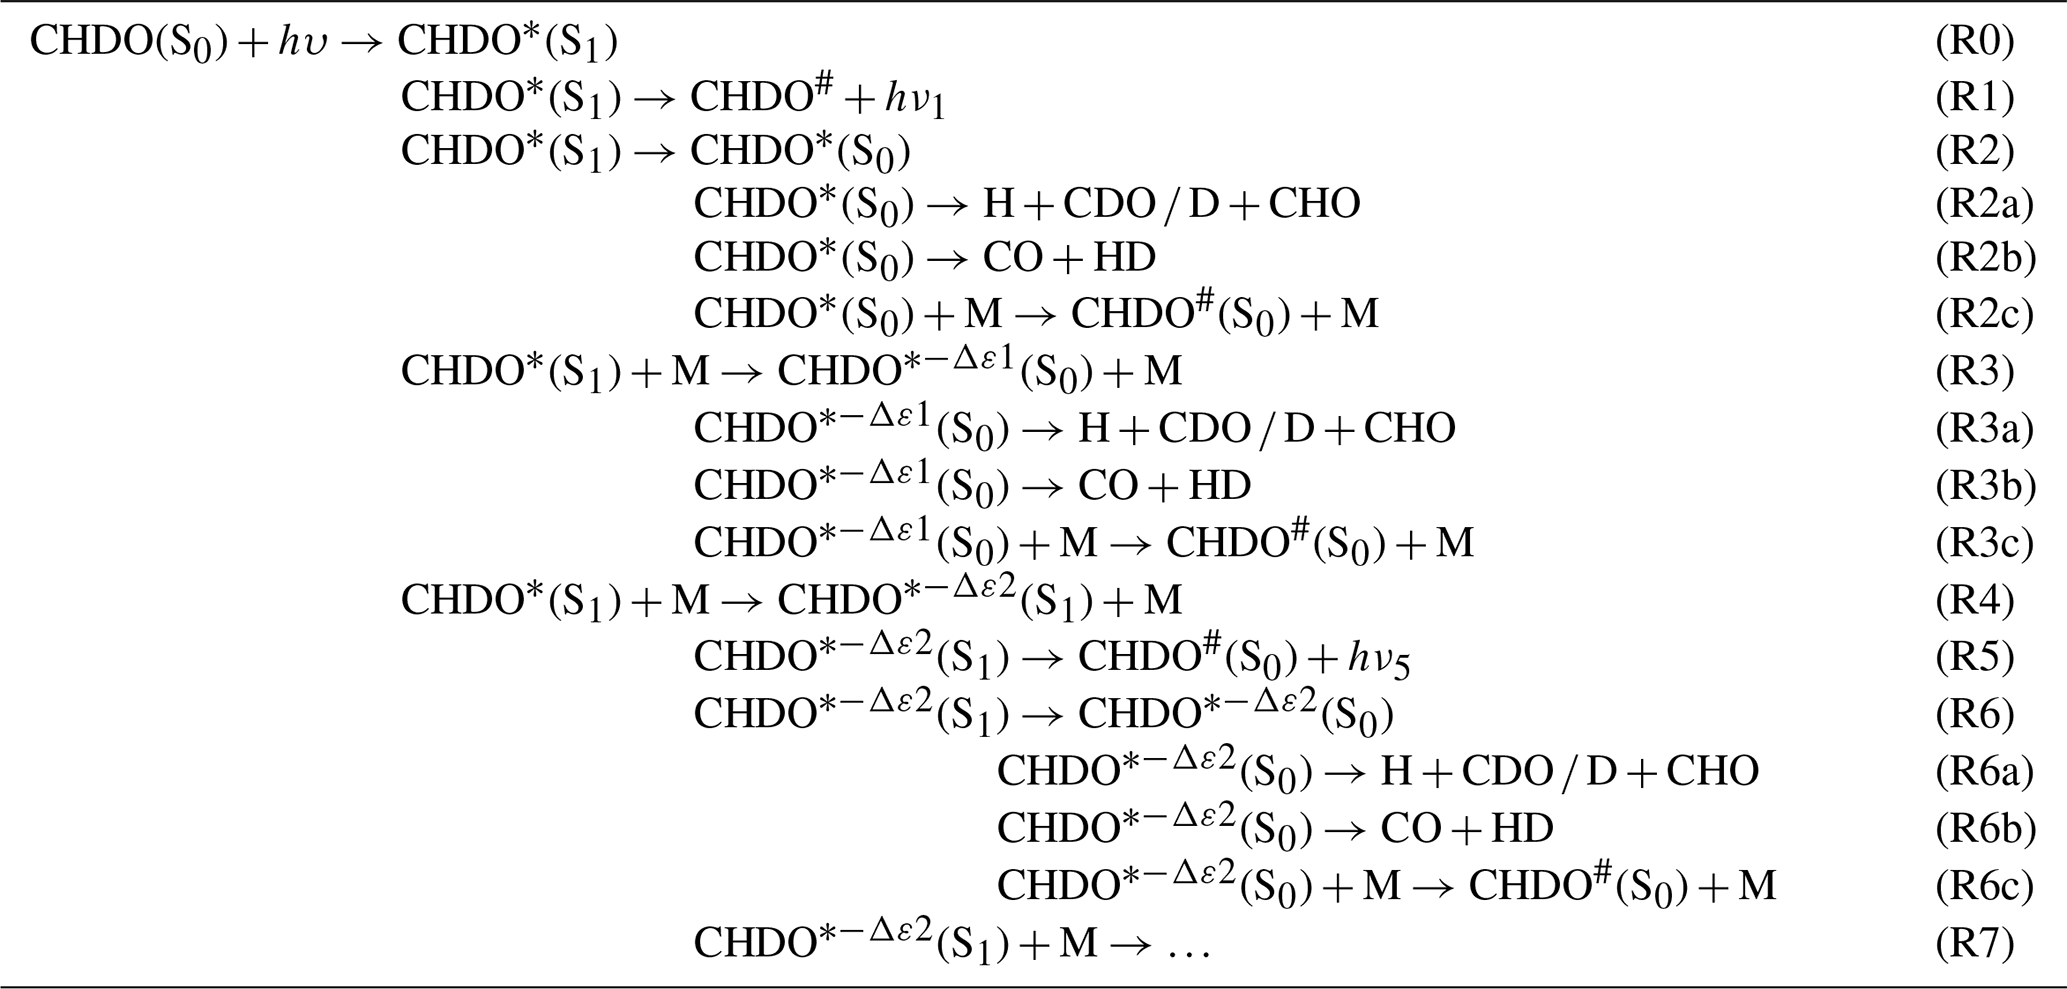
Table 1Reaction scheme of the photolysis of CHDO occurring over the S1 and S0 electronic singlet states. −Δε1 and −Δε2 indicate the collisional energy losses to bath gas M in the respective reactions. This quenching is stepwise but is represented here for energies above and/or below the threshold for dissociation; the asterisk ∗ stands for excitations that are able to lead to bond breaking, whereas the index # indicates lower energies that ultimately lead to thermalized CHDO.
In this work, we aim to provide information for the modeling of CHDO photochemistry for atmospheric conditions, i.e., for a limited domain of temperature and pressure, by deducing the molecular and radical quantum yields Φmol and Φrad for CHDO from literature information based on the scant data available and supplemented by a number of plausible assumptions. We do this based on two approaches: the first is based on the fluorescence measurements of Miller and Lee (1978) and literature data on energy transitions (e.g., Yeung and Moore, 1973; Chuang et al., 1987; Osborn, 2008; Fu et al., 2011). The second approach assumes that the measurements of McQuigg and Calvert (1969) can be corrected via the comparison of the CH2O measurement with later experiments (see, e.g., the overview by Röth and Ehhalt, 2015). The photochemistry derived thus is then used to assess the altitudinal dependence of the CHDO isotopic fractionation.
Based on the available literature (e.g., Araújo et al., 2009; Breuer and Lee, 1971; Chuang et al., 1987; Yamaguchi et al., 1998), we propose a photolytic reaction scheme of CHDO in Table 1, analogous to that of CH2O (Röth and Ehhalt, 2015). The scheme involves a cascading series of fragmentation channels competing with stepwise quenching by collisional energy loss, starting at the excited singlet state S1. Reactions via the triplet state of CHDO are not considered here as they are only accessible at wavelengths below 300 nm (Aràujo et al., 2009), while we concentrate on wavelengths above this limit in this work. Under atmospheric conditions, which are considered here, the system is thermalized.
After excitation of the ground-state CHDO(S0) (Reaction R0) by a photon of a given wavelength, the excited reaction product CHDO∗(S1) decays by fluorescence (Reaction R1) or transitions to the S0 ground-state surface as an excited CHDO∗ molecule with either all available energy (Reaction R2) or a variable amount of energy −Δε1 being lost by quenching (Reaction R3). The excited CHDO∗(S0) and can, in turn, be quenched by the bath gas in a cascading series (Reactions R2c, R3c, R6c), competing at each energy level with fragmentation into radicals (Reactions R2a, R3a, R6a) or to molecular products CO+HD (Reactions R2b, R3b, R6b), as described for CH2O by Yeung and Moore (1973). Alternatively, the excited CHDO∗(S1) can lose an amount of energy by quenching but remain on the S1 excited electronic surface (Reaction R4). This state can then undergo processes as above, i.e., decay by fluorescence (Reaction R5) and transitioning to the S0 ground state without (Reaction R6) or with (Reaction R7) energy loss by quenching, where once again it can undergo further quenching (Reaction R6c) in competition with fragmentation (Reactions R6a, R6b). Overall, this scheme represents a cascading series of quenching steps competing against decomposition and fluorescence. Only the first few steps in the cascade are represented, but more cascading steps are possible at lower internal energies. According to the analysis of the fluorescence measurements by Miller and Lee (1978), these lower-energy reactions are not critical and need not be considered in detail. Here, Reaction (R7) simply represents the summation of all subsequent cascades, from which negligible channels such as the fluorescence channels are omitted. Schematic energy diagrams for this reaction mechanism were already depicted in the literature (e.g., Fig. 3 in Aràujo et al., 2009, and Fig. 1 in Chuang et al., 1987) and are not repeated here.
The quantum yield Φrad represents the combined fragmentation into radicals (Reactions R2a, R3a, R6a), while summed fragmentation through the molecular branches (Reactions R2b, R3b, R6b) is described by the quantum yield Φmol. The total photolysis quantum yield Φtot, i.e., the decay of excited formaldehyde into products other than its ground state, can be experimentally derived from the observed CO production, where CDO and CHO radical fragments react with O2 to form CO and . The quantum yield of the fluorescence is always less than 1 % (Miller and Lee, 1978) and is omitted henceforth.
Obviously, the sum of Φtot and Φquench, the summed yield of the quenching reactions (R2c, R3c, R6c), must equal 1 at any wavelength hν.
From the fluorescence measurements of Miller and Lee (1978), the quantum yields of both the fluorescence and the total non-CHDO products can be derived. The contribution of the second step in the reaction cascade is small at low pressure (see later), so we assume that Table X provided by these authors directly gives the reaction rate constants k1 and k2, where k1 equals the reciprocal lifetime τradiation listed, and is the non-radiative lifetime. Similarly, the constants k5 and k6 are determined by the lifetimes of the next lower vibrational level.
Table 2Results of the least-square fit of the quantum yields of CHDO (Miller and Lee, 1978); k1, k2, k5, and k6 are literature data (Miller and Lee, 1978), and k3, k4, and k7 are deduced from these data.
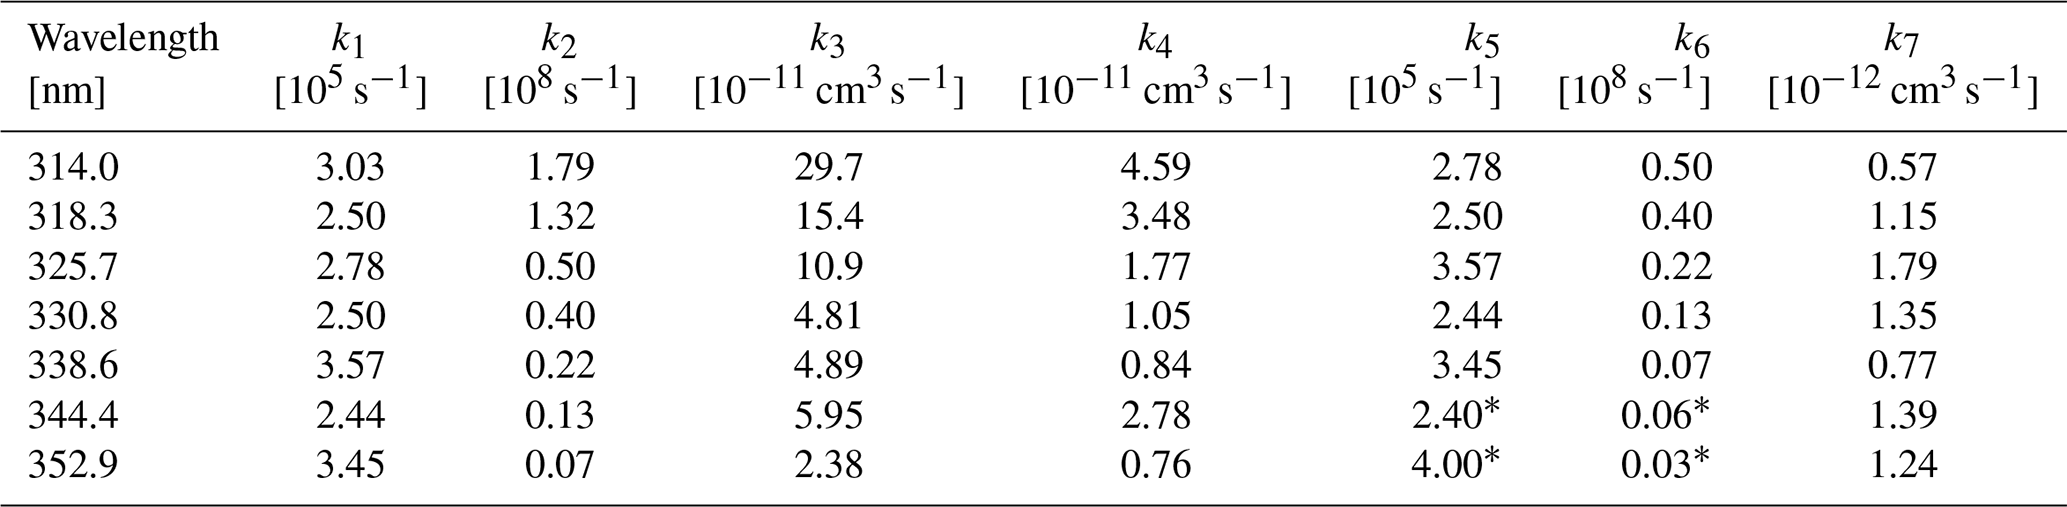
∗ Estimated by extrapolation of the other values.
The reaction constants k3, k4, and k7 can be deduced from the pressure dependence of the CHDO fluorescence quantum yield in Table II of Miller and Lee (1978). In the present paper, only the quantum yields at pressures above 1 Torr are considered, where the Ar bath gas used is assumed to have similar collisional properties to air (Hirschfelder et al., 1954). For each wavelength, the pressure dependence of the data is fitted by a simplex algorithm according to Nelder and Mead (1965) using Eq. (3) for the fluorescence quantum yield ΦF:
with and . For consistency, we only used the 2i4j transitions.
The corresponding reaction constants are listed in Table 2. With this data set, the experimental fluorescence measurements are well fitted, as shown in Fig. 1, where, to improve the clarity of the fit, only the pressure-dependent part θ(M) of Eq. (3) is plotted vs. pressure:
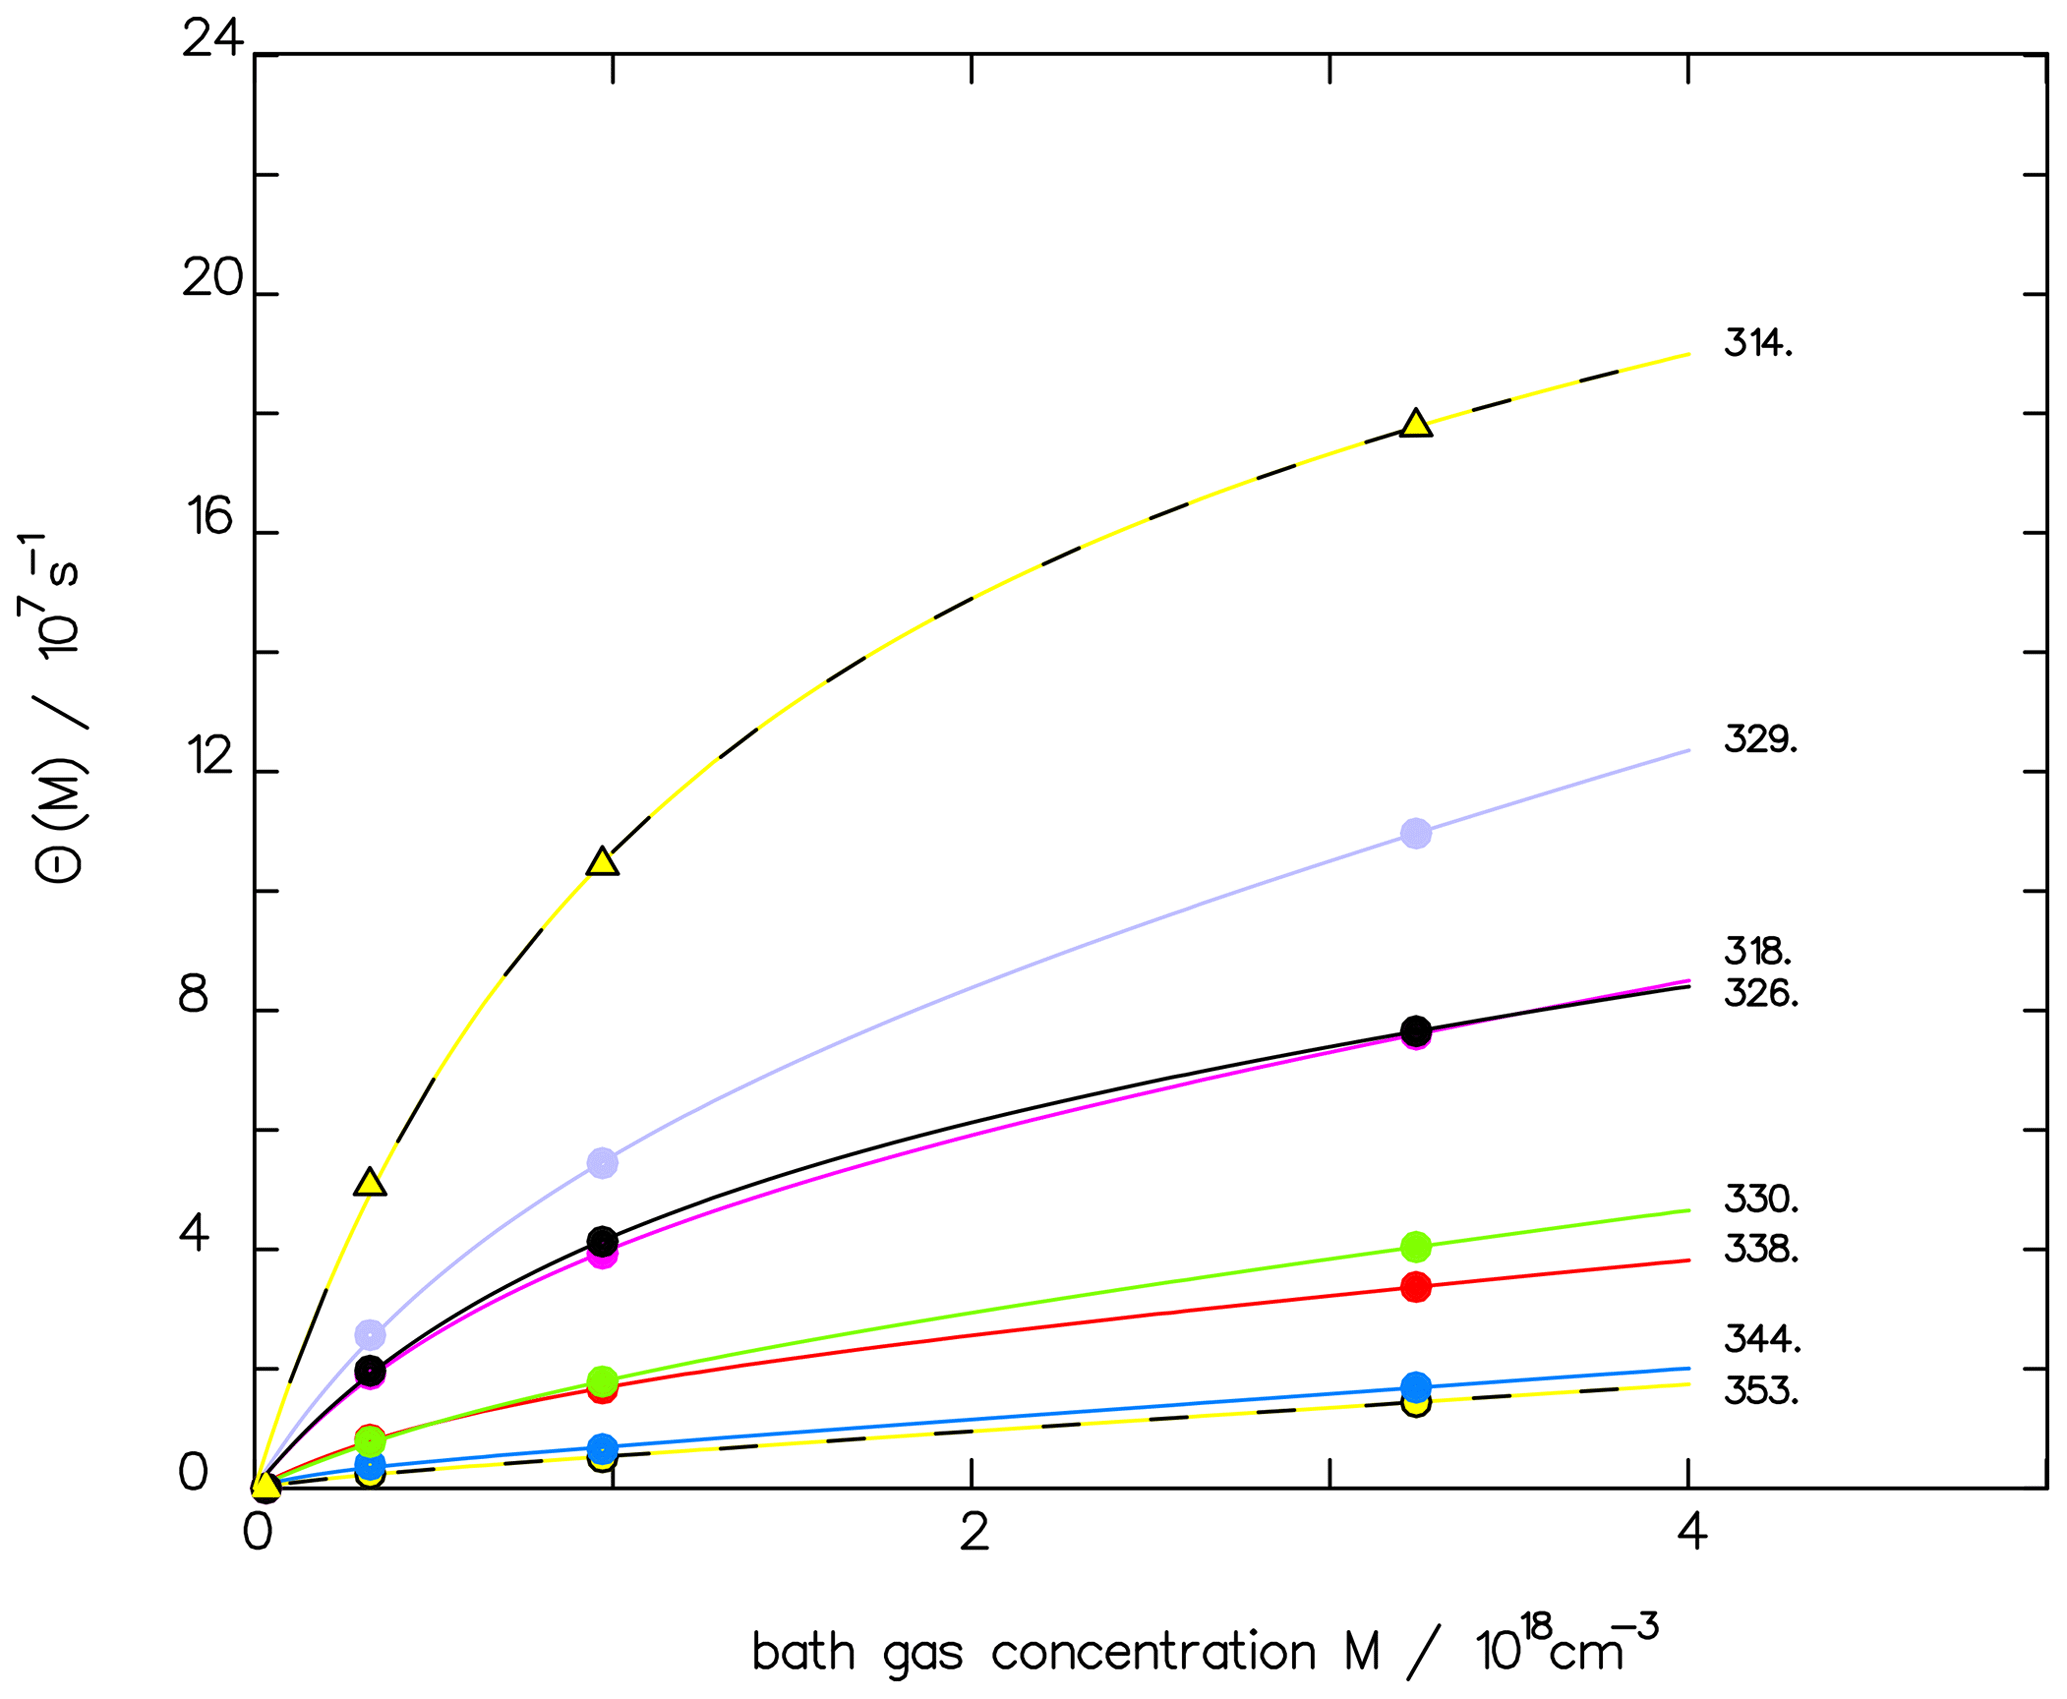
Figure 1Comparison of the fluorescence quantum yield measured by Miller and Lee (1978) (full dots) with the fitted function ΦF(M) (see Eq. 3) for different wavelengths (in nm) as indicated. To emphasize the quality of the fit, we depict only the pressure-dependent part θ(M), as defined in Eq. (4).
The energy transferred in Reaction (R2) is either quenched to form a stable molecule CHDO#(S0) or used to drive fragmentation into molecular (CO + HD) or radical products (). Hence, Reactions (R2a) and (R2b) form part of the product-forming channel. Analogously, the secondary reactions of the pressure-dependent Reactions (R3) and (R4) lead to products via Reactions (R3a) and (R3b) and Reactions (R6a) and (R6b), respectively. With this, the total-product quantum yield of the photolysis of CHDO is the sum of the individual product quantum yields across all channels k, where the index k=2, 3, and 6 stands for the non-radiative Reactions (R2), (R3), and (R6).
The individual product quantum yield can be approximated by
analogously to the publication by Röth and Ehhalt (2015) on CH2O.
In Eq. (5), ε2 is the excitation energy of the photolysis reaction. The energies ε3 and ε6 are related to ε2 by the approximated energy transfer in a collision in relation to the averaged width of the band intervals, given by eV (Troe, 2007) and eV (Miller and Lee, 1978). The pivot wavelength is 348.6 nm, as published in Nilsson et al. (2014), based on quantum chemical calculations of the barriers to dissociation of H-CHO, H-CDO, D-CHO, and D-CDO.
The total quantum yield of the products (molecules plus radicals) can be deduced from the rate constants of Table 2 and the measurements of Nilsson et al. (2010, 2014), who investigated the pressure dependence of the kinetic isotope effect, KIE, of the photolysis frequencies of CH2O and CHDO.
As the quantum yield of CH2O is known from the literature (see, e.g., Röth and Ehhalt, 2015), remains the only unknown factor in Eq. (6). With the actinic flux density F of the lamp used by Nilsson et al. (2014) and the absorption spectra σx of CH2O and CHDO from Gratien et al. (2007), the ratio KIE can be calculated with optimized values for a and b in Eq. (5). Comparing the results of the simulation with the measured data by Nilsson et al. (2010, 2014), the constants a and b can be determined via a least-square fit. Figure 2 presents the result with optimized values a=2.94 and nm−1 together with the measurements. The data at 1000 hPa are included in the fit as their mean value to accommodate the large variation in the data.
The total-product quantum yield, deduced from the reaction scheme (Reactions R0 to R7), is
with α and β as defined in Eq. (3) and , the sub-product yield, defined according to Eq. (5). The measured wavelength dependence of Φtot at 1000 hPa pressure is depicted in Fig. 3, where the total quantum yield is calculated with the rate constants from Table 2. The pressure dependence of the three terms of Φtot is illustrated in Fig. 4.
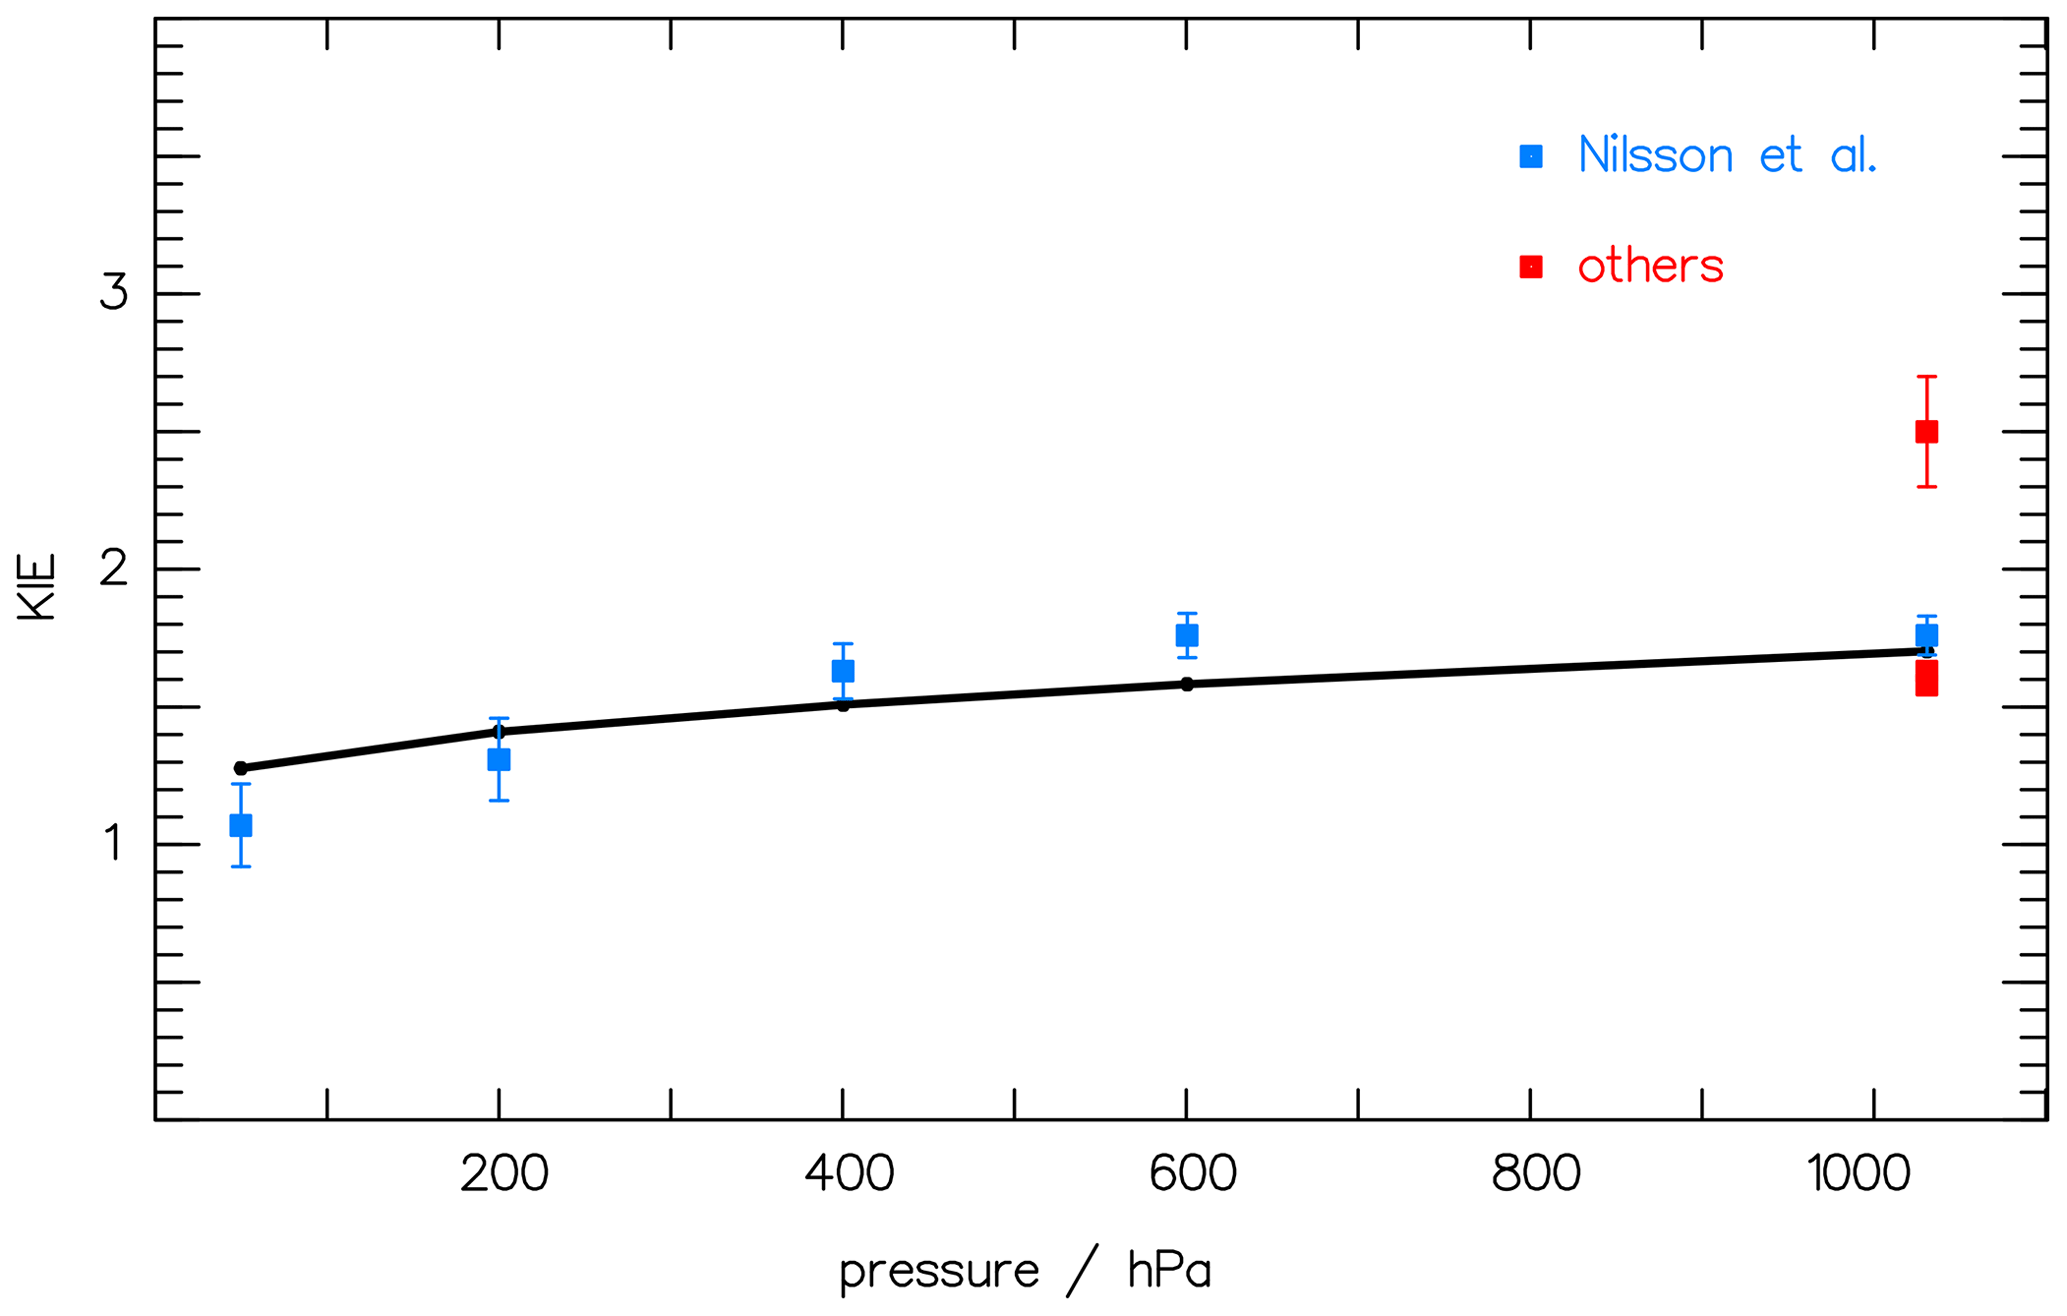
Figure 2The pressure dependence of the kinetic isotope effect (KIE) (i.e., the ratio of the CH2O CHDO photolysis frequencies; see Eq. 6) is compared to the measured data of Nilsson et al. (2010) (blue squares) and to Feilberg et al. (2007), Rhee et al. (2008), and Röckmann et al. (2010) (red squares, “others”). The solid curve at 1000 hPa is included to accommodate the variation in the data.
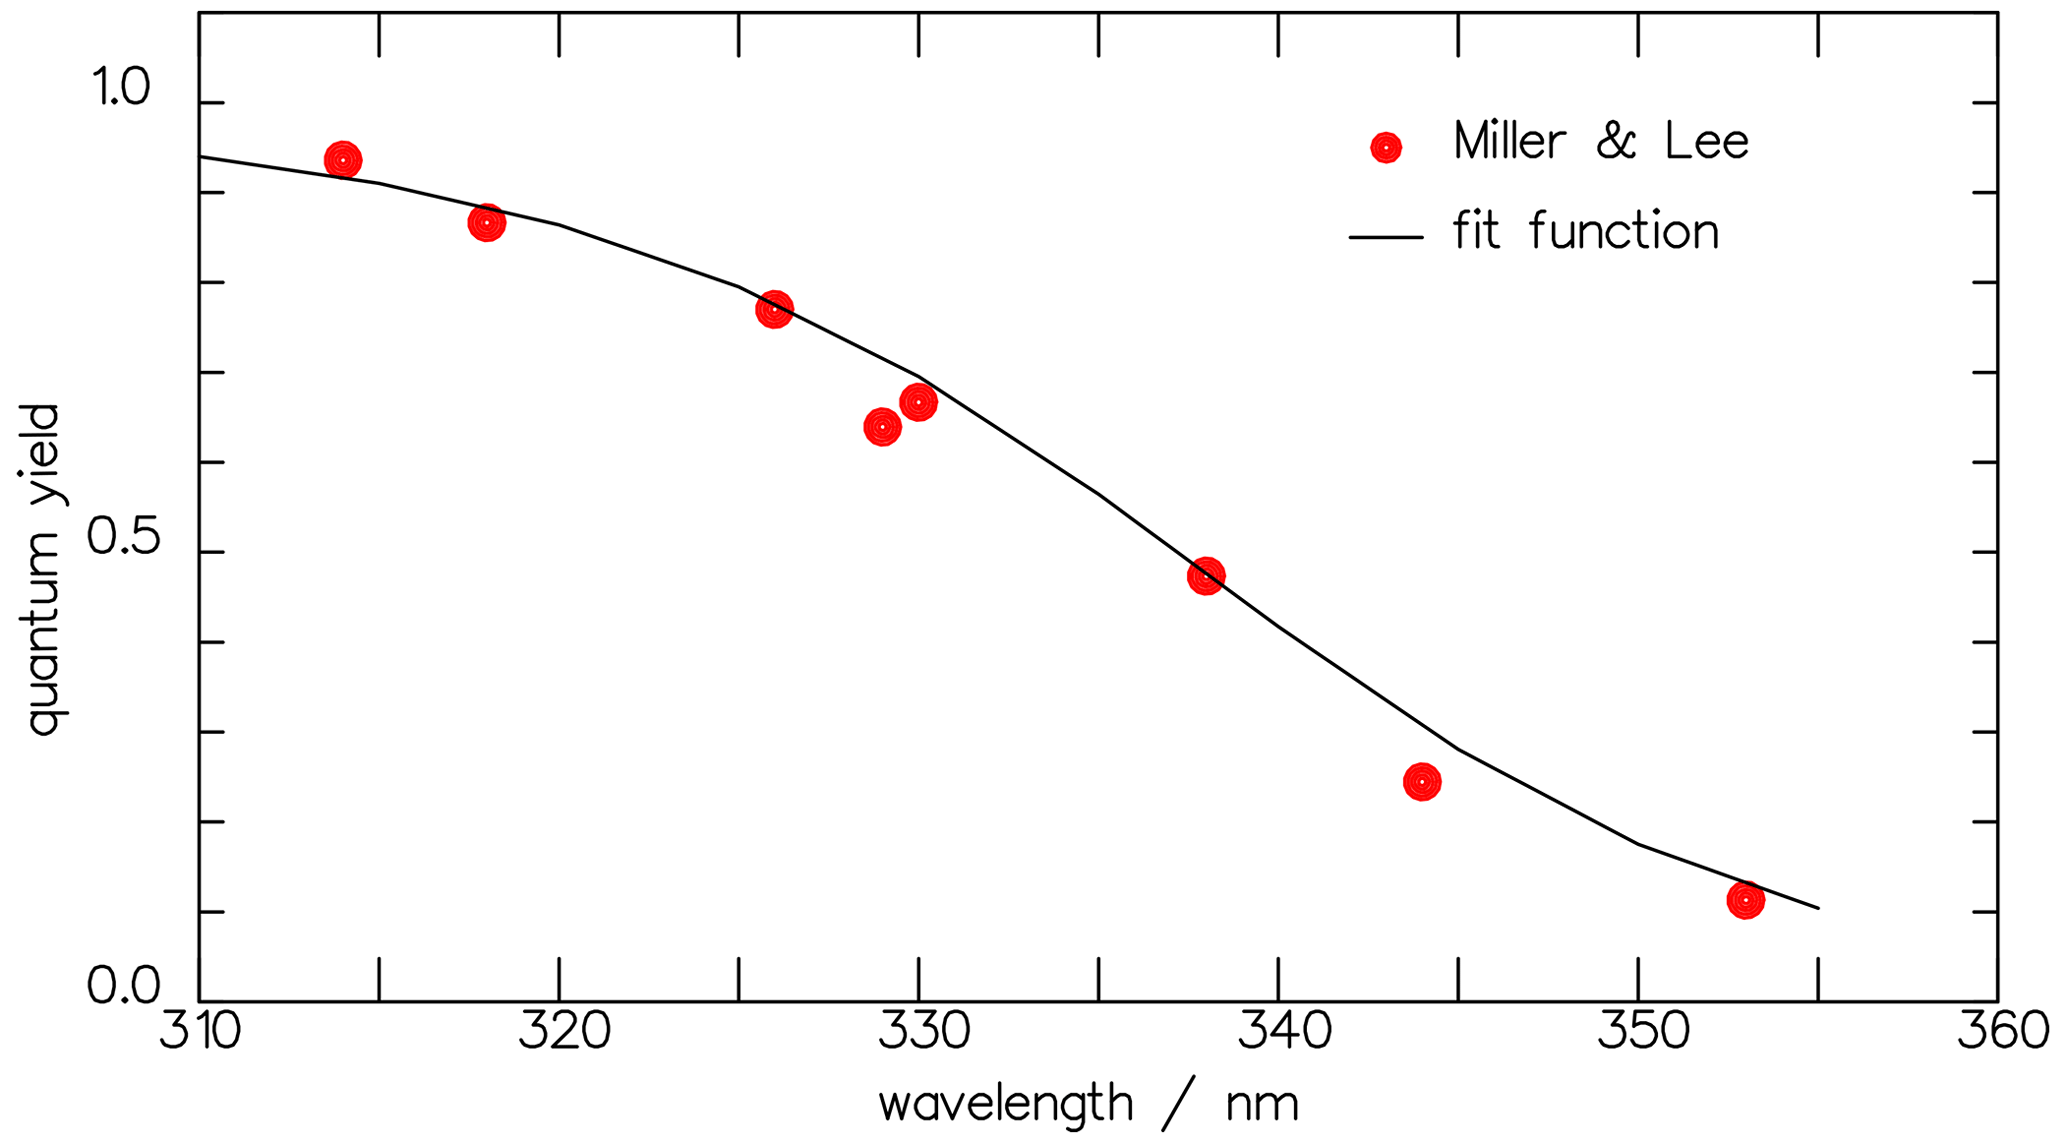
Figure 3The total-product quantum yields Φtot derived from the measured rate constants of Miller and Lee (1978) at 1000 hPa through Eq. (7) (full circles) are well reproduced by the continuous Φtot function obtained after fitting the rate coefficients to function Eq. (8) (solid curve).
Table 3Parameters of the rate constants according to Eq. (8) (B in nm−1 and A in s−1 (k1, k2, k5, k6) or cm3 s−1 (k3, k4, k7)) as derived from least-square fits.
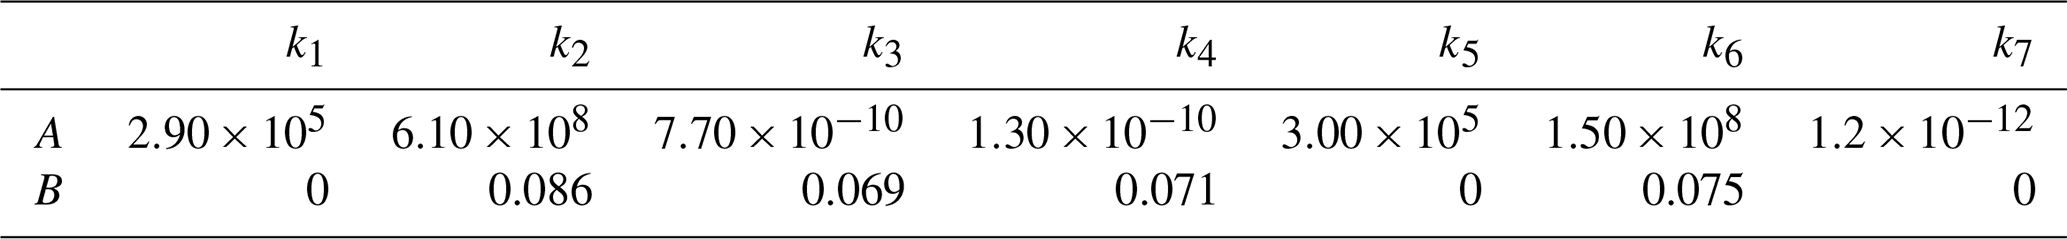
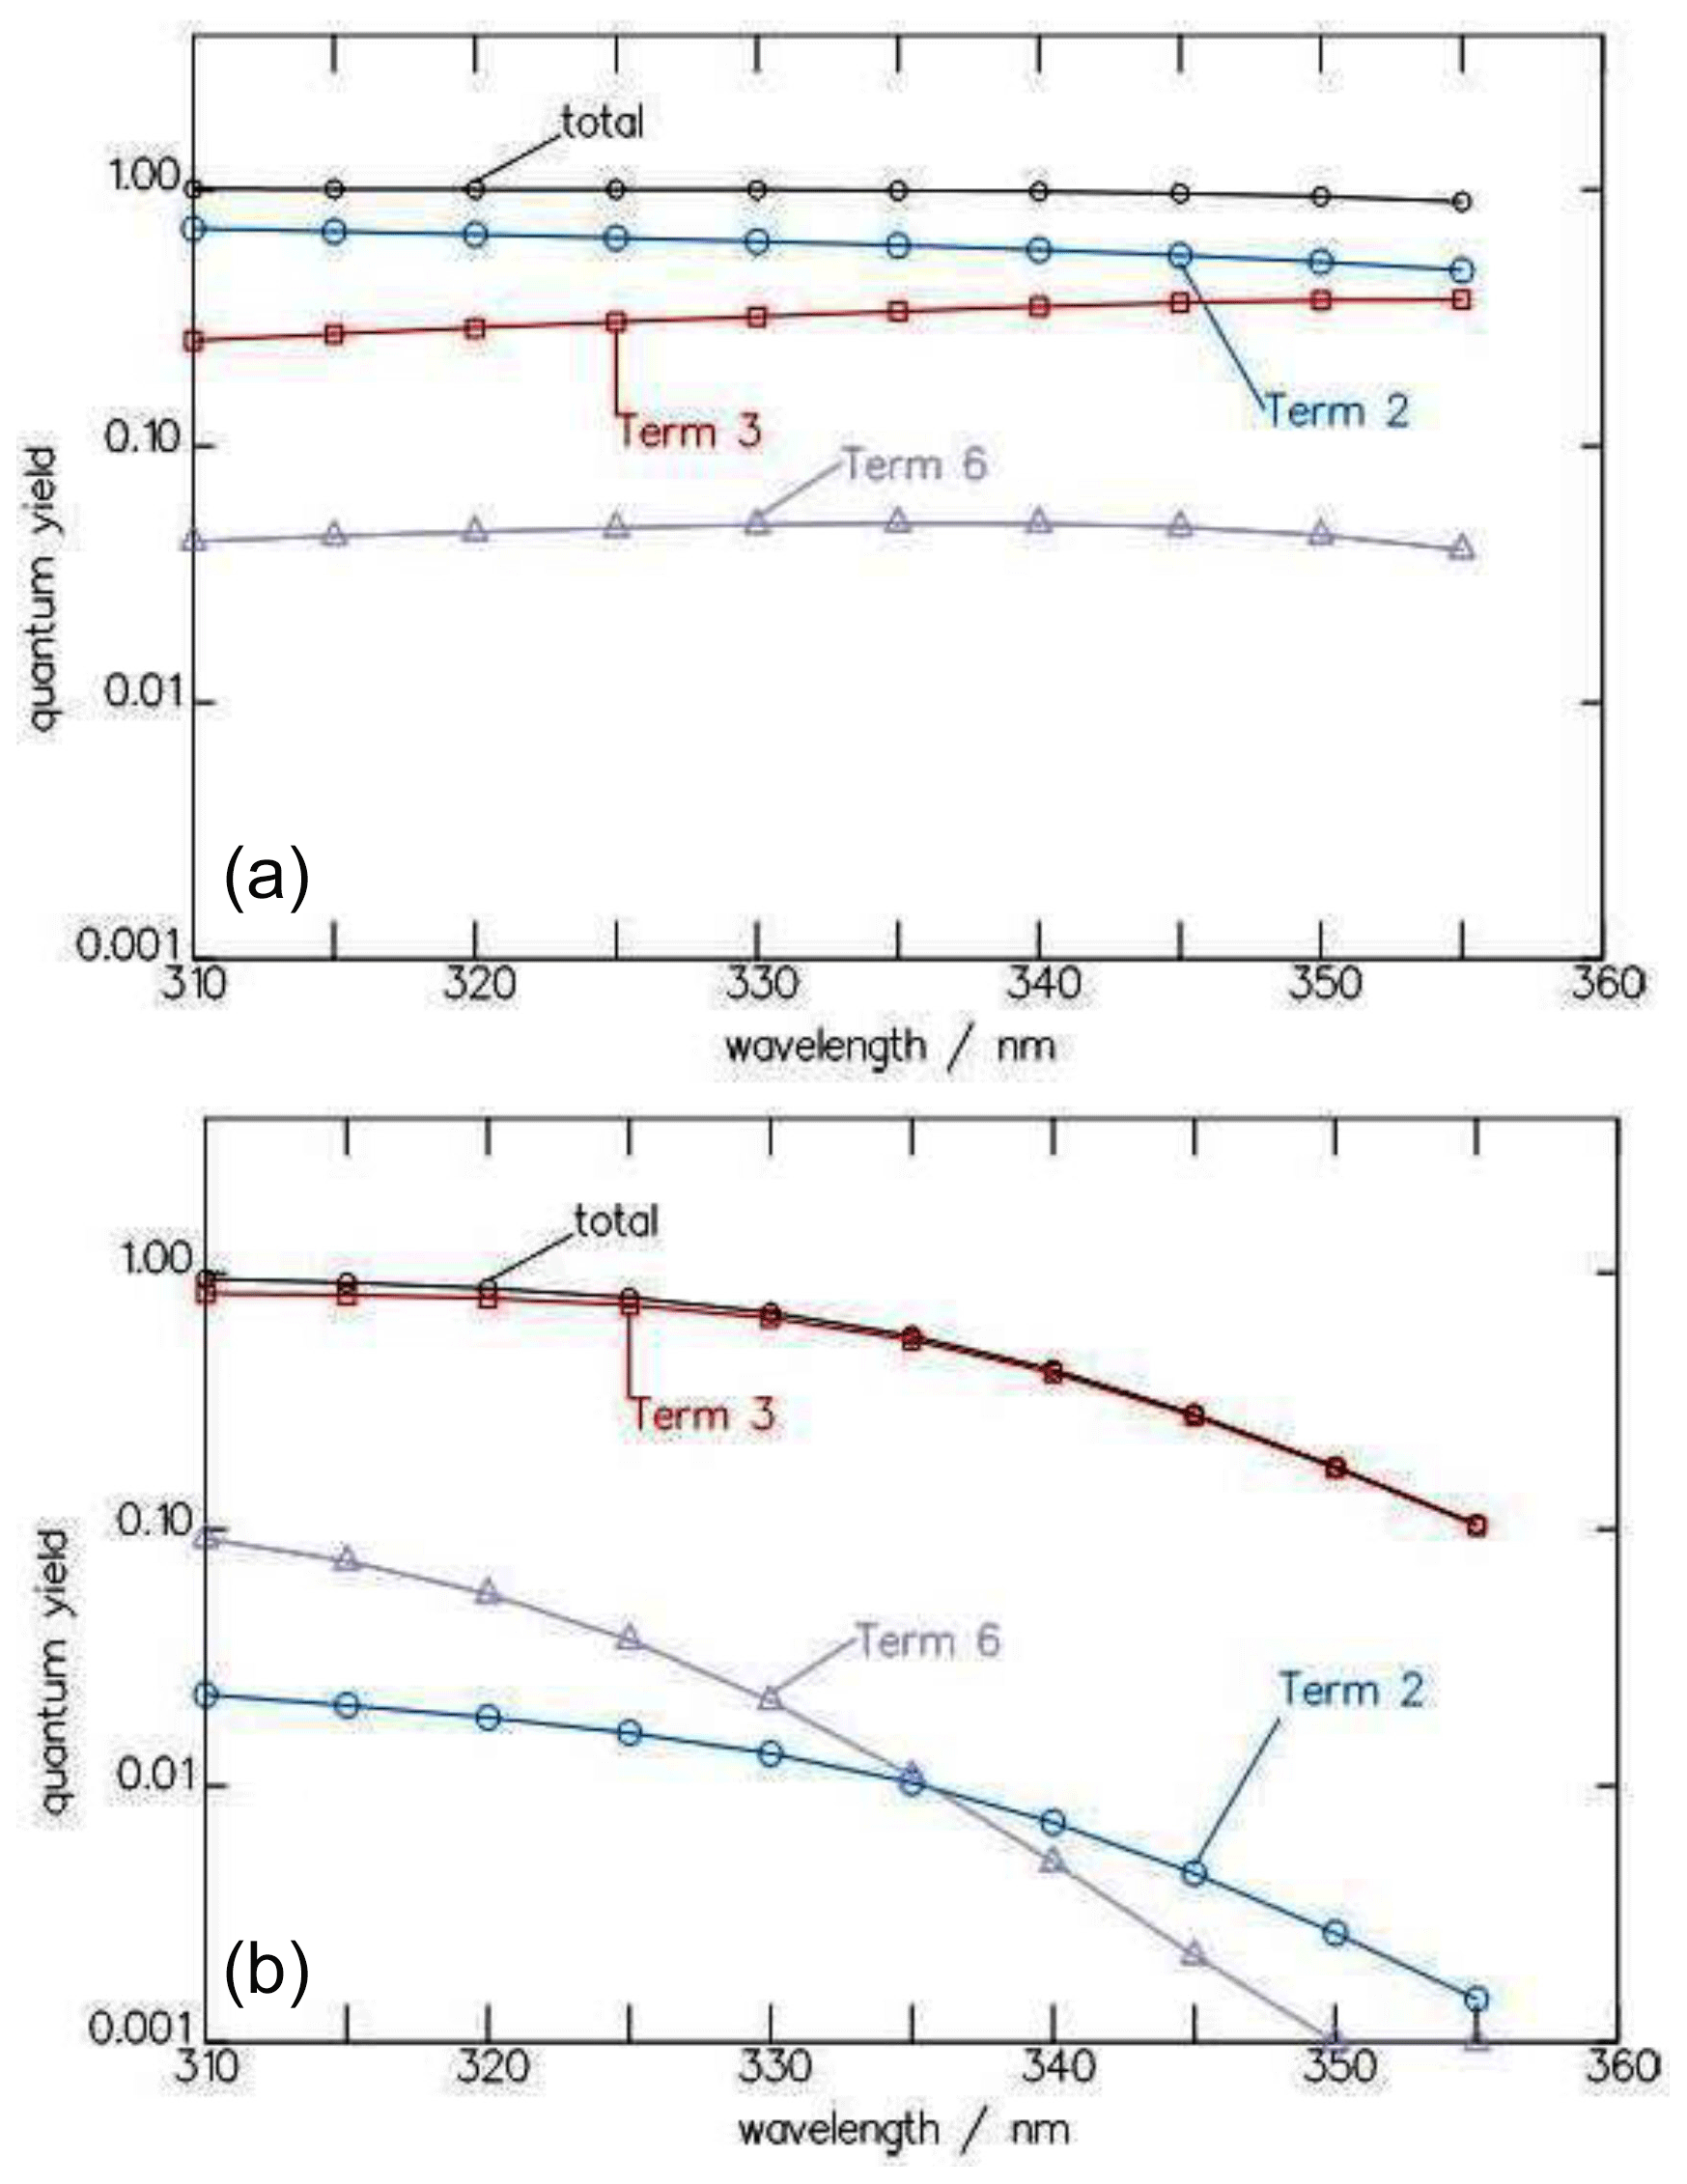
Figure 4Wavelength dependence of the contributions of the three terms for , , and of Eq. (7) to the total quantum yield Φtot of the CHDO photolysis at 10 (a) and 1030 hPa (b).
To obtain a continuous and smooth wavelength dependence, the rate constants k1 through k7 can be represented by an approximation function:
The values for the parameters A and B are obtained from a least-square fit to the data in Table 2 and listed in Table 3. Wherever the value of B is less than 0.001, it is set to 0, and A then corresponds directly to the mean of the respective rate constant. The wavelength dependence of Φtot at 1000 hPa with these functions is presented by the solid line in Fig. 3. The comparison to the experimental data by Miller and Lee (1978) suggests a variance in the data of around 15 %.
For CHDO, the only quantitative indication for the quantum yield of the radical channel in the literature is measurements of the kinetic isotope effect (KIE) (Feilberg et al., 2007; Rhee et al., 2008; Röckmann et al., 2010; Nilsson et al., 2014). Following Eq. (5), simulating these KIE measurements requires three parameters for the individual radical quantum yield , expressed in Eq. (9): the maximum value Φmax of the wavelength dependence, its curvature b, and the pivot wavelength λ0. The parameter a is set to 1 as, for the radical quantum yield, no pressure dependence is assumed, canceling the factor.
Analogously to the analysis for CH2O (Röth and Ehhalt, 2015), where the curvatures of the wavelength dependence of Φtot and Φrad are similar, b can be set to nm−1 for the radical quantum yield of CHDO. The maximum Φmax was varied in the interval [0.70, 0.78] around the corresponding value for CH2O, but the resulting scattering is very small (see shaded area in Fig. 5). Consequently, parameter Φmax is set to 0.74, matching the value also used for CH2O (Ehhalt and Röth, 2015).
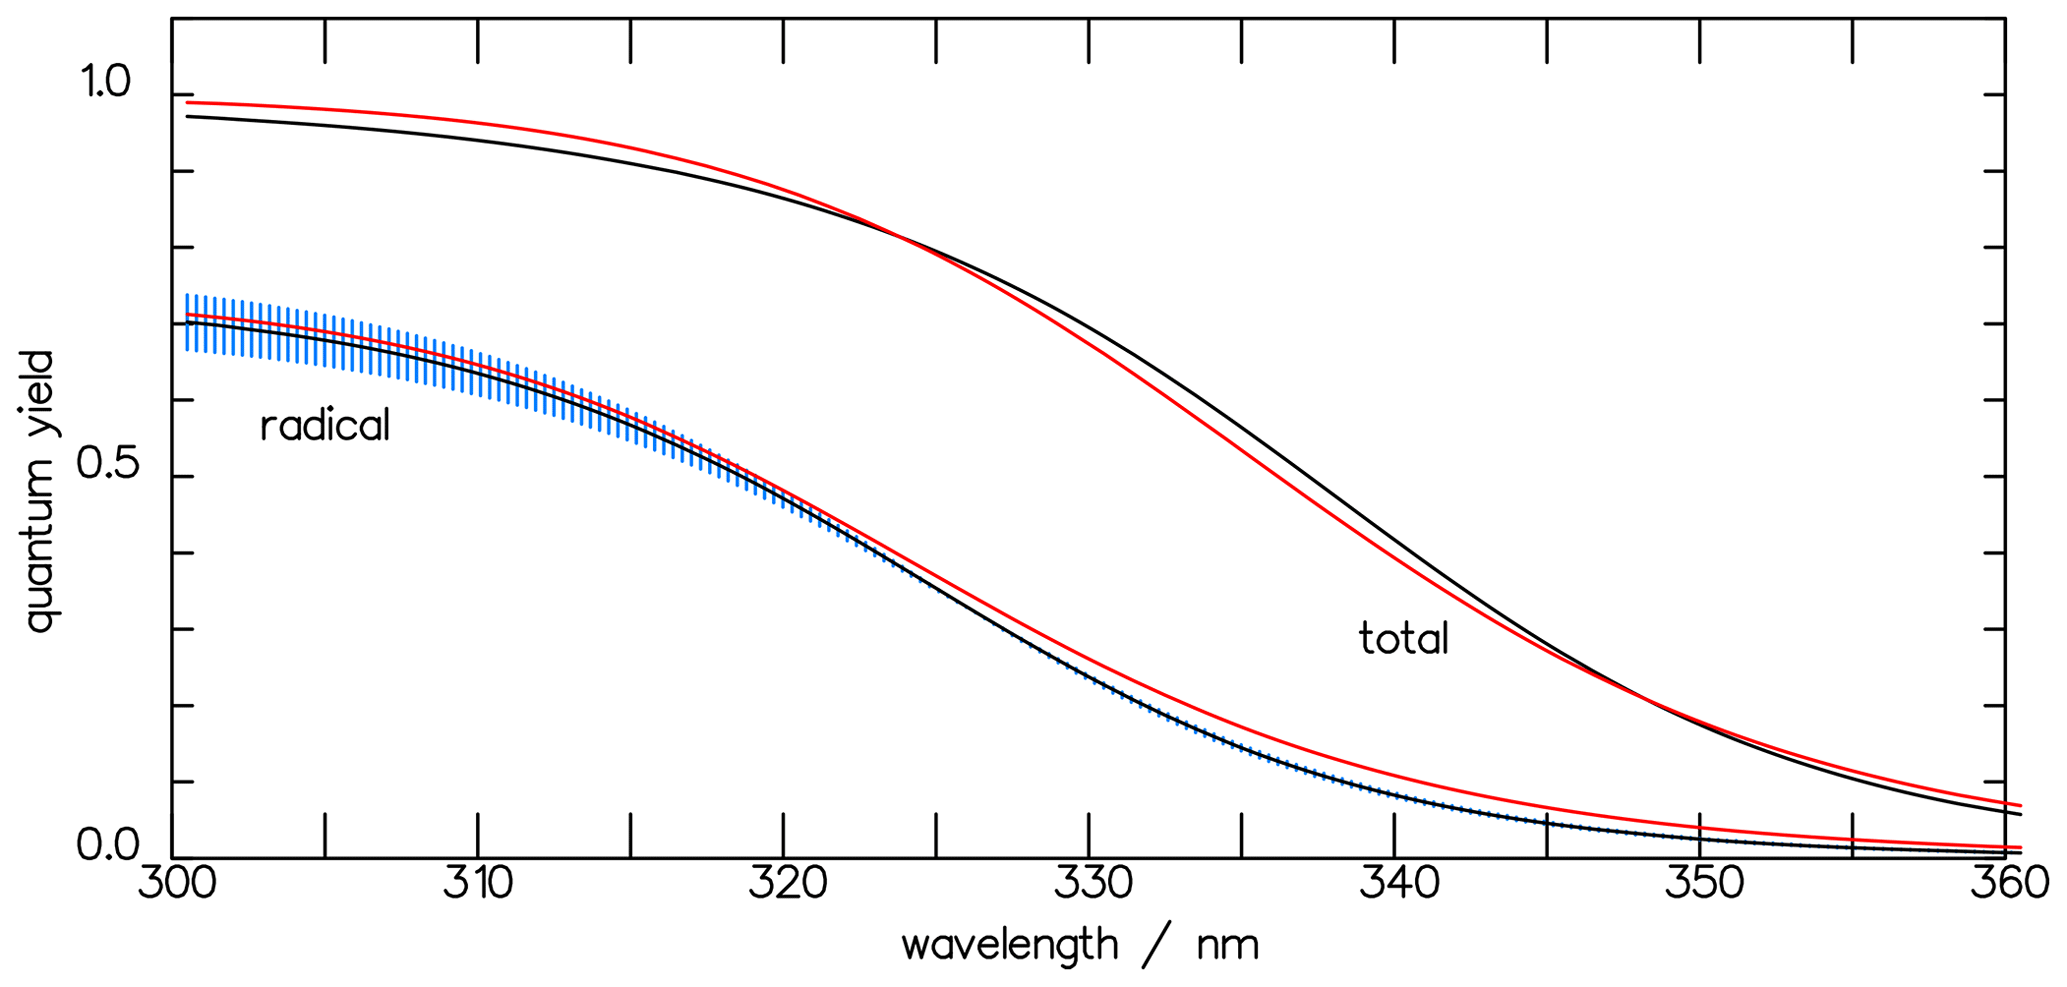
Figure 5The total quantum yields Φtot of the photolysis of CHDO and that of the radical channel Φrad, calculated with the three-term functions of Eqs. (7) and (10) (black curves). The blue-shaded area indicates the variation in parameter a within the interval [0.70, 0.78]. The red curves, derived using the one-term approximation (Eq. 11), and the black curves fall within the variance of each other.
With these parameters, the KIE of 1.63 as measured by Röckmann et al. (2010) was fitted with the actinic flux density given by Röckmann et al. (2020) and the optical spectra by Gratien et al. (2007). The best fit gave a pivot wavelength λ0 of 327 nm. This value lies in the middle of the bond energies of 362.63 kJ mol−1 for C–H and 369.6 kJ mol−1 for C–D, calculated by Chuang et al. (1987). With the constants Φmax=0.74, a=1, nm−1, and nm, the quantum-yield function Φrad of the radical channel of CHDO is analogous to Eq. (7):
where the radical quantum yields of the individual channels are given by Eq. (9) and with α and β as defined in Eq. (3). Figure 5 depicts the wavelength dependence of the total quantum yield together with that for the radicals. At atmospheric pressures, as considered in this paper, the contributions of the individual quenching processes are insignificant with respect to the overall radical quantum yield.
To provide a more handy tool for atmospheric modeling, we introduce an exponential function (Eq. 11), with only one term and three parameters for the total and the radical quantum yields of CHDO, similar to those deduced by Ehhalt and Röth (2015) for CH2O, as a proxy for the three-term functions (Eqs. 7 and 10):
The corresponding parameters for the total quantum yield of CHDO are a=1.0, s−1, and λ0=336.2 nm. For the radical channel, the factor is set to 1 as the photolysis leading to the radicals is nearly pressure independent. The respective parameters are a=0.74, s−1, and λ0=325.0 nm. Both approximation curves are depicted in Fig. 5, and Fig. 6 shows the pressure-dependent comparison with the measured data by Miller and Lee (1978).
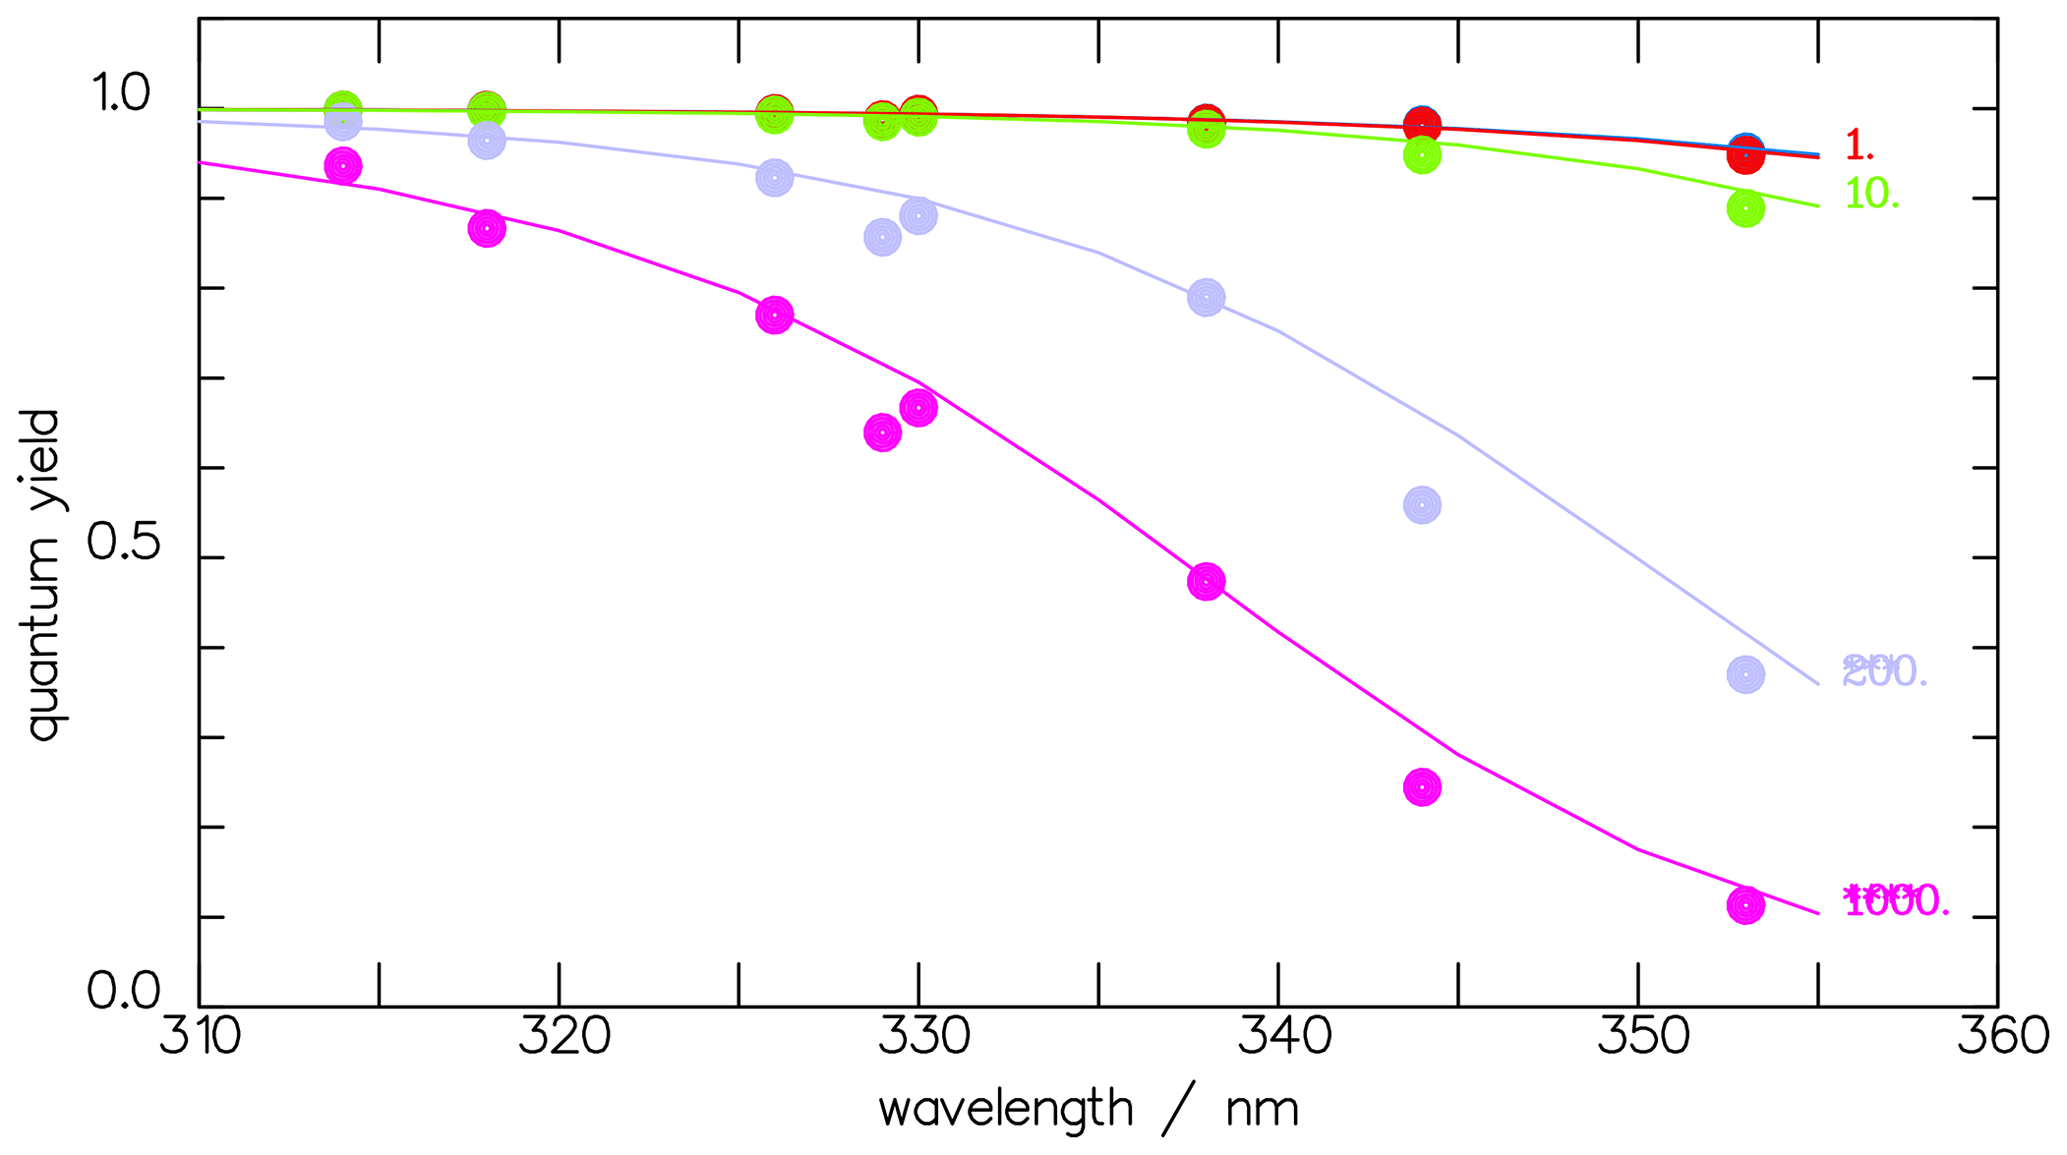
Figure 6Comparison of the one-term fit function (Eq. 11) (open circles on the solid line) with the measured data (Miller and Lee, 1978) of the total photolytic quantum yields Φtot (full circles) at 1, 10, 200, and 1000 hPa.
Our second approach to estimate the quantum yields for the photolysis of CHDO is based on the experiments of McQuigg and Calvert (1969), who measured the photo-decomposition of CH2O, CHDO, and CD2O. Unfortunately, the authors only presented the quantum yields for the two radical reaction channels of CH2O and CD2O. They further assumed that the total quantum yield equals 1, independent of wavelength. It appears, however, that these data have a bias which becomes evident when the data for CH2O are compared to more recent measurements.
In Fig. 7, the dependence on the wavelength of Φrad of CH2O by McQuigg and Calvert (1969) is depicted together with a curve for CH2O, averaged over measured data from the paper by Röth and Ehhalt (2015). The latter evaluation showed no pressure dependence but indicated a weak temperature effect which is neglected here. The curve is represented by the following function:
Equation (12) exhibits a maximum in Φrad around 310 nm, independent of the small temperature shift, whereas the earlier values of McQuigg and Calvert (1969) exhibit a monotonic decay with increasing wavelength above 280 nm, which points to a bias in the latter. The second summand in Eq. (12) is less than 1 % at wavelengths above 300 nm and, hence, can be omitted in the present paper. Figure 7 also includes the data of McQuigg and Calvert (1969) for CD2O, which show a quite similar wavelength dependency to the data for CH2O.
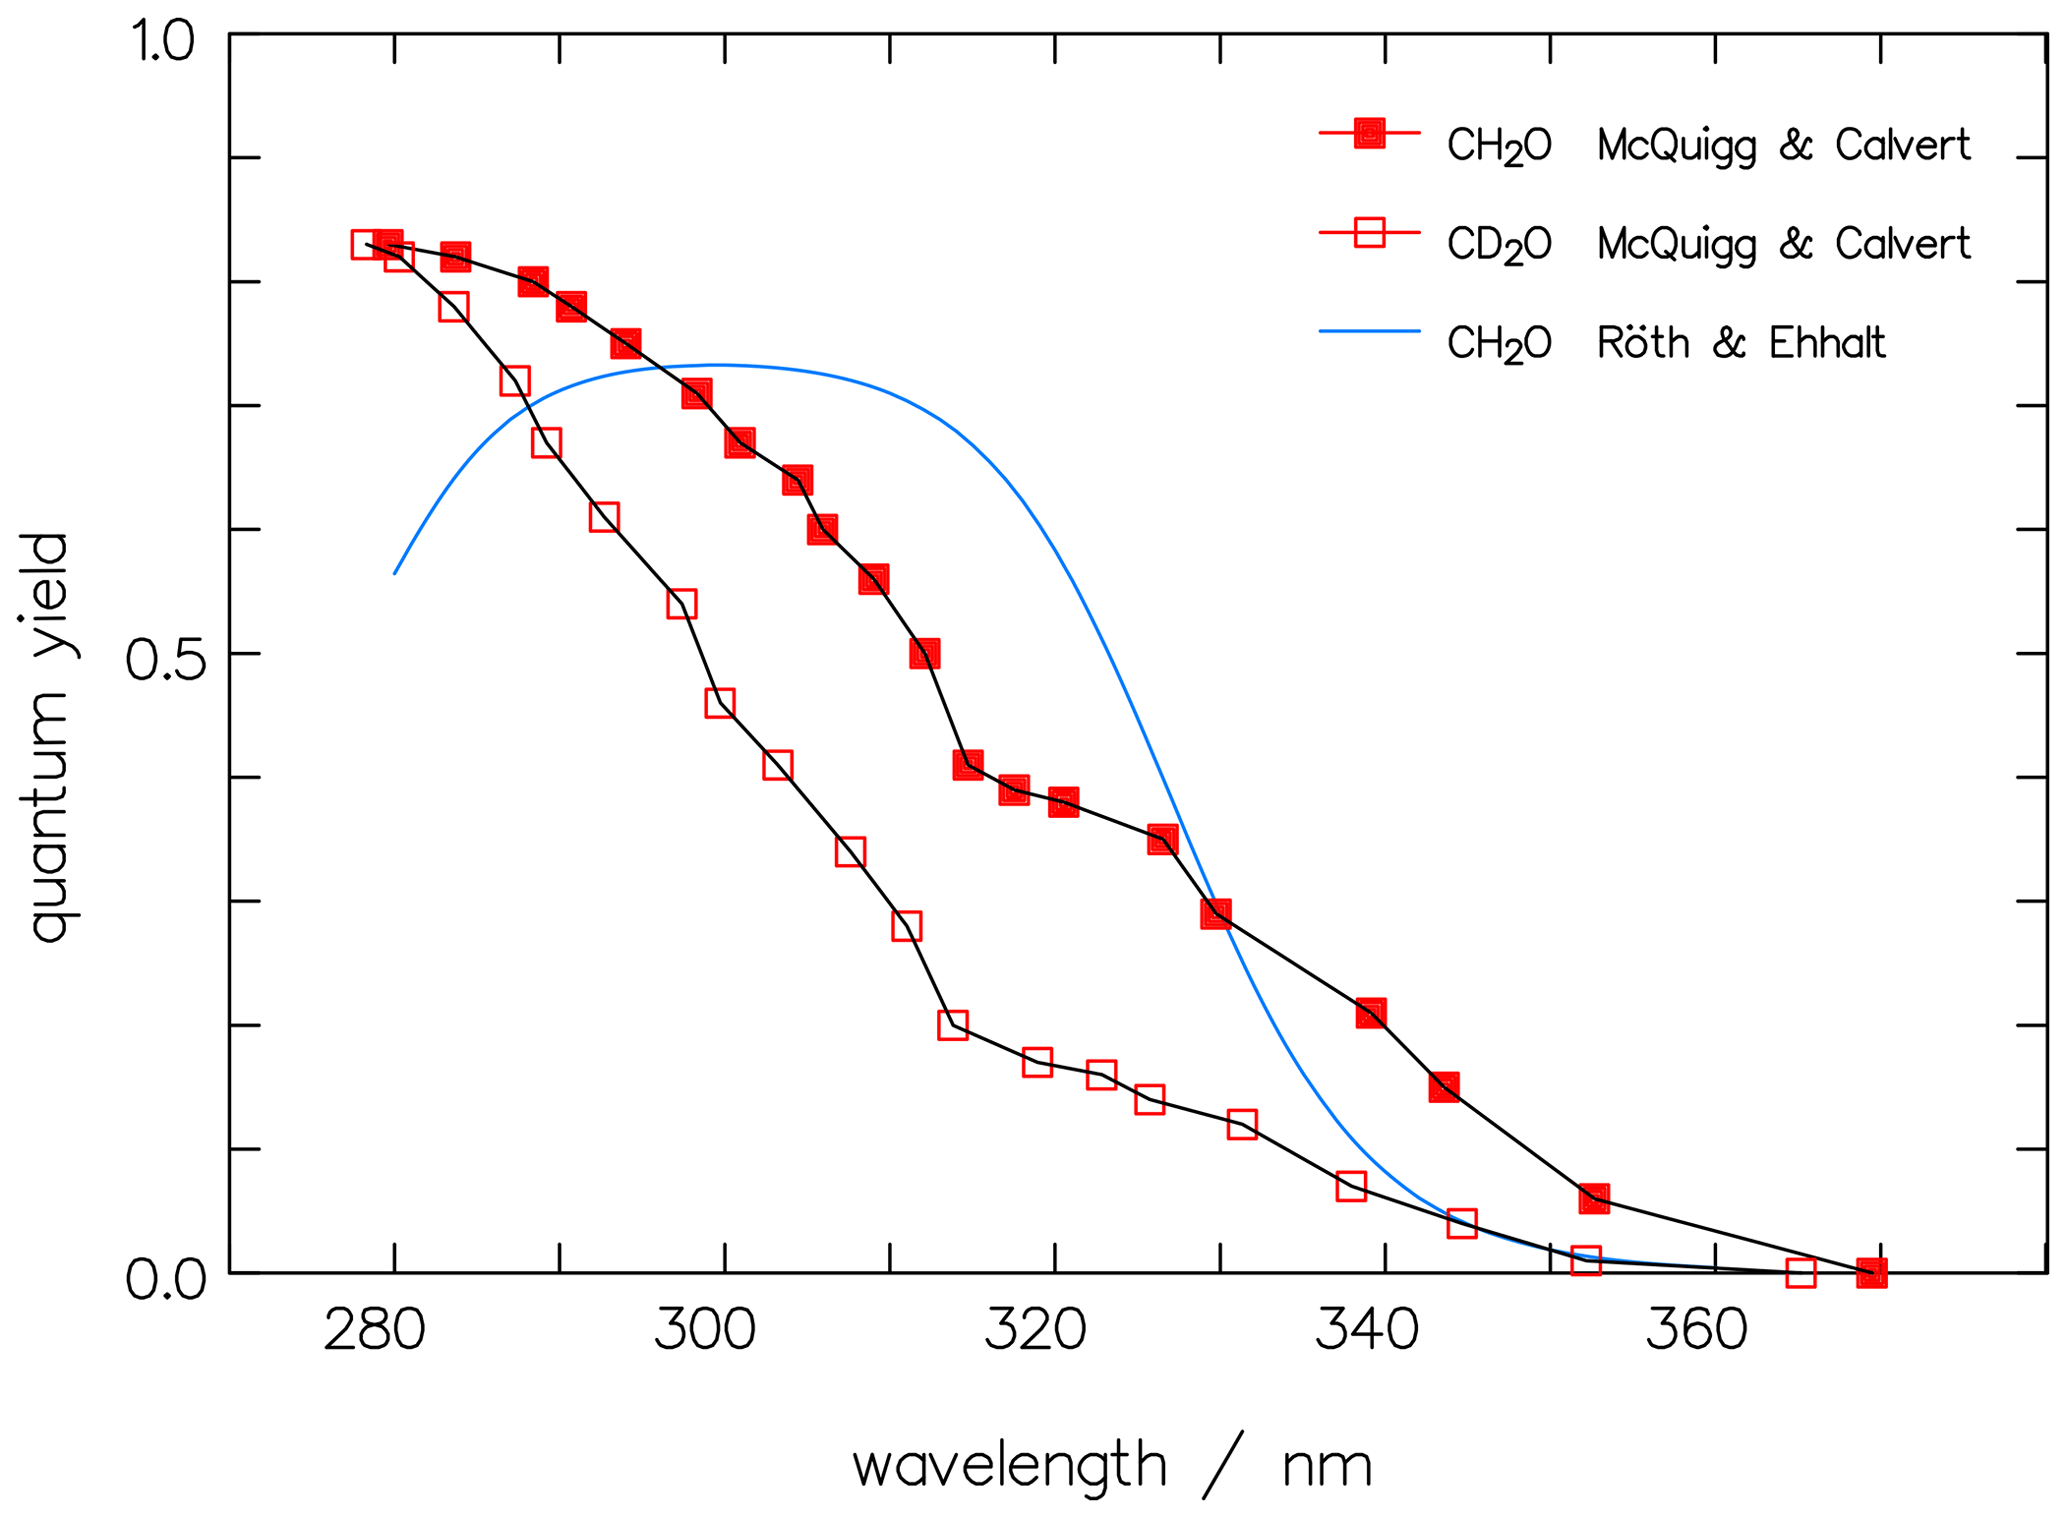
Figure 7The original data of McQuigg and Calvert (1969) for CH2O (full red squares) and CD2O (open squares) for the photolytic quantum yields of the radical channel are compared to the averaged function for CH2O by Röth and Ehhalt (2015).
Our first assumption is that the bias in the experiments of McQuigg and Calvert (1969) extends equally to both isotopologues (CD2O and CH2O) and that, therefore, the ratio R of their quantum yields is correct. This ratio is displayed in Fig. 8 and shows a mostly monotonic decrease with increasing wavelength. In this context, it is interesting to note that the ratio of the rate constants for the decomposition of excited CH2O∗ and CD2O∗ into the respective radical channels, as calculated by Troe (1984) from theory, results in a curve with a monotonic decrease with increasing wavelength similar to that of the quantum-yield ratio (see Fig. 8).
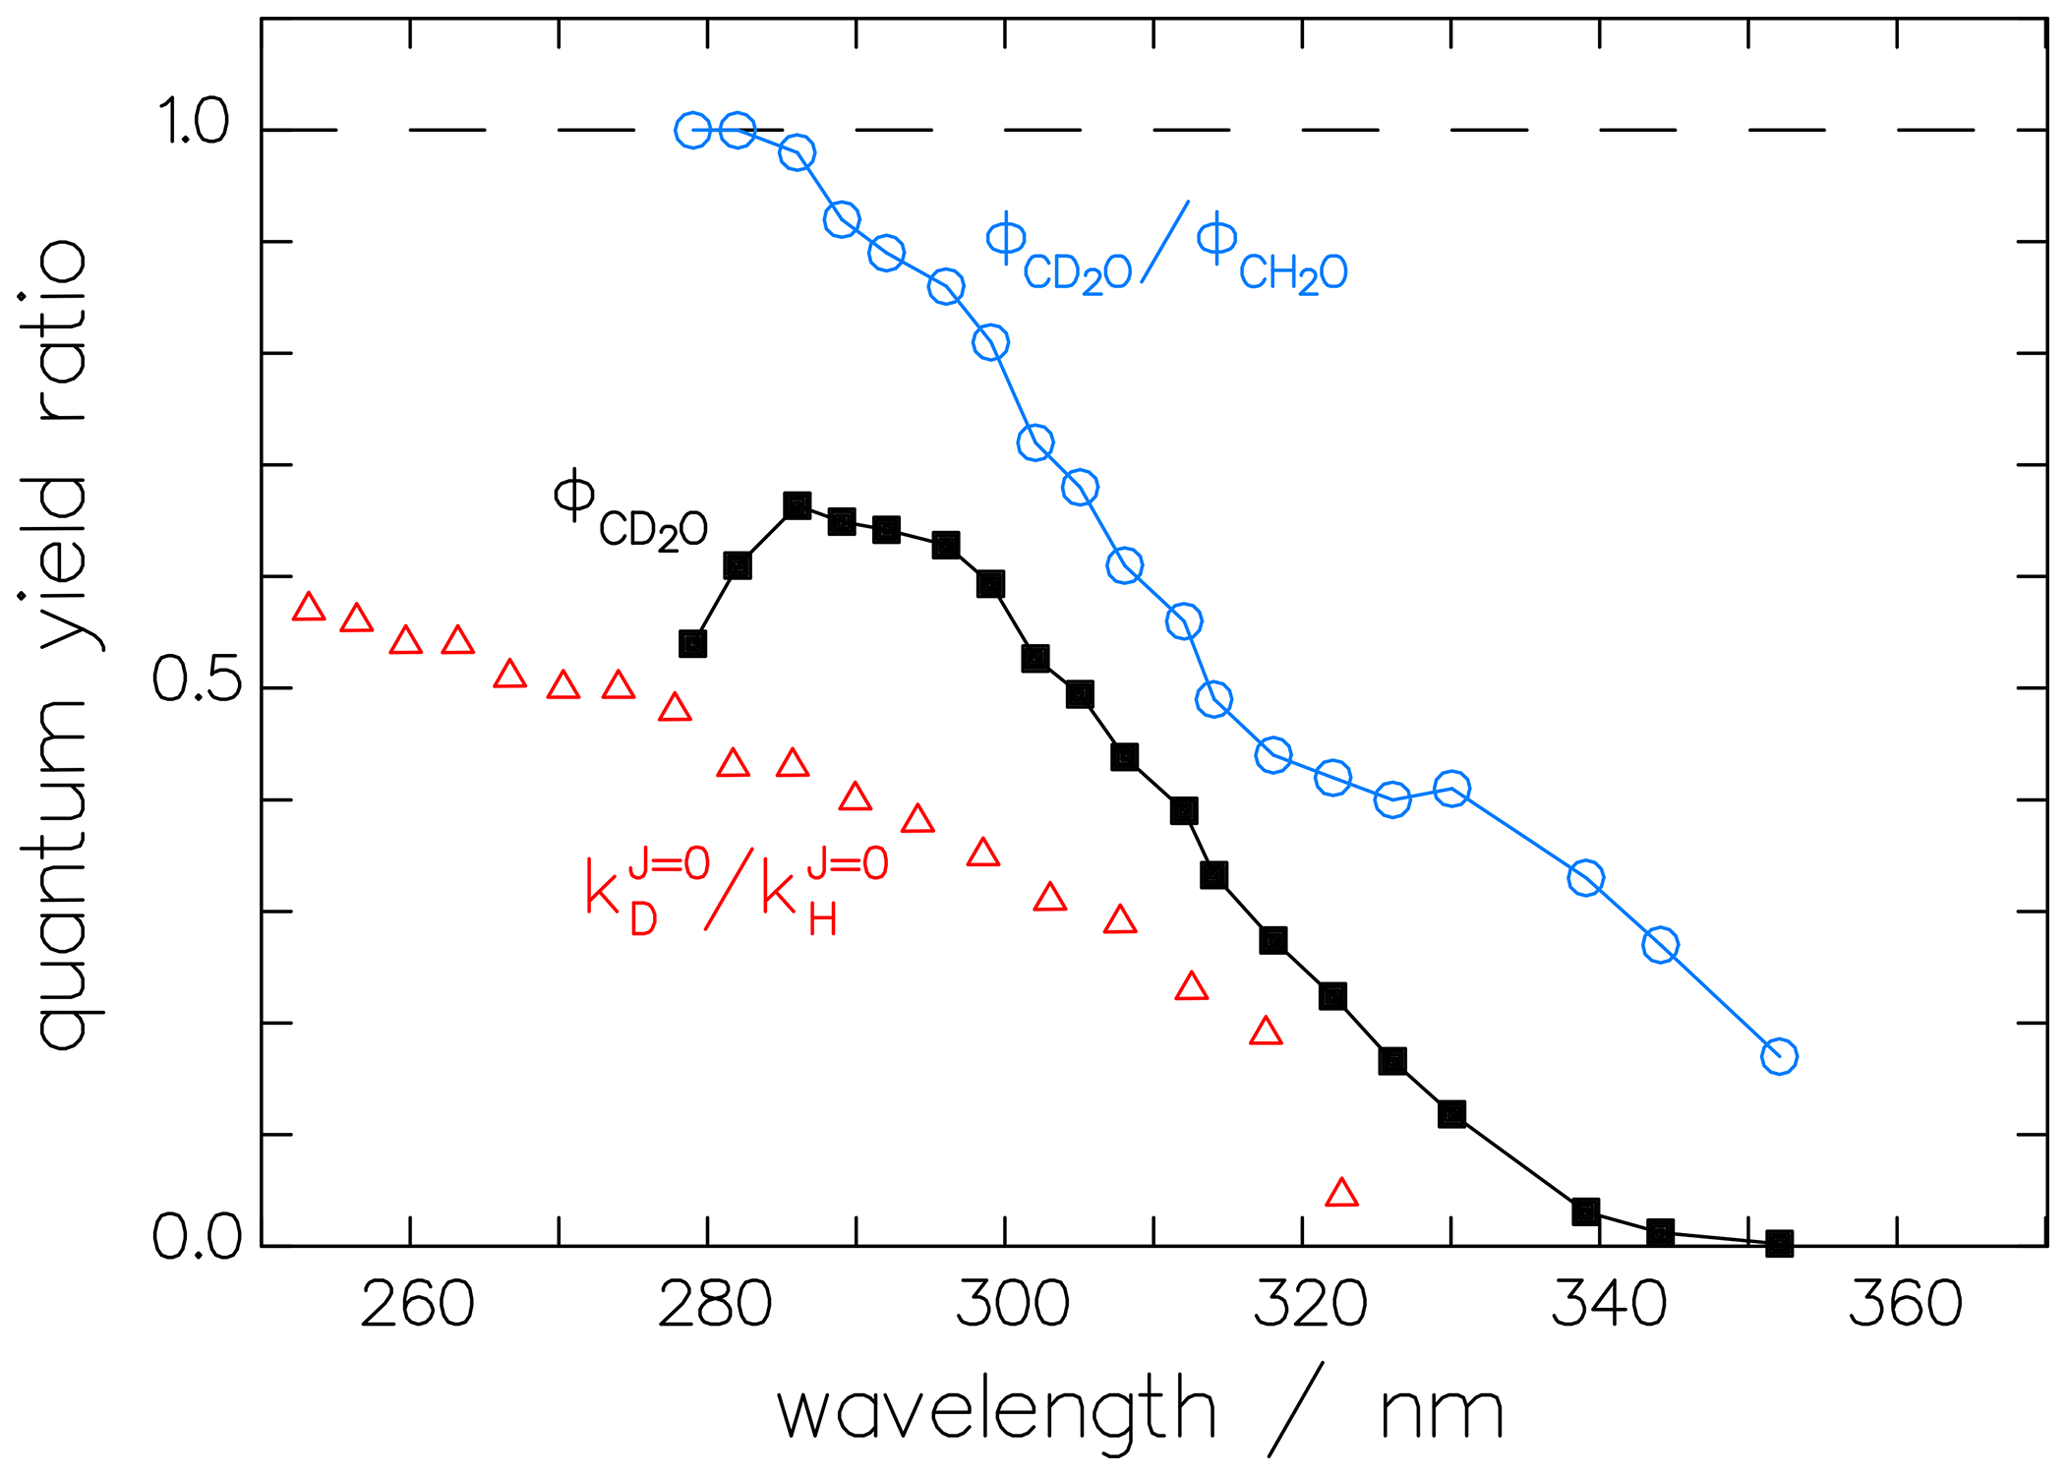
Figure 8The ratio of the McQuigg and Calvert (1969) data shown in Fig. 7 and the corrected radical quantum yield of CD2O, (black squares). The ratio of the respective reaction constants (triangles) derived theoretically by Troe (1984) shows the same tendency as the quantum-yield ratio.
Using ratio R together with the fit function (Eq. 12) for allows us to estimate for the radical channel of CD2O, as shown in Fig. 8.
To calculate , we need one further assumption. Our hypothesis is suggested by the results of Feilberg et al. (2004), who found that the KIEs of the reactions of CHDO with OH, Cl, and Br are arithmetic means of the KIE of the reactions of CH2O and CD2O with those radicals. This, in turn, implies that the C–H bond strengths are similar in the isotopologues, and the same is true for the C–D bond strength. We, therefore, assume that can be calculated from the average of and at each wavelength:
The resulting radical quantum yields are compared in Fig. 9. does not depend on pressure since neither nor is pressure dependent. The respective maxima in Φrad, on the other hand, decrease from 0.72 over 0.70 to 0.65 for increasing deuteration. Moreover, there is a blue shift of 5 nm to 10 nm in the decreasing part of the quantum-yield spectra of CHDO and CD2O, i.e., at wavelengths above 315 nm. These blue shifts have the same tendency but do not quite match the measured threshold energies of 362.3, 368.4, and 370.6 kJ mol−1 for CH2O, CHDO, and CD2O, respectively (Chuang et al., 1987), which correspond to the wavelengths 330.9, 325.5, and 323.5 nm.

Figure 9Wavelength dependency of the quantum yields Φrad for the radical channel of the three isotopologues of formaldehyde. The curves for CH2O (Röth and Ehhalt, 2015) and that for CD2O (corrected data of McQuigg and Calvert, 1969) are used to calculate the quantum yield of CHDO (black dots) according to their mean values. is then fitted by the one-term function (Eq. 14) (black line).
The one-term fit function for the radical channel of CHDO is
and it is also shown in Fig. 9. In Fig. 10 the result of the interpretation of the measured photo-decomposition of CHDO by McQuigg and Calvert (1969) is compared to the radical quantum yield deduced from the fluorescence measurements of Miller and Lee (1978). Both estimations lead to a wavelength dependence of , which lies in both uncertainty ranges. This is a strong hint that the deduced results are robust and represent the true quantum yield of the radical channel of the photolysis of CHDO.
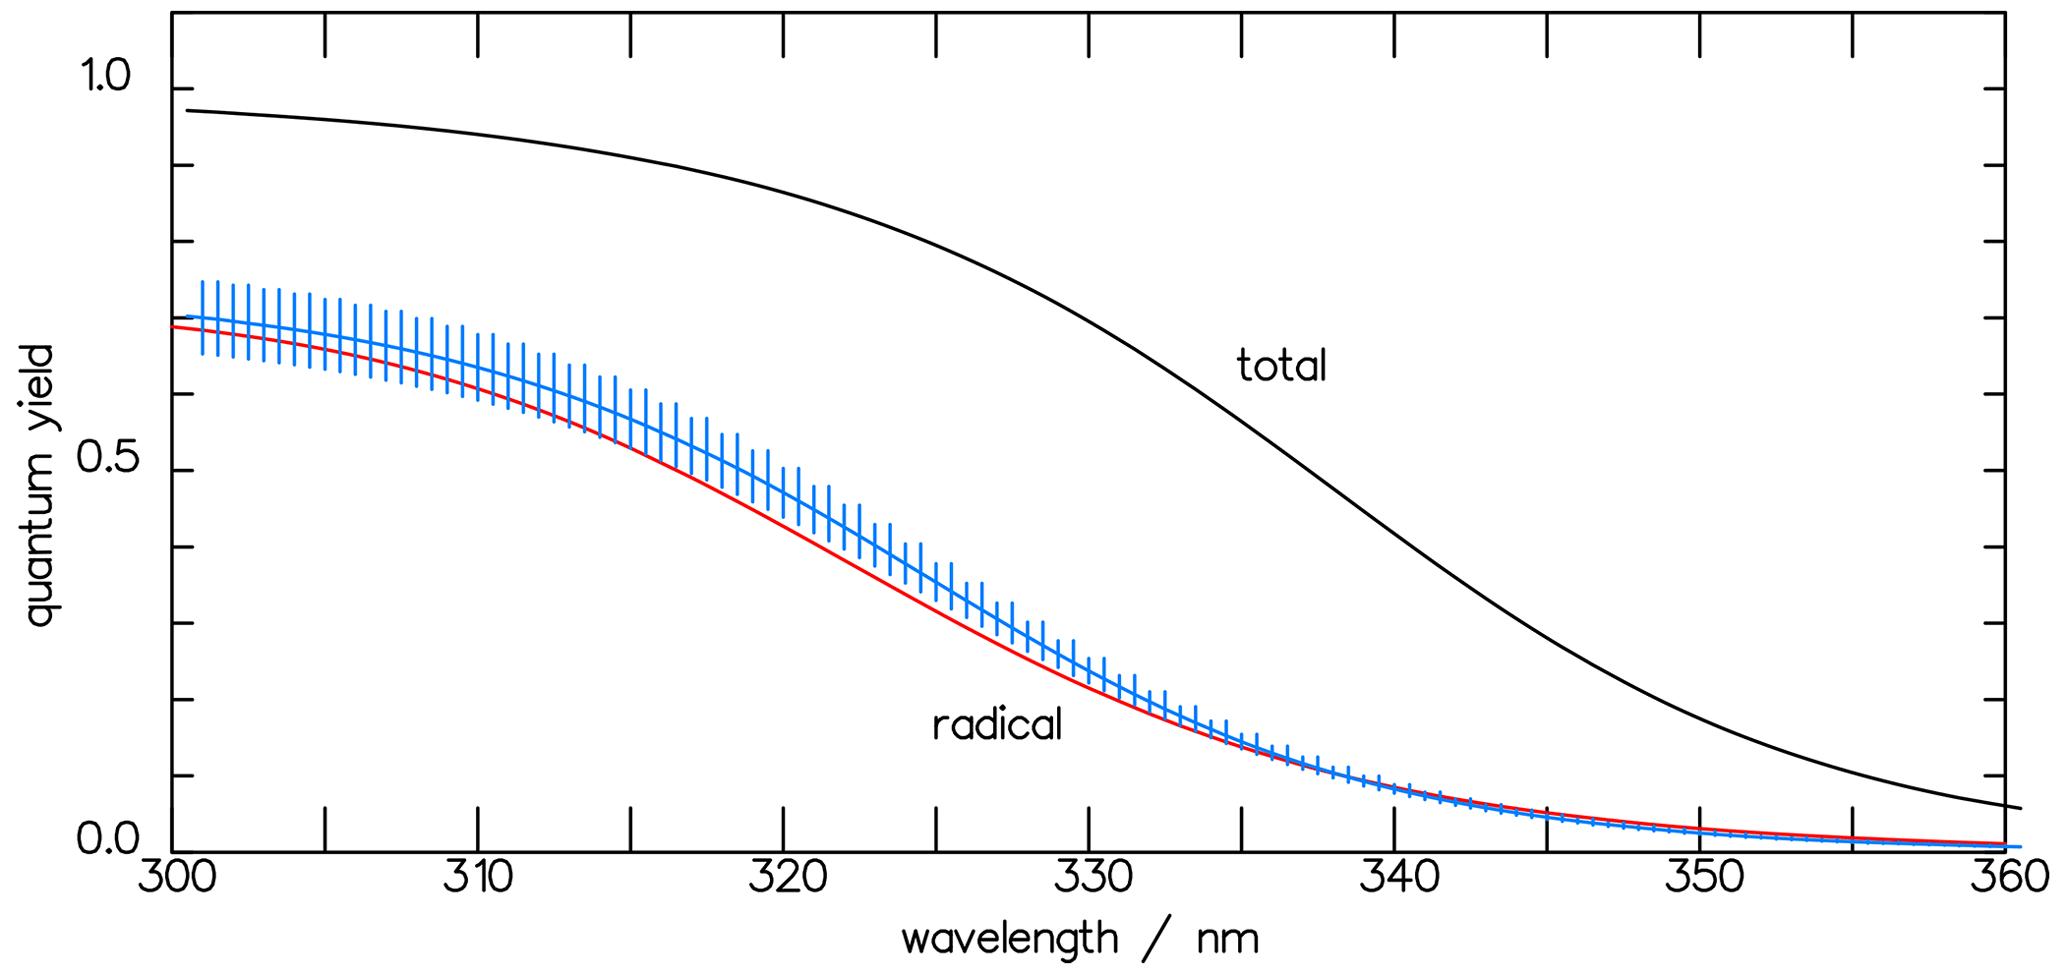
Figure 10The CHDO quantum yield fit function deduced from the fluorescence measurements (blue line, Eq. 11) of Miller and Lee (1978) and that from the interpretation of the photo-decomposition (red line, Eq. 14) measurements of McQuigg and Calvert (1969). These lie within each other's uncertainty ranges. Also depicted is the function for the total quantum yield Φtot (Eq. 11).
The photolysis frequency Ji of the isotopologues CH2O and CHDO is given by the integration of quantum yield Φ, absorption cross-section σ, and spectral actinic photon flux density Fλ(λ) over the λ wavelength domain:
where the quantum yield Φi,j(λ) depends on the product channel j, either molecular or radical, of isotopologue i, and the absorption cross-section σi(λ) is specific to the isotopologues i. For our calculations, the absorption spectra of CH2O and CHDO from Gratien et al. (2007) were applied. We used these values instead of the JPL recommendation (Burkholder et al., 2019) for consistency with the calculations in Sects. 2 and 3. The solar spectral actinic flux density Fλ was calculated from a quasi-spherical 1-D radiation transfer model (Röth, 2002); the Φ(λ) values are those from Sect. 2. An example of the terms Φmol(λ), σ(λ), and Fλ(λ) for the molecular channel of CHDO is given in Fig. 11 for the pressure and temperature at an altitude of 20 km. The product of these terms, integrated over 5 nm intervals for better visibility, is also displayed to demonstrate the spectrally resolved contributions to the photolysis frequency of the molecular channel of CHDO.
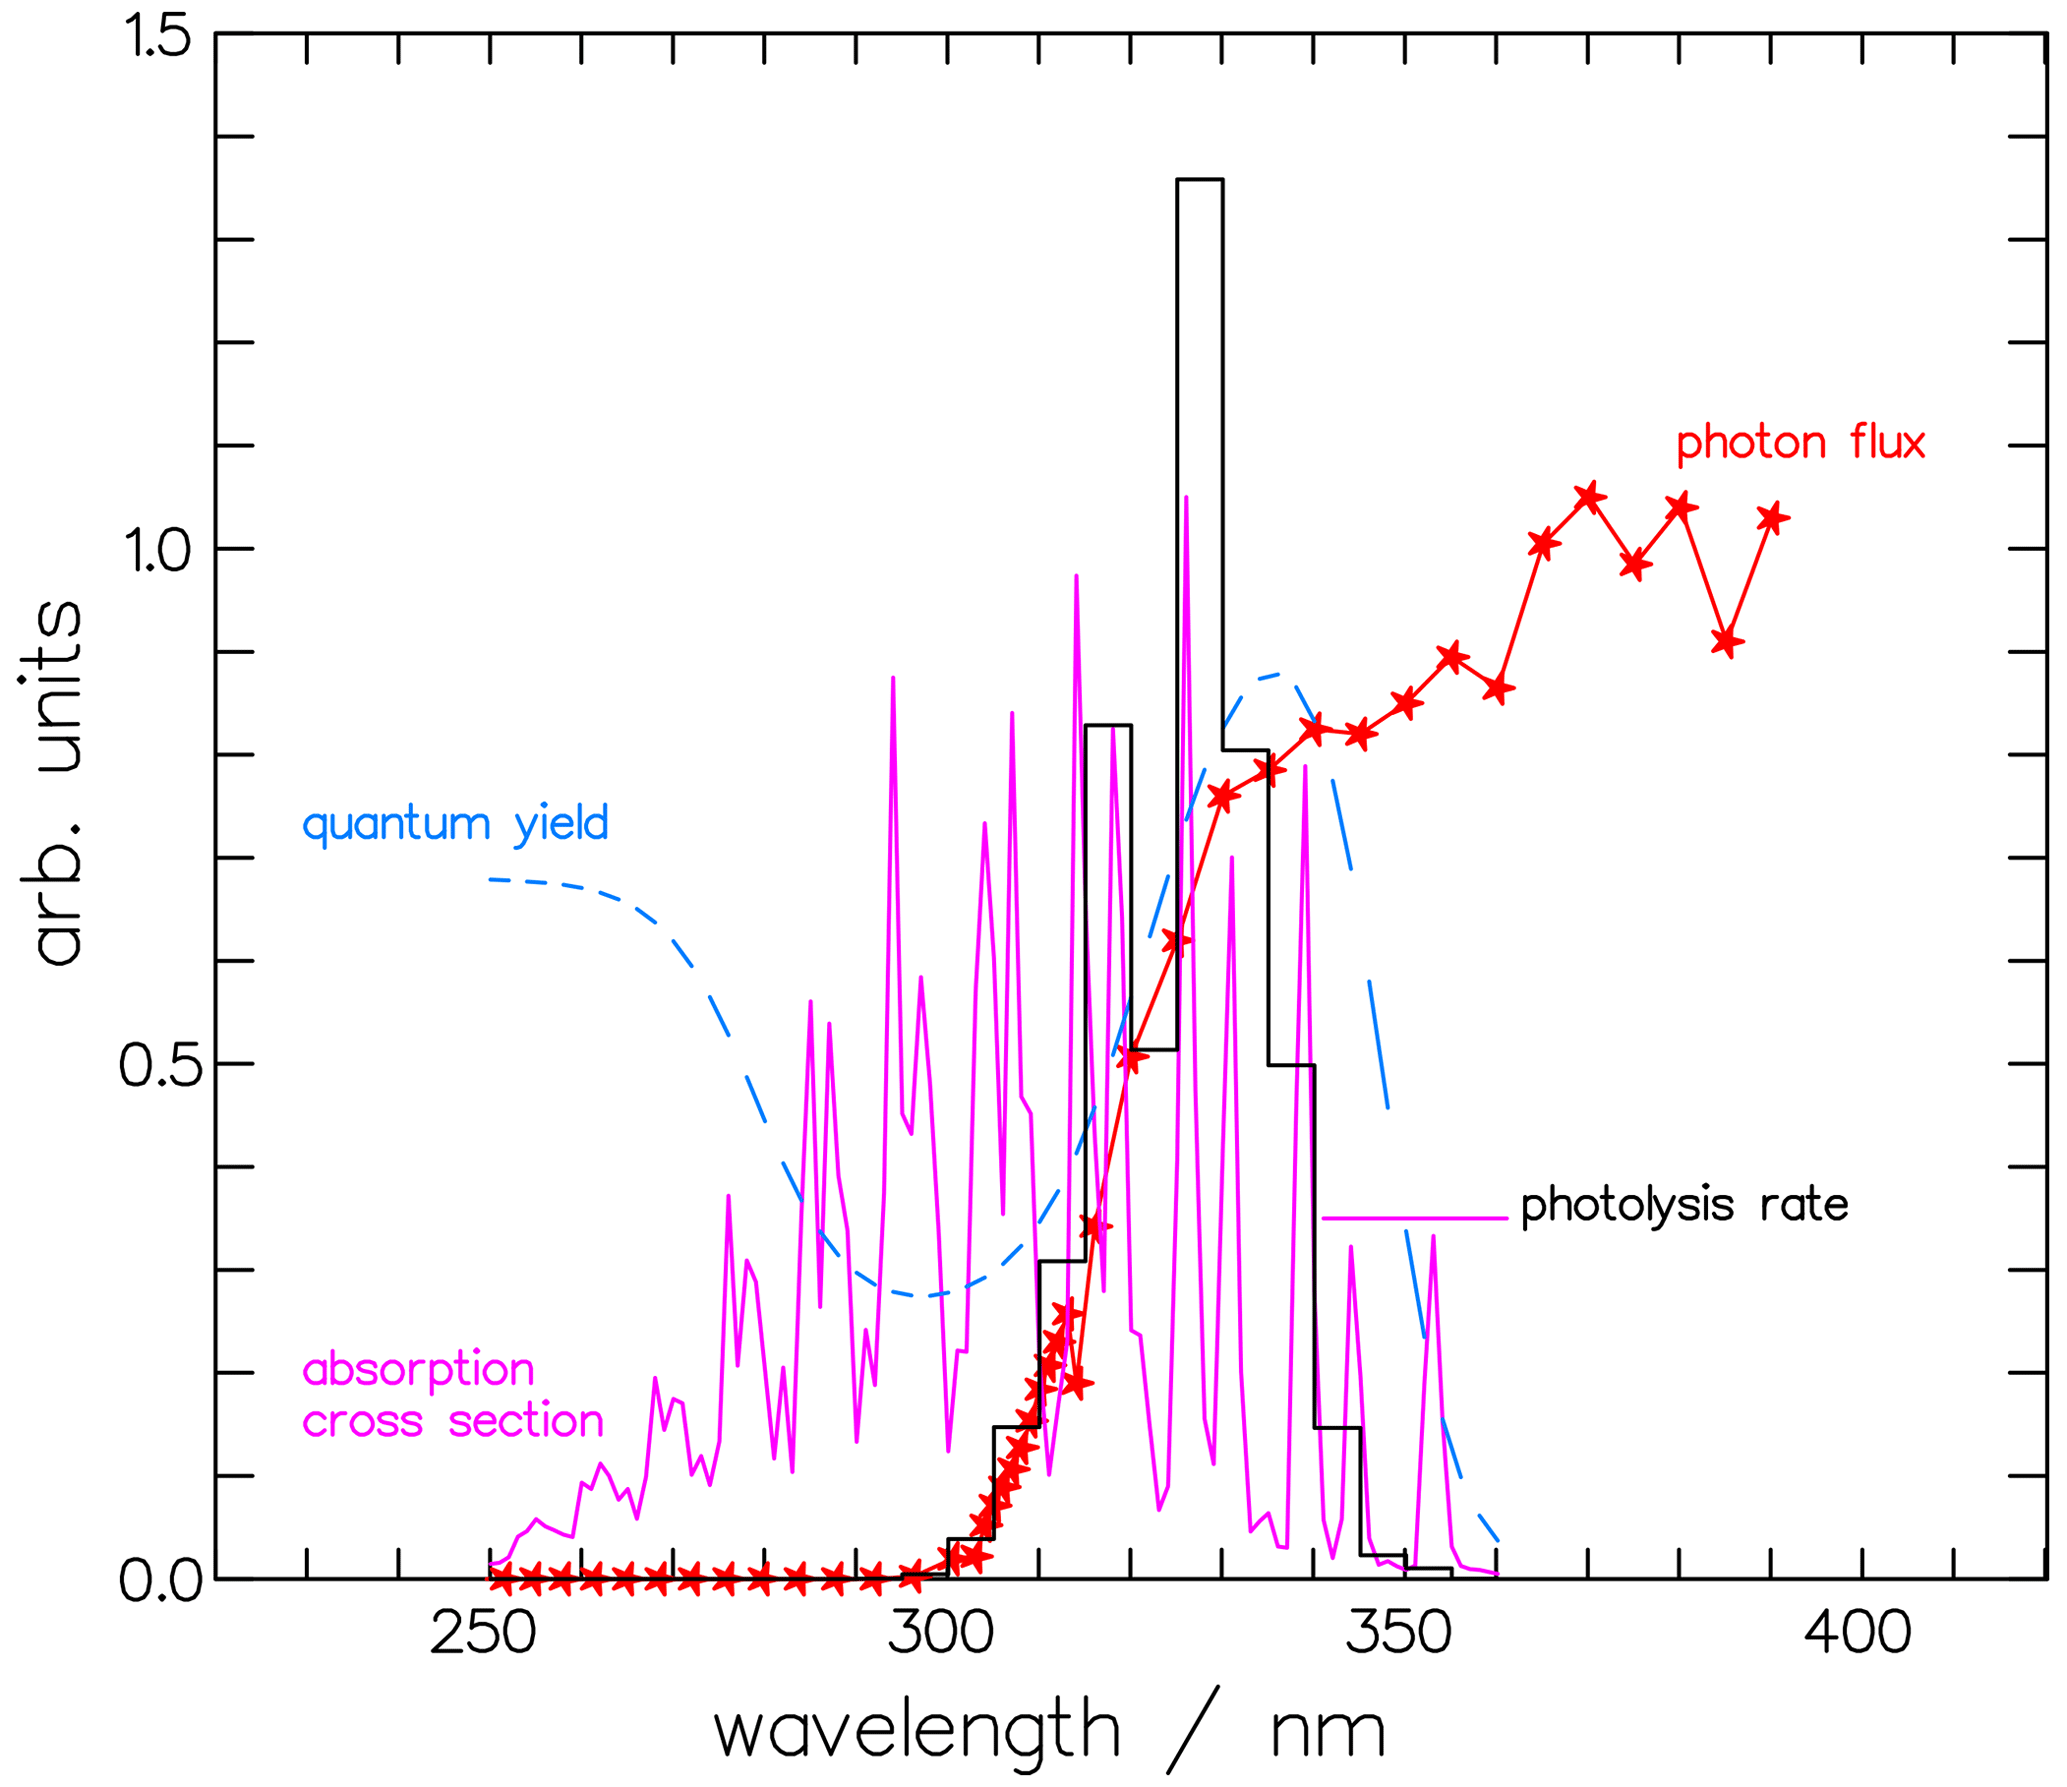
Figure 11The photolysis rate is the combination of the actinic photon flux, the absorption cross-section, and the quantum yield. Depicted are the contributions to the molecular channel of the photolysis rate of CHDO, , at 20 km altitude and integrated over 5 nm wavelength: the actinic photon flux Fλ(λ), the absorption cross-section σ(λ) (Gratien et al., 2007), and the quantum yield for the molecular channel Φmol(λ). The photolysis rate, the photon flux, and the cross-section are multiplied by 2.5×10⁵, , and 1.5×10¹⁹, respectively, to achieve comparability.
The kinetic isotope effect for the molecular channel is given by
and for the radical channel it is given by
For a quick overview, the dependence of KIErad and KIEmol on altitude for globally averaged conditions (equinox, 30° N) is depicted in Fig. 12a and b. KIEmol decreases monotonically with decreasing pressure from 1.59 at 1000 hPa to 1.06 at 1 hPa. The radical channel, in contrast, shows hardly any pressure dependency as the rate of this reaction is not influenced by the quenching process. The marginal variation in the kinetic isotope effect with altitude is caused by the altitudinal increase in the photon flux and its differing contribution to the photolysis frequency integrals of CH2O and CHDO.
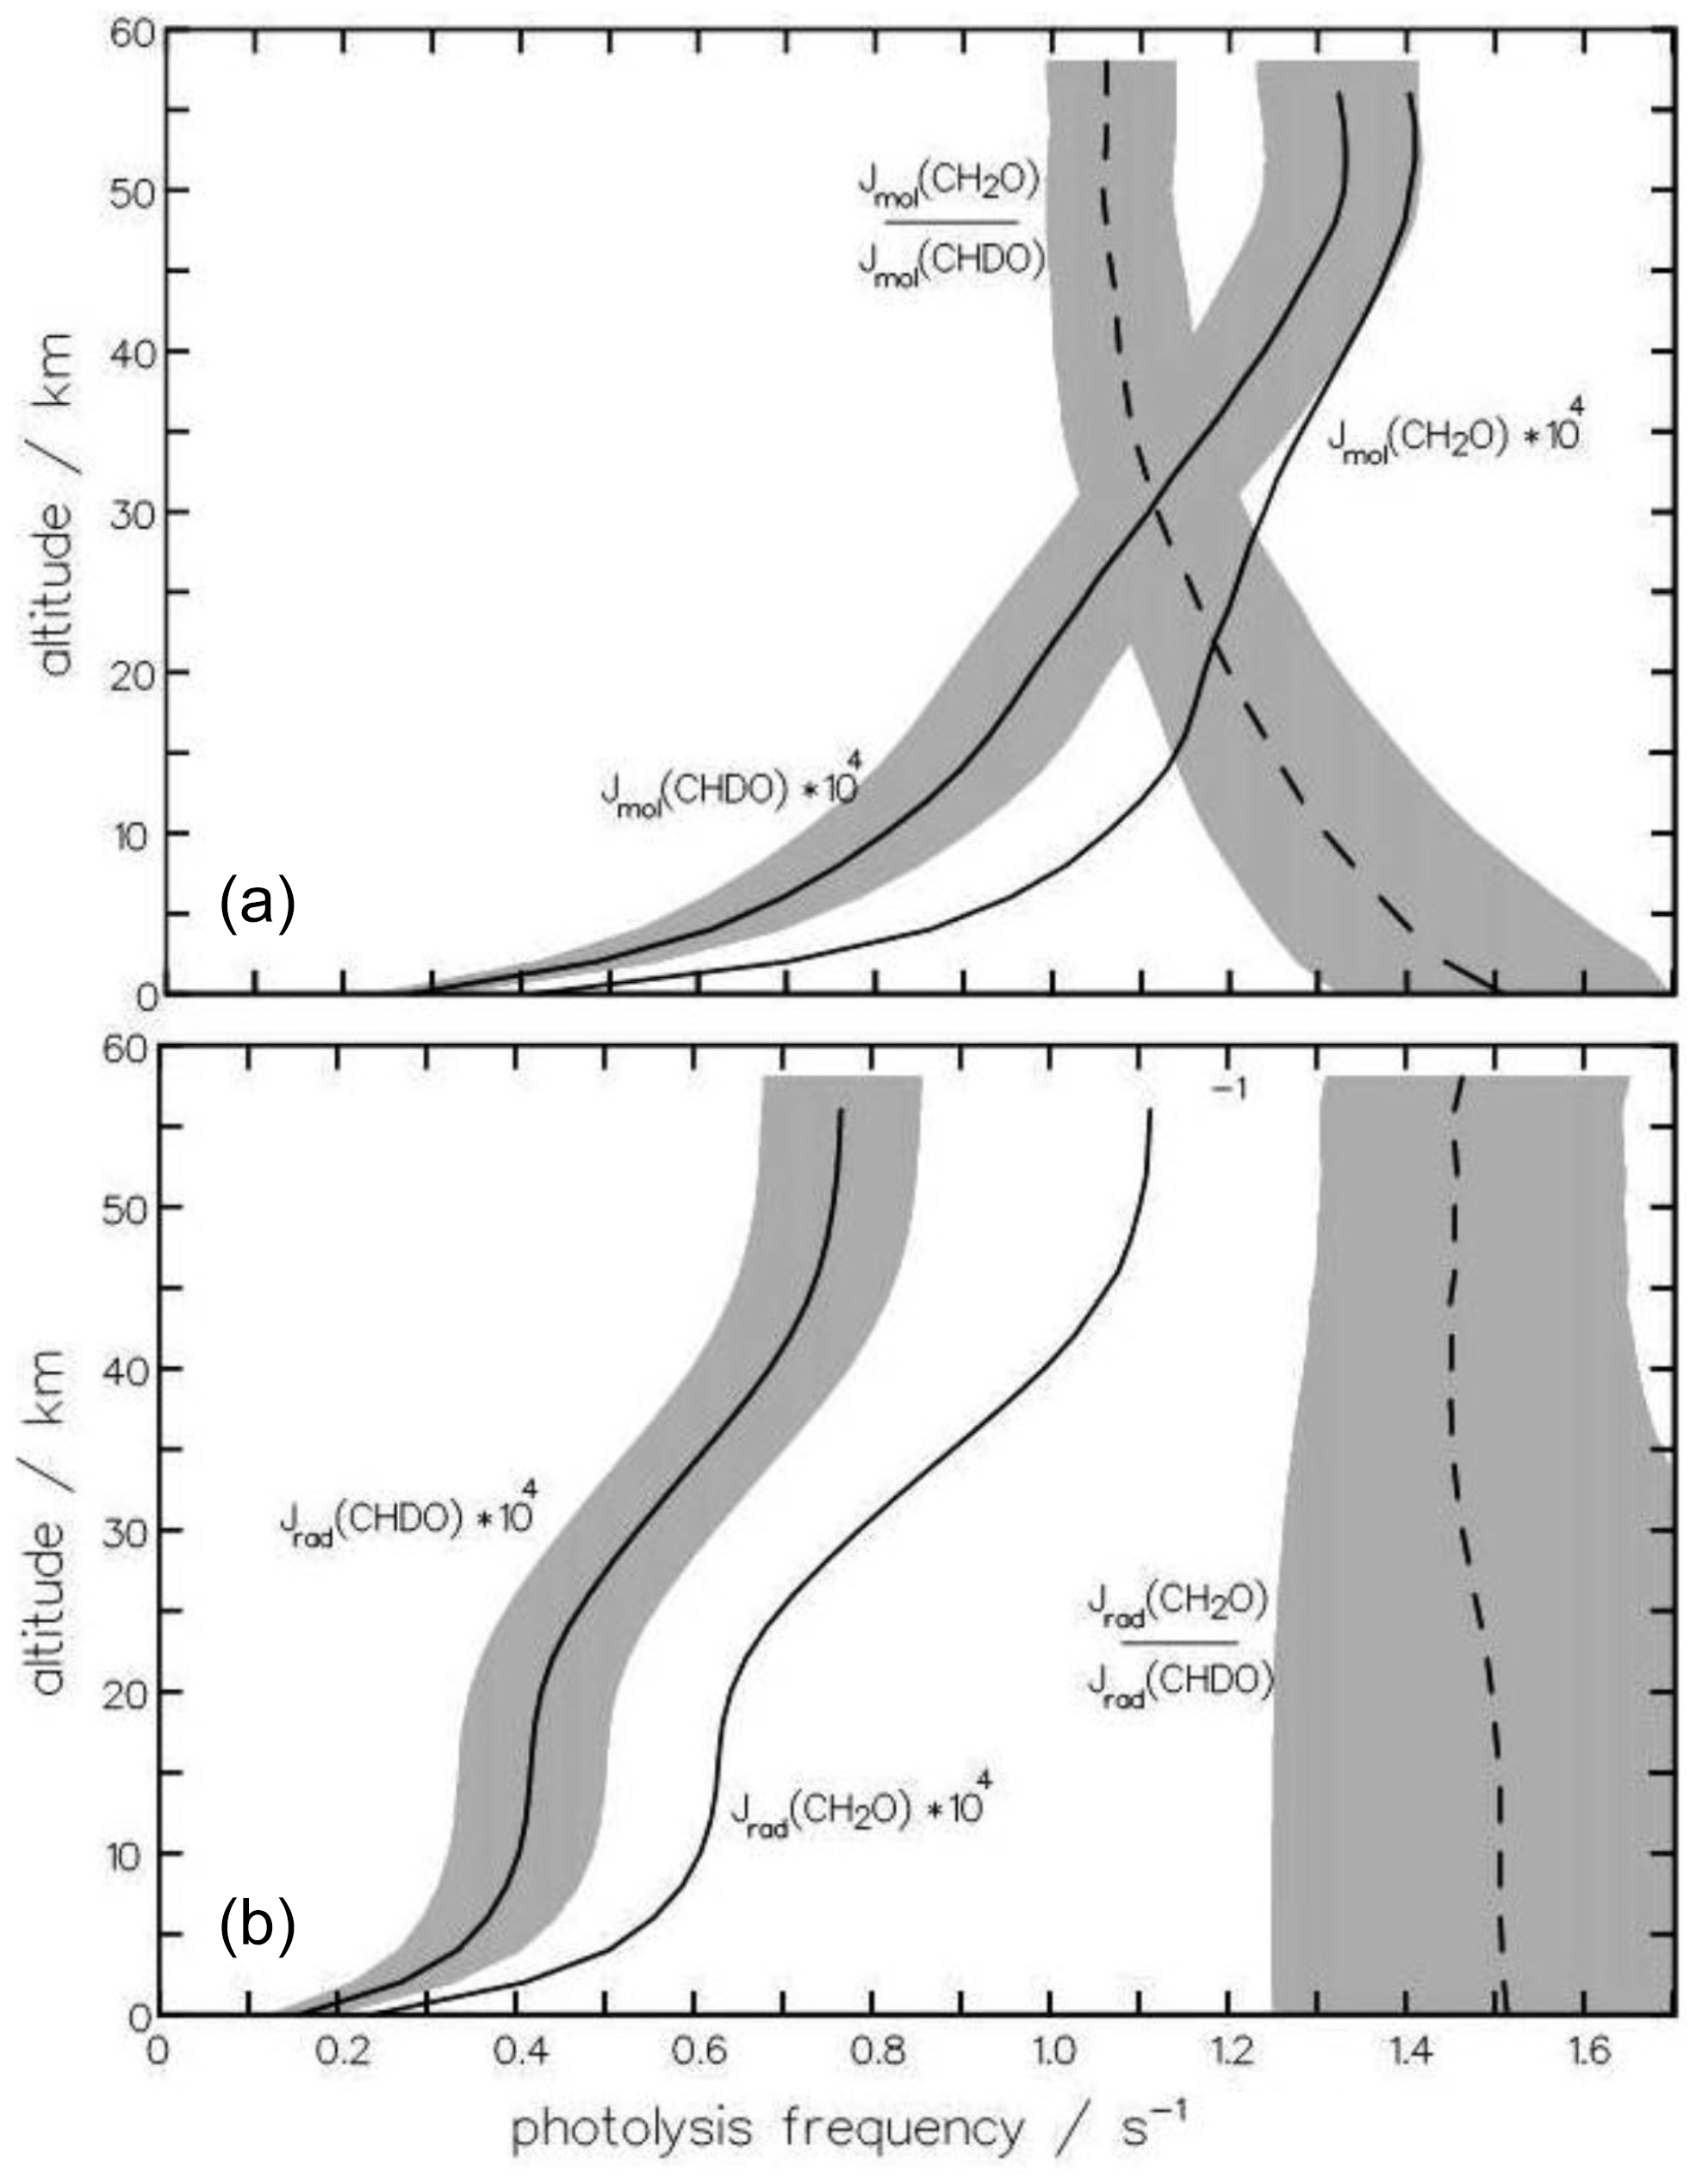
Figure 12The altitudinal dependence of the photolysis frequencies Jmol of the molecular channels (a) of CH2O and CHDO is important for the atmospheric production of HD. For comparison, the radical channels (b) are also depicted. The dependence on altitude of the kinetic isotope effect, , is more pronounced for the molecular channel than the radical channel. The shaded area indicates the variance upon changing (a) the quantum yield Φmol by 10 % and (b) the radical threshold wavelength by 3 nm.
To examine whether the quantum-yield functions for CHDO deduced above are applicable for modeling purposes, additional sensitivity studies were carried out, varying the main features of the quantum-yield functions. With respect to the fractionation factor, only the variations in those parameters are relevant, which alters the relation of the entirety of the photolysis frequency integrals (Eq. 15) of the molecular and radical channels. In Fig. 12a and b, we additionally show the variances of the photolysis frequencies, as well as of the fractionation factors. The shaded area is produced by varying one parameter of the CHDO quantum yield as indicated below. The photolysis frequency of CH2O remained unchanged.
The sensitivity of the molecular branch of the photolysis frequency of CHDO to the pre-exponential factor of the quantum-yield function is roughly 10 % throughout the atmosphere if this value is varied by 10 %. All other parameters do not alter the integral Eq. (15) significantly and only produce variances of less than 1 % when changed by 10 %. It can thus be concluded that the estimated equation parameters are good representations of the actual values. At higher altitudes (<10 hPa), and are close to unity in the wavelength regime 330 to 360 nm (see, e.g., Fig. 6). So the photolysis frequency in the stratosphere does not change much if the parameters of the respective functions are varied. Therefore, the variance in the fractionation factor does not decrease much above 30 km altitude. Here, measurements at tropospheric pressures could be much more informative, as becomes evident from Fig. 12.
The photolysis frequency of the radical channel of CHDO is only sensitive to the maximum of the quantum yield and to the threshold wavelength 323 nm. Shifting the latter value by ±3 nm produces changes of about 20 % in the troposphere, decreasing to 10 % at 50 km altitude, as shown in Fig. 12. This variation in the threshold produces an error bar of the fractionation factor of the same magnitude.
Due to consecutive reactions, only the molecular channel contributes to the HD production. Up to now, there has been a handicap in the interpretation of stratospheric measurements of the concentration of deuterated hydrogen HD due to the lack of exact knowledge of the photolysis frequencies of deuterated formaldehyde, resulting in an uncertainty in the fractionation factor. There have been a number of experimental approaches to deduce the fractionation factor, where, e.g., Feilberg et al. (2005) measured a value of 1.82 ± 0.07 for αmol, while Röckmann et al. (2010) found a value of 1.63 ± 0.03 for that ratio. In their modeling paper, Mar et al. (2007) varied the fractionation factor between 1.2 and 1.5 for stratospheric conditions.
In all these studies, the pressure dependence of the photolysis frequencies could not be investigated. An interesting experiment by Nilsson et al. (2009) addressed this problem. Unfortunately, the spectral radiance of the light source used did not resemble the sunlight well enough, and their findings could not be transferred to the real atmosphere without information on the quantum yield of CHDO.
Besides its pressure dependence, the variation in the photolytic fractionation factors can also be caused by different actinic fluxes at the times and sites of the experiments. The actinic fluxes in the numerator and denominator of the fractionation factor in Eqs. (16) and (17) do not cancel out, and, therefore, the factor is dependent on the local insolation conditions. Calculations of the solar-zenith-angle (SZA) dependency with the complex radiation transfer model ART (Röth, 2002) result in values from 1.47 at overhead sun to 1.95 at SZA=83° for clear sky and free horizon at ground level. This zenith angle dependency is less expressed at 20 km altitude and disappears at 50 km, as depicted in Fig. 13. This effect may explain the differences in the measurements of the fractionation factors. To check the variance with the solar zenith angle, the measured fractionation factor KIEm (Eq. 16) is compared to model calculations. The factor 1.63 ± 0.03 (Röckmann et al., 2010) was derived from experimental studies in the atmospheric simulation chamber SAPHIR between 60 and 70° SZA (Röckmann et al., 2010). The absorption cross-sections by Gratien et al. (2007) and the quantum yields derived above, together with the radiation spectra, result in a fractionation factor of 1.54 for 60° SZA and 1.70 for 70° SZA; these are in good agreement with the measured value.
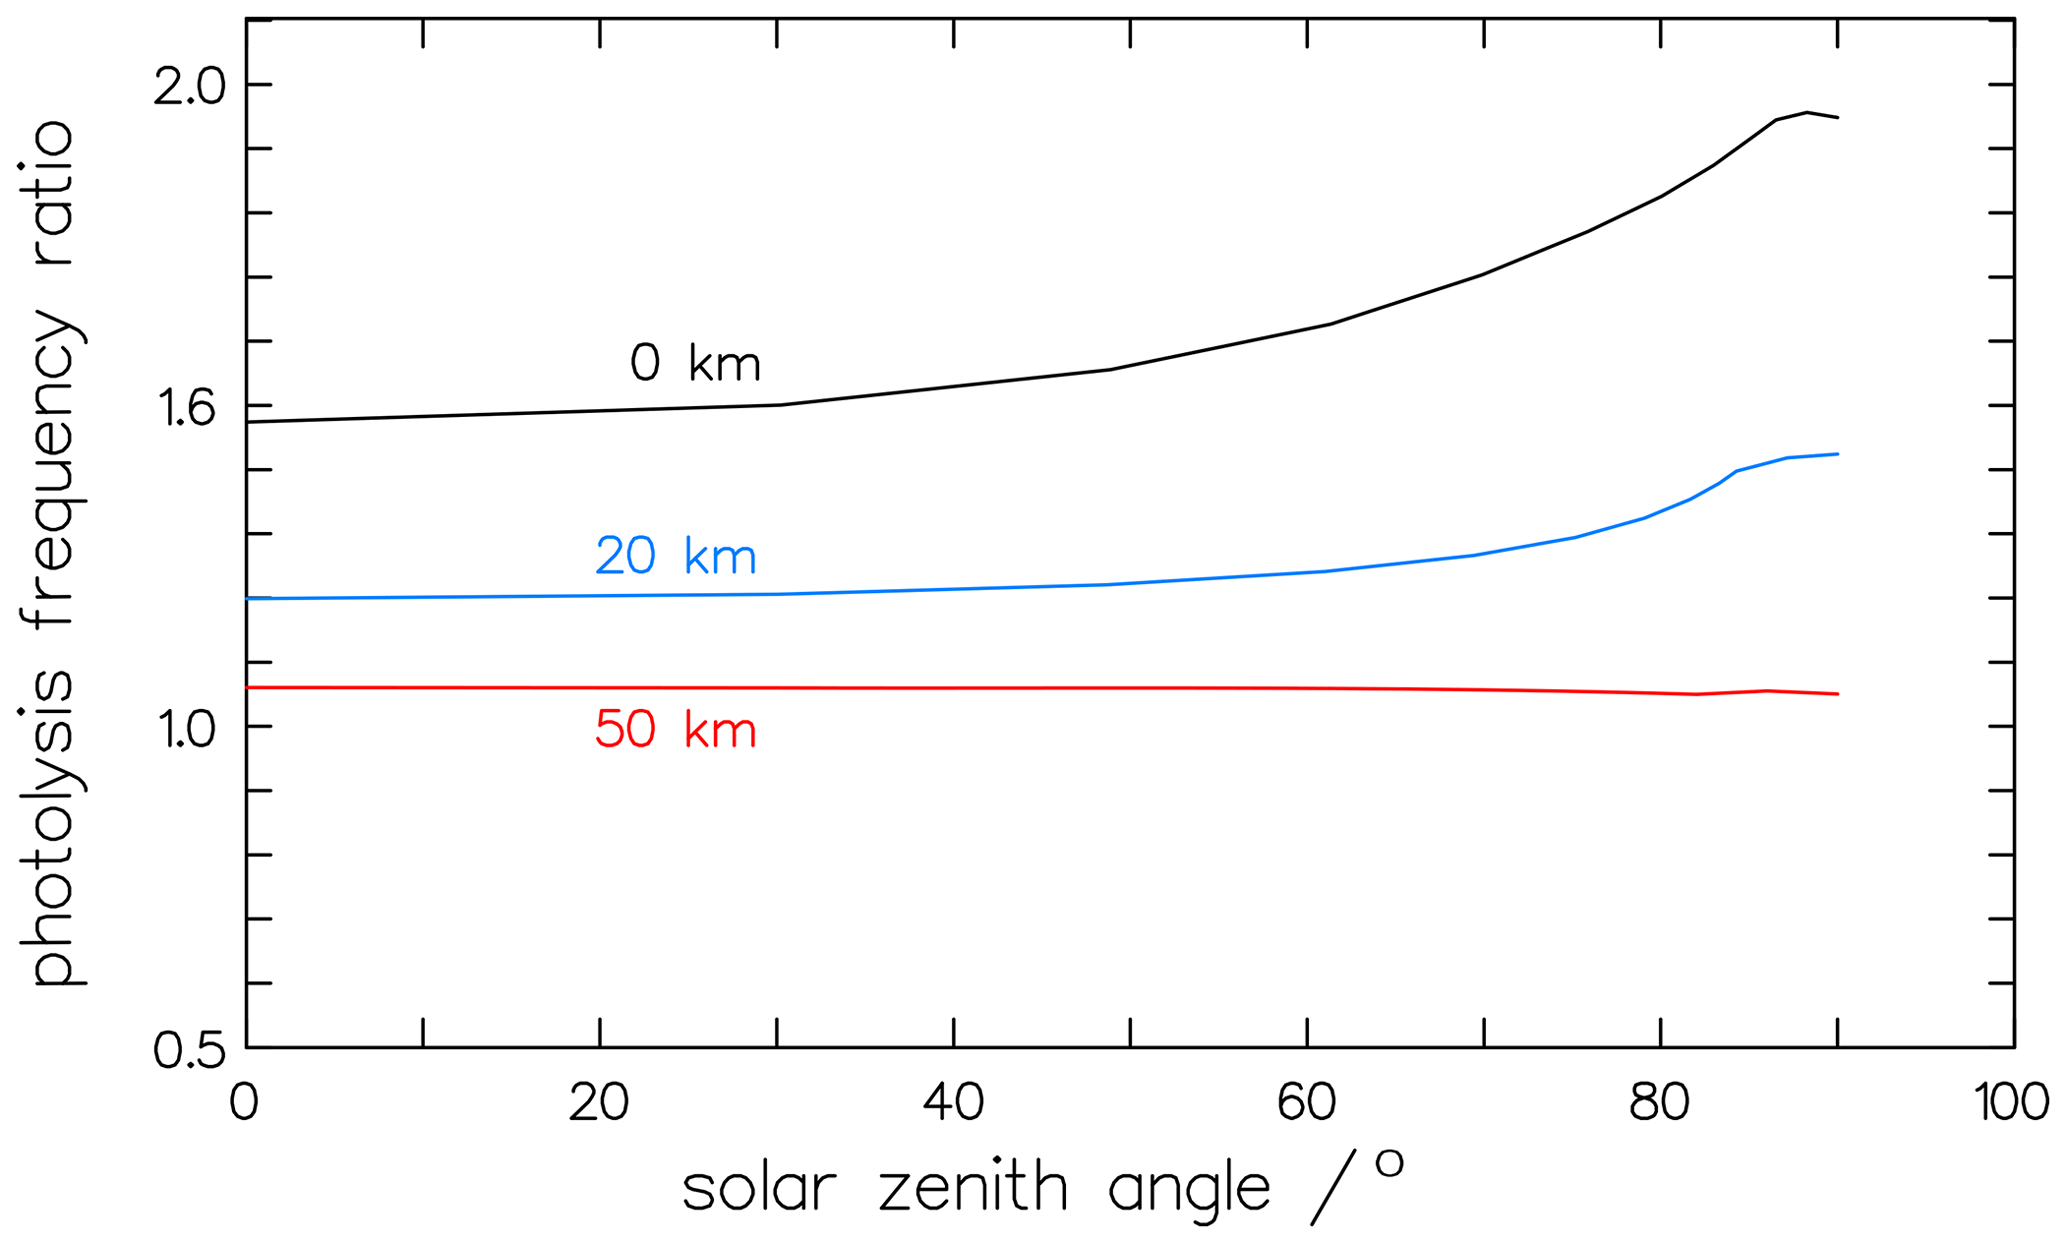
Figure 13At 50 km altitude, the solar-zenith-angle dependency on the photolysis frequency ratio of the molecular channel is nearly constant. In contrast, at 0 km, the ratio increases significantly for solar zenith angles above 30°.
The current work derives a framework and set of equations for describing the CHDO photolysis based on two different approaches building on the available literature data, finding a consistent result across all data sets. It could be shown that the most influential parameters of the rates of photolysis of CHDO are the absolute value and the threshold of the quantum yield of the radical channel. The simplified parameterized equations (Eqs. 11 and 14) that are readily implemented in kinetic models are provided for these quantities. Measurements around 300 and 325 nm could help to further reduce the uncertainty in the fractionation factor. Additional measurements of the pressure dependence of the total quantum yield, i.e., the quenching rate of excited CHDO∗, would be valuable to further test the assumptions made in this paper.
The analysis in this work relies mostly on regular data fitting procedures, which are readily available in statistical packages. The only other method used is wavelength-dependent integration to derive summed quantities; all modeling software incorporating photolysis will have an implementation for this standard operation.
All source data are available in the cited literature (McQuigg and Calvert, 1969; Miller and Lee, 1978).
The scientific conceptualization, methodology, and analysis were done by EPR, where LV provided additional OA. Both authors contributed significantly to the writing of the manuscript.
The contact author has declared that neither of the authors has any competing interests.
Publisher's note: Copernicus Publications remains neutral with regard to jurisdictional claims made in the text, published maps, institutional affiliations, or any other geographical representation in this paper. While Copernicus Publications makes every effort to include appropriate place names, the final responsibility lies with the authors.
The authors thank Birger Bohn and Dominico Taraborrelli for their useful comments and suggestions to improve the clarity and readability of the paper.
The article processing charges for this open-access publication were covered by the Forschungszentrum Jülich.
This paper was edited by John Plane and reviewed by two anonymous referees.
Araújo, M., Lasome, B., Magalhaes, A. L., Worth, G. A., Bearperk, M. J., and Robb, M. A.: The molecular dissociation of formaldehyde at medium photoexcitation energies: A quantum chemistry and direct quantum dynamics study, J. Chem. Phys., 131, 144301-1–144301-8, https://doi.org/10.1063/1.3242082, 2009.
Breuer, G. M. and Lee, E. K. C.: Fluorescence decay times of Cyclic Ketones, Acetone, and Butanal in the gas phase, J. Phys. Chem., 75, 989–990, https://doi.org/10.1021/j100677a029, 1971.
Burkholder, J. B., Sander, S. P., Abbatt, J. P. D., Barker, J. R., Cappa, C., Crous, D., Dipple, T. S., Huie, R. E., Kolb, C. E., Kurylo, M. J., Orkin, V. L., Percival, C. J., Wilmouth, D. M., and Wine, P. H.: Chemical kinetics and photochemical data for use in atmospheric studies, JPL-Publication 19-5, Pasadena, http://jpldataeval.jpl.nasa.gov/ (last access: 27 February 2024), 2019.
Chuang, M.-C., Foltz, M. F., and Moore, C. B.: T1 barrier height, S1–T1 intersystem crossing rate, and S0 radical dissociation threshold for H2CO, D2CO, and HDCO, J. Chem. Phys., 87, 3855–3864, https://doi.org/10.1063/1.452940, 1987.
Ehhalt, D. H. and Volz, A.: Coupling of the CH4 with the H2 and CO cycle: isotopic evidence, in: Symposium on Microbal Production and Utilization of Gases (H2, CH4, and CO), edited by: Schlegel, H. G., Gottschalk, G., and Pfennig, N., OCLC 4281340, Akad. Wiss. Göttingen, Germany, 1976.
Feilberg, K. L., Johnson, M. S., and Nielsen, C. J.: Relative Reaction Rates of HCHO, HCDO, DCDO, H13CHO, and HCH18O with OH, Cl, Br, and NO3 Radicals, J. Phys. Chem. A, 108, 7393–7398, https://doi.org/10.1021/jp048329k, 2004.
Feilberg, K. L., D'Anna, B., Johnson, M. S., and Nielsen, C. J.: Relative Tropospheric Photolysis Rates of HCHO, H13CHO, HCH18O, and DCDO Measured at the European Photoreactor Facility, J. Phys. Chem. A, 109, 8314–8319, https://doi.org/10.1021/jp0513723, 2005.
Feilberg, K. L., Johnson, M. S., Bacak, A., Röckmann, T., and Nielsen, C. J.: Relative Tropospheric Photolysis Rates of HCHO and HCDO Measured at the European Photoreactor Facility, J. Phys. Chem. A, 111, 9034–9046, https://doi.org/10.1021/jp070185x, 2007.
Fu, B., Shepler, B. C., and Bowman, J. M.,: Three-State Trajectory Surface Hopping Studies of the photosissociation dynamics of formaldehyde on ab initio potential energy surfaces, J. Am. Chem. Soc., 133, 7957–7968, https://doi.org/10.1021/ja201559r, 2011.
Gerst, S. and Quay, P.: Deuterium component of the global molecular hydrogen cycle, J. Geophys. Res., 106, 5021–5031, https://doi.org/10.1029/2000jD900593, 2001.
Gratien, A., Nilsson, E., Doussin, J.-F., Johnson, M. S., Nielsen, C. J., Stenstrom, Y., and Picquet-Varrault, B.: UV and IR Absorption Cross-sections of HCHO, HCDO, and DCDO, J. Phys. Chem. A, 111, 11506–11513, https://doi.org/10.1021/jp074288r, 2007.
Hirschfelder, J. O., Curtiss, C. F., and Bird, R. B.: Molecular Theory of Gases and Liquids, Wiley, London, 1249 pp., ISBN 0 471 40065 3, 1954.
Keller-Rudek, H., Moortgat, G. K., Sander, R., and Sörensen, R.: MPI-Mainz UV-VIS Spectral Atlas of Gaseous Molecules, http://www.uv-vis-spectral-atlas-mainz.org (last access: 1 June 2022), 2022.
Mar, K. A., McCarthy, M. C., Connell, P., and Boering, K. A.: Modelling the photochemical origins of the extreme deuterium enrichment in stratospheric H2, J. Geophys. Res., 112, D19302, https://doi.org/10.1029/2006JD007403, 2007.
McCarthy, M. C., Boering, K. A., Rahn, T., Eiler, J. M., Rice, A. L., Tyler, S. C., Schauffler, S., Atlas, E., and Johnson, D. G.: The hydrogen isotopic composition of water vapor entering the stratosphere inferred from high-precision measurements of δD-CH4 and δD-H2, J. Geophys. Res., 109, D07304, https://doi.org/10.1029/2003JD004003, 2004.
McQuigg, R. D. and Calvert, J. G.: The Photodecomposition of CH2O, CD2O, CHDO, and CH2O-CD2O Mixtures at Xenon Flash Lamp Intensities, J. Am. Chem. Soc., 91, 1590–1599, https://doi.org/10.1021/ja01035a002, 1969.
Miller, R. G. and Lee, E. K. C.: Single vibronic level photochemistry of formaldehydes in the A 1A2 state: Radiative and nonradiative processes in H2CO, HDCO, and D2CO, J. Chem. Phys., 68, 4448–4464, https://doi.org/10.1063/1.435527, 1978.
Nelder, J. A. and Mead, R.: A simplex method for function minimization, Comput. J., 7, 308–313, https://doi.org/10.1287/mnsc.42.7.954, 1965.
Nilsson, E. J. K., Bache-Andreassen, L., Johnston, M. S., and Nielsen, C. J.: Relative Tropospheric Photolysis Rates of Acetaldehyde and Formaldehyde Isotopologues Measured at the European Photoreactor Facility, J. Phys. Chem. A, 113, 3498–3504, https://doi.org/10.1021/jp811113c, 2009.
Nilsson, E. J. K., Andersen, V. F., Skov, H., and Johnson, M. S.: Pressure dependence of the deuterium isotope effect in the photolysis of formaldehyde by ultraviolet light, Atmos. Chem. Phys., 10, 3455–3462, https://doi.org/10.5194/acp-10-3455-2010, 2010.
Nilsson, E. J. K., Schmidt, J. A., and Johnson, M. S.: Pressure dependent isotopic fractionation in the photolysis of formaldehyde-d2, Atmos. Chem. Phys., 14, 551–558, https://doi.org/10.5194/acp-14-551-2014, 2014.
Osborn, D. L.: Exploring multiple reaction paths to a single product channel, Adv. Chem. Phys., 138, 213–265, https://doi.org/10.1002/9780470259474, 2008.
Pieterse, G., Krol, M. C., Batenburg, A. M., Steele, L. P., Krummel, P. B., Langenfelds, R. L., and Röckmann, T.: Global modelling of H2 mixing ratios and isotopic compositions with the TM5 model, Atmos. Chem. Phys., 11, 7001–7026, https://doi.org/10.5194/acp-11-7001-2011, 2011.
Rahn, T., Eiler, J. M., Boering, K. A., Wennberg, P. O., McCarthy, M. C., Tyler, S., Schauffler, S., Donelly, S., and Arlas, E.: Extreme deuterium enrichment in stratospheric hydrogen and the global atmospheric budget of H2, Nature, 424, 918–921, https://doi.org/10.1038/nature01917, 2003.
Rhee, T. S., Brenninkmeijer, C. A. M., Braß, M., and Brühl, C.: Isotopic composition of H2 from CH4 oxidation in the stratosphere and the troposphere, J. Geophys. Res., 111, D23303, https://doi.org/10.1029/2005jD006760, 2006.
Rhee, T. S., Brenninkmeijer, C. A. M., and Röckmann, T.: Hydrogen isotope fractionation in the photolysis of formaldehyde, Atmos. Chem. Phys., 8, 1353–1366, https://doi.org/10.5194/acp-8-1353-2008, 2008.
Rice, A. L., Tyler, S. C., McCarthy, M. C., Boering, K. A., and Atlas, E.: Carbon and hydrogen isotopic compositions of stratospheric methane: 1. High-precision observations from the NASA ER-2 aircraft, J. Geophys. Res., 108, 4460, https://doi.org/10.1029/2002JD003042, 2003.
Röckmann, T., Rhee, T. S., and Engel, A.: Heavy hydrogen in the stratosphere, Atmos. Chem. Phys., 3, 2015–2023, https://doi.org/10.5194/acp-3-2015-2003, 2003.
Röckmann, T., Walter, S., Bohn, B., Wegener, R., Spahn, H., Brauers, T., Tillmann, R., Schlosser, E., Koppmann, R., and Rohrer, F.: Isotope effect in the formation of H2 from H2CO studied at the atmospheric simulation chamber SAPHIR, Atmos. Chem. Phys., 10, 5343–5357, https://doi.org/10.5194/acp-10-5343-2010, 2010.
Röth, E.-P.: Description of the Anisotropic Radiation Transfer Model ART to Determine Photodissociation Coefficients, Ber. Forschungszentrum Jülich, Jül-3960, 2002.
Röth, E.-P. and Ehhalt, D. H.: A simple formulation of the CH2O photolysis quantum yields, Atmos. Chem. Phys., 15, 7195–7202, https://doi.org/10.5194/acp-15-7195-2015, 2015.
Troe, J.: Specific rate constants k(E,J) for the unimolecular dissociations of H2CO and D2CO, J. Phys. Chem., 88, 4375–4380, https://doi.org/10.1021/j150663a038, 1984.
Troe, J.: Analysis of quantum yields for the photolysis of formaldehyde at >310 nm, J. Phys. Chem. A, 111, 3868–3874, https://doi.org/10.1021/jp066886w, 2007.
Yamaguchi, Y., Wesolowski, S., Van Huis, T. J., and Schaefer III, H. F.: The unimolecular dissociation of H2O on the lowest triplet potential-energy surface, J. Chem. Phys., 108, 5281–5288, https://doi.org/10.1063/1.476315, 1998.
Yeung, E. S. and Moore, C. B.: Photochemistry of single vibronic levels of formaldehyde, J. Chem. Phys., 58, 3988–3998, https://doi.org/10.1063/1.1679755, 1973.
- Abstract
- Introduction
- Photolysis reaction mechanism
- Analysis of fluorescence measurements
- Analysis of the CHDO photo-decomposition
- The isotope fractionation during the photolysis of formaldehyde
- Discussion
- Conclusions
- Code availability
- Data availability
- Author contributions
- Competing interests
- Disclaimer
- Acknowledgements
- Financial support
- Review statement
- References