the Creative Commons Attribution 4.0 License.
the Creative Commons Attribution 4.0 License.
 | 27 Feb 2024
Investigation of observed dust trends over the Middle East region in NASA Goddard Earth Observing System (GEOS) model simulations
Adriana Rocha-Lima
Peter R. Colarco
Anton S. Darmenov
Edward P. Nowottnick
Arlindo M. da Silva
Luke D. Oman
Satellite observations and ground-based measurements have indicated a high variability in the aerosol optical depth (AOD) in the Middle East region in recent decades. In the period that extends from 2003 to 2012, observations show a positive AOD trend of 0.01–0.04 per year or a total increase of 0.1–0.4 per decade. This study aimed to investigate if the observed trend was also captured by the NASA Goddard Earth Observing System (GEOS) model. To this end, we examined changes in the simulated dust emissions and dust AOD during this period. To understand the factors driving the increase in AOD in this region we also examined meteorological and surface parameters important for dust emissions, such as wind fields and soil moisture. Two GEOS model simulations were used in this study: the Modern-Era Retrospective analysis for Research and Applications, Version 2 (MERRA-2) reanalysis (with meteorological and aerosol AOD data assimilated) and MERRA-2 Global Modeling Initiative (GMI) Replay (with meteorology constrained by the MERRA-2 reanalysis but without aerosol assimilation). We did not find notable changes in the modeled 10 m wind speed and soil moisture. However, analysis of Moderate Resolution Imaging Spectroradiometer (MODIS) normalized difference vegetation index (NDVI) data did show an average decrease of 8 % per year in the region encompassing Syria and Iraq, which prompted us to quantify the effects of vegetation on dust emissions and AOD in the Middle East region. This was done by performing a sensitivity experiment in which we enhanced dust emissions in grid cells where the NDVI decreased. The simulation results supported our hypothesis that the loss of vegetation cover and the associated increase in dust emissions over Syria and Iraq can partially explain the increase in AOD downwind. The model simulations indicated dust emissions need to be 10-fold larger in those grid cells in order to reproduce the observed AOD and trend in the model.
- Article
(23769 KB) - Full-text XML
- BibTeX
- EndNote


1.1 The Middle East and climate
The Middle East is defined as the geographical area extending from northeastern Africa to western Asia, with the Arabian Desert covering most of this region. The climate is hot and dry, with average precipitation of 50 mm yr−1 in the most arid regions (Saudi Arabia, Qatar, United Arab Emirates, Bahrain) to 700 mm yr−1 in the wettest regions around Lebanon (Hasanean and Almazroui, 2015), with the driest areas facing more than 300 dry days per year to up to a full year of dry days in the desert areas of Saudi Arabia and southern Iraq (Lelieveld et al., 2012). The seasonal dust cycle in the Middle East is different depending on the region (Rezazadeh et al., 2013). Typically, higher aerosol levels occur in the drier season between March and September (see Fig. 1a). Intense dust storms in the Middle East are caused by thunderstorm cells or else by haboobs, which are characterized by walls of blowing sand and dust carried to higher altitudes by strong winds and are common in many parts of the region (Miller et al., 2008; Knippertz et al., 2007). Dust storms have numerous adverse effects – disruption of roads and flight cancelations, damage to crops, and soil degradation. Populations exposed to high dust concentration are subject to respiratory health problems (Middleton, 2017; Meo et al., 2013). Moreover, airborne dust particles can spread diseases by carrying bacteria, viruses, and pollutants (Morris et al., 2011).
Long-term measurements of aerosol concentrations are scarce over desert areas. The Aerosol Robotic Network (AERONET) (Holben et al., 1998) provides ground-based sun photometer measurements of the column-integrated total aerosol optical depth (AOD). Figure 1b–c show AERONET stations located in the Middle East region. Stations are mainly concentrated near populated coastal areas, and only a few of them have long-term consistent high-quality AOD (referred to as Level 2.0) time series extending over the last 20 years (SEDE BOKER, Solar Village, Nes Ziona, and IMS-METU-ERDEMLI), with Solar Village being the only station in the central Middle East area. Estimates of total dust emissions are poorly constrained, and the locations of the dust sources are not well known, with an estimated contribution of about 75 % from natural and 25 % from anthropogenic sources (WorldBank, 2019). According to Kok et al. (2021), global annual dust emissions from the Middle East and central Asia contribute 30 % of the total world global dust loading in the atmosphere.
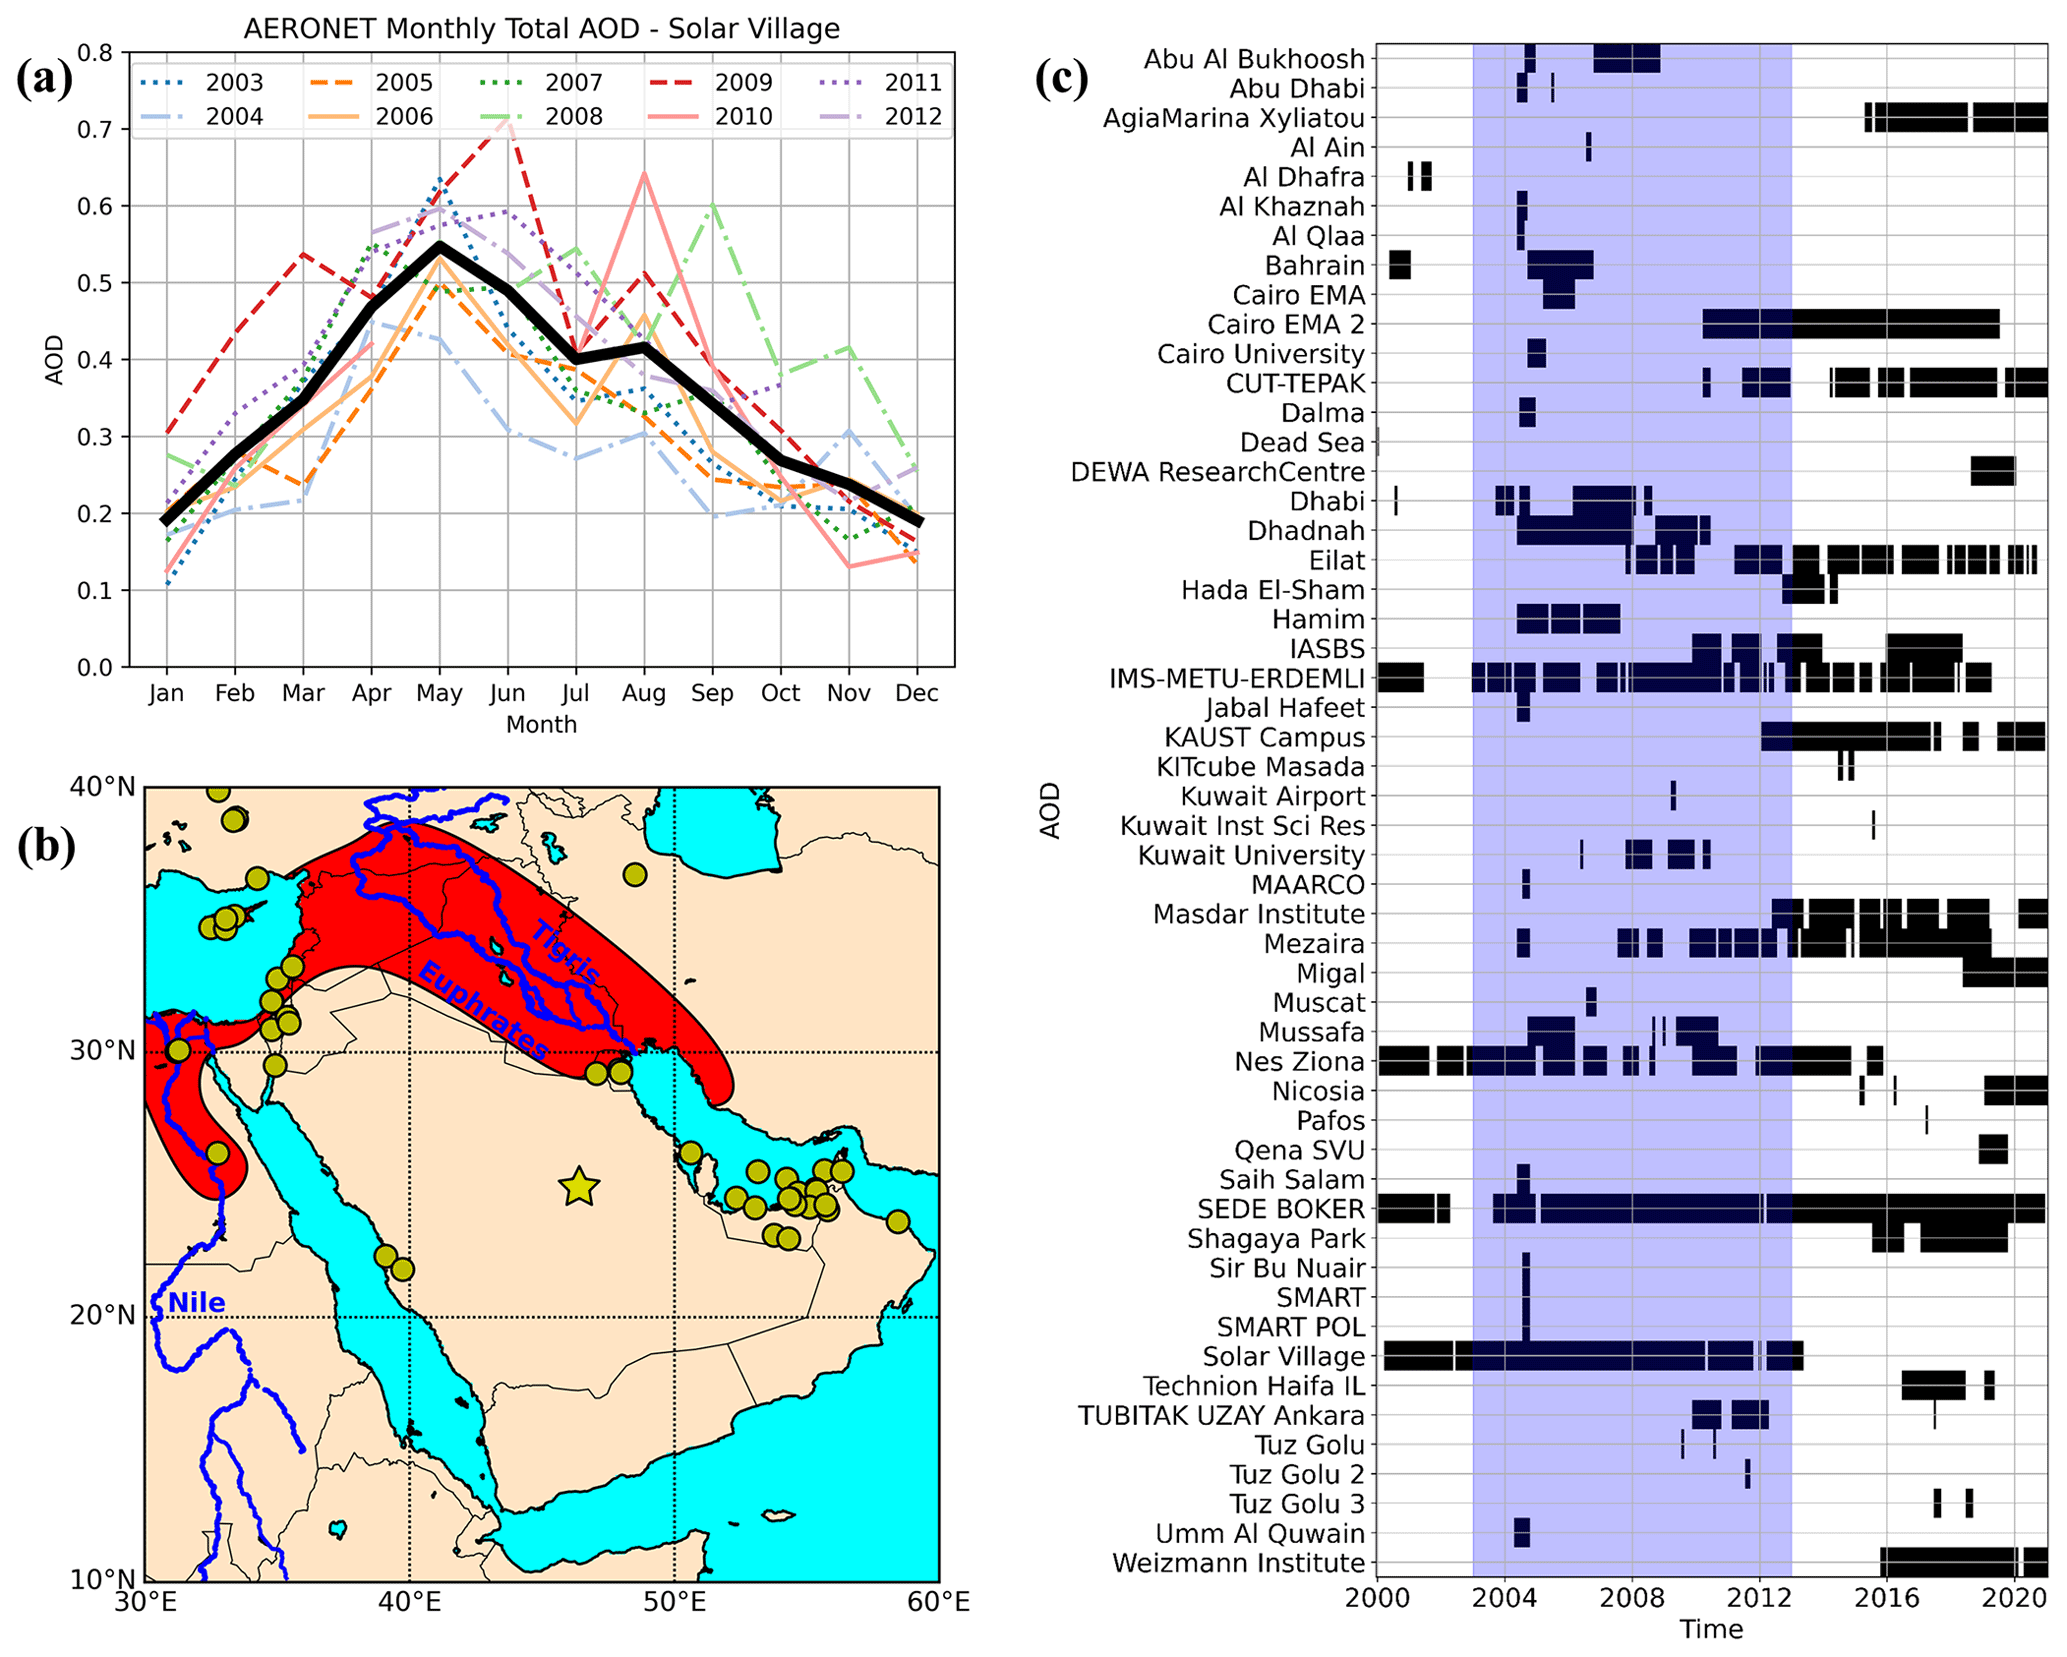
Figure 1(a) Aerosol Robotic Network (AERONET) monthly total AOD (Level 2.0) product for Solar Village in Saudi Arabia. (b) Locations of AERONET stations (yellow circles) in the Middle East region. Red shading corresponds to the Fertile Crescent region. Solar Village is shown as a yellow star. (c) Availability of AOD data from the AERONET stations. The period of interest for this study (2003–2012) is highlighted.
In recent decades, observations have shown that some regions in North Africa and the Middle East have experienced an overall increase in the frequency and intensity of dust storms, whereas other regions have experienced a decrease (Shao et al., 2013). The investigation of global AOD trends prior to 2010 using model simulations concluded that models underestimate changes over this region (Chin et al., 2014; Pozzer et al., 2015). According to Hamidi et al. (2013), dust activities in the years preceding 2013 were intensified for several reasons. These include the development of dam construction projects on the Tigris and Euphrates rivers, which led to a decrease in the water content of soil in the downstream areas, urbanization in regions previously used for agriculture, and a shortage of power that hindered the adequate irrigation of farmlands. The meteorological factors behind these trends are not well understood (Albugami et al., 2019). Notaro et al. (2015) linked the variability in the dust activity in the Arabian Peninsula to prolonged drought in the Fertile Crescent region (the region that extends from Nile River in Egypt to the nearby Tigris and Euphrates rivers – see Fig. 1b). Using remote-sensing observations, Nabavi et al. (2016) identified the region northwest of Iraq and east of Syria as emerging dust areas with a marked increase in the frequency of dust events. Xia et al. (2022) showed that the Middle East AOD trend has reverted in the most recent years partially due to the expansion of irrigated areas. Conversely, Che et al. (2019) found that sea level pressure and wind speed were the primary meteorological factors driving AOD variations over the Middle East. More recent studies have examined the link between dust activity in the Middle East and climate decadal oscillations. Xi (2021) associated the AOD trends over the Middle East with the combined effects from El Niño–Southern Oscillation (ENSO) and the Pacific Decadal Oscillation (PDO). Specifically, when both ENSO and PDO are in phase, influences in the sea surface temperature and winds are amplified, creating high surface pressure around the Middle East with hotter and drier conditions. The drought in the Tigris–Euphrates Basin is believed to be associated with the effects of La Niña and negative PDO phases, which can have resulting effects on agriculture and vegetation loss in the Fertile Crescent. At the same time, Liu et al. (2023) related the shift in the AOD trend in the Middle East around 2010 from positive to negative to the shift in the northern tropical Atlantic (NTA) sea surface temperature (SST).
Klingmüller et al. (2016) investigated the increase in dust emissions in the Middle East and showed that observations from AERONET at Solar Village have a positive trend in the period between 2003 and 2012 (Fig. 2a). After 2012, AERONET data show that AOD started to decrease again; unfortunately, reliable measurements are not available at that station beyond May 2013. Klingmüller et al. (2016) also showed that AOD from the space-based Moderate Resolution Imaging Spectroradiometer (MODIS) confirmed a positive trend in the total AOD over Solar Village and other areas across the Middle East region in the period between 2003 and 2012, with a reverse of the trend until 2015 (i.e., the end of their study).
In this study, we evaluated the ability of the NASA Goddard Earth Observing System (GEOS) (Rienecker et al., 2008; Molod et al., 2015), a global Earth system model developed by the NASA Global Modeling and Assimilation Office (GMAO), to reproduce the observed dust AOD trend between 2003–2012. For that, we look at the variations in dust emission and dust AOD and changes in the main dust-driven meteorological parameters in the same period when observations indicated a positive AOD trend. Two model simulations based on the same GEOS model version were used in this study: the Modern-Era Retrospective analysis for Research and Applications, Version 2 (MERRA-2) reanalysis (with meteorological and aerosol AOD data assimilated) and the MERRA-2 Global Modeling Initiative (GMI) Replay (with meteorology constrained by the MERRA-2 reanalysis but without aerosol assimilation). We investigated the possible causes of the AOD variability and the qualitative impact of the change in vegetation cover by performing a sensitivity study to allow for an increase in emissions over areas of decreasing normalized difference vegetation index (NDVI) in the region of the Fertile Crescent.
1.2 Model description and dust emission scheme
The GEOS model is a global Earth system model that supports NASA’s broad range of Earth science applications, including data analysis, reanalysis, observing system simulation experiments, climate and weather prediction, and basic Earth system research. The version of GEOS used in this study includes prognostic aerosols from the Goddard Chemistry, Aerosol, Radiation, and Transport (GOCART) module (Chin et al., 2002; Colarco et al., 2010). The GOCART aerosol module includes the sources, sinks, and chemistry of dust, sulfate (SO4), sea salt, and black (BC) and organic carbon (OC) aerosols. For dust, the particle size distribution is discretized into five non-interacting size bins spaced at radii of between 0.1–10 µm.
Dust emissions are known to be sensitive to different factors, climatology, wind patterns, topography, and soil characteristics. In the default configuration of GEOS, the description of the spatial distribution of dust emission is parametrized by the topographic source based on Ginoux et al. (2001). The uplifting of the dust particles is modulated by the wind fields and soil wetness according to the dust flux equation:
where Cg is a global tuning constant, S is the emission efficiency given by the topographic source function, sp is the mass fraction of dust for each size bin (p), U10 is the horizontal wind speed at 10 m, and Ut is the threshold wind speed dependent on the particle size and soil moisture (volume of water within the volume of bulk soil) required to initiate emission (Belly, 1964). Ginoux et al. (2001) replaced the soil moisture variable by the surface soil wetness, a dimensionless variable ranging from 0 to 1 that indicates the saturation level of the soil. Surface soil wetness above 0.5 results in a complete saturation of the soil (effectively Ut→∞) and zero flux emission.
(Holben et al., 1998)(NASA/LARC/SD/ASDC, 1999)(Hsu et al., 2019; Sayer et al., 2019)(Didan, 2015)(Joiner and Yoshida, 2020)Table 1List of sensors and dataset products used in this study in the period from 2003 to 2012.
Two model GEOS simulations were used in this study: the MERRA-2 reanalysis and MERRA-2 GMI Replay. The MERRA-2 reanalysis is a long-term (1980–present) global reanalysis that assimilates satellite meteorological and aerosol data (Gelaro et al., 2017; Randles et al., 2017; Buchard et al., 2017). It assimilates several wind observations, including ground-based datasets, remotely sensed profilers, and satellite-derived and satellite-retrieved winds (McCarty et al., 2016). The MERRA-2 reanalysis also uses precipitation observations to correct model-generated precipitation, which is needed for estimating soil moisture in the catchment land surface model (De Lannoy et al., 2014; Gelaro et al., 2017; Reichle et al., 2017a, b). Furthermore, the MERRA-2 reanalysis assimilates total AOD from multiple systems, such as the Advanced Very-High-Resolution Radiometer (AVHRR), MODIS, and the Multi-angle Imaging Spectroradiometer (MISR) over bright surfaces, and from selected AERONET stations prior to 2015. The aerosol assimilation is performed eight times a day at 3 h intervals. MERRA-2 GMI Replay (Strode et al., 2019) uses a replay mechanism to produce a simulation with meteorology similar to the MERRA-2 reanalysis. There are several differences between MERRA-2 GMI Replay and the MERRA-2 reanalysis to note. First, unlike the MERRA-2 reanalysis, MERRA-2 GMI Replay was performed with a full chemistry simulation using the Global Modeling Initiative's (GMI) chemical mechanism (Duncan et al., 2007; Strahan et al., 2007). This has no practical impact on the simulations of dust emissions and loss processes. Second, MERRA-2 GMI Replay, uses the same catchment land surface model as the MERRA-2 reanalysis; however, there are differences in soil moisture due to differences in the treatment of water vapor and precipitation. Finally, and most significantly, MERRA-2 GMI Replay does not constrain the total aerosol optical depth to observations like in the MERRA-2 reanalysis.

Figure 2Time series of the de-seasonalized AOD at Solar Village in Saudi Arabia for (a) AERONET ground-based station Level 2.0, (b) MODIS Deep Blue Collection 6.1 (MODIS DB C6.1) (Hsu et al., 2019; Sayer et al., 2019), and (c) MISR (NASA/LARC/SD/ASDC, 1999). Simulated time series of the de-seasonalized AOD for (d) the MERRA-2 reanalysis (i.e., with aerosol data assimilated) and (e) MERRA-2 GMI Replay (no aerosol data assimilated). The light blue lines in the simulation plots correspond to the same model datasets sampled at AERONET time.
Both the MERRA-2 reanalysis and MERRA-2 GMI Replay were run at a global ∼ 50 km horizontal resolution with 72 vertical levels extending from the surface to ∼ 80 km altitude. Output is saved hourly on a regular grid with a resolution of 0.625° longitude and 0.5° latitude (Gelaro et al., 2017).
Using the same definition given by Klingmüller et al. (2016), we calculated the de-seasonalized AOD for our model simulations and various remote-sensing aerosol observations as the difference between monthly mean AOD and the average monthly mean for the period 2003–2012. The slope of the de-seasonalized AOD for the same period was obtained by fitting a linear regression to the de-seasonalized AOD. Table 1 summarizes ground-based and satellite products used in this study. All datasets were selected to cover the period between 2003 and 2012.
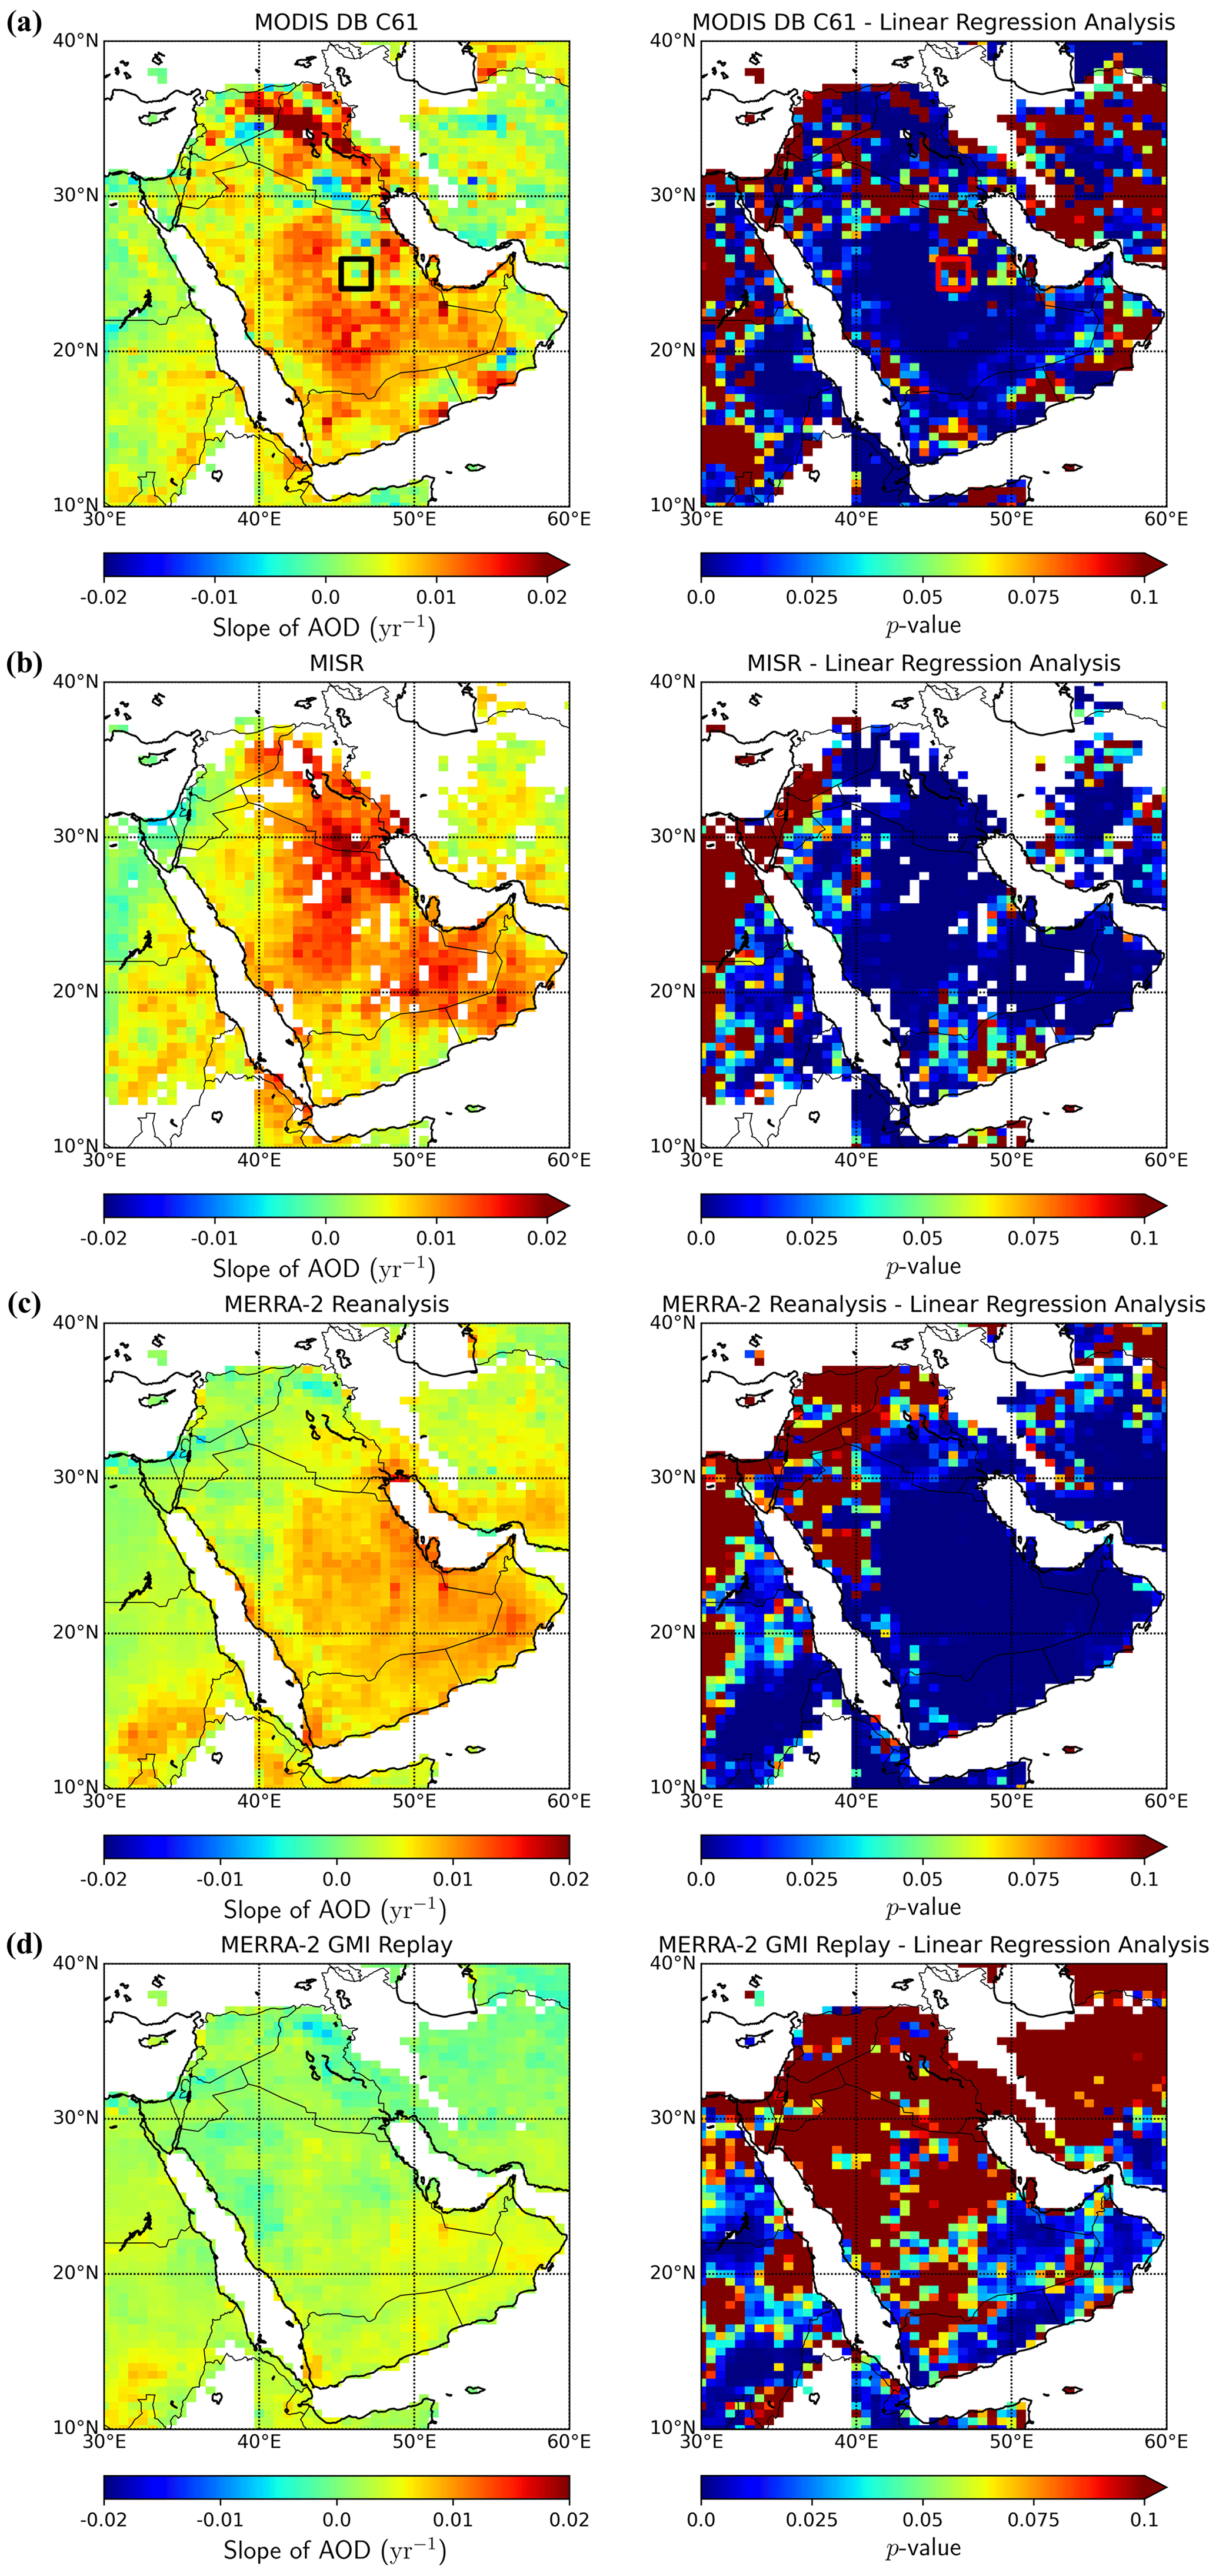
Figure 3Map of the dust-screened de-seasonalized AOD (on the left) for the period of 2003–2012 and p values of the linear regression (on the right): (a) MODIS Deep Blue Collection 6.1, (b) MISR, (c) the MERRA-2 reanalysis, and (d) MERRA-2 GMI Replay. GEOS model simulation datasets are synchronized to match MODIS DB C6.1 time.
Figure 2 shows the slope of the de-seasonalized AOD at Solar Village in Saudi Arabia for (a) AERONET-Level 2.0, (b) MODIS Deep Blue Collection 6.1 (MODIS DB C6.1), (c) MISR, (d) the MERRA-2 reanalysis, and (e) MERRA-2 GMI Replay. Observations from AERONET and MISR show positive slopes of 0.017 and 0.011 per year, respectively. For MODIS, a positive slope of 0.005 per year is obtained averaging the de-seasonalized AOD of nine grid cells around Solar Village, shown as the area marked by the square in Fig. 3a. Although the slope of the AOD from MODIS DB C6.1 at these grid cells around Solar Village has a p value equal 0.08, incompatible with a trend (typically p values lower than 0.05 are statistically significant), that is not the case for the next neighboring grid cells, as will be shown in Fig. 3a. At the Solar Village grid box, the MERRA-2 reanalysis shows a significant slope of increase in AOD of 0.012 per year and MERRA-2 GMI Replay does not have any trend, as confirmed by p values on the order of 10−8 and 0.11 for each fitting.
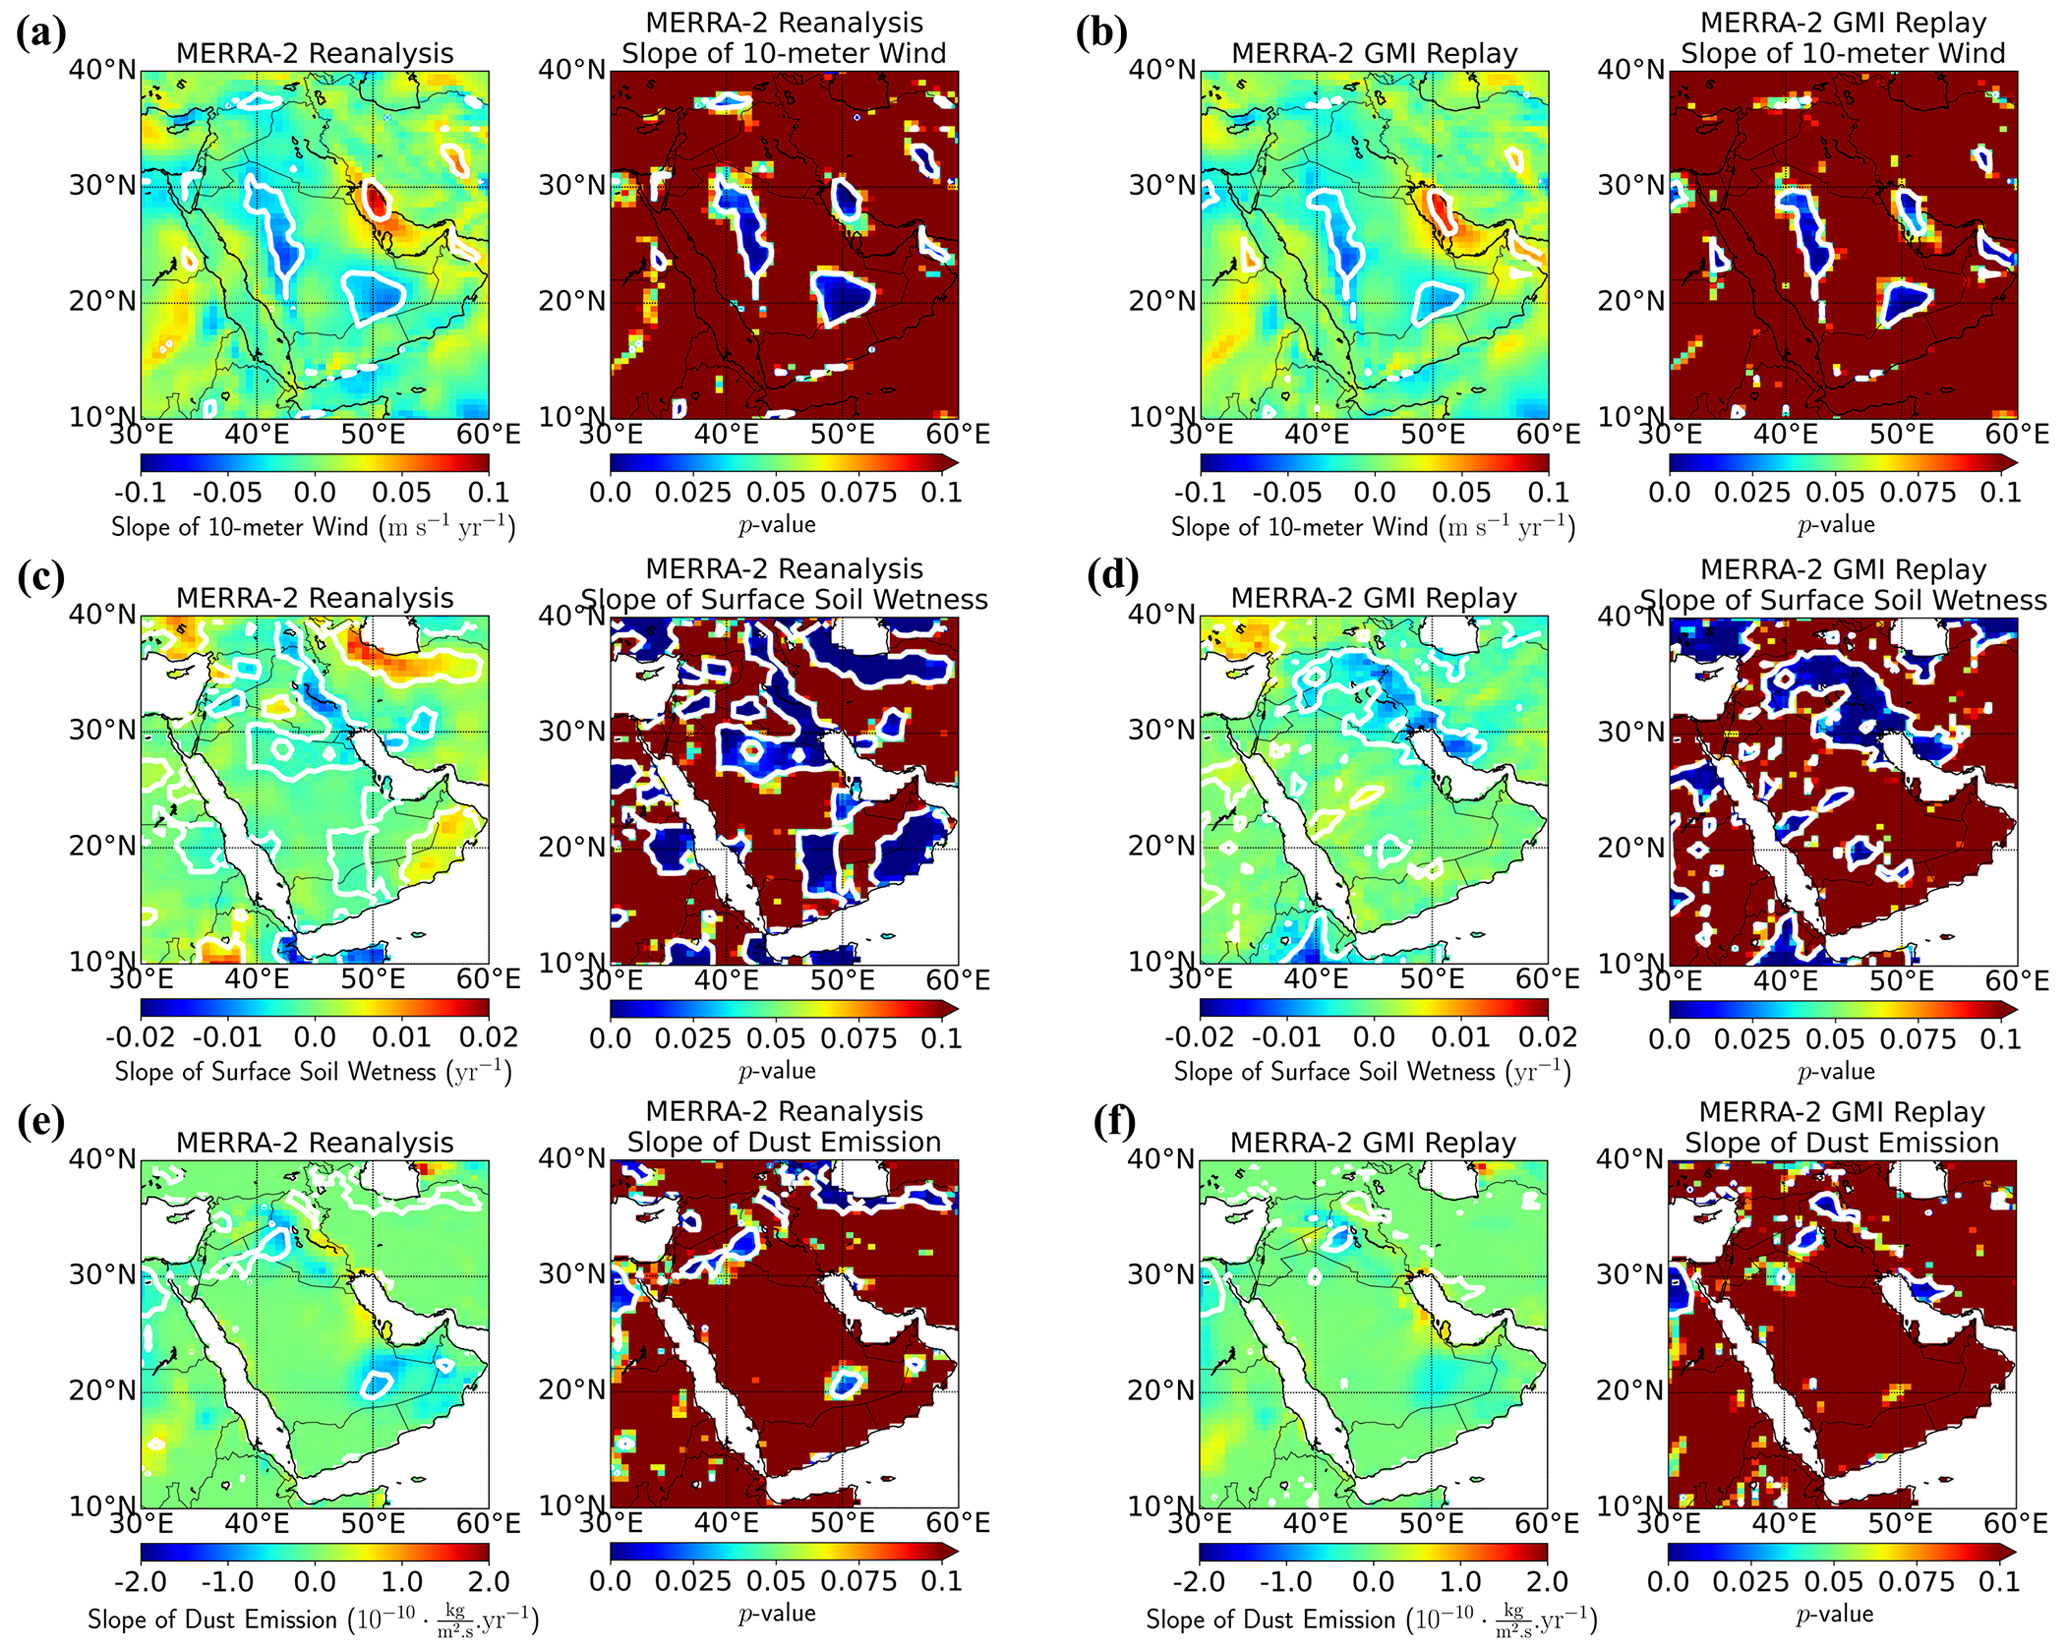
Figure 4The MERRA-2 reanalysis (a, c, e) and MERRA-2 GMI Replay (b, d, f): (a–b) slope of the 10 m wind speed, (c–d) slope of surface soil wetness, and (e–f) slope of dust emissions. All slopes were calculated for the period between 2003 and 2012. White contour regions with p values lower than 0.05 are associated with statistically significant slopes.
To further evaluate the model capability to capture dust AOD trends over the region, MODIS AOD was “dust-screened” to select AOD observations consisting predominantly of dust aerosol. For that, we selected observations with an Ångström exponent smaller than 1.0 and with a single-scattering albedo (SSA) larger at 670 nm than at 412 nm. Then, AODs from the MERRA-2 reanalysis and MERRA-2 GMI Replay were sampled at MODIS dust-screened time. Figure 3 shows the regional map of the slope of the dust-screened de-seasonalized AOD (on the left) for the period between 2003 to 2012 and respective p values for the linear fitting of the slope (on the right). MODIS and MISR show similar spatial trends extending from the region of the Fertile Crescent in Syria and Iraq around the Tigris and Euphrates rivers to the south border of Saudi Arabia, with positive slopes varying from 0.01 to 0.04 per year. MISR shows higher slope values in the southeast border of the region near Oman and the United Arab Emirates. Notably, the higher slope hotspots both in MODIS and MISR have statistically significant p values. The MERRA-2 reanalysis shows a positive variability in the AOD similar to MODIS and MISR, although the variation differs in magnitude and does not capture the hotspot region over the Fertile Crescent. The MERRA-2 GMI Replay does not show any significant variability in the same period at Solar Village. The white pixel patches correspond to grid boxes with low statistics (less than 50 observations on average per month).
Dust emissions in both the MERRA-2 reanalysis and MERRA-2 GMI Replay are driven by similar wind fields; however, they used different soil moisture datasets. Dust emissions are modulated by the topographic source based on Ginoux et al. (2001). Figure 4 shows the de-seasonalized slopes of the 10 m wind speed, surface soil wetness, and dust emission fluxes for both the MERRA-2 reanalysis and MERRA-2 GMI Replay and also shows the corresponding p values.
The slopes of the 10 m wind fields (Fig. 4a–b) for both the MERRA-2 reanalysis and MERRA-2 GMI Replay have corresponding p values that are statistically significant only over a few regions (shown in blue), and in those areas the slope of the surface wind is negative over land. This would suggest that the changes in the 10 m wind would result in weaker regional dust emissions in the model. The greatest magnitude change in 10 m wind speed over these regions is on the order of −0.06 m s−1 yr−1, which comparatively to calculated 10 m annual mean baseline values for the region represents changes of less than 4 % (see Appendix A for baseline values).
For the surface soil wetness, we observe that the slopes for the MERRA-2 reanalysis and MERRA-2 GMI Replay have a different spatial distribution, which we attributed to the differences in the soil moisture inputs used in them. For the MERRA-2 reanalysis, areas with statistical significance are observed over Oman, with a positive variation of up to +0.0075 per year, and over Iraq and Syria, with a negative variability of up to −0.01 per year. Interestingly, the region of the Fertile Crescent shows a decrease in the surface soil wetness for both simulations. For MERRA-2 GMI Replay, where we do not observe the increase in surface soil wetness over Oman, the most significant change in soil moisture is seen over Iraq and along the western border of Iran with a decrease in soil moisture of up to −0.0075 per year and in central areas of Saudi Arabia with a positive increase of +0.005 per year.
Although variations in the surface soil wetness are observed between the MERRA-2 reanalysis and MERRA-2 GMI Replay, the slope of the dust emission fluxes are essentially identical in both reanalysis and replay (Fig. 4e–f). Only a few regions show p values with a statistical significance. In those few spots, the model indicates (1) a decrease in dust emissions correlated to the decrease in wind speeds to the south of Saudi Arabia and (2) a slight decrease (increase) in dust emissions correlated to increase (decrease) in soil moisture. Overall, we observe that there is no statistically significant increase in dust emissions. It also confirms that the positive slope in the de-seasonalized AOD in the MERRA-2 reanalysis cannot be explained by the local increase in dust emission, and it was partially captured only due to the AOD assimilation. Moreover, the few locations of statistical significance in the slope of the dust emission are places where the emission efficiency given by the topographic source (see Fig. 7a) is relatively low, which can also be seen in the baseline values for monthly and annual dust emission shown in Appendix A, Figs. A4 and A7.
To explore the impact of aerosol data assimilation on the MERRA-2 simulation, Fig. 5 shows the slope of the de-seasonalized AOD analysis increments from MERRA-2. The aerosol analysis in MERRA-2 is performed by combining the forecasted column-integrated AOD with the assimilated AOD increments. Quality-controlled AOD at 550 nm is assimilated into the GOCART and GEOS model by the Goddard Aerosol Assimilation System (GAAS) every 3 h (Buchard et al., 2015, 2016). For desert regions in the period between 2003–2012, AOD was assimilated using observations from MISR and AERONET AOD Level 2.0 (Randles et al., 2017). Figure 5a–b show that the de-seasonalized slope of the assimilated AOD increments is positive over the entire Middle East region, with two main hotspots over Iraq and Solar Village in Saudi Arabia, consistent with the observations (Fig. 3a–b). Significant p values were obtained over the entire region confirming the positive AOD trend over the period. These results show that data assimilated from the Solar Village ground-based station is driving the increase more so than assimilation of spaceborne observations. In the MERRA-2 reanalysis (Fig. 3c), the resulting AOD increase will be seen downwind due to the typical configuration of the wind patterns over the region in the north–south direction. The wind indicates the direction in which dust is transported from the Fertile Crescent to the Saudi Arabia region (Fig. 5b).
3.1 Investigating causes of the AOD variability over the Middle East region
3.1.1 Normalized difference vegetation index (NDVI)
The causes of recent AOD trends over the Middle East have not been clearly identified yet. Although aerosol emissions from anthropogenic sources have increased over some regions, Klingmüller et al. (2016) showed that changes in AOD in the same period were accompanied by decreases in the MODIS Ångström exponent and so decreases in the AERONET fine-mode particles. Similarly, Sabetghadam et al. (2021) noticed a higher presence of the aerosol dust type in March 2012 compared to the long-term average for the period of 2001–2019 in the Fertile Crescent region. These findings suggest that the AOD trends over the region are associated with a higher concentration of coarse particles, like dust. Increases in soil dryness due to the land use and higher temperatures have also been linked to the observed AOD trends (Adamo et al., 2022). Changes in the vegetation cover show a reduction in vegetation in the region of the Fertile Crescent as seen in Fig. 6a.
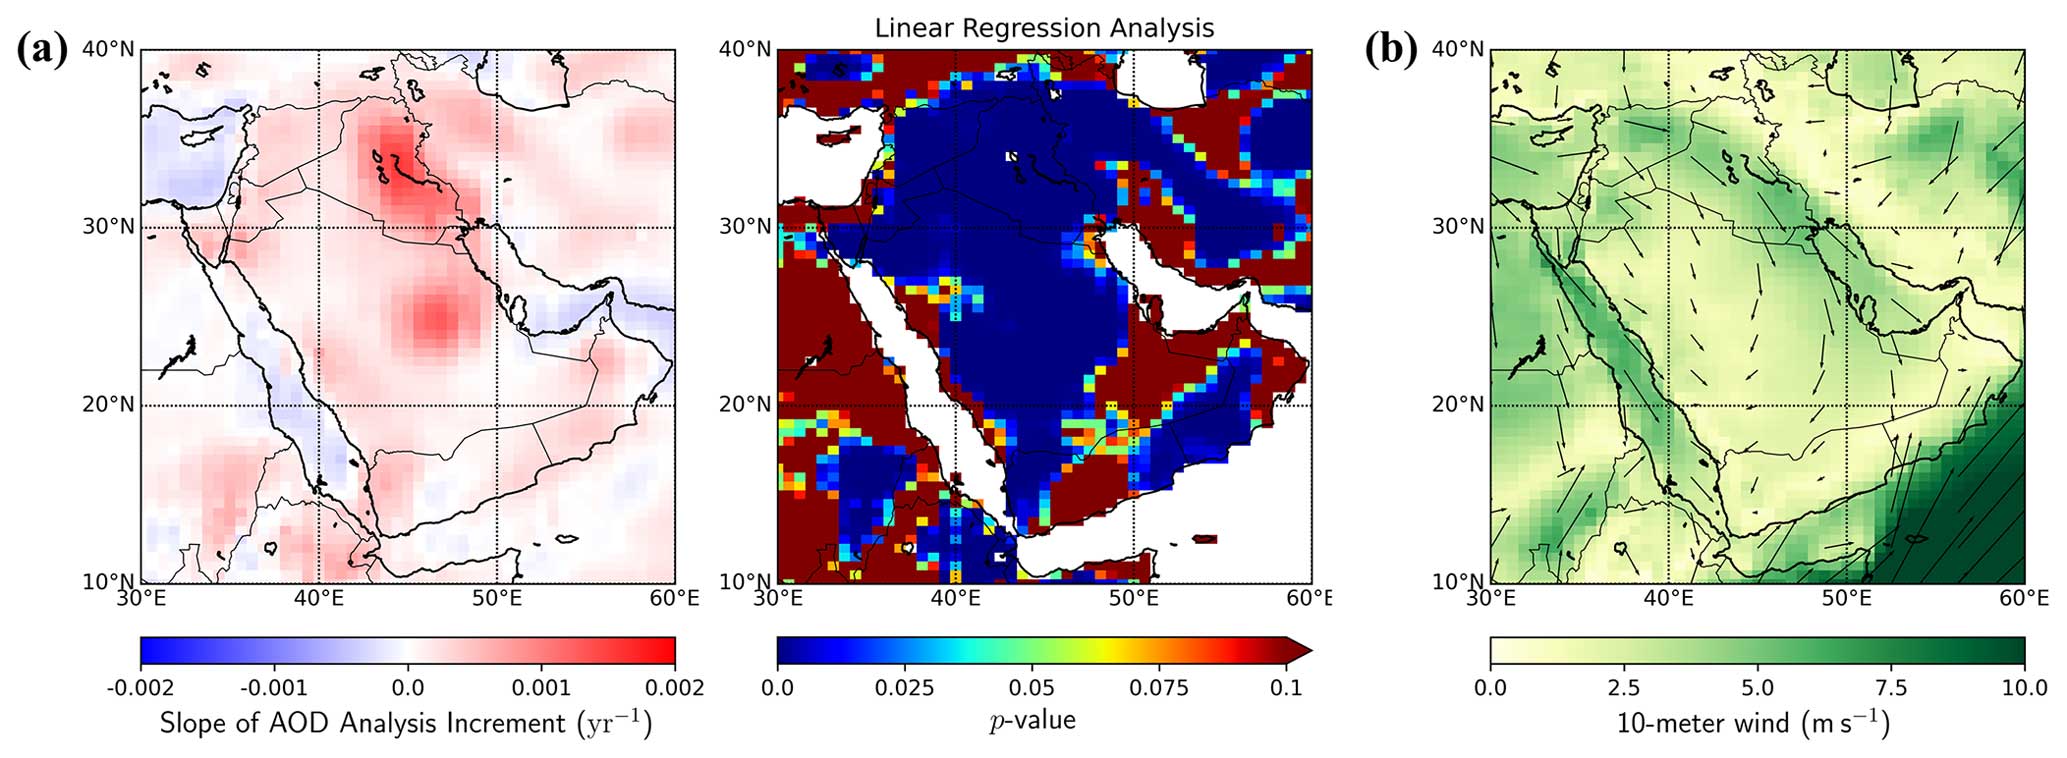
Figure 5(a) Slope of the AOD analysis increments assimilated in the MERRA-2 reanalysis in the period between 2003–2012 and p values of the linear regression show an overall positive increment over the entire Middle East region. (b) Direction and magnitude of 10 m wind vectors for the month of June over the Middle East region.
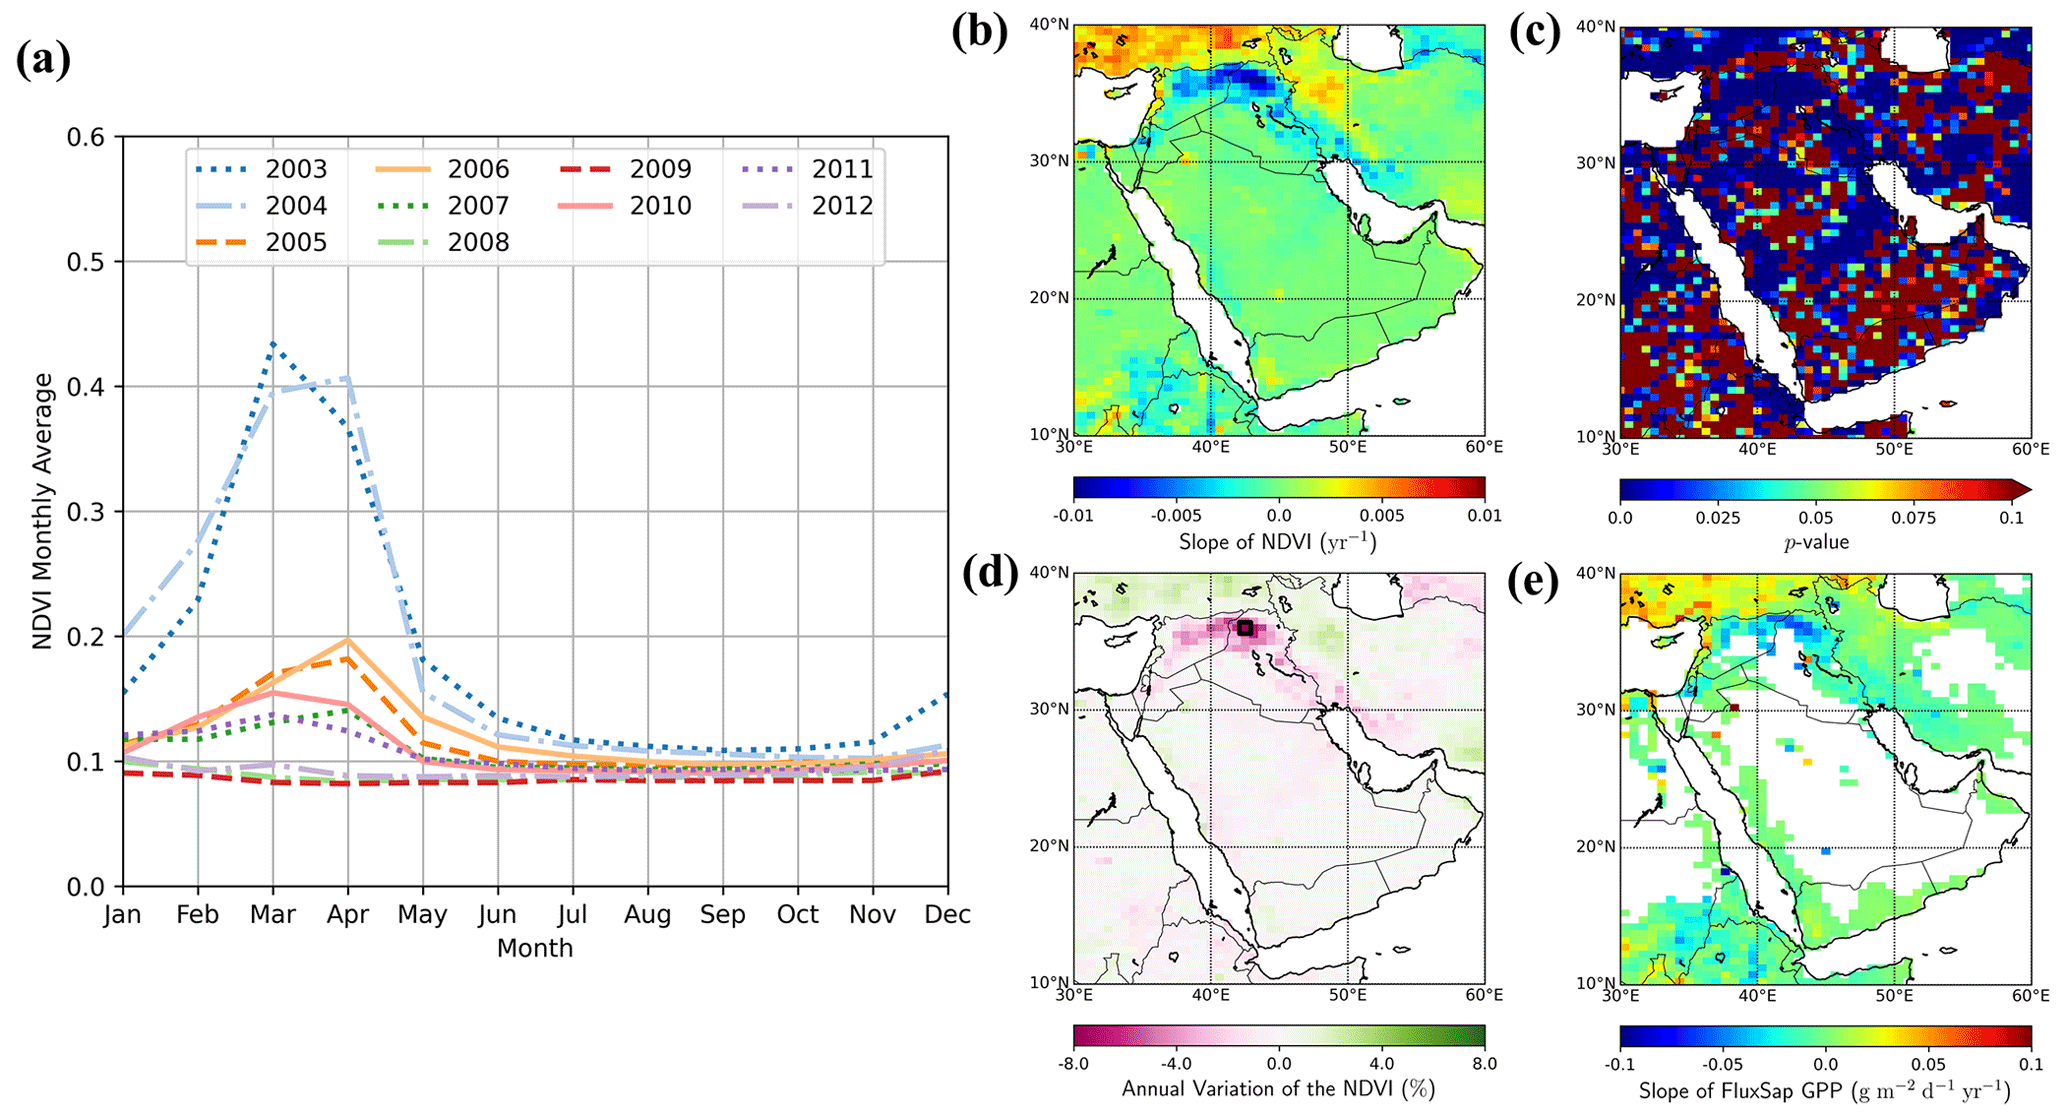
Figure 6(a) Monthly NDVI product from MODIS between 2003 and 2012 for a grid cell in the region of the Fertile Crescent (square in Fig. 6d), (b) slope of the de-seasonalized NDVI for the same period, (c) p values of the linear regression fitting of the slope of the NDVI, (d) equivalent annual variation calculated as the magnitude of the slope divided by the annual mean NDVI in percent, and (e) slope of the global daily terrestrial gross primary production (FluxSat GPP) obtained for the same period.
The normalized difference vegetation index (NDVI) dataset product from MODIS provides a consistent global spatial temporal comparison of canopy greenness (Didan, 2015). Figure 6a shows the time series of the monthly NDVI for a grid box located in the region of Fertile Crescent. The greenest peak in March–April is suppressed over the years, with NDVI values ranging from 0.4 (sparsely vegetated) in the year 2003 to 0.1 (bare ground) in 2012. NDVI maps for the entire region are shown in Fig. A8. Figure 6b–c show the map of the slope of the de-seasonalized NDVI and respective p values between 2003–2012, confirming the decrease in vegetation in the Fertile Crescent region. Figure 6d shows the annual variation in the NDVI in percent obtained as the slope divided by the annual baseline of the NDVI over the region, resulting in maximum NDVI variations of up to around 80 % over the decade in the most critical grid box.
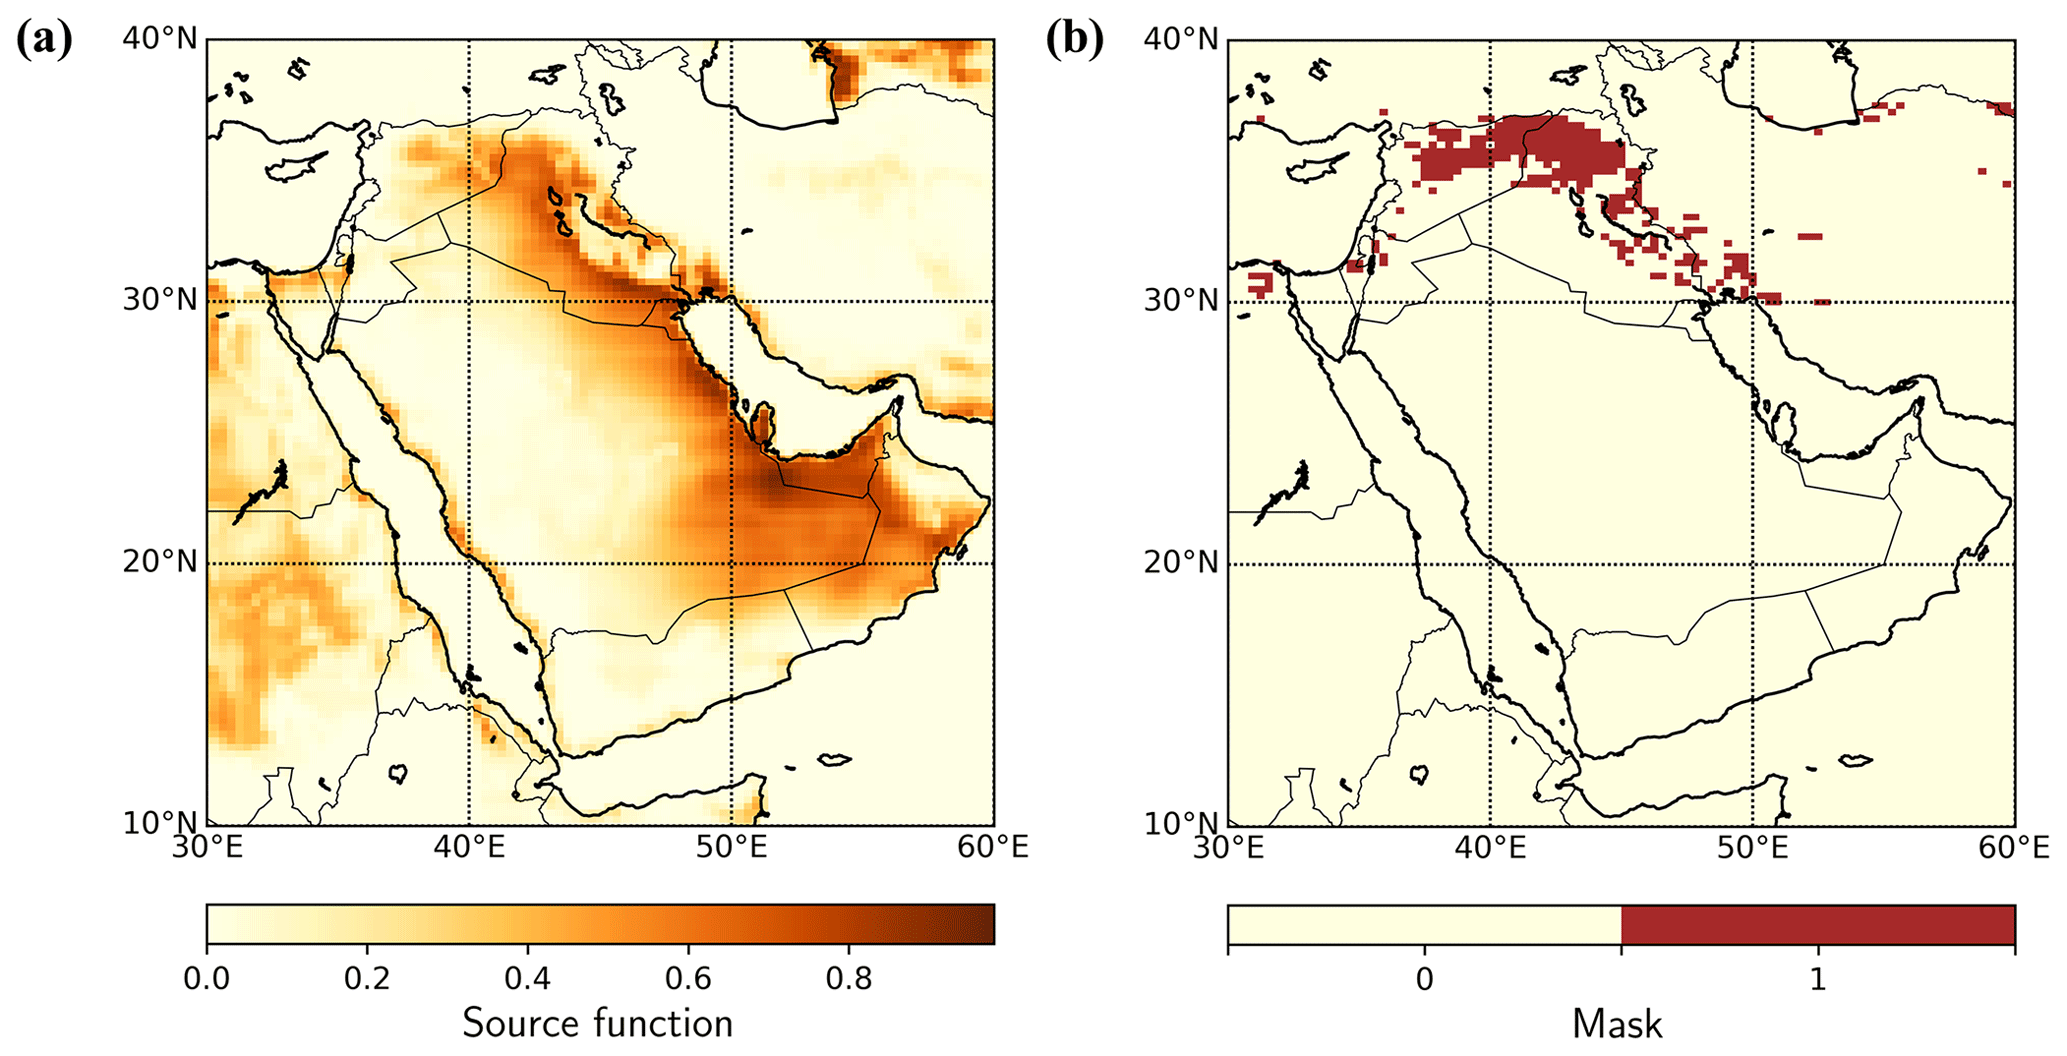
Figure 7(a) Topographic source function shows the spatial efficiency of dust emission over the Middle East region based on Ginoux et al. (2001, 2004). The map is based on observations that topographic lows with bare soil have accumulated sediments and are potential dust sources. (b) Mask used for the simulation of dust emissions in the region of the Fertile Crescent coincident with grid boxes in the model where decreasing vegetation coverage was observed to have negative slopes of NDVI above 0.025 per year.
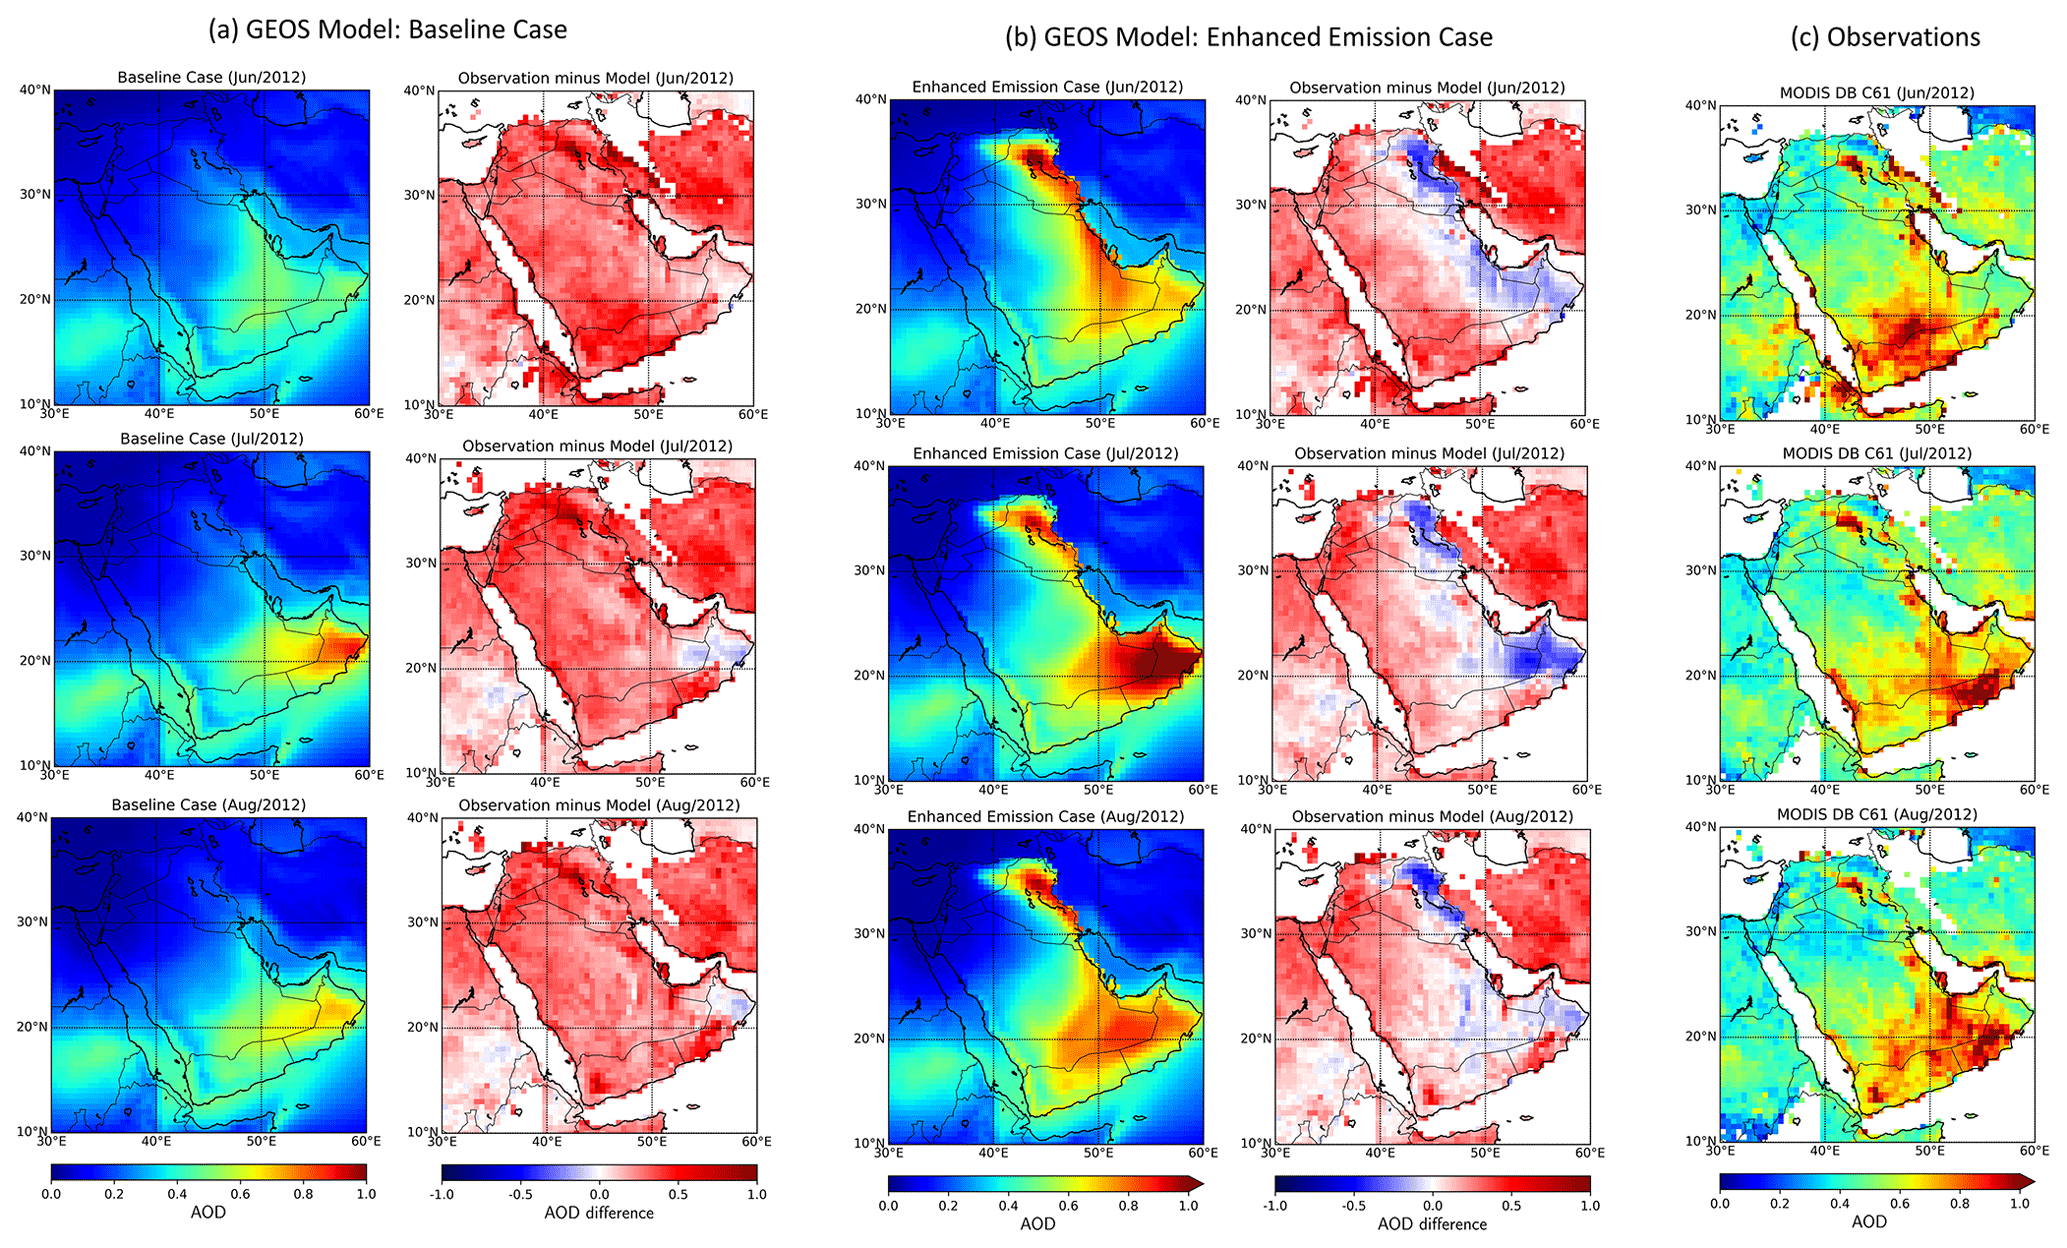
Figure 8Monthly AOD and difference between MODIS DB C6.1 observations and GEOS model simulations for the months of June, July, and August 2012: (a) baseline case using the standard topographic source, (b) enhanced dust emission sources with optimum matching, and (c) MODIS DB C6.1 AOD.
The determination of a vegetation index is usually associated with high uncertainty, as retrievals of the NDVI over this region can be influenced by dust aerosols given that the surface reflectance used to compute the NDVI can be affected by absorbing aerosols. Different sensors or algorithms have shown consistent results indicating the existence of deforestation over this region. The gross primary production (GPP), which represents the amount of carbon dioxide (CO2) assimilated by plants through photosynthesis, is an important indicator of vegetation. The GPP product archived at the NASA Aura Validation Data Center (AVDC) was derived using neural networks combined with the bidirectional reflectance distribution function (BRDF) and nadir-adjusted reflectance (NBAR) products from the MODIS instrument. It also incorporates global GPP estimates from selected FLUXNET2015 eddy covariance tower sites (Joiner and Yoshida, 2020). Figure 6e shows the slope for the MODIS and FLUXNET-derived global daily terrestrial gross primary production (FluxSat GPP) product. In this product, the productivity of biomass is expressed in units of biomass carbon (g m−2 d−1), which is similar to the NDVI. The negative slope for the productivity biomass over the Fertile Crescent is an additional indicator of a decrease in vegetation in that region.
3.2 Model simulation to test effects of enhancing dust emissions over areas with decreasing vegetation
Changes in vegetation coverage were not directly taken into account in the version of the GEOS model on which the MERRA-2 reanalysis and MERRA-2 GMI Replay are based, given that the efficiency of emissions is specified by the topographic source function that is static over time (S in Eq. 1). Additionally, as seen in Fig. 4a–d, variations in the 10 m wind speed and soil moisture in the model were mostly negligible over the region, and indeed the impact of those changes is revealed as having only a small impact on the computed dust emissions (Fig. 4e–f). For the few locations where statistically significant changes in dust emission happened, they mostly tended to decrease the emissions. In the region where the changes tended to increase emissions, this did not have a great impact.
A study by Kim et al. (2013) showed that the time dependence of global dust sources can have significant impacts on dust simulations near source regions. However, the static topographic source function used in the MERRA-2 reanalysis and MERRA-2 GMI Replay does not incorporate a time-varying NDVI. To assess the impact of the variation in vegetation on dust emissions, we performed a GEOS simulation (baseline case) using the default static topographic depression source map (Fig. 7a) and a second simulation with a modified source (dust-enhanced case). The mask (Fig. 7b) was obtained by selecting grid cells with NDVI variations smaller than −0.0025 per year. The apportioned model run with the mask allowed the simulation of the dust emissions only in the region where observations indicate desertification. Both simulations (baseline and dust-enhanced case) were performed with a similar configuration and were replayed to the MERRA-2 meteorology.
The comparison of the GEOS model simulations for June, July, and August of 2012 shows the baseline case (Fig. 8a) and the case with enhanced dust emission (Fig. 8b). The sensitivity study was performed during this time period because it corresponds to the highest observed AOD and lowest NDVI values in the Fertile Crescent region. NDVI values over the Fertile Crescent region remained around 0.1 (bare ground) throughout that entire year. However, it is important to note that we did not use the NDVI values in the GEOS simulation. Instead, we allowed more emissions in the grid boxes where the NDVI values changed significantly. The results confirm that the enhancement of dust emissions in the Fertile Crescent region increases dust AOD downwind. The contribution of the dust from the masked region was added to the total AOD. In order to find the optimum enhancement factor, we minimized the difference between MODIS Deep Blue Collection 6.1 monthly mean AODs and the model-simulated values for the dust-enhanced case in the grid boxes covering the Middle East region. We found that emissions over the Fertile Crescent would have to be enhanced by a factor of 10 for optimum matching with the observations. These enhancement factors were found to be 11.04, 11.26, and 9.27 for June, July, and August of 2012, respectively, and are shown in Fig. 8b.
Simulation with the enhancement of dust emission in the Fertile Crescent reduced the overall differences between the AOD from the model simulation and MODIS observations in downwind regions, specifically in the central and western areas (Fig. 8a–b, panels on the right). However, they also show that AOD can be overestimated regionally near the east coast, which implies that particular attention should be given to regional studies.
Analysis using observations from the Moderate Resolution Imaging Spectroradiometer (MODIS) Collection 6.1 and the Multi-angle Imaging Spectroradiometer (MISR) shows a positive slope of the de-seasonalized AOD (i.e., the AOD with the monthly climatology of the seasonal cycle removed) over an extended region in the Middle East, with a positive significant AOD trend of 0.02–0.04 per year in some areas during the period between 2003–2012. MISR AOD trends are notably higher than those from MODIS on the southeast border of Saudi Arabia with Oman and the United Arab Emirates. Ground-based AOD observations from AERONET at Solar Village captured a positive AOD trend of 0.017 per year over the same period.
The MERRA-2 reanalysis (with aerosol data assimilated) captures part of this southern variability, though at a smaller magnitude. MERRA-2 GMI Replay (without aerosol data assimilated) is unable to capture most of this variability. Both the reanalysis and GMI Replay use approximately the same wind fields. The slope of the 10 m wind speed, which is used to calculate dust emissions, shows statistically significant negative variation over a few small areas in Saudi Arabia, which would have contributed to a regional decrease in dust emissions. Because those locations are not highly efficient emitting areas according to the topographic source function, that effect propagated to dust emission does not impact emission significantly.
Different soil moisture datasets were used in the MERRA-2 reanalysis and MERRA-2 GMI Replay. The most notable positive differences between them are seen over Oman and over the Iranian part of the Caspian Sea's coast, where the slope of the surface soil wetness significantly increases in the MERRA-2 reanalysis, but the same is not seen in the slope of the surface soil wetness used in MERRA-2 GMI Replay. These positive slopes would have contributed to an overall decrease in dust emission, but again since they are not a major emitting area, the propagated impact on dust emissions is not significant. Finally, both soil moisture datasets indicate slight decreases in soil moisture over the border between Iraq and Iran which, as seen in Fig. 4c, are not translated into significant variation in dust emissions in a manner that would explain the increase in AOD.
It should be noted, however, that even though surface winds and soil moisture in the model do not seem to produce an overall significant effect on dust emissions, both variables from the MERRA-2 reanalysis and MERRA-2 GMI Replay contain errors, and the trends revealed in Fig. 4 have uncertainties. For instance, surface winds in the reanalysis may be underestimated. A comparison of surface winds from reanalysis with high-frequency wind observations shows many significant biases, including incorrect annual and seasonal dependences and systematic underestimation of the strongest winds speeds, which can directly impact estimates of dust emission (Largeron et al., 2015; Evan, 2018). Similarly, soil moisture also contains errors since, besides observed precipitation over land, MERRA-2 does not assimilate land surface observations (Reichle et al., 2017a).
The variation in the slope of the AOD analysis increment assimilated in the MERRA-2 reanalysis, similarly to the observations, shows a significant positive AOD increase over the Middle East region, which shows the importance of the aerosol data assimilation and highlights the need to improve the description of the parameters and processes related to the dust properties, emission, and transport in the model. Further investigation with long-term and simultaneous observations of meteorological and surface parameters related to dust emission near dust sources seems to be a key requirement to solve the parameterization of dust emission schemes, and these schemes are essential in order to capture dust emission and AOD variability in the models.
The exact causes of the recent AOD increase in the Middle East have not been clearly identified, but amongst many factors, it has also been linked to droughts and deforestation. Observations show significant change in vegetation coverage in the Fertile Crescent region over the same period (2003–2012). Negative variation in NDVI values of up to 80 % in the most critical areas just to the northwest of the peak in the AOD has supported these findings, as has the significant increase in the dryness of the soil throughout the region. The sensitivity study confirmed that enhancing dust emissions in the Fertile Crescent region can reduce the overall differences between the model simulation and MODIS observations comparatively to a baseline case that used the default dust emission scheme based on a topographic source. These results support the hypothesis that the increasing AOD observed in the Middle East region could have been associated with land use and reduction in the vegetation in the region of the Fertile Crescent, which potentially expose more bare soils, increasing dust emissions. However, while the enhancement of the emissions improves AOD in the central and western areas, it does overestimate it near the east coast, which shows the limitations of this approach for solving regional studies. This work underlines the need for long-term ground-based observations near dust-emitting sources to inform models and to track Earth’s long-term variability. The correct spatial and temporal description of dust sources is essential to provide the framework needed for an accurate determination of local and global dust loading and transport.
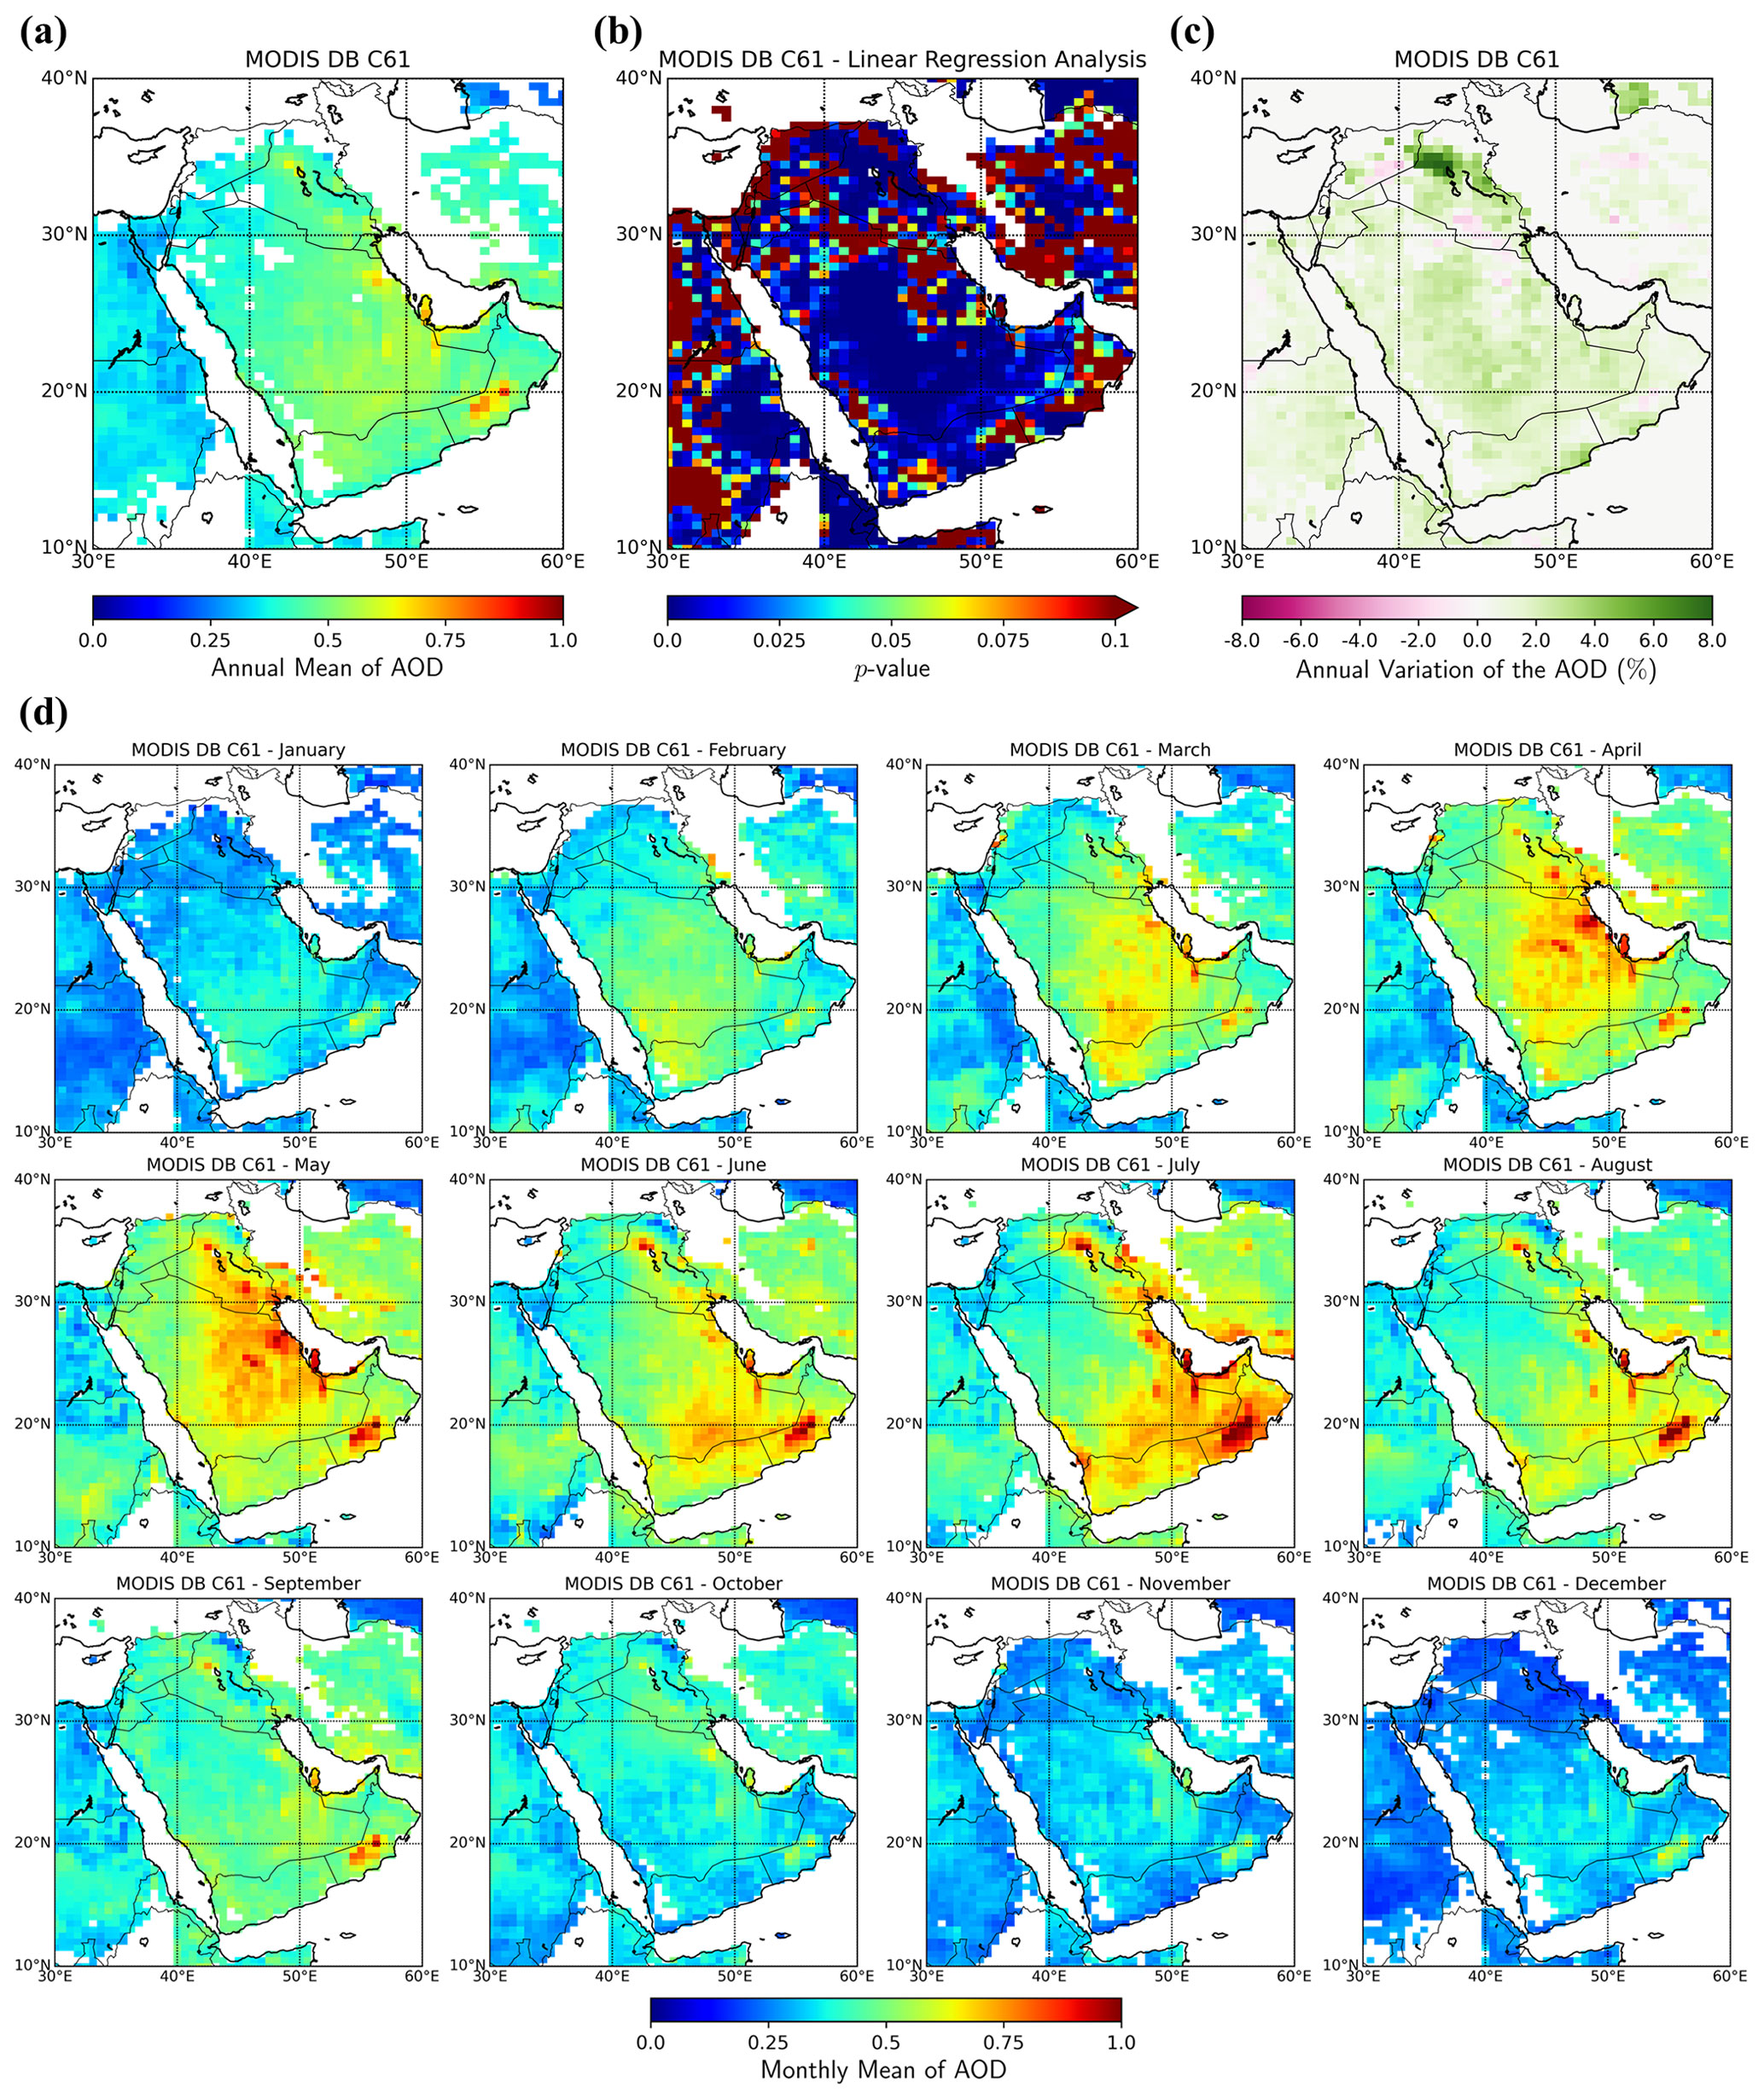
Figure A1AOD from MODIS Deep Blue Collection 6.1 for the period between 2003–2012: (a) annual mean, (b) p values of the linear regression fitting of the slope, (c) annual variation in percent, and (d) monthly means.
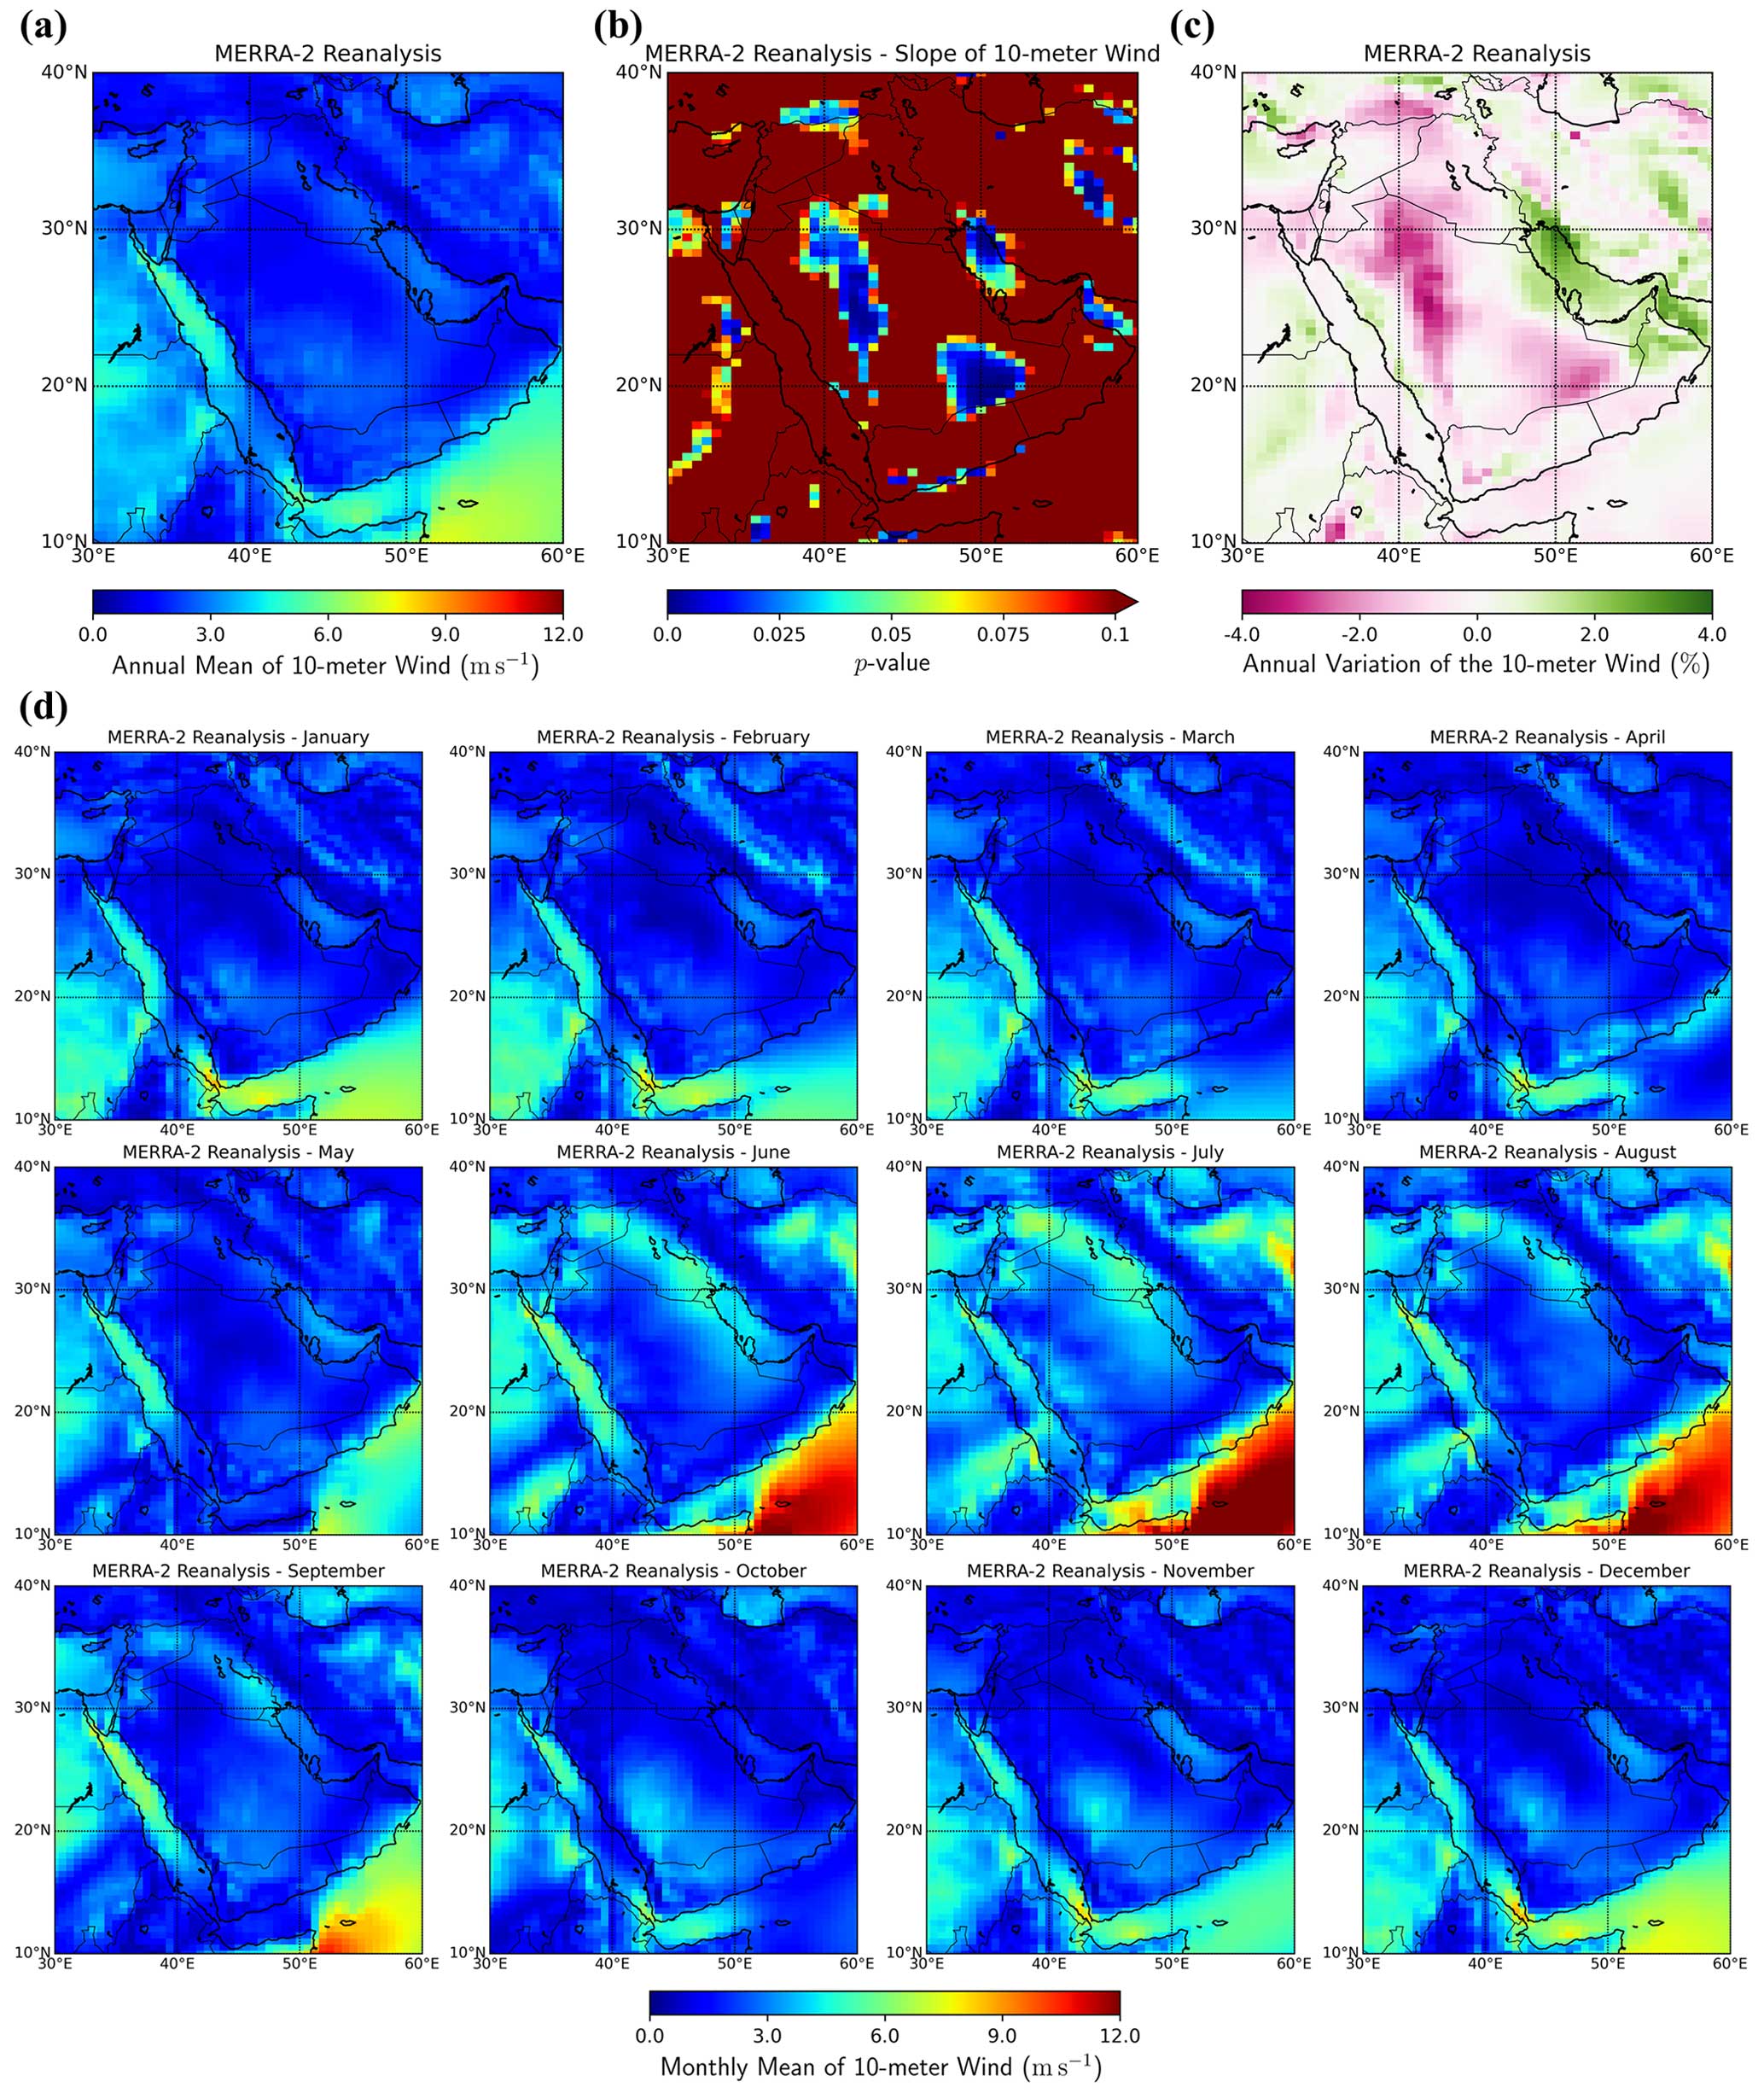
Figure A2MERRA-2 reanalysis – wind speed at 10 m for the period between 2003–2012: (a) annual mean, (b) p values of the linear regression fitting of the slope, (c) annual variation in percent, and (d) monthly means.
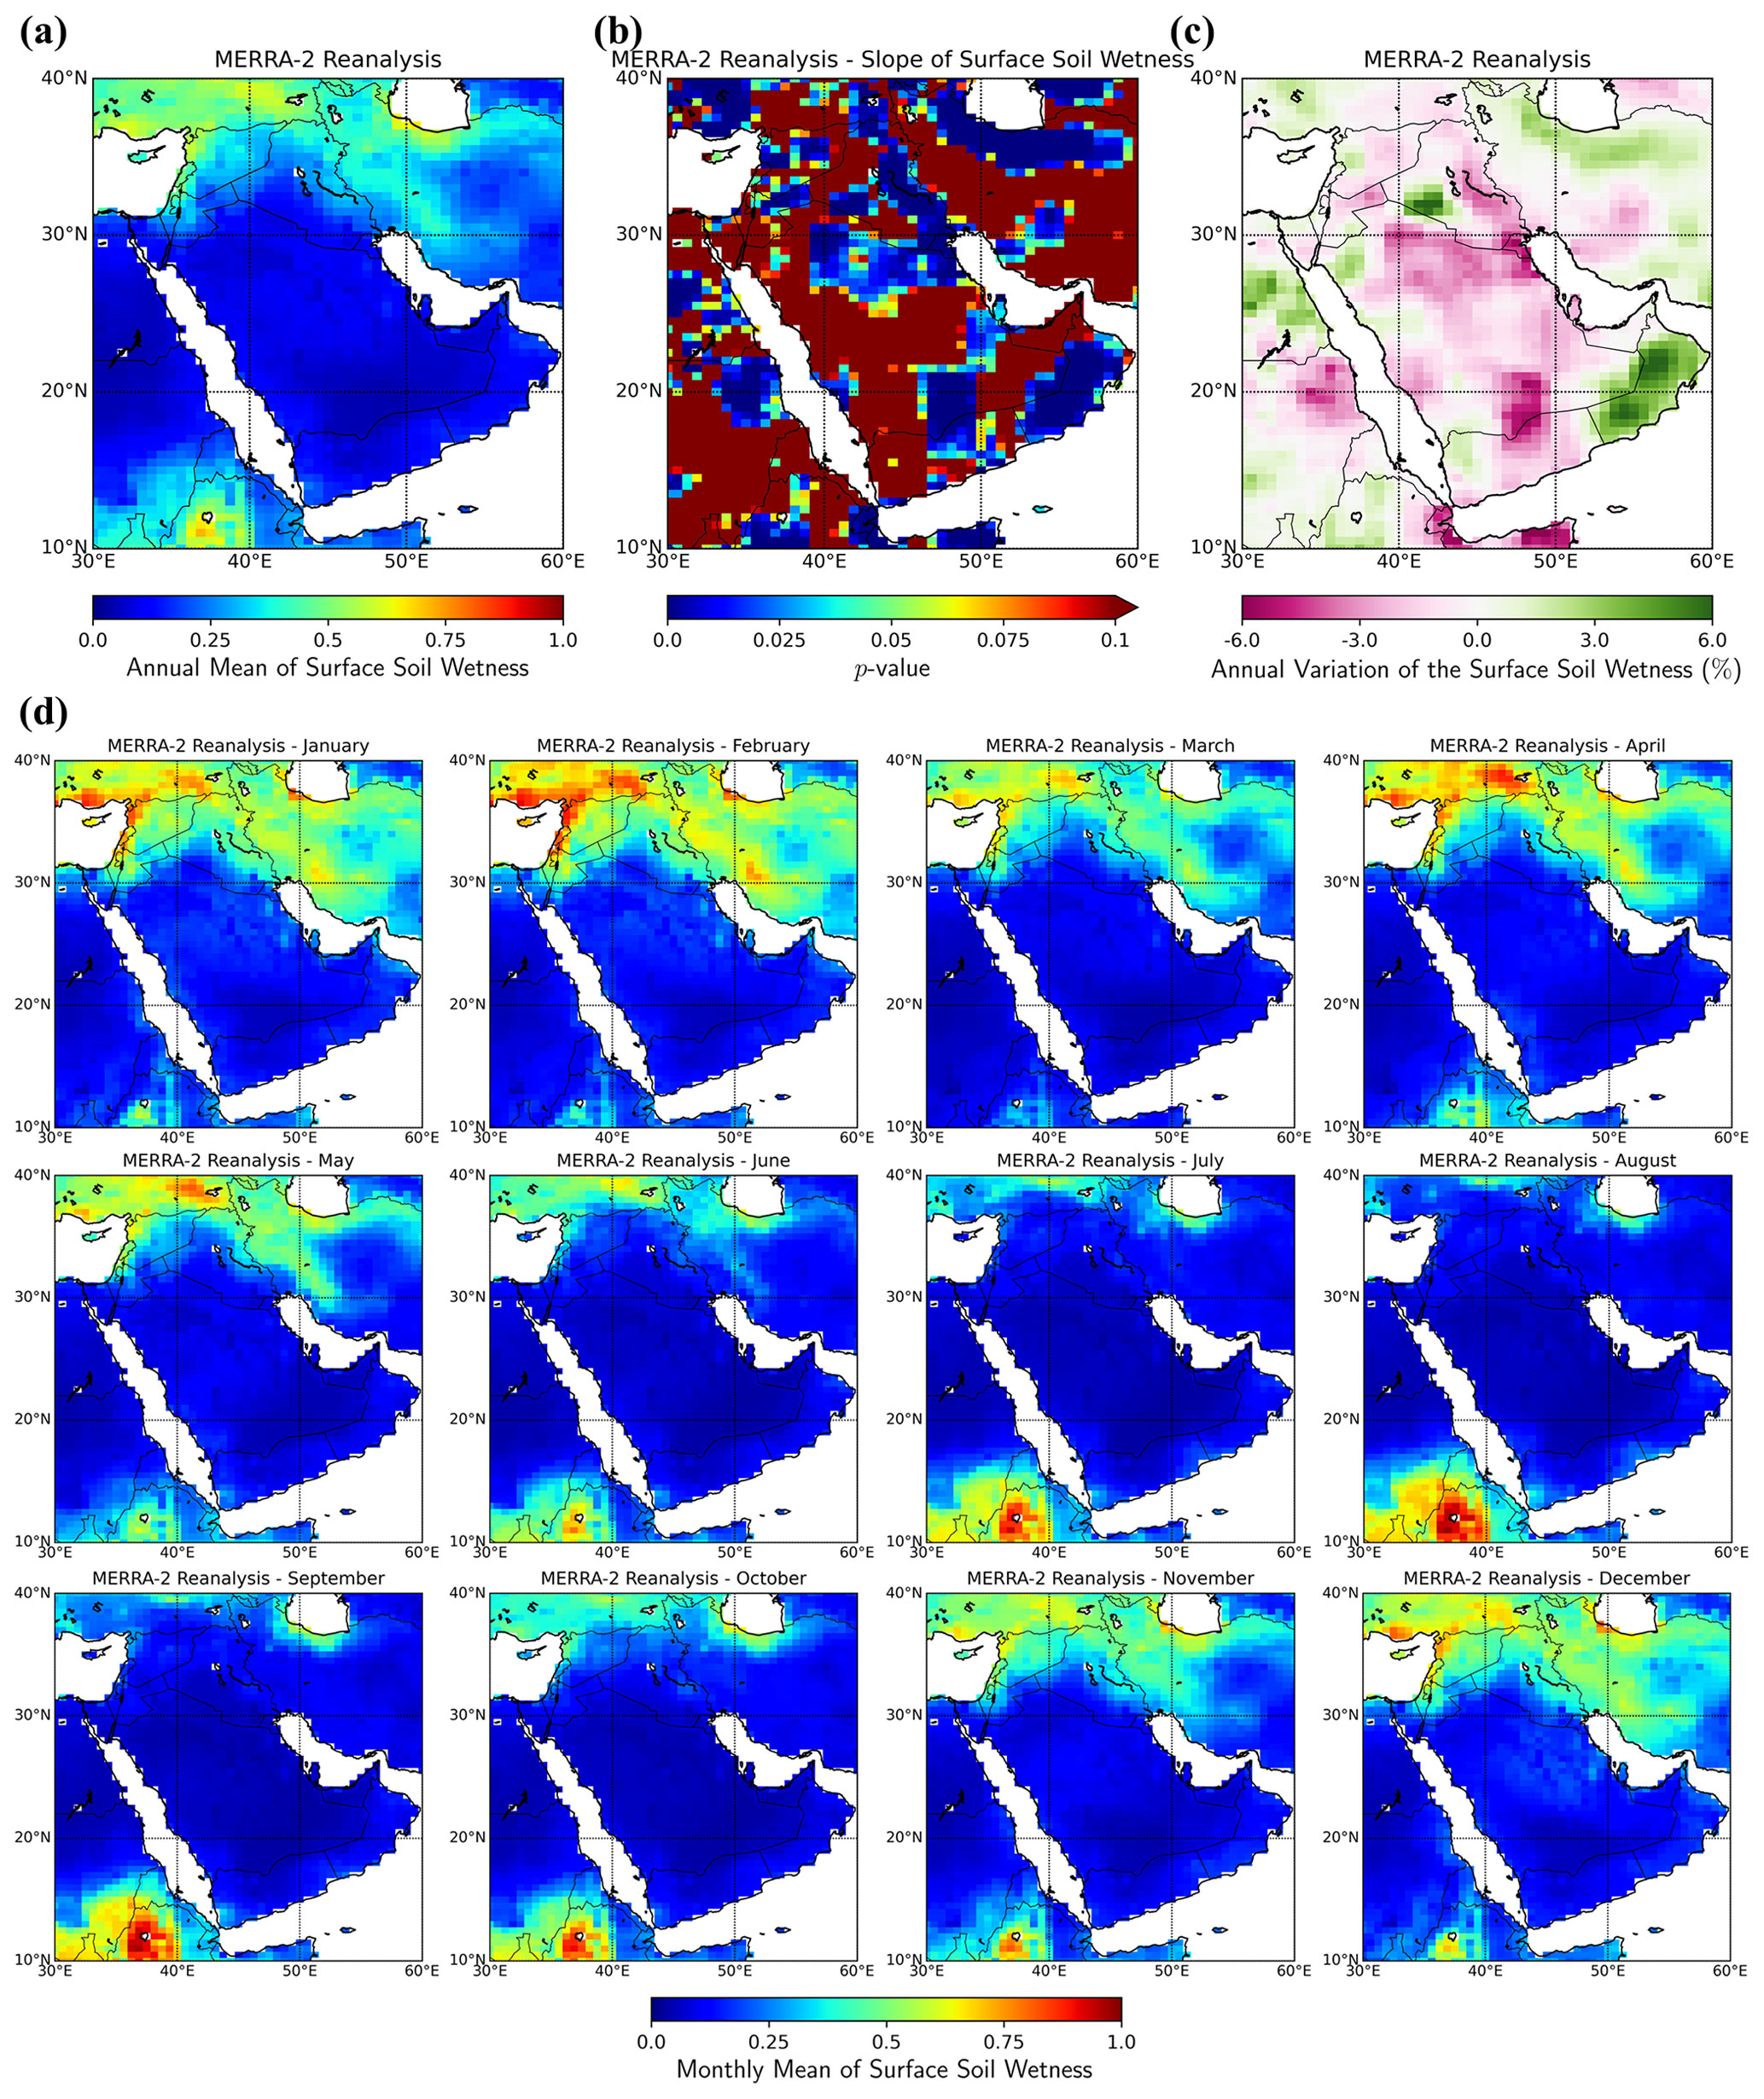
Figure A3MERRA-2 reanalysis – surface soil wetness for the period between 2003–2012: (a) annual mean, (b) p values of the linear regression fitting of the slope, (c) annual variation in percent, and (d) monthly means.
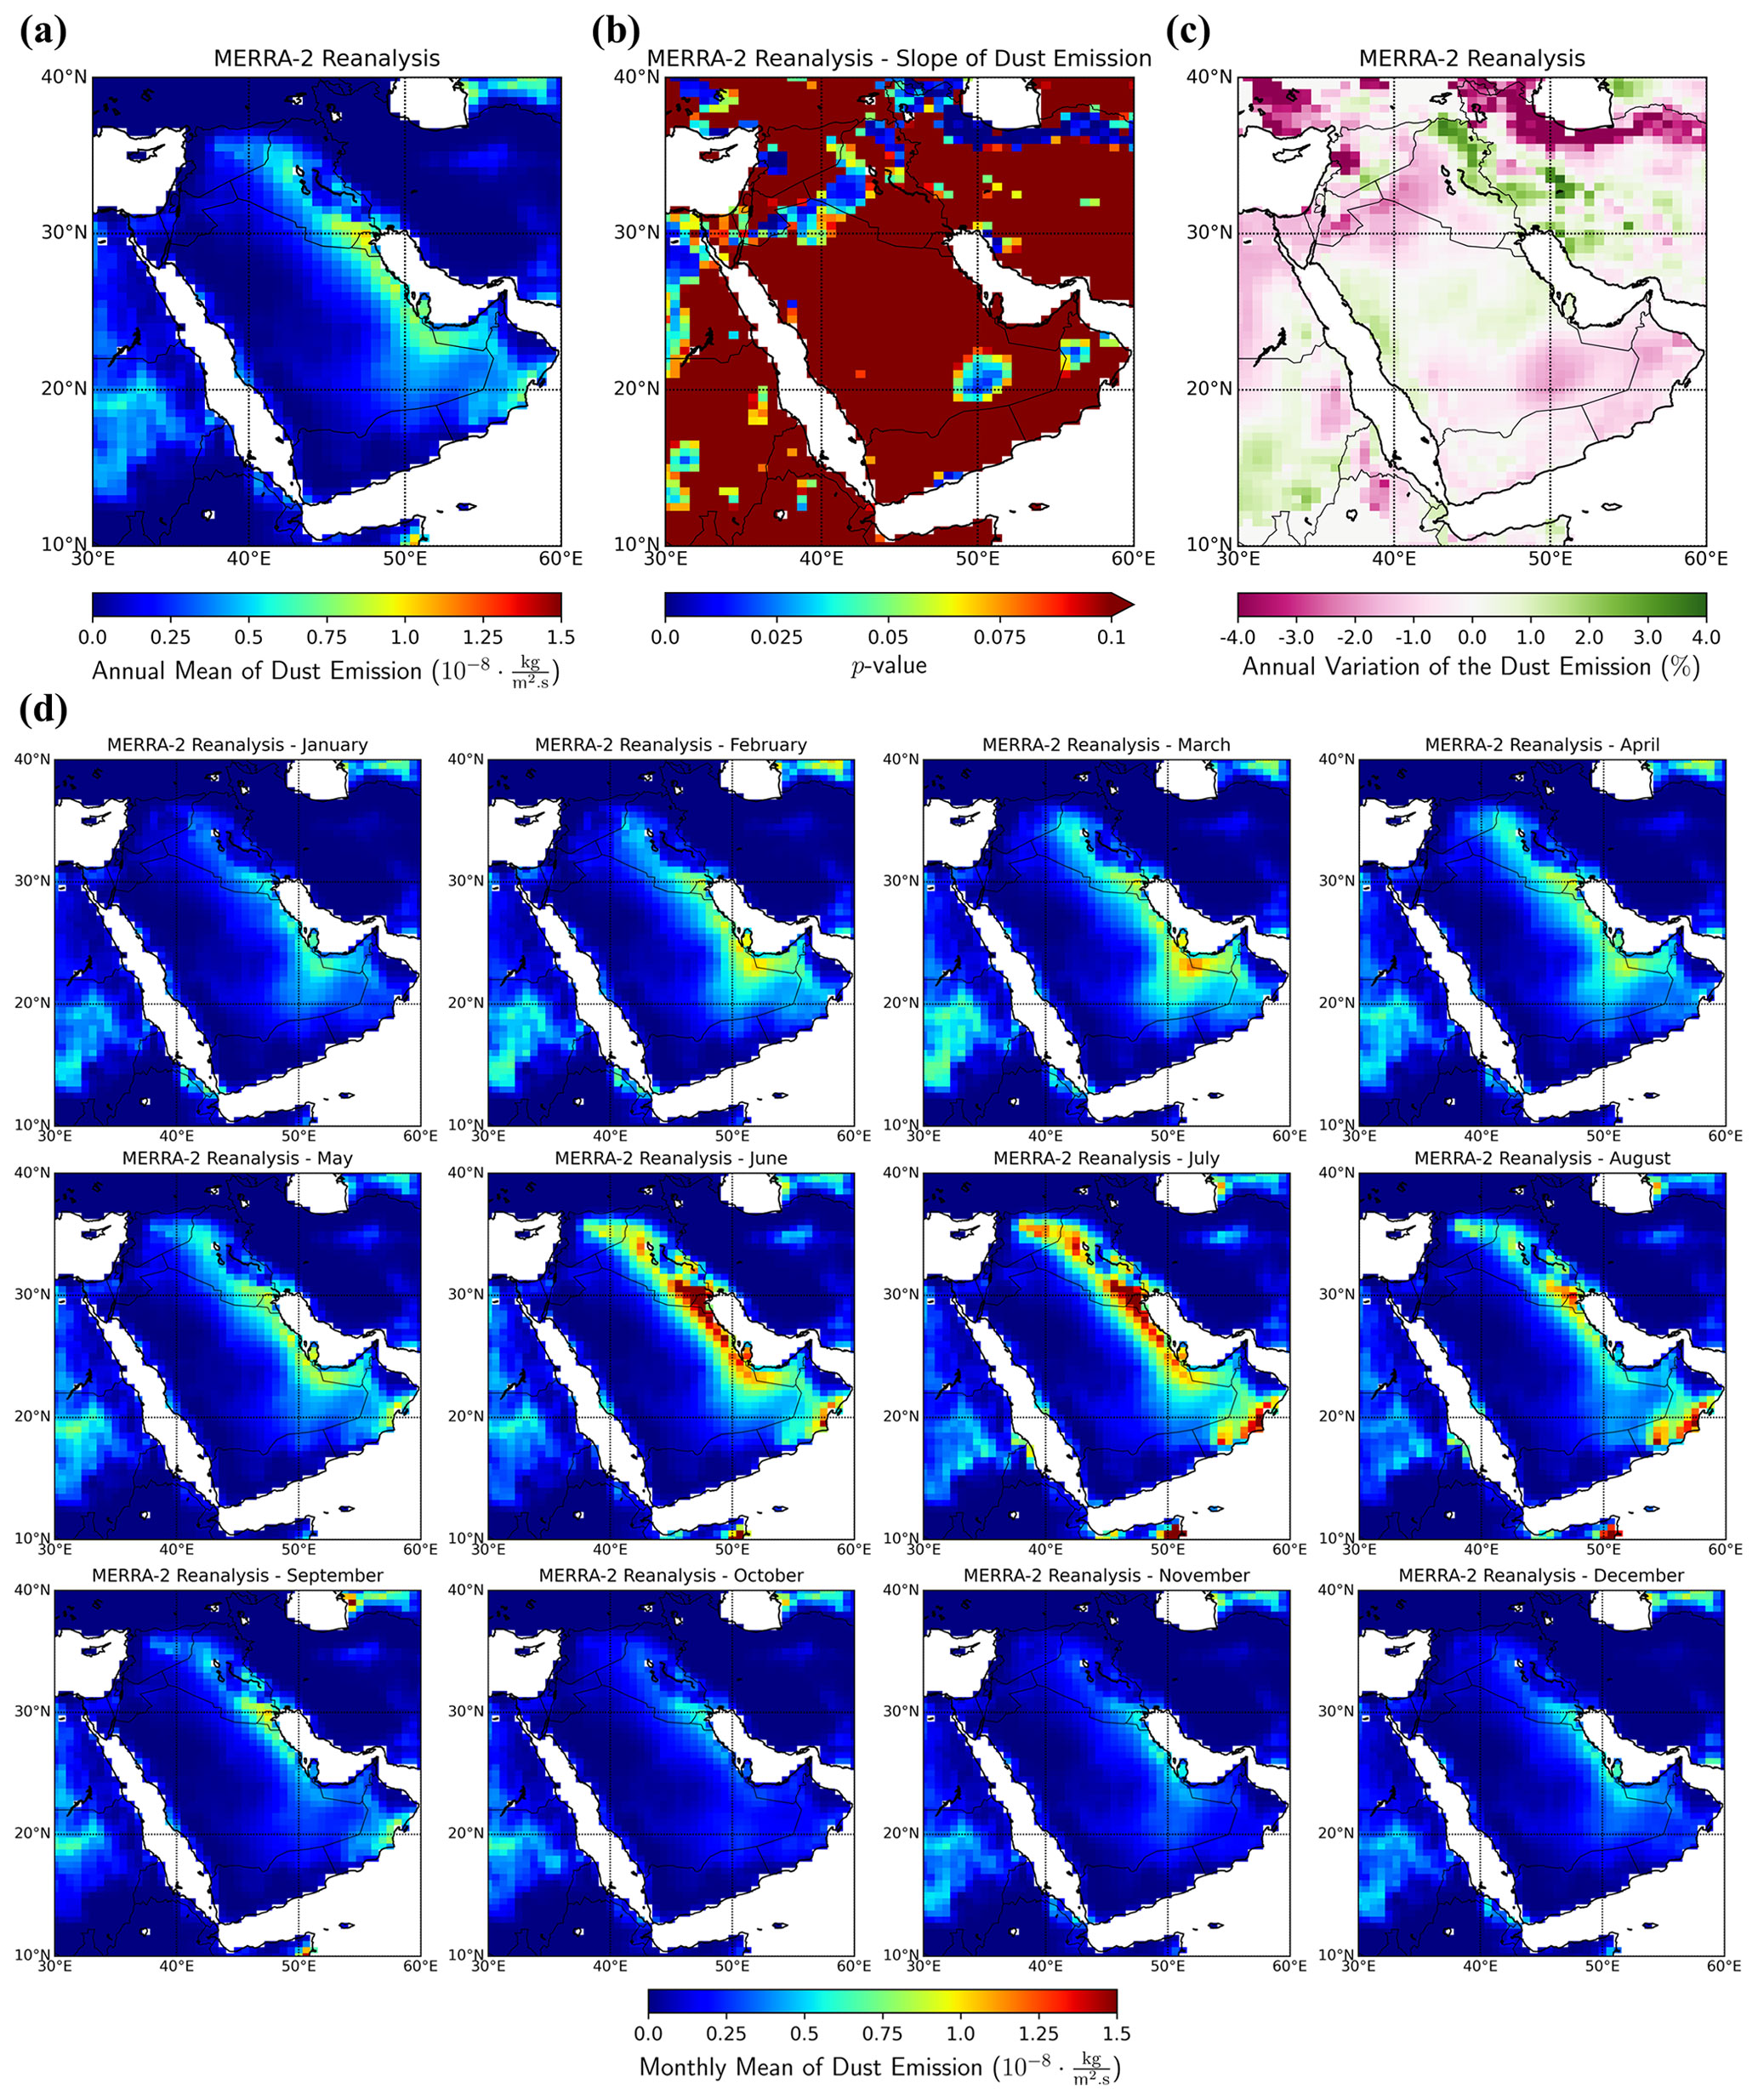
Figure A4MERRA-2 reanalysis – dust emission for the period between 2003–2012: (a) annual mean, (b) p values of the linear regression fitting of the slope, (c) annual variation in percent, and (d) monthly means.

Figure A5MERRA-2 GMI Replay – wind speed at 10 m for the period between 2003–2012: (a) annual mean, (b) p values of the linear regression fitting of the slope, (c) annual variation in percent, and (d) monthly means.
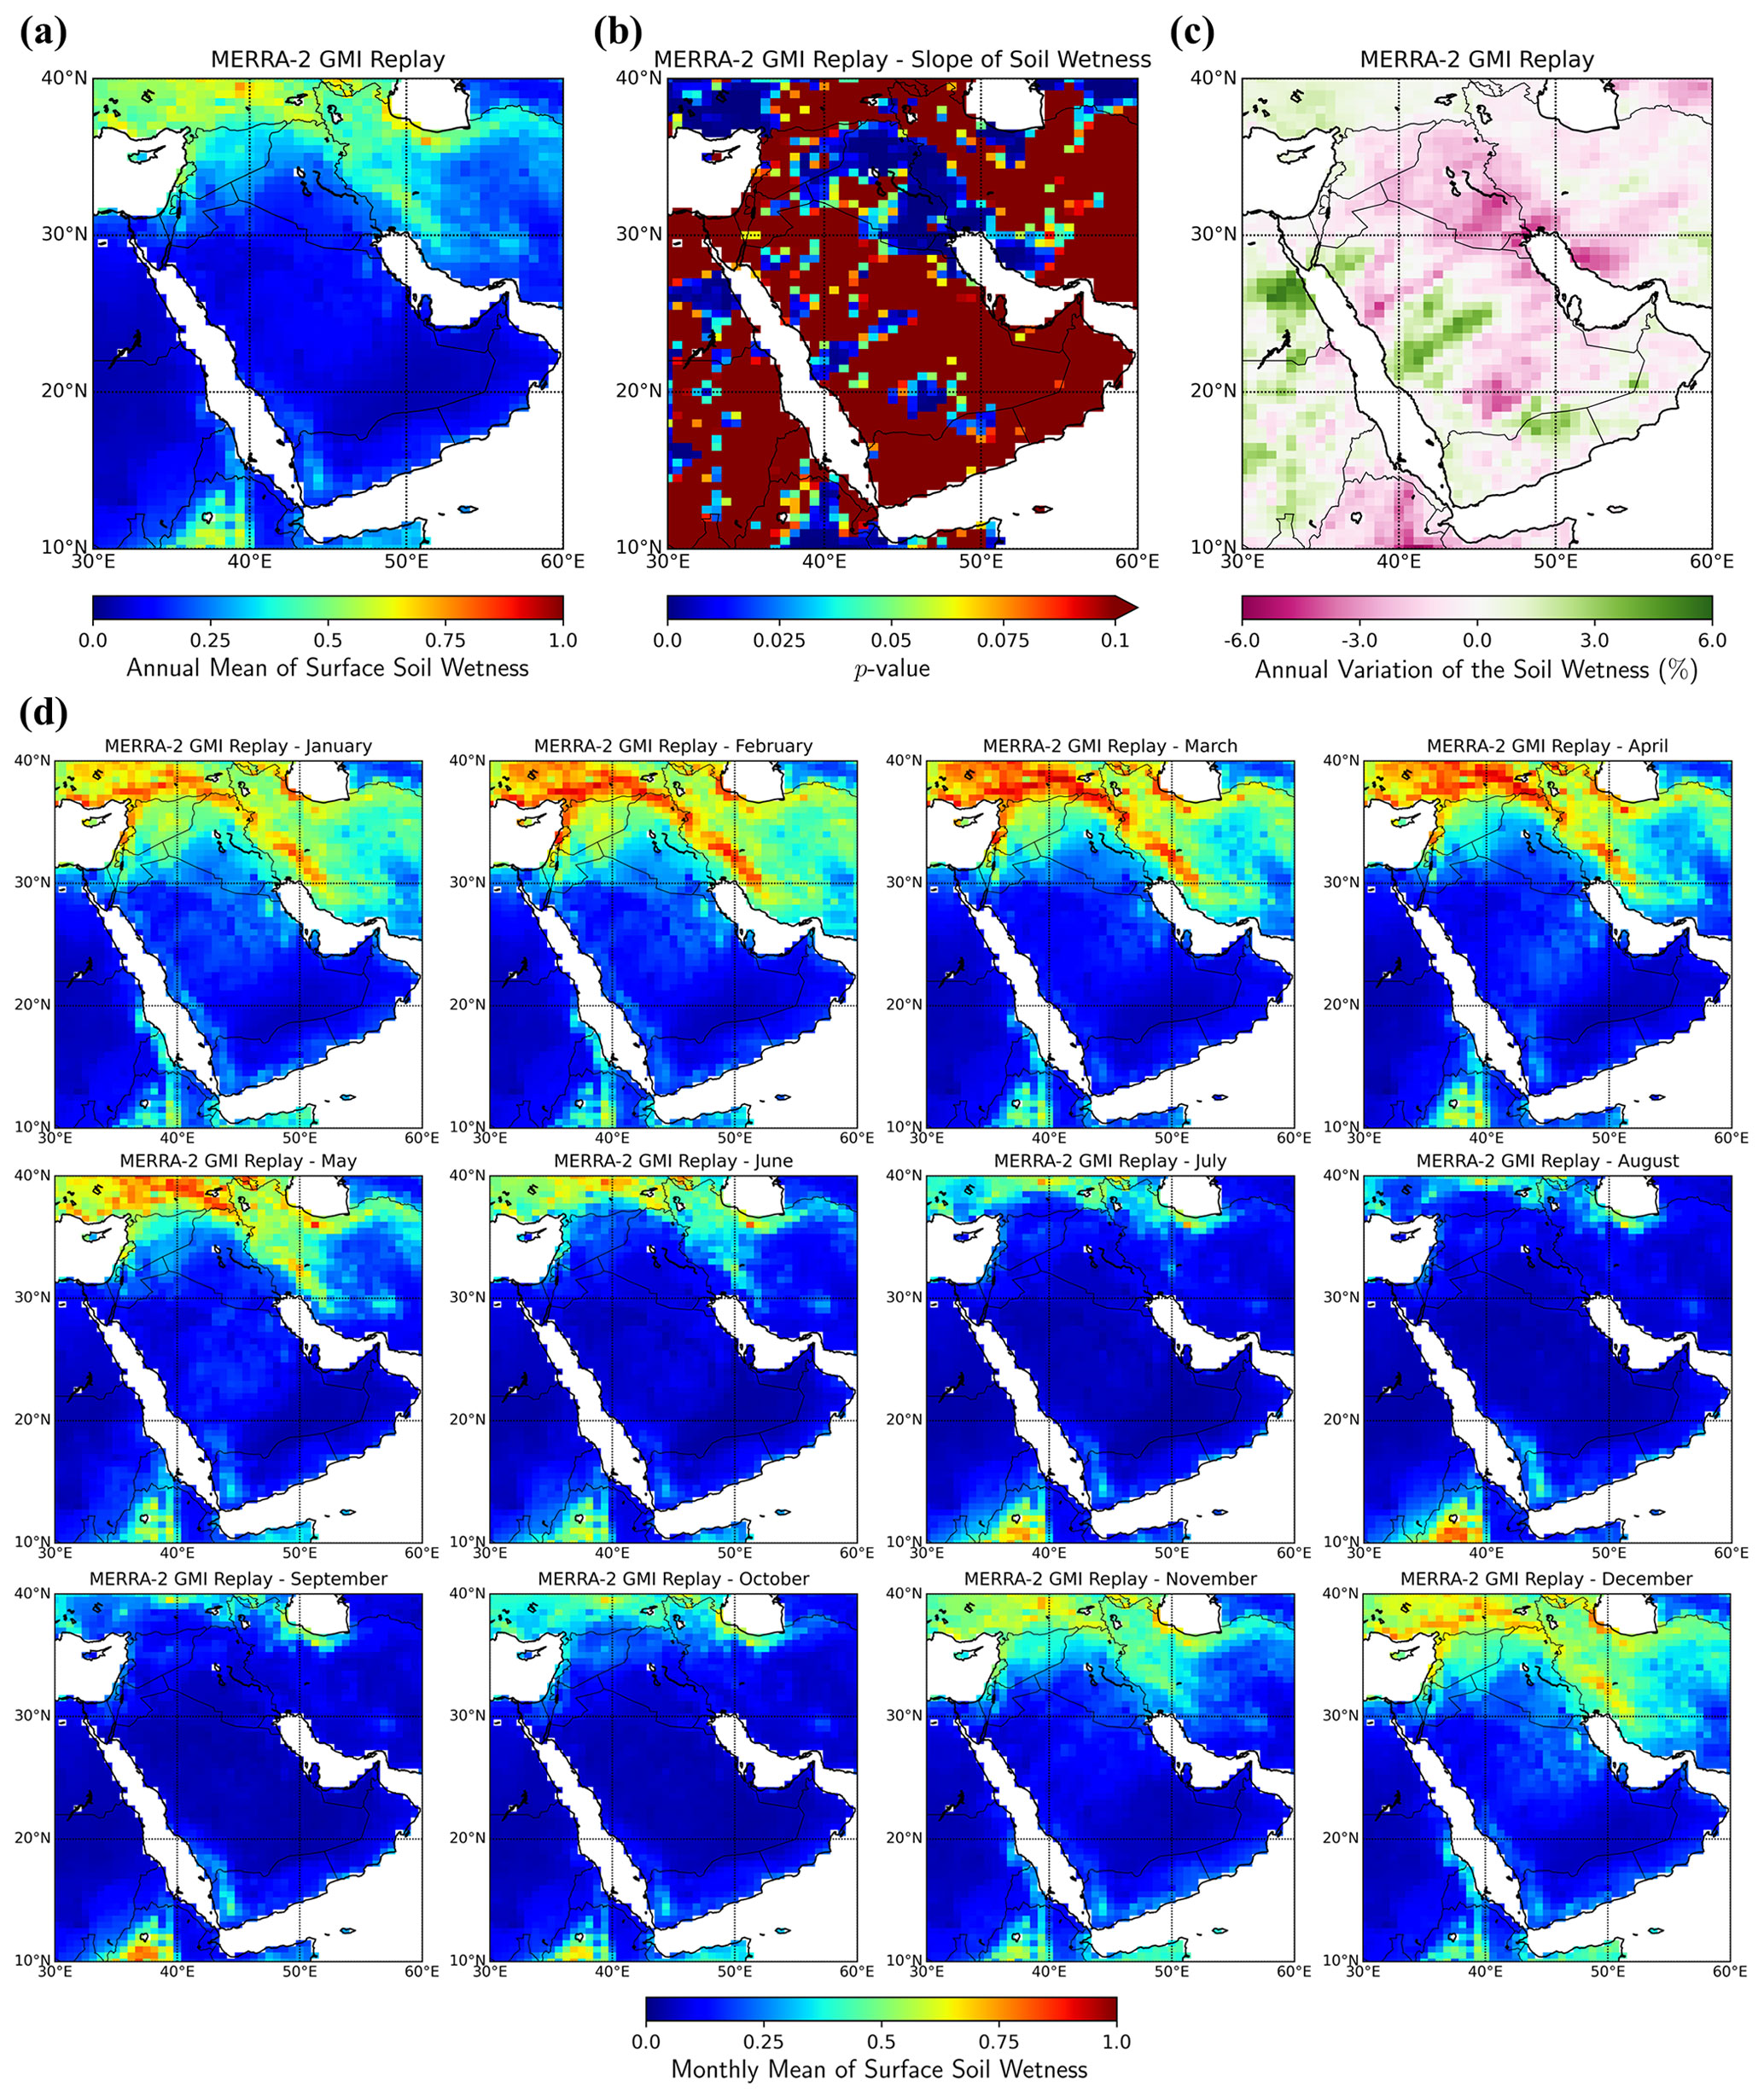
Figure A6MERRA-2 GMI Replay – surface soil wetness for the period between 2003–2012: (a) annual mean, (b) p values of the linear regression fitting of the slope, (c) annual variation in percent, and (d) monthly means.
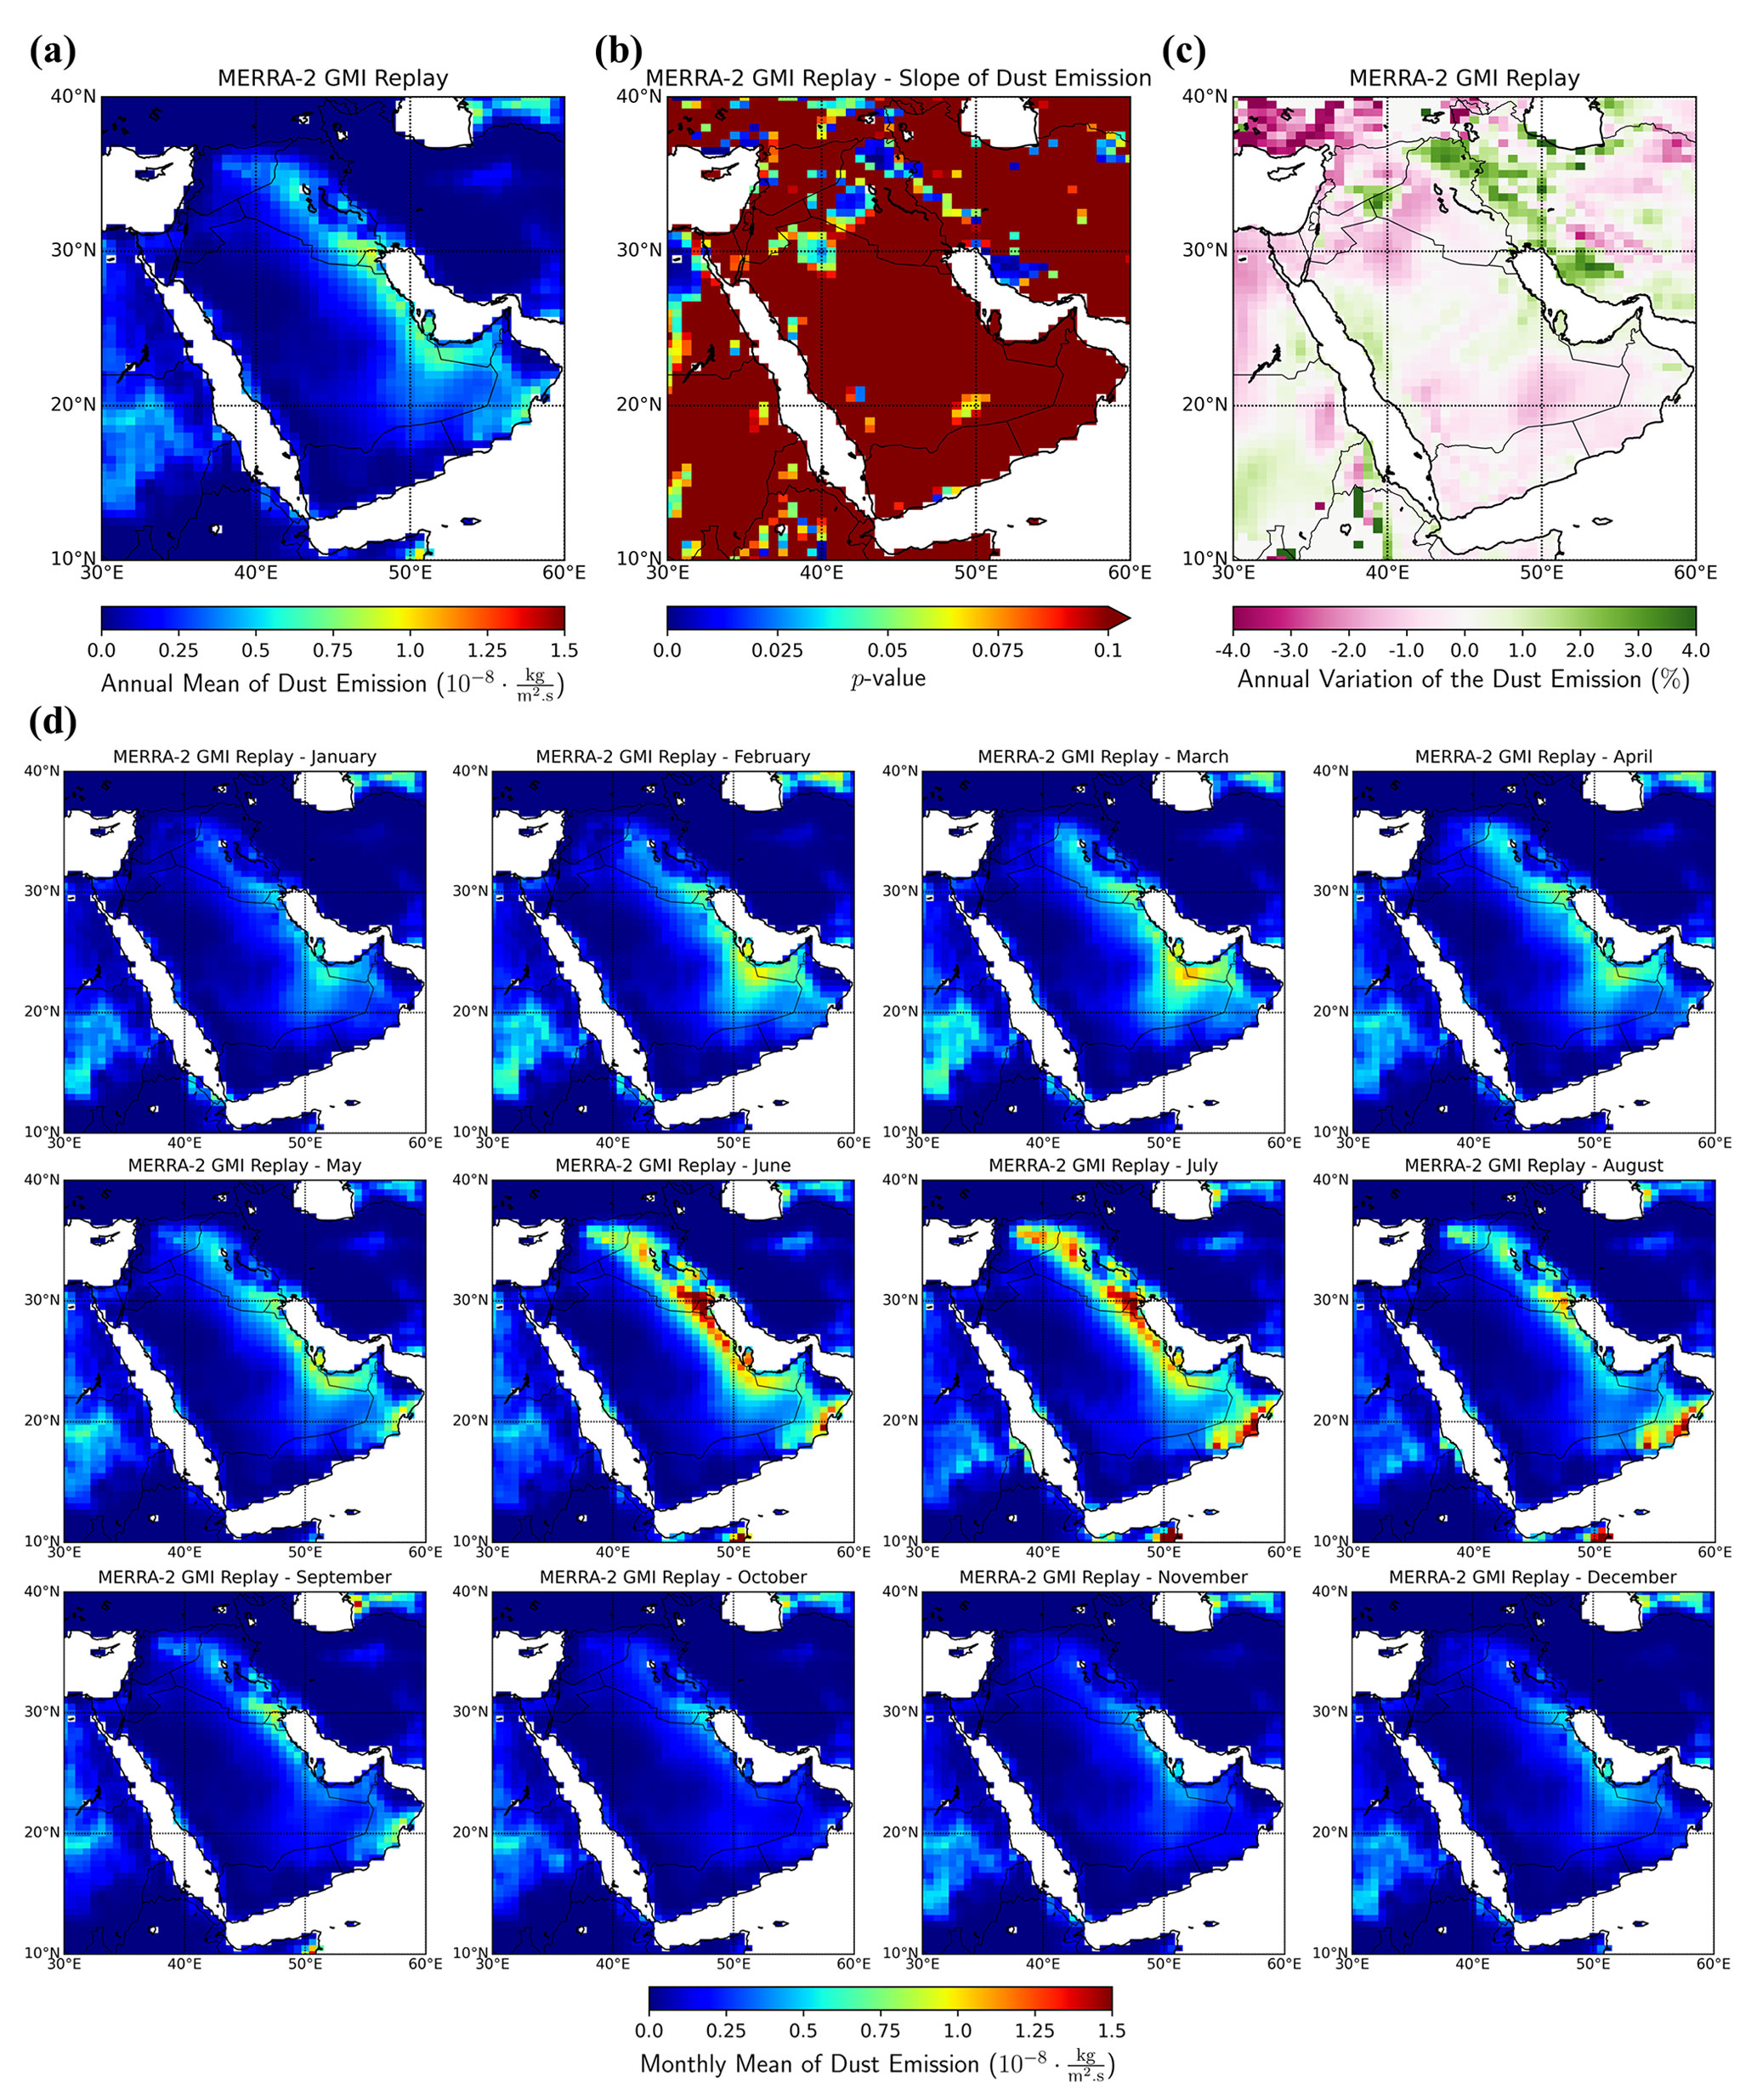
Figure A7MERRA-2 GMI Replay – dust emission for the period between 2003–2012: (a) annual mean, (b) p values of the linear regression fitting of the slope, (c) annual variation in percent, and (d) monthly means.
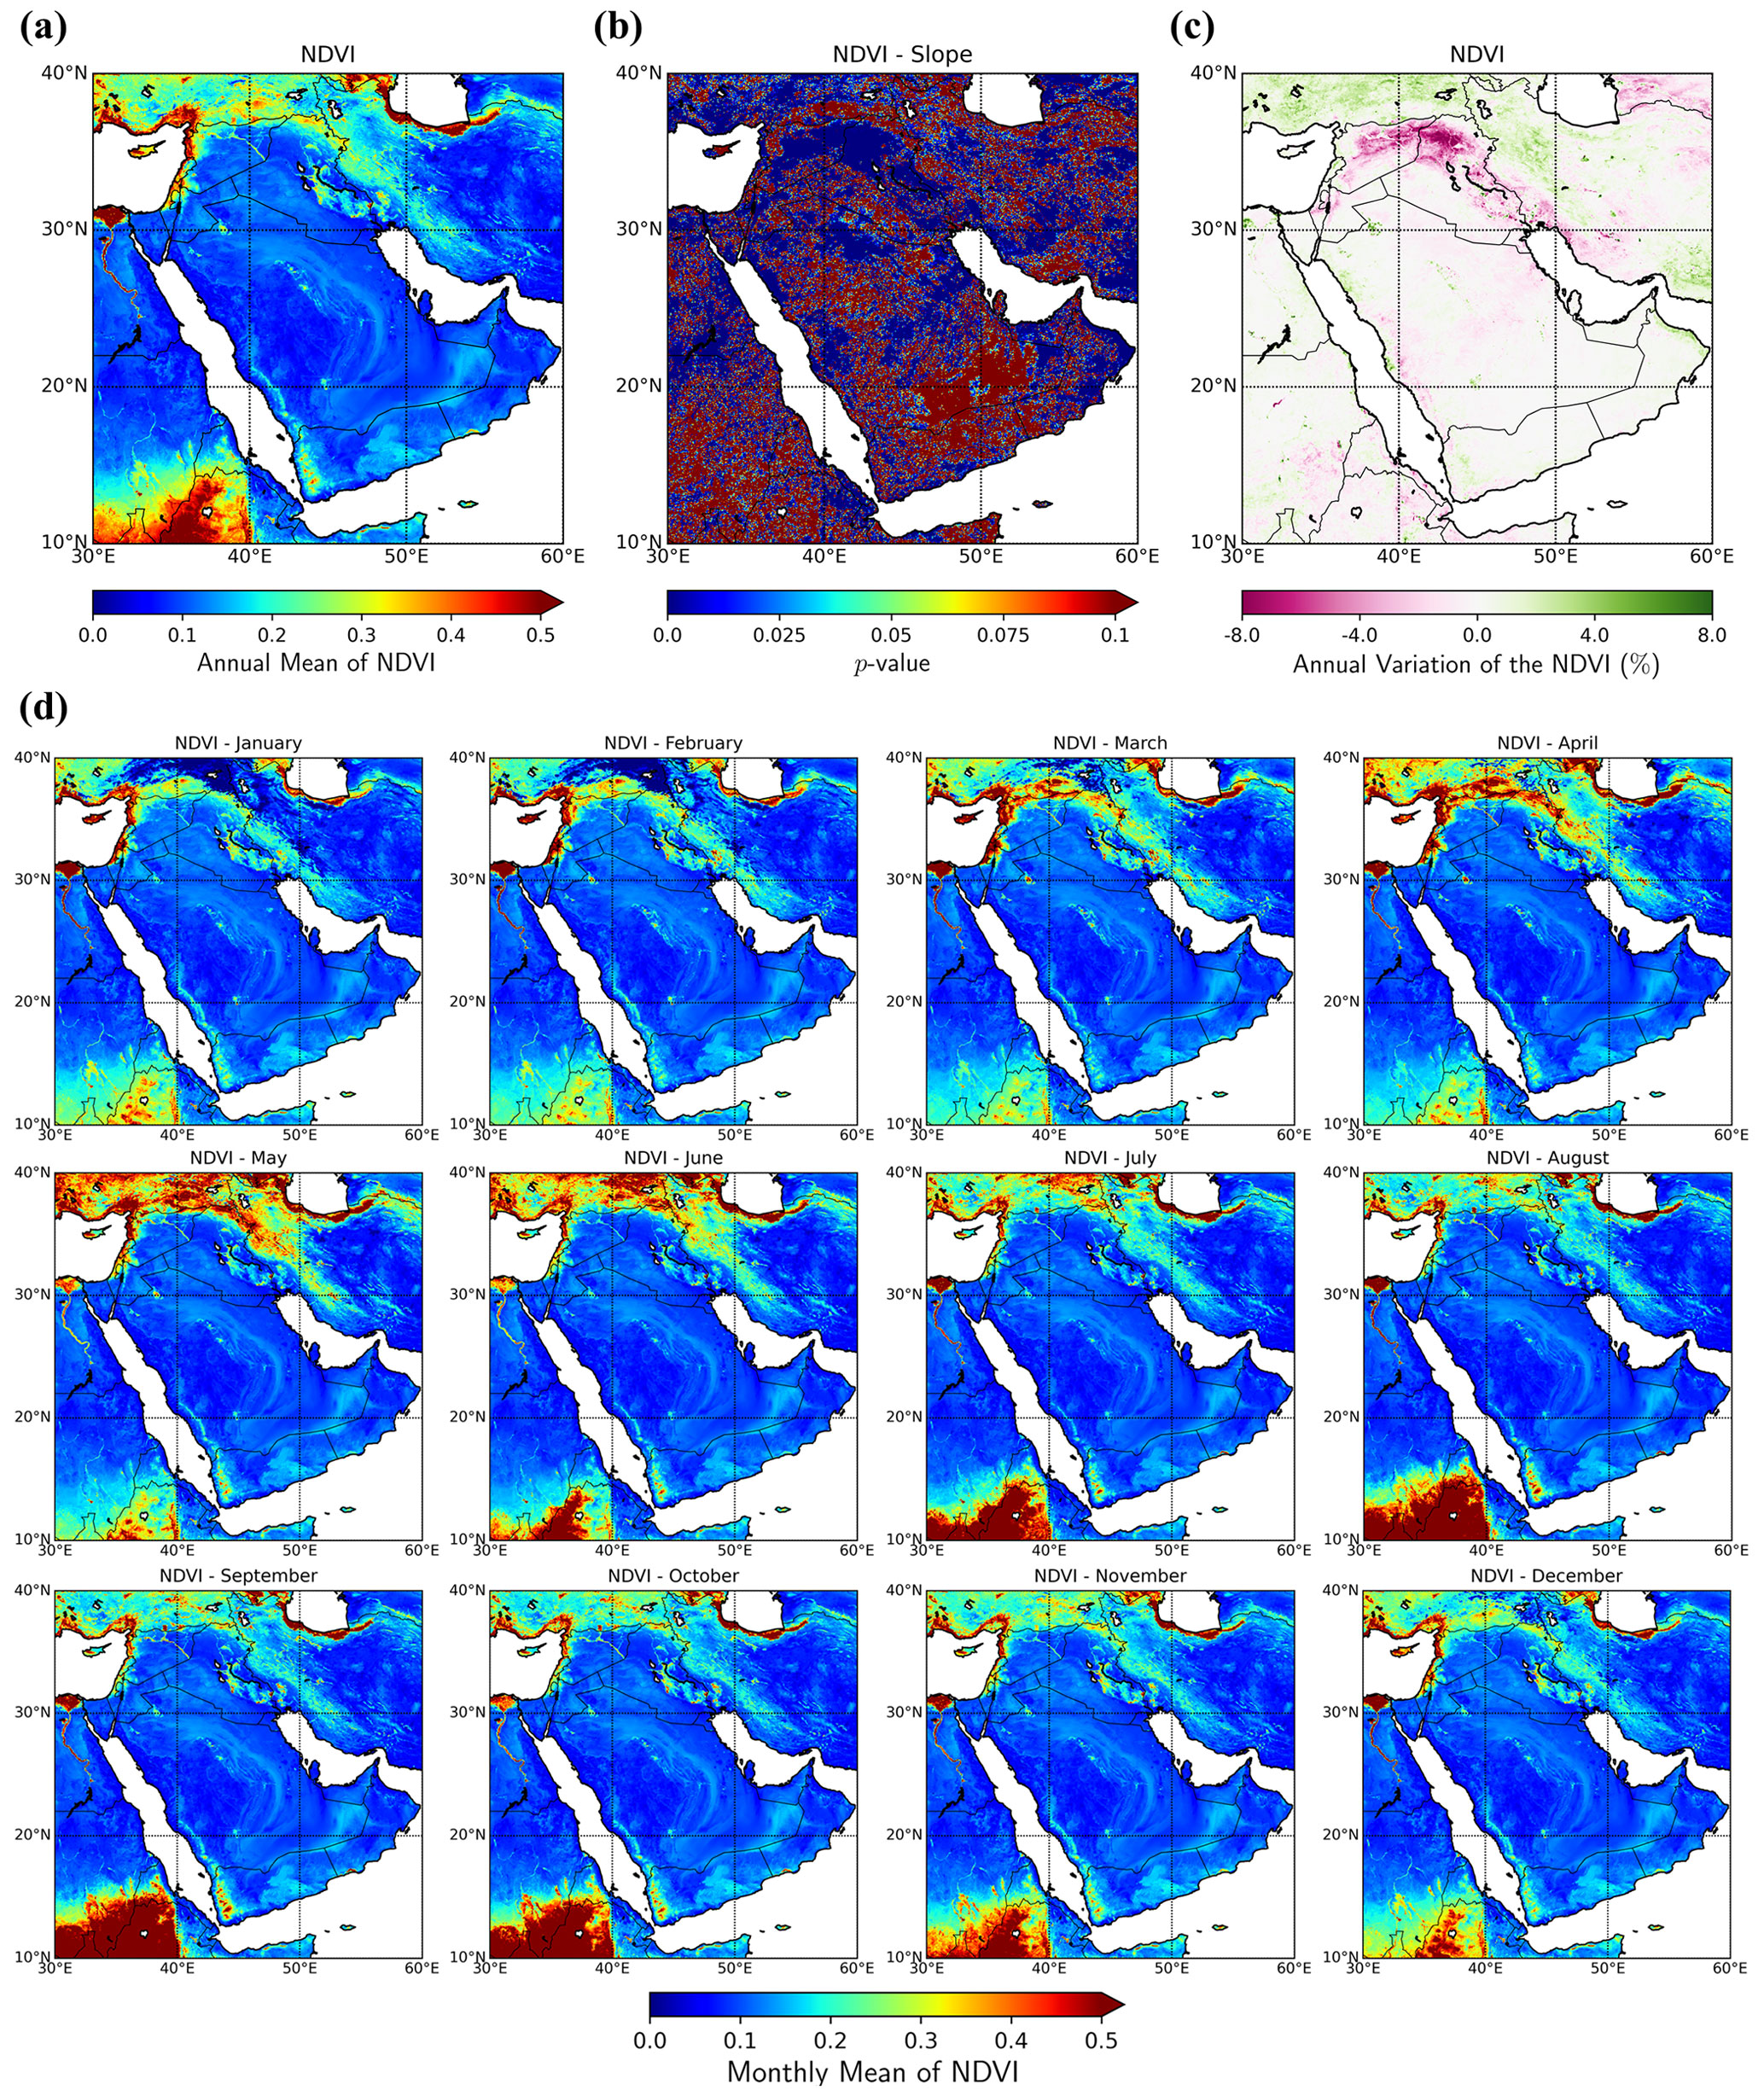
Figure A8Normalized difference vegetation index (NDVI) for the period between 2003–2012: (a) annual mean, (b) p values of the linear regression fitting of the slope, (c) annual variation in percent, and (d) monthly means.
Aerosol optical depth datasets from MODIS Deep Blue Collection 6.1 and the MISR Level 2 product are available at https://ladsweb.modaps.eosdis.nasa.gov/search/order/2/MOD04_L2-61 (Levy and Hsu, 2015, last access: February 16, 2024) and https://asdc.larc.nasa.gov/project/MISR/MIL2ASAE_3 (NASA/LARC/SD/ASDC, 1999). Aerosol Robotic Network (AERONET) aerosol datasets are available at https://aeronet.gsfc.nasa.gov/ (AERONET, 2024). The MERRA-2 reanalysis and MERRA-2 GMI Replay data are available in the following repositories: https://disc.gsfc.nasa.gov/ (GMAO, 2015) and http://acd-ext.gsfc.nasa.gov/Projects/GEOSCCM/MERRA2GMI/ (GMI, 2017). The normalized difference vegetation index (NDVI) from the MYD13C2 MODIS Version 6 data product is available at https://doi.org/10.5067/MODIS/MYD13C2.006 (Didan, 2015, last access: February 16, 2024). The daily FluxSat GPP product can be accessed at https://doi.org/10.3334/ORNLDAAC/1835 (Joiner and Yoshida, 2021).
ARL was responsible for the implementation, scientific analysis, and preparation of this paper. PC made substantial contributions to the concept, design, and interpretation of results presented in this paper. AD provided scientific and technical expertise and assisted with a critical revision of this paper. EN and AS contributed with scientific advice. LO provided expertise on the MERRA-2 GMI Replay datasets.
The contact author has declared that none of the authors has any competing interests.
Publisher’s note: Copernicus Publications remains neutral with regard to jurisdictional claims made in the text, published maps, institutional affiliations, or any other geographical representation in this paper. While Copernicus Publications makes every effort to include appropriate place names, the final responsibility lies with the authors.
The authors thank the principal investigators and their teams for making available the MODIS, MISR, AERONET, and FluxSat GPP products. This research was funded by the NASA ACMAP project “Assessment of the spatial and temporal variability of mineral dust aerosols in the Middle East and North Africa using observations and modeling” (grant no. NNX17AH28G), with Richard Eckman and Kenneth Jucks as program managers. Simulations with the GEOS model were performed at the NASA Center for Climate Simulation (NCCS) computational facility.
This research has been supported by the National Aeronautics and Space Administration (grant no. NNX17AH28G).
This paper was edited by Ashu Dastoor and reviewed by three anonymous referees.
Adamo, N., Al-Ansari, N., Sissakian, V., Fahmi, K., and Abed, S.: Climate Change: Droughts and Increasing Desertification in the Middle East, with Special Reference to Iraq, Engineering, 14, 235–273, https://doi.org/10.4236/eng.2022.147021, 2022. a
AERONET: Aerosol Robotic network, NASA [data set], https://aeronet.gsfc.nasa.gov/ (last access: 16 February 2024), 2024. a
Albugami, S., Palmer, S., Cinnamon, J., and Meersmans, J.: Spatial and Temporal Variations in the Incidence of Dust Storms in Saudi Arabia Revealed from In Situ Observations, Geosciences, 9, 162, https://doi.org/10.3390/geosciences9040162, 2019. a
Belly, P. Y.: Sand movement by wind, Technical Memorandum No 1, US Army Coastal Eng. Res. Center, http://resolver.tudelft.nl/uuid:f5051163-7a83-440d-9d02-92683a442549 (last access: 16 February 2024), 1964. a
Buchard, V., da Silva, A. M., Colarco, P. R., Darmenov, A., Randles, C. A., Govindaraju, R., Torres, O., Campbell, J., and Spurr, R.: Using the OMI aerosol index and absorption aerosol optical depth to evaluate the NASA MERRA Aerosol Reanalysis, Atmos. Chem. Phys., 15, 5743–5760, https://doi.org/10.5194/acp-15-5743-2015, 2015. a
Buchard, V., da Silva, A., Randles, C., Colarco, P., Ferrare, R., Hair, J., Hostetler, C., Tackett, J., and Winker, D.: Evaluation of the surface PM2.5 in Version 1 of the NASA MERRA Aerosol Reanalysis over the United States, Atmos. Environ., 125, 100–111, https://doi.org/10.1016/j.atmosenv.2015.11.004, 2016. a
Buchard, V., Randles, C. A., da Silva, A. M., Darmenov, A., Colarco, P. R., Govindaraju, R., Ferrare, R., Hair, J., Beyersdorf, A. J., Ziemba, L. D., and Yu, H.: The MERRA-2 Aerosol Reanalysis, 1980 Onward. Part II: Evaluation and Case Studies, J. Climate, 30, 6851–6872, https://doi.org/10.1175/JCLI-D-16-0613.1, 2017. a
Che, H., Gui, K., Xia, X., Wang, Y., Holben, B. N., Goloub, P., Cuevas-Agulló, E., Wang, H., Zheng, Y., Zhao, H., and Zhang, X.: Large contribution of meteorological factors to inter-decadal changes in regional aerosol optical depth, Atmos. Chem. Phys., 19, 10497–10523, https://doi.org/10.5194/acp-19-10497-2019, 2019. a
Chin, M., Ginoux, P., Kinne, S., Torres, O., Holben, B. N., Duncan, B. N., Martin, R. V., Logan, J. A., Higurashi, A., and Nakajima, T.: Tropospheric Aerosol Optical Thickness from the GOCART Model and Comparisons with Satellite and Sun Photometer Measurements, J. Atmos. Sci., 59, 461–483, https://doi.org/10.1175/1520-0469(2002)059<0461:TAOTFT>2.0.CO;2, 2002. a
Chin, M., Diehl, T., Tan, Q., Prospero, J. M., Kahn, R. A., Remer, L. A., Yu, H., Sayer, A. M., Bian, H., Geogdzhayev, I. V., Holben, B. N., Howell, S. G., Huebert, B. J., Hsu, N. C., Kim, D., Kucsera, T. L., Levy, R. C., Mishchenko, M. I., Pan, X., Quinn, P. K., Schuster, G. L., Streets, D. G., Strode, S. A., Torres, O., and Zhao, X.-P.: Multi-decadal aerosol variations from 1980 to 2009: a perspective from observations and a global model, Atmos. Chem. Phys., 14, 3657–3690, https://doi.org/10.5194/acp-14-3657-2014, 2014. a
Colarco, P., da Silva, A., Chin, M., and Diehl, T.: Online simulations of global aerosol distributions in the NASA GEOS-4 model and comparisons to satellite and ground-based aerosol optical depth, J. Geophys. Res.-Atmos., 115, D14207, https://doi.org/10.1029/2009JD012820, 2010. a
De Lannoy, G. J. M., Koster, R. D., Reichle, R. H., Mahanama, S. P. P., and Liu, Q.: An updated treatment of soil texture and associated hydraulic properties in a global land modeling system, J. Adv. Model. Earth Syst., 6, 957–979, https://doi.org/10.1002/2014MS000330, 2014. a
Didan, K.: MYD13C2 MODIS/Aqua Vegetation Indices Monthly L3 Global 0.05Deg CMG V006, NASA EOSDIS Land Processes DAAC [data set], https://doi.org/10.5067/MODIS/MYD13C2.006, 2015. a, b
Duncan, B. N., Strahan, S. E., Yoshida, Y., Steenrod, S. D., and Livesey, N.: Model study of the cross-tropopause transport of biomass burning pollution, Atmos. Chem. Phys., 7, 3713–3736, https://doi.org/10.5194/acp-7-3713-2007, 2007. a
Evan, A. T.: Surface Winds and Dust Biases in Climate Models, Geophys. Res. Lett., 45, 1079–1085, https://doi.org/10.1002/2017GL076353, 2018. a
Gelaro, R., McCarty, W., Suárez, M. J., Todling, R., Molod, A., Takacs, L., Randles, C. A., Darmenov, A., Bosilovich, M. G., Reichle, R., Wargan, K., Coy, L., Cullather, R., Draper, C., Akella, S., Buchard, V., Conaty, A., da Silva, A. M., Gu, W., Kim, G.-K., Koster, R., Lucchesi, R., Merkova, D., Nielsen, J. E., Partyka, G., Pawson, S., Putman, W., Rienecker, M., Schubert, S. D., Sienkiewicz, M., and Zhao, B.: The Modern-Era Retrospective Analysis for Research and Applications, Version 2 (MERRA-2), J. Climate, 30, 5419–5454, https://doi.org/10.1175/JCLI-D-16-0758.1, 2017. a, b, c
Ginoux, P., Chin, M., Tegen, I., Prospero, J. M., Holben, B., Dubovik, O., and Lin, S.-J.: Sources and distributions of dust aerosols simulated with the GOCART model, J. Geophys. Res.-Atmos., 106, 20255–20273, https://doi.org/10.1029/2000JD000053, 2001. a, b, c, d
Ginoux, P., Prospero, J., Torres, O., and Chin, M.: Long-term simulation of global dust distribution with the GOCART model: correlation with North Atlantic Oscillation, Environ. Model. Softw., 19, 113–128, https://doi.org/10.1016/S1364-8152(03)00114-2, 2004. a
GMAO (Global Modeling and Assimilation Office): MERRA-2 tavg1_2d_aer_Nx: 2d,1-Hourly,Time-averaged,Single-Level,Assimilation,Aerosol Diagnostics V5.12.4, Greenbelt, MD, USA, Goddard Earth Sciences Data and Information Services Center (GES DI https://doi.org/10.5067/KLICLTZ8EM9D SC), Earth Data [data set], https://disc.gsfc.nasa.gov/, 2015. a
GMI (Global Modeling Initiative): merra2_gmi, NCCS [data set], https://portal.nccs.nasa.gov/datashare/merra2_gmi/ (last access: 16 February 2024), 2017. a
Hamidi, M., Kavianpour, M. R., and Shao, Y.: Synoptic analysis of dust storms in the Middle East, Asia-Pac. J. Atmos. Sci., 49, 279–286, https://doi.org/10.1007/s13143-013-0027-9, 2013. a
Hasanean, H. and Almazroui, M.: Rainfall: Features and Variations over Saudi Arabia, A Review, Climate, 3, 578–626, https://doi.org/10.3390/cli3030578, 2015. a
Holben, B., Eck, T., Slutsker, I., Tanré, D., Buis, J., Setzer, A., Vermote, E., Reagan, J., Kaufman, Y., Nakajima, T., Lavenu, F., Jankowiak, I., and Smirnov, A.: AERONET – A Federated Instrument Network and Data Archive for Aerosol Characterization, Remote Sens. Environ., 66, 1–16, https://doi.org/10.1016/S0034-4257(98)00031-5, 1998. a, b
Hsu, N. C., Lee, J., Sayer, A. M., Kim, W., Bettenhausen, C., and Tsay, S.-C.: VIIRS Deep Blue Aerosol Products Over Land: Extending the EOS Long-Term Aerosol Data Records, J. Geophys. Res.-Atmos., 124, 4026–4053, https://doi.org/10.1029/2018JD029688, 2019. a, b
Joiner, J. and Yoshida, Y.: Satellite-based reflectances capture large fraction of variability in global gross primary production (GPP) at weekly time scales, Agr. Forest Meteoro., 291, 108092, https://doi.org/10.1016/j.agrformet.2020.108092, 2020. a, b
Joiner, J. and Yoshida, Y.: Global MODIS and FLUXNET-derived Daily Gross Primary Production, V2. ORNL DAAC, Oak Ridge, Tennessee, USA, Earth Data [data set], https://doi.org/10.3334/ORNLDAAC/1835, 2021. a
Kim, D., Chin, M., Bian, H., Tan, Q., Brown, M. E., Zheng, T., You, R., Diehl, T., Ginoux, P., and Kucsera, T.: The effect of the dynamic surface bareness on dust source function, emission, and distribution, J. Geophys. Res.-Atmos., 118, 871–886, https://doi.org/10.1029/2012JD017907, 2013. a
Klingmüller, K., Pozzer, A., Metzger, S., Stenchikov, G. L., and Lelieveld, J.: Aerosol optical depth trend over the Middle East, Atmos. Chem. Phys., 16, 5063–5073, https://doi.org/10.5194/acp-16-5063-2016, 2016. a, b, c, d
Knippertz, P., Deutscher, C., Kandler, K., Müller, T., Schulz, O., and Schütz, L.: Dust mobilization due to density currents in the Atlas region: Observations from the Saharan Mineral Dust Experiment 2006 field campaign, J. Geophys. Res.-Atmos., 112, https://doi.org/10.1029/2007JD008774, 2007. a
Kok, J. F., Adebiyi, A. A., Albani, S., Balkanski, Y., Checa-Garcia, R., Chin, M., Colarco, P. R., Hamilton, D. S., Huang, Y., Ito, A., Klose, M., Li, L., Mahowald, N. M., Miller, R. L., Obiso, V., Pérez García-Pando, C., Rocha-Lima, A., and Wan, J. S.: Contribution of the world's main dust source regions to the global cycle of desert dust, Atmos. Chem. Phys., 21, 8169–8193, https://doi.org/10.5194/acp-21-8169-2021, 2021. a
Largeron, Y., Guichard, F., Bouniol, D., Couvreux, F., Kergoat, L., and Marticorena, B.: Can we use surface wind fields from meteorological reanalyses for Sahelian dust emission simulations?, Geophys. Res. Lett., 42, 2490–2499, https://doi.org/10.1002/2014GL062938, 2015. a
Lelieveld, J., Hadjinicolaou, P., Kostopoulou, E., Chenoweth, J., El Maayar, M., Giannakopoulos, C., Hannides, C., Lange, M. A., Tanarhte, M., Tyrlis, E., and Xoplaki, E.: Climate change and impacts in the Eastern Mediterranean and the Middle East, Clim. Change, 114, 667–687, https://doi.org/10.1007/s10584-012-0418-4, 2012. a
Levy, R. and Hsu, C.: MODIS Atmosphere L2 Aerosol Product, NASA MODIS Adaptive Processing System, Goddard Space Flight Center, USA, Earth Data [data set], https://doi.org/10.5067/MODIS/MOD04_L2.061, 2015. a
Liu, G., Li, J., and Ying, T.: The shift of decadal trend in Middle East dust activities attributed to North Tropical Atlantic variability, Sci. Bull., 68, 1439–1446, https://doi.org/10.1016/j.scib.2023.05.031, 2023. a
McCarty, W. R., Coy, L., Gelaro, R., Huang, A., Merkova, D., Smith, E. B., Sienkiewicz, M., and Wargan, K.: MERRA-2 input observations: Summary and assessment. NASA Tech. Rep. NASA/TM-2016-104606, 46, p. 64, 2016. a
Meo, S. A., Al-Kheraiji, M. F. A., AlFaraj, Z. F., Alwehaibi, N. A., and Aldereihim, A. A.: Respiratory and general health complaints in subjects exposed to sandstorm at Riyadh, Saudi Arabia, Pak. J. Med. Sci., 2, 642–646, https://doi.org/10.12669/pjms.292.3065, 2013. a
Middleton, N.: Desert dust hazards: A global review, Aeol. Res., 24, 53–63, https://doi.org/10.1016/j.aeolia.2016.12.001, 2017. a
Miller, S. D., Kuciauskas, A. P., Liu, M., Ji, Q., Reid, J. S., Breed, D. W., Walker, A. L., and Mandoos, A. A.: Haboob dust storms of the southern Arabian Peninsula, J. Geophys. Res.-Atmos., 113, D01202, https://doi.org/10.1029/2007JD008550, 2008. a
Molod, A., Takacs, L., Suarez, M., and Bacmeister, J.: Development of the GEOS-5 atmospheric general circulation model: evolution from MERRA to MERRA2, Geosci. Model Dev., 8, 1339–1356, https://doi.org/10.5194/gmd-8-1339-2015, 2015. a
Morris, C. E., Sands, D. C., Bardin, M., Jaenicke, R., Vogel, B., Leyronas, C., Ariya, P. A., and Psenner, R.: Microbiology and atmospheric processes: research challenges concerning the impact of airborne micro-organisms on the atmosphere and climate, Biogeosciences, 8, 17–25, https://doi.org/10.5194/bg-8-17-2011, 2011. a
Nabavi, S. O., Haimberger, L., and Samimi, C.: Climatology of dust distribution over West Asia from homogenized remote sensing data, Aeol. Res., 21, 93–107, https://doi.org/10.1016/j.aeolia.2016.04.002, 2016. a
NASA/LARC/SD/ASDC: MISR Level 2 Aerosol parameters V003, NASA Langley Atmospheric Science Data Center DAAC, Earth Data [data set], https://doi.org/10.5067/TERRA/MISR/MIL2ASAE_L2.003-23, 1999. a, b, c
Notaro, M., Yu, Y., and Kalashnikova, O. V.: Regime shift in Arabian dust activity, triggered by persistent Fertile Crescent drought, J. Geophys. Res.-Atmos., 120, 10229–10249, https://doi.org/10.1002/2015JD023855, 2015. a
Pozzer, A., de Meij, A., Yoon, J., Tost, H., Georgoulias, A. K., and Astitha, M.: AOD trends during 2001–2010 from observations and model simulations, Atmos. Chem. Phys., 15, 5521–5535, https://doi.org/10.5194/acp-15-5521-2015, 2015. a
Randles, C. A., da Silva, A. M., Buchard, V., Colarco, P. R., Darmenov, A., Govindaraju, R., Smirnov, A., Holben, B., Ferrare, R., Hair, J., Shinozuka, Y., and Flynn, C. J.: The MERRA-2 Aerosol Reanalysis, 1980 Onward. Part I: System Description and Data Assimilation Evaluation, J. Climate, 30, 6823–6850, https://doi.org/10.1175/JCLI-D-16-0609.1, 2017. a, b
Reichle, R. H., Draper, C. S., Liu, Q., Girotto, M., Mahanama, S. P. P., Koster, R. D., and Lannoy, G. J. M. D.: Assessment of MERRA-2 Land Surface Hydrology Estimates, J. Climate, 30, 2937–2960, https://doi.org/10.1175/JCLI-D-16-0720.1, 2017a. a, b
Reichle, R. H., Liu, Q., Koster, R. D., Draper, C. S., Mahanama, S. P. P., and Partyka, G. S.: Land Surface Precipitation in MERRA-2, J. Climate, 30, 1643–1664, https://doi.org/10.1175/JCLI-D-16-0570.1, 2017b. a
Rezazadeh, M., Irannejad, P., and Shao, Y.: Climatology of the Middle East dust events, Aeol. Res., 10, 103–109, https://doi.org/10.1016/j.aeolia.2013.04.001, 2013. a
Rienecker, M. M., Suarez, M. J., Todling, R., Bacmeister, J., Takacs, L., Liu, H.-C., Gu, W., Sienkiewicz, M., Koster, R. D., Gelaro, R., Stajner, I., and Nielsen, J. E.: The GEOS-5 Data Assimilation System - Documentation of versions 5.0.1, 5.1.0, and 5.2.0, NASA Global Modeling and Assimilation Office, 101, https://gmao.gsfc.nasa.gov/pubs/docs/Rienecker369.pdf (last access: 16 February 2024), 2008. a
Sabetghadam, S., Alizadeh, O., Khoshsima, M., and Pierleoni, A.: Aerosol properties, trends and classification of key types over the Middle East from satellite-derived atmospheric optical data, Atmos. Environ., 246, 118100, https://doi.org/10.1016/j.atmosenv.2020.118100, 2021. a
Sayer, A. M., Hsu, N. C., Lee, J., Kim, W. V., and Dutcher, S. T.: Validation, Stability, and Consistency of MODIS Collection 6.1 and VIIRS Version 1 Deep Blue Aerosol Data Over Land, J. Geophys. Res.-Atmos., 124, 4658–4688, https://doi.org/10.1029/2018JD029598, 2019. a, b
Shao, Y., Klose, M., and Wyrwoll, K.-H.: Recent global dust trend and connections to climate forcing, J. Geophys. Res.-Atmos., 118, 11107–11118, https://doi.org/10.1002/jgrd.50836, 2013. a
Strahan, S. E., Duncan, B. N., and Hoor, P.: Observationally derived transport diagnostics for the lowermost stratosphere and their application to the GMI chemistry and transport model, Atmos. Chem. Phys., 7, 2435–2445, https://doi.org/10.5194/acp-7-2435-2007, 2007. a
Strode, S. A., Ziemke, J. R., Oman, L. D., Lamsal, L. N., Olsen, M. A., and Liu, J.: Global changes in the diurnal cycle of surface ozone, Atmos. Environ., 199, 323–333, https://doi.org/10.1016/j.atmosenv.2018.11.028, 2019. a
WorldBank: Sand and Dust Storms in the Middle East and North Africa Region – Sources, Costs, and Solutions, World Bank, https://doi.org/10.1596/33036, 2019. a
Xi, X.: Revisiting the Recent Dust Trends and Climate Drivers Using Horizontal Visibility and Present Weather Observations, J. Geophys. Res.-Atmos., 126, e2021JD034687, https://doi.org/10.1029/2021JD034687, 2021. a
Xia, W., Wang, Y., and Wang, B.: Decreasing Dust Over the Middle East Partly Caused by Irrigation Expansion, Earth's Future, 10, e2021EF002252, https://doi.org/10.1029/2021EF002252, 2022. a