the Creative Commons Attribution 4.0 License.
the Creative Commons Attribution 4.0 License.
 | 26 Feb 2024
Explaining the green volcanic sunsets after the 1883 eruption of Krakatoa
Christian von Savigny
Anna Lange
Christoph G. Hoffmann
Alexei Rozanov
Volcanic sunsets are usually associated with extended and enhanced reddish colours typically complemented by purple colours at higher elevations. However, many eyewitnesses reported remarkably clear and distinct green twilight colours after the eruption of Krakatoa (Sunda Strait, Indonesia) in 1883. To the best of our knowledge, no earlier studies exist providing an explanation for this unusual phenomenon. In the current work, we employ simulations with the SCIATRAN radiative transfer model to investigate the processes leading to green volcanic sunsets. Green sunsets can be simulated based on plausible assumptions by anomalous scattering on stratospheric sulfate aerosols. We investigate the sensitivity of the twilight colours to relevant parameters such as aerosol optical depth (AOD), the parameters of the particle size distribution (PSD), and the amount of ozone. The main requirements for the occurrence of green twilights are a sufficiently large aerosol optical depth combined with particle radii of about 500–700 nm (assuming stratospheric sulfate aerosols) and a preferably narrow aerosol particle size distribution. The occurrence of green twilights after historic eruptions provides important constraints on the particle size of volcanic aerosols.
- Article
(2649 KB) - Full-text XML
- BibTeX
- EndNote


Volcanic eruptions are well known to affect the colours of the twilight sky. In conditions of volcanically enhanced stratospheric aerosol loading, the primary sunset colouring is complemented by a secondary effect, also known as “afterglow”, lasting significantly longer than ordinary twilight colours (Meinel and Meinel, 1991). The extended reddish afterglows reported after many volcanic eruptions can be qualitatively explained in single-scattering approximation. The tangential path of the solar radiation through the lower atmosphere (the sun being below the horizon) leads to a reddening of the transmitted solar spectrum due to Rayleigh scattering and extinction by aerosol particles. This red spectrum is then scattered by the volcanically enhanced aerosol layer to produce a typically reddish afterglow for a ground-based visual observer. The red colouring of the evening sky typically intensifies with increasing stratospheric aerosol loading. In a few studies, this behaviour was exploited to estimate aerosol optical depth (AOD) from red-to-green colour ratios in photographs of historic paintings (Zerefos et al., 2007, 2014). This approach was recently challenged (von Savigny et al., 2022), and one important aspect was the dependence of volcanic twilight colours on the size distribution of the volcanic aerosol particles.
The Royal Society's report on the Krakatoa eruption in 1883 (Symons et al., 1888) includes numerous reports on green twilight skies after the eruption. For example, the Hon. F. A. Rollo Russell observed on 9 November 1883 (from Surrey, i.e. south of London) a “remarkable whitish-greenish opalescence above the sun at sunset […]”. On 25 November, Russell observed a “green light above sunset, and bright greenish-white growing from about 10 min after sunset”. Others reported “very curious opalescent shining green and slightly greenish-white” or “bright green glow near the place where the sun set”. The Krakatoa report also includes observations of the typical pink or violet colours often associated with volcanic sunsets, but the reports of green colours are remarkable. Unusual colours (blue and green) of the solar and lunar discs are sometimes reported after biomass burning events, sandstorms, or volcanic eruptions (see, e.g. Horvath et al., 1994; Wullenweber et al., 2021), including the eruption of Krakatoa (Symons et al., 1888). This phenomenon is relatively well understood and can be reproduced using radiative transfer models (Wullenweber et al., 2021). The physical cause is most likely anomalous scattering; i.e. the scattering cross section increases with increasing wavelength in the visible spectral range. Note that the term “anomalous scattering” only refers to the untypical spectral dependence of the scattering cross section in the visible spectral range. The scattering cross section can, however, still be modelled with, e.g. Mie theory. Anomalous scattering requires a specific aerosol particle size distribution (PSD) with particle radii in the range of 500–700 nm (assuming the refractive index typical for stratospheric sulfate aerosols) and a preferably narrow distribution. Anomalous scattering also provides an explanation for the green twilight skies in the aftermath of the Krakatoa eruption, as shown in the current study. A fundamental difference between the blue and green appearances of the solar or lunar disc and green twilights is that in the first case, the transmitted radiation is seen by the ground-based observer, whereas in the second case, it is scattered radiation.
This paper is structured as follows: the employed radiative transfer simulations and colour display approach are explained in Sect. 2; Sect. 3 presents the main findings of our study; in Sect. 4, important implications of the results are discussed; and conclusions are presented in the final section.
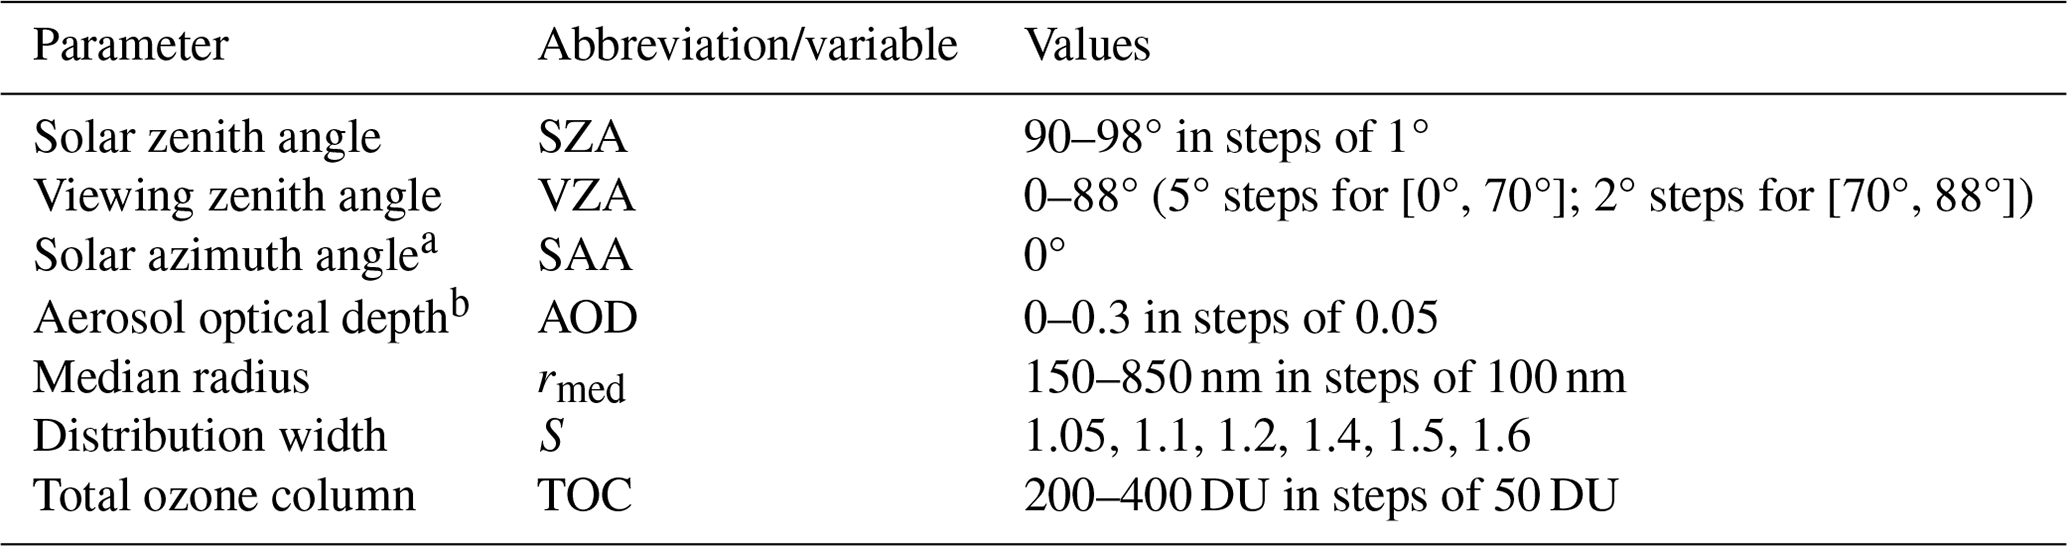
The methodology employed here is very similar to that used in the recent studies by von Savigny et al. (2022) and Lange et al. (2023), and only the most important details are repeated. The spectra of scattered solar radiation are simulated with version 4.1.3 of the radiative transfer model SCIATRAN (Rozanov et al., 2014; IUP, 2024) for a ground-based observer viewing the twilight sky. The calculations are carried out for solar zenith angles (SZAs) between 90 and 98°, variable viewing zenith angles (VZAs) (see Table 1), and a fixed solar azimuth angle (SAA) of 0°. See Fig. 1 for an illustration of the viewing geometry. SCIATRAN was operated in the approximate spherical mode; i.e. single-scattering calculations are carried out in fully spherical geometry, while the contribution of multiple scattering is approximated. This approximation, however, is accurate enough to investigate twilight conditions for the range of SZAs considered here (Lange et al., 2022). Table 1 provides an overview of the range of parameters chosen for the SCIATRAN simulations. Note that Mie theory was used to calculate the optical properties of the aerosols.
The volcanic stratospheric aerosol layer considered here has a Gaussian particle number density profile with a peak altitude of zpeak = 21 km and a FWHM (full width at half maximum) of 8 km. The peak altitude was chosen based on estimates of the layer height reported in Symons et al. (1888) (see Part IV, Sect. IV, Table IV) for the period between 1 and 3 months after the eruption of Krakatoa. Note that the number density profile is scaled within SCIATRAN to result in the specified AOD. The stratospheric aerosol is assumed to consist of pure sulfate particles composed of 75 % H2SO4 and 25 % H2O. The aerosol particle size distribution is assumed to be mono-modal and log-normal with median radius rmed and geometric width parameter S, both of which will be varied in the following. The assumption of a pure sulfate layer in the stratosphere can be considered reasonable several months after a major volcanic eruption (when many of the green twilight observations were made after the Krakatoa eruption; Symons et al., 1888) because the volcanic ash can be assumed to have sedimented out (Kremser et al., 2016). Note that the tropospheric aerosol component is also assumed to consist of sulfate aerosol particles with the same PSD as the stratospheric component. The tropospheric AOD corresponds to about 10 % of the total AOD. Tests were also performed based on the tropospheric aerosol model by Shettle and Fenn (1979), which had a minor overall effect on the simulation results.
In order to ensure an objective display of the colours corresponding to a given radiance spectrum, we use the CIE (International Commission on Illumination) colour-matching functions and determine the x and y chromaticity values (see, e.g. Wullenweber et al., 2021, for more detailed information on the display of colour information). Colour information is then displayed in the x–y plane (see, e.g. the right panel of Fig. 2). The symbols displayed in the CIE chromaticity diagrams in Figs. 2, 3, and 4 are filled with the RGB colours corresponding to the respective values of x and y. Please note that only the position within the x–y plane constitutes objective colour information, while the displayed colour does not necessarily constitute it because it will depend, e.g. on the output device.
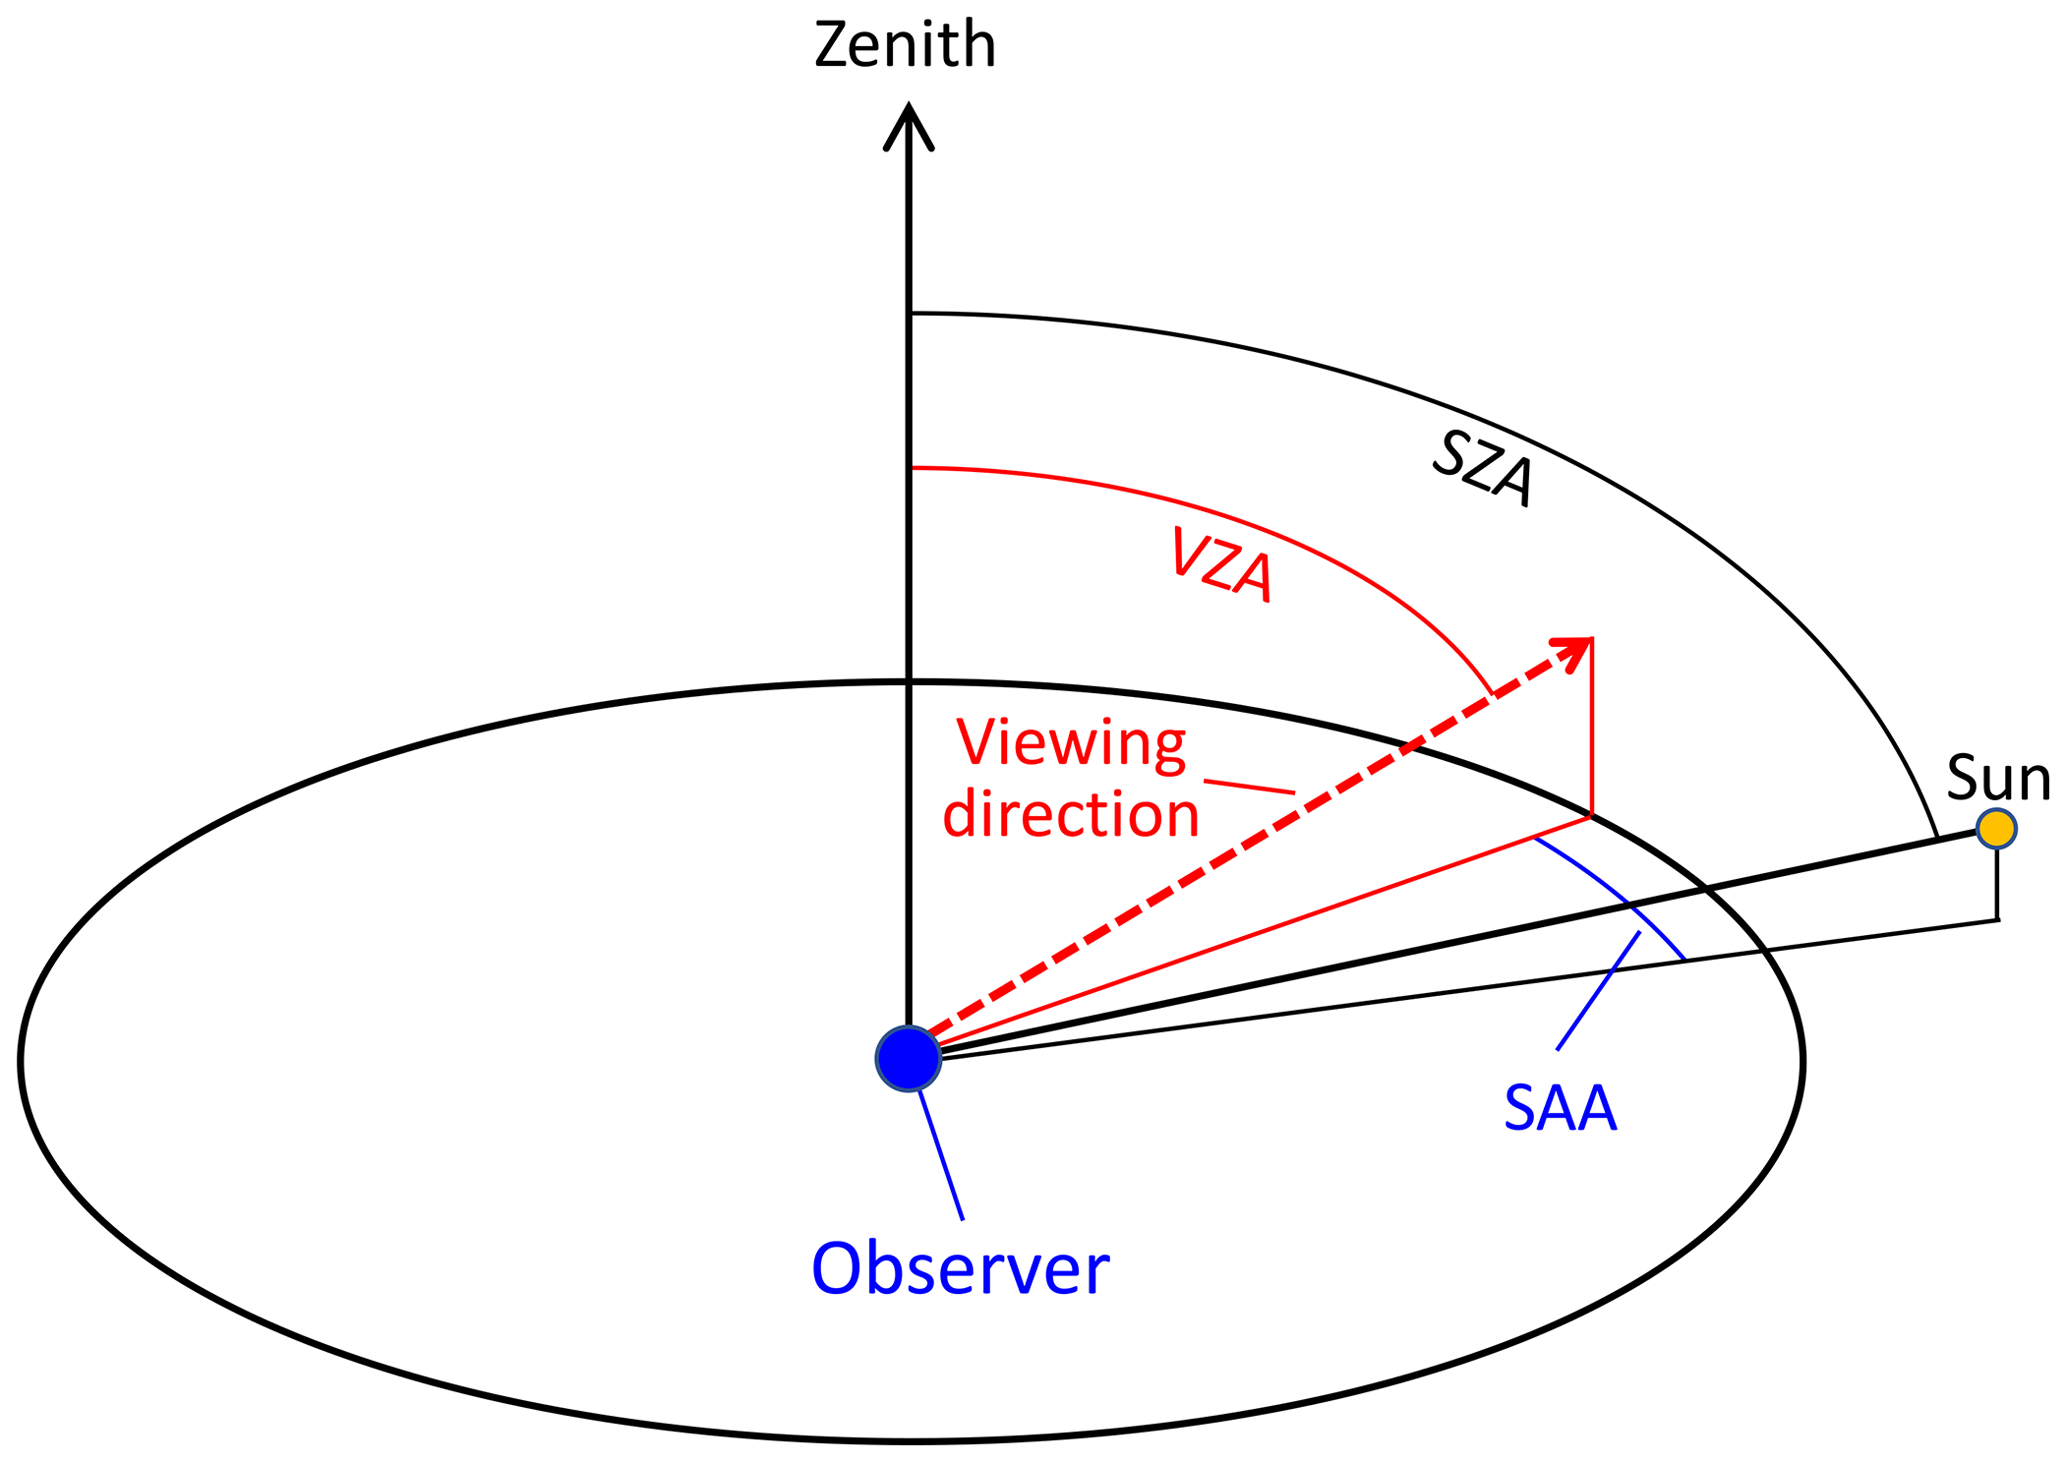
Figure 1Sketch of the observation geometry and the relevant angles (i.e. solar zenith angle, SZA; viewing zenith angle, VZA; solar azimuth angle, SAA).
Table 1An overview of parameter settings for the SCIATRAN simulations (a note that SAA = 0° corresponds to the solar direction; b AOD values correspond to a wavelength of 550 nm).
We first present a sample twilight spectrum and the corresponding CIE chromaticity diagram for a parameter combination that is associated with distinctly green twilight colours. The upper row of Fig. 2 shows the scattered radiance spectrum (left panel) and the corresponding CIE chromaticity diagram (right panel) for the following parameters: SZA = 93°, VZA = 88°, SAA = 0°, AOD = 0.3, rmed = 650 nm, S = 1.1, and a total ozone column (TOC) of 400 DU. The spectrum exhibits a maximum in the green spectral range (which covers wavelengths from about 495 nm to about 570 nm), and the Chappuis absorption bands of O3 (with a maximum near 600 nm) are clearly visible.
The right panel shows the location of the spectrum in the CIE chromaticity diagram as a coloured circle. The arc of smaller coloured circles shows the locations of pure spectral colours, while the red “x” corresponds to the unattenuated solar spectrum. The resulting colour for this combination of viewing geometry and input parameters is clearly greenish, demonstrating that green twilight colours can be simulated with suitably chosen input parameters. This is already an important finding of the present study. The lower row of Fig. 2 shows results for the same viewing geometry as in the upper row but without any aerosols in the atmosphere, i.e. AOD = 0.0. In this case, there is no clear spectral maximum in the green part of the spectrum, and the red parts are significantly enhanced relative to smaller wavelengths in the visible spectral range (note the different ordinate ranges in the two spectra).
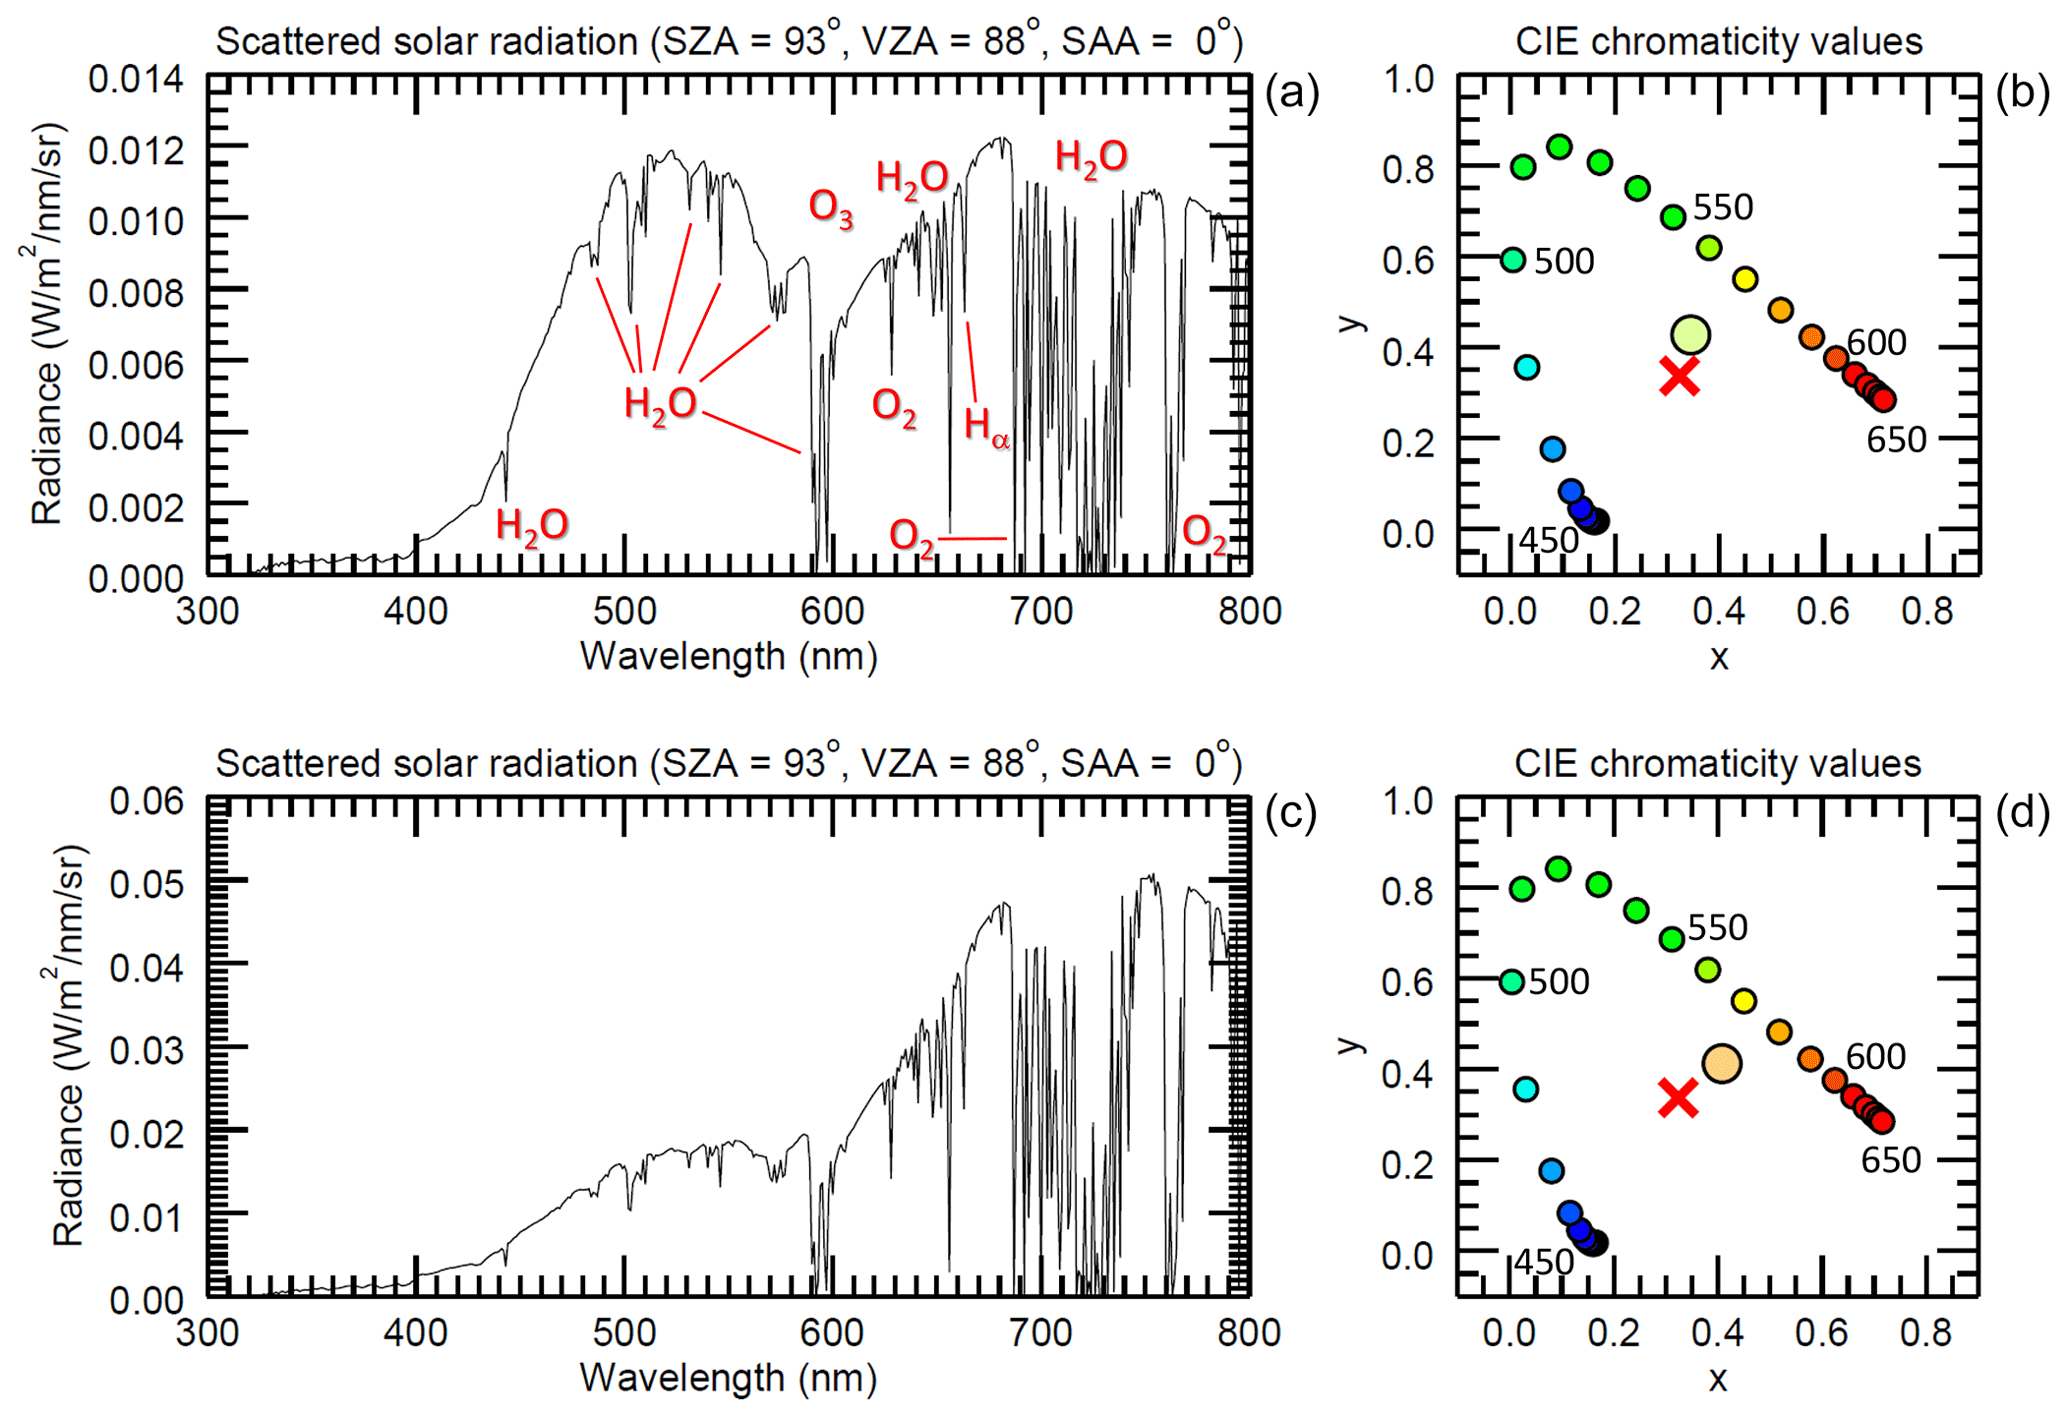
Figure 2Spectra (a–c; note different ordinate ranges) and CIE chromaticity diagrams (b–d) for the following viewing geometry: SZA = 93°, VZA = 88°, and SAA = 0°. The simulations shown in the top row are based on the following assumptions: AOD = 0.3, rmed = 650 nm, S = 1.1, and TOC = 400 DU. For the bottom row, the AOD has been set to zero and the other parameters remain the same. The “x” in the right-column panels corresponds to the chromaticity values of the unattenuated solar spectrum. The arc of the colour circles corresponds to pure spectral colours at different wavelengths (values given in nanometres with 10 nm steps) and the single-coloured circle shows the chromaticity values of the spectrum on the left.
The visual colour impression of the evening sky depends on several different parameters, including the viewing and solar angles, the parameters of the aerosol PSD, and the abundance of ozone. We found that green sunsets can be simulated for many different parameter combinations and a complete description of all possible combinations is beyond the scope of the present study. Instead, the main effects are investigated here in a sensitivity analysis by varying the following parameters: SZA, VZA, the PSD parameters rmed, and S, as well as AOD, and TOC. Figure 3 shows CIE chromaticity diagrams for the evening sky spectra for SZA = 91° and variable VZA for different values of rmed (panel a), TOC (panel b), AOD (panel c), and S (panel d). The default values of the parameters that are not varied in a given panel are AOD = 0.3, rmed = 650 nm, S = 1.1, and TOC = 300 DU. These values were chosen because they lead to green twilights for certain viewing geometries. For reasons of clarity, the chromaticity coordinates are only shown for two TOC values (panel b) and two values of the distribution width S (panel d).
As panel (a) of Fig. 3 shows, the median radius of the aerosol PSD has a relatively large impact on the resulting twilight colours, and only for rmed=650 nm do greenish colours occur for VZAs ≥ 80°, with VZAs = 88° being associated with a rather yellowish colour. For smaller values of rmed, anomalous scattering is not strong enough – or does not occur at all – and the twilight colours are rather orange and reddish. The impact of the TOC on the twilight colours is already quite significant at SZA = 91°, as panel (b) of Fig. 3 shows. Panel (c) demonstrates that large AODs provide more favourable conditions for green twilights to occur. Increasing the AOD moves the chromaticity values to the left in the CIE chromaticity diagram. Panel (d) displays the dependence of the twilight colours on the width parameters S of the aerosol PSD. Apparently, green sunsets occur more easily for narrow PSDs. This is also according to expectations because anomalous scattering is more pronounced for narrow PSDs – given the right values of rmed (compare Fig. 1 in Wullenweber et al., 2021).
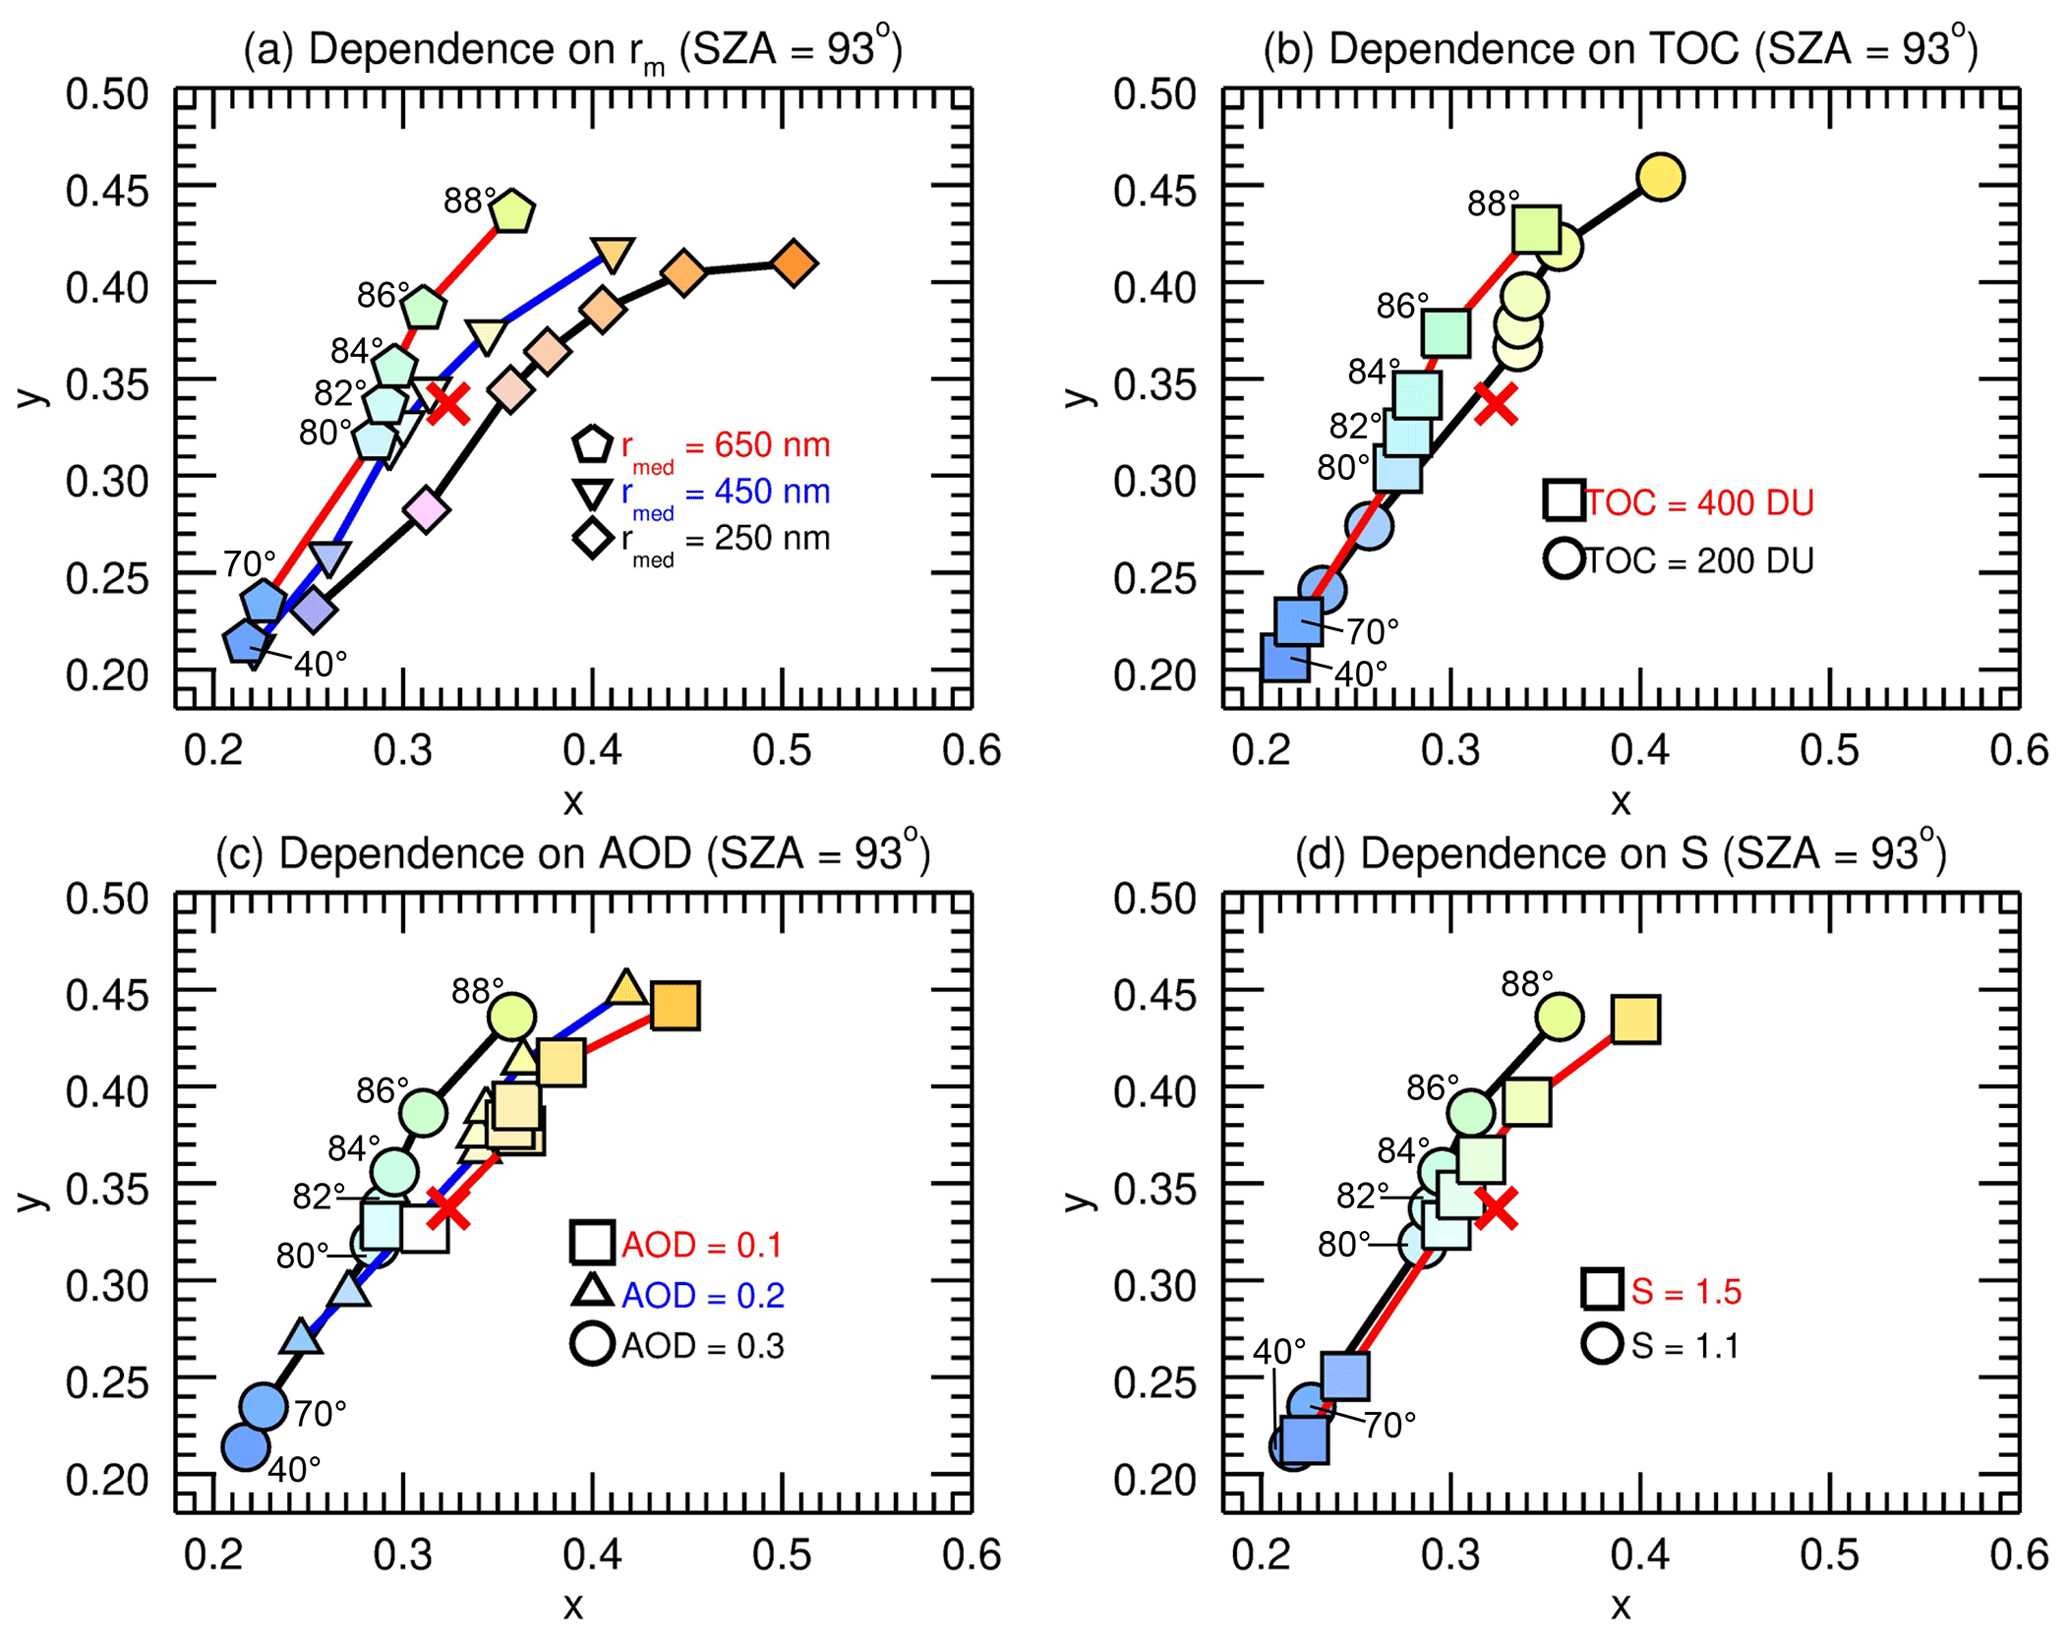
The resulting colours also depend on the SZA, and Fig. 4 shows results similar to Fig. 3 for SZA = 93°. Overall, the dependence of the colours on the parameters varied in the respective panels is generally larger for SZA = 93° than for SZA = 91°. Based on all the simulations carried out, the following conclusions can be drawn:
-
Green twilight skies can only be simulated for specific aerosol sizes (see panel (a) of Figs. 2 and 3). The median radius of the assumed log-normal PSD needs to be between about 500 and 700 nm. This size range is expected because it is associated with the most pronounced anomalous scattering for stratospheric sulfate aerosols (Wullenweber et al., 2021).
-
Absorption in the Chappuis bands of O3 is only of moderate importance for SZAs smaller than about 94°. For larger SZAs, the effect of the O3 absorption on the twilight colours increases (not shown). For increasing TOC, the absorption in the Chappuis bands will be more pronounced, causing the spectral maximum in the blue/green part of the visible spectrum to shift to lower wavelengths.
-
Green twilights can only be simulated for AOD values exceeding about 0.2 for the parameters chosen. The fact that a sufficiently large AOD (in combination with a suitable PSD) is required to produce green twilight colours can be explained qualitatively because the red–orange colours caused in a pure Rayleigh (or Rayleigh-dominated) atmosphere need to be suppressed.
-
Green twilight skies are, in general, more easily produced for narrow PSDs, as seen in panel (d) of Figs. 3 and 4. This behaviour is also expected because anomalous scattering is more pronounced for narrow PSDs (e.g. Fig. 1 in Wullenweber et al., 2021). An increase in the width of the PSD leads mainly to a horizontal shift of the chromaticity coordinates to the right, i.e. in the direction of red and orange colours.
-
For many scenarios with enhanced stratospheric aerosol loading, purple colours above the green, yellow, or orange (depending on the scenario) colours are simulated, as shown in Fig. 4; i.e. the simulations also allow for the reproduction of this well-known phenomenon, frequently observed after volcanic eruptions.
It is also relevant to note that the impact of the surface albedo on the twilight colours is very small (see Fig. 4 in von Savigny et al., 2022).
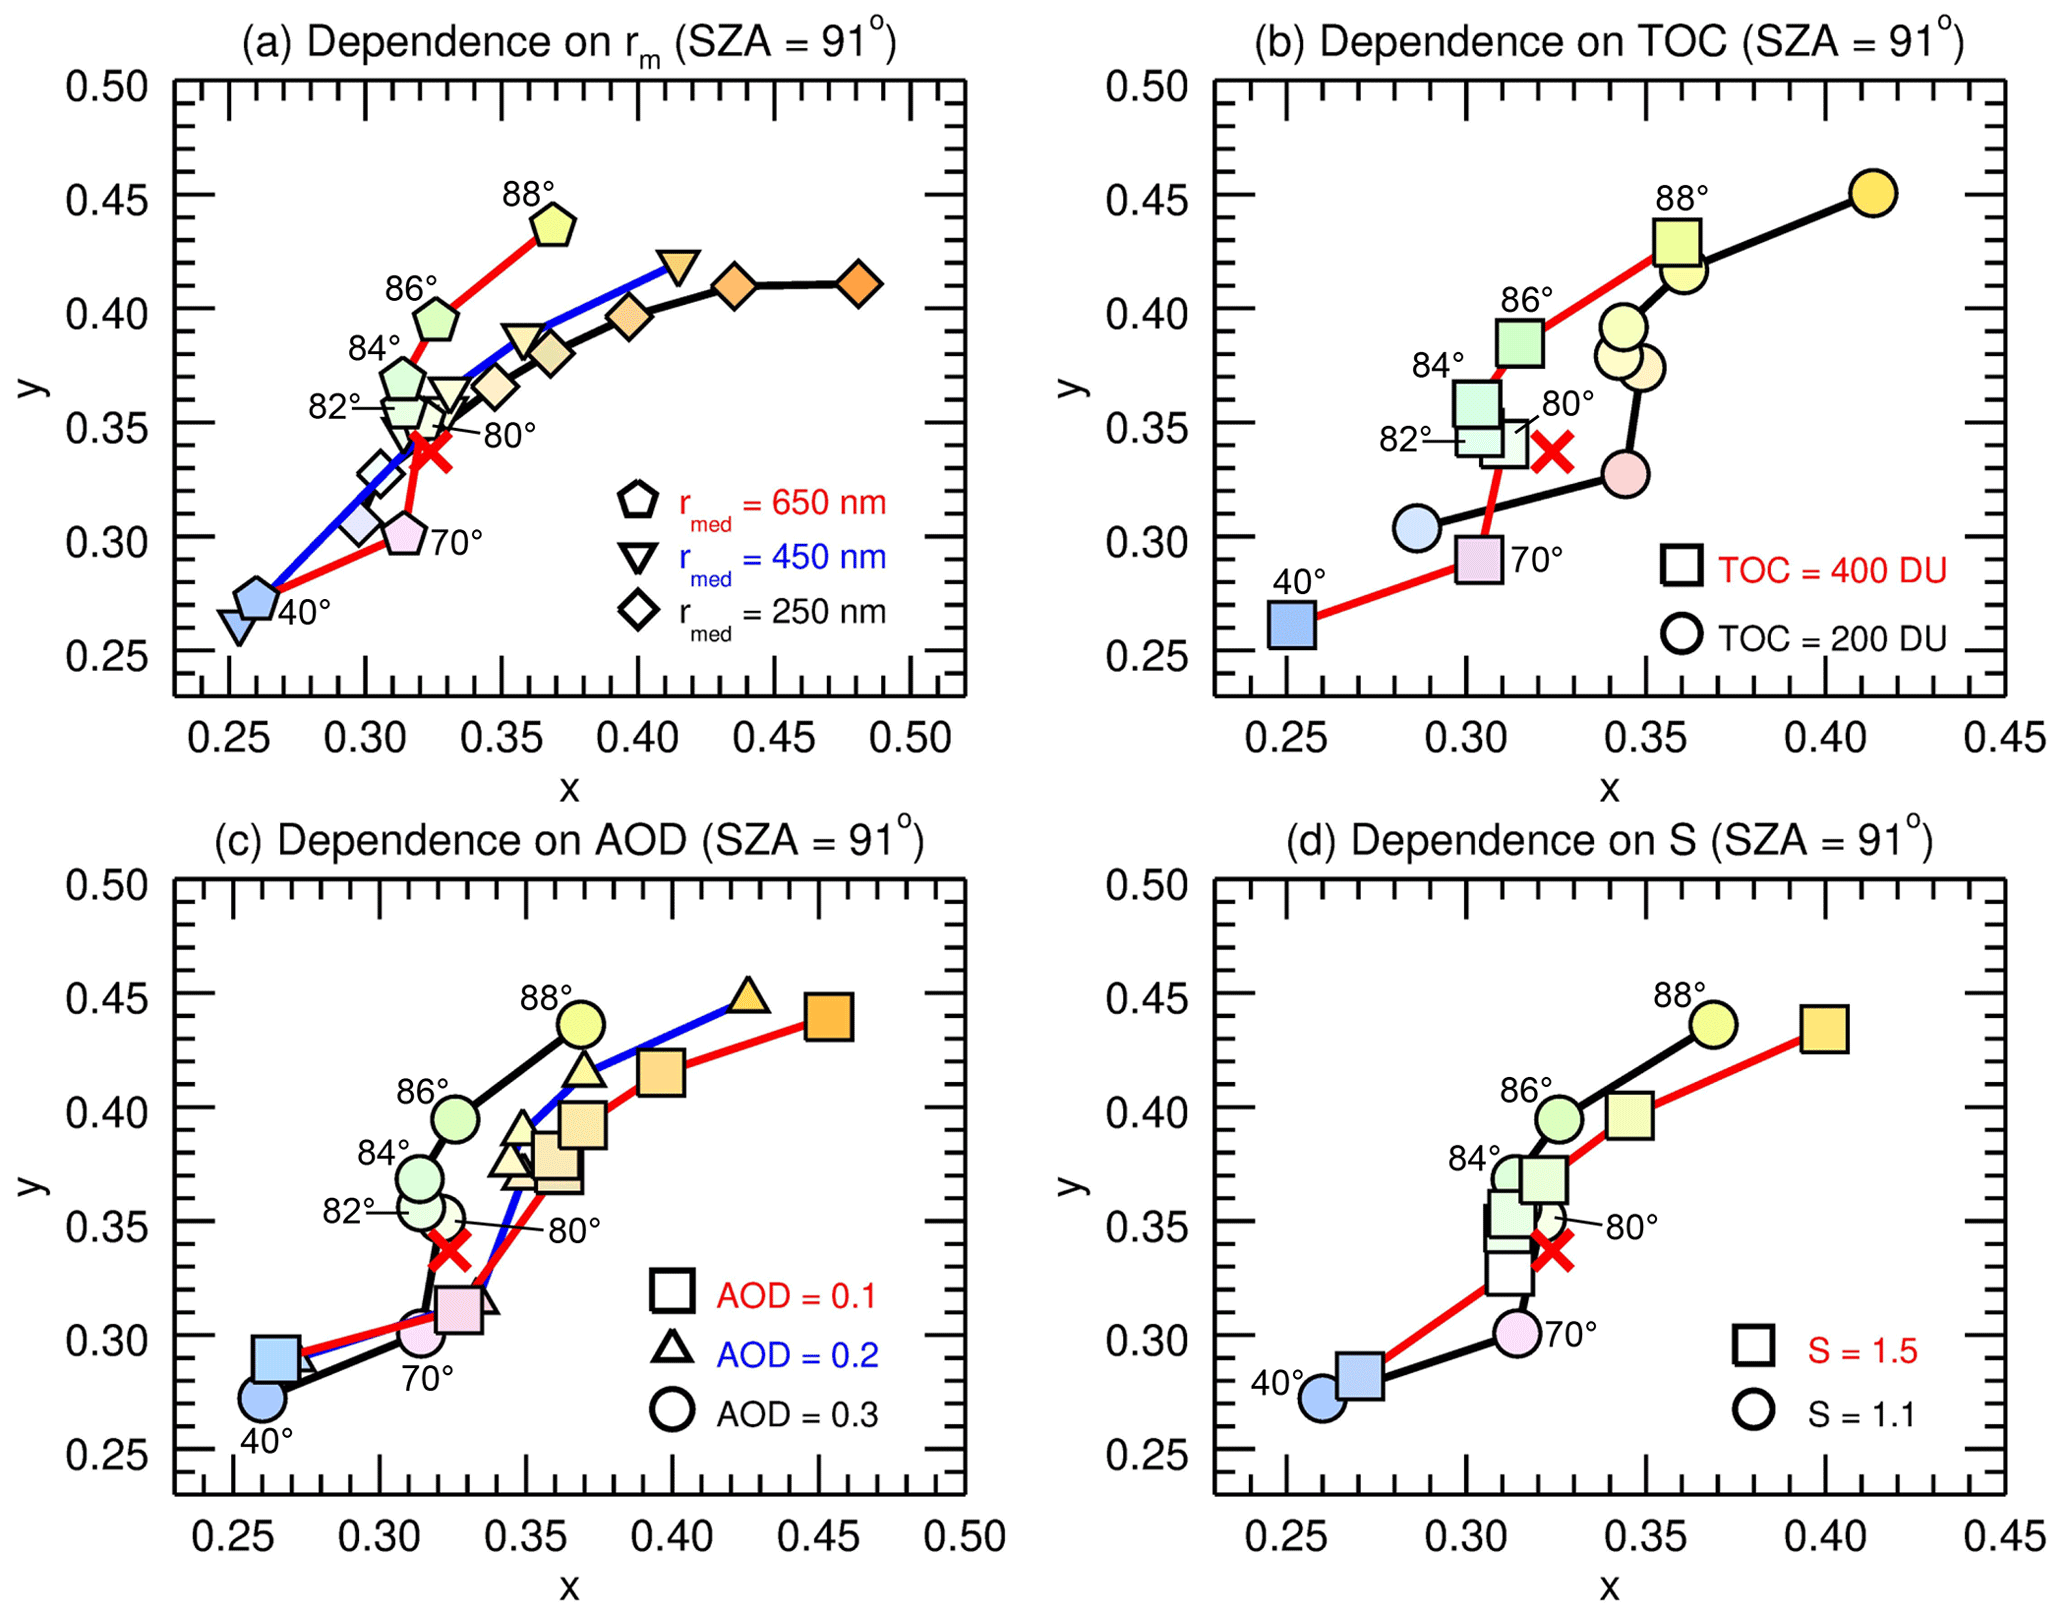
Figure 3CIE chromaticity diagrams similar to the right panel of Fig. 2 but for variable input parameters, i.e median radius rmed (a), total ozone column TOC (b), AOD (c), and width S of the PSD (d). Results are for SZA = 91°, SAA = 0°, and different VZAs, shown by the numbers next to the symbols in each panel (VZA values are 40, 70, 80, 82, 84, 86, and 88°). For clarity reasons, VZAs are only shown for one line in each panel.
It is important to realize that not all possible combinations of relevant input parameters affecting the colours of the twilight sky can be tested. For that reason, we cannot give, e.g. a sharp AOD threshold above which green twilights will occur. In addition, the exact aerosol PSD and its variation after the 1883 eruption of Krakatoa is unknown. Based on the optical particle counter (OPC) measurements after the 1991 eruption of Mount Pinatubo (Deshler, 2008), one might expect the PSD after the Krakatoa eruption to be bimodal with one mode at a median radius of about 100 nm and a coarse mode with median radii of several hundred nanometres. However, because of the strong dependence of the particle's scattering cross section on radius (von Savigny and Hoffmann, 2020), the scattering signal can be expected to be strongly dominated by the coarse mode, providing some justification for the assumption of a mono-modal PSD. In addition, the main purpose of the present study is to demonstrate that green volcanic sunsets can, in principle, be simulated with suitably chosen parameters that are in a plausible range without knowledge of the actual aerosol PSD and its spatial and temporal evolution after the eruption of Krakatoa.
In the following section, we discuss – based on the information available for Krakatoa or other eruptions – whether the AOD and particle size parameters in the aftermath of the Krakatoa eruption were likely in the range required to explain green volcanic sunsets. Regarding the particle size of stratospheric aerosols, typical radii of stratospheric sulfate particles are 100 nm (Deshler, 2008; Wrana et al., 2021) for background conditions. After the Mount Pinatubo eruption in June 1991, particle radii of several hundred nanometres were reported, with some studies reporting radii on the order of 600 nm up to several months after the eruption (Brock et al., 1993; Echle et al., 1998; Bingen et al., 2004; Deshler, 2008). In other words, particle radii on the order of those required to produce green volcanic sunsets have also been observed after the Mount Pinatubo eruption. We are not aware of any reports of green sunsets after this eruption, which may be due to (a) the AOD being too low or (b) the PSD being too wide. Evidence for the possibility of particles with radii in the range of 500 to 700 nm also comes from model simulations. Kokkola et al. (2009) tested the performance of different aerosol microphysical modules and found – for a Pinatubo-sized eruption – a coarse mode of the PSD with a diameter between 1 and 2 µm, i.e. radii in the range required to cause green volcanic twilights.
Next, we discuss available estimates of the AOD following the 1883 eruption of Krakatoa, which are based on sunlight extinction measurements (Sato et al., 1993; Stothers, 1996). According to Sato et al. (1993), the AOD reached a maximum value of 0.125, globally and annually averaged only in 1885. The values in 1883 and 1884 are 0.021 and 0.081 respectively. A maximum AOD in 1885 appears implausible, and Sato et al. (1993) make no statements about the accuracy of the AOD values. Stothers (1996) reports a maximum AOD of 0.4 in September 1883 for the [30° S, 30° N] latitude range. For January 1884, a globally averaged AOD of 0.182 is reported. However, the discussion in Stothers (1996) suggests that these values are relatively uncertain. Since no precise measurements of the AOD are available for the period 1883–1885, we can only carefully conclude that the AOD may have been in the range for which our simulations produce green twilight skies. The global-mean SAOD (stratospheric AOD) values reconstructed from sulfate records in ice cores by Toohey and Sigl (2017) reach a maximum of about 0.12 after the Krakatoa eruption, while the ICI (ice core index) by Crowley and Unterman (2013) yields a maximum global-mean SAOD of about 0.18. It is of course important to remember that for certain times and latitude regions, the SAOD will exceed the global-mean value. To summarize, the AOD and particle size required for green volcanic sunsets are in a plausible range for the Krakatoa eruption and more or less consistent with earlier studies. Our results suggest that the AOD in the aftermath of the 1883 eruption of Krakatoa may have been larger than the values presented in some of the earlier studies.
It is also interesting to note that for scenarios that produce a green sunset, the usual orange and red colours of the twilight sky can be suppressed or even completely absent (see, e.g. panel a of Figs. 3 and 4). This is consistent with some of the eyewitness reports cited in Symons et al. (1888). One report states (referring to the year 1884): “During the remainder of the year the sunsets were uncommonly free from colour, […], and no redness of an ordinary character remaining along the horizon after sunset, except on a few evenings and in a few localities.” (Symons et al., 1888).
Green sky colours are also sometimes observed in connection with severe thunderstorm clouds (e.g. Bohren and Fraser, 1993), and we briefly discuss the similarities and differences between green thunderstorms and green sunsets. Bohren and Fraser (1993) discuss two hypotheses to explain green thunderstorm clouds, i.e. the “Fraser” hypothesis and the “Bohren” hypothesis. The Bohren hypothesis is essentially based on the absorption of solar radiation by liquid water (or ice) inside thunderstorm clouds, leading to a blue shift of sunlight reddened by Rayleigh extinction for large SZAs. Both hypotheses require very large cloud optical depths. One might argue that the Bohren hypothesis may also be applied to stratospheric aerosols because the smaller particle size of stratospheric aerosols, compared to cloud droplets, is associated with a reduction in the liquid water path required to explain green thunderstorm clouds, according to the Bohren hypothesis (see Sect. 8.6.1 and equation 8.80 in Bohren and Clothiaux, 2006). However, because of the much lower optical depth of the stratospheric aerosol layer after the Krakatoa eruption (see above) compared to typical thunderstorm clouds, the Bohren hypothesis cannot explain green twilights caused by the stratospheric aerosol layer after the Krakatoa eruption. It is certainly possible that there was an increased occurrence of green thunderstorm clouds after the eruption of Krakatoa, but in several of the green twilight observations described in the Krakatoa report, the twilight sky was cloud-free and green thunderstorms cannot serve as an explanation of the green colours.
However, a similar general process leads to the green colours in the case of both thunderstorms and volcanic sunsets, i.e. a blue shift of reddened sunlight. This blue shift is caused by Rayleigh scattering in the case of the Fraser hypothesis, by H2O (liquid or solid) absorption in the case of the Bohren hypothesis, and by anomalous aerosol scattering in the case of the green volcanic sunsets.
Finally, we discuss the relationship between green volcanic sunsets and the recently described phenomenon of the green band (Lange et al., 2023), corresponding to a typically narrow horizontal band of light green sometimes occurring after sunset between the red colours near the horizon and the blue colours above (Lange et al., 2023). Green volcanic sunsets are characterized by much more pronounced green colouring of the twilight sky, with significantly larger distances from the white point in the CIE chromaticity diagram (compare, e.g. Fig. 4 in this study with Fig. 4 in Lange et al., 2023). In addition, the green band requires neither the large particles necessary for anomalous scattering to occur nor the relatively large AODs (Lange et al., 2023). Also, in the case of the green volcanic sunsets simulated here, the green colour extends to the horizon in contrast to the green-band phenomenon.
In the aftermath of the 1883 eruption of Krakatoa, numerous eyewitnesses reported green twilights. In this work, we carried out sensitivity studies based on radiative transfer simulations in order to investigate the cause of green twilights and the sensitivity of twilight colours to different relevant parameters. Green volcanic twilights can be explained by anomalous scattering occurring for sufficiently large particles (i.e. radii of about 500 to 700 nm) and a preferably narrow particle size distribution. In addition, green twilights require the AOD to exceed a threshold of about 0.2. The dependence of twilight colours on AOD, the particle size parameters, and the abundance of O3 was generally found to increase with SZA for SZAs between 90 and 98°. Due to the fact that different parameters affect the twilight colours, we cannot give precise values of the AOD or the size parameters for the occurrence of a green volcanic twilight. Despite these limitations, green twilights can provide some quantitative constraints on the AOD and aerosol size for historic volcanic eruptions and complement other volcanic proxy data sets, e.g. based on ice cores or lunar eclipse observations.
The SCIATRAN radiative transfer model including all databases used for the simulations presented in this work is publicly accessible at https://www.iup.uni-bremen.de/sciatran/ (IUP, 2024, last access: 22 February 2024).
CvS designed the study, carried out the SCIATRAN simulations with assistance by AR and AL, and wrote an initial version of the manuscript. All authors discussed, edited, and proofread the manuscript.
The contact author has declared that none of the authors has any competing interests.
Publisher’s note: Copernicus Publications remains neutral with regard to jurisdictional claims made in the text, published maps, institutional affiliations, or any other geographical representation in this paper. While Copernicus Publications makes every effort to include appropriate place names, the final responsibility lies with the authors.
This work was supported by the Deutsche Forschungsgemeinschaft (project VolARC of the DFG research unit VolImpact FOR 2820, grant no. 398006378). We are indebted to the Institute of Environmental Physics of the University of Bremen – particularly to Vladimir Rozanov and John P. Burrows FRS – for providing the SCIATRAN radiative transfer model. We also thank Filip Vanhellemont and Timothy Garrett as well as an anonymous reviewer for their insightful comments that helped to improve the manuscript.
This research has been supported by the Deutsche Forschungsgemeinschaft (grant no. 398006378).
This paper was edited by Timothy Garrett and reviewed by Filip Vanhellemont and one anonymous referee.
Bingen, C., Fussen, D., and Vanhellemont, F.: A global climatology of stratospheric aerosol size distribution parameters derived from SAGE II data over the period 1984–2000: 2. Reference data, J. Geophys. Res., 109, D06202, https://doi.org/10.1029/2003JD003511, 2004. a
Bohren, C. F. and Clothiaux, E. E.: Fundamentals of Atmospheric Radiation, John Wiley & Sons, Ltd, ISBN: 9783527618620, https://doi.org/10.1002/9783527618620, 2006. a
Bohren, C. F. and Fraser, A. B.: Green thunderstorms, Bull. Am. Met. Soc., 74, 2185–2194, https://doi.org/10.1175/1520-0477(1993)074<2185:GT>2.0.CO;2, 1993. a, b
Brock, C., Jonsson, H., Wilson, J., Dye, J., Baumgardner, D., Borrmann, S., Pitts, M., Osborn, M., DeCoursey, R., and Woods, D.: Relationships between optical extinction, backscatter and aerosol surface and volume in the stratosphere following the eruption of Mt. Pinatubo, Geophys. Res. Lett., 22, 2555–2558, 1993. a
Crowley, T. J. and Unterman, M. B.: Technical details concerning development of a 1200 yr proxy index for global volcanism, Earth Syst. Sci. Data, 5, 187–197, https://doi.org/10.5194/essd-5-187-2013, 2013. a
Deshler, T.: A review of global stratospheric aerosol: Measurements, importance, life cycle, and local stratospheric aerosol, Atmos. Res., 90, 223–232, 2008. a, b, c
Echle, G., von Clarmann, T., and Oelhaf, H.: Optical and microphysical parameters of the Mt. Pinatubo aerosol as determined from MIPAS-B mid-IR limb emission spectra, J. Geophys. Res., 103, 19193–19211, 1998. a
Horvath, H., Metzig, G., Preining, O., and Pueschel, R. F.: Observation of a blue sun over New Mexico, USA, on 19 April 1991, Atmos. Environ., 28, 621–630, https://doi.org/10.1016/1352-2310(94)90039-6, 1994. a
IUP: University of Bremen: Radiative transfer model SCIATRAN, https://www.iup.uni-bremen.de/sciatran/ (last access: 22 February 2024), 2024. a, b
Kokkola, H., Hommel, R., Kazil, J., Niemeier, U., Partanen, A.-I., Feichter, J., and Timmreck, C.: Aerosol microphysics modules in the framework of the ECHAM5 climate model – intercomparison under stratospheric conditions, Geosci. Model Dev., 2, 97–112, https://doi.org/10.5194/gmd-2-97-2009, 2009. a
Kremser, S., Thomason, L. W., von Hobe, M., Hermann, M., Deshler, T., Timmreck, C., Toohey, M., Stenke, A., Schwarz, J. P., Weigel, R., Fueglistaler, S., Prata, F. J., Vernier, J.-P., Schlager, H., Barnes, J. E., Antuna-Marrero, J.-C., Fairlie, D., Palm, M., Mahieu, E., Notholt, J., Rex, M., Bingen, C., Vanhellemont, F., Bourassa, A., Plane, J. M. C., Klocke, D., Carn, S. A., Clarisse, L., Trickl, T., Neely, R., James, A. D., Rieger, L., Wilson, J. C., and Meland, B.: Stratospheric aerosol – Observations, processes, and impact on climate, Rev. Geophys., 54, 278–335, https://doi.org/10.1002/2015RG000511, 2016. a
Lange, A., Baumgarten, G., Rozanov, A., and von Savigny, C.: On the colour of noctilucent clouds, Ann. Geophys., 40, 407–419, https://doi.org/10.5194/angeo-40-407-2022, 2022. a
Lange, A., Rozanov, A., and von Savigny, C.: On the twilight phenomenon of the green band, Appl. Opt., 62, 162–171, 2023. a, b, c, d, e
Meinel, A. B., and Meinel, M.: Sunsets, Twilights and Evening Skies, Cambridge University Press, 173 pp., ISBN: 0521406471, 1991. a
Rozanov, V., Rozanov, A., Kokhanovsky, A., and Burrows, J.: Radiative transfer through terrestrial atmosphere and ocean: Software package SCIATRAN, J. Quant. Spec. Rad. Trans., 133, 13–71, 2014. a
Sato, M., Hansen, J. E., McCormick, M. P., and Pollack J. B.: Stratospheric aerosol optical depths 1850–1990, J. Geophys. Res., 98, 22987–22994, 1993. a, b, c
Shettle, E. P. and Fenn, R. W.: Models for the aerosols of the lower atmosphere and the effects of humidity variations on their optical properties, Report AFGL-TR-79-0214, Airforce Geophysics Laboratory Hanscom, 94 pp., https://apps.dtic.mil/sti/pdfs/ADA085951.pdf (last access: 23 February 2024), 1979. a
Stothers, R. B.: Major optical depth perturbations to the stratosphere from volcanic eruptions: Pyrheliometric period, 1881–1960, J. Geophys. Res., 101, 3901–3920, 1996. a, b, c
Symons, G., Judd, J., Strachey, R., Wharton, W., Evans, F., Russell, F., Archibald, D., and Whipple, G.: The Eruption of Krakatoa: And Subsequent Phenomena, Krakatoa Committee of the Royal Society (Great Britain), Trübner & Co., Ludgate Hill, https://doi.org/10.3931/e-rara-16337, 1888. a, b, c, d, e, f
Toohey, M. and Sigl, M.: Volcanic stratospheric sulfur injections and aerosol optical depth from 500 BCE to 1900 CE, Earth Syst. Sci. Data, 9, 809–831, https://doi.org/10.5194/essd-9-809-2017, 2017. a
von Savigny, C. and Hoffmann, C. G.: Issues related to the retrieval of stratospheric-aerosol particle size information based on optical measurements, Atmos. Meas. Tech., 13, 1909–1920, https://doi.org/10.5194/amt-13-1909-2020, 2020. a
von Savigny, C., Lange, A., Hemkendreis, A., Hoffmann, C. G., and Rozanov, A.: Is it possible to estimate aerosol optical depth from historic colour paintings?, Clim. Past, 18, 2345–2356, https://doi.org/10.5194/cp-18-2345-2022, 2022. a, b, c
Wrana, F., von Savigny, C., Zalach, J., and Thomason, L. W.: Retrieval of stratospheric aerosol size distribution parameters using satellite solar occultation measurements at three wavelengths, Atmos. Meas. Tech., 14, 2345–2357, https://doi.org/10.5194/amt-14-2345-2021, 2021. a
Wullenweber, N., Lange, A., Rozanov, A., and von Savigny, C.: On the phenomenon of the blue sun, Clim. Past, 17, 969–983, https://doi.org/10.5194/cp-17-969-2021, 2021. a, b, c, d, e, f
Zerefos, C. S., Gerogiannis, V. T., Balis, D., Zerefos, S. C., and Kazantzidis, A.: Atmospheric effects of volcanic eruptions as seen by famous artists and depicted in their paintings, Atmos. Chem. Phys., 7, 4027–4042, https://doi.org/10.5194/acp-7-4027-2007, 2007. a
Zerefos, C. S., Tetsis, P., Kazantzidis, A., Amiridis, V., Zerefos, S. C., Luterbacher, J., Eleftheratos, K., Gerasopoulos, E., Kazadzis, S., and Papayannis, A.: Further evidence of important environmental information content in red-to-green ratios as depicted in paintings by great masters, Atmos. Chem. Phys., 14, 2987–3015, https://doi.org/10.5194/acp-14-2987-2014, 2014. a