the Creative Commons Attribution 4.0 License.
the Creative Commons Attribution 4.0 License.
 | 23 Feb 2024
Frequent haze events associated with transport and stagnation over the corridor between the North China Plain and Yangtze River Delta
Feifan Yan
Yafang Cheng
Rujin Huang
Hong Liao
Ting Yang
Yuanyuan Zhu
Shaoqing Zhang
Lifang Sheng
Wenbin Kou
Xinran Zeng
Shengnan Xiang
Xiaohong Yao
Huiwang Gao
PM2.5 pollution is a major air quality issue that deteriorates human health, and numerous studies have focused on PM2.5 pollution in major regions such as the North China Plain (NCP) and Yangtze River Delta (YRD). However, the characteristics of PM2.5 concentrations and the associated formation mechanism in the transport corridor (referred to as SWLY) between the NCP and YRD are largely ignored. Based on observational data, we find that the number of PM2.5 pollution events in SWLY is comparable to that in the NCP, far exceeding that in the YRD, which is indicative of the severity of air pollution in this area. Utilizing a regional climate and air quality model, we isolate the effect of seesaw transport events, e.g., transport between the NCP and YRD, and atmospheric stagnation on the accumulation of PM2.5 over SWLY. Specifically, seesaw events and stagnation, comparable to each other, collectively account for an average of 67 % of pollution days, with PM2.5 exceeding 75 µg m−3, and this fraction (85 %) is even larger for severe haze events, with PM2.5 exceeding 150 µg m−3. Furthermore, the connection between seesaw transport and large-scale circulation is examined. The transregional transport of pollutants from the NCP to the YRD (YRD to NCP) is likely stimulated by positive (negative) to negative (positive) geopotential height anomalies at 500 hPa located in northern China. The health effect due to short-term PM2.5 exposure induced by the transregional transport and stagnation is investigated, yielding a total of 8634 (95 % CI: 6023–11 223) and 9496 (95 % CI: 6552–12 413) premature deaths, respectively, in SWLY during winter 2014–2019, which is as high as 9 % of the total premature deaths in China, even though SWLY takes up less than 1 % of China's area. While atmospheric stagnation is in general projected to occur more frequently under a warming climate, this study indicates the importance of regional emission control to alleviate PM2.5 pollution from seesaw transport and stagnation.
- Article
(4152 KB) - Full-text XML
-
Supplement
(1591 KB) - BibTeX
- EndNote


With the rapid development of the economy, particulate matter with diameters less than 2.5 µm (PM2.5) has become a major issue that deteriorates air quality in China and threatens human health, e.g., causing serious respiratory and cardiovascular diseases and even premature death (Donaldson et al., 1998; Pui et al., 2014; Xing et al., 2016). Strict emission control strategies have been carried out since the severe haze pollution events in 2013, leading to a generally decreasing trend of annual mean PM2.5 concentrations (Q. Zhang et al., 2019). Nevertheless, in addition to emissions, unfavorable meteorological conditions, such as atmospheric stagnation (Gao et al., 2020; Wang et al., 2022) and transregional transport of air pollutants (Huang et al., 2020; Kang et al., 2021; Ma et al., 2017), continue to stimulate the accumulation of local PM2.5, which is conducive to creating air pollution at levels that exceed the Chinese Ambient Air Quality Standards.
In China, severe PM2.5 pollution in eastern China has received much attention, especially in the North China Plain (NCP) (Wang et al., 2014; Zhang et al., 2015) and the Yangtze River Delta (YRD) (Jia et al., 2022; J. D. Li et al., 2019). Several studies have noted that air pollutants can be transported between the NCP and YRD (He et al., 2018; Huang et al., 2020; Kang et al., 2019; J. Zhang et al., 2021). For instance, by applying the source apportionment method, Kang et al. (2019) found that transport due to cold frontal passages from the NCP contributed to 29 % of severe PM2.5 pollution, with PM2.5 concentrations as high as 300 µg m−3 during 21–26 January 2015 in the YRD. Similarly, Huang et al. (2020) found that air pollutants from the YRD could be transported to the NCP, lowering the planetary boundary layer height (PBLH) through the aerosol direct radiative effect and aggravating the accumulation of PM2.5 concentrations therein, which can then be transported back to the YRD by cold fronts. In fact, the region located in the connecting belt of these two areas, particularly at the junction of four provinces (Jiangsu, Anhui, Shandong, Henan), referred to as SWLY, experiences heavy PM2.5 pollution in China (Wu et al., 2018; Xie et al., 2016). Moreover, high PM2.5 concentrations pose a remarkable health risk due to the dense population in SWLY (Yang et al., 2018; T. T. Li et al., 2019). Nevertheless, there are very limited studies investigating the transport effects on PM2.5 concentrations in SWLY.
In addition to the transport, atmospheric stagnation plays an essential role in magnifying local air pollution in China. Previous studies indicated that atmospheric stagnation exhibited a high spatial correlation with PM2.5 pollution over eastern China (Wang et al., 2022) and favored the accumulation in PM2.5 concentrations (Gao et al., 2020; Wang et al., 2018). For instance, Wang et al. (2022) found that more than two-thirds of stagnant days could lead to high PM2.5 concentrations exceeding the 90th percentile in the NCP during 2013–2018. During 1985–2014, the most evident increasing trend of atmospheric stagnation frequency was found in the eastern flank of China, including the SWLY region (Huang et al., 2017), and how these weather conditions induce PM2.5 pollution remains unclear.
PM2.5 exerts substantial health effects, among which the long-term exposure effect has been widely acknowledged (Geng et al., 2021; Ali et al., 2023), and recent studies have indicated striking health burdens resulting from short-term exposure to PM2.5 as well (Jiang et al., 2020; T. T. Li et al., 2019; Liu et al., 2021). For example, T. T. Li et al. (2019) found 169 862 additional deaths attributed to short-term PM2.5 exposure in China in 2015, with the highest death rate of 14.63 (95 % CI: 8.50–20.69) per 100 000 people in eastern China. Liu et al. (2021) found that Shandong, Jiangsu, Hebei, and Henan experienced the highest health costs (medical cost, productivity loss, etc.) in China attributable to short-term PM2.5 pollution during 2013–2018. Therefore, it is of great importance to investigate the health burdens associated with short-term exposure to PM2.5 concentrations, as well as the contributions resulting from different meteorological conditions, e.g., transregional transport and stagnant weather in SWLY.
To this end, we conduct numerical simulations with Weather Research and Forecasting (WRF) and Community Multiscale Air Quality (CMAQ) from 2014 to 2019, aiming to isolate the effects of transport (Sect. 3.2) and atmospheric stagnation (Sect. 3.3) on PM2.5 in SWLY. Finally, the health impact of PM2.5 caused by transregional transport and stagnation is quantified.
2.1 Model configuration
This study applies WRF version 4.1.1 and CMAQ version 5.3.1 to simulate the meteorological and air quality conditions from 2014 to 2019. The simulation domain is shown in Fig. S1 in the Supplement, and the spatial resolution is 36 km × 36 km. There are 34 vertical layers from the surface to 50 hPa, with denser layers within the planetary boundary layer (PBL) to better reproduce the air pollutant concentrations within the layer (Wang et al., 2011; Appel et al., 2007). The physics schemes in WRF are shown in Table S1 in the Supplement and are consistent with a previous study (Zeng et al., 2022). The NCEP Climate Forecast System Reanalysis (CFSR) version 2 (Saha et al., 2014), with horizontal resolutions of 0.5° × 0.5°, provides the initial and boundary conditions for WRF simulations. To improve the meteorological simulations to enhance the simulation capability of air quality model, a grid nudging technique is applied (Bowden et al., 2012; Liu et al., 2012). Only U and V nudging above the boundary layer was applied, with a nudging coefficient of . The gas chemical mechanism of Carbon Bond version 6 (CB6) (Luecken et al., 2019) and the aerosol module of AERO7 are used (Pye et al., 2017; Appel et al., 2021). The chemical initial and boundary conditions of CMAQ are downscaled from the Model for Ozone and Related chemical Tracers, version 4 (MOZART-4) (Emmons et al., 2010), the same method as applied in Ma et al. (2019).
In this study, the anthropogenic emissions inventory in 2016 is derived from the Multi-resolution Emission Inventory for China version 1.2 (MEIC v1.2; http://meicmodel.org.cn/#firstPage, last access: 2 February 2024; Li et al., 2017; Zheng et al., 2018), which mainly includes emissions from agriculture, residents, transportation, industry, and power plants. The ship emissions are from the shipping emission inventory model (SEIM) (Liu et al., 2016; H. Liu et al., 2019). The biomass burning emission inventory from 2014–2019 is based on the Global Emission Database version 4.1 (GFEDv4.1; Giglio et al., 2013; van der Werf et al., 2017). The hourly biogenic emissions are generated by the Model of Emission of Gases and Aerosol from Nature (MEGAN) (Guenther et al., 2012). For the evaluation of model simulations, the meteorological observation data are available at the National Climatic Data Center (NCDC; https://www.ncei.noaa.gov/weather-climate-links#dsi-3505; last access: 8 December 2021), including air temperature at 2 m and wind speed and direction at 10 m. The observational hourly PM2.5 data are taken from the China National Environmental Monitoring Centre (http://www.pm25.in/, last access: 23 September 2021). In this study, the simulation time for WRF and CMAQ is 6 full years from 2014 to 2019. The simulations are conducted continuously for each year, with December in the previous year as the spin-up time. To facilitate the analysis, the 3 months of January, February, and December in the same year are referred to as the winter season.
2.2 Short-term exposure premature death to PM2.5
To quantify the health effects attributable to exposure to PM2.5, we calculated all-cause premature deaths associated with short-term exposure to PM2.5 during 2014–2019. The following formula is used:
RRi,j represents the relative risk for deaths from all causes, where i and j represent the day and grid, respectively. Ci,j is the daily average concentration of PM2.5. For days with a mean PM2.5 greater than or equal to 75 µg m−3, C0 equals 75 µg m−3, and the exposure–response coefficient β is set to 1.22 % (95 % CI: 0.82 %–1.63 %) per 10 µg m−3 increase in PM2.5 (Sun et al., 2022). For all the other days that are considered relatively clean, C0 equals zero, and β is set to 0.41 % (95 % CI: 0.32 %–0.50 %) per 10 µg m−3 increase in PM2.5 (C. Liu et al., 2019). The age structure is not considered in this formula because of little significant differences in mortality among age subgroups (Sun et al., 2022).
Deathi,j represents the number of premature deaths at a specific grid in a day, and Yi,j is the daily baseline mortality rate, which is obtained from the Global Burden of Disease (GBD) 2019 data (https://vizhub.healthdata.org/gbd-results/, last access: 2 February 2024; GBD 2019 Diseases and Injuries Collaborators, 2020). Pj represents the number of populations.
2.3 Definition of seesaw events and air stagnation
In this study, we focus on two meteorological scenarios during wintertime in 2014–2019: seesaw events and air stagnation. The seesaw events are diagnosed as follows: over a 3 d period, the mean PM2.5 concentration over the NCP (YRD) decreases by more than a certain threshold, whereas it increases continuously during the period over the YRD (NCP), leading to two types of seesaw events. In this study, we selected a threshold of 40 %, which identified a total of 168 d with the seesaw pattern. Additionally, we tested several other thresholds (e.g., 30 %, 35 %, 45 %, 50 %), which resulted in comparable numbers of seesaw pattern days: 182, 176, 162, and 154, respectively. Regarding air stagnation, we adopted the criteria proposed by Gao et al. (2020). A stagnant day is defined as a day where the daily mean wind speed at 10 m is less than 3.2 m s−1, the daily total precipitation is less than 1 mm, and the planetary boundary layer height is less than 520 m.
Please note that there is an overlap between stagnant and seesaw events. Among the seesaw events, 35 % are concomitant with stagnant conditions, indicating that the seesaw events together with stagnant weather conditions are more conducive to high PM2.5 pollution. As a result, when discussing the seesaw pattern, the concomitant stagnant days are included.
3.1 Model validation
To evaluate the capability of the model to reproduce the observations, we first compared the meteorological parameters, including daily air temperature at 2 m (T2), specific humidity at 2 m (Q2), wind speed at 10 m (WS10), and wind direction at 10 m (WD10), simulated by WRF (Table S2) against the observations of the NCDC over the NCP, YRD, and SWLY. The statistical metrics, including mean bias, gross error, and root-mean-square error (RMSE), are mostly within the benchmarks (Emery and Tai, 2001), despite the slightly higher bias for wind direction, which is likely attributable to wind directions close to 0 or 360° (G. Zhang et al., 2019). Moreover, daily mean simulated PM2.5 is compared to observations during 2014–2019 over the three regions of NCP, YRD, and SWLY (Fig. S2). Overall, the mean fractional bias (MFB) and mean fractional error (MFE) percentages are within the benchmarks (MFB %, MFE ≤ 75 %; U.S. EPA, 2007), warranting high confidence in interpreting the simulated results.
3.2 Observational evidence of high PM2.5 concentrations in SWLY
Figure 1a shows the spatial distribution of observed mean PM2.5 concentrations from 2014 to 2019. The high values of PM2.5 are predominantly concentrated in eastern China due to dense populations and anthropogenic emissions (Gao et al., 2022). Zooming into SWLY and the NCP and YRD, the annual mean PM2.5 in these three regions gradually decreases, primarily attributable to strict clean air policies and reductions in anthropogenic emissions (G. Zhang et al., 2019). Among the three regions, the average PM2.5 concentration is highest in the NCP (76.0 µg m−3), followed closely by SWLY with a PM2.5 concentration of 67.2 µg m−3, which is much higher than that over the YRD (46.3 µg m−3). Furthermore, as shown in Fig. 1b, despite the adjacency of SWLY to the NCP, the decreasing trend is more pronounced in the NCP (9.3 ), followed by the YRD (5.1 ) and SWLY (5.0 ). When focusing specifically on the winter season, as shown in Fig. 1c, PM2.5 concentrations in the NCP and SWLY are almost comparable from 2016 to 2019 and much higher than in the YRD, indicating a more severe haze pollution situation in winter in SWLY compared to the YRD. Note that the line separation between NCP and SWLY in the winter of 2014 and 2015 will be discussed in the subsequent paragraph.
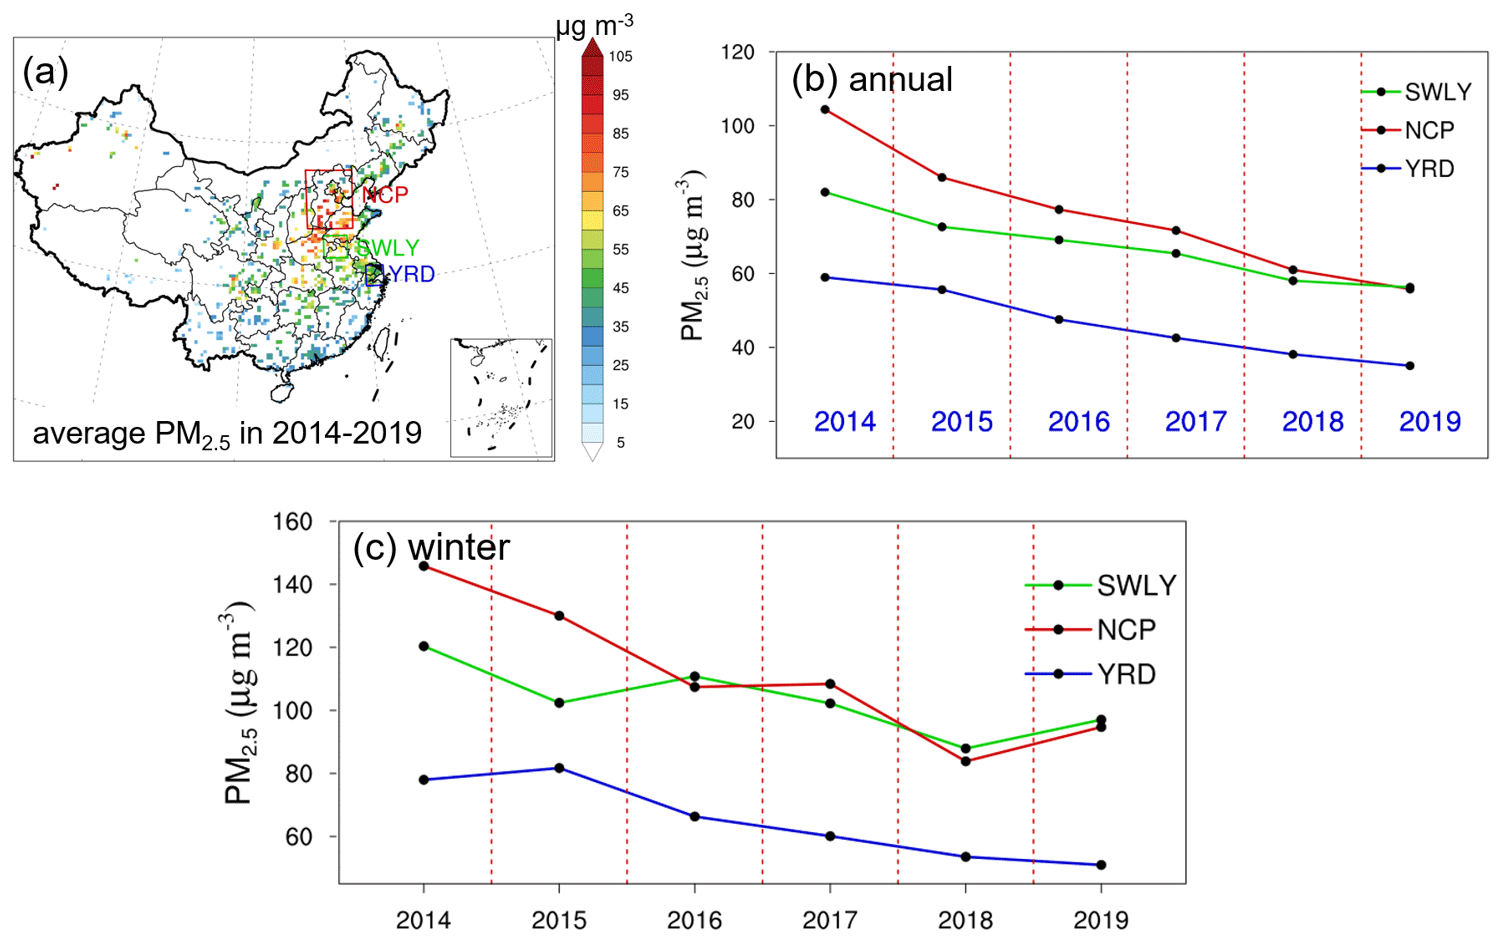
Figure 1(a) Spatial distribution of 6-year annual mean PM2.5. (b, c) Time series of annual (b) and winter (c) mean PM2.5 concentrations over the SWLY, NCP, and YRD regions.
According to the Air Quality Index (HJ 633-2012; MEEPRC, 2012), a pollution day is defined as a day with a mean PM2.5 concentration exceeding 75 µg m−3, which can be further divided into moderate pollution (75–150 µg m−3), heavy pollution (150–250 µg m−3), and extreme pollution (greater than 250 µg m−3). To better measure the severity of pollution, a metric of duration is introduced, which is calculated as the regional mean value of the total number of pollution days in winter. The number of pollution days in one event is considered persistent, and we have also calculated the mean persistence of all events. Figure 2 shows the duration and mean regional PM2.5 concentrations over SWLY and NCP during these pollution days, for these three abovementioned categories. Here, some discussion is needed to show why we introduce these parameters and which kind of information it could bring us beyond a simple PM2.5 concentration.
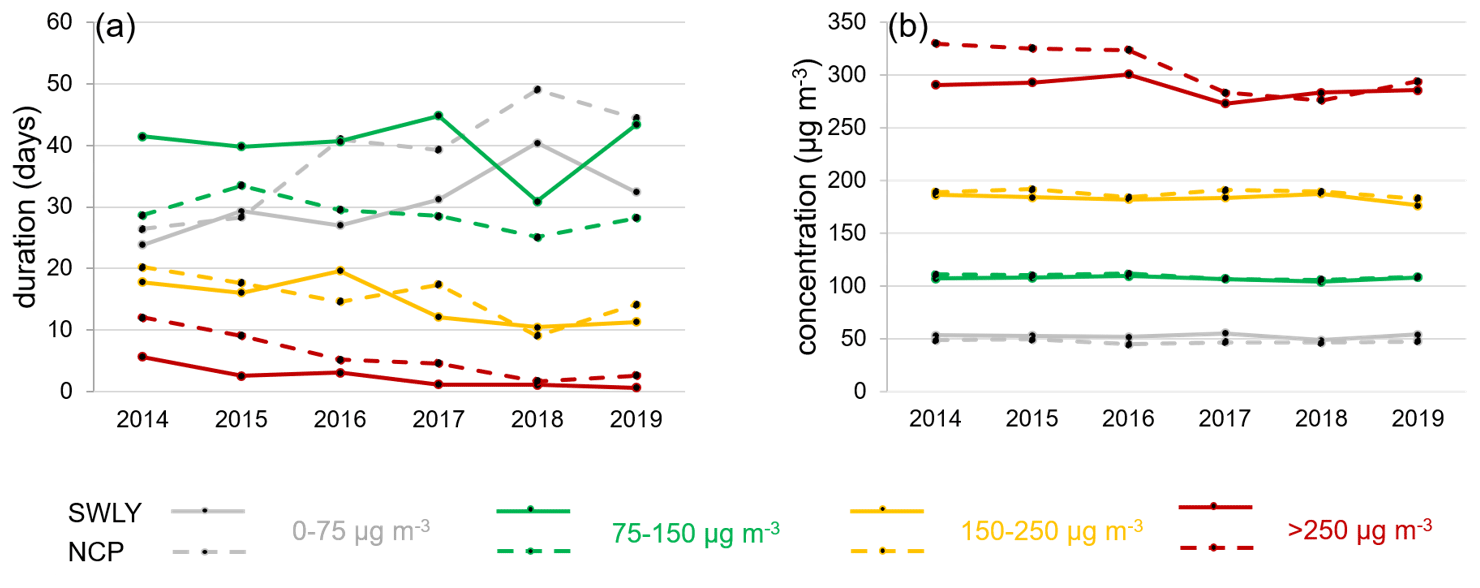
Figure 2The regional mean number of days (duration) (a) and concentrations (b) of observational PM2.5 for the four categories (I – 0–75 µg m−3, II – 75–150 µg m−3, III – 150–250 µg m−3, and IV – greater than 250 µg m−3) over SWLY (solid lines) and the NCP (dotted lines) in winter 2014–2019.
During wintertime in 2014–2019, the total annual number of pollution days reached an average of 57.1 and 50.3 in SWLY and NCP, respectively (Fig. 2a). By classifying pollution days into different categories, the results depicted in Fig. 2b indicate that extreme-pollution events, characterized by daily mean PM2.5 concentrations exceeding 250 µg m−3, dominate the interannual variability in winter PM2.5 in both SWLY and the NCP (Fig. 1c). Similarly, as shown in Fig. S3, in 2014 and 2015, the cumulative distribution function curves of daily observed PM2.5 in the NCP are obviously on the right of those in SWLY, indicating higher PM2.5 concentrations over the NCP. From 2016, the cumulative distribution function curves over SWLY are on the right of those in the NCP when the PM2.5 concentration is below 100–150 µg m−3, which reverses when the PM2.5 concentration becomes higher, yielding an overall comparable PM2.5 concentration between NCP and SWLY. While both SWLY and the NCP experience comparably frequent PM2.5 pollution events, higher than the frequency over the YRD (Fig. S4a), the higher total number of PM2.5 pollution days in SWLY indicates that the meteorological features in SWLY may govern the severe pollution there, considering that the mean precursor emissions (such as NOx and SO2) in SWLY are only 68 % and 52 % of those in the NCP (Fig. S5).
3.3 The seesaw effect between the NCP and YRD on PM2.5 in SWLY
Considering that SWLY is located in the corridor between the NCP and YRD, transport from polluted areas such as the NCP and YRD could play key roles in affecting air quality in SWLY. To diagnose the effect, two types of seesaw events are defined in this study. Type I seesaw events are characterized by a decrease (40 % threshold) in PM2.5 concentration over the NCP and an increase over the YRD, while Type II seesaw events show the opposite pattern.
The temporal evolution of mean composited PM2.5 concentrations during winter 2014–2019 in SWLY and the NCP and YRD for Type I and II seesaw events is shown in Fig. 3a–b. For Type I events (Fig. 3a), there is a total of 24 events lasting 75 d, with an average persistence of 3 d. On day 1, the PM2.5 concentrations are highest over the NCP (144.5 µg m−3), followed by SWLY (103.9 µg m−3) and the YRD (32.1 µg m−3). On day 2, along with a sharp decrease in the PM2.5 concentration in the NCP (112.9 µg m−3), the PM2.5 in SWLY rapidly increased by 31 % (135.2 µg m−3). Finally, on the third day, when PM2.5 pollution is cleared out in the NCP (59.0 µg m−3), PM2.5 concentrations in SWLY remain as high as 108.7 µg m−3 and increase to 94.3 µg m−3 in the YRD. Figure 3c further denotes wind vectors at 850 hPa, which supports the movement of the surface PM2.5 concentration. On day 1, the weak wind over northern China favors the accumulation of PM2.5 in the NCP, and the particulate matter propagates southeastward, driven by the enhanced northwesterly wind, resulting in high PM2.5 concentrations in SWLY and YRD on day 2 and 3. Previous studies have pointed out that the transboundary effect from the NCP to the YRD contributed to almost one-third of the total PM2.5 in the YRD during periods such as 21–26 January 2015 (Kang et al., 2019) and 2–3 November 2017 (Kang et al., 2021), respectively.
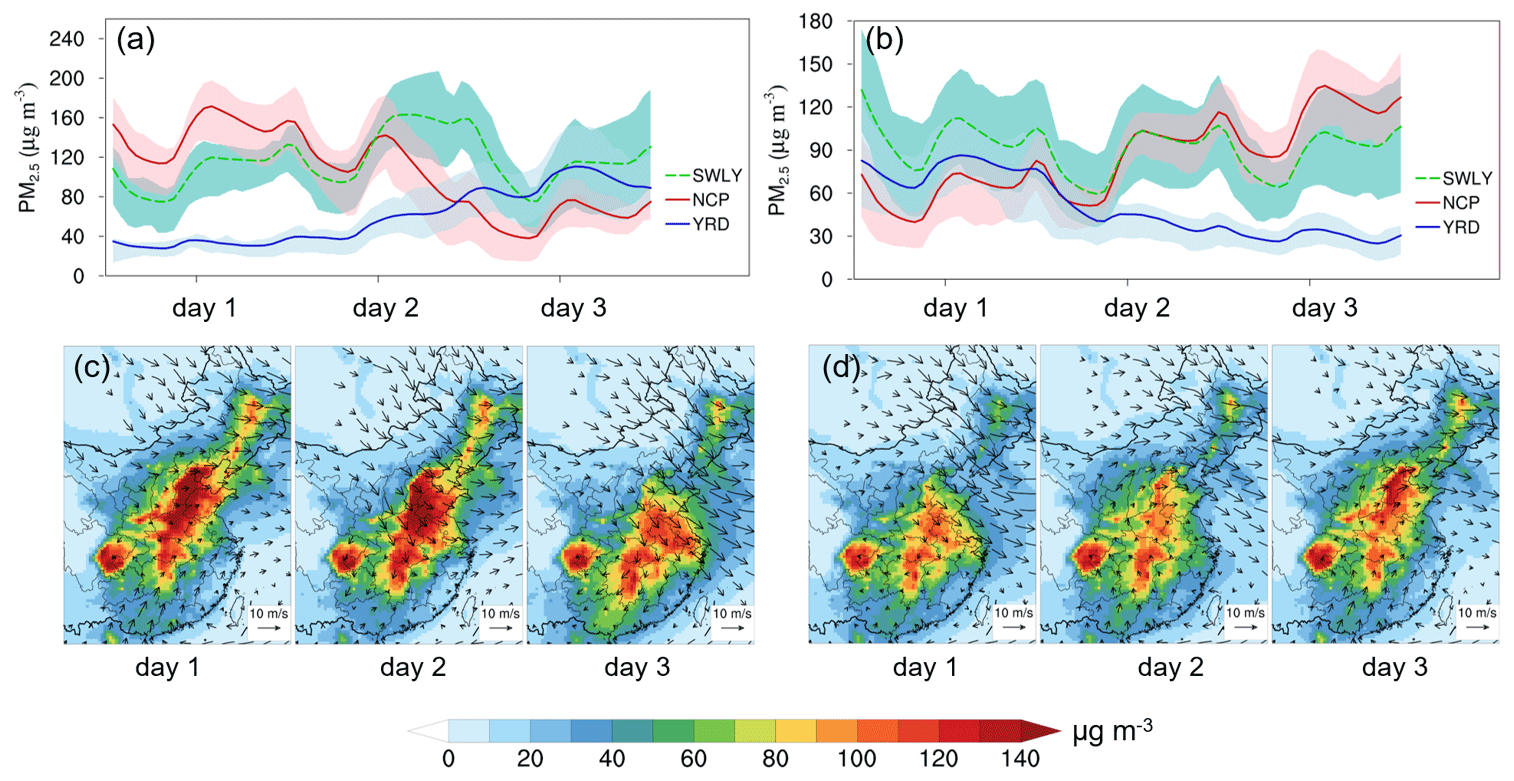
Figure 3(a, b) Time series of mean PM2.5 concentrations in SWLY (dashed green line), the NCP (solid red line), and the YRD (solid blue line), with shading indicative of the range of the 25th–75th percentile, during winter 2014–2019 for Type I (a) and Type II (b). (c, d) The spatial distribution shows the surface average PM2.5 concentrations during 3 d in Type I (c) and Type II (d), respectively, with black arrows representing the wind vectors at 850 hPa.
Similarly, in Type II events (Fig. 3b) during which PM2.5 is transported from the YRD toward the northwest, there is a total of 106 d with 32 events. Compared to day 1, the PM2.5 concentrations on day 3 over the YRD decrease rapidly by 63 %, while they increase by 82 % over the NCP (111.7 µg m−3). Meanwhile, SWLY maintains a stable pollutant status, with PM2.5 concentrations of 59.4–131.9 µg m−3. The spatiotemporal evolution of surface PM2.5 concentrations and wind vectors at 850 hPa during this event is displayed in Fig. 3d. Unlike Type I (Fig. 3c), on day 1, strong northwesterly winds in northern China are concomitant with low PM2.5 concentrations over the NCP, while the PM2.5 concentrations in southern China, such as the YRD and adjacent areas, are relatively high. In the following 2 d, the northwesterly wind retreated further north, and a weak southerly wind dominated the majority of northern China, stimulating the accumulation of PM2.5 in SWLY and the NCP. Comparably, focusing on episodic events from 29 October to 6 November 2015 over the NCP, W. Zhang et al. (2021) found that transport from the south could account for up to 70 % of PM2.5 concentrations over this area.
Moreover, the Lagrangian particle dispersion model FLEXPART working together with WRF (FLEXPART-WRF; Brioude et al., 2013) is applied to identify the dominant wind direction for each event in Type I and II, with the target regions of YRD and NCP, respectively. A total of 72 h, with an interval of 12 h, is backward tracked to identify the transport pathways, yielding a total of seven trajectories marked in different colors for each event, as shown in Figs. S6–S7. For Type I, most seesaw events are driven by the northwesterly wind, leading to an increase in PM2.5 concentrations in the SWLY and YRD regions. Even though there are a few exceptions, for instance, on 2 and 27 February 2014, the wind direction 72 h prior to the event may be quite different from the other 2 d (e.g., 24 and 48 h), which in general favors the northwesterly transport, indicating that the wind pattern closer to the end of the event may play a larger role in fostering the accumulation of high PM2.5 concentrations downwind of the pollution area. In contrast, for Type II, the seesaw pattern of the PM2.5 concentration in the NCP is attributed to the shift in the dominant wind direction, that is, from northwest to southwest (Fig. S7), which facilitates PM2.5 accumulation over the NCP.
There is a tight relationship between the surface PM2.5 concentration and upper-level large-scale circulations (e.g., 500 hPa) in eastern China (Hua and Wu, 2022; Zhang et al., 2022). To this end, we collate the anomalous 500 hPa geopotential height and wind vector data during Type I and II events. As shown in Fig. 4a, for Type I, the NCP is located west of the center of intense anticyclonic anomalies, conducive to the accumulation of PM2.5 concentrations therein by inducing relatively stagnant weather conditions (Wang et al., 2020; Zhong et al., 2019). Based on observations during 2009–2020, as mentioned in Hua and Wu (2022), negative–positive height anomalies could be regarded as a reliable signal for wintertime haze occurrence in Beijing. On day 2 and 3, the high-pressure system center retreated eastward; a triple feature emerged, with a positive–negative–positive pattern in northern China from west to east; and the middle low-pressure system favored the air transport from the NCP, eventually forming the high PM2.5 in SWLY and the YRD. In contrast, the spatial evolution of the pressure system behaves oppositely for Type II events (Fig. 4b). Northern China is controlled by a low-pressure system on day 1, supporting the low PM2.5 concentration and relatively high PM2.5 concentration over the YRD and southern China. Along with the movement of airflow, a high-pressure system kicks in and takes over, facilitating the transport of moist and warm airflow and subsequent secondary formation of PM2.5 in northern China (W. Zhang et al., 2021; Zhang et al., 2022).
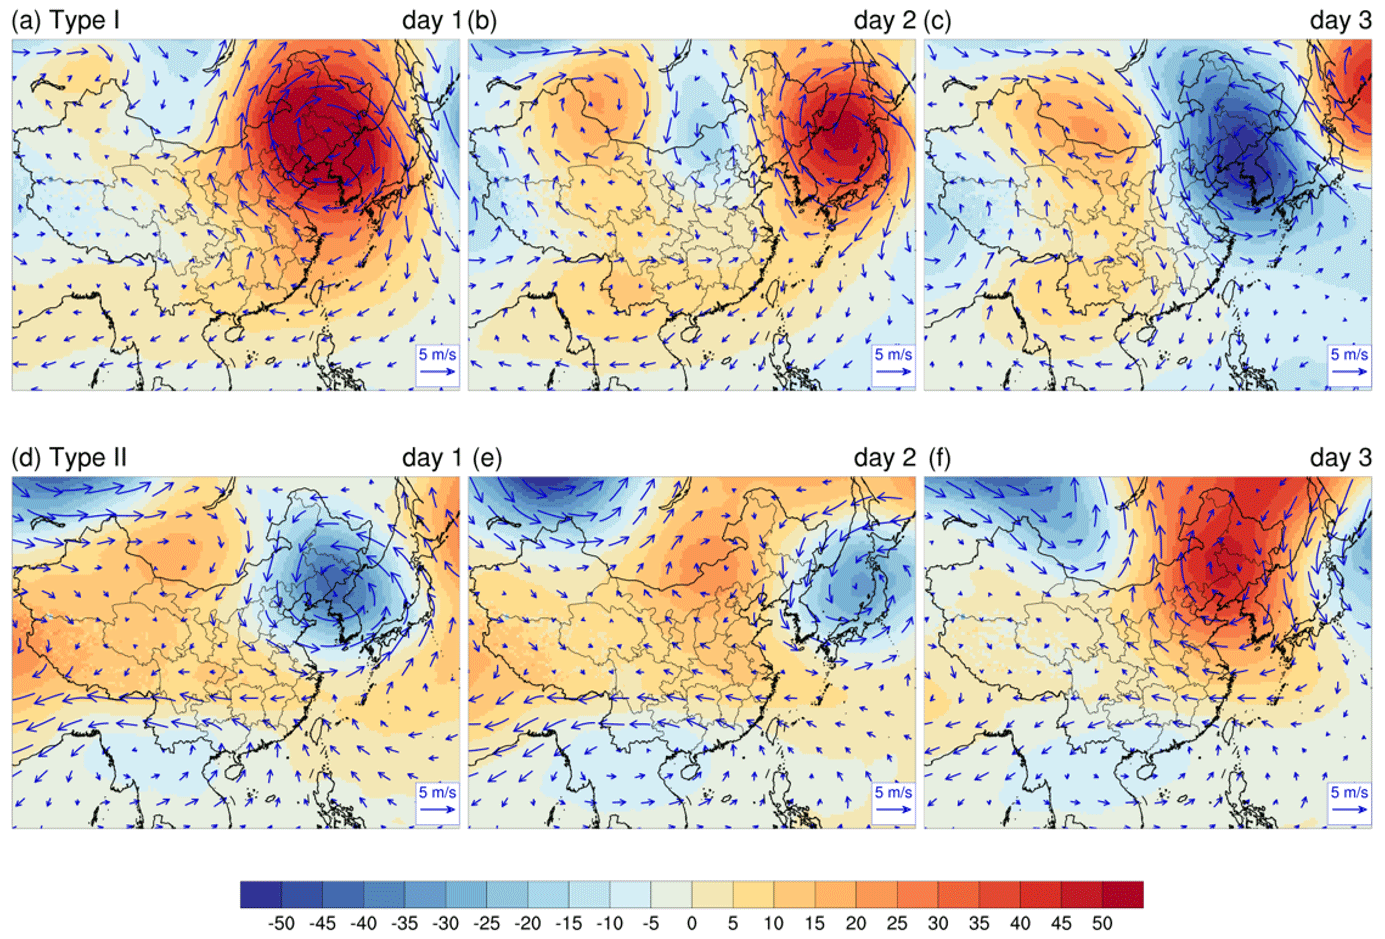
Figure 4The composite anomalies of the geopotential height (units: gpm) and wind vector at 500 hPa for 3 d for Type I and II, with the anomaly relative to the winter average in winter 2014–2019.
3.4 Pollution days in SWLY attributable to atmospheric stagnation
Stagnant meteorological conditions have been found to play an important role in promoting the accumulation of PM2.5 on severe pollution days in China (Wang et al., 2022, 2018). Therefore, in addition to the days categorized as a seesaw pattern in winter during 2014–2019, we investigate the impact of atmospheric stagnation on PM2.5 pollution in SWLY.
The annual mean of atmospheric stagnation days in 2014–2019 over eastern China is shown in Fig. 5a. The Tarim Basin and Sichuan Basin exhibit the most frequent stagnation occurrence exceeding 50 %, which is attributable to the topography as well as climate conditions featured by low wind speed (Wang et al., 2022; Huang et al., 2017). In SWLY (green square in Fig. 1a), the annual mean stagnation days reach 37 d. Furthermore, we evaluate the capability of stagnation days to modulate PM2.5 pollution and use the ratio of polluted days in stagnation days to the total number of stagnation days (HSR, defined in Gao et al., 2020). As shown in Fig. 5b, among all the stagnation days, the pollution days in SWLY account for 60 %, which can explain 35 % of the total pollution days (Table S3), implying the importance of stagnant weather on the accumulation of PM2.5. Under stagnant conditions, the spatial distribution of the average PM2.5 concentration (Fig. 5c) shows explicit spatial heterogeneity, and a high PM2.5 concentration is captured in SWLY (120.5 µg m−3).
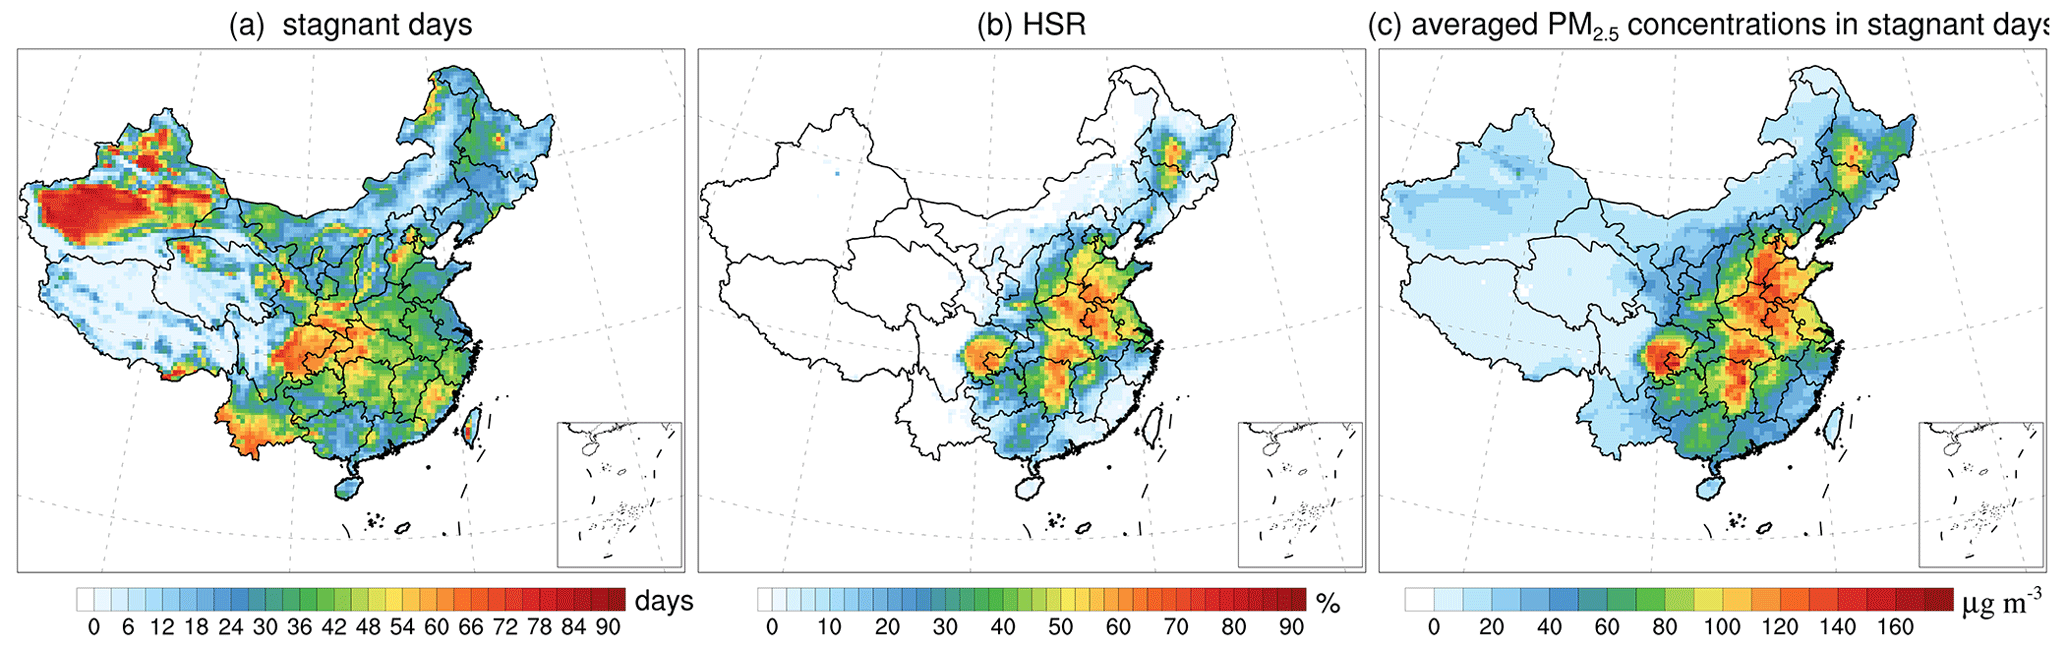
Figure 5The annual total number of stagnant days (a), ratio of pollution days to the total number of stagnant days (HSR, b), and mean PM2.5 concentrations during stagnant days during winter 2014–2019 (c).
Furthermore, the interannual variability of composited mean PM2.5 concentrations and HSR during stagnation are displayed in Fig. 6a, indicating consistently positive trends for the three metrics. The variability of HSR and composited mean PM2.5 concentrations are likely governed by the variability of stagnation persistence (depicted as the black dotted line in Fig. 6a). Focusing specifically on pollution days (defined as daily mean PM2.5 concentration exceeding 75 µg m−3) only during atmospheric stagnation, which is equivalent to the product of stagnation days and HSR, yields an average of 23 d per winter, accounting for 23 %–49 % (orange bars in Fig. 6b) of total pollution days during the winter of 2014–2019. Moreover, the total number of pollution days amounts to 387 (Table S3). The pollution days associated with seesaw events are shown by green bars and account for a range of 12 % to 44 %, with the highest proportion of 44 % in 2017, followed by 43 % in 2015, and 40 % in 2014, tightly linked to the interannual variability of large-scale cold front activities (X. Zhang et al., 2019). Overall, the stagnation of air conditions and transport accounted for 58 %–78 %, an average of 67 %, of the pollution days in SWLY in winter 2014–2019.
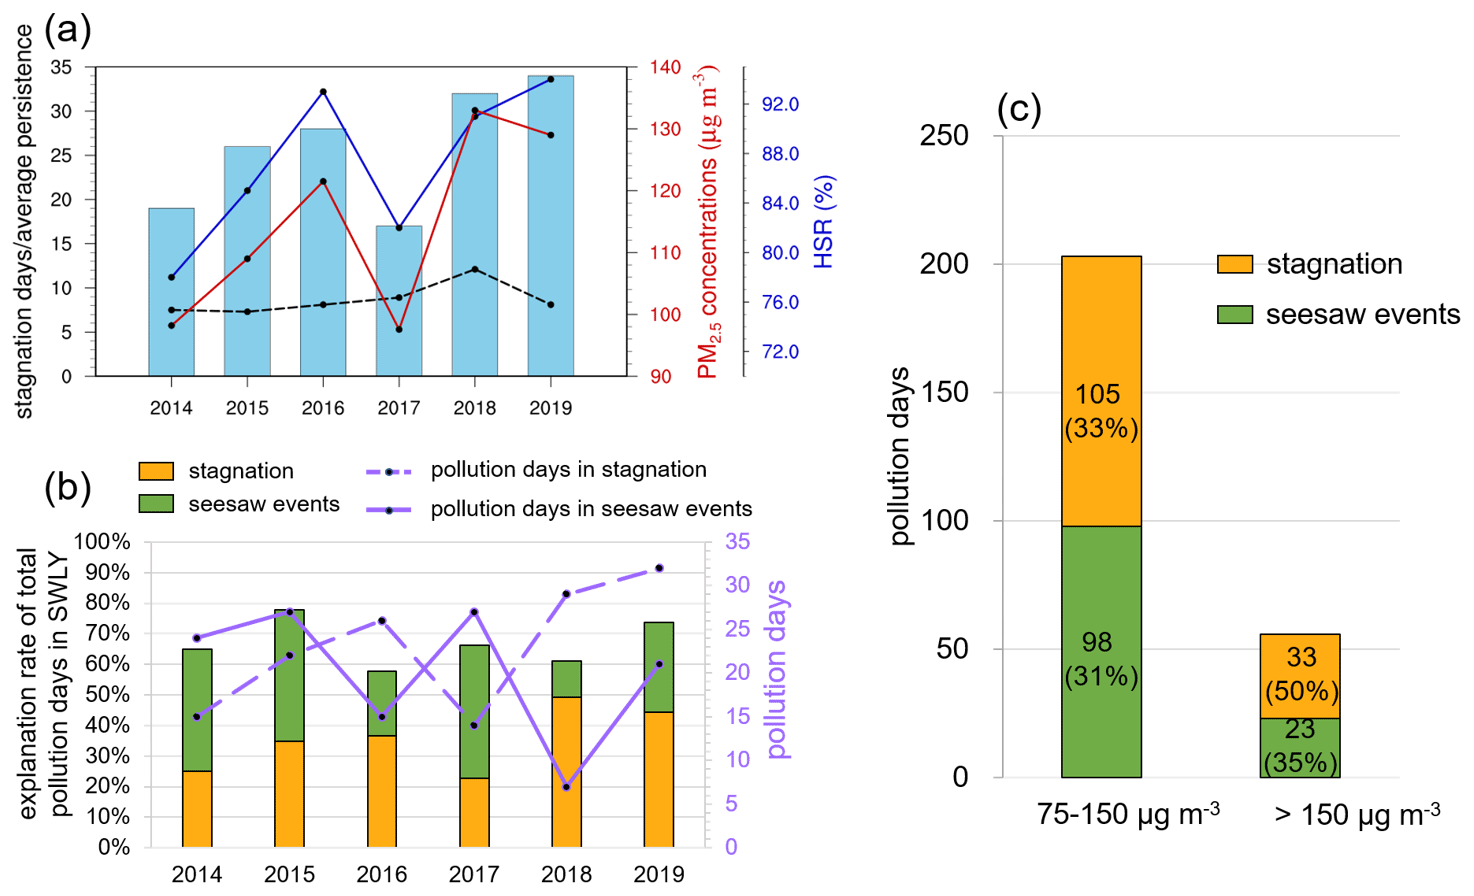
Figure 6(a) Annual stagnation days in winter (blue bars), the average concentration of PM2.5 during the stagnation period (red line), HSR (the ratio of haze days during the stagnation period to the total number of stagnation days; blue line), and the average persistence of composite stagnation events in SWLY (dotted black line) in winter from 2014–2019. (b) The annual explanation rate of stagnant air conditions and seesaw events on total pollution days (PM2.5 concentrations greater than 75 µg m−3) in SWLY. (c) The total explanation rate of air stagnation and seesaw events on moderate-pollution (75–150 µg m−3) and heavy-pollution (> 150 µg m−3) days in SWLY.
The pollution days can be classified into moderate-pollution days (75 µg m−3 < PM2.5 < 150 µg m−3) and heavy-pollution days (150 µg m−3 < PM2.5). For moderate-pollution days, comparable contributions from stagnation (33 %) and seesaw events (31 %) are achieved. The contribution to heavy pollution is even higher, accounting for 85 %, with 50 % from stagnation and 35 % from seesaw events.
3.5 Premature deaths attributable to short-term PM2.5 exposure over SWLY
Considering the threat of exposure to PM2.5 to public health, we assessed premature deaths in SWLY due to short-term PM2.5 exposure caused by seesaw events and stagnant meteorology in winter during 2014–2019.
There was a total of 26 241 (95 % CI: 18 304–34 126) premature deaths resulting from PM2.5 exposure in SWLY in winter during 2014–2019. Specifically, during the seesaw events shown in Fig. 7a, focusing on eastern China, the distribution of premature deaths due to short-term PM2.5 exposure is mainly concentrated in the southern NCP, SWLY, and YRD. For SWLY, PM2.5 exposure during the seesaw events accounted for 33 % (8634 (95 % CI: 6023–11 223)) of the total premature deaths, primarily due to exposure to pollution days (7404 (95 % CI: 5060–9727)) compared to clean days (green bars in Fig. 7c). A comparable rate of premature death is caused by stagnation (9496 (95 % CI: 6552–12 413); Fig. 7b) in SWLY, mainly attributable to PM2.5 exposure on pollution days (8892 (95 % CI: 6078–11 678); orange bars in Fig. 7c). We also calculated the total number of premature deaths in China during winter from 2014 to 2019 due to short-term exposure, which amounted to 293 652 (95 % CI: 229 711–357 318). Notably, SWLY accounted for 9 % of these premature deaths, despite its coverage representing only 0.8 % of the total land area.
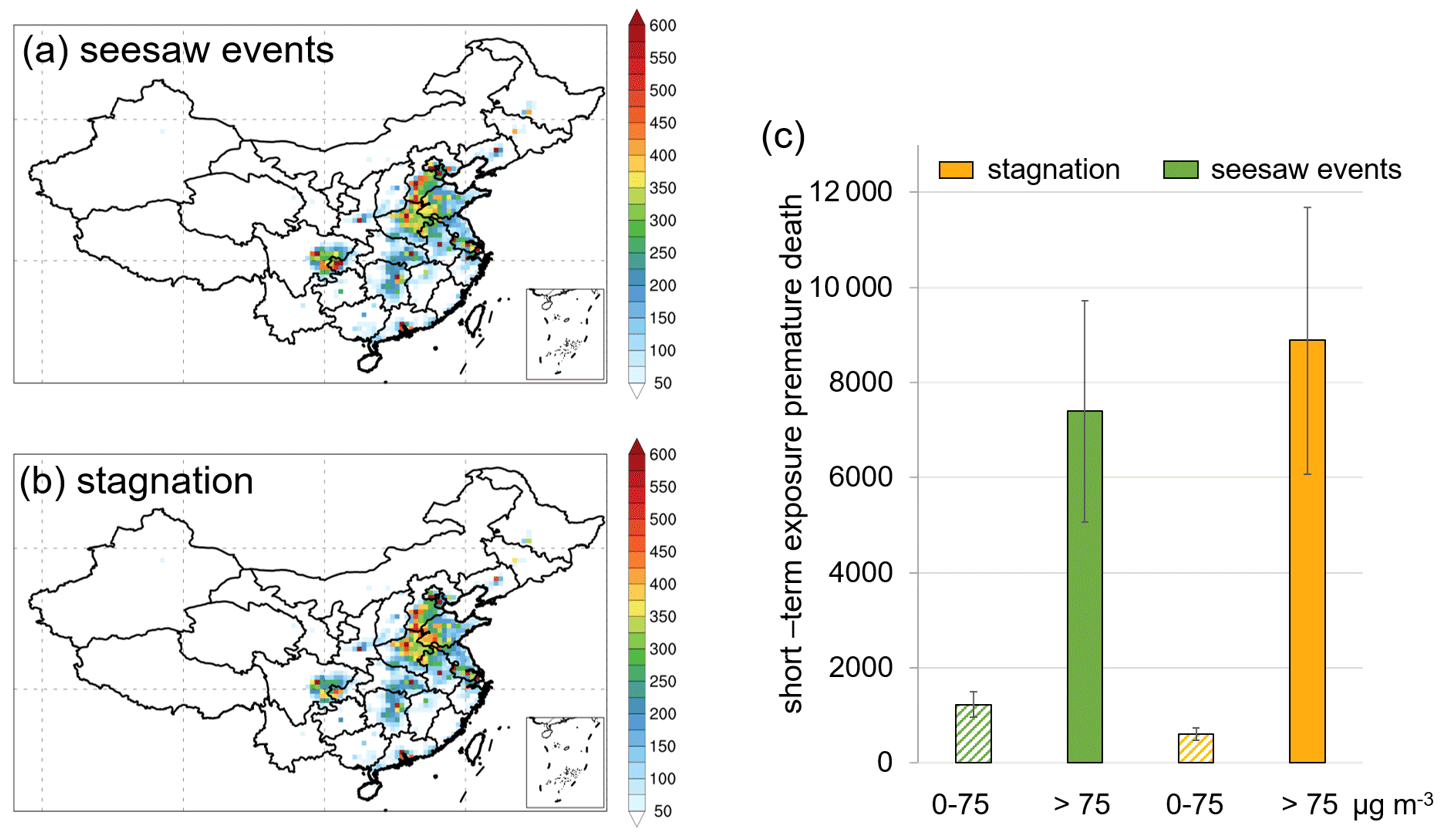
Figure 7(a) The spatial distribution of total premature deaths resulting from short-term PM2.5 exposure during the transport days (i.e., days with seesaw events). (b) Same as panel (a) but for the days with stagnation conditions in SWLY. (c) The premature deaths resulting from exposure to PM2.5 with concentrations less than 75 µg m−3 and greater than 75 µg m−3 during transport and stagnant days in SWLY.
The SWLY region, located at the junction of the NCP and YRD, experienced a persistent and pronounced wintertime PM2.5 pollution situation from 2014 to 2019. Interestingly, despite comparable frequencies of pollution days between NCP and SWLY, the total number of pollution days in SWLY (57.1 d yr−1) is 14 % higher than that in the NCP. This can be attributed to the amplified influence of seesaw transport effects between NCP and YRD on PM2.5 levels in SWLY.
When there is a transition in the geopotential height anomaly at 500 hPa, particularly when it changes from positive to negative in northern China (or vice versa), it leads to a shift in pollutant transport. The northwest wind activity facilitates the transport of pollutants from the NCP to the YRD, while the southeasterly wind favors pollutant transport from the YRD to the NCP, yielding high PM2.5 levels in SWLY. Moreover, atmospheric stagnation plays a crucial role in triggering PM2.5 accumulation in SWLY. For instance, during the winter period of 2014–2019, both the total number of stagnation days and mean PM2.5 concentration during stagnant periods show positive trends, likely modulated by the persistence of stagnation. Overall, the combined influence of seesaw events and stagnation accounts for approximately two-thirds of the pollution days observed in SWLY.
Considering the health effects during winters from 2014 to 2019 in SWLY, short-term exposure to PM2.5 was found to result in an additional 8634 premature deaths (95 % CI: 6023–11 223) and 9496 premature deaths (95 % CI: 6552–12 413) attributable to seesaw events and stagnation, respectively. Although the area of SWLY accounts for less than 1 % of China, it accounts for 9 % of the total number of premature deaths in the country. More frequent atmospheric stagnation events are projected to occur in China under a warming climate (Horton et al., 2014; Hu et al., 2022), highlighting the urgency of coordinated cross-regional emissions reduction to achieve additional benefits in reducing PM2.5 concentrations and the associated health effects in SWLY.
The regional air quality simulations are available upon request to the corresponding author.
The supplement related to this article is available online at: https://doi.org/10.5194/acp-24-2365-2024-supplement.
YG conceived the project, FY performed the analysis and drafted the manuscript, and all authors contributed to the writing of the manuscript.
At least one of the (co-)authors is a member of the editorial board of Atmospheric Chemistry and Physics. The peer-review process was guided by an independent editor, and the authors also have no other competing interests to declare.
Publisher’s note: Copernicus Publications remains neutral with regard to jurisdictional claims made in the text, published maps, institutional affiliations, or any other geographical representation in this paper. While Copernicus Publications makes every effort to include appropriate place names, the final responsibility lies with the authors. Regarding the maps used in this paper, please note that Figs. 1, 3, 4, 5, and 7 contain disputed territories.
The authors gratefully acknowledge the financial support of the National Natural Science Foundation of China and Fundamental Research Funds for the Central Universities. The simulations were conducted on the Center for High Performance Computing and System Simulation, National Laboratory for Marine Science and Technology (Qingdao).
This research has been supported by the National Natural Science Foundation of China (grant no. 42122039) and Fundamental Research Funds for the Central Universities (grant no. 202341001).
This paper was edited by Dantong Liu and reviewed by two anonymous referees.
Ali, M. A., Huang, Z., Bilal, M., Assiri, M. E., Mhawish, A., Nichol, J. E., de Leeuw, G., Almazroui, M., Wang, Y., and Alsubhi, Y.: Long-term PM2.5 pollution over China: Identification of PM2.5 pollution hotspots and source contributions, Sci. Total Environ., 893, 164871, https://doi.org/10.1016/j.scitotenv.2023.164871, 2023.
Appel, K. W., Gilliland, A. B., Sarwar, G., and Gilliam, R. C.: Evaluation of the Community Multiscale Air Quality (CMAQ) model version 4.5: Sensitivities impacting model performance: Part I–Ozone, Atmos. Environ., 41, 9603–9615, https://doi.org/10.1016/j.atmosenv.2007.08.044, 2007.
Appel, K. W., Bash, J. O., Fahey, K. M., Foley, K. M., Gilliam, R. C., Hogrefe, C., Hutzell, W. T., Kang, D., Mathur, R., Murphy, B. N., Napelenok, S. L., Nolte, C. G., Pleim, J. E., Pouliot, G. A., Pye, H. O. T., Ran, L., Roselle, S. J., Sarwar, G., Schwede, D. B., Sidi, F. I., Spero, T. L., and Wong, D. C.: The Community Multiscale Air Quality (CMAQ) model versions 5.3 and 5.3.1: system updates and evaluation, Geosci. Model Dev., 14, 2867–2897, https://doi.org/10.5194/gmd-14-2867-2021, 2021.
Bowden, J. H., Otte, T. L., Nolte, C. G., and Otte, M. J.: Examining Interior Grid Nudging Techniques Using Two-Way Nesting in the WRF Model for Regional Climate Modeling, J. Climate, 25, 2805–2823, https://doi.org/10.1175/JCLI-D-11-00167.1, 2012.
Brioude, J., Arnold, D., Stohl, A., Cassiani, M., Morton, D., Seibert, P., Angevine, W., Evan, S., Dingwell, A., Fast, J. D., Easter, R. C., Pisso, I., Burkhart, J., and Wotawa, G.: The Lagrangian particle dispersion model FLEXPART-WRF version 3.1, Geosci. Model Dev., 6, 1889–1904, https://doi.org/10.5194/gmd-6-1889-2013, 2013.
Donaldson, K., Li, X. Y., and MacNee, W.: Ultrafine (nanometre) particle mediated lung injury, J. Aerosol. Sci., 29, 553–560, https://doi.org/10.1016/s0021-8502(97)00464-3, 1998.
Emery, C. and Tai, E.: Enhanced Meteorological Modeling and Performance Evaluation for Two Texas Ozone Episodes, Texas Natural Resource Conservation Commission, ENVIRON International Corp, https://api.semanticscholar.org/CorpusID:127579774 (last access: 7 February 2024), 2001.
Emmons, L. K., Walters, S., Hess, P. G., Lamarque, J.-F., Pfister, G. G., Fillmore, D., Granier, C., Guenther, A., Kinnison, D., Laepple, T., Orlando, J., Tie, X., Tyndall, G., Wiedinmyer, C., Baughcum, S. L., and Kloster, S.: Description and evaluation of the Model for Ozone and Related chemical Tracers, version 4 (MOZART-4), Geosci. Model Dev., 3, 43–67, https://doi.org/10.5194/gmd-3-43-2010, 2010.
Gao, Y., Zhang, L., Zhang, G., Yan, F. F., Zhang, S. Q., Sheng, L. F., Li, J. P., Wang, M. H., Wu, S. L., Fu, J. S., Yao, X. H., and Gao, H. W.: The climate impact on atmospheric stagnation and capability of stagnation indices in elucidating the haze events over North China Plain and Northeast China, Chemosphere, 258, 127335, https://doi.org/10.1016/j.chemosphere.2020.127335, 2020.
Gao, Y., Zhang, L., Huang, A., Kou, W., Bo, X., Cai, B., and Qu, J.: Unveiling the spatial and sectoral characteristics of a high-resolution emission inventory of CO2 and air pollutants in China, Sci. Total Environ., 847, 157623, https://doi.org/10.1016/j.scitotenv.2022.157623, 2022.
GBD 2019 Diseases and Injuries Collaborators: Global burden of 369 diseases and injuries in 204 countries and territories, 1990–2019: a systematic analysis for the Global Burden of Disease Study 2019, Lancet, 396, 1204–1222, https://doi.org/10.1016/S0140-6736(20)30925-9, 2020.
Geng, G., Xiao, Q., Liu, S., Liu, X., Cheng, J., Zheng, Y., Xue, T., Tong, D., Zheng, B., Peng, Y., Huang, X., He, K., and Zhang, Q.: Tracking Air Pollution in China: Near Real-Time PM2.5 Retrievals from Multisource Data Fusion, Environ. Sci. Technol., 55, 12106–12115, https://doi.org/10.1021/acs.est.1c01863, 2021.
Giglio, L., Randerson, J. T., and van der Werf, G. R.: Analysis of daily, monthly, and annual burned area using the fourth-generation global fire emissions database (GFED4), J. Geophys. Res.-Biogeosci., 118, 317–328, https://doi.org/10.1002/jgrg.20042, 2013.
Guenther, A. B., Jiang, X., Heald, C. L., Sakulyanontvittaya, T., Duhl, T., Emmons, L. K., and Wang, X.: The Model of Emissions of Gases and Aerosols from Nature version 2.1 (MEGAN2.1): an extended and updated framework for modeling biogenic emissions, Geosci. Model Dev., 5, 1471–1492, https://doi.org/10.5194/gmd-5-1471-2012, 2012.
He, J., Gong, S., Zhou, C., Lu, S., Wu, L., Chen, Y., Yu, Y., Zhao, S., Yu, L., and Yin, C.: Analyses of winter circulation types and their impacts on haze pollution in Beijing, Atmos. Environ., 192, 94–103, https://doi.org/10.1016/j.atmosenv.2018.08.060, 2018.
Horton, D. E., Skinner, C. B., Singh, D., and Diffenbaugh, N. S.: Occurrence and persistence of future atmospheric stagnation events, Nat. Clim. Change, 4, 698–703, https://doi.org/10.1038/nclimate2272, 2014.
Hu, A., Xie, X., Gong, K., Hou, Y., Zhao, Z., and Hu, J.: Assessing the Impacts of Climate Change on Meteorology and Air Stagnation in China Using a Dynamical Downscaling Method, Front. Environ. Sci., 10, 894887, https://doi.org/10.3389/fenvs.2022.894887, 2022.
Hua, W. L. and Wu, B. Y.: Atmospheric circulation anomaly over mid- and high-latitudes and its association with severe persistent haze events in Beijing, Atmos. Res., 277, 106315, https://doi.org/10.1016/j.atmosres.2022.106315, 2022.
Huang, Q., Cai, X., Song, Y., and Zhu, T.: Air stagnation in China (1985–2014): climatological mean features and trends, Atmos. Chem. Phys., 17, 7793–7805, https://doi.org/10.5194/acp-17-7793-2017, 2017.
Huang, X., Ding, A. J., Wang, Z. L., Ding, K., Gao, J., Chai, F. H., and Fu, C. B.: Amplified transboundary transport of haze by aerosol–boundary layer interaction in China, Nat. Geosci., 13, 428–434, https://doi.org/10.1038/s41561-020-0583-4, 2020.
Jia, Z., Doherty, R. M., Ordóñez, C., Li, C., Wild, O., Jain, S., and Tang, X.: The impact of large-scale circulation on daily fine particulate matter (PM2.5) over major populated regions of China in winter, Atmos. Chem. Phys., 22, 6471–6487, https://doi.org/10.5194/acp-22-6471-2022, 2022.
Jiang, Z., Jolleys, M. D., Fu, T.-M., Palmer, P. I., Ma, Y., Tian, H., Li, J., and Yang, X.: Spatiotemporal and probability variations of surface PM2.5 over China between 2013 and 2019 and the associated changes in health risks: An integrative observation and model analysis, Sci. Total Environ., 723, 137896, https://doi.org/10.1016/j.scitotenv.2020.137896, 2020.
Kang, H., Zhu, B., Gao, J., He, Y., Wang, H., Su, J., Pan, C., Zhu, T., and Yu, B.: Potential impacts of cold frontal passage on air quality over the Yangtze River Delta, China, Atmos. Chem. Phys., 19, 3673–3685, https://doi.org/10.5194/acp-19-3673-2019, 2019.
Kang, H. Q., Zhu, B., Liu, X. H., Shi, S. S., Hou, X. W., Lu, W., Yan, S. Q., Pan, C., and Chen, Y.: Three-Dimensional Distribution of PM2.5 over the Yangtze River Delta as Cold Fronts Moving Through, J. Geophys. Res.-Atmos., 126, e2020JD034035, https://doi.org/10.1029/2020jd034035, 2021.
Li, J. D., Liao, H., Hu, J. L., and Li, N.: Severe particulate pollution days in China during 2013–2018 and the associated typical weather patterns in Beijing-Tianjin-Hebei and the Yangtze River Delta regions, Environ. Pollut., 248, 74–81, https://doi.org/10.1016/j.envpol.2019.01.124, 2019.
Li, M., Liu, H., Geng, G. N., Hong, C. P., Liu, F., Song, Y., Tong, D., Zheng, B., Cui, H. Y., Man, H. Y., Zhang, Q., and He, K. B.: Anthropogenic emission inventories in China: a review, Natl. Sci. Rev., 4, 834–866, https://doi.org/10.1093/nsr/nwx150, 2017.
Li, T. T., Guo, Y. M., Liu, Y., Wang, J. N., Wang, Q., Sun, Z. Y., He, M. K. Z., and Shi, X. M.: Estimating mortality burden attributable to short-term PM2.5 exposure: A national observational study in China, Environ. Int., 125, 245–251, https://doi.org/10.1016/j.envint.2019.01.073, 2019.
Liu, C., Chen, R., Sera, F., Vicedo-Cabrera, A. M., Guo, Y., Tong, S., Coelho, M. S. Z. S., Saldiva, P. H. N., Lavigne, E., Matus, P., Valdes Ortega, N., Osorio Garcia, S., Pascal, M., Stafoggia, M., Scortichini, M., Hashizume, M., Honda, Y., Hurtado-Díaz, M., Cruz, J., Nunes, B., Teixeira, J. P., Kim, H., Tobias, A., Íñiguez, C., Forsberg, B., Åström, C., Ragettli, M. S., Guo, Y.-L., Chen, B.-Y., Bell, M. L., Wright, C. Y., Scovronick, N., Garland, R. M., Milojevic, A., Kyselý, J., Urban, A., Orru, H., Indermitte, E., Jaakkola, J. J. K., Ryti, N. R. I., Katsouyanni, K., Analitis, A., Zanobetti, A., Schwartz, J., Chen, J., Wu, T., Cohen, A., Gasparrini, A., and Kan, H.: Ambient Particulate Air Pollution and Daily Mortality in 652 Cities, New Engl. J. Med., 381, 705–715, https://doi.org/10.1056/NEJMoa1817364, 2019.
Liu, H., Fu, M. L., Jin, X. X., Shang, Y., Shindell, D., Faluvegi, G., Shindell, C., and He, K. B.: Health and climate impacts of ocean-going vessels in East Asia, Nat. Clim. Chang., 6, 1037–1041, https://doi.org/10.1038/nclimate3083, 2016.
Liu, H., Meng, Z. H., Lv, Z. F., Wang, X. T., Deng, F. Y., Liu, Y., Zhang, Y. N., Shi, M. S., Zhang, Q., and He, K. B.: Emissions and health impacts from global shipping embodied in US-China bilateral trade, Nature Sustainability, 2, 1027–1033, https://doi.org/10.1038/s41893-019-0414-z, 2019.
Liu, J., Yin, H., Tang, X., Zhu, T., Zhang, Q., Liu, Z., Tang, X. L., and Yi, H. H.: Transition in air pollution, disease burden and health cost in China: A comparative study of long-term and short-term exposure, Environ. Pollut., 277, 116770, https://doi.org/10.1016/j.envpol.2021.116770, 2021.
Liu, P., Tsimpidi, A. P., Hu, Y., Stone, B., Russell, A. G., and Nenes, A.: Differences between downscaling with spectral and grid nudging using WRF, Atmos. Chem. Phys., 12, 3601–3610, https://doi.org/10.5194/acp-12-3601-2012, 2012.
Luecken, D. J., Yarwood, G., and Hutzell, W. T.: Multipollutant modeling of ozone, reactive nitrogen and HAPs across the continental US with CMAQ-CB6, Atmos. Environ., 201, 62–72, https://doi.org/10.1016/j.atmosenv.2018.11.060, 2019.
Ma, M., Gao, Y., Wang, Y., Zhang, S., Leung, L. R., Liu, C., Wang, S., Zhao, B., Chang, X., Su, H., Zhang, T., Sheng, L., Yao, X., and Gao, H.: Substantial ozone enhancement over the North China Plain from increased biogenic emissions due to heat waves and land cover in summer 2017, Atmos. Chem. Phys., 19, 12195–12207, https://doi.org/10.5194/acp-19-12195-2019, 2019.
Ma, Q. X., Wu, Y. F., Zhang, D. Z., Wang, X. J., Xia, Y. J., Liu, X. Y., Tian, P., Han, Z. W., Xia, X. G., Wang, Y., and Zhang, R. J.: Roles of regional transport and heterogeneous reactions in the PM2.5 increase during winter haze episodes in Beijing, Sci. Total Environ., 599, 246–253, https://doi.org/10.1016/j.scitotenv.2017.04.193, 2017.
MEEPRC: Technical Regulation on Ambient Air Quality Index (on trial): HJ 633-2012, Ministry of Ecology and Environment of the People's Republic of China, http://www.mee.gov.cn/ywgz/fgbz/bz/bzwb/jcffbz/201203/t20120302_224166.shtml (last access: 2 February 2024), 2012.
Pui, D. Y. H., Chen, S. C., and Zuo, Z. L.: PM2.5 in China: Measurements, sources, visibility and health effects, and mitigation, Particuology, 13, 1–26, https://doi.org/10.1016/j.partic.2013.11.001, 2014.
Pye, H. O. T., Murphy, B. N., Xu, L., Ng, N. L., Carlton, A. G., Guo, H., Weber, R., Vasilakos, P., Appel, K. W., Budisulistiorini, S. H., Surratt, J. D., Nenes, A., Hu, W., Jimenez, J. L., Isaacman-VanWertz, G., Misztal, P. K., and Goldstein, A. H.: On the implications of aerosol liquid water and phase separation for organic aerosol mass, Atmos. Chem. Phys., 17, 343–369, https://doi.org/10.5194/acp-17-343-2017, 2017.
Saha, S., Moorthi, S., Wu, X. R., Wang, J., Nadiga, S., Tripp, P., Behringer, D., Hou, Y. T., Chuang, H. Y., Iredell, M., Ek, M., Meng, J., Yang, R. Q., Mendez, M. P., Van Den Dool, H., Zhang, Q., Wang, W. Q., Chen, M. Y., and Becker, E.: The NCEP Climate Forecast System Version 2, J. Climate, 27, 2185–2208, https://doi.org/10.1175/jcli-d-12-00823.1, 2014.
Sun, Y., Zhang, Y., Chen, C., Sun, Q., Wang, Y., Du, H., Wang, J., Zhong, Y., Shi, W., Li, T., and Shi, X.: Impact of Heavy PM2.5 Pollution Events on Mortality in 250 Chinese Counties, Environ. Sci. Technol., 56, 8299–8307, https://doi.org/10.1021/acs.est.1c07340, 2022.
U.S. EPA: Guidance on the Use of Models and Other Analyses for Demonstrating Attainment of Air Quality Goals for Ozone, PM2.5 and Regional Haze, EPA-454/B-07-002, and the publishing institution is U.S. Environmental Protection Agency, Research Triangle Park, NC, 2007.
van der Werf, G. R., Randerson, J. T., Giglio, L., van Leeuwen, T. T., Chen, Y., Rogers, B. M., Mu, M., van Marle, M. J. E., Morton, D. C., Collatz, G. J., Yokelson, R. J., and Kasibhatla, P. S.: Global fire emissions estimates during 1997–2016, Earth Syst. Sci. Data, 9, 697–720, https://doi.org/10.5194/essd-9-697-2017, 2017.
Wang, J., Liu, Y., Ding, Y., Wu, P., Zhu, Z., Xu, Y., Li, Q., Zhang, Y., He, J., Wang, J. X. L., and Qi, L.: Impacts of climate anomalies on the interannual and interdecadal variability of autumn and winter haze in North China: A review, Int. J. Climatol., 40, 4309–4325, https://doi.org/10.1002/joc.6471, 2020.
Wang, L. H., Newchurch, M. J., Biazar, A., Liu, X., Kuang, S., Khan, M., and Chance, K.: Evaluating AURA/OMI ozone profiles using ozonesonde data and EPA surface measurements for August 2006, Atmos. Environ., 45, 5523–5530, https://doi.org/10.1016/j.atmosenv.2011.06.012, 2011.
Wang, L. L., Li, M. G., Wang, Q. L., Li, Y. Y., Xin, J. Y., Tang, X., Du, W. P., Song, T., Li, T. T., Sun, Y., Gao, W. K., Hu, B., and Wang, Y. S.: Air stagnation in China: Spatiotemporal variability and differing impact on PM2.5 and O3 during 2013–2018, Sci. Total Environ., 819, 152778, https://doi.org/10.1016/j.scitotenv.2021.152778, 2022.
Wang, X. Y., Dickinson, R. E., Su, L. Y., Zhou, C. L. E., and Wang, K. C.: PM2.5 pollution in China and how it has been exacerbated by terrain and meteorological conditons, B. Am. Meteorol. Soc., 99, 105–120, https://doi.org/10.1175/bams-d-16-0301.1, 2018.
Wang, Y. S., Yao, L., Wang, L. L., Liu, Z. R., Ji, D. S., Tang, G. Q., Zhang, J. K., Sun, Y., Hu, B., and Xin, J. Y.: Mechanism for the formation of the January 2013 heavy haze pollution episode over central and eastern China, Sci. China-Earth Sci, 57, 14–25, https://doi.org/10.1007/s11430-013-4773-4, 2014.
Wu, X. G., Ding, Y. Y., Zhou, S. B., and Tan, Y.: Temporal characteristic and source analysis of PM2.5 in the most polluted city agglomeration of China, Atmos. Pollut. Res., 9, 1221–1230, https://doi.org/10.1016/j.apr.2018.05.008, 2018.
Xie, Y., Dai, H. C., Dong, H. J., Hanaoka, T., and Masui, T.: Economic Impacts from PM2.5 Pollution-Related Health Effects in China: A Provincial-Level Analysis, Environ. Sci. Technol., 50, 4836–4843, https://doi.org/10.1021/acs.est.5b05576, 2016.
Xing, Y. F., Xu, Y. H., Shi, M. H., and Lian, Y. X.: The impact of PM2.5 on the human respiratory system, J. Thorac. Dis., 8, E69–E74, https://doi.org/10.3978/j.issn.2072-1439.2016.01.19, 2016.
Yang, Y., Luo, L. W., Song, C., Yin, H., and Yang, J. T.: Spatiotemporal Assessment of PM2.5-Related Economic Losses from Health Impacts during 2014-2016 in China, Int. J. Env. Res. Pub. He., 15, 1278, https://doi.org/10.3390/ijerph15061278, 2018.
Zeng, X. R., Gao, Y., Wang, Y. H., Ma, M. C., Zhang, J. X., and Sheng, L. F.: Characterizing the distinct modulation of future emissions on summer ozone concentrations between urban and rural areas over China, Sci. Total Environ., 820, 153324, https://doi.org/10.1016/j.scitotenv.2022.153324, 2022.
Zhang, G., Gao, Y., Cai, W., Leung, L. R., Wang, S., Zhao, B., Wang, M., Shan, H., Yao, X., and Gao, H.: Seesaw haze pollution in North China modulated by the sub-seasonal variability of atmospheric circulation, Atmos. Chem. Phys., 19, 565–576, https://doi.org/10.5194/acp-19-565-2019, 2019.
Zhang, J., Yuan, Q., Liu, L., Wang, Y. Y., Zhang, Y. X., Xu, L., Pang, Y., Zhu, Y. H., Niu, H. Y., Shao, L. Y., Yang, S. S., Liu, H., Pan, X. L., Shi, Z. B., Hu, M., Fu, P. Q., and Li, W. J.: Trans-Regional Transport of Haze Particles From the North China Plain to Yangtze River Delta During Winter, J. Geophys. Res.-Atmos., 126, e2020JD033778, https://doi.org/10.1029/2020jd033778, 2021.
Zhang, Q., Quan, J. N., Tie, X. X., Li, X., Liu, Q., Gao, Y., and Zhao, D. L.: Effects of meteorology and secondary particle formation on visibility during heavy haze events in Beijing, China, Sci. Total Environ., 502, 578–584, https://doi.org/10.1016/j.scitotenv.2014.09.079, 2015.
Zhang, Q., Zheng, Y., Tong, D., Shao, M., Wang, S., Zhang, Y., Xu, X., Wang, J., He, H., Liu, W., Ding, Y., Lei, Y., Li, J., Wang, Z., Zhang, X., Wang, Y., Cheng, J., Liu, Y., Shi, Q., Yan, L., Geng, G., Hong, C., Li, M., Liu, F., Zheng, B., Cao, J., Ding, A., Gao, J., Fu, Q., Huo, J., Liu, B., Liu, Z., Yang, F., He, K., and Hao, J.: Drivers of improved PM2.5 air quality in China from 2013 to 2017, P. Natl. Acad. Sci. USA, 116, 24463–24469, https://doi.org/10.1073/pnas.1907956116, 2019.
Zhang, S., Zeng, G., Wang, T., Yang, X., and Iyakaremye, V.: Three dominant synoptic atmospheric circulation patterns influencing severe winter haze in eastern China, Atmos. Chem. Phys., 22, 16017–16030, https://doi.org/10.5194/acp-22-16017-2022, 2022.
Zhang, W., Hai, S., Zhao, Y., Sheng, L., Zhou, Y., Wang, W., and Li, W.: Numerical modeling of regional transport of PM2.5 during a severe pollution event in the Beijing–Tianjin–Hebei region in November 2015, Atmos. Environ., 254, 118393, https://doi.org/10.1016/j.atmosenv.2021.118393, 2021.
Zhang, X., Xu, X., Ding, Y., Liu, Y., Zhang, H., Wang, Y., and Zhong, J.: The impact of meteorological changes from 2013 to 2017 on PM2.5 mass reduction in key regions in China, Sci. China Earth Sci., 62, 1885–1902, https://doi.org/10.1007/s11430-019-9343-3, 2019.
Zheng, B., Tong, D., Li, M., Liu, F., Hong, C., Geng, G., Li, H., Li, X., Peng, L., Qi, J., Yan, L., Zhang, Y., Zhao, H., Zheng, Y., He, K., and Zhang, Q.: Trends in China's anthropogenic emissions since 2010 as the consequence of clean air actions, Atmos. Chem. Phys., 18, 14095–14111, https://doi.org/10.5194/acp-18-14095-2018, 2018.
Zhong, W., Yin, Z., and Wang, H.: The relationship between anticyclonic anomalies in northeastern Asia and severe haze in the Beijing–Tianjin–Hebei region, Atmos. Chem. Phys., 19, 5941–5957, https://doi.org/10.5194/acp-19-5941-2019, 2019.