the Creative Commons Attribution 4.0 License.
the Creative Commons Attribution 4.0 License.
 | 22 Feb 2024
Measurement report: Nocturnal subsidence behind the cold front enhances surface particulate matter in plains regions: observations from the mobile multi-lidar system
Yiming Wang
Haolin Wang
Yujie Qin
Xinqi Xu
Guowen He
Nanxi Liu
Shengjie Miao
Shaojia Fan
A multi-lidar system, mounted in a vehicle to monitor the profiles of temperature, wind, and particle optical properties, was utilized to investigate the winter fine particulate matter (PM2.5) pollution from a vertical perspective in four cities in China in winter 2018. We observed the enhancement of surface nocturnal PM2.5 in two typical plains cities (Changzhou and Wangdu), which was attributed to the subsidence of PM2.5 transported from upstream polluted areas, with the wind turning north and downdrafts dominating. Combining the observed surface PM2.5, the reanalysis meteorological data, and the GEOS-Chem model simulation, we revealed the transport nocturnal PM2.5 enhancement by subsidence (T-NPES) events that occurred frequently in the two cities, with percentages of 12.2 % and 18.0 %, respectively, during December 2018–February 2019. Furthermore, the GEOS-Chem model simulation further confirmed the ubiquity of winter T-NPES events on a large scale, including North China Plain and the Yangtze River Delta. Process analysis revealed that the subsidence was closely correlated with the southeasterly movement of the high-pressure system and the passage of the cold front, resulting in the increase of temperature aloft, a stronger inversion layer, and further PM2.5 accumulation in the atmospheric boundary layer. Thus, a conceptual model of the T-NPES events was proposed to highlight this surface PM2.5 enhancement mechanism in these plains regions. However, it did not apply to the two cities in the basin region (Xi'an and Chengdu) due to the obstruction of the weather system movement by the mountains surrounding the basin.
- Article
(14103 KB) - Full-text XML
-
Supplement
(3137 KB) - BibTeX
- EndNote


The severe fine particulate matter (PM2.5, particles with an aerodynamic diameter smaller than 2.5 µm) pollution, caused by rapid industrialization and urbanization in China (Guo et al., 2014; Huang et al., 2014), has essential impacts on visibility, the ecosystem, regional and global climate, and human health (Yue et al., 2017; An et al., 2019; De Marco et al., 2019; Z. Q. Li et al., 2019; Hao et al., 2021). To mitigate the PM2.5 pollution, the government of China implemented the Air Pollution Prevention and Control Action Plan in 2013 by strict emission controls (Gao et al., 2020). Despite the fact that the annual average concentration of PM2.5 has significantly decreased (Ding et al., 2019; H. Y. Li et al., 2019; Q. Zhang et al., 2019; Silver et al., 2020; Geng et al., 2021b), the PM2.5 levels in the majority of Chinese cities are still above the World Health Organization target (WHO, 2021). The issue of PM2.5 pollution remains particularly critical in the North China Plain (NCP) and Yangtze River Delta (YRD) in wintertime (Peng et al., 2021; Qin et al., 2021).
The formation mechanisms of PM2.5 pollution were complex especially in China (Guo et al., 2014; Xiao et al., 2021b), such as the high emission intensity (Q. Zhang et al., 2019), the rapid chemical formation of secondary particles owing to the gas phase and heterogeneous reactions (Wang et al., 2017; Lu et al., 2019; Chen et al., 2020), and the interactions within the atmospheric boundary layer (ABL) (Ding et al., 2013; Gao et al., 2016; Dong et al., 2017; Li et al., 2017). Long-range transport also had significant impacts on PM2.5 pollution (Guo et al., 2014; Zhang et al., 2015; Huang et al., 2018). Cold fronts, as a common synoptic circulation in winter, were usually favorable for the quick removal of the locally accumulated pollutants in the NCP (Zhao et al., 2013; Gao et al., 2017) but conversely transport the pollutants to the YRD over a long distance (Kang et al., 2019; Huang et al., 2020; Kang et al., 2021). Zhou et al. (2023) indicated that the cold fronts could transport the precursors to the residual layer, where the secondary pollution was rapidly driven to be generated and then exacerbated near-surface air pollution as a result of the development of the daytime convective ABL. However, the above studies have focused on the impact of the horizontally transported pollutants on the downstream regions after the passage of the cold front. In comparison, few studies have been conducted on the variation in the vertical direction of particulate matter in the ABL during the passage of the cold front.
The vertical mixing exchange process between layers has a great impact on local air quality, and the subsidence motion is associated with the evolution of the inversion layer (Gramsch et al., 2014; Xu et al., 2018; He et al., 2022). Zhang et al. (2022) reported that the PM2.5 concentration behind the cold front increased due to the subsidence motion and inversion layer. Zhao et al. (2023) suggested that the frontal downdrafts were an additional transport pathway in the nighttime to make a higher contribution to the ground nitrate. Both of their studies were based on the model simulations, and the observational evidence of the subsidence behind the cold front and its impact on the nocturnal PM2.5 enhancement events is still lacking. Shi et al. (2022) reported one subsidence case of particulate matter during the passage of the cold front over Wangdu, China, in winter, which revealed that the subsidence was closely connected to the enhancement of nocturnal PM2.5.
To investigate the mechanisms of nocturnal PM2.5 enhancement triggered by subsidence, the three-dimensional spatial and temporal distribution is crucial. Many field observations of the vertical distribution of particulate matter have been performed employing various methods such as tethered balloons (Wang et al., 2021; Ran et al., 2022), airplanes (Wang et al., 2018; Fast et al., 2022), uncrewed aerial vehicles (Song et al., 2021; Dubey et al., 2022), and meteorological towers (Li et al., 2022; Yin et al., 2023). Lidar, as an active remote sensing device with high temporal and spatial resolution, has been extensively employed in atmospheric detection to obtain profiles of particulate matter, wind, and temperature. Ground-based and satellite-based lidar have been widely used to detect the vertical distribution of aerosol. In recent years, the mobile multi-lidar system has been gradually developed and has become a powerful tool for observing target species in a vertical perspective. Compared with the traditional ground lidar system, the mobile multi-lidar system enables continuous mobile observations and provides information on the distribution of specific factors along its path and can be used as an effective supplement to other fixed lidars. Additionally, the mobile multi-lidar system can reach different cities due to its portable setting in a short time to carry out fixed-point observations. The mobile lidar system has been used to carry out several observations in the past few years (Lv et al., 2020; He et al., 2021; Xu et al., 2022). He et al. (2021) investigated the vertical distribution characteristics of particulate matter in the Guanzhong Plain using the mobile multi-lidar system. Xu et al. (2022) conducted an observational study on the three-dimensional structure of particulate matter distribution in the Guangdong–Hong Kong–Macao Greater Bay Area using the mobile multi-lidar system and proposed a conceptual model to elucidate the vertical distribution of particulate matter under different wind and temperature conditions.
Here, we conducted the first nationwide field measurements using the mobile multi-lidar system during winter 2018 in China to investigate the vertical distribution characteristics of particulate matter in different cities. We focus on the observed nocturnal PM2.5 enhancement events and seek insights into their characteristics and causes by combining the GEOS-Chem model simulation, the surface PM2.5 observation, and the meteorological reanalysis dataset. Finally, we examine the ubiquity of this phenomenon in plains regions in China and propose a conceptual model, providing detailed vertical insights into the enhancement of nocturnal surface PM2.5.
2.1 Multi-lidar system
A multi-lidar system was installed on the mobile observation vehicle. The vehicle, a modified seven-seater Mercedes-Benz sport utility vehicle, was equipped with three lidar instruments mounted on steel bars at the rear for stability. The mobile observation routes were primarily on flat highways, and the speed was controlled to remain around 80 km h−1 to minimize the impact of frequent changes in speed and vehicle bumps on the measurement results.
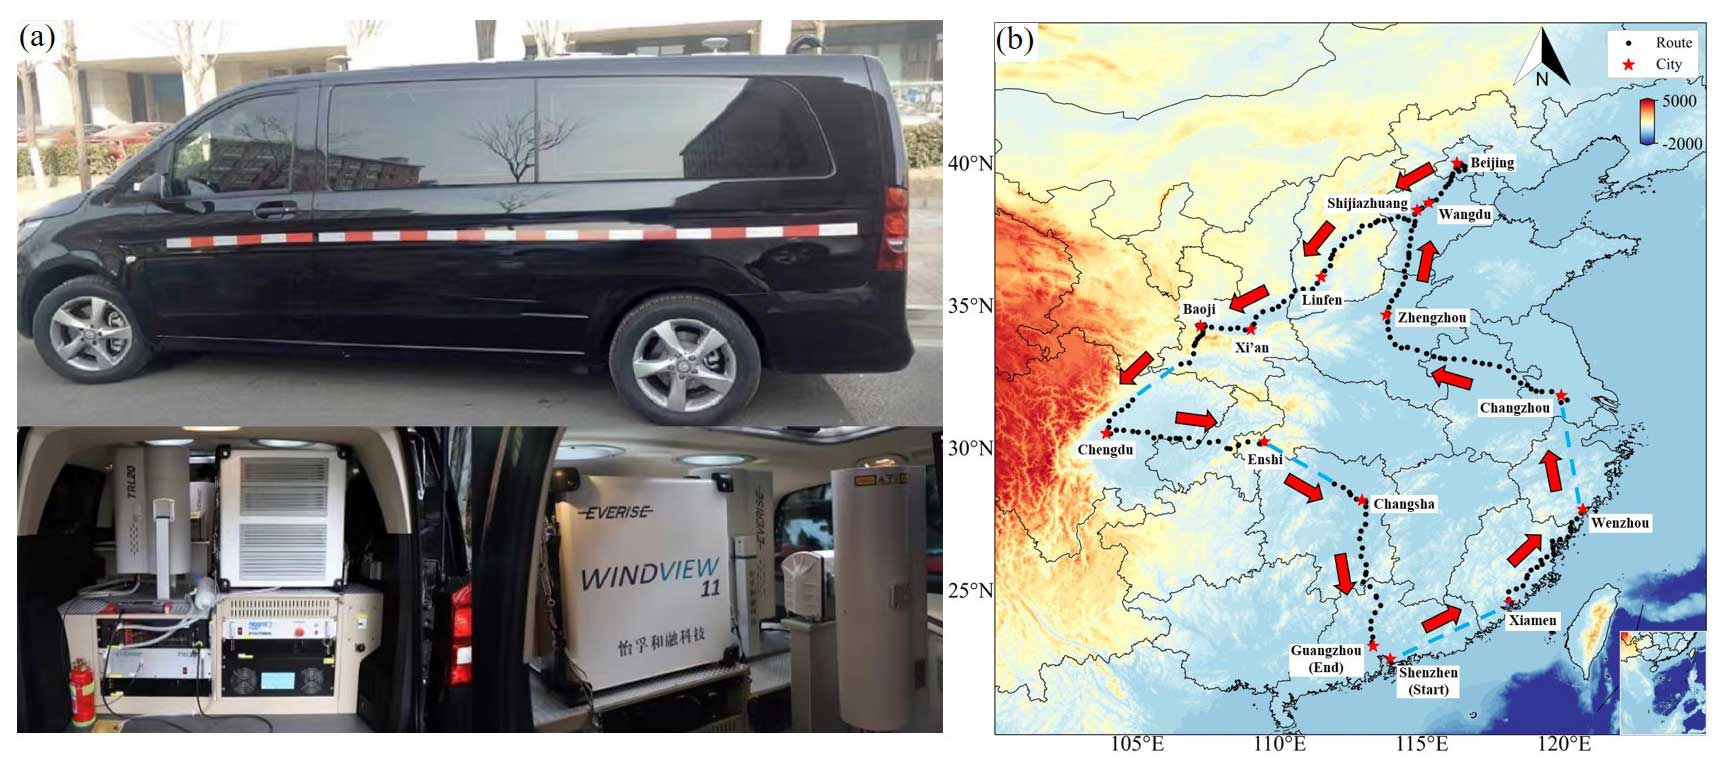
Figure 1(a) The mobile observation vehicle and multi-lidar system. (b) The mobile observation route and stopover cities, where the dashed blue line shows the sections of missing data. Publisher's remark: please note that the above figure contains disputed territories.
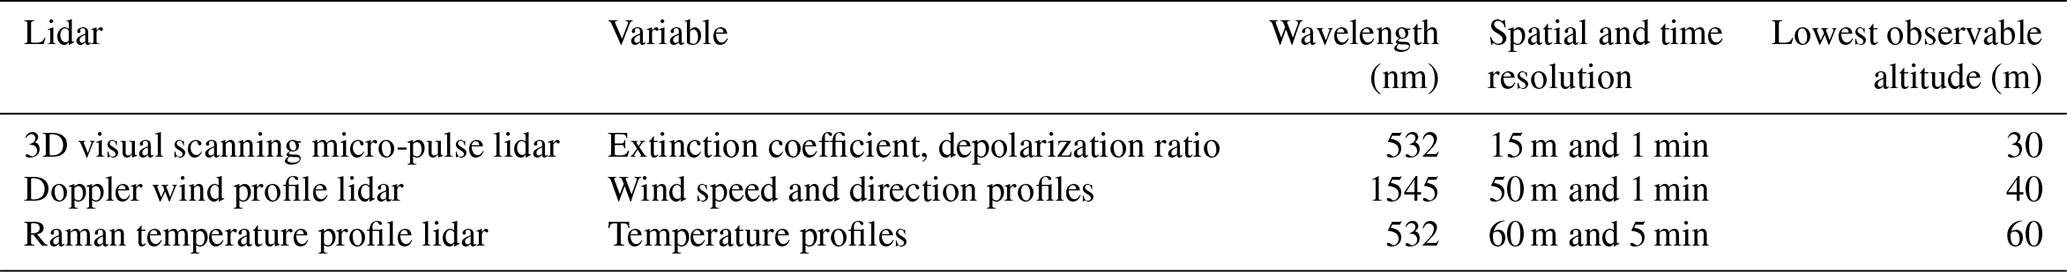
The multi-lidar system (Everise Technology Ltd., Beijing) consisted of a 3D visual scanning micro-pulse lidar (EV-Lidar-CAM), a twirling Raman temperature profile lidar (TRL20), a Doppler wind profile lidar (WINDVIEW10), and a global positioning system (GPS). The 3D visual scanning micropulse lidar had a detection range of up to 30 km, a temporal resolution of 1 min, and a vertical resolution of 15 m. The 3D lidar used an Nd:YAG laser to emit a 532 nm laser beam at a repetition frequency of 2500 Hz, which is scattered by aerosol particles in the atmosphere. The backscattered signal is utilized to calculate the aerosol extinction coefficient and depolarization ratio profile. The extinction coefficient increases with higher particle pollution concentrations, while the depolarization ratio can distinguish between spherical and non-spherical particles based on their size and shape. The Doppler wind profile lidar provides a temporal resolution of 1 min and a vertical resolution of 50 m. It emits a rotating 1545 nm laser beam using a 10 kHz repetition rate fiber-pulse laser and measures the Doppler shift produced by the laser's backscattered signal as it passes through airborne particles such as dust, water droplets in clouds and fog, polluted aerosols, salt crystals, and biomass-burning aerosols to derive the horizontal and vertical wind speeds at any height. The Raman temperature profile lidar, based on Raman scattering theory, calculates atmospheric temperature by detecting the rotational Raman scattering signal of nitrogen or oxygen molecules in the atmosphere. Operating at a 532 nm wavelength with an Nd:YAG laser at a repetition frequency of 20 Hz, it has a temporal resolution of 5 min and a vertical resolution of 60 m. The quality of the data obtained by the lidar system was checked by the Integrated Environmental Meteorological Observation Vehicle before deployment. The results showed a percentage difference of less than 15 % between the lidar system data and the data provided by the Shenzhen Meteorological Tower, demonstrating the high accuracy of the lidar instrument (Xu et al., 2022). Data during the instrument malfunction, below the blind zone, and in rainy weather have been excluded. Previous studies have utilized this lidar system and demonstrated its reliability (Xu et al., 2018; He et al., 2021). The mobile observation vehicle and multi-lidar system are shown in Fig. 1a. More details of the multi-lidar system are shown in the Table 1.
2.2 The route of nationwide mobile observation
To investigate the distribution characteristics of particulate matter during winter in different regions in China, the Integrated Environmental Meteorological Observation Vehicle of Sun Yat-sen University was utilized to conduct the first nationwide mobile observation campaign. The campaign, which lasted 43 d and covered approximately 11 000 km, started in Shenzhen on 30 November 2018 and ended in Guangzhou on 11 January 2019. This campaign surveyed the PM2.5 vertical profiles across 15 cities, including Shenzhen, Xiamen, Wenzhou, Changzhou, Zhengzhou, Wangdu, Beijing, Shijiazhuang, Linfen, Xi'an, Baoji, Chengdu, Enshi, Changsha, and Guangzhou. The observation route and stopover cities are shown in Fig. 1b. Due to the precipitation, there were no observations between Shenzhen–Xiamen and Wenzhou–Changzhou, while some GPS data were missing between Beijing–Chengdu and Enshi–Changsha.
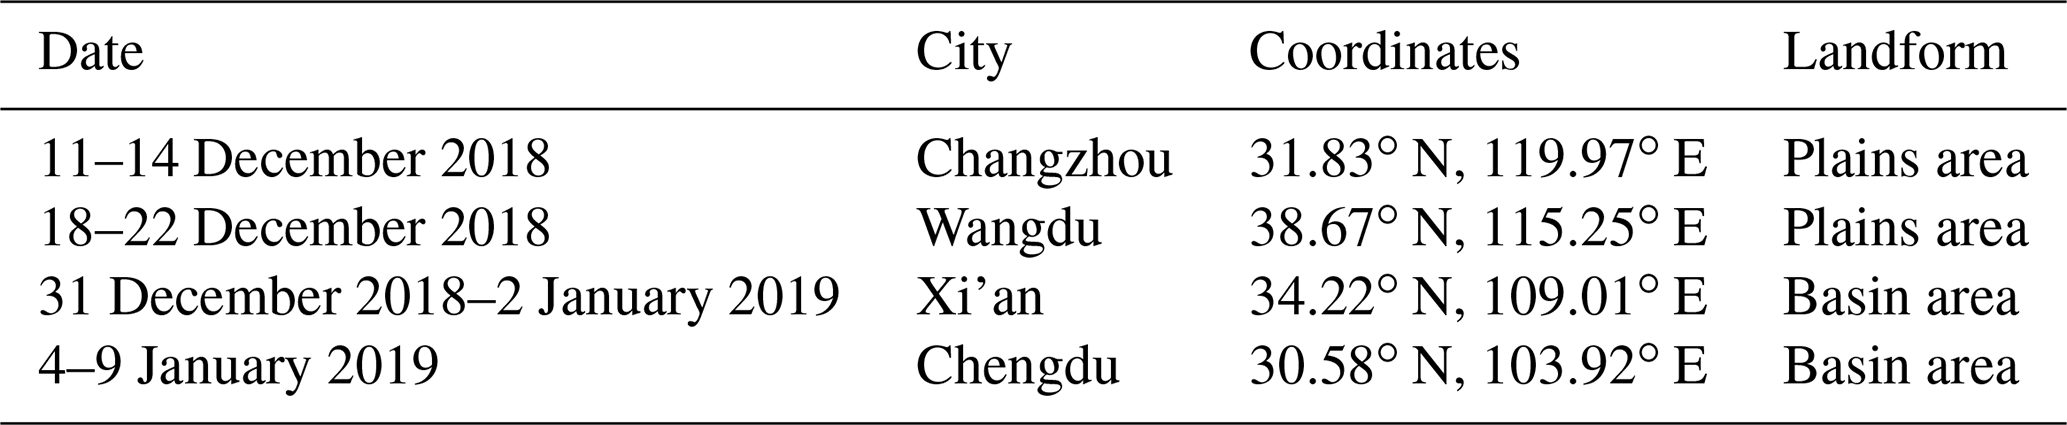
To compare the vertical distribution characteristics of particulate matter in different regions, we conducted fixed-point observations for several pollution days in four representative cities in the eastern China region (Changzhou), North China Plain (Wangdu), Guanzhong Basin (Xi'an), and Sichuan Basin (Chengdu). The dates and duration of the fixed-point observations are presented in Table 2. In the following analysis, only the data obtained in the four fixed-point measurements are used since they have a long enough duration to show the vertical variation of PM2.5.
2.3 Surface PM2.5 data and ERA5 reanalysis data
The nationwide hourly observations of surface PM2.5 in China are obtained from the China National Environmental Monitoring Center (CNEMC) network (https://quotsoft.net/air, last access: 2 March 2023). Here, we used the hourly PM2.5 concentration data from the whole winter of 2018 (December 2018 to February 2019) and selected data from the closest monitoring station to show the change in surface PM2.5 concentration at the four observation sites.
The spatial distribution of daily average surface PM2.5 concentration is obtained from the TAP team (http://tapdata.org.cn, last access: 3 March 2023), with a spatial resolution of 10 km. Based on machine learning algorithms and multi-source data information, the TAP team has built a multi-source data fusion system that integrates ground observation data, satellite remote sensing information, high-resolution emission inventories, air quality model simulations, and other multi-source information (Geng et al., 2021a; Xiao et al., 2021a). In addition to the observation data, we also apply the three-dimensional meteorological data from the ERA5 dataset for the winter of 2018 (https://quotsoft.net/air, last access: 2 March 2023) (Munoz-Sabater et al., 2021). This dataset contained temperature, horizontal and vertical wind speed, and direction at pressure levels, as well as two-dimensional data including sea-level pressure and 2 m temperature. The ERA5 dataset is the fifth generation of the European Centre for Medium-Range Weather Forecasts (ECMWF) atmospheric reanalysis of the global climate. The ERA5 dataset has a horizontal resolution of 0.25∘ × 0.25∘, a vertical resolution of 25 hPa, and a temporal resolution of 1 h.
2.4 HYSPLIT backward trajectory model
The Hybrid Single Particle Lagrangian Integrated Trajectory Model (HYSPLIT) (Stein et al., 2015), developed by NOAA Air Resources Laboratory, is a valuable tool for simulating the movement of air mass and the transport of pollutants in the atmosphere and is used in our study to obtain the sources of particulate matter at different heights. Altitudes of 100, 500, and 1000 m were set as the endpoints of the trajectories, the meteorological input for the trajectory model was the FNL dataset, and each trajectory was calculated for 24 h duration.
2.5 GEOS-Chem model description
Given the short-term (less than 1 week) fixed-point observation duration of the mobile observation vehicle in each city, we employ the global three-dimensional chemical transport model GEOS-Chem version 13.3.1 to interpret the vertical observations (available at https://github.com/geoschem/GCClassic/tree/13.3.1, last access: 2 March 2023; Bey et al., 2001) and to simulate the distribution of particulate matter concentrations during winter 2018 in China. We perform the nested-grid version of the GEOS-Chem simulation at a spatial of 0.5∘ (latitude) × 0.625∘ (longitude) resolution over East Asia (11∘ S–55∘ N, 60–150∘ E), The model has 47 vertical layers with 18 layers below 3 km in altitude. Boundary chemical conditions for the nested models are archived from a consistent global simulation run at 4∘ latitude × 5∘ longitude resolution. Meteorological input is from the Modern-Era Retrospective analysis for Research and Application version 2 (MERRA-2) (Gelaro et al., 2017). We conduct the model simulation from November 2018 to February 2019 with the first month as a spin-up.
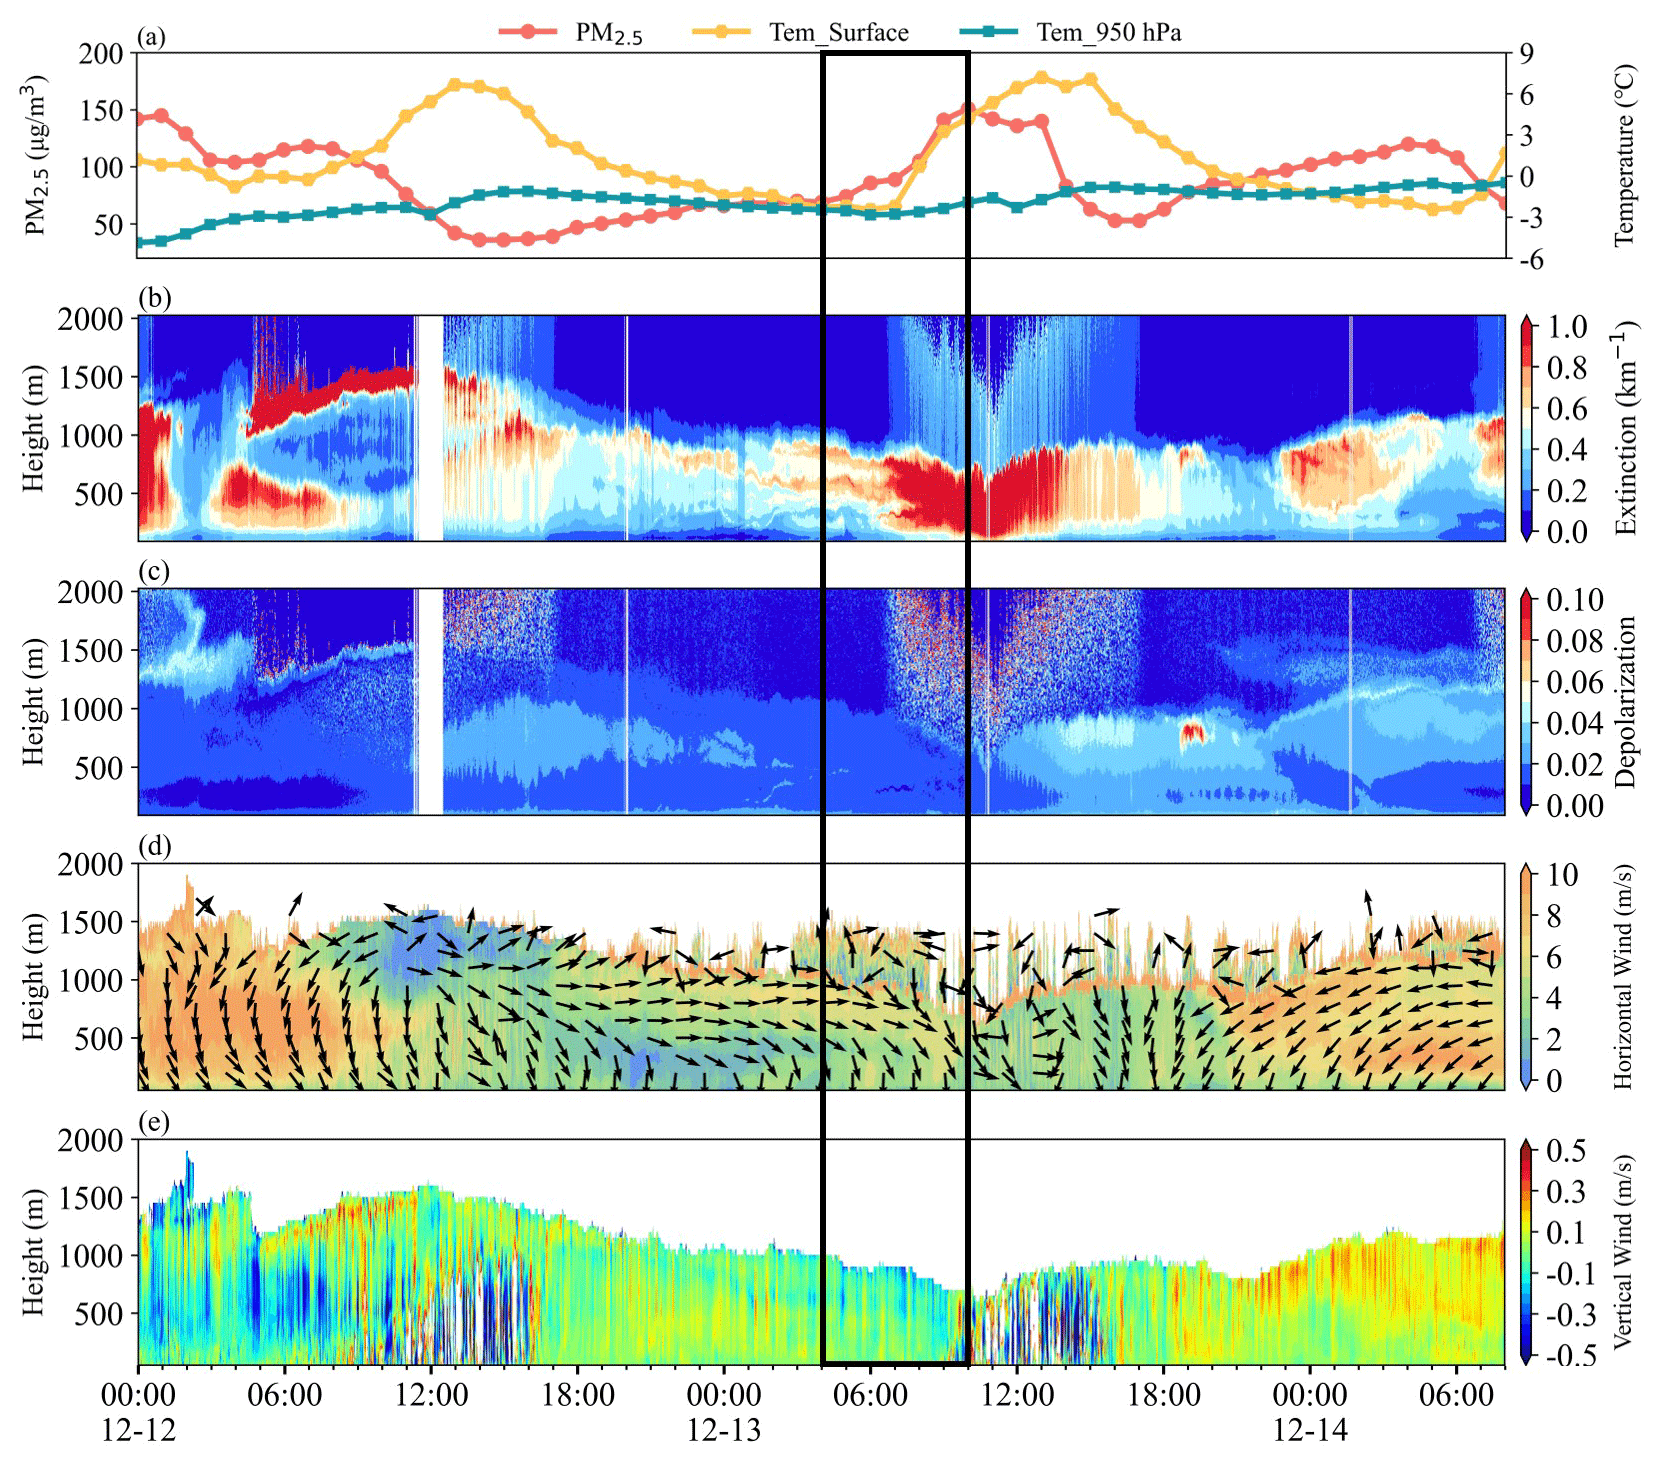
Figure 2(a) Surface PM2.5 concentration, surface temperature, and 950 hPa temperature; (b) extinction coefficient; (c) depolarization ratio; (d) horizontal wind; and (e) vertical wind, during the observation in Changzhou from 12 to 14 December. The black box indicates the nocturnal surface PM2.5 enhanced event.
The model mechanisms and emissions mostly follow our previous study (Wang et al., 2022). In short, the GEOS-Chem model describes a comprehensive stratospheric and tropospheric ozone–NOx–VOCs–aerosol–halogen chemical mechanism (Wang et al., 1998; Park et al., 2004; Parrella et al., 2012; Mao et al., 2013). Photolysis rates are computed using the Fast-JX scheme (Bian and Prather, 2002). Advection of tracers in GEOS-Chem is accomplished through the TPCORE advection algorithm. The boundary layer mixing process is described in Lin and McElroy (2010). Dry and wet deposition of both gas and aerosols is considered (Wesely, 1989; Zhang et al., 2001). We apply the latest version of the Community Emissions Data System (CEDSv2) anthropogenic emissions inventory (O'Rourke et al., 2021), in which the emissions over China have been adjusted to align with the Multi-resolution Emission Inventory for China (MEIC) inventory (Zheng et al., 2018). Figure S1 in the Supplement showed the comparison of model results with observations for monthly mean PM2.5, and the correlation coefficients between model and observation were about 0.6, which meant that the model results provided a relatively good reproduction of the observations.
3.1 The observation of nocturnal PM2.5 enhancement in plains areas
During the fixed-point observation in Changzhou, we observed a typical surface PM2.5 concentration enhancement event starting at 04:00 LT (local time, UTC+8) and lasting until 10:00 LT on 13 December. As shown in Fig. 2a, the concentration of PM2.5 increased from 69 to 151 µg m−3. Figure 2b and c shows the spatiotemporal distribution of the extinction coefficient and depolarization ratio. There was a clear layer with a low extinction coefficient below 500 m from 16:00 LT on 12 December to 04:00 LT on 13 December, indicating low PM2.5 concentration near the surface. Meanwhile, an aerosol layer with a high extinction coefficient of about 0.7 km−1 appeared at 500–1000 m. Figure 2d and e depicted the west winds prevailing in the layer of 500–1000 m with a wind speed (WS) of about 7 m s−1. Based on the daily average concentration of PM2.5 on 12 December shown in Fig. S2 in the Supplement, the western area of the observation site in Changzhou suffered from severe air pollution with the concentration of PM2.5 exceeding 150 µg m−3. Under the strong forcing of the west winds, the regional transport of aerosol from the west of Changzhou was detected, leading to a high extinction coefficient layer at 500–1000 m. The spatiotemporal distribution of the vertical velocity in Fig. 2e indicated the dominant updraft winds in the ABL, which was conducive to the suspension of pollutants at 500–1000 m.
However, the prevailing winds at 500–1000 m shifted to the north and northwest after 04:00 LT on 13 December. By 08:00 LT, the northerly wind dominated in the ABL. The change in wind direction affected the transport process of pollutants at 500–1000 m, after which the transport basically disappeared. Meanwhile, the downdraft winds dominated above 500 m (Fig. 2e) and the aerosol layer suspended at 500–1000 m began to gradually transport and diffuse downward into the lower layer of ABL, which enhanced the nocturnal surface PM2.5 concentration. It is worth noting that after 04:00 LT on 13 December the surface temperature was close to the temperature at 950 hPa, suggesting that the structure of the ABL was stable and was conducive to the accumulation of the PM2.5.
The sea surface field showed the cold high-pressure system moved southeast with increasing strength from 20:00 LT on 12 December to 08:00 LT on 13 December (Fig. S3 in the Supplement). The change in the synoptic weather system was accompanied by a cold frontal passage. The cold frontal passage was inferred to start at about 04:00 LT on 13 December and last about 4 h, which was further illustrated by the clockwise rotation of the horizontal wind from the ground to the upper layer (Shi et al., 2022) and the transition from updrafts to downdrafts, the observation site was located behind the cold front after 04:00 LT where the descending movements dominated. Under the influence of the subsidence, the pollutants transported by the westward advection diffused downward to the low layer and further aggravated the local air quality.
After 08:00 LT, the concentration of surface PM2.5 increased rapidly and peaked at around 10:00 LT, the extinction coefficient below 1000 m also reached a high level with 1.0 km−1 at the same time and the depolarization remained at about 0.01. The surface temperature began to rise and the convective ABL developed rapidly, which enhanced the vertical mixing and resulted in the rapid increase in surface PM2.5 (Zhou et al., 2023). The north winds following the passage of the cold front dominated in the ABL after 08:00 LT, which could bring pollution from the NCP to the YRD (Kang et al., 2019; Huang et al., 2020). Therefore, we attribute the increase in the concentration of surface PM2.5 from 04:00 to 10:00 LT to the combination of the subsidence behind the cold front before 08:00 LT, vertical mixing caused by the development of the convective ABL, and the transport by the north winds.
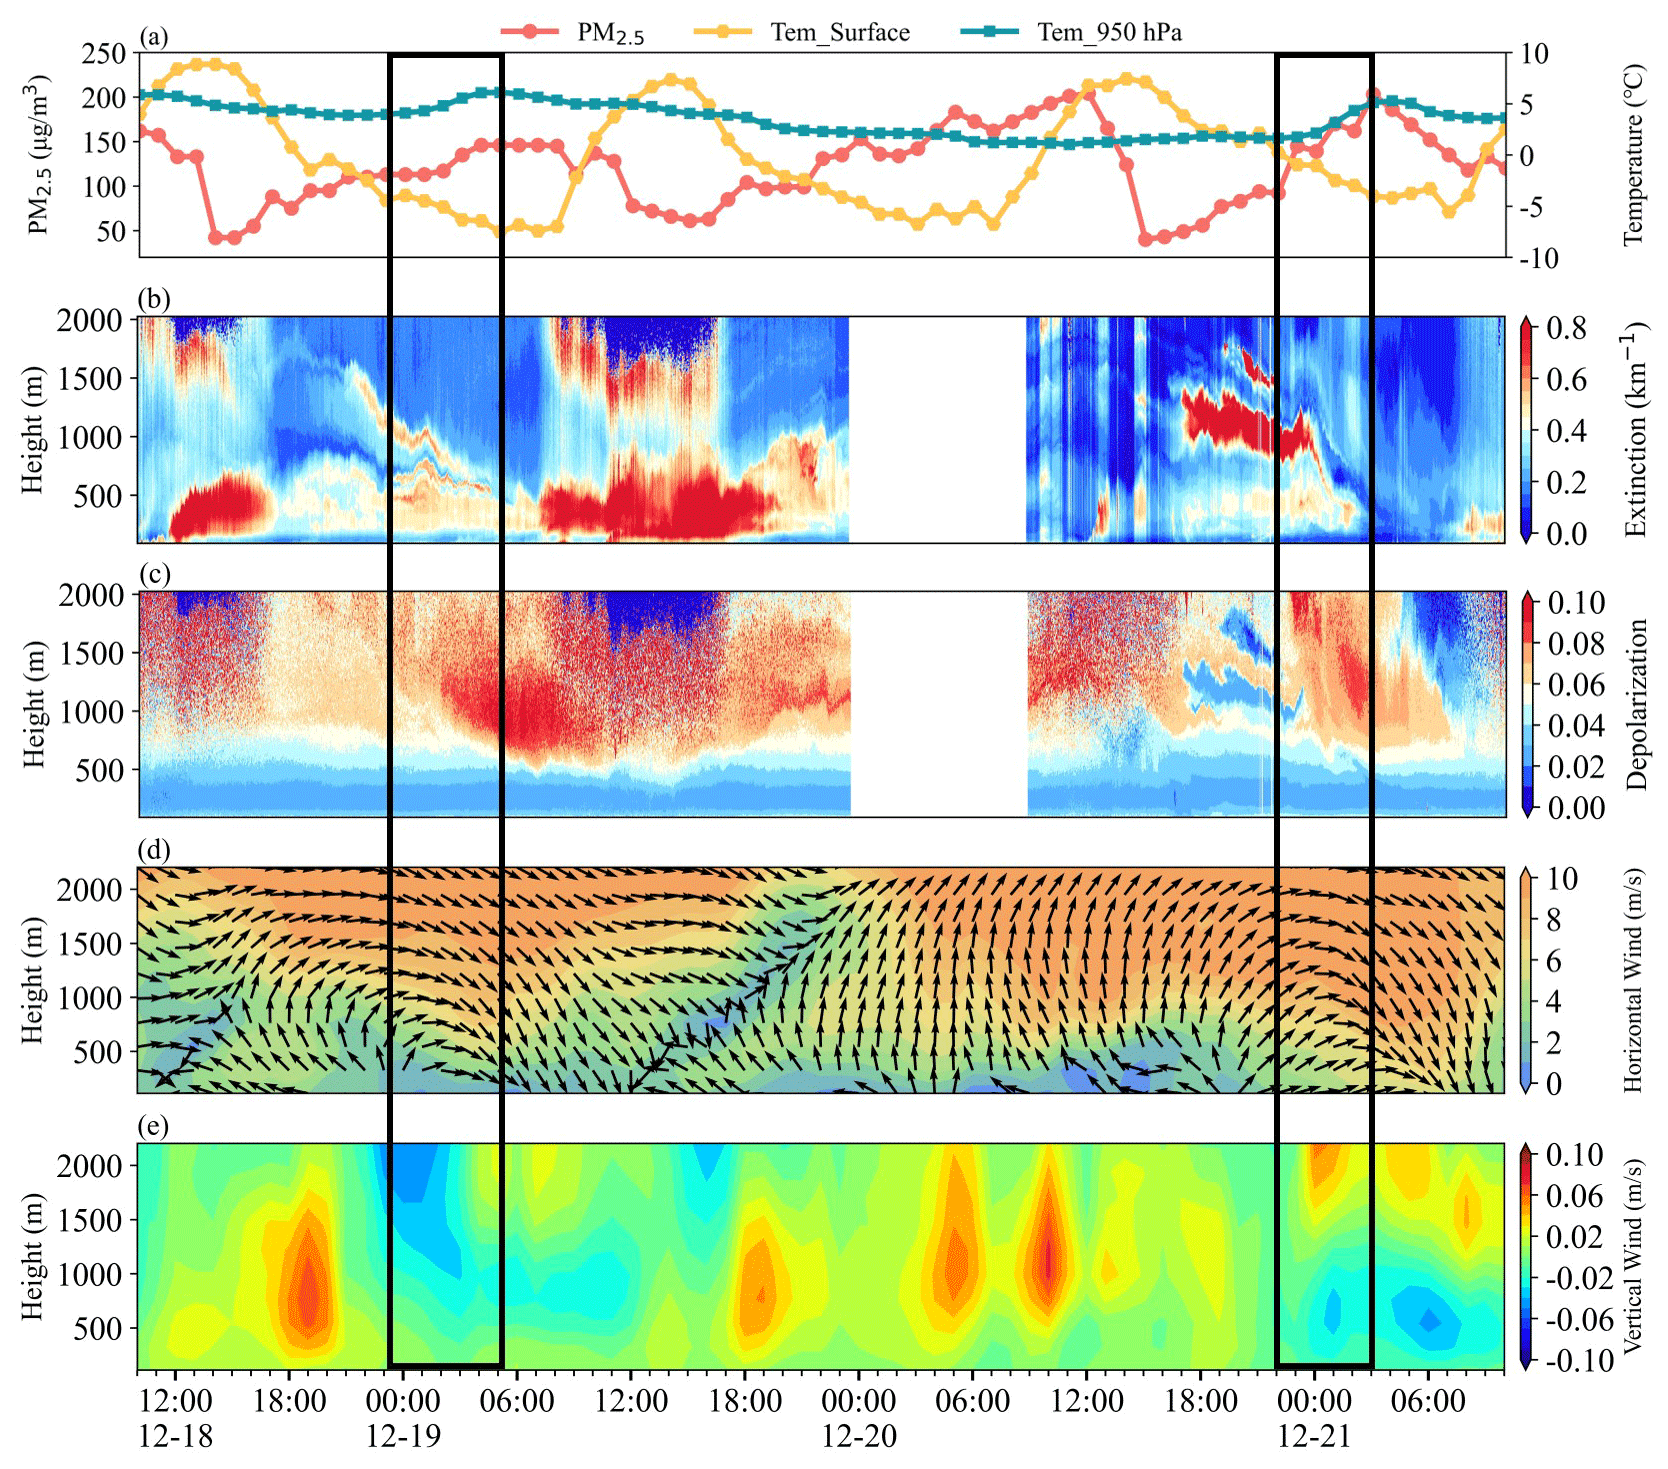
Figure 3(a) Surface PM2.5 concentration, surface temperature, and 950 hPa temperature; (b) extinction coefficient; (c) depolarization ratio; (d) horizontal wind; and (e) vertical wind, during the observation in Wangdu from 18 to 21 December. The black boxes indicate the nocturnal PM2.5 enhancement events.
We also found similar nocturnal surface PM2.5 enhancement events during the fixed-point observation in Wangdu on 19 December and 21 December (Fig. 3a). The concentration of PM2.5 started to enhance at 01:00 LT on 19 December, and meanwhile the layer of pollutants above 1000 m started to transport and diffuse to the lower layer of ABL, which was reflected by the change in the extinction coefficient shown in Fig. 3b. Unfortunately, due to the instrument malfunction, the wind profile data were unavailable, and we used the ERA5 data instead, which previously showed good consistency with the observation of with Doppler wind lidar (Shi et al., 2022). As shown in Fig. 3d, from 10:00 LT on 18 December to 00:00 LT on 19 December, southwesterly winds prevailed above 1000 m and the WS exceeded 8 m s−1; a persistent southerly wind could result in severe air pollution in the NCP (Cai et al., 2017; Callahan et al., 2019; G. Zhang et al., 2019). The wind forced the regional advection of pollutants from the southern region suffering from serious air pollution (Fig. S4 in the Supplement) to the observation site. Meanwhile, the updrafts dominated in the ABL, which facilitated the suspension of pollutants in the upper layer. After 00:00 LT on 19 December, as the cold high-pressure system moved southwest accompanied by a cold front (Fig. S5 in the Supplement), the prevailing winds above 1000 m shifted to the northwest gradually and downdrafts dominated behind the cold frontal passage. The changes in the horizontal and vertical wind fields caused the advection of pollutants to disappear basically and the pollutants layer suspended above 1000 m began to transport and diffuse downward to the low layer of ABL. The passage of the cold front at 00:00 LT on 19 December lasted for 4 h, and the subsidence behind the cold front caused the pollutants to diffuse downward, enhancing the concentration of nocturnal PM2.5.
The pattern of the nocturnal surface PM2.5 enhancement event on 21 December was highly similar to that on 19 December. However, the pollutant advection process lasted a longer duration which started at 16:00 LT on 20 December and ended at 00:00 LT on 21 December (Fig. 3b), and the WS of the southwest wind above 1000 m exceeded 12 m s−1 meeting the standard of the low-level jet (LLJ) (Kraus et al., 1985; Hu et al., 2013). The area south of the observation site in Wangdu suffered from more severe air pollution with the concentration of PM2.5 exceeding 300 µg m−3 (Fig. S6 in the Supplement). Under the strong forcing of the southwestern LLJ and the updrafts (depicted in Fig. 3d and e), an aerosol layer with high extinction coefficient exceeding 2 km−1 formed and was suspended at 1000–1500 m from 16:00 LT on 20 December to 00:00 LT on 21 December. Meanwhile, Fig. 3c showed that the layer with low depolarization was consistent with the layer with a high extinction coefficient, further confirming the role of transportation.
After 00:00 LT, the wind direction of the LLJ began to change due to the southeasterly movement of the high-pressure system accompanied by a cold front (Fig. S7 in the Supplement). The passage of the cold front started at 00:00 LT on 21 December and lasted for 4 h, after which the downdrafts dominated below 1500 m (Fig. 3e), and the northwestern LLJ no longer transported pollutants from the southern area but greatly enhanced the turbulent mixing (Shi et al., 2022). Under the influence of the turbulence generated by LLJ and subsidence behind the cold front, the aerosol-rich layer suspended at 1000–1500 m was gradually transported and diffused downward into the lower layer of ABL, ultimately enhancing the concentration of surface PM2.5, which was consistent with the result reported by Shi et al. (2022), with the secondary inorganic aerosol increasing simultaneously during the subsidence process as observed by the tethered balloon.
It is worth noting that when both nocturnal surface PM2.5 enhancement events in Wangdu occurred, the temperature at 950 hPa showed an increasing trend as a result of the heating of the air by compression as it descended, while the surface temperature continuously declined (Fig. 3a). The opposite variation of surface temperature and temperature at 950 hPa stabilized the lower atmosphere. The stronger inversion layer was probably induced by subsidence (Carlson and Stull. 1986). With the more stable atmospheric layer and inversion during subsidence, the concentration of surface PM2.5 enhanced (Gramsch et al., 2014; Largeron and Staquet. 2016).
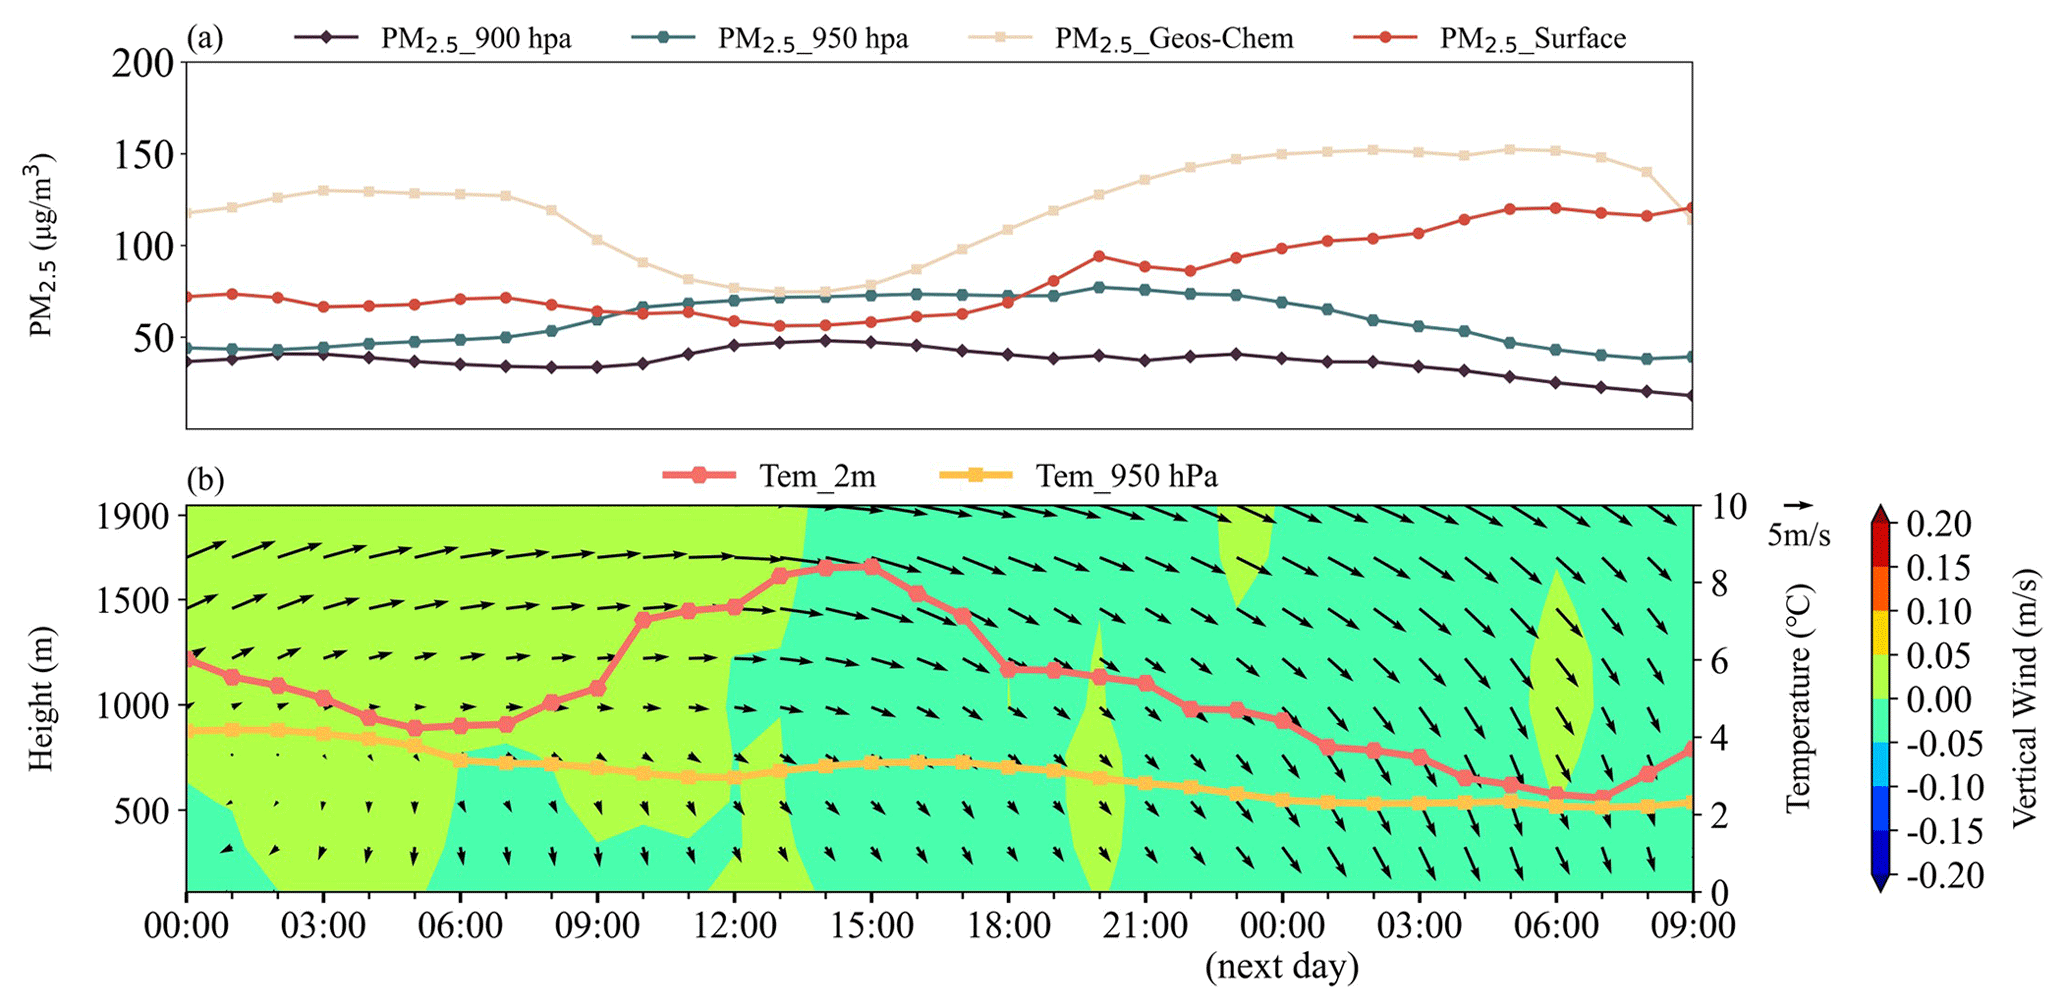
Figure 4The average for all T-NPES events in Changzhou. (a) The concentration of PM2.5 at different levels, surface PM2.5 of observation (red line), surface PM2.5 of simulation (blue line), and PM2.5 at 900 and 950 hPa. (b) The horizontal winds (arrows), the vertical winds (shaded), the temperature at 2 m, and temperature at 950 hPa.
3.2 Transport nocturnal PM2.5 enhancement by subsidence events
During the fixed-point observation, we found the causes of three nocturnal PM2.5 enhancement events in different cities were similar. The processes can be summarized as three steps. First, the horizontal winds with high wind speed forced the transport of pollutants from the upstream region, while the updrafts dominated, resulting in the formation and suspension of an aerosol layer with high extinction coefficient at the high layer of the ABL. Then, under the influence of the southeasterly movement of the high-pressure system and the passage of the cold front, the horizontal wind direction shifted to the north or northwest and the downdrafts became dominant. Finally, the transport of pollutants disappeared due to the change in wind direction, and under the subsidence behind the cold front the aerosol-rich layer suspended at the high layer was gradually transported and diffused downward into the lower layer of the ABL, ultimately enhancing the concentration of nocturnal PM2.5. Here, we defined this pollution pattern as T-NPES (transport nocturnal PM2.5 enhancement by subsidence) events.
To investigate the occurrence frequency of T-NPES events, we employed the GEOS-Chem model to simulate the distribution of particulate matter concentrations in China during the whole winter of 2018 (December 2018 to February 2019). We utilized the simulated PM2.5 at 950 and 900 hPa to represent the high-altitude PM2.5 concentration. We selected the closest grid data of the wind field data, 950 hPa, and 2 m temperature data from the ERA5 dataset to the observation site in Changzhou and Wangdu to show the meteorological condition. By analyzing the hourly concentration variation of PM2.5 and the distribution of the wind field during the 3 months of winter 2018 in Changzhou and Wangdu, we found 11 typical T-NPES events in Changzhou accounting for 12.2 % and 18 T-NPES events in Wangdu accounting for 18 %, which indicated that the T-NPES events were a relatively common phenomenon in the two cities.
Figure 4 shows the average pattern of all T-NPES events in Changzhou, the trend of the simulated PM2.5 was consistent with the observation, confirming the credibility of the simulations. As shown in Fig. 4a, the enhancement of nocturnal surface PM2.5 started at 21:00 LT, when there was no significant enhancement in anthropogenic PM2.5 emissions, while the high-altitude PM2.5 represented by PM2.5 at 900 and 950 hPa started to decrease, which was consistent with the observed event in Changzhou described in Sect. 3.1. According to the distribution of the wind field (Fig. 4b), westerly winds with high wind speed prevailed in the layer above 1000 m from 00:00 to about 18:00 LT, which was conducive to the transport of pollutants. The updrafts dominated from 00:00 to 12:00 LT, forcing the pollutants suspending in the upper layer, which was reflected by the enhancing PM2.5 concentration at high altitude (Fig. 4a). Despite the downdrafts dominating after 12:00 LT, there was no immediate reduction in PM2.5 concentration at high altitudes, which might be related to the fact that the horizontal wind direction had not changed, and the transport of pollutants continued. A brief updraft before 21:00 LT suspended the pollutants at high altitudes. After 21:00 LT, northwesterly winds and downdrafts dominated in the ABL, and the high-altitude PM2.5 began to gradually transport and diffuse downward, causing the enhancement of surface concentration of PM2.5, and this process continued until 04:00 LT in the next day. The surface temperature and the temperature at 950 hPa gradually approached, which is consistent with the observed case in Changzhou, indicating that the structure of the ABL was stable and was conducive to the accumulation of the PM2.5. As shown in Fig. S8 in the Supplement, the average sea level pressure indicated that the southeasterly movement of the high-pressure system and the passage of the cold front, which resulted in the shift in wind direction and subsidence behind the cold front, were the main causes of the T-NPES events.
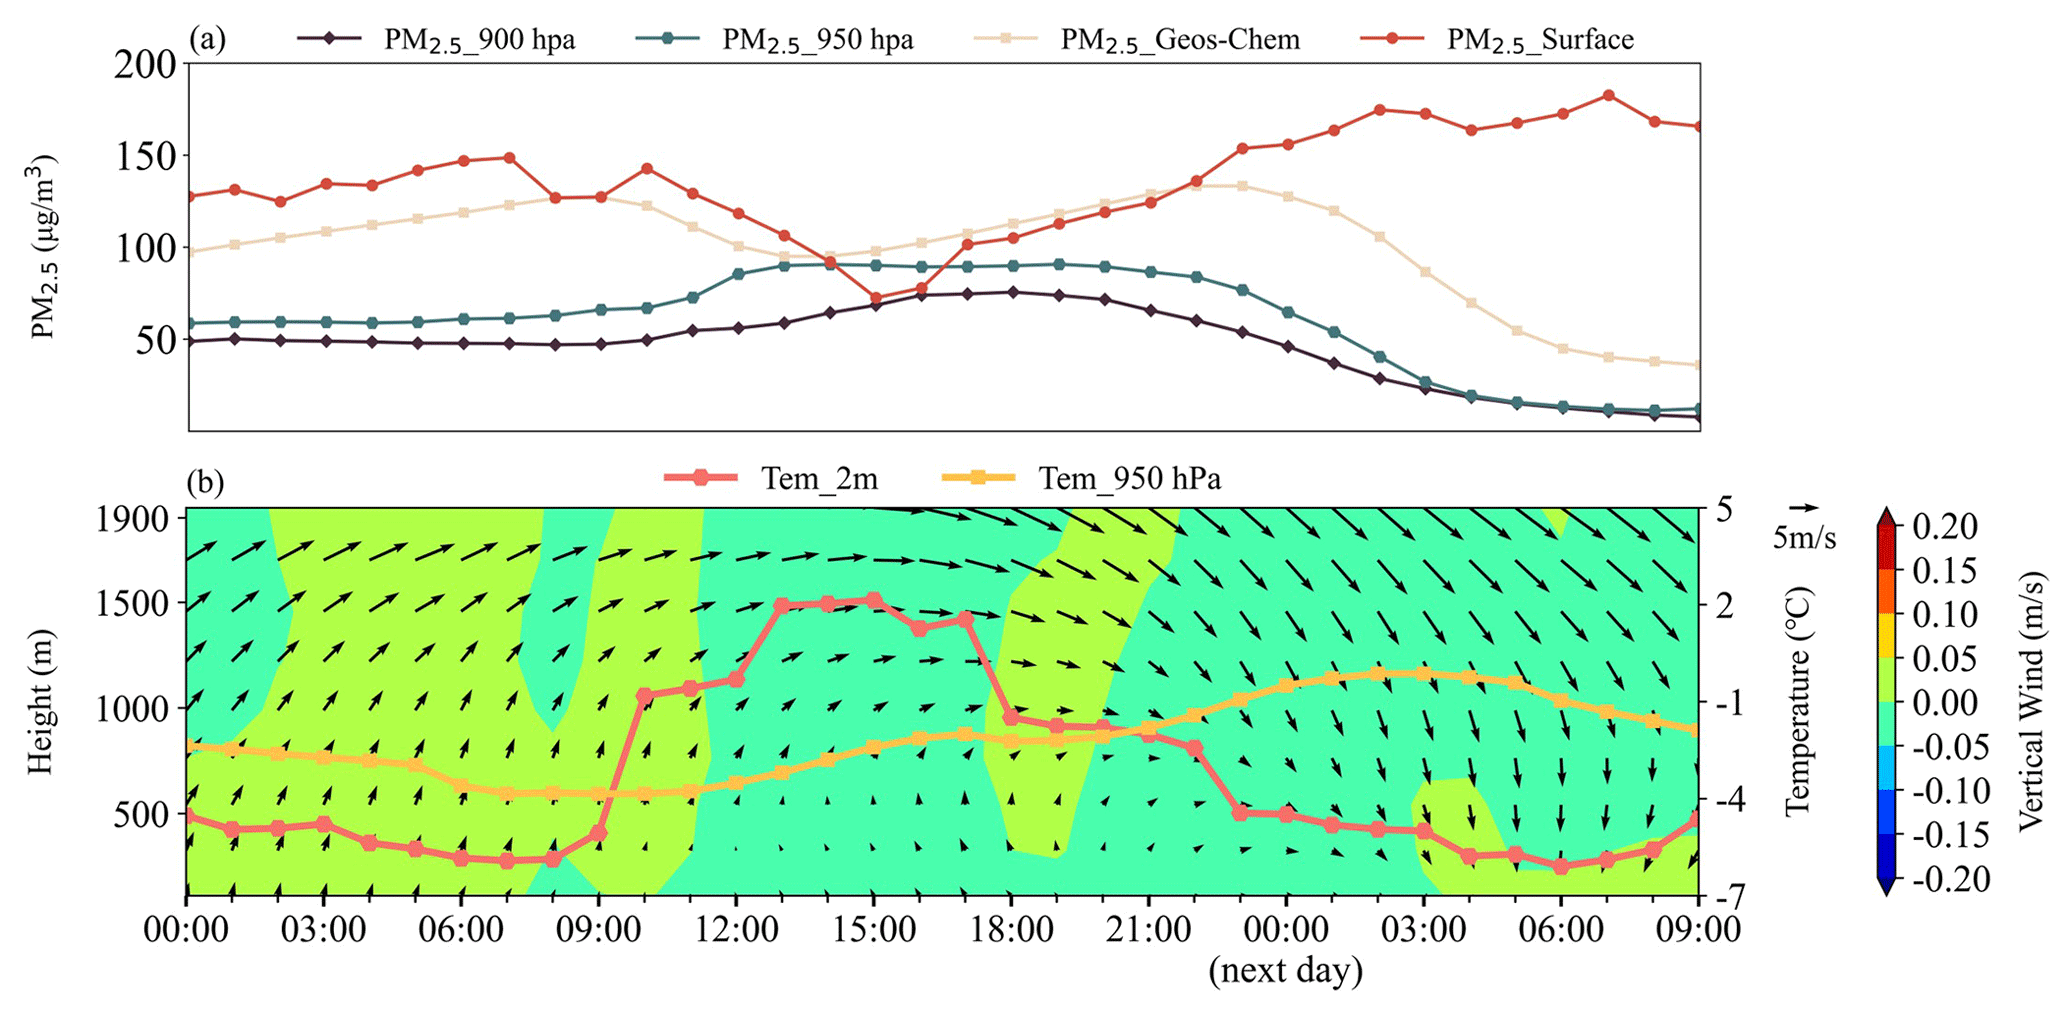
Figure 5The average for all T-NPES events in Wangdu. (a) The concentration of PM2.5 at different levels, surface PM2.5 of observation (red line), surface PM2.5 of simulation (blue line), and PM2.5 at 900 and 950 hPa. (b) The horizontal winds (arrows), the vertical winds (shaded), the temperature at 2 m, and temperature at 950 hPa.
Figure 5 shows the average pattern of all T-NPES events in Wangdu, which was similar to that in Changzhou. Figure 5a demonstrated that the trend of simulated PM2.5 was consistent with the observation before 22:00 LT but was different thereafter. The trend of high-altitude PM2.5 was increasing before 15:00 LT due to the transport of pollutants by prevailing southwesterly horizontal winds and the dominance of updrafts, which suspended the aerosol shown in Fig. 5b. After 18:00 LT, the prevailing winds began to turn northwest and ultimately turn north at 00:00 LT the next day, while a brief updraft between 18:00 and 20:00 LT suspended the pollutants at high altitude. The ABL was dominated by the northwestern winds and downdrafts after 21:00 LT. Simultaneously, the high-altitude PM2.5 began to gradually transport and diffuse downward causing the enhancement of surface concentration of PM2.5. The temperature at 950 hPa increased and the surface temperature declined (Fig. 5b), which agreed with the two observation examples in Wangdu. The opposite variation in temperature at different heights stabilized the ABL and further enhanced the concentration of PM2.5. By analyzing the weather circulation patterns, the causes of the T-NPES events were the same as those in Changzhou and were attributed to the southeasterly movement of the high-pressure system and the passage of the cold front (Fig. S9).
Overall, the average patterns of T-NPES events in Changzhou and Wangdu were essentially in good agreement with the three cases of T-NPES in the two cities, but there were still slight differences, such as the change at Wangdu caused by the movement of high pressure lasting a longer time in the average situation and the start time of subsidence behind the cold front also being inconsistent, which were due to each T-NPES event not being exactly the same.
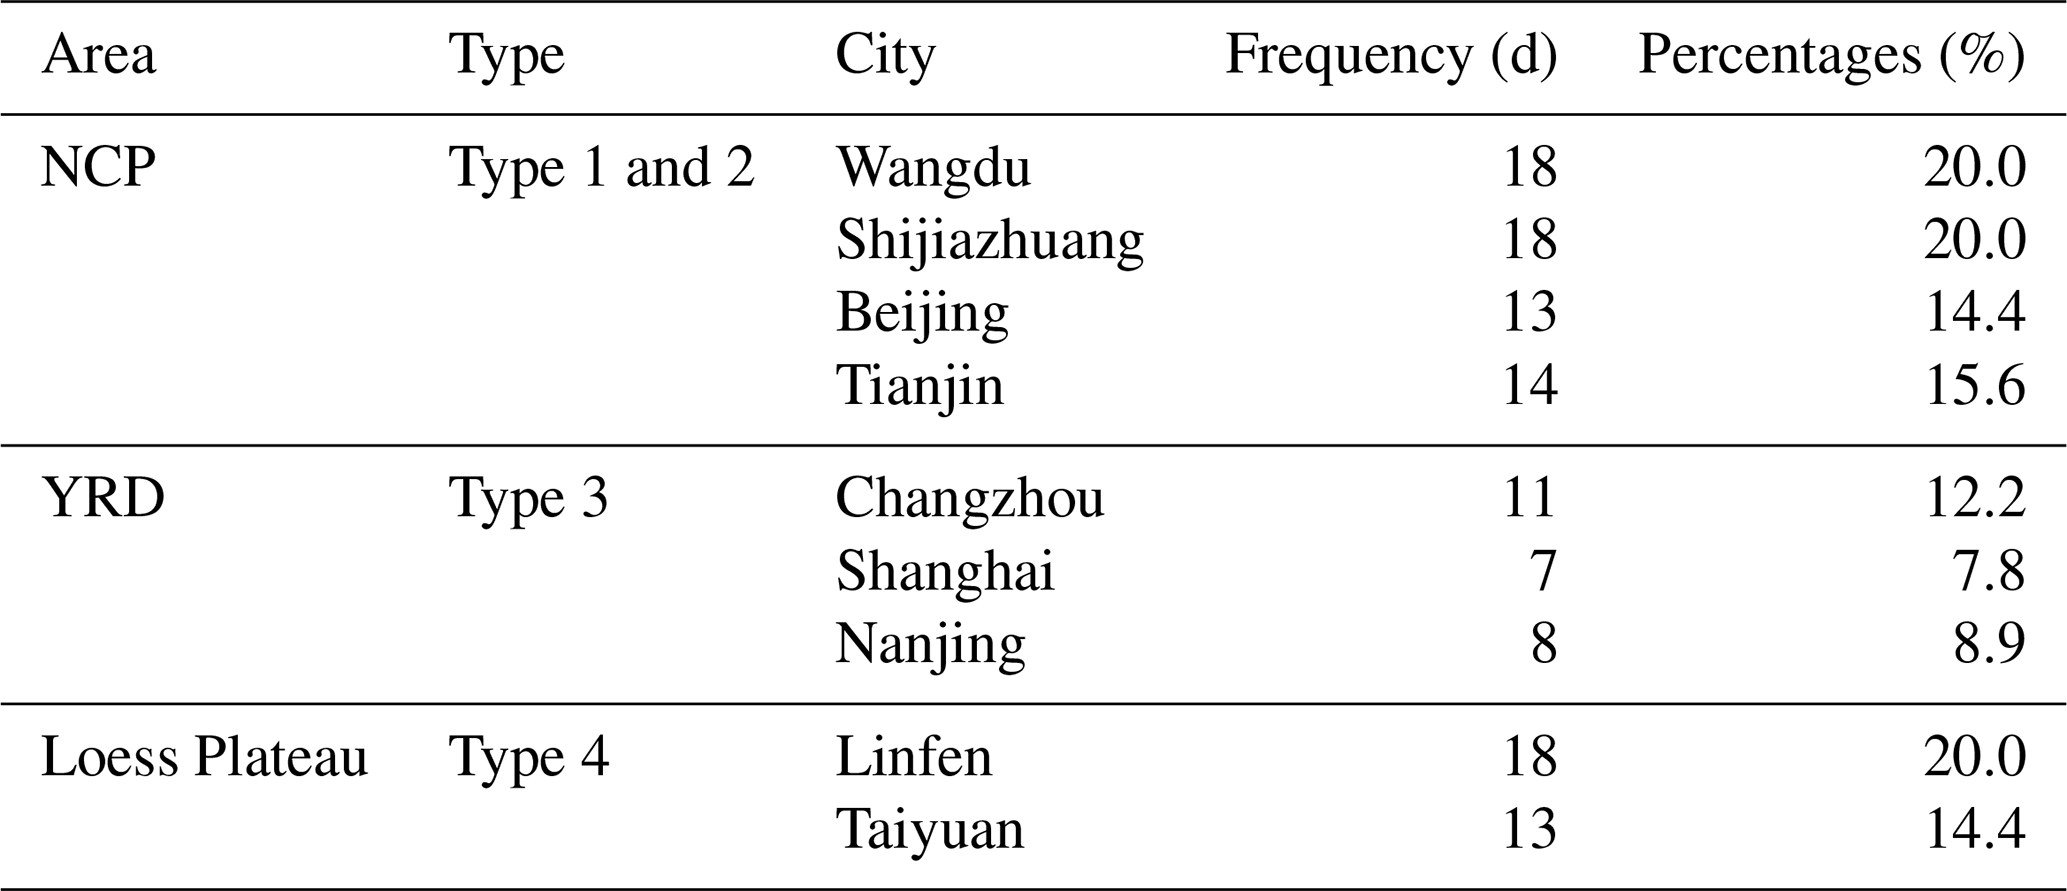
Table 3Statistics of the T-NPES events in cities during December 2018 to February 2019.
3.3 The universality of T-NPES events in eastern China
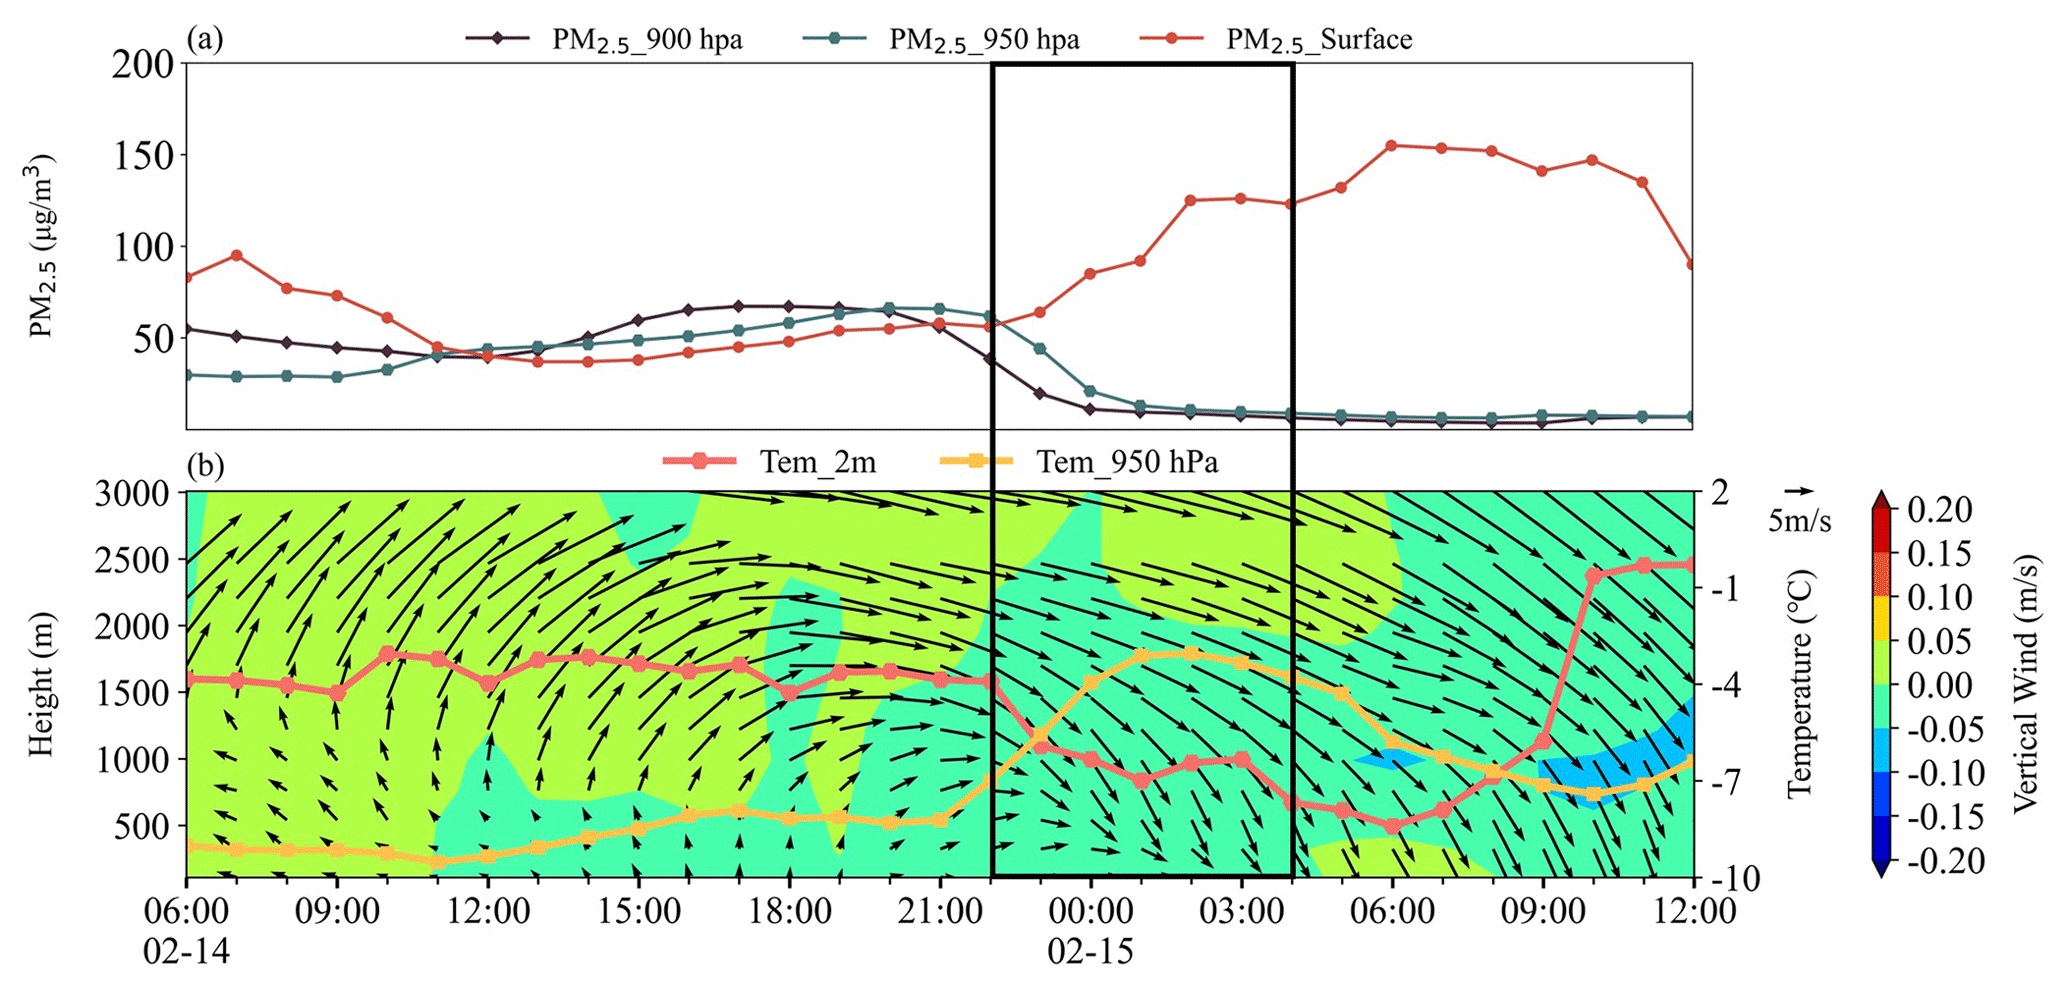
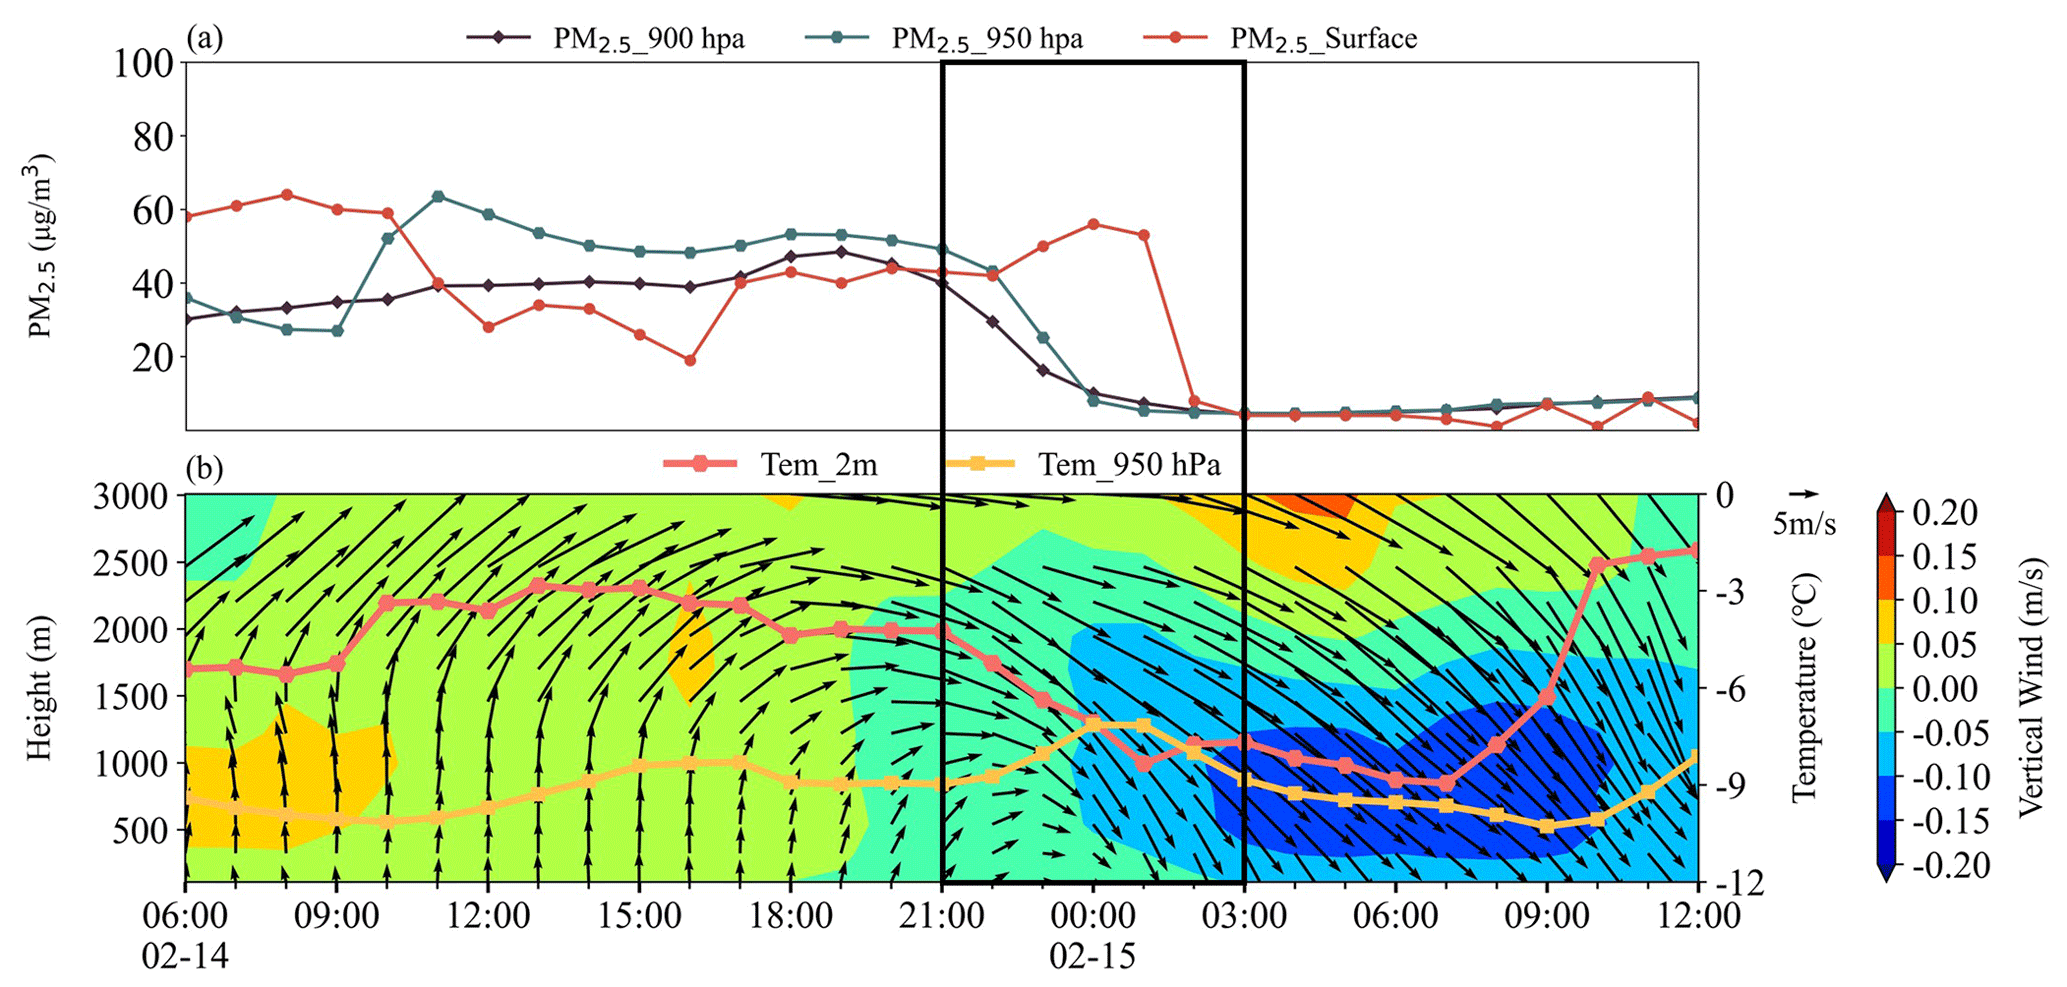
Despite the mobile observation vehicle having no observations in other cities of the NCP, the YRD, and the Loess Plateau, we could still utilize the simulated data and the ERA5 data to investigate the universality of T-NPES event occurrence in other cities. We selected Shijiazhuang, Beijing, and Tianjin as representative cities of the NCP; Shanghai and Nanjing as representative cities of the YRD; and Taiyuan and Linfen as representative cities of the Loess Plateau. We found a similar pattern of T-NPES events in all these cities. However, these T-NPES events in different cities had some differences in detail. Here we divided the T-NPES events into four types based on the status of PM2.5 after T-NPES events. More information on the types, frequency of the T-NPES events, and their percentage of the winter 2018 was shown in Table 3. The typical representation of Type 1 is shown in Fig. 6, the characteristic of Type 1 was that the southwestern winds transported the pollutants in the high-altitude of the ABL, then the wind direction shifted to north and downdrafts dominated; finally, pollutants in high-altitude diffused into lower layer causing the surface PM2.5 to enhance. However, after the T-NPES event, the north wind near the ground was not strong enough to remove the pollutants, causing a high level of PM2.5 lasting until the morning of the next day and may result in aggravation of the air pollution in the following day. The characteristic of the T-NPES event of Type 2 was basically consistent with Type 1. However, after the T-NPES event, as north winds became stronger, pollutants were rapidly removed, resulting in a clean boundary layer throughout (Fig. 7). Even when the pollutants were removed more quickly by stronger north winds, the subsidence process might not be observed. Type 1 and Type 2 were both observed in the NCP cities, Type 1 predominated in Wangdu and Shijiazhuang, and Type 2 was dominant in Beijing and Tianjin.
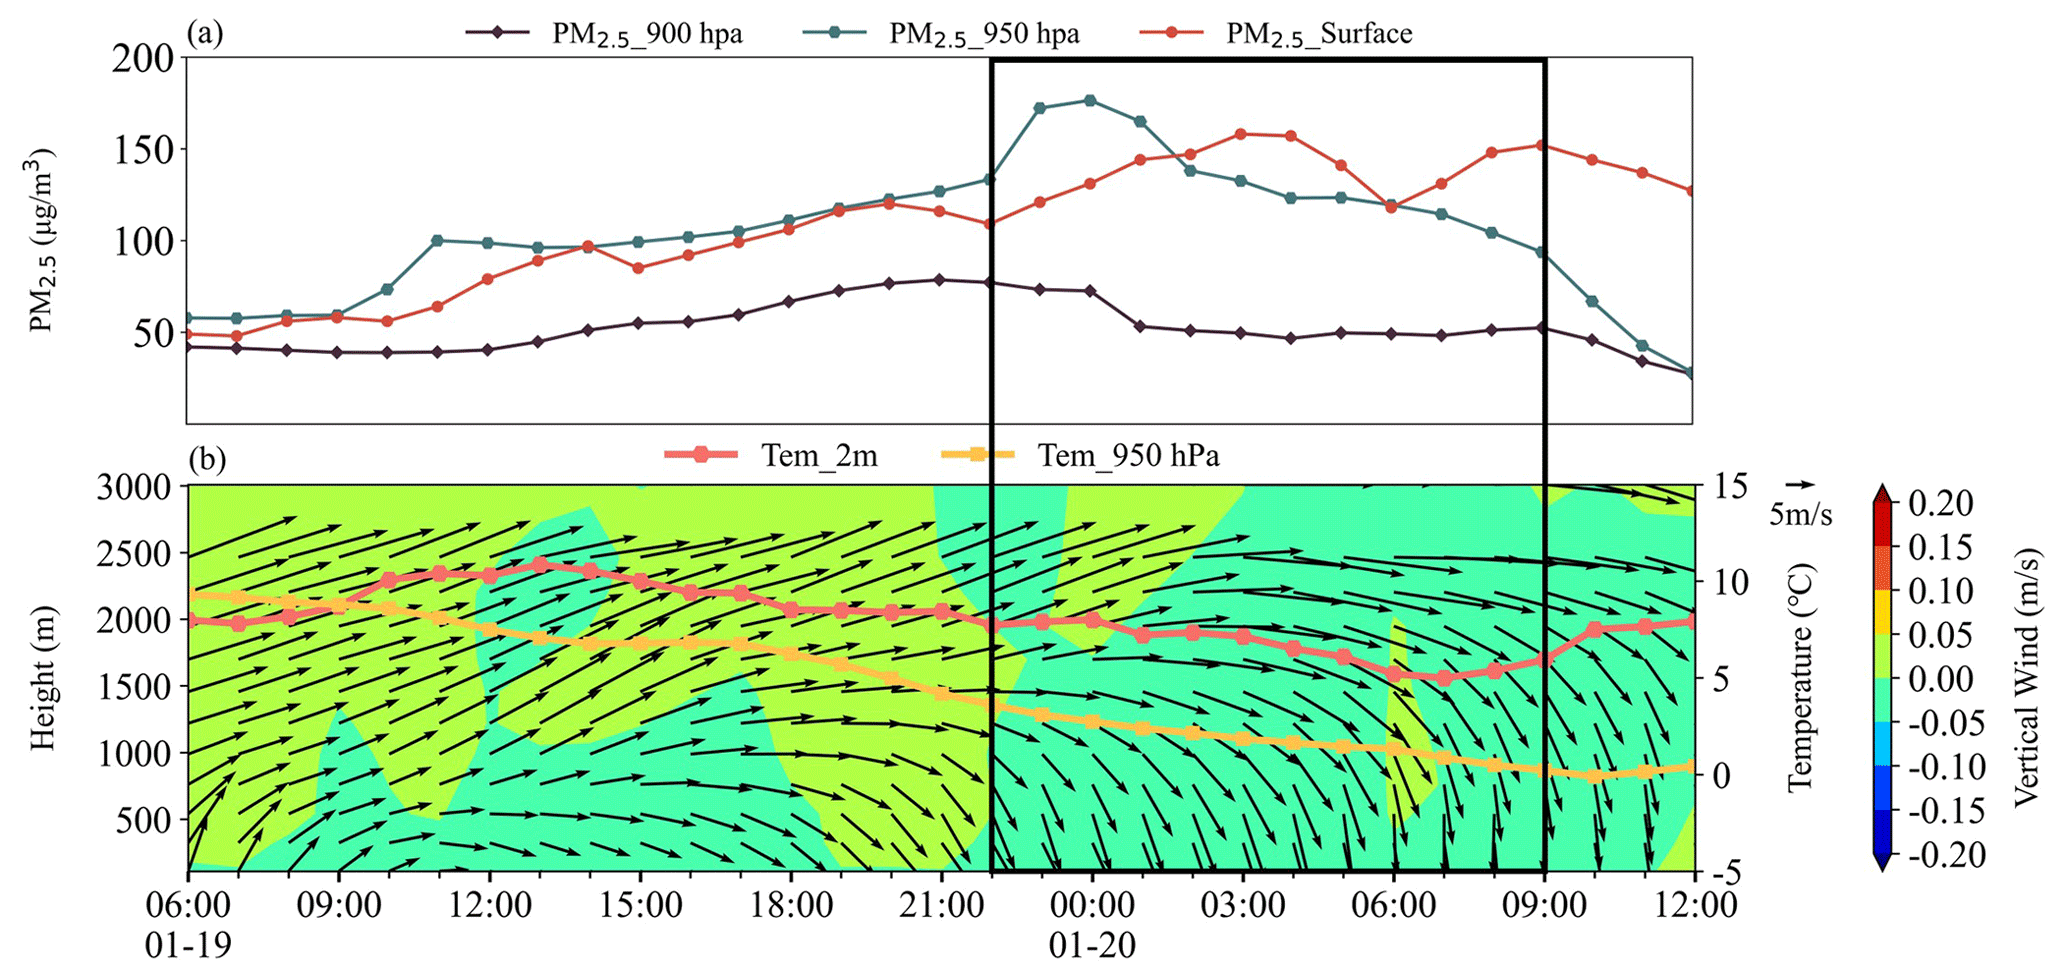
Figure 8 shows the typical representation of Type 3. The prevailing wind transporting pollutants was not southwest but west, and the start and end of the T-NPES event were later than for Type 1 and 2. After the T-NPES event, the increase in 2 m temperature and the development of convective ABL led to vertical mixing and an increase in surface PM2.5. Additionally, the stronger north wind might transport the pollutants from the NCP to the YRD. Type 3 was similar to the example in Changzhou in Sect. 3.1 and indicative of a typical pattern in the YRD cities.
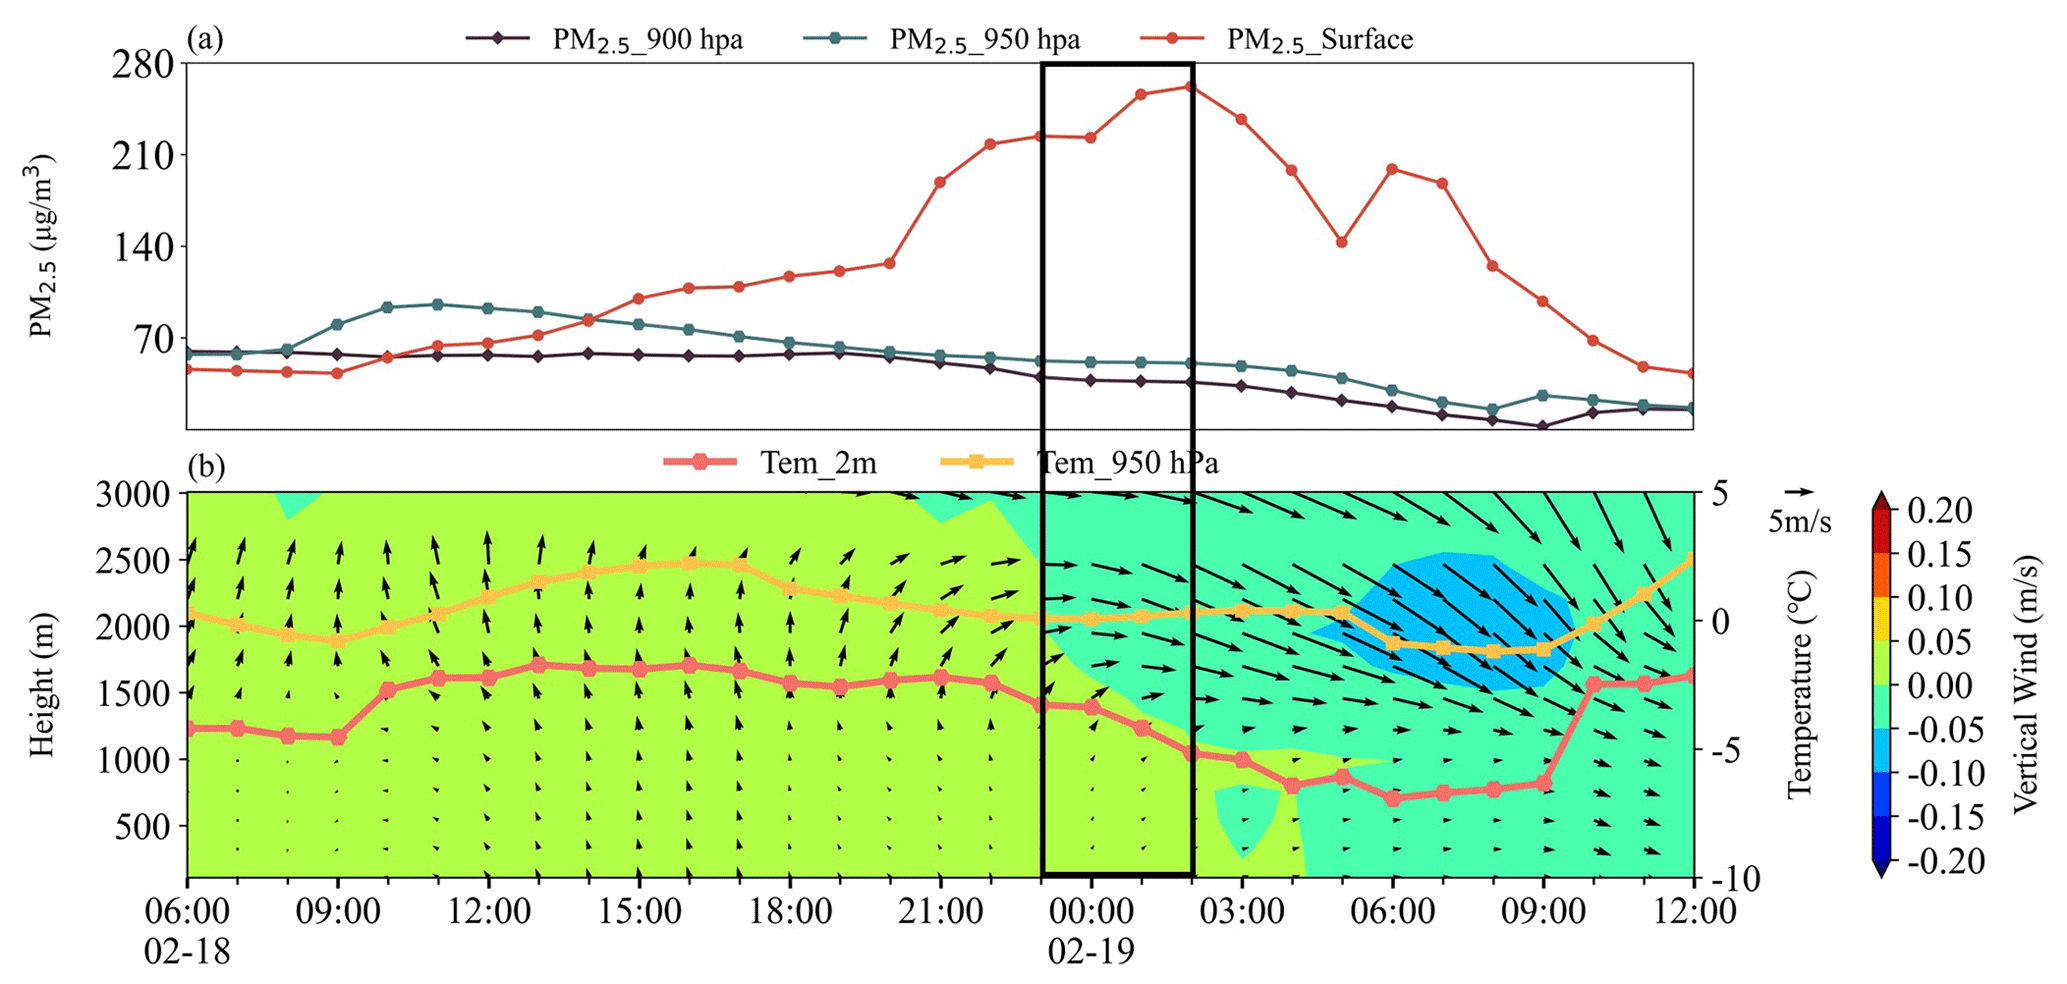
The typical representation of Type 4, which mainly occurred in the Loess Plateau cities, was shown in Fig. 9. During the T-NPES event, the change in wind direction was only observed above 1500 m while the wind speed below was so weak that the shift in wind direction was not significant, which was significantly different from the wind field of the other three types. The reason for the difference between Type 4 and other types was mainly related to the topography of the Loess Plateau, which has a blocking effect on the movement of the high-pressure system. It is worth noting that after the analysis of these T-NPES events in different cities in China, we suggested that the T-NPES events were a common pattern of the nocturnal PM2.5 enhancement but did not always have an impact on the air pollution of the following day. The pollution levels on the following day depended more on the strength of the cold front, local pollution conditions, the structure of ABL, and regional transportation. Further quantification is needed to determine the relationship between the T-NPES events and the pollution levels on the following day.
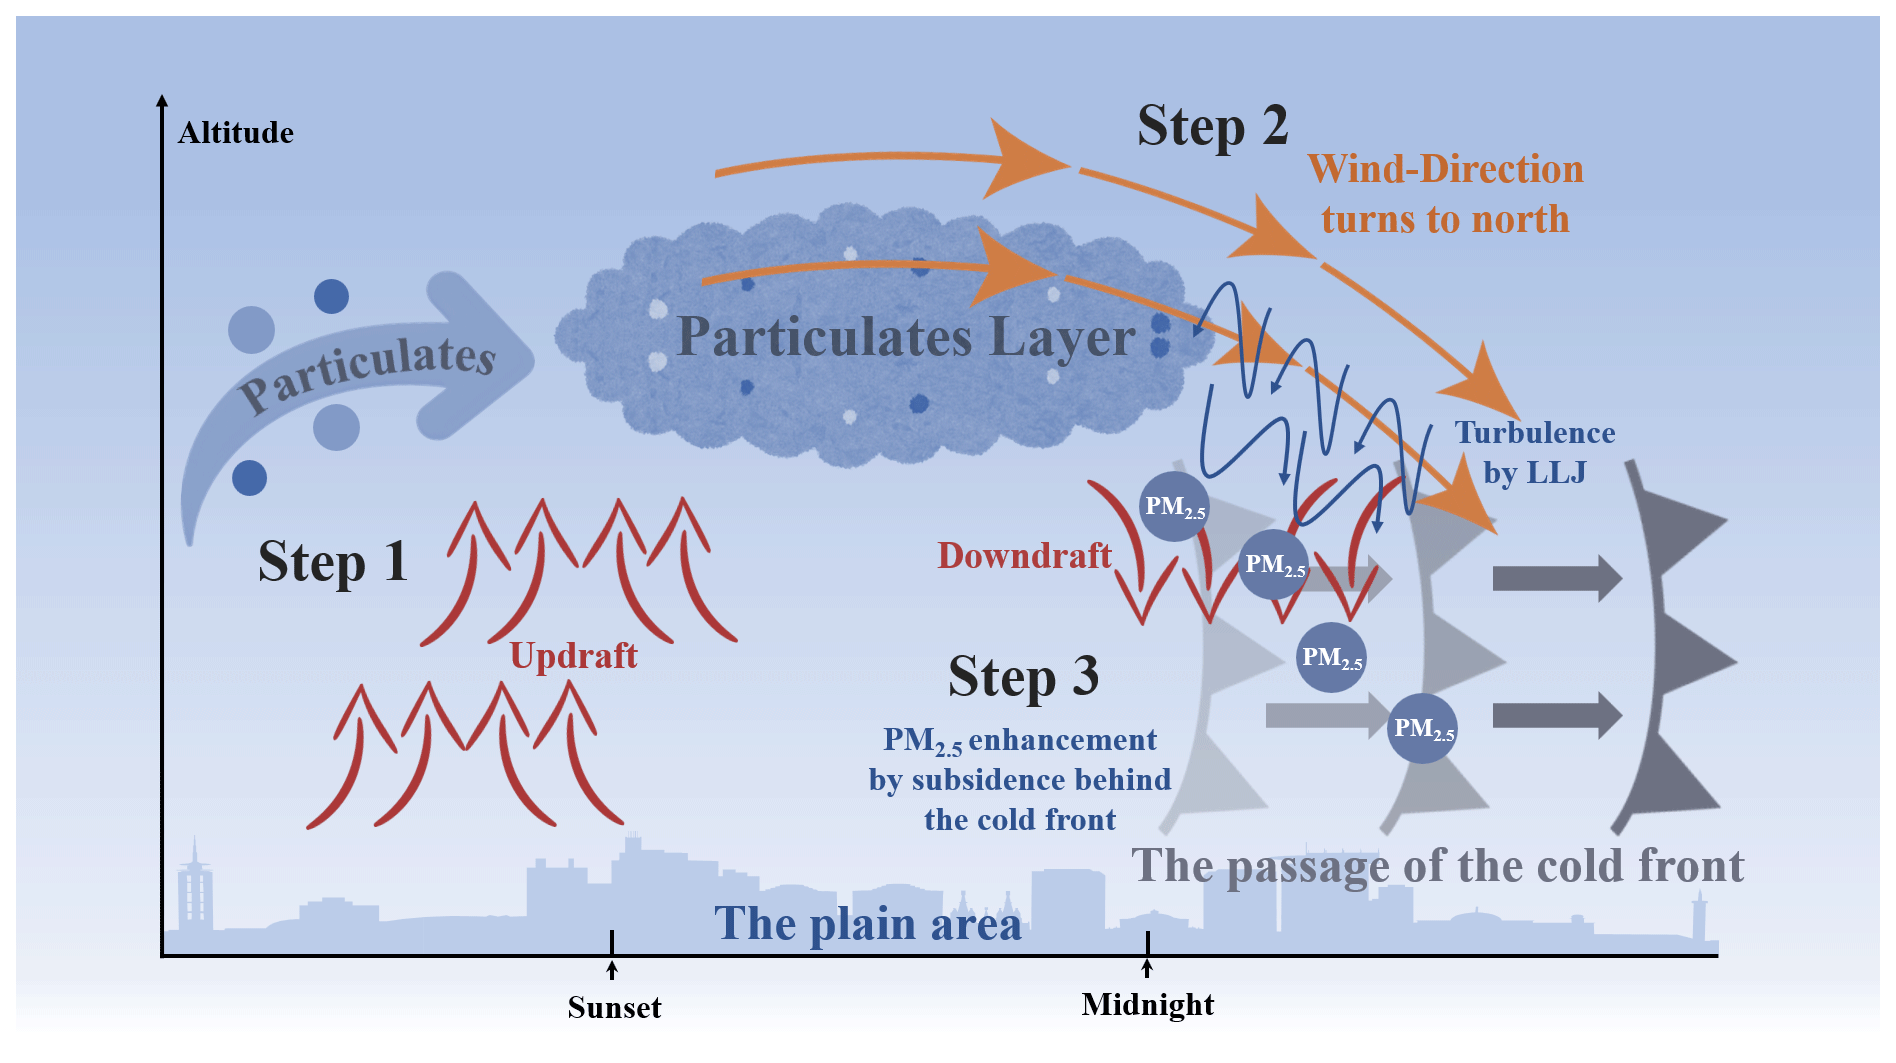
To find insights into the mechanism of nocturnal PM2.5 enhancement, we systematically documented instances of nocturnal PM2.5 enhancement during the winter of 2018 in Wangdu and Changzhou according to the surface PM2.5 observation. We identified 48 such events in Wangdu and 27 in Changzhou, with proportions of T-NPES events of 37.5 % and 40.7 %, respectively. The results implied that T-NPES represents merely one among multiple pathways contributing to the nocturnal PM2.5 enhancement. We checked the nocturnal PM2.5 enhancement events that were not caused by T-NPES in Wangdu, the dominant wind field distributions within the ABL were southerly or characterized by static light wind, which indicated that the nocturnal PM2.5 enhancement might result from either horizontal transport from polluted regions in the southern areas or the local accumulation of particulates in the stable ABL. In the nocturnal PM2.5 enhancement events of non-T-NPES conditions in Changzhou, higher wind speeds in the ABL predominantly from the northerly and southwesterly directions indicated that the nocturnal PM2.5 enhancement might result from horizontal transport from the NCP (Huang et al., 2020) or other reasons. For example, from the perspective of chemical formation, the nocturnal atmospheric oxidation may elevate the nighttime aerosol concentration (H. C. Wang et al., 2023; Yan et al., 2023). In addition, we found the T-NPES event does not always cause a nocturnal PM2.5 increase; in a few cases, the strong northerly wind following the cold front plays a role in removing the aerosol. In summary, the T-NPES just represents one vertical transport mechanism that can collectively contribute to the enhancement of nocturnal PM2.5 with other physical and chemical processes (Zhao et al., 2023). Further understanding of the coupling effect of transportation as well as the chemical formation to the nocturnal PM2.5 enhancement is thus highly needed. Based on these examples mentioned above, we suggested that the T-NPES events were a common phenomenon in winter in plains areas such as the NCP and the YRD. A conceptual model was thus developed and shown in Fig. 10, where the transportation of aerosol by the horizontal winds at high altitudes and the updrafts dominated before nighttime, which was conducive to the formation and suspension of the aerosol layer. Following this, with the southeasterly movement of the high-pressure system and the passage of the cold front at about midnight, the wind direction began to turn north–northwest, causing the aerosol to dilute. Finally, the downdrafts dominated in the ABL, and the LLJ might enhance the turbulence. Under the influence of subsidence behind the cold front and turbulence, the depth of the aerosol layer suspended at high altitudes began to decrease and the pollutants gradually transported and diffused downwards into the lower layer of the ABL, enhancing the concentration of surface PM2.5.
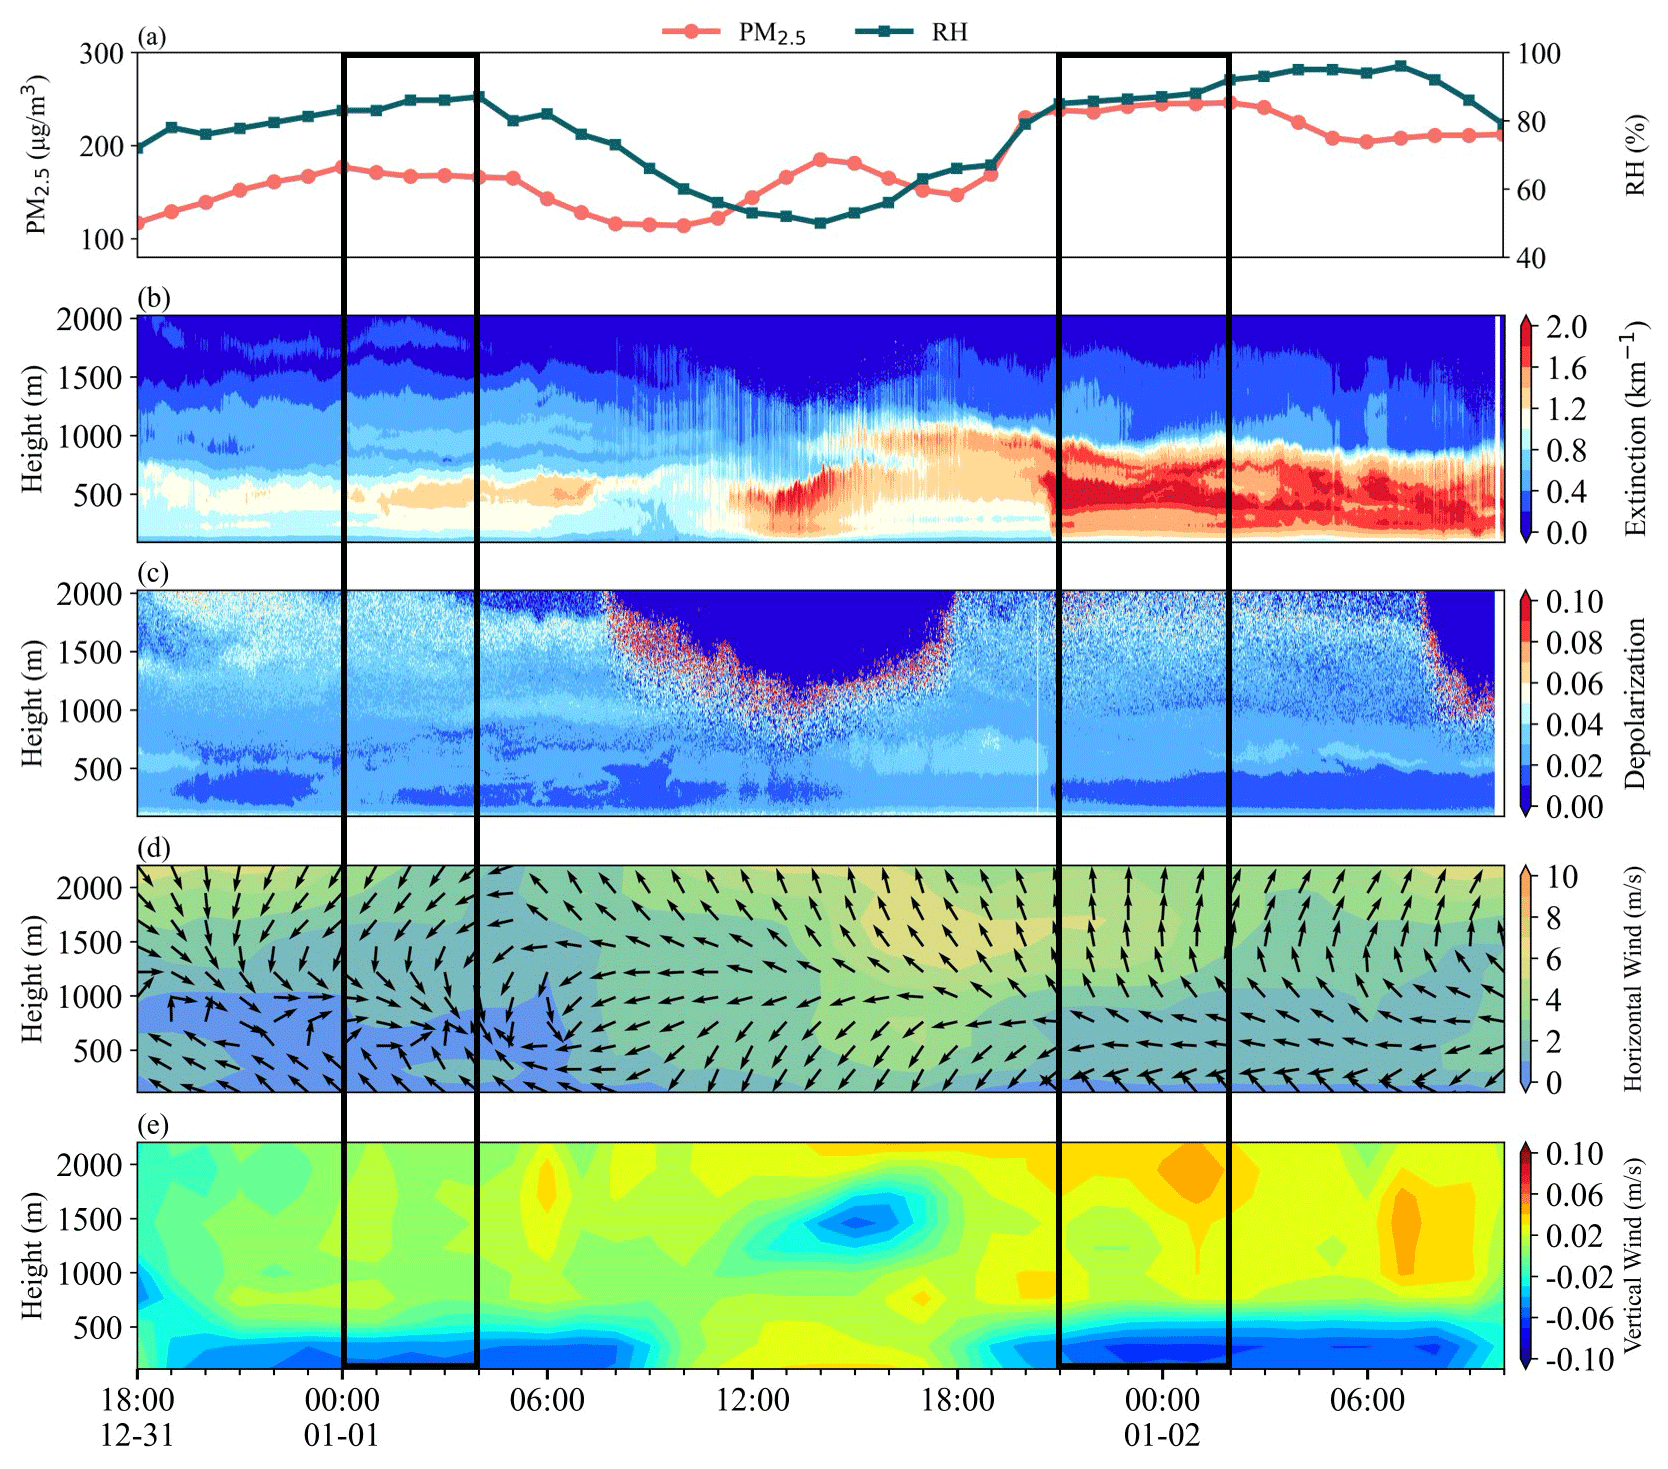
Figure 11(a) Surface PM2.5 concentration and relative humidity, (b) extinction coefficient, (c) depolarization ratio, (d) horizontal wind, and (e) vertical wind, during the observation in Xi'an from 18:00 LT on 31 December to 10:00 LT on 2 January. The two black boxes are the period to be studied.
3.4 No T-NPES event occurred in basin areas
We further checked the fixed-point measurement in Xi'an and Chengdu, two cities with typical basin topography. The results indicated that there were essentially no T-NPES events in either city, suggesting the concept did not work. Figure 11a indicates that the concentration of surface PM2.5 had no enhancement during the night from 23:00 LT on 31 December to 04:00 LT on 1 January and from 22:00 LT on 1 January to 03:00 LT on 2 January in Xi'an. PM2.5 remained at a high concentration, while the extinction coefficient did not show the subsidence process, suggesting that the T-NPES events were not common here.
Taking the night of 31 December as an example, from 18:00 LT on 31 December to 04:00 LT on 1 January, the concentration of surface PM2.5 increased before 23:00 LT. It then stabilized at high values, while the extinction coefficient remained at a high level with about 1.0–1.2 km−1 near 500 m. As shown in Fig. 11d, from 18:00 LT on 31 December to 06:00 LT on 1 January, a light wind layer appeared below 1000 m, with ∼ 1 m s−1. Such a static and stable condition was conducive to the accumulation of locally generated particulate matter near the ground, causing the concentration of PM2.5 to enhance between 18:00 and 23:00 LT on 31 December and the formation and maintenance of the aerosol layer at about 500 m. It is worth noting that the wind direction at the lower layer was southeasterly, while it was the opposite (northwesterly) at about 1000 m, which was the typical characteristic of mountain–valley breeze circulation. The dominance of downdrafts below 500 m suggested that Xi'an was in the upper area of the nocturnal mountain–valley breeze circulation. The mountain–valley breeze circulation could only be observed when the background WS was relatively weak, which further indicated a stable structure of the ABL. The example on 1 January was similar to the above one, with the extinction coefficient reaching 2 km−1 and the depolarization ratio decreasing after 21:00 LT due to the hygroscopic growth of aerosol following the rise in relative humidity.
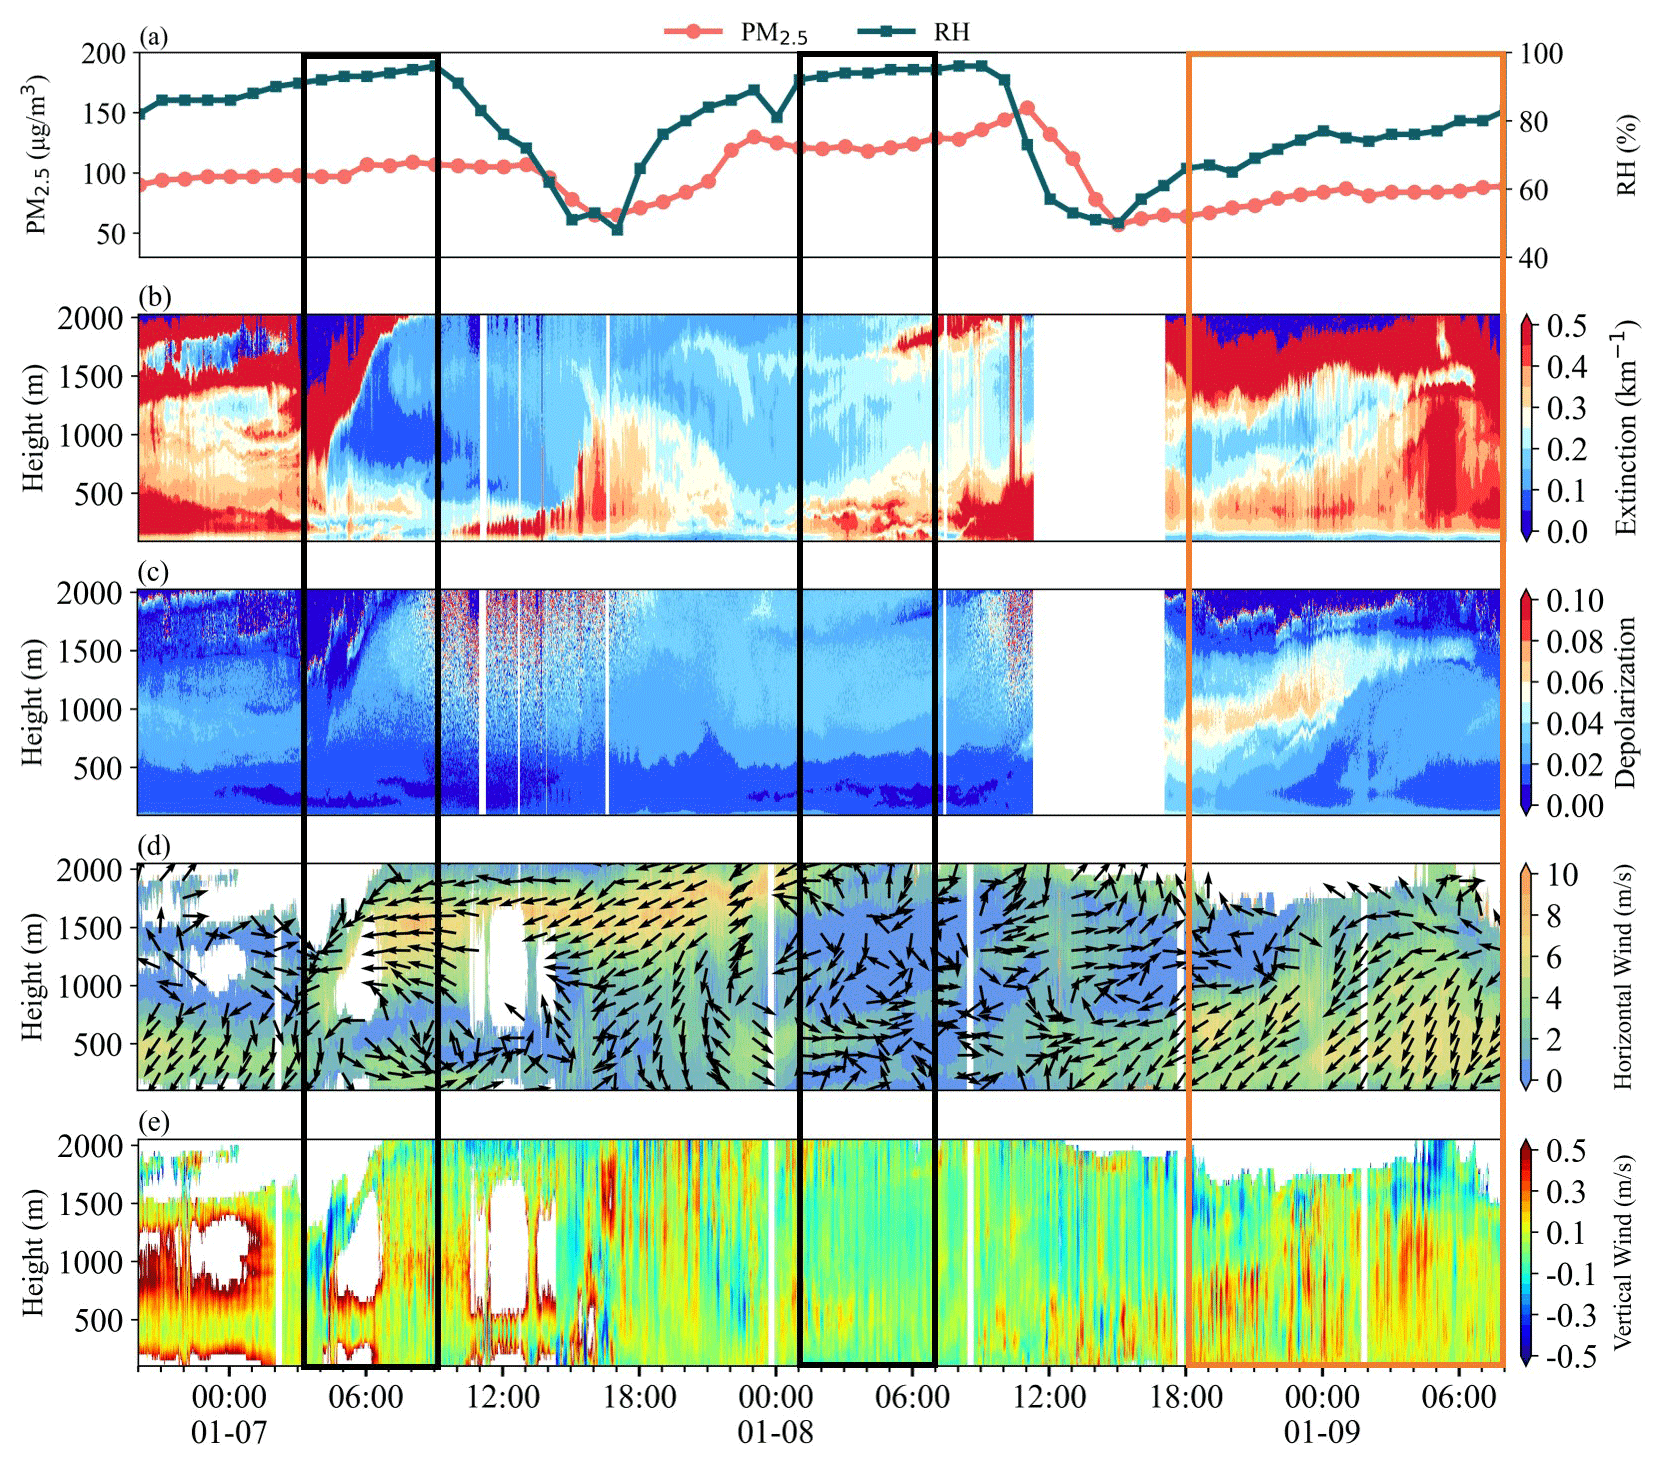
Figure 12Surface PM2.5 concentration and relative humidity, (b) extinction coefficient, (c) depolarization ratio, (d) horizontal wind, and (e) vertical wind, during the observation in Chengdu from 20:00 LT on 7 January to 08:00 LT on 10 January. The two black boxes were the period of the double-layer structure, the orange box was the period to be studied.
Due to the topography of the basin in Xi'an, the mountain–valley breeze circulation or the horizontal winds with lower WS always dominated the ABL, which was not conducive to the transport and dispersion of particulate matter. The stable structure of the ABL resulted in the particulate matter accumulating in the low layer, which was the main feature of the nocturnal particulate matter distribution in Xi'an.
Figure 12 showed that the concentration of surface PM2.5 also had no significant enhancement but remained at a high value over nighttime in Chengdu. The distribution of the extinction coefficient in the two black boxes presented a double-layer structure, one layer near 250 m and another layer suspended at about 500 m. Meanwhile, the wind field exhibited typical mountain–valley breeze circulation, as shown in the two black boxes in Fig. 12d, which presented westerly wind near 250 m and southeasterly wind above 500 m. The variation in wind direction due to the mountain–valley breeze circulation at different layers might be responsible for the double layer of particulate matter. Figure S10 in the Supplement illustrates the backward trajectories when the double layer appeared. The layer of particulate matter at about 100 m might have originated from the southwest area of Chengdu, whereas the layer of particulate matter at 500 m and 1000 m might have originated from the northeast area of Chengdu. The different sources of particulate matter were consistent with the mountain–valley breeze circulation in Chengdu, further demonstrating the dominance of the mountain–valley breeze in the static and stable ABL at night.
The orange box in Fig. 12 indicated that the distribution of particulate matter in the ABL of Chengdu under the dominance of northeasterly winds with high WS. Both the extinction coefficient and the depolarization ratio showed a stratified structure, with the extinction coefficient initially higher below 750 m and lower above 750 m, whereas the depolarization ratio exhibited the opposite trend. The main cause of this phenomenon was that the different sources of particulate matter in the two layers. Under the influence of the dominant updrafts, local emissions with a high depolarization ratio were transported upwards, while the lower layer was occupied by particulate matter with a lower depolarization ratio transported by the northeasterly wind. As there was continuous transport of the northeasterly wind, the entire ABL was occupied by transported particulate matter with a high extinction coefficient and a low depolarization ratio.
Due to the short time during the fixed-point observation period, it is difficult to make a universal conclusion that no T-NPES occurs in basin regions. Therefore, we further checked the surface and model simulation data of the two basin cities for 3 months in winter 2018. We found that, unlike the plains area, the T-NPES events were rarely observed in the basin regions. It confirmed that the conceptual model was indeed not applicable in the basin area. This was mainly attributed to the fact that the movement of the weather system was blocked by the mountains surrounding the basin. Therefore, the movement of the high-pressure system and the passage of the cold front had a weak impact on the basin region. Without the downdrafts and the shift in wind direction associated with the movement of the high-pressure system and the passage of the cold front, the structure of the ABL between Xi'an and Chengdu was relatively stable, making it difficult for particulate matter to be transported and diffused and thus accumulate in the ABL at night. During the 3 months, we found that the wind field in Xi'an was dominated by light winds, while in Chengdu there were two states: one was dominated by light winds and the other by strong northeasterly winds. Fortunately, our fixed-point observations had captured these typical processes indeed. In addition, considering the wind fields in basin cities were mainly dominated by light winds, which was the main characteristic of basin area (Bei et al., 2016; Shu et al., 2021) and was similar to the wind fields below 1500 m in Taiyuan and Linfen of the Type 4. Therefore, we suggested that the Loess Plateau cities might serve as a crucial transitional zone between the plains and the basin as introduced in Sect. 3.3. In summary, the conceptual model of T-NPES events was applicable to the plains areas, which were more influenced by the movement of the weather system in winter, such as the NCP and YRD, but not to the basin areas.
In this study, we reveal that the T-NPES is a relatively common and important pathway that causes PM2.5 pollution in the surface layer in plains areas in wintertime China. The fixed-point observations in Changzhou and Wangdu demonstrated that the T-NPES was associated with the subsidence of particulate matter in the upper layer due to the movement of high pressure and the passage of the cold front. Model simulations further confirmed the ubiquity of T-NPES events in plains areas, despite these event types varying case by case. However, the observations in Xi'an and Chengdu indicated that these events were less likely to occur in the basin areas, as the impact of the weather system was weakened by the obstruction of mountains surrounding the basin. In future studies, more multi-lidar measurements should be conducted in other cities in the plains and basin areas to look for insights into the detailed mechanism of T-NPES events. In addition, more work is urgently needed to uncover the vertical profiles of chemical components of the particulate matter, since they may also be affected by the coupling of physical and chemical processes.
The datasets used in this study are available at https://doi.org/10.5281/zenodo.8368944 (Y. Wang et al., 2023).
The supplement related to this article is available online at: https://doi.org/10.5194/acp-24-2267-2024-supplement.
HaiW and SF designed the study. YW and HaiW analyzed the data. HaoW and XL provided the GEOS-Chem model simulation results. YW and HaiW wrote the paper with input from all coauthors.
The contact author has declared that none of the authors has any competing interests.
Publisher's note: Copernicus Publications remains neutral with regard to jurisdictional claims made in the text, published maps, institutional affiliations, or any other geographical representation in this paper. While Copernicus Publications makes every effort to include appropriate place names, the final responsibility lies with the authors.
The authors gratefully acknowledge the NOAA Air Resources Laboratory (ARL) for the provision of the HYSPLIT transport and dispersion model used in this study.
This research has been supported by the Guangdong Major Project of Basic and Applied Basic Research (grant no. 2020B0301030004), the National Key Research and Development Program of China (grant nos. 2023YFC3709201, 2023YFC3706103, 2023YFC3710900), and the Fundamental Research Funds for the Central Universities, Sun Yat-sen University (grant no. 23lgbj002).
This paper was edited by Matthias Tesche and reviewed by Youngmin Noh and one anonymous referee.
An, Z. S., Huang, R. J., Zhang, R. Y., Tie, X. X., Li, G. H., Cao, J. J., Zhou, W. J., Shi, Z. G., Han, Y. M., Gu, Z. L., and Ji, Y. M.: Severe haze in northern China: A synergy of anthropogenic emissions and atmospheric processes, P. Natl. Acad. Sci. USA, 116, 8657–8666, https://doi.org/10.1073/pnas.1900125116, 2019..
Bei, N. F., Xiao, B., Meng, N., and Feng, T.: Critical role of meteorological conditions in a persistent haze episode in the Guanzhong basin, China, Sci. Total Environ., 550, 273–284, https://doi.org/10.1016/j.scitotenv.2015.12.159, 2016.
Bey, I., Jacob, D. J., Yantosca, R. M., Logan, J. A., Field, B. D., Fiore, A. M., Li, Q. B., Liu, H. G. Y., Mickley, L. J., Schultz, and M. G.: Global modeling of tropospheric chemistry with assimilated meteorology: Model description and evaluation, J. Geophys. Res.-Atmos., 106, 23073–23095, https://doi.org/10.1029/2001JD000807, 2001.
Bian, H. S. and Prather, M. J.: Fast-J2: Accurate simulation of stratospheric photolysis in global chemical models, J. Atmos. Chem., 41, 281–296, https://doi.org/10.1023/A:1014980619462, 2002.
Cai, W. J., Li, K., Liao, H., Wang, H. J., Wu, and L. X.: Weather conditions conducive to Beijing severe haze more frequent under climate change, Nat. Clim. Change, 7, 257–262, https://doi.org/10.1038/NCLIMATE3249, 2017.
Callahan, C. W., Schnell, J. L., and Horton, D. E.: Multi-Index Attribution of Extreme Winter Air Quality in Beijing, China, J. Geophys. Res.-Atmos., 124, 4567–4583, https://doi.org/10.1029/2018JD029738, 2019.
Carlson, M. A. and Stull, R. B.: Subsidence in the nocturnal boundary layer, J. Clim. Appl. Meteorol., 25, 1088–1099, https://doi.org/10.1175/1520-0450(1986)025<1088:sitnbl>2.0.co;2, 1986.
Chen, X. R., Wang, H. C., Lu, K. D., Li, C. M., Zhai, T. Y., Tan, Z. F., Ma, X. F., Yang, X. P., Liu, Y. H., Chen, S. Y., Dong, H. B., Li, X., Wu, Z. J., Hu, M., Zeng, L. M., and Zhang, Y. H.: Field Determination of Nitrate Formation Pathway in Winter Beijing, Environ. Sci. Technol., 54, 9243–9253, https://doi.org/10.1021/acs.est.0c00972, 2020.
De Marco, A., Proietti, C., Anav, A., Ciancarella, L., D'Elia, I., Fares, S., Fornasier, M. F., Fusaro, L., Gualtieri, M., Manes, F., Marchetto, A., Mircea, M., Paoletti, E., Piersanti, A., Rogora, M., Salvati, L., Salvatori, E., Screpanti, A., Vialetto, G., Vitale, M., and Leonardi, C.: Impacts of air pollution on human and ecosystem health, and implications for the National Emission Ceilings Directive: Insights from Italy, Environ. Int., 125, 320–333, https://doi.org/10.1016/j.envint.2019.01.064, 2019.
Ding, A. J., Fu, C. B., Yang, X. Q., Sun, J. N., Petäjä, T., Kerminen, V.-M., Wang, T., Xie, Y., Herrmann, E., Zheng, L. F., Nie, W., Liu, Q., Wei, X. L., and Kulmala, M.: Intense atmospheric pollution modifies weather: a case of mixed biomass burning with fossil fuel combustion pollution in eastern China, Atmos. Chem. Phys., 13, 10545–10554, https://doi.org/10.5194/acp-13-10545-2013, 2013.
Ding, A., Huang, X., Nie, W., Chi, X., Xu, Z., Zheng, L., Xu, Z., Xie, Y., Qi, X., Shen, Y., Sun, P., Wang, J., Wang, L., Sun, J., Yang, X.-Q., Qin, W., Zhang, X., Cheng, W., Liu, W., Pan, L., and Fu, C.: Significant reduction of PM2.5 in eastern China due to regional-scale emission control: evidence from SORPES in 2011–2018, Atmos. Chem. Phys., 19, 11791–11801, https://doi.org/10.5194/acp-19-11791-2019, 2019.
Dong, Z., Li, Z., Yu, X., Cribb, M., Li, X., and Dai, J.: Opposite long-term trends in aerosols between low and high altitudes: a testimony to the aerosol–PBL feedback, Atmos. Chem. Phys., 17, 7997–8009, https://doi.org/10.5194/acp-17-7997-2017, 2017.
Dubey, R., Patra, A. K., Joshi, J., Blankenberg, D., and Nazneen: Evaluation of vertical and horizontal distribution of particulate matter near an urban roadway using an unmanned aerial vehicle, Sci. Total Environ., 836, 155600, https://doi.org/10.1016/j.scitotenv.2022.155600, 2022.
Fast, J. D., Bell, D. M., Kulkarni, G., Liu, J., Mei, F., Saliba, G., Shilling, J. E., Suski, K., Tomlinson, J., Wang, J., Zaveri, R., and Zelenyuk, A.: Using aircraft measurements to characterize subgrid-scale variability of aerosol properties near the Atmospheric Radiation Measurement Southern Great Plains site, Atmos. Chem. Phys., 22, 11217–11238, https://doi.org/10.5194/acp-22-11217-2022, 2022.
Gao, M., Carmichael, G. R., Wang, Y., Saide, P. E., Yu, M., Xin, J., Liu, Z., and Wang, Z.: Modeling study of the 2010 regional haze event in the North China Plain, Atmos. Chem. Phys., 16, 1673–1691, https://doi.org/10.5194/acp-16-1673-2016, 2016.
Gao, M., Saide, P. E., Xin, J. Y., Wang, Y. S., Liu, Z. R., Wang, Y. X., Wang, Z. F., Pagowski, M., Guttikunda, S. K., and Carmichael, G. R.: Estimates of Health Impacts and Radiative Forcing in Winter Haze in Eastern China through Constraints of Surface PM2.5 Predictions, Environ. Sci. Technol., 51, 2178–2185, https://doi.org/10.1021/acs.est.6b03745, 2017.
Gao, M., Liu, Z., Zheng, B., Ji, D., Sherman, P., Song, S., Xin, J., Liu, C., Wang, Y., Zhang, Q., Xing, J., Jiang, J., Wang, Z., Carmichael, G. R., and McElroy, M. B.: China's emission control strategies have suppressed unfavorable influences of climate on wintertime PM2.5 concentrations in Beijing since 2002, Atmos. Chem. Phys., 20, 1497–1505, https://doi.org/10.5194/acp-20-1497-2020, 2020.
Gelaro, R., McCarty, W., Suarez, M. J., Todling, R., Molod, A., Takacs, L., Randles, C. A., Darmenov, A., Bosilovich, M. G., Reichle, R., Wargan, K., Coy, L., Cullather, R., Draper, C., Akella, S., Buchard, V., Conaty, A., da Silva, A. M., Gu, W., Kim, G. K., Koster, R., Lucchesi, R., Merkova, D., Nielsen, J. E., Partyka, G., Pawson, S., Putman, W., Rienecker, M., Schubert, S. D., Sienkiewicz, M., and Zhao, B.: The Modern-Era Retrospective Analysis for Research and Applications, Version 2 (MERRA-2), J. Climate, 30, 5419–5454, https://doi.org/10.1175/JCLI-D-16-0758.1, 2017.
Geng, G. N., Xiao, Q. Y., Liu, S. G., Liu, X. D., Cheng, J., Zheng, Y. X., Xue, T., Tong, D., Zheng, B., Peng, Y. R., Huang, X. M., He, K. B., and Zhang, Q.: Tracking Air Pollution in China: Near Real-Time PM2.5 Retrievals from Multisource Data Fusion, Environ. Sci. Technol., 55, 12106–12115, https://doi.org/10.1021/acs.est.1c01863, 2021a.
Geng, G. N., Zheng, Y. X., Zhang, Q., Xue, T., Zhao, H. Y., Tong, D., Zheng, B., Li, M., Liu, F., Hong, C. P., He, K. B., and Davis, S. J.: Drivers of PM2.5 air pollution deaths in China 2002–2017, Nat. Geosci., 14, 645–650, https://doi.org/10.1038/s41561-021-00792-3, 2021b.
Gramsch, E., Caceres, D., Oyola, P., Reyes, E., Vasquez, Y., Rubio, M. A., and Sanchez, G.: Influence of surface and subsidence thermal inversion on PM2.5 and black carbon concentration, Atmos. Environ., 98, 290–298, https://doi.org/10.1016/j.atmosenv.2014.08.066, 2014.
Guo, S., Hu, M., Zamora, M. L., Peng, J. F., Shang, D. J., Zheng, J., Du, Z. F., Wu, Z., Shao, M., Zeng, L. M., Molina, M. J., and Zhang, R. Y.: Elucidating severe urban haze formation in China, P. Natl. Acad. Sci. USA, 111, 17373–17378, https://doi.org/10.1073/pnas.1419604111, 2014.
Hao, X., Li, J. D., Wang, H. J., Liao, H., Yin, Z. C., Hu, J. L., Wei, Y., and Dang, R. J.: Long-term health impact of PM2.5 under whole-year COVID-19 lockdown, Environ. Pollut., 290, 118118, https://doi.org/10.1016/j.envpol.2021.118118, 2021.
He, C., Lu, X., Wang, H., Wang, H., Li, Y., He, G., He, Y., Wang, Y., Zhang, Y., Liu, Y., Fan, Q., and Fan, S.: The unexpected high frequency of nocturnal surface ozone enhancement events over China: characteristics and mechanisms, Atmos. Chem. Phys., 22, 15243–15261, https://doi.org/10.5194/acp-22-15243-2022, 2022.
He, Y. P., Xu, X. Q., Gu, Z. L., Chen, X. H., Li, Y. M., and Fan, S. J.: Vertical distribution characteristics of aerosol particles over the Guanzhong Plain, Atmos. Environ., 255, 118444, https://doi.org/10.1016/j.atmosenv.2021.118444, 2021.
Hu, X.-M., Klein, P. M., Xue, M., Zhang, F., Doughty, D. C., Forkel, R., Joseph, E., and Fuentes, J. D.: Impact of the vertical mixing induced by low-level jets on boundary layer ozone concentration, Atmos. Environ., 70, 123–130, https://doi.org/10.1016/j.atmosenv.2012.12.046, 2013.
Huang, R. J., Zhang, Y. L., Bozzetti, C., Ho, K. F., Cao, J. J., Han, Y. M., Daellenbach, K. R., Slowik, J. G., Platt, S. M., Canonaco, F., Zotter, P., Wolf, R., Pieber, S. M., Bruns, E. A., Crippa, M., Ciarelli, G., Piazzalunga, A., Schwikowski, M., Abbaszade, G., Schnelle-Kreis, J., Zimmermann, R., An, Z. S., Szidat, S., Baltensperger, U., El Haddad, I., and Prevot, A. S. H.: High secondary aerosol contribution to particulate pollution during haze events in China, Nature, 514, 218–222, https://doi.org/10.1038/nature13774, 2014.
Huang, X., Wang, Z. L., and Ding, A. J.: Impact of Aerosol-PBL Interaction on Haze Pollution: Multiyear Observational Evidences in North China, Geophys. Res. Lett., 45, 8596–8603, https://doi.org/10.1029/2018GL079239, 2018.
Huang, X., Ding, A. J., Wang, Z. L., Ding, K., Gao, J., Chai, F. H., and Fu, C. B.: Amplified transboundary transport of haze by aerosol-boundary layer interaction in China, Nat. Geosci., 13, 428–434, https://doi.org/10.1038/s41561-020-0583-4, 2020.
Kang, H., Zhu, B., Gao, J., He, Y., Wang, H., Su, J., Pan, C., Zhu, T., and Yu, B.: Potential impacts of cold frontal passage on air quality over the Yangtze River Delta, China, Atmos. Chem. Phys., 19, 3673–3685, https://doi.org/10.5194/acp-19-3673-2019, 2019.
Kang, H. Q., Zhu, B., Liu, X. H., Shi, S. S., Hou, X. W., Lu, W., Yan, S. Q., Pan, C., and Chen, Y.: Three-Dimensional Distribution of PM2.5 over the Yangtze River Delta as Cold Fronts Moving Through, J. Geophys. Res.-Atmos., 126, e2020JD034035, https://doi.org/10.1029/2020JD034035, 2021.
Kraus, H., Malcher, J., and Schaller, E.: A nocturnal low level jet during PUKK, Bound.-Lay. Meteorol., 31, 187–195, https://doi.org/10.1007/bf00121177, 1985.
Largeron, Y. and Staquet, C.: Persistent inversion dynamics and wintertime PM10 air pollution in Alpine valleys, Atmos. Environ., 135, 92–108, https://doi.org/10.1016/j.atmosenv.2016.03.045, 2016.
Li, H., Cheng, J., Zhang, Q., Zheng, B., Zhang, Y., Zheng, G., and He, K.: Rapid transition in winter aerosol composition in Beijing from 2014 to 2017: response to clean air actions, Atmos. Chem. Phys., 19, 11485–11499, https://doi.org/10.5194/acp-19-11485-2019, 2019.
Li, L., Lu, C., Chan, P. W., Lan, Z. J., Zhang, W. H., Yang, H. L., and Wang, H. C.: Impact of the COVID-19 on the vertical distributions of major pollutants from a tower in the Pearl River Delta, Atmos. Environ., 276, 119068, https://doi.org/10.1016/j.atmosenv.2022.119068, 2022.
Li, Z. Q., Guo, J. P., Ding, A. J., Liao, H., Liu, J. J., Sun, Y. L., Wang, T. J., Xue, H. W., Zhang, H. S., and Zhu, B.: Aerosol and boundary-layer interactions and impact on air quality, Natl. Sci. Rev., 4, 810–833, https://doi.org/10.1093/nsr/nwx117, 2017.
Li, Z. Q., Wang, Y., Guo, J. P., Zhao, C. F., Cribb, M., Dong, X. Q., Fan, J. W., Gong, D. Y., Huang, J. P., Jiang, M. J., Jiang, Y. Q., Lee, S. S., Li, H., Li, J. M., Liu, J. J., Qian, Y., Rosenfeld, D., Shan, S. Y., Sun, Y. L., Wang, H. J., Xin, J. Y., Yan, X., Yang, X., Yang, X. Q., Zhang, F., and Zheng, Y. T.: East Asian Study of Tropospheric Aerosols and their Impact on Regional Clouds, Precipitation, and Climate (EAST-AIR(CPC)), J. Geophys. Res.-Atmos., 124, 13026–13054, https://doi.org/10.1029/2019JD030758, 2019.
Lin, J. T. and McElroy, M. B.: Impacts of boundary layer mixing on pollutant vertical profiles in the lower troposphere: Implications to satellite remote sensing, Atmos. Environ., 44, 1726–1739, https://doi.org/10.1016/j.atmosenv.2010.02.009, 2010.
Lu, K. D., Fuchs, H., Hofzumahaus, A., Tan, Z. F., Wang, H. C., Zhang, L., Schmitt, S. H., Rohrer, F., Bohn, B., Broch, S., Dong, H. B., Gkatzelis, G. I., Hohaus, T., Holland, F., Li, X., Liu, Y., Liu, Y. H., Ma, X. F., Novelli, A., Schlag, P., Shao, M., Wu, Y. S., Wu, Z. J., Zeng, L. M., Hu, M., Kiendler-Scharr, A., Wahner, A., and Zhang, Y. H.: Fast Photochemistry in Wintertime Haze: Consequences for Pollution Mitigation Strategies, Environ. Sci. Technol., 53, 10676–10684, https://doi.org/10.1021/acs.est.9b02422, 2019.
Lv, L., Xiang, Y., Zhang, T., Chai, W., and Liu, W.: Comprehensive study of regional haze in the North China Plain with synergistic measurement from multiple mobile vehicle-based lidars and a lidar network, Sci. Total Environ., 721, 137773, https://doi.org/10.1016/j.scitotenv.2020.137773, 2020.
Mao, J., Fan, S., Jacob, D. J., and Travis, K. R.: Radical loss in the atmosphere from Cu-Fe redox coupling in aerosols, Atmos. Chem. Phys., 13, 509–519, https://doi.org/10.5194/acp-13-509-2013, 2013.
Muñoz-Sabater, J., Dutra, E., Agustí-Panareda, A., Albergel, C., Arduini, G., Balsamo, G., Boussetta, S., Choulga, M., Harrigan, S., Hersbach, H., Martens, B., Miralles, D. G., Piles, M., Rodríguez-Fernández, N. J., Zsoter, E., Buontempo, C., and Thépaut, J.-N.: ERA5-Land: a state-of-the-art global reanalysis dataset for land applications, Earth Syst. Sci. Data, 13, 4349–4383, https://doi.org/10.5194/essd-13-4349-2021, 2021.
O'Rourke, P. R., Smith, S. J., Mott, A., Ahsan, H., McDuffie, E. E., Crippa, M., Klimont, Z., McDonald, B., Wang, S. X., Nicholson, M. B., Feng, L., and Hoesly, R. M.: CEDS v-2021-04-21 Emission Data 1975–2019 (Version Apr-21-2021), DataHub [data set], https://data.pnnl.gov/dataset/CEDS-4-21-21 (last access: 3 May 2023), 2021.
Park, R. J., Jacob, D. J., Field, B. D., Yantosca, R. M., and Chin, M.: Natural and transboundary pollution influences on sulfate-nitrate-ammonium aerosols in the United States: Implications for policy, J. Geophys. Res.-Atmos., 109, D15204, https://doi.org/10.1029/2003JD004473, 2004.
Parrella, J. P., Jacob, D. J., Liang, Q., Zhang, Y., Mickley, L. J., Miller, B., Evans, M. J., Yang, X., Pyle, J. A., Theys, N., and Van Roozendael, M.: Tropospheric bromine chemistry: implications for present and pre-industrial ozone and mercury, Atmos. Chem. Phys., 12, 6723–6740, https://doi.org/10.5194/acp-12-6723-2012, 2012.
Peng, J. F., Hu, M., Shang, D. J., Wu, Z. J., Du, Z. F., Tan, T. Y., Wang, Y. N., Zhang, F., and Zhang, R. Y.: Explosive Secondary Aerosol Formation during Severe Haze in the North China Plain, Environ. Sci. Technol., 55, 2189–2207, https://doi.org/10.1021/acs.est.0c07204, 2021.
Qin, Y., Li, J. Y., Gong, K. J., Wu, Z. J., Chen, M. D., Qin, M. M., Huang, L., and Hu, J. L.: Double high pollution events in the Yangtze River Delta from 2015 to 2019: Characteristics, trends, and meteorological situations, Sci. Total Environ., 792, 148349, https://doi.org/10.1016/j.scitotenv.2021.148349, 2021.
Ran, L., Deng, Z., Wu, Y., Li, J., Bai, Z., Lu, Y., Zhuoga, D., and Bian, J.: Measurement report: Vertical profiling of particle size distributions over Lhasa, Tibet – tethered balloon-based in situ measurements and source apportionment, Atmos. Chem. Phys., 22, 6217–6229, https://doi.org/10.5194/acp-22-6217-2022, 2022.
Shi, Y., Zeng, Q. C., Liu, L., Huo, J. T., Zhang, Z., Ding, W. C., and Hu, F.: Observed Evidence That Subsidence Process Stabilizes the Boundary Layer and Increases the Ground Concentration of Secondary Pollutants, J. Geophys. Res.-Atmos., 127, e2021JD035244, https://doi.org/10.1029/2021JD035244, 2022.
Shu, Z., Liu, Y., Zhao, T., Xia, J., Wang, C., Cao, L., Wang, H., Zhang, L., Zheng, Y., Shen, L., Luo, L., and Li, Y.: Elevated 3D structures of PM2.5 and impact of complex terrain-forcing circulations on heavy haze pollution over Sichuan Basin, China, Atmos. Chem. Phys., 21, 9253–9268, https://doi.org/10.5194/acp-21-9253-2021, 2021.
Silver, B., Conibear, L., Reddington, C. L., Knote, C., Arnold, S. R., and Spracklen, D. V.: Pollutant emission reductions deliver decreased PM2.5−caused mortality across China during 2015–2017, Atmos. Chem. Phys., 20, 11683–11695, https://doi.org/10.5194/acp-20-11683-2020, 2020.
Song, R. F., Wang, D. S., Li, X. B., Li, B., Peng, Z. R., and He, H. D.: Characterizing vertical distribution patterns of PM2.5 in low troposphere of Shanghai city, China: Implications from the perspective of unmanned aerial vehicle observations, Atmos. Environ., 265, 118724, https://doi.org/10.1016/j.atmosenv.2021.118724, 2021.
Stein, A. F., Draxler, R. R., Rolph, G. D., Stunder, B. J. B., Cohen, M. D., and Ngan, F.: NOAA'S HYSPLIT ATMOSPHERIC TRANSPORT AND DISPERSION MODELING SYSTEM, B. Am. Meteorol. Soc., 96, 2059–2077, https://doi.org/10.1175/BAMS-D-14-00110.1, 2015.
Wang, D. F., Huo, J. T., Duan, Y. S., Zhang, K., Ding, A. J., Fu, Q. Y., Luo, J. H., Fei, D. N., Xiu, G. L., and Huang, K.: Vertical distribution and transport of air pollutants during a regional haze event in eastern China: A tethered mega-balloon observation study, Atmos. Environ., 246, 118039, https://doi.org/10.1016/j.atmosenv.2020.118039, 2021.
Wang, F., Li, Z., Ren, X., Jiang, Q., He, H., Dickerson, R. R., Dong, X., and Lv, F.: Vertical distributions of aerosol optical properties during the spring 2016 ARIAs airborne campaign in the North China Plain, Atmos. Chem. Phys., 18, 8995–9010, https://doi.org/10.5194/acp-18-8995-2018, 2018.
Wang, H., Lu, X., Jacob, D. J., Cooper, O. R., Chang, K.-L., Li, K., Gao, M., Liu, Y., Sheng, B., Wu, K., Wu, T., Zhang, J., Sauvage, B., Nédélec, P., Blot, R., and Fan, S.: Global tropospheric ozone trends, attributions, and radiative impacts in 1995–2017: an integrated analysis using aircraft (IAGOS) observations, ozonesonde, and multi-decadal chemical model simulations, Atmos. Chem. Phys., 22, 13753–13782, https://doi.org/10.5194/acp-22-13753-2022, 2022.
Wang, H. C., Lu, K. D., Chen, X. R., Zhu, Q. D., Chen, Q., Guo, S., Jiang, M. Q., Li, X., Shang, D. J., Tan, Z. F., Wu, Y. S., Wu, Z. J., Zou, Q., Zheng, Y., Zeng, L. M., Zhu, T., Hu, M., and Zhang, Y. H.: High N2O5 Concentrations Observed in Urban Beijing: Implications of a Large Nitrate Formation Pathway, Environ. Sci. Tech. Let., 4, 416–420, https://doi.org/10.1021/acs.estlett.7b00341, 2017.
Wang, H. C., Wang, H. L., Lu, X., Lu, K. D., Zhang, L., Tham, Y. J., Shi, Z. B., Aikin, K., Fan, S. J., Brown, S. S., and Zhang, Y. H.: Increased night-time oxidation over China despite widespread decrease across the globe, Nat. Geosci., 16, 217–223, https://doi.org/10.1038/s41561-022-01122-x, 2023.
Wang, Y., Wang, H., and Fan, S.: Measurement report: Nocturnal subsidence behind the cold front enhances surface particulate matter in the plain regions: observation from the mobile multi-lidar system, Zenodo [data set], https://doi.org/10.5281/zenodo.8368944, 2023.
Wang, Y. H., Logan, J. A., and Jacob, D. J.: Global simulation of tropospheric O3-NOx-hydrocarbon chemistry. 2. Model evaluation and global ozone budget, J. Geophys. Res., 103, 10727–10755, https://doi.org/10.1029/98jd00157, 1998.
Wesely, M. L.: Parameterization of surface resistances to gaseous dry deposition in regional-scale numerical models, Atmos. Environ., 23, 1293–1304, https://doi.org/10.1016/0004-6981(89)90153-4, 1989.
WHO: WHO Global Air Quality Guidelines: Particulate Matter (PM2.5 and PM10), Ozone, Nitrogen Dioxide, Sulfur Dioxide and Carbon Monoxide, World Health Organization (WHO), Geneva, Switzerland, https://www.who.int/publications/i/item/9789240034228 (last access: 3 March 2023), 2021.
Xiao, Q., Zheng, Y., Geng, G., Chen, C., Huang, X., Che, H., Zhang, X., He, K., and Zhang, Q.: Separating emission and meteorological contributions to long-term PM2.5 trends over eastern China during 2000–2018, Atmos. Chem. Phys., 21, 9475–9496, https://doi.org/10.5194/acp-21-9475-2021, 2021b.
Xiao, Q. Y., Geng, G. N., Cheng, J., Liang, F. C., Li, R., Meng, X., Xue, T., Huang, X. M., Kan, H. D., Zhang, Q., and He, K. B.: Evaluation of gap-filling approaches in satellite-based daily PM2.5 prediction models, Atmos. Environ., 244, 117921, https://doi.org/10.1016/j.atmosenv.2020.117921, 2021a.
Xu, X., Xie, J., Li, Y., Miao, S., and Fan, S.: Measurement report: Vehicle-based multi-lidar observational study of the effect of meteorological elements on the three-dimensional distribution of particles in the western Guangdong–Hong Kong–Macao Greater Bay Area, Atmos. Chem. Phys., 22, 139–153, https://doi.org/10.5194/acp-22-139-2022, 2022.
Xu, Z. N., Huang, X., Nie, W., Shen, Y. C., Zheng, L. F., Xie, Y. N., Wang, T. Y., Ding, K., Liu, L. X., Zhou, D. R., Qi, X. M., and Ding, A. J.: Impact of Biomass Burning and Vertical Mixing of Residual-Layer Aged Plumes on Ozone in the Yangtze River Delta, China: A Tethered-Balloon Measurement and Modeling Study of a Multiday Ozone Episode, J. Geophys. Res.-Atmos., 123, 11786–11803, https://doi.org/10.1029/2018JD028994, 2018.
Yan, C., Tham, Y. J., Nie, W., Xia, M., Wang, H. C., Guo, Y. S., Ma, W., Zhan, J. L., Hua, C. J., Li, Y. Y., Deng, C. J., Li, Y. R., Zheng, F. X., Chen, X., Li, Q. Y., Zhang, G., Mahajan, A. S., Cuevas, C. A., Huang, D. D., Wang, Z., Sun, Y. L., Saiz-Lopez, A., Bianchi, F., Kerminen, V. M., Worsnop, D. R., Donahue, N. M., Jiang, J. K., Liu, Y. C., Ding, A. J., and Kulmala, M.: Increasing contribution of nighttime nitrogen chemistry to wintertime haze formation in Beijing observed during COVID-19 lockdowns, Nat. Geosci., 16, 975–981, https://doi.org/10.1038/s41561-023-01285-1, 2023.
Yin, C., Xu, J., Gao, W., Pan, L., Gu, Y., Fu, Q., and Yang, F.: Characteristics of fine particle matter at the top of Shanghai Tower, Atmos. Chem. Phys., 23, 1329–1343, https://doi.org/10.5194/acp-23-1329-2023, 2023.
Yue, X., Unger, N., Harper, K., Xia, X., Liao, H., Zhu, T., Xiao, J., Feng, Z., and Li, J.: Ozone and haze pollution weakens net primary productivity in China, Atmos. Chem. Phys., 17, 6073–6089, https://doi.org/10.5194/acp-17-6073-2017, 2017.
Zhang, G., Gao, Y., Cai, W., Leung, L. R., Wang, S., Zhao, B., Wang, M., Shan, H., Yao, X., and Gao, H.: Seesaw haze pollution in North China modulated by the sub-seasonal variability of atmospheric circulation, Atmos. Chem. Phys., 19, 565–576, https://doi.org/10.5194/acp-19-565-2019, 2019.
Zhang, L. M., Gong, S. L., Padro, J., and Barrie, L.: A size-segregated particle dry deposition scheme for an atmospheric aerosol module, Atmos. Environ., 35, 549–560, https://doi.org/10.1016/S1352-2310(00)00326-5, 2001.
Zhang, Q., Zheng, Y. X., Tong, D., Shao, M., Wang, S. X., Zhang, Y. H., Xu, X. D., Wang, J. N., He, H., Liu, W. Q., Ding, Y. H., Lei, Y., Li, J. H., Wang, Z. F., Zhang, X. Y., Wang, Y. S., Cheng, J., Liu, Y., Shi, Q. R., Yan, L., Geng, G. N., Hong, C. P., Li, M., Liu, F., Zheng, B., Cao, J. J., Ding, A. J., Gao, J., Fu, Q. Y., Huo, J. T., Liu, B. X., Liu, Z. R., Yang, F. M., He, K. B., and Hao, J. M.: Drivers of improved PM2.5 air quality in China from 2013 to 2017, P. Natl. Acad. Sci. USA, 116, 24463–24469, https://doi.org/10.1073/pnas.1907956116, 2019.
Zhang, R. Y., Wang, G. H., Guo, S., Zarnora, M. L., Ying, Q., Lin, Y., Wang, W. G., Hu, M., and Wang, Y.: Formation of Urban Fine Particulate Matter, Chem. Rev., 115, 3803–3855, https://doi.org/10.1021/acs.chemrev.5b00067, 2015.
Zhang, W. H., Li, W. S., An, X. D., Zhao, Y. H., Sheng, L. F., Hai, S. F., Li, X. D., Wang, F., Zi, Z. F., Chu, M.: Numerical study of the amplification effects of cold-front passage on air pollution over the North China Plain, Sci. Total Environ., 833, 155231, https://doi.org/10.1016/j.scitotenv.2022.155231, 2022.
Zhao, X. J., Zhao, P. S., Xu, J., Meng,, W., Pu, W. W., Dong, F., He, D., and Shi, Q. F.: Analysis of a winter regional haze event and its formation mechanism in the North China Plain, Atmos. Chem. Phys., 13, 5685–5696, https://doi.org/10.5194/acp-13-5685-2013, 2013.
Zhao, X. X., Zhao, X. J., Liu, P. F., Chen, D., Zhang, C. L., Xue, C. Y., Liu, J. F., Xu, J., and Mu, Y. J.: Transport Pathways of Nitrate Formed from Nocturnal N2O5 Hydrolysis Aloft to the Ground Level in Winter North China Plain, Environ. Sci. Technol., 57, 2715–2725, https://doi.org/10.1021/acs.est.3c00086, 2023.
Zheng, B., Tong, D., Li, M., Liu, F., Hong, C., Geng, G., Li, H., Li, X., Peng, L., Qi, J., Yan, L., Zhang, Y., Zhao, H., Zheng, Y., He, K., and Zhang, Q.: Trends in China's anthropogenic emissions since 2010 as the consequence of clean air actions, Atmos. Chem. Phys., 18, 14095–14111, https://doi.org/10.5194/acp-18-14095-2018, 2018.
Zhou, X., Huang, X., Sun, P., Chi, X., Ren, C., Lai, S., Wang, Z., Qi, X., Wang, J., Nie, W., Xu, Z., Huo, J., Fu, Q., and Ding, A.: Fast Secondary Aerosol Formation in Residual Layer and Its Impact on Air Pollution Over Eastern China, J. Geophys. Res.-Atmos., 128, e2023JD038501, https://doi.org/10.1029/2023JD038501, 2023.