the Creative Commons Attribution 4.0 License.
the Creative Commons Attribution 4.0 License.
 | 14 Feb 2024
Tethered balloon-borne observations of thermal-infrared irradiance and cooling rate profiles in the Arctic atmospheric boundary layer
Michael Lonardi
Elisa F. Akansu
André Ehrlich
Mauro Mazzola
Christian Pilz
Matthew D. Shupe
Holger Siebert
Manfred Wendisch
Clouds play an important role in controlling the radiative energy budget of the Arctic atmospheric boundary layer. To quantify the impact of clouds on the radiative heating or cooling of the lower atmosphere and of the surface, vertical profile observations of thermal-infrared irradiances were collected using a radiation measurement system carried by a tethered balloon. We present 70 profiles of thermal-infrared radiative quantities measured in summer 2020 during the Multidisciplinary drifting Observatory for the Study of Arctic Climate (MOSAiC) expedition and in autumn 2021 and spring 2022 in Ny-Ålesund, Svalbard. Measurements are classified into four groups: cloudless, low-level liquid-bearing cloud, elevated liquid-bearing cloud, and elevated ice cloud. Cloudless cases display an average radiative cooling rate of about −2 K d−1 throughout the atmospheric boundary layer. Instead, low-level liquid-bearing clouds are characterized by a radiative cooling up to −80 K d−1 within a shallow layer at cloud top, while no temperature tendencies are identified underneath the cloud layer. Radiative transfer simulations are performed to quantify the sensitivity of radiative cooling rates to cloud microphysical properties. In particular, cloud top cooling is strongly driven by the liquid water path, especially in optically thin clouds, while for optically thick clouds the cloud droplet number concentration has an increased influence. Additional radiative transfer simulations are used to demonstrate the enhanced radiative importance of the liquid relative to ice clouds. To analyze the temporal evolution of thermal-infrared radiation profiles during the transitions from a cloudy to a cloudless atmosphere, a respective case study is investigated.
- Article
(2080 KB) - Full-text XML
- BibTeX
- EndNote


The Arctic climate system is currently undergoing dramatic changes that are mainly driven by global warming. However, in the Arctic, the warming is significantly enhanced relative to the global average. This effect is known as “Arctic amplification”. The causes for this phenomenon, though not yet fully understood, include several feedback mechanisms and other processes (Serreze and Barry, 2011; Wendisch et al., 2023a). Among others, the role of clouds in Arctic amplification and their realistic representation in models is still uncertain, mainly because of the complexity of cloud processes (Curry, 1986; Curry et al., 1996; Morrison et al., 2012). Reducing the uncertainty is of primary interest, as clouds play a crucial role in several feedback mechanisms (Wendisch et al., 2019). In particular, clouds exert a strong control on the Arctic surface radiative energy budget (Intrieri et al., 2002; Becker et al., 2023). Clouds have a cooling impact by reducing the incoming solar radiation and a warming effect by emitting thermal-infrared (TIR) radiation (Shupe and Intrieri, 2004). The total (solar plus TIR) cloud radiative effect is strongly variable and depends on the solar zenith angle, the thermodynamic and microphysical properties of the cloud, and the surface albedo, as well as surface and cloud base temperatures (Shupe and Intrieri, 2004). Cloud radiative properties are strongly affected by the thermodynamic phase of the cloud (Sun and Shine, 1994; Ehrlich et al., 2009), with liquid-bearing clouds having a stronger radiative effect than ice-only clouds (Shupe and Intrieri, 2004; Turner et al., 2018). Liquid-bearing clouds can be purely liquid or can also contain an ice component (mixed-phase clouds). The liquid water path (LWP) largely controls the attenuation of incoming solar radiation and the emission of TIR radiation, with optically thick clouds (LWP ≥ 30 g m−2) emitting nearly as black bodies (Shupe and Intrieri, 2004; Turner et al., 2018). Williams and Igel (2021) and Morrison et al. (2008) showed that droplet number concentration (Nd) impacts the optical properties of clouds. The interaction of clouds with surface albedo and temperature has been studied over the Arctic sea ice (Curry and Ebert, 1992; Walsh and Chapman, 1998; Intrieri et al., 2002; Walden et al., 2017; Stapf et al., 2020), open ocean (Wendisch et al., 2023b; Becker et al., 2023), and land (Dong et al., 2010; Miller et al., 2015; Ebell et al., 2020).
While most of the literature discusses the cloud radiative effect at the surface, its height dependence in the atmospheric boundary layer (ABL) is mostly not considered, although it may be significant because of local radiative energy sources and sinks at different altitudes (Curry, 1986; Yamamoto et al., 1995; Asano et al., 2004; Philipona et al., 2020). For example, Turner et al. (2018) showed that the vertical structure of irradiance and radiative cooling rate profiles depends on the atmospheric state. In a cloudless atmosphere, the emission of TIR irradiance from the surface results in cooling that promotes the formation of a surface-based temperature inversion. In liquid-bearing clouds, cloud top radiative cooling contributes to strong stratification just above the cloud layer, thus de-coupling the cloud, and consequently the ABL, from the overlying atmosphere. In turn, the vertical motion of sinking colder air parcels induces mixing in and below the cloud, which is important for cloud maintenance (e.g., Morrison et al., 2012). Entrainment of moisture (Shupe et al., 2013; Solomon et al., 2014; Egerer et al., 2021) and cloud condensation nuclei from above the cloud can also prolong the lifetime of the cloud. Conversely, the reduction of radiative cooling at cloud top due to the shading effects of a second cloud at higher altitudes dampens the vertical mixing of the lower cloud, which may shorten its lifetime (Shupe et al., 2013; Turner et al., 2018; Chechin et al., 2023).
Another complication in determining the role of clouds in Arctic amplification is that models are not always capable of reproducing cloud evolution and their transitions to and from cloudless states. These transitions may be determined locally or by larger-scale drivers, like advection from different regions or at different altitudes. Transitions may occur at a fixed location when two air masses are exchanged or along air mass trajectories when air masses are transformed (Pithan et al., 2018).
Radiosondes provide in situ measurements of the thermodynamic state over the vertical axis, but the interaction among the atmospheric variables is not instantaneous; thus isolated radiosonde profiles are not sufficient to fully depict the processes involved. Airborne profile observations of radiative properties in the cloudless and cloudy ABL with high vertical and temporal resolution are suited to observing short-term changes of radiative profiles during transitions of atmospheric states. However, these observations become particularly challenging in the harsh Arctic environmental conditions. Nevertheless, in recent years a significant number of data were collected with the help of aircraft (Ehrlich et al., 2019; Wendisch et al., 2019, 2023b; Becker et al., 2023), free-flying balloons (Philipona et al., 2020), and tethered balloons (Lawson et al., 2011; Sikand et al., 2013; Dexheimer et al., 2019; Becker et al., 2020; Inoue et al., 2021). In particular, combined measurements of thermodynamic properties (Egerer et al., 2021), broadband irradiances (Lonardi et al., 2022), turbulence (Egerer et al., 2019, 2023), and aerosol particle properties (Pilz et al., 2022) were obtained with the tethered balloon-borne system BELUGA (Balloon-bornE moduLar Utility for profilinG the lower Atmosphere; Egerer et al., 2019).
In this study, BELUGA profile observations of TIR irradiances and derived parameters (net irradiance and radiative cooling rate) are analyzed to characterize the effect of the atmospheric state and cloud properties on these quantities in the Arctic. Measurements were obtained in summer 2020 during the Multidisciplinary drifting Observatory for the Study of Arctic Climate (MOSAiC) expedition (Shupe et al., 2022) and during autumn 2021 and spring 2022 in Ny-Ålesund, Svalbard. In Sect. 2, the instrumental setup and the methods used to derive vertically resolved profiles of net irradiance and radiative cooling rates are described. The data of all measurement periods are statistically analyzed in Sect. 3, characterizing different atmospheric states. In Sect. 4, radiative transfer simulations are used to quantify the sensitivity of radiative cooling rates to cloud microphysics properties of elevated clouds. The temporal evolution of radiation profiles during the transition from a cloudy state to a cloudless atmosphere is characterized by sequences of balloon profile observations and further used to derive a profile of cloud radiative effect in Sect. 5. Section 6 summarizes the conclusions of this paper.
Measurements in the Arctic lower troposphere were performed at a drifting ice floe during MOSAiC (Shupe et al., 2022) between 29 June–27 July 2020 (hereafter referred to as “summer”) and at the permanent joint German–French AWIPEV (Alfred Wegener Institute for Polar and Marine Research and the French Polar Institute Paul-Émile Victor) research base in Ny-Ålesund, Svalbard, between 24 September–12 November 2021 and between 24 March–12 May 2022 (“autumn” and “spring”, respectively). Figure 1 displays the geographical position of the measurement sites. Although the MOSAiC measurements were obtained while drifting southwards through the Fram Strait, which is almost the same latitude as compared to Ny-Ålesund (79∘ N), the two sites represent different environmental conditions. When BELUGA was deployed in summer 2020, the MOSAiC camp consisted of an ice floe covered with melting snow, surrounded by an increasing fraction of melt ponds and open water. Shupe et al. (2022, Fig. 3) visually display the balloon site in this environment. The Ny-Ålesund ground site was located next to a small settlement close to the generally ice-free Kongsfjord. The fjord is oriented northwest–southeast and is surrounded by plateaus and mountains of about 500–1000 m altitude. Their presence affects the local wind circulation and the advection of air masses (Maturilli and Kayser, 2017; Gierens et al., 2020; Schön et al., 2022).
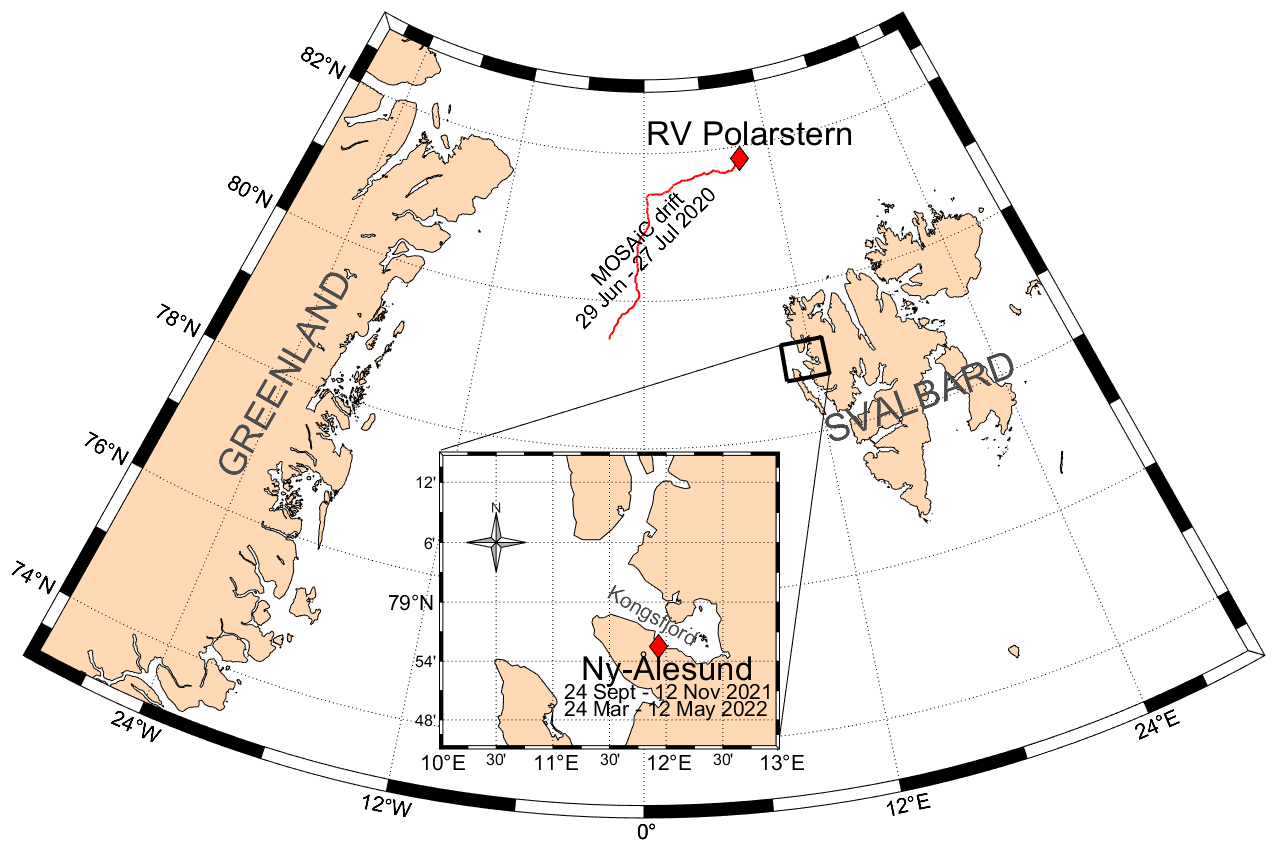
Figure 1Drift track of the MOSAiC ice camp in summer 2020 (red line) and geographical location of Ny-Ålesund. The box displays the location of the measurement site with respect to the fjord.
At both sites, the tethered balloon setup was complemented by a comprehensive observation network suite with near-surface radiation measurements, surface-based remote sensing, and radiosoundings (daily at Ny-Ålesund, 6-hourly at MOSAiC). Shupe et al. (2022) display a detailed overview of the instrumentation deployed at the MOSAiC site, while the Ny-Ålesund measurement setup includes tower measurements (Mazzola et al., 2016), ground-based remote sensing data (Nomokonova et al., 2019), and radiosounding observations (Maturilli et al., 2013). The near-surface radiation data of MOSAiC were obtained by a pair (upward and downward looking) of pyrgeometers (uncertainties of 2.6 and 1 W m−2, respectively) located at 2 m height as part of an atmospheric surface flux station (ASFS) (Cox et al., 2023b). In Ny-Ålesund, the Climate Change Tower (CCT) was equipped with a net radiometer (accuracy 10 %) installed at 33 m height above ground (Mazzola et al., 2016). The Cloudnet algorithm was applied to calculate profiles of cloud properties by combining an ensemble of retrievals from surface-based remote sensing instruments (Illingworth et al., 2007). For MOSAiC, the cloud characterization with Cloudnet was based on a microwave radiometer, a Ka-band cloud radar, and a microwave-length Raman lidar (Engelmann et al., 2023). The LWP uncertainty is 20 g m−2, while for the ice water path (IWP) it is 40 %. The liquid water content (LWC) has an uncertainty of 15 %–20 %, and for the ice water content (IWC) it is between −30 % and 40 % (Lonardi et al., 2022). In Ny-Ålesund, the ground-based remote sensing featured a microwave radiometer, an FMCW-94-SP Doppler cloud radar, and a ceilometer (Nomokonova et al., 2019). Vaisala RS41 radiosondes were used at both sites (Maturilli, 2020; Maturilli et al., 2022).
Tethered balloon measurements were conducted using BELUGA (Egerer et al., 2019) to profile the Arctic lower troposphere. The core measurement setup used during the three deployments is described by Lonardi et al. (2022) and Pilz et al. (2023). During MOSAiC the observations were obtained by continuously profiling the lower troposphere up to 1500 m with an ascent rate of 0.5–1 m s−1, while in Ny-Ålesund the profiles were occasionally stopped at a fixed height for 2 h to allow filter sampling of aerosol particles.
The broadband radiation package (BP) measured upward and downward TIR (4.5–42 µm) and solar (0.3–2.8 µm) broadband irradiances. Due to the absence of solar radiation in autumn and payload limitations during the observations in spring 2022, BP was substituted by a lighter configuration measuring TIR irradiances only. For the analysis of vertical profiles of cooling rates presented here, the solar component is of secondary importance (Turner et al., 2018), even in mid-summer (Lonardi et al., 2022), although it might become relevant when investigating the evaporation of cloud particles at cloud top or cloud–surface albedo interactions. Therefore, we analyze only the TIR irradiances.
Balloon-borne measurements of upward irradiance (F↑) and downward irradiance (F↓) were radiometrically calibrated using the methods introduced by Egerer et al. (2019), Lonardi et al. (2022), and Pilz et al. (2023) and showed agreement with permanent surface observations within the limits of their uncertainties (7 W m−2). To quantify the radiative energy budget at flight altitude z, F↑ and F↓ were used to derive the net irradiance (Fnet) defined by
The vertical divergence of Fnet in an atmospheric layer results in local temperature tendencies (cooling or warming). These temperature tendencies induced by radiation in a layer between two heights zbot and ztop can be quantified by the radiative temperature tendency rate (ζ) using
where ρ is the density of the air and cp is the specific heat capacity of air at constant pressure. While they are referring to the same process, in this paper we will refer to positive values as “heating rates” and negative values as “cooling rates”. The magnitude of ζ depends on the layer thickness over which the convergence or divergence of radiative fluxes occurs. To be consistent, we first interpolated the irradiance profiles to a common vertical grid with a 1 m resolution, and then we calculated the ζ profiles using a layer thickness of 10 m. Such resolution allows for characterizing the temperature tendencies also in the narrow cloud top region.
Measurements were compared to simulations by the plane-parallel radiative transfer model (RTM) DISORT (Stamnes et al., 1988) implemented in the libRadtran 2.0.3 software package (Emde et al., 2016). The gaseous absorption parameterization used in the model was LOWTRAN (Ricchiazzi et al., 1998). Standard aerosol profiles were used following the model by Shettle (1989). The aerosol type below 2 km was set to maritime for all the cases, while the season was modified according to the campaign periods. Temperature and water vapor in the simulations were based on the nearest-in-time radiosonde data complemented in the lower layers by BELUGA observations.
3.1 Classification of atmospheric states
A total of 70 profile observations were collected with BP on BELUGA during the three campaigns. Each balloon ascent was performed up to a maximum height of 1000–1500 m in a time span of about 30–45 min. In summer 2020, 17 profiles were obtained during MOSAiC. In Ny-Ålesund, 36 profiles were obtained in autumn 2021 and 17 profiles were obtained in spring 2022. The atmospheric variables measured during the three investigated periods cover a large fraction of the variability of the Arctic lower troposphere, although cold, stable winter conditions over sea ice are missing.
Table 1Prevailing atmospheric state during the measurement profiles performed in summer (MOSAiC) and during autumn and spring (Ny-Ålesund).
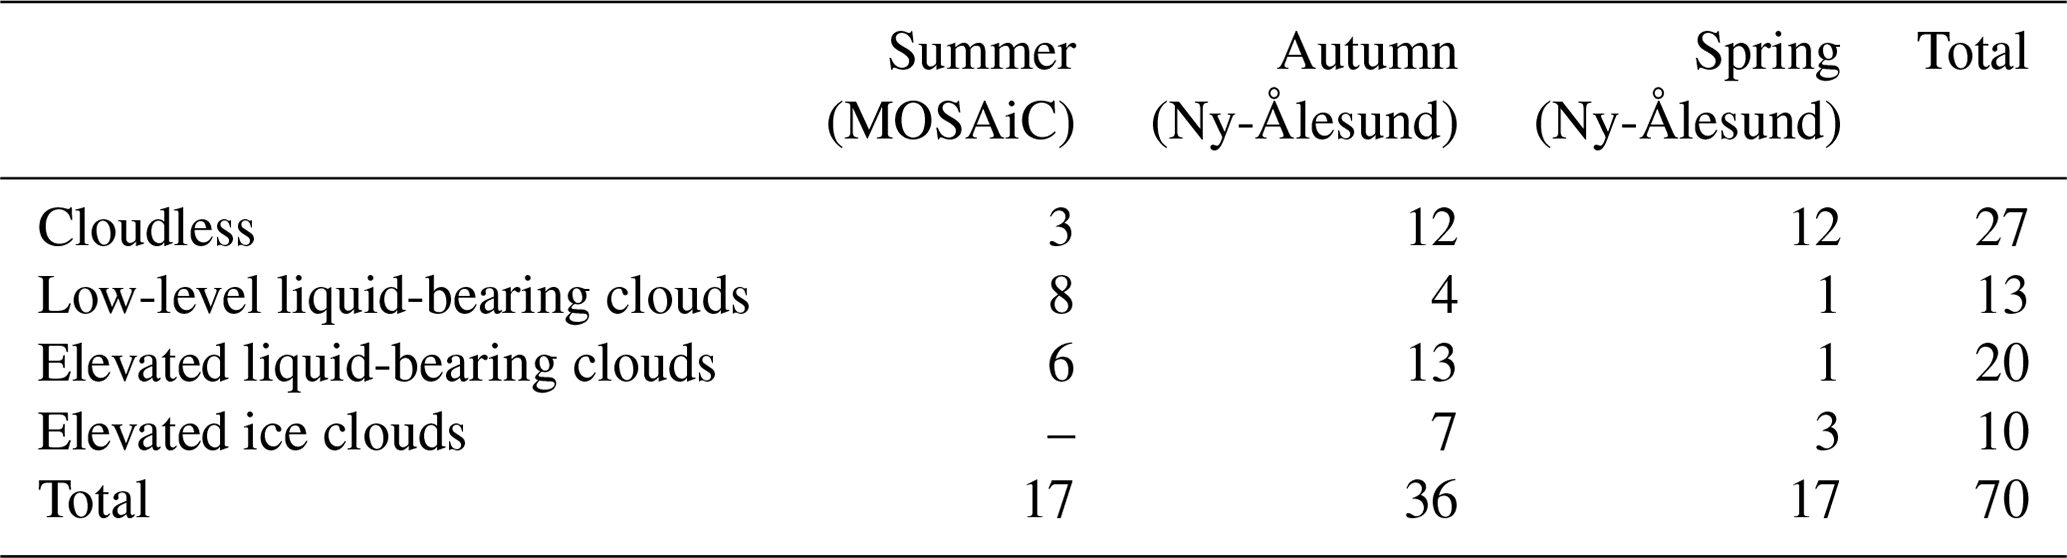
Surface measurements typically indicate two radiative modes: a cloudless state with strongly negative TIR net irradiances and a cloudy state with TIR net irradiances close to 0 W m−2 (Stramler et al., 2011). To characterize the impact of clouds on radiative properties during different atmospheric states or transitions between them, balloon-borne profiles were sorted based on the cloud properties retrieved from the Cloudnet products (Illingworth et al., 2007; Griesche et al., 2020). If a liquid-bearing cloud (LWP ≥ 5 g m−2, with an optical thickness approximately ≥ 1) was the only cloud layer present, and the balloon profiled through cloud top, the case was defined as a “low-level liquid-bearing cloud”. If cloud top was not reached, or if a second cloud was present above, the case was an “elevated liquid-bearing cloud”. If clouds contained ice and had little to no liquid water (LWP < 5 g m−2), the case was classified as an “elevated ice cloud”. In this case, the additional specification on the cloud height comes from the fact that no ice cloud was reached by the balloon measurements. Table 1 summarizes the categories and the relative counts sorted per season.
The Arctic summer atmosphere over the pack ice is typically covered by fog and/or low-level clouds, mostly in the form of mixed-phase clouds (Curry et al., 1996; Shupe, 2011; Tjernström et al., 2012; Brooks et al., 2017). Rinke et al. (2021) showed that summer 2020 was unusually warm at the MOSAiC site, resulting in a lower share of mixed-phase clouds in favor of purely liquid water clouds. Within the BELUGA operations in summer 2020, low-level clouds frequently occurred alone (eight cases) or were capped by an additional cloud layer (elevated liquid-bearing cloud, six cases), while only three cases were cloudless. A statistical analysis conducted by Nomokonova et al. (2019) showed that Ny-Ålesund is generally characterized by the presence of clouds throughout the entire year (81 %). In autumn the vertical frequency distribution of hydrometeors is typically centered around a maximum at about 1 km height, while clouds at lower altitudes are less frequent, as the topography prevents the advection of low maritime clouds into the valley (Maturilli and Kayser, 2017). This height is close to the ceiling height for tethered balloon profiles; thus it was expected that BELUGA measurements would often stop below cloud top. Due to the not-sampled cloud top, the corresponding radiative cooling profiles do not show the cloud top cooling and are thus classified as elevated cloud cases. BELUGA data in autumn 2021 consistently showed a larger number of elevated clouds (13 cases) compared to low-level clouds (4 cases). Several cloudless scenarios (12 cases) occurred in autumn, and they were the dominant state (12 cases) sampled in spring, partially in agreement with an increased share of cloudless scenarios in spring reported by Nomokonova et al. (2019).
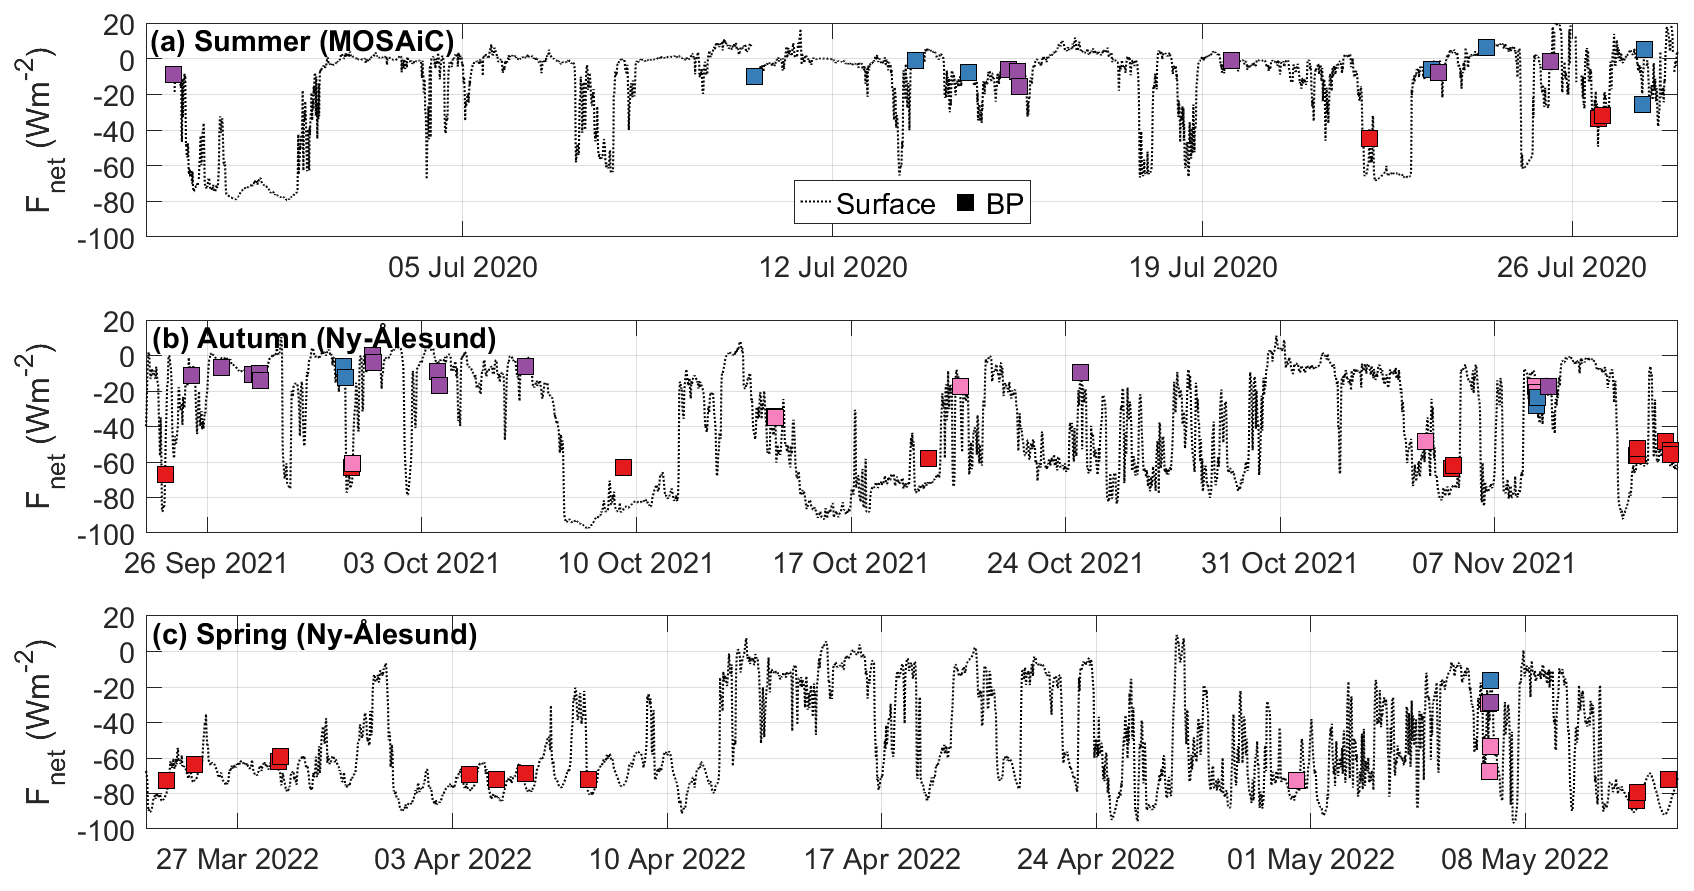
Figure 2TIR net irradiances in summer (a), autumn (b), and spring (c). Time series (dotted lines) show 2 m observations by the ASFS at the MOSAiC ice floe and 33 m observations by the CCT in Ny-Ålesund. Balloon in situ measurements at 33 m (squares) during ascents are color-coded to indicate the atmospheric state: cloudless (red), low-level liquid-bearing clouds (blue), elevated liquid-bearing clouds (purple), and elevated ice clouds (pink). Note that the three time periods have different lengths.
Figure 2 displays the time series of TIR net irradiances measured at the atmospheric surface flux station (ASFS; 2 m; Cox et al., 2023a) and at the Climate Change Tower (CCT; 33 m) during the deployment periods at the MOSAiC ice floe and in Ny-Ålesund, respectively. Tethered balloon profiles are characterized by BP measurements close to the surface (33 m at both sites) and are color-coded following the atmospheric state. This height was selected to neglect possible surface disturbances caused by the operations at the balloon site. Due to logistical and meteorological limitations in the operation of BELUGA (surface wind needs to be below 5 m s−1), observations are not equally distributed over the campaign period. Except for the first days of July 2020, liquid-bearing clouds were almost continuously observed by Cloudnet at the MOSAiC ice floe site, as indicated by small values of TIR net irradiances (Fig. 2a). In Ny-Ålesund, the first weeks of autumn 2021 were characterized by liquid-bearing elevated or multilayer clouds, while later on ice-only clouds and cloudless regimes prevailed (Fig. 2b). Early spring 2022 was typically cloudless, with clouds frequently appearing only after mid-April (Fig. 2c). In general, frontal passages, characterized by cloud cover, were not sampled with BELUGA due to the strong winds associated with the synoptic activity.
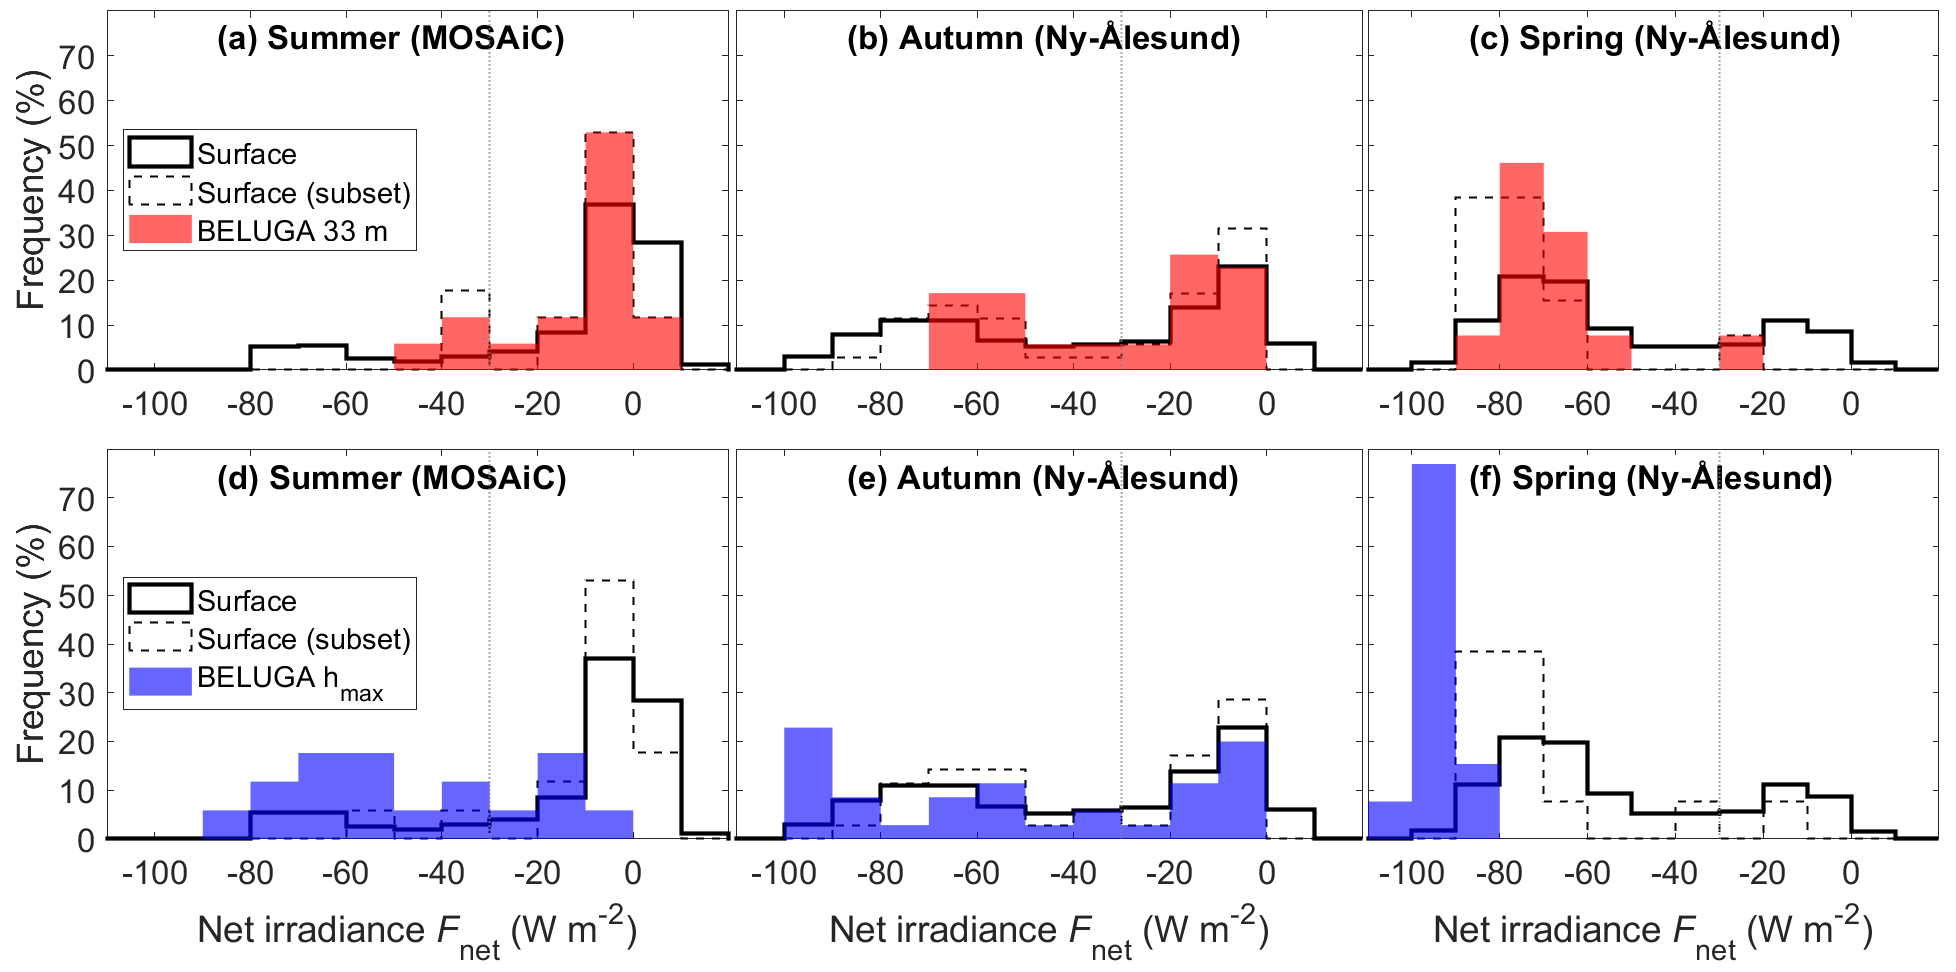
Figure 3Frequency of TIR net irradiances near the surface (a–c) and at maximum height (d–f) during the balloon deployments in summer, autumn, and spring. Each balloon profile was sampled only once per level (once at 33 m and once at the maximum height level), and the time-corresponding data point of the time series was used to obtain the subset of the surface distribution. Surface distributions were derived from the time series from surface-based systems (ASFS for MOSAiC, CCT for Ny-Ålesund) displayed in Fig. 2. The separation between cloudless and cloudy cases is indicated by a dotted gray line.
To quantify how representative the BELUGA profiles were of the entire campaign conditions, the frequency distributions of near-surface TIR net irradiances of the entire campaign periods and the BELUGA flights are displayed in Fig. 3. Based on the distribution of near-surface observations in Fig. 2, a threshold of Fnet equal to −30 W m−2 is defined to distinguish between “cloudless” (less than −30 W m−2) and “cloudy” (larger than or equal to −30 W m−2) cases. In cloudless conditions, a strongly negative TIR radiative budget is observed. In cloudy cases, the presence of one or multiple liquid-bearing clouds increases the F↓, resulting in net irradiances close to 0 W m−2. During all three deployment periods, the bimodal distribution associated with cloudless or cloudy conditions (Shupe and Intrieri, 2004; Stramler et al., 2011; Wendisch et al., 2019, 2023b; Solomon et al., 2023) was present at the surface, although significant differences in the strength of the two modes are observed.
There is a general match between the distribution of irradiances for the BELUGA near-surface measurements (red bars in Fig. 3a–c) and the surface measurements at the same times (dashed bars in Fig. 3a–c). However, the time periods of the BELUGA observations are only partially representative of the overall distribution of conditions (black bars in Fig. 3a–c). Surface measurements in summer displayed a scarcity of cloudless cases in favor of cloudy periods (Fig. 3a). BELUGA observation periods captured the cloudy cases of the period but largely missed the cloudless component due to intermittent sampling. Ground measurements in autumn and spring indicated a more evenly distributed frequency between the two modes, with the cloudy mode being still dominant during autumn (Fig. 3b) and the cloudless mode prevailing in spring (Fig. 3c). BELUGA profiles in autumn generally followed the seasonal distribution, while in spring the profiles were obtained more frequently during cloudless conditions. The differences in net irradiances in cloudless atmospheres in Ny-Ålesund in comparison to the summer are caused by the temperature differences between seasons. The temperature variations affected both the downward irradiance emitted by the atmosphere and the upward irradiance emitted by the surface. In cloudy cases, net irradiances at the surface were typically negative in all seasons. However, for some cases at MOSAiC, the TIR net irradiance was directed toward the surface, indicating the advection of clouds that were warmer than the melting ice surface (locked at 0 ∘C).
The distribution of surface measurements did not vary significantly during the balloon ascents (dashed bars in Fig. 3d–f), while the distribution observed at the top of BELUGA profiles (blue bars in Fig. 3d–e) was different due to the vertical variation in the cloud cover. The occurrence of strongly negative irradiances at maximum height indicates that the cloudy atmospheres profiled at MOSAiC often featured single layers of low-level liquid-bearing clouds (Fig. 3d). Therefore, above the cloud, Fnet has the values of a cloudless state. BELUGA observations at maximum height in autumn largely represent the same atmospheric state (cloudy vs. cloudless; Fig. 3e), indicating that generally the cloud cover consisted of elevated clouds. However, a decrease in the number of cloudy cases in favor of cloudless ones indicates that some of the observations in cloudy scenarios reached above the cloud layer, suggesting that these cases featured a low-level cloud. The cloud case observed in spring (Fig. 3f) was characterized by an elevated ice cloud; therefore the net irradiance decreased with height and at the top of the profile could be interpreted as a cloudless case.
3.2 Net irradiance profiles
Figure 4 summarizes all observations of Fnet profiles obtained in the three campaign periods. The profiles were classified according to the atmospheric states introduced in Sect. 2. Cloudless profiles (red lines in Fig. 4) exhibit a steady decrease in Fnet with height at a rate of about −2.5 W m−2 over 100 m altitude in spring and −3 W m−2 over 100 m altitude in autumn. Overall, the vertical gradient is a result of the temperature profiles, where colder higher layers emit less downward irradiance than the warmer low layers emit upward (following the Stefan–Boltzmann law). At low altitudes, the surface dominates due to its higher emissivity compared to the atmosphere, resulting in a decreasing Fnet despite the presence of temperature inversions. Fnet in the presence of elevated ice clouds (pink lines in Fig. 4) shows fewer negative values due to additional emission of downward irradiance by the cloud, which is located in atmospheric layers with cold temperatures, but has a higher emissivity than the atmosphere alone. However, the vertical decrease in Fnet has a rate on the order of −2 W m−2 over 100 m altitude, which is similar to a cloudless case.
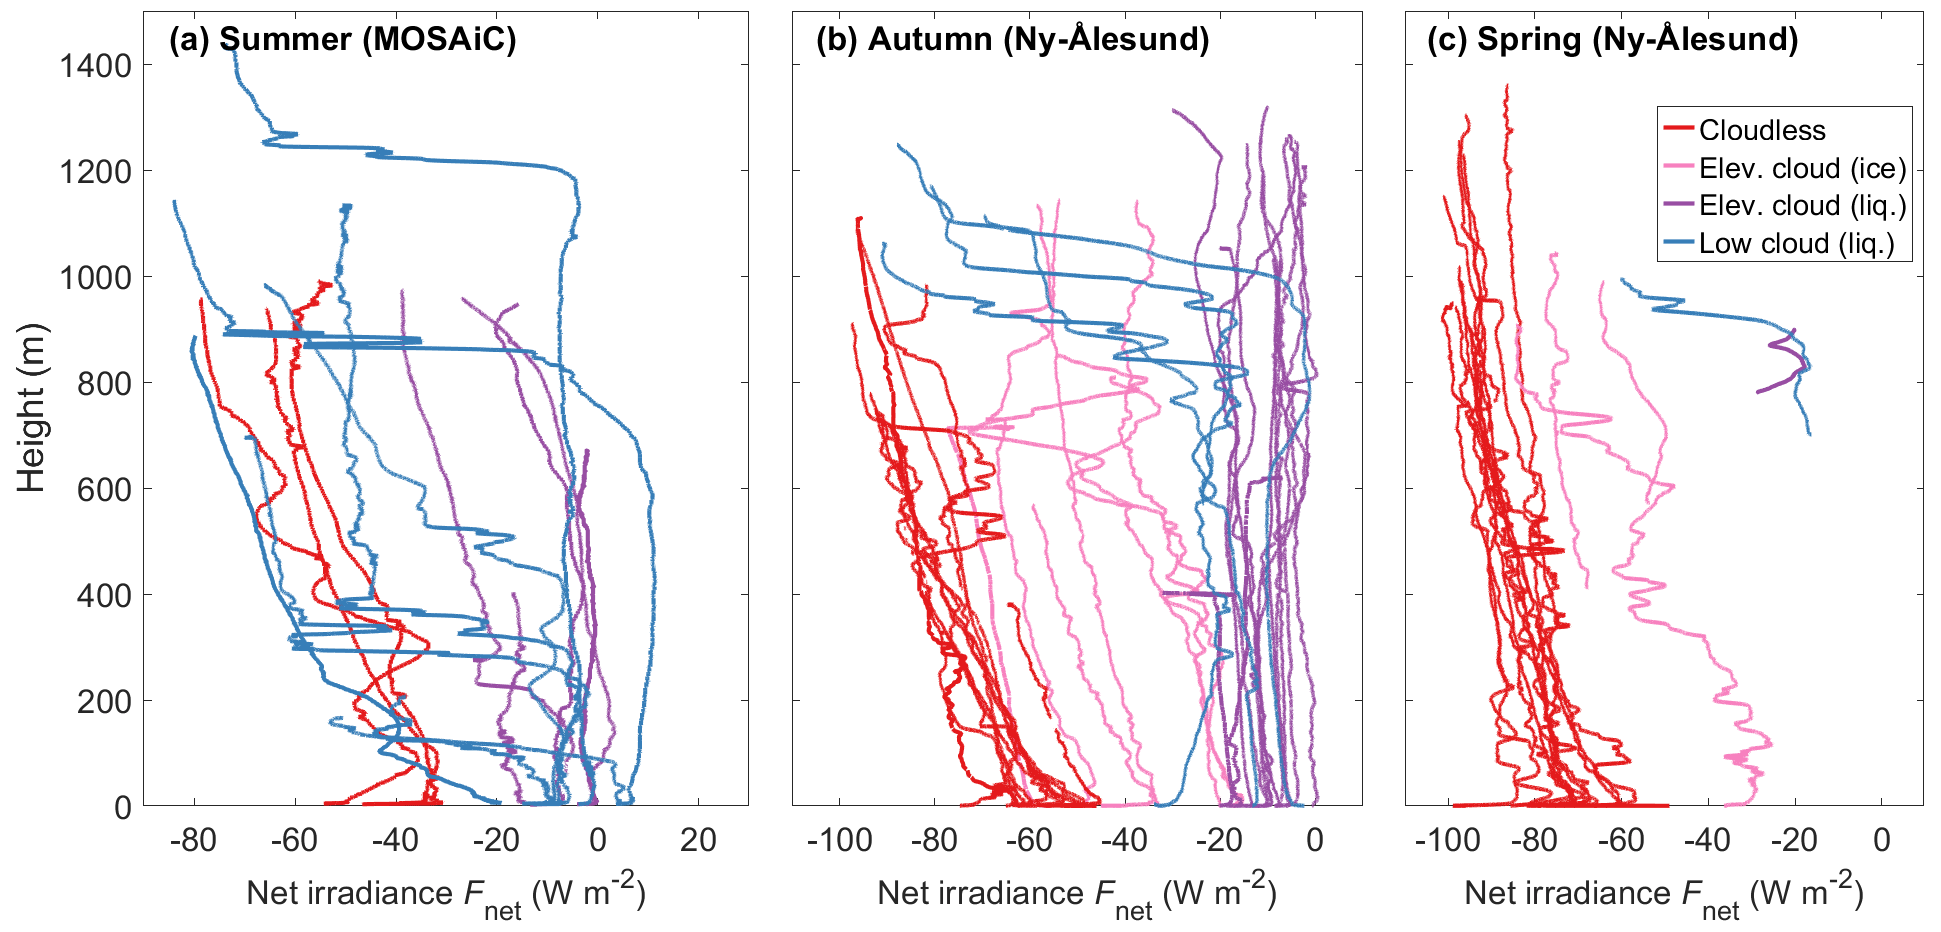
Figure 4Observed profiles of net irradiance in (a) summer, (b) autumn, and (c) spring. The color-coding indicates the classification of the atmospheric states: cloudless (red), low-level liquid-bearing clouds (blue), elevated liquid-bearing clouds (purple), and elevated ice clouds (pink). The calculated uncertainty of each data point is ±7 W m−2.
The net irradiance beneath low-level (blue lines in Fig. 4) and elevated liquid-bearing clouds (purple lines in Fig. 4) is rather vertically constant, with an average Fnet of about −10 W m−2. In these states, the downward emission of the cloud has a similar magnitude to the upward emission by the surface, resulting in an almost balanced TIR radiative energy budget. This holds especially for clouds with a low base height, as frequently observed during MOSAiC. Profiles that exceed the cloud top of low-level clouds exhibit a sharp decrease in Fnet at cloud top. This feature describes the vertical transition from the cloudy state to the cloudless state. At Ny-Ålesund (Fig. 4b, c), only clouds with cloud top higher than 800 m were observed, partially due to the local topography blocking advected clouds. During MOSAiC (Fig. 4a), the cloud thickness and cloud top altitude were more variable; thus the transitions from cloudy to cloudless state were observed at different altitudes. The clouds with different cloud top altitudes observed during MOSAiC also illustrate that the strength of the decrease in Fnet at cloud top depends on cloud top altitude. Given the different slopes of Fnet profiles in cloudless and cloudy conditions, the spread between both states increases with altitude. This spread is reflected in the transition at cloud top and enhances cloud top cooling: given a fixed temperature profile and identical cloud microphysical properties, higher cloud tops will cause stronger cloud top cooling.
3.3 Radiative cooling rate profiles
For each measured profile of Fnet, radiative cooling rates were calculated based on Eq. (2). The radiative cooling rates were then averaged for each atmospheric state and season. To ensure sufficient statistical significance, the averages shown in Fig. 5 were calculated only when at least six profile observations were available at the corresponding altitude. In general, radiative cooling rates between −4 and −1 K d−1 are expected for cloudless cases throughout all latitudes (Suomi et al., 1958; Asano et al., 2004; McFarlane et al., 2007; Thorsen et al., 2013; Cesana et al., 2019), while simulations for an Arctic site indicate weak values of about −1 K d−1 (Turner et al., 2018). Cloudless profiles obtained in Ny-Ålesund during spring (Fig. 5a) and autumn (Fig. 5b) show on average a radiative cooling rate between −3 and −1 K d−1. Close to the surface, spring measurements have a marked signal up to −9 K d−1. Conversely, up to about 500 m height, measurements in autumn indicate slightly higher cooling rates (−3 K d−1) compared to spring (−2 K d−1). Further up, radiative cooling is still present, but the signal becomes more variable due to the thermodynamic profiles of the air masses advected above the surrounding topography.
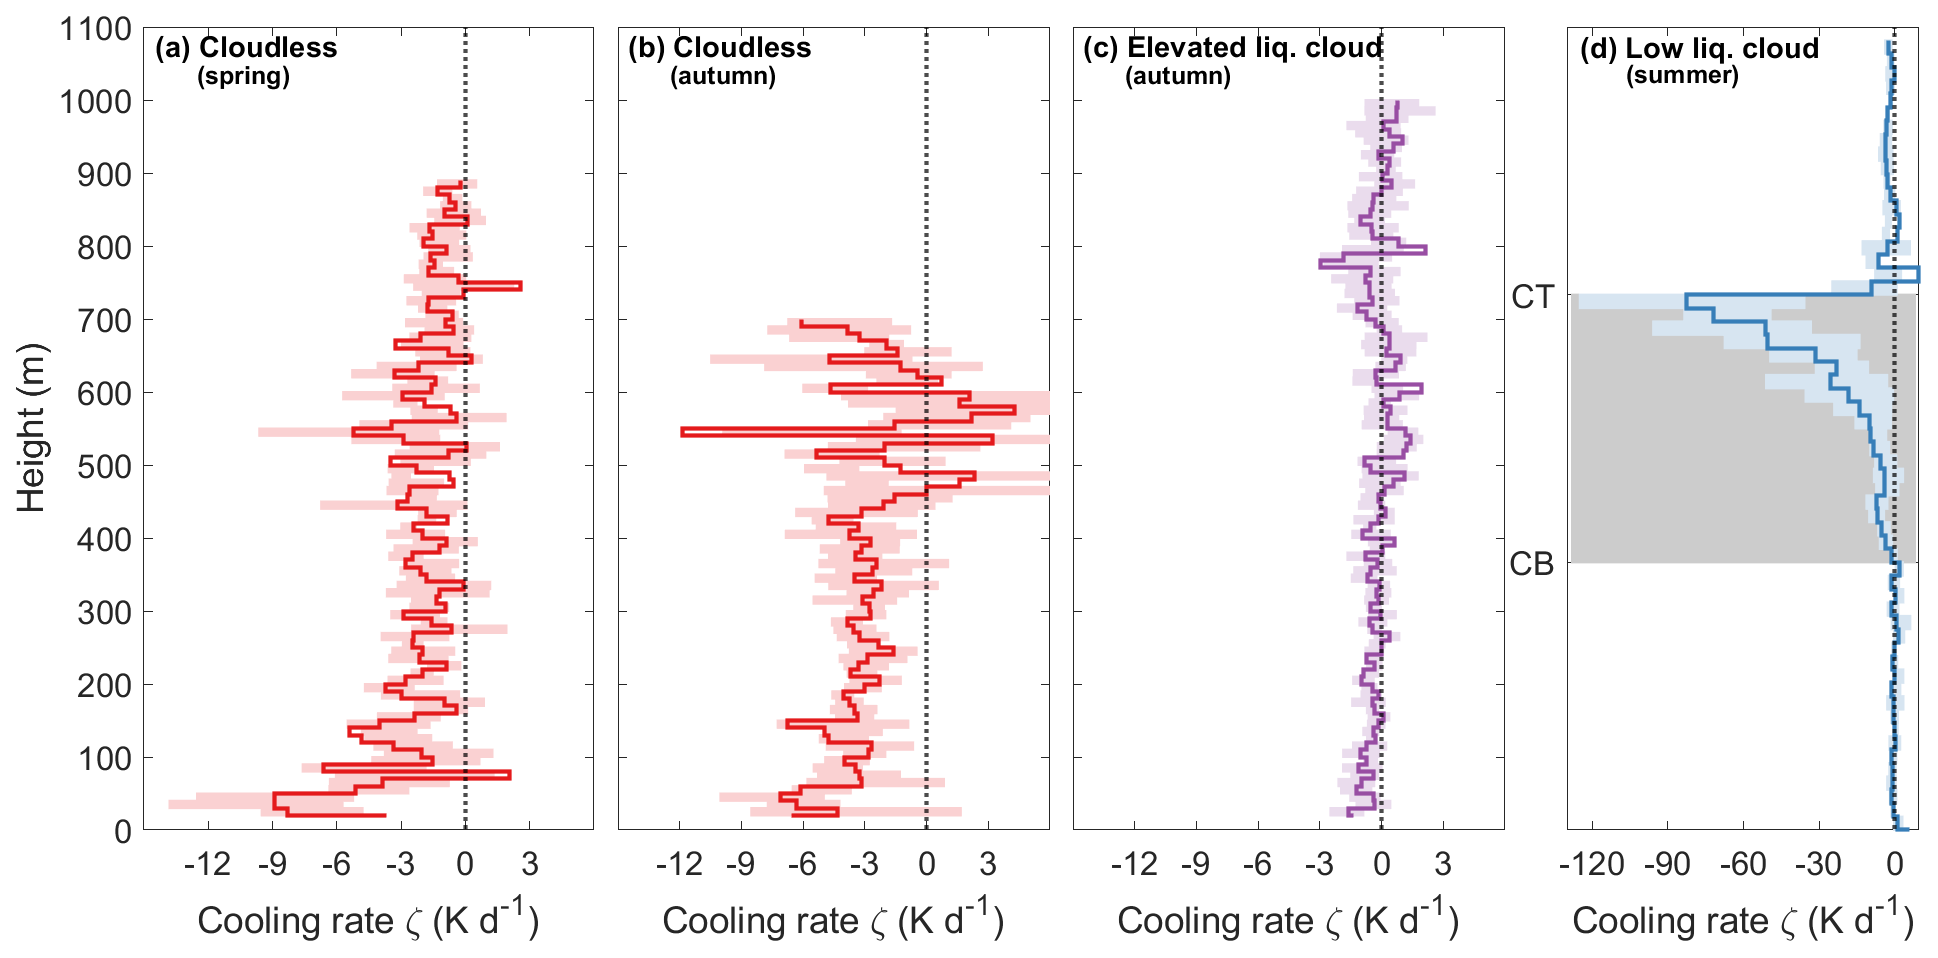
Figure 5Profiles of TIR cooling rates during different atmospheric states: (a) cloudless in spring, (b) cloudless in autumn, (c) under elevated liquid-bearing clouds in autumn, and (d) through a vertically normalized low-level liquid-bearing cloud in summer (note also the different scale on the x axis for this case). Average values are displayed as solid lines, and the values between the 25th and the 75th percentile are represented by a colored area. The calculated uncertainty of each data point is ± 5 K d−1. In (d), cloud boundaries are indicated by gray shading.
The radiative cooling rate profile measured beneath elevated liquid-bearing clouds (Fig. 5c) shows weak oscillations typically below ± 1 K d−1 centered on the zero line. This case corresponds to the radiative equilibrium where surface and cloud base emit a similar amount of radiation, as previously shown for similar cloud conditions on sea ice (Egerer et al., 2019) and in Ny-Ålesund (Becker et al., 2020). The average profile obtained through low-level water-bearing clouds in summer shows the radiative cooling rates below, in, and above a vertically normalized cloud (Fig. 5d). Profiling through the cloud layers obviously combines the cloudy and cloudless features; thus weak cooling rates of −2 K d−1 are observed above the cloud and there is little to no cooling underneath it, while strong cooling rates up to −80 K d−1 are present at cloud top. Similar profiles for Arctic low-level clouds were simulated by Turner et al. (2018) and agree with other in situ observations (Egerer et al., 2019; Becker et al., 2020).
3.4 Adjusting measured and simulated radiative profiles
Radiative transfer simulations were performed to quantify the influence of liquid water path (LWP) and droplet number concentration (Nd) on the radiative cooling rates of low-level liquid-bearing clouds. An in situ profile obtained on 13 July 2020 is compared to RTMs initialized to represent the observed cloud. During the profile, the LWP retrieved by Cloudnet varied between 18–49 g m−2, with an average of 27 g m−2. A droplet number concentration of 70 cm−3 was estimated from the difference of the aerosol particle concentration below and within the cloud, assuming that this is the fraction of activated particles. Cloudnet indicated a cloud between 1040–1260 m. For the simulations, the LWP was varied between 10–120 g m−2. The corresponding profiles of liquid water content (LWC) were derived by vertically distributing the liquid water path maintaining the adiabatic LWC assumption used in Cloudnet. The Nd was varied between 20–120 cm−3. The profile of the droplet effective radius (Reff) of the cloud was then calculated using
where ρw is the density of liquid water and LWC(z) is the liquid water content for the layer at height z. The parameter k converts the effective droplet radius into the volumetric droplet radius and was set to 0.8, which is representative of stratocumulus (Brenguier et al., 2011).
Figure 6 compares the measured profiles with the simulated profiles of Fnet and cooling rates for five different LWPs. The simulations show that below the cloud the emission of TIR radiation is quickly saturated with LWP exceeding 30 g m−2 (Fig. 6a), consistent with the findings of Shupe and Intrieri (2004), while weak changes of in-cloud Fnet also occur at larger values of LWP (Fig. 6c). For thin clouds (LWP below 30 g m−2), an increase in the LWP increases F↓ at cloud base. This increase offsets the Fnet by a constant amount at all the heights in the layer between surface and cloud base. Due to the constant offset, the slope of Fnet remains unchanged and no significant variations in the radiative cooling rate occur. This offset in Fnet becomes smaller as the LWP increases. Simulated values are about 12 W m−2 for LWP increasing from 10 to 20 g m−2 and about 4 W m−2 when increasing from 20 to 30 g m−2 (Fig. 6b). In the central layers of the cloud it is still possible to discern a Fnet offset due to the increase in the LWP even beyond the 30 g m−2 threshold value, while the Fnet at cloud top is fixed due to its dependency on the temperature. The overall result is an increased slope for the Fnet profile in the cloud top region (Fig. 6c), which causes a marked increase in the cloud top cooling rate (Fig. 6d). For the explored values, a variation in Nd at a fixed LWP (shaded areas in Fig. 6) can change the net irradiance in and below the cloud. The effect is stronger below optically thin clouds, with variations up to 7 W m−2 at 10 g m−2, and becomes weaker with increasing LWPs (up to 4 W m−2 at 30 g m−2 and up to 0.5 W m−2 at 120 g m−2) (Fig. 6a). The net irradiance offset decreases less markedly inside the cloud (Fig. 6c), and the Fnet variability then influences the radiative cooling rates (Fig. 6d).
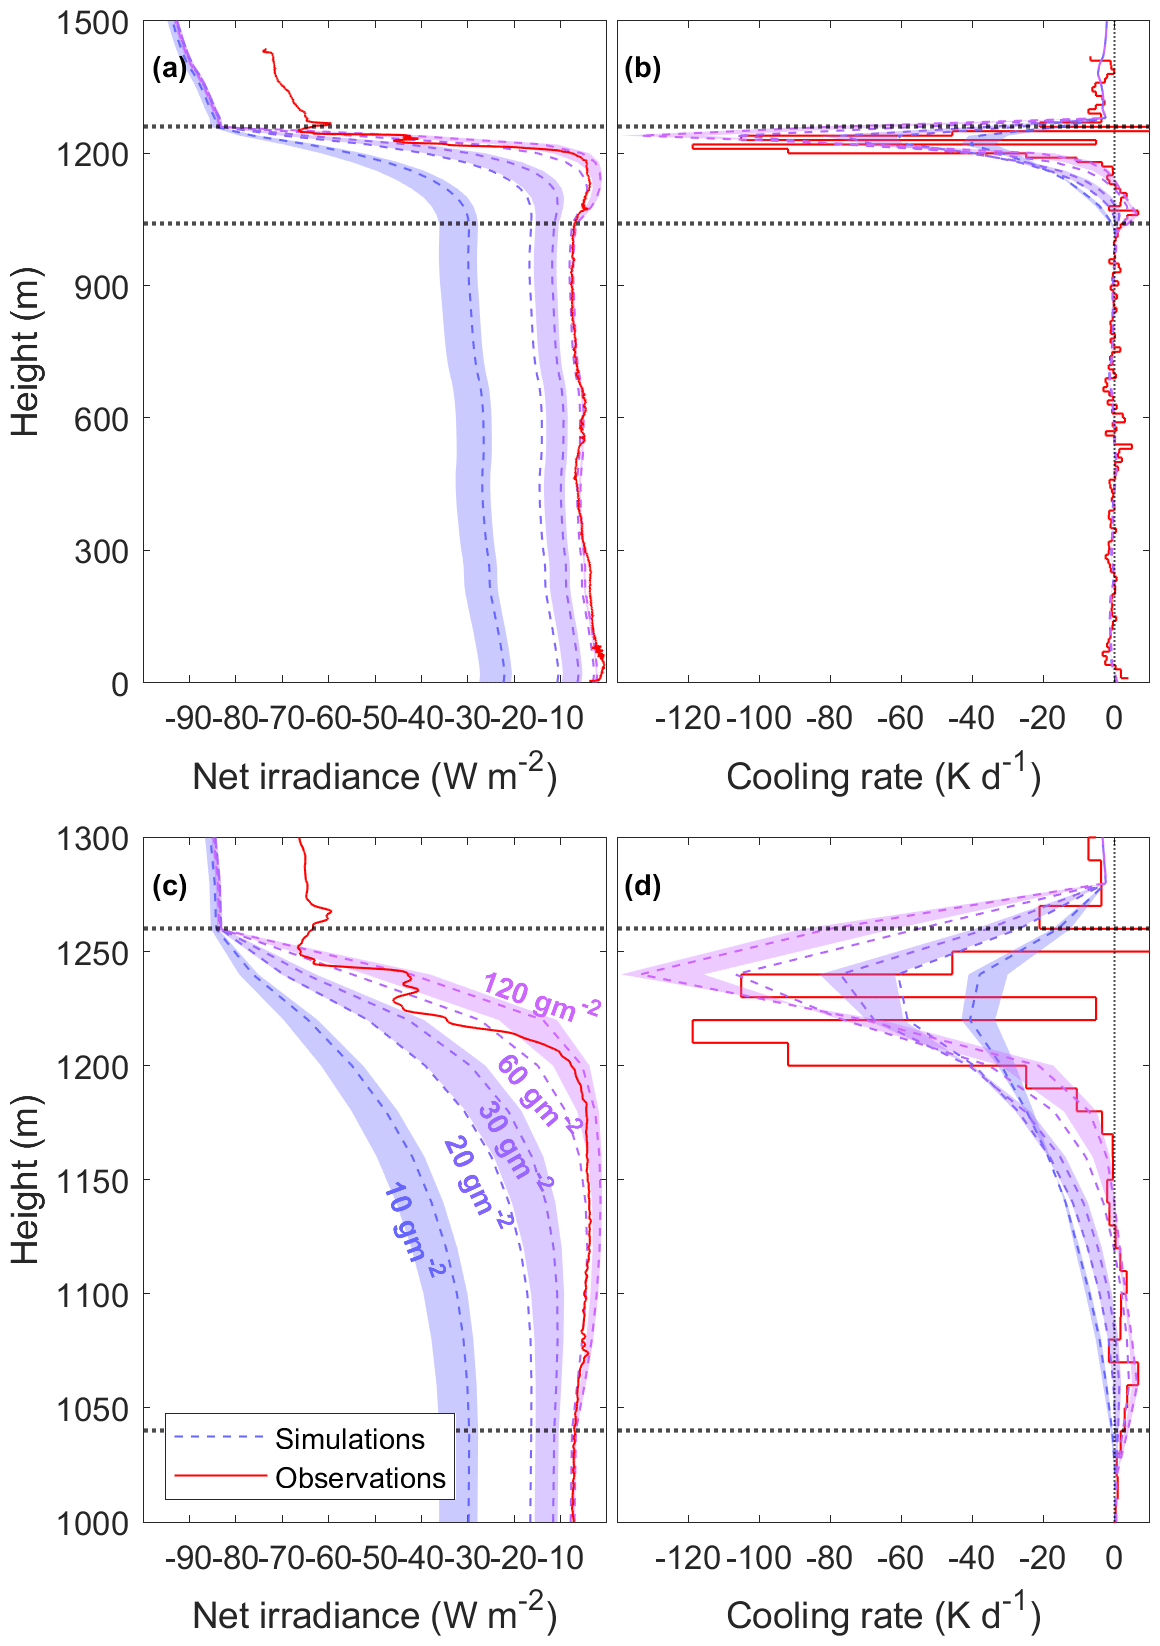
Figure 6Simulated TIR profiles for a single-layer low-level cloud with different LWP and a fixed Nd of 70 m−3 (dashed curves). (a) Net irradiance profiles in the lower troposphere, (b) radiative cooling rate profiles in the lower troposphere, (c) net irradiance profiles focusing on the cloud layer, and (d) radiative cooling rate profiles focusing on the cloud layer. For LWPs of 10, 30, and 120 g m−2, additional profiles obtained by varying Nd between 20–120 m−3 are displayed as shaded areas. Balloon in situ measurements are displayed in red. Cloud boundaries are represented by horizontal dotted lines.
While the maximum radiative cooling plays an instantaneous crucial role in driving the entrainment at cloud top, the radiative cooling of the entire cloud layer (“integrated cloud radiative cooling”) characterizes the long-term temperature tendency of the cloudy air mass. The integrated cloud radiative cooling of the cloud layer is calculated by the sum of all the in-cloud radiative cooling rates divided by the cloud thickness. However, it has to be noted that other terms would significantly impact this temperature tendency (solar radiative warming, phase change, advection, and turbulence).
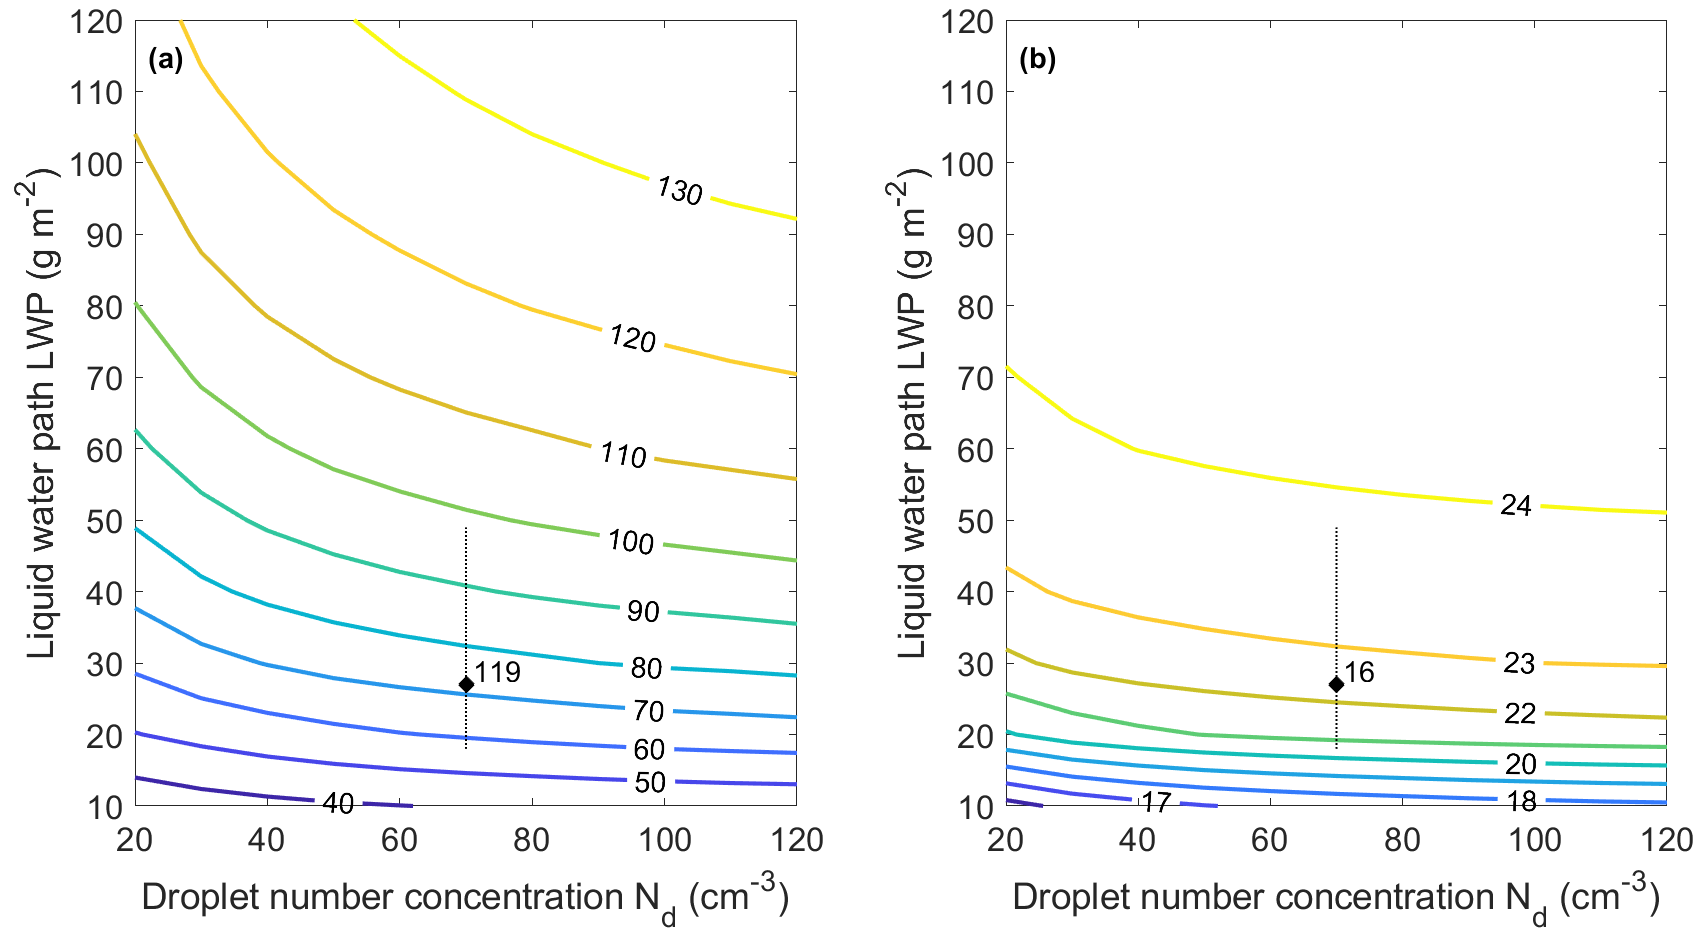
Figure 7Contour plots of (a) cloud top radiative cooling (K d−1) and (b) integrated cloud radiative cooling (K d−1) with varying liquid water path and droplet number concentrations. The black dots indicate the observed radiative cooling rates, and the vertical dotted line indicates LWP variability during the profile.
The maximum radiative cooling rates at cloud top and the integrated cloud radiative cooling are calculated in Fig. 7. Cloud top radiative cooling between −43 and −33 K d−1 is present even with limited amounts of liquid water (Fig. 7a). The magnitude of the radiative cooling increases with the LWP, but for optically thick clouds (LWP larger than 30 g m−2) an increase in the available water is not as effective as for thin clouds, and the Nd becomes gradually more important. The integrated cloud radiative cooling is driven almost exclusively by the LWP (Fig. 7b). This occurs since the enhanced cooling provided at cloud top by larger Nd is balanced by reduced cooling in the middle and lower layers of the cloud (Fig. 6d), in agreement with the simulations by Williams and Igel (2021).
Elevated clouds affect the radiation profiles in the lower troposphere, as shown by the observations in both of the case studies examined here. This effect strongly depends on the optical depth of the elevated cloud. While ice clouds (Sect. 4.2) do not significantly reduce the cloud top cooling of lower clouds, liquid clouds can completely eliminate it (Sect. 4.1). To systematically investigate how the elevated clouds change the radiative cooling rate profiles, radiative transfer simulations are used.
4.1 Liquid-bearing cloud
Figure 8 displays simulations based on the cloud layers observed on 23 July 2020 at 11:28 UTC. Cloudnet retrievals indicate a total LWP of 38–72 g m−2. This is the sum of the LWP of the upper cloud (altitude between 3000–3200 m) and of the lower cloud (altitude between 190–330 m). We ran RTM simulations varying the total liquid water path (LWPtot) between 20–100 g m−2 (in steps of 10 g m−2) and distributed it differently between the elevated and the low-level cloud layer (LWPelev and LWPlow, respectively). Leaitch et al. (2016) observed Nd between 30–100 cm−3 in Arctic clouds, and, following the good agreement obtained in Sect. 3.4, we set Nd to 70 cm−3 as a realistic assumption for the droplet number concentration. The best match with the observed Fnet profile was derived for simulations with LWPelev equal to 20 g m−2 and LWPlow equal to 20 g m−2. This is consistent with the limited Cloudnet retrievals including both the clouds, which indicated a LWP of around 26 g m−2 in the elevated cloud and about 16 g m−2 in the low-level cloud.
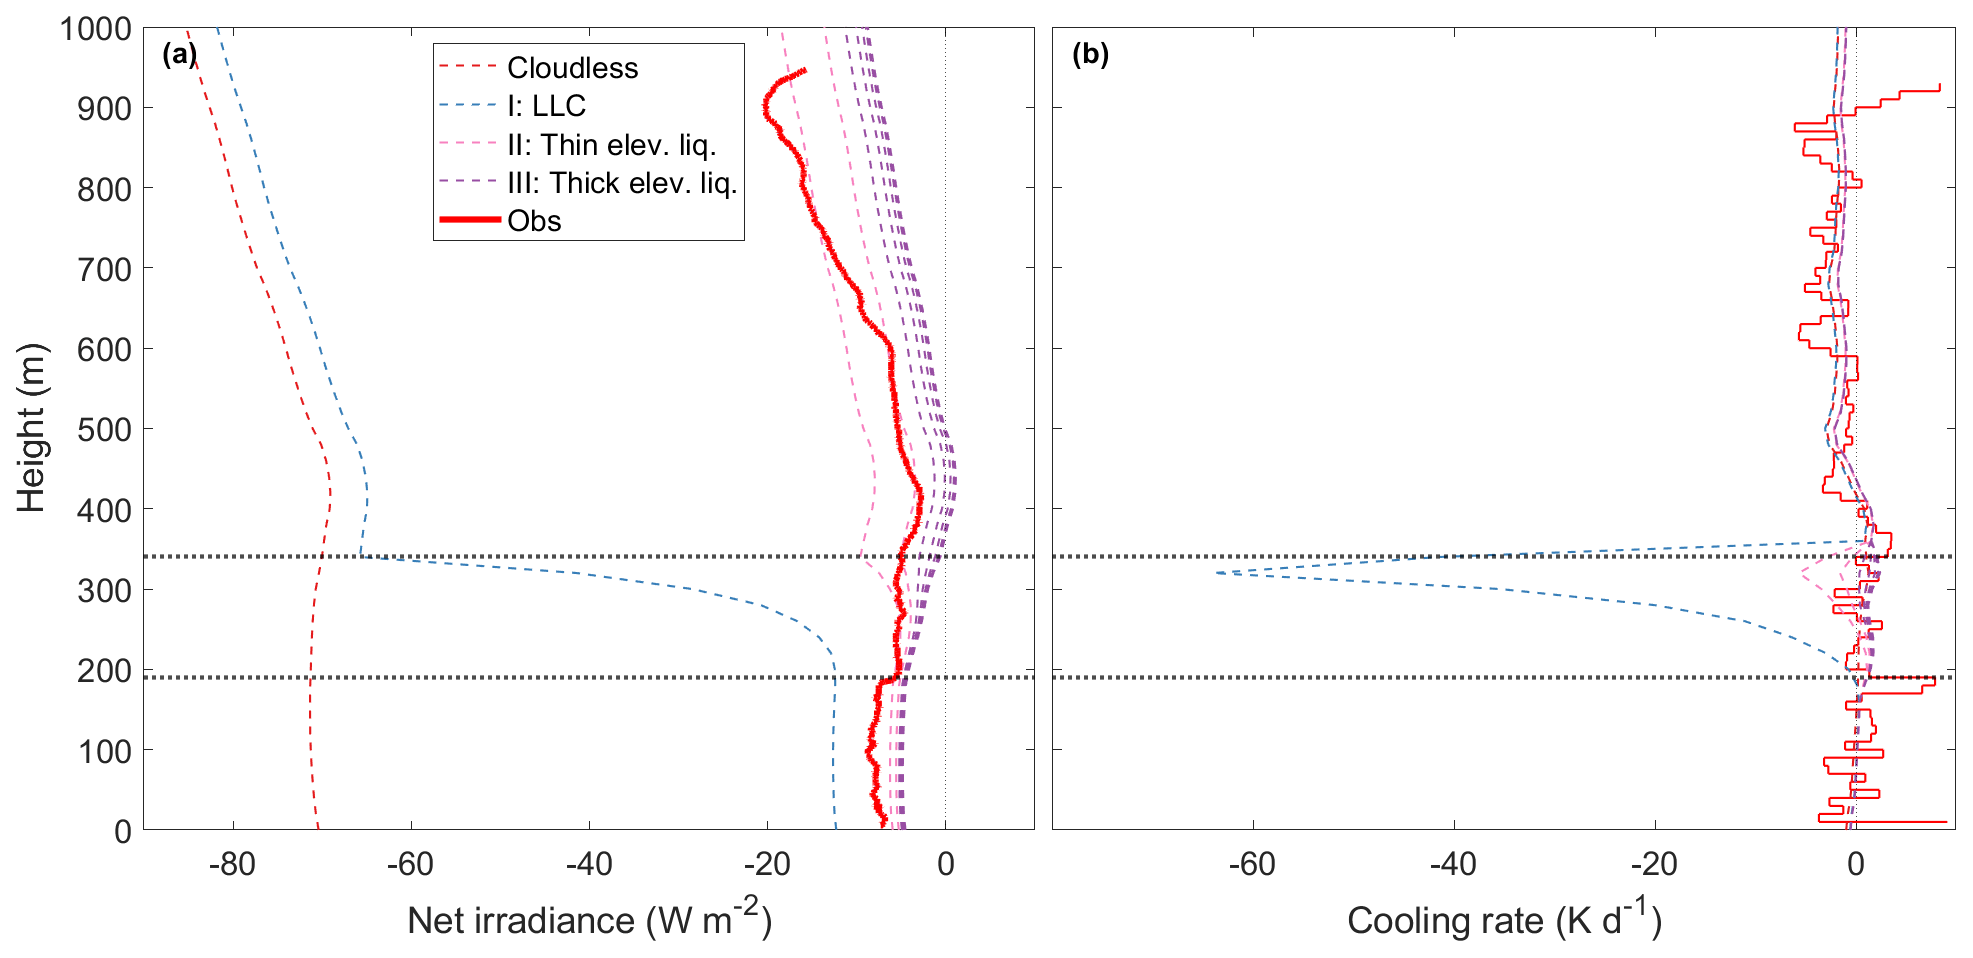
Figure 8Profiles of (a) net irradiance and (b) radiative cooling rates for a liquid-bearing low-level cloud capped by an elevated liquid-bearing cloud. A cloudless simulation is represented in dashed red, a simulation with only the low-level cloud (LWP equal to 20 g m−2) is represented in dashed blue, each dashed pink/purple line represents a simulation after increasing the LWP of the upper cloud by 10 g m−2, and observed values are shown in solid red. Cloud boundaries are represented by horizontal dotted lines.
Three states (I–III) emerge for the radiative cooling rates in the low-level cloud. (I) In the control case the lower cloud contains all the available liquid water and therefore behaves as a single-layer cloud (blue line in Fig. 8), with a cloud top radiative cooling rate of −64 K d−1. The net irradiance profile above the cloud follows the cloudless profile (solid red line in Fig. 8) with a small offset due to the higher surface emission compared to the cloud top emission with lower temperature. Therefore, a radiative cooling rate of −2 K d−1 is derived. (II) When the elevated cloud is optically thin (LWPelev < 30 g m−2, pink lines in Fig. 8), the net irradiance above the low-level cloud is significantly reduced, resulting in cloud top radiative cooling of −6 K d−1 (−2 K d−1) when the upper cloud has a liquid water path of 10 g m−2 (20 g m−2). (III) In cases where the elevated cloud is optically thick (LWPelev ≥ 30 g m−2, purple lines in Fig. 8), the radiative signature of the low-level cloud disappears almost completely. As a result, cloud top cooling of the low cloud is completely removed (0 K d−1), as described by Turner et al. (2018). Thus, the vertical partitioning of LWP in multilayer cloud situations is very important for the processes impacting the maintenance of all cloud layers.
4.2 Ice cloud
Remote sensing retrievals on 30 September 2021 at Ny-Ålesund intermittently showed an ice cloud located between 7400–9000 m, with a maximum ice water path (IWP) of 20 g m−2. We ran RTM simulations varying the IWP between 0–20 g m−2. The ice cloud was investigated for both a cloudy and a cloudless ABL, as displayed in Fig. 9. The effective radius of the ice particles was fixed at 30 µm following Cloudnet products.
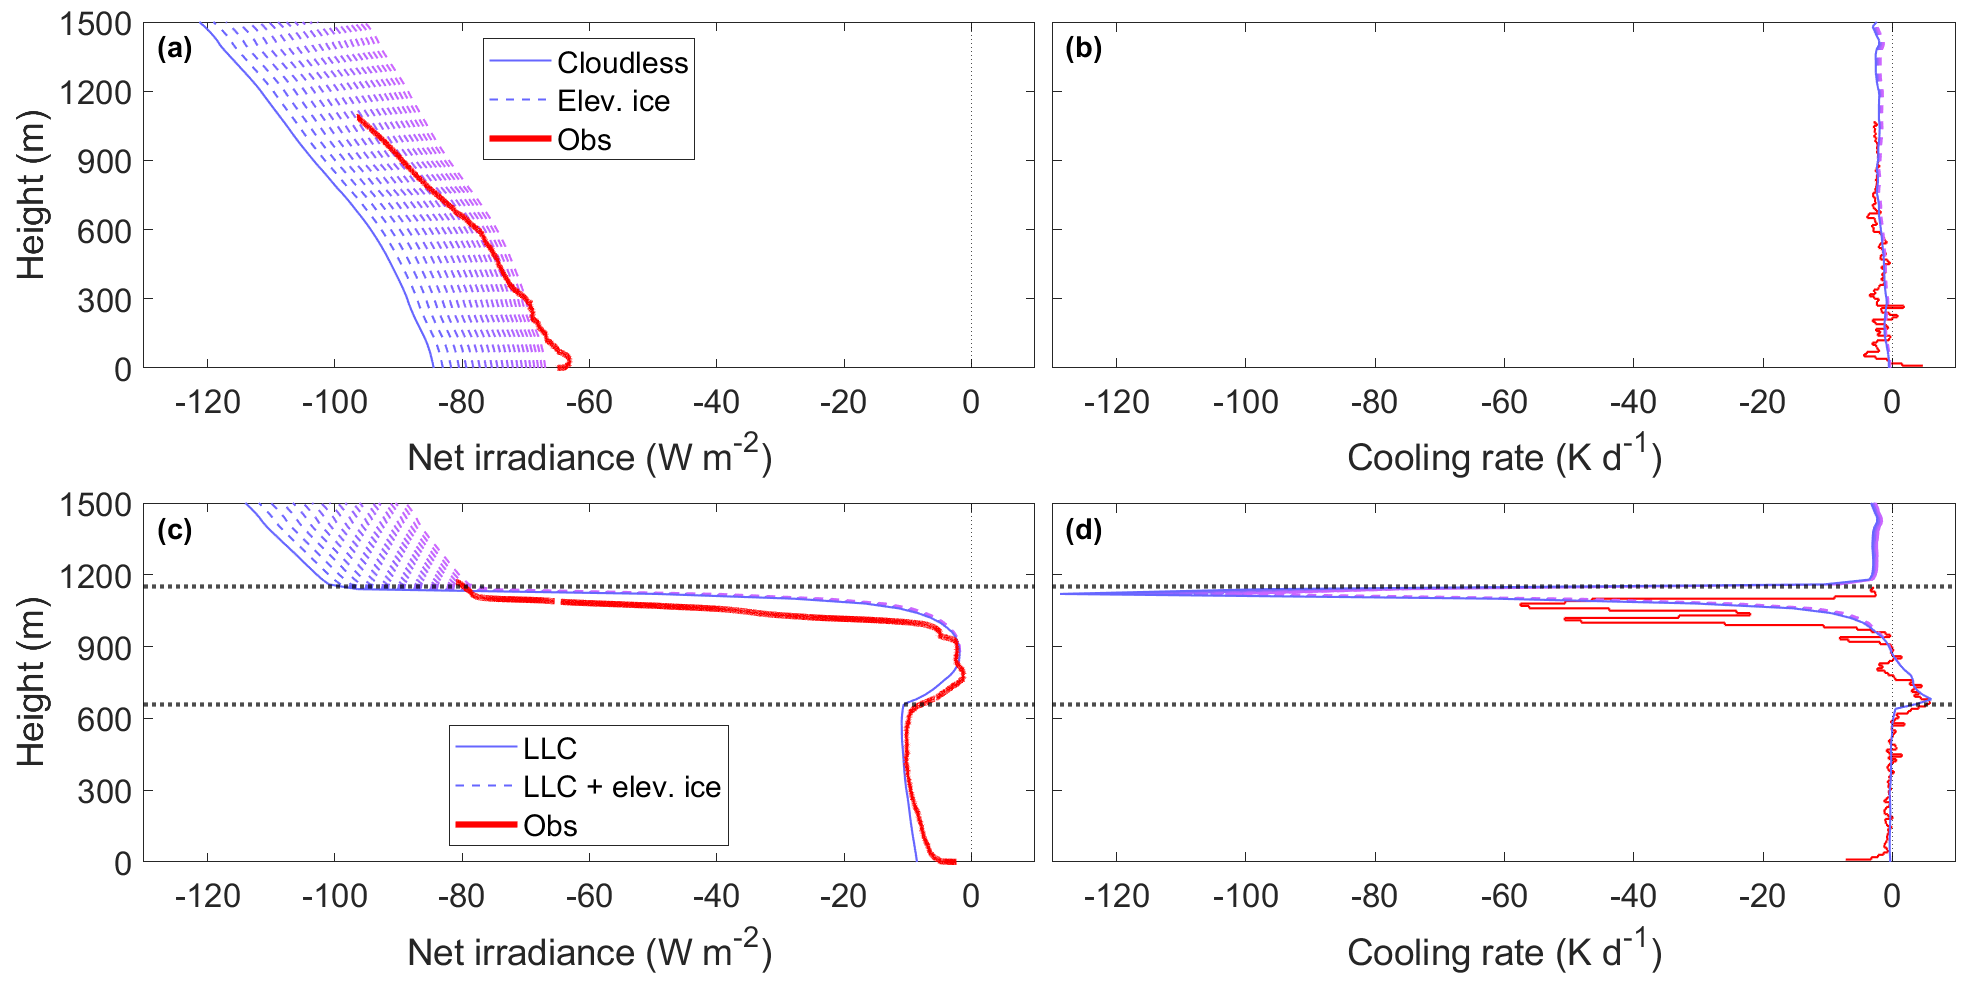
Figure 9Profiles for (a, b) a cloudless ABL and (c, d) a low-level liquid-bearing cloud, both capped by an elevated ice cloud (not shown). Net irradiance (a, c) and radiative cooling rates (b, d) are displayed. A simulation without the ice cloud is represented by a solid blue line, each dashed line represents a simulation after an increase in the IWP by 1 g m−2 in the elevated cloud, and observed values are shown in solid red. The boundaries of the low-level cloud are represented by horizontal dotted lines.
The ice cloud offsets Fnet in a cloudless ABL (dashed lines in Fig. 9a). As the Fnet offset is constant with height, the derived radiative cooling rates do not vary (Fig. 9b). Similarly, the ice layer exerts an effect on a liquid-bearing low-level cloud by diminishing Fnet due to an increased downward component emitted by the ice cloud (dashed lines in Fig. 9c). The reduced magnitude of Fnet at cloud top adjusts the radiative cooling rates of the low-level cloud (Fig. 9d). For the investigated ice clouds, the maximum effect was a reduction of cloud top cooling from −129 to −100 K d−1, and this reduction becomes larger as the IWP of the upper cloud is increased. Overall, it is clear that elevated ice clouds do have the potential to impact the radiative processes of low-level clouds but are typically less effective per unit of condensed mass in doing so.
Transitions between atmospheric states can be used to quantify the cloud radiative effect of the observed scenarios. We investigated the radiative effect of a low-level liquid-bearing cloud using two balloon profiles obtained on the same day. A transition from a cloudy to a cloudless atmosphere was observed in Ny-Ålesund on 30 September 2021. Initial Cloudnet observations showed a low-level liquid-bearing single-layer cloud with cloud base at 660 m and cloud top at 1140 m. The LWP was variable but for most of the time exceeded 30 g m−2; thus the cloud can be considered optically thick for TIR radiation. Cloudnet data indicated a small fraction of ice particles in the low-level cloud. Radiative transfer simulations (not shown here) illustrated that the ice crystals had no significant impact on the TIR radiation profiles. Cloudnet also observed a persistent ice cloud with a base height of 7400 m (not shown). The low-level cloud dissipated during the day, and the temporal variation in the cloud cover strongly impacted the radiation profiles.
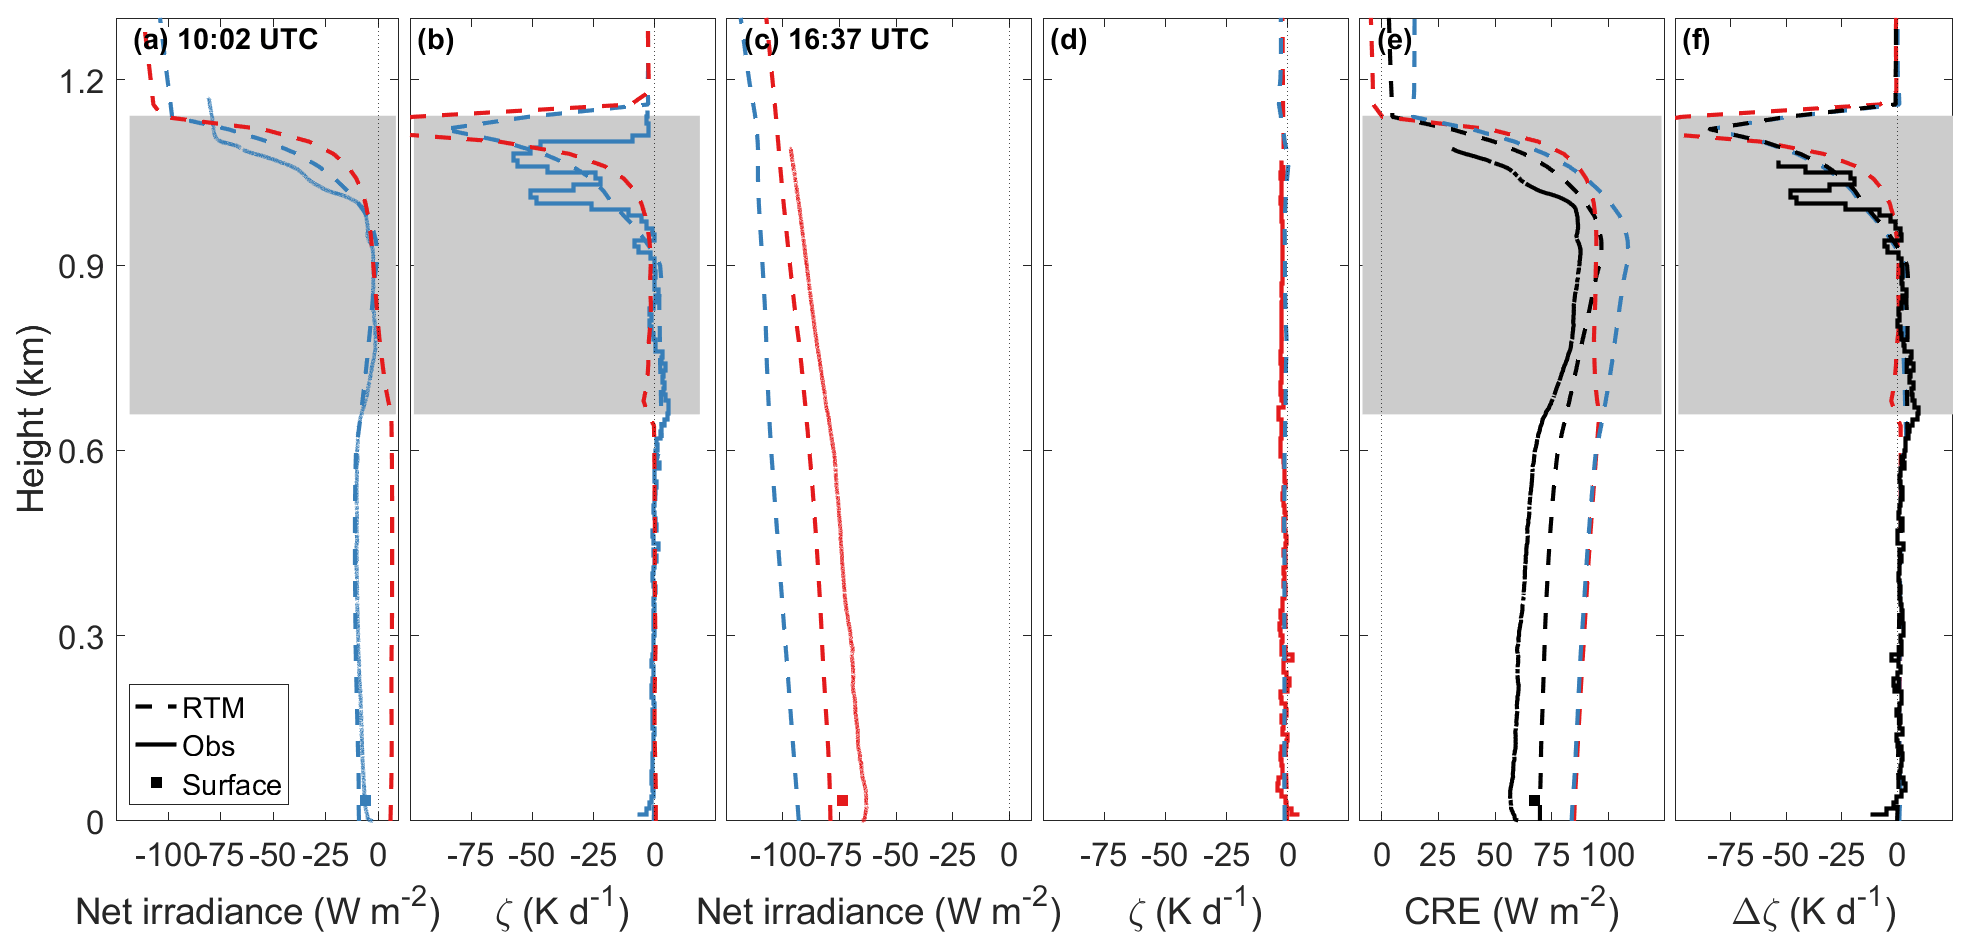
Figure 10Balloon-borne profiles of TIR net irradiance and radiative cooling rates on 30 September 2021 at (a, b) 10:02 UTC and (c, d) 16:37 UTC and (e, f) the difference between the two sets of profiles. Lines based on 10:02 UTC temperature profiles are shown in blue, and lines based on 16:37 UTC temperature profiles are shown in red. Dashed lines represent RTM simulations. Clouds are represented by gray shading.
The profiles of net irradiance and derived radiative cooling rates measured with BELUGA are shown as solid colored lines in Fig. 10, matched by radiative transfer models obtained using the observed thermodynamic profile (dashed blue lines in Fig. 10a–b and dashed red lines in Fig. 10c–d). As the thermodynamic profiles changed between both observations, their impact (water vapor and temperature changes) on the radiative profiles needs to be considered, as shown by Stapf et al. (2021). Two additional scenarios were simulated: one using the cloudy thermodynamic profiles to simulate cloudless conditions (dashed blue lines in Fig. 10c–d) and one using the thermodynamic profile of the cloudless case to simulate cloudy conditions (dashed red lines in Fig. 10a–b).
The initial in situ measurements of net irradiance and radiative cooling rate (Fig. 10a, b) at 10:02 UTC represent the case of a low-level liquid-bearing single-layer cloud. When moving upward, the Fnet decreases significantly at cloud top by about 70 W m−2, which leads to a local maximum radiative cooling rate of −60 K d−1. Low radiative heating rates (up to 5 K d−1) are observed at cloud base as a result of the cloud being colder than the surface. Consequentially, a radiative cooling rate of −7 K d−1 was calculated in the near-surface layer (lowermost 10 m layer of the balloon profile). At 16:37 UTC, the second balloon profile indicates a radiative cooling rate on the order of −2 K d−1 at all heights. The radiative cooling rate observed throughout the cloudless atmosphere is well represented by the RTM simulation (Fig. 10d). A negative offset of net irradiance between measurements and simulations is obvious in Fig. 10a and c and results from the presence of the elevated ice cloud which was not included in the simulation. This effect is analyzed in Sect. 4.2, showing that adding the missing cloud results in a better match between simulations and observations.
The cloud radiative effect (CRE) is calculated for all altitudes by the difference between the cloudy and the cloudless irradiances (Ramanathan et al., 1989). It highlights that the cloud cover variation changes the whole radiation profile. Sources and sinks of radiative energy are modified in location and intensity. While some of the variability between the cloudy and the cloudless profiles is due to differences in the temperature and humidity profiles, the main variations are induced by the presence and absence of the cloud layer, thus showing that cloudiness is the main factor controlling the shape of radiation profiles.
The average observed cloud radiative effect in the layer between the surface and the cloud is 62 W m−2, with a tendency to increase with height (Fig. 10e). This value is in agreement with the near-surface measurements (67 W m−2) and with other values reported for clouds at a similar altitude and temperature (Shupe and Intrieri, 2004). The average radiative effect derived by balloon measurements inside the cloud is 78 W m−2, with a peak of 88 W m−2. The model results indicate a maximum difference of 4 W m−2, decreasing with height. The simulations using the same thermodynamic profile for both states present an offset, in particular having larger magnitudes in the layer between the surface and the cloud (89 W m−2), but suggest the same vertical structure. The offset in the CRE between the profiles with fixed thermodynamic profiles (dashed colored lines in Fig. 10) and the RTM that included the change in both thermodynamics and cloud cover (dashed black line) indicates the change induced only by the change in atmospheric conditions. In particular, it shows that the humidity layer (between 660–1140 m in the dashed blue profile) has a radiative effect. The calculations also allow deriving profiles of radiative temperature tendency (Fig. 10f) caused only by the cloud and independent of the cooling by the atmosphere (water vapor). Under the cloud, the presence of the cloud results in an average heating rate of about 1 K d−1, while inside the cloud the profile largely resembles the cloudy profile. Above the cloud, the radiative temperature tendencies were unaltered (0 K d−1).
Vertical profiles of TIR irradiance were measured using broadband radiometers installed as part of an instrument payload of the tethered balloon platform BELUGA during the MOSAiC expedition in summer 2020 and in Ny-Ålesund (Svalbard) in autumn 2021 and spring 2022. The profiles were analyzed to characterize the height-resolved TIR radiative energy budget and derived cooling rates for typical atmospheric situations. Measurements over the sea ice in summer during MOSAiC showed a frequent abundance of low-level liquid-bearing clouds. At Ny-Ålesund mostly cloudless conditions were sampled.
The measurements revealed that the typical bimodal distribution of surface TIR net irradiance associated with cloudy/cloudless atmospheric states introduced by Shupe and Intrieri (2004) is present also at higher altitudes. However, the frequency distributions changed significantly with height, as the cloud cover varied with height. The difference between the TIR net irradiances measured in cloudy and cloudless states increased with altitude; thus the bimodal distribution became more separated. This indicated that the cloud radiative effects were stronger for the atmosphere layers further away from the surface.
The profile data were divided into four categories: cloudless, low-level cloud, and elevated liquid-bearing or ice clouds, each presenting a particular vertical structure of the radiative quantities. Cloudless scenarios exhibited a continuous vertical decrease in TIR net irradiances associated with a decrease in air temperature (Becker et al., 2020; Philipona et al., 2020). For all cloudless cases, the radiative cooling rates ranged between −3 and −1 K d−1. This loss of radiative energy can potentially modify the entire temperature profile and thus initiate other atmospheric processes. Optically thick clouds removed the cooling tendency in the layers between cloud base and the surface. Low-level liquid-bearing clouds were characterized by a strong cooling rate up to −80 K d−1 within a thin layer at cloud top, which is consistent with previous works (Turner et al., 2018; Becker et al., 2020).
Using sensitivity studies based on radiative transfer simulations combined with the available in situ observations, we showed that measurements were reproduced by simulations with adjusted microphysical input. The liquid water path (LWP) proved to be of particular importance for determining cloud top cooling for optically thin clouds (LWP < 30 g m−2). For optically thick clouds, the droplet number concentration (Nd) acquires relative importance in controlling the magnitude of cloud top cooling, but the integrated cloud cooling does not significantly change with varying Nd (Williams and Igel, 2021). An elevated cloud influenced the lower-troposphere TIR radiation profiles similarly to a low-level cloud, with the important distinction that its cloud top cooling is located above the ABL. The presence of an elevated cloud has an impact also on low-level clouds (Turner et al., 2018). Even when the amount of liquid water in the elevated cloud is limited, the cloud top radiative cooling in the low-level cloud is strongly reduced. The radiative cooling in this lower cloud then becomes negligible when the elevated cloud is optically thick. Even elevated ice clouds modulated the TIR irradiance profiles by reducing the radiative gradient within lower-level clouds, but they were less effective at doing so per unit of condensed mass. In cloudless boundary layers, the reduction of TIR net irradiances due to an ice cloud aloft is important because the surface radiative balance can vary, but it does not affect the strength of the radiative cooling rates over the vertical profile. This reduces the radiative gradient within the low-level cloud, thus dampening the radiative cooling rate at cloud top.
A profile of CRE was derived from the transition between atmospheric states observed with a sequence of balloon profile measurements obtained on 30 September 2021. A low-level cloud dissipated, and the vertical profiles of the radiative energy budget and the radiative cooling rates changed significantly and rapidly. The CRE from surface measurements matched the results obtained at the base of the balloon profile; however, the CRE steadily increased with altitude up to cloud base height and peaked in the central part of the cloud. Simulations alternating the two thermodynamic profiles were combined with switching the cloud layer on and off, indicating that cloudiness is the main driver in controlling the structure of the TIR radiation profile.
Although the number of observed profiles is limited, the data presented here showcase the radiative cooling rate profiles associated with different atmospheric states. However, to represent the complexity of transition cases and compare them to the output of numerical models, a larger set of consecutive profile observations with less temporal separation will be required.
The balloon-borne radiation measurements are publicly available on Zenodo (https://doi.org/10.5281/zenodo.8079768, Lonardi et al., 2023). The 2 m time series of net irradiance for MOSAiC was obtained from https://doi.org/10.18739/A2XD0R00S (Cox et al., 2023a). The 33 m time series of net irradiance for Ny-Ålesund is available at the Italian Arctic Data Center (https://data.iadc.cnr.it/erddap/tabledap/cct_radiation_d2.html, Mazzola et al., 2023). Cloudnet data were obtained from https://hdl.handle.net/21.12132/2.241e5a2b37654e45 (Engelmann et al., 2023) for MOSAiC and from https://doi.org/10.60656/2498625552e84611 (Ebell et al., 2024) for Ny-Ålesund. Radiosonde data were obtained from https://doi.org/10.1594/PANGAEA.943870 (Maturilli et al., 2022) for MOSAiC and from https://doi.org/10.1594/PANGAEA.943870 (Maturilli, 2020) for Ny-Ålesund.
ML performed the balloon-borne radiation measurements, analyzed the data, and drafted the paper. MDS and MM were responsible for the surface radiation measurements at MOSAiC and Ny-Ålesund, respectively, and contributed to the data analysis. EFA, AE, CP, HS, and MW contributed to the acquisition of balloon-borne measurements, to the scientific discussion, and to the writing.
The contact author has declared that none of the authors has any competing interests.
Publisher’s note: Copernicus Publications remains neutral with regard to jurisdictional claims made in the text, published maps, institutional affiliations, or any other geographical representation in this paper. While Copernicus Publications makes every effort to include appropriate place names, the final responsibility lies with the authors.
This article is part of the special issue “HALO-(AC)3 – an airborne campaign to study air mass transformations during warm-air intrusions and cold-air outbreaks”. It is not associated with a conference.
We gratefully acknowledge the funding by the Deutsche Forschungsgemeinschaft (DFG, German Research Foundation) – project number 268020496 – within the Transregional Collaborative Research Center TRR 172, “ArctiC Amplification: Climate Relevant Atmospheric and SurfaCe Processes, and Feedback Mechanisms (AC)3” in sub-project A02. This work was carried out and data used in this paper were produced as part of the international Multidisciplinary drifting Observatory for the Study of Arctic Climate (MOSAiC) with the tag MOSAiC20192020. We thank all persons involved in the expedition of the research vessel Polarstern during MOSAiC (AWI_PS122_00) as listed in Nixdorf et al. (2021). Matthew D. Shupe was supported by a Mercator Fellowship with (AC)3, by the US National Science Foundation (OPP-1724551), the Department of Energy (DE-SC0021341), and the NOAA Cooperative Agreement (NA22OAR4320151). Radiation measurements for MOSAiC were obtained from the University of Colorado/NOAA flux team. Radiation measurements for Ny-Ålesund were obtained from the Italian National Research Council. Cloudnet data for MOSAiC were obtained from the Cloudnet team at TROPOS. We acknowledge the assistance from the staff of the Institute of Geophysics and Meteorology of the University of Cologne in the interpretation of the Ny-Ålesund Cloudnet data. Radiosonde data were obtained through a partnership between the leading Alfred Wegener Institute (AWI), the Atmospheric Radiation Measurement (ARM) User Facility, a US Department of Energy facility managed by the Biological and Environmental Research Program, and the German Weather Service (DWD). The authors are particularly thankful to the teams operating BELUGA and to the logistics staff present at MOSAiC and in Ny-Ålesund.
This research has been supported by the Deutsche Forschungsgemeinschaft (grant no. 268020496 – TRR 172), the U.S. National Science Foundation (grant no. OPP-1724551), the Department of Energy Atmospheric System Research Program (grant no. DE-SC0021341), and the NOAA Cooperative Agreement (grant no. NA22OAR4320151).
This paper was edited by Radovan Krejci and reviewed by two anonymous referees.
Asano, S., Yoshida, Y., Miyake, Y., and Nakamura, K.: Development of a radiometer-sonde for simultaneously measuring the downward and upward broadband fluxes of shortwave and longwave radiation, J. Meteorol. Soc. Jpn., 82, 623–637, https://doi.org/10.2151/jmsj.2004.623, 2004. a, b
Becker, R., Maturilli, M., Philipona, R., and Behrens, K.: In situ sounding of radiative flux profiles through the Arctic lower troposphere, Bull. Atmos. Sci. Technol., 1, 155–177, https://doi.org/10.1007/s42865-020-00011-8, 2020. a, b, c, d, e
Becker, S., Ehrlich, A., Schäfer, M., and Wendisch, M.: Airborne observations of the surface cloud radiative effect during different seasons over sea ice and open ocean in the Fram Strait, Atmos. Chem. Phys., 23, 7015–7031, https://doi.org/10.5194/acp-23-7015-2023, 2023. a, b, c
Brenguier, J.-L., Burnet, F., and Geoffroy, O.: Cloud optical thickness and liquid water path – does the k coefficient vary with droplet concentration?, Atmos. Chem. Phys., 11, 9771–9786, https://doi.org/10.5194/acp-11-9771-2011, 2011. a
Brooks, I. M., Tjernström, M., Persson, P. O. G., Shupe, M. D., Atkinson, R. A., Canut, G., Birch, C. E., Mauritsen, T., Sedlar, J., and Brooks, B. J.: The Turbulent Structure of the Arctic Summer Boundary Layer During The Arctic Summer Cloud-Ocean Study, J. Geophys. Res.-Atmos., 122, 9685–9704, https://doi.org/10.1002/2017JD027234, 2017. a
Cesana, G., Waliser, D. E., Henderson, D., L'Ecuyer, T. S., Jiang, X., and Li, J. L.: The vertical structure of radiative heating rates: A multimodel evaluation using a-train satellite observations, J. Climate, 32, 1573–1590, https://doi.org/10.1175/JCLI-D-17-0136.1, 2019. a
Chechin, D. G., Lüpkes, C., Hartmann, J., Ehrlich, A., and Wendisch, M.: Turbulent structure of the Arctic boundary layer in early summer driven by stability, wind shear and cloud-top radiative cooling: ACLOUD airborne observations, Atmos. Chem. Phys., 23, 4685–4707, https://doi.org/10.5194/acp-23-4685-2023, 2023. a
Cox, C., Gallagher, M., Shupe, M. D., Persson, O., Grachev, A., Solomon, A., Ayers, T., Costa, D., Hutchings, J., Leach, J., Morris, S., Osborn, J., Pezoa, S., and Uttal, T.: Atmospheric Surface Flux Station #50 measurements (Level 3 Final), Multidisciplinary Drifting Observatory for the Study of Arctic Climate (MOSAiC), central Arctic, October 2019–September 2020, Arctic Data Center [data set], https://doi.org/10.18739/A2XD0R00S, 2023a. a, b
Cox, C. J., Gallagher, M. R., Shupe, M. D., Persson, P. O. G., Solomon, A., Fairall, C. W., Ayers, T., Blomquist, B., Brooks, I. M., Costa, D., Grachev, A., Gottas, D., Hutchings, J. K., Kutchenreiter, M., Leach, J., Morris, S. M., Morris, V., Osborn, J., Pezoa, S., Preußer, A., Riihimaki, L. D., and Uttal, T.: Continuous observations of the surface energy budget and meteorology over the Arctic sea ice during MOSAiC, Scientific Data, 10, 519, https://doi.org/10.1038/s41597-023-02415-5, 2023b. a
Curry, J. A.: Interactions among turbulence, radiation and microphysics in Arctic stratus clouds., J. Atmos. Sci., 43, 90–106, https://doi.org/10.1175/1520-0469(1986)043<0090:IATRAM>2.0.CO;2, 1986. a, b
Curry, J. A. and Ebert, E. E.: Annual cycle of radiation fluxes over the Arctic Ocean: sensitivity to cloud optical properties, J. Climate, 5, 1267–1280, https://doi.org/10.1175/1520-0442(1992)005<1267:ACORFO>2.0.CO;2, 1992. a
Curry, J. A., Rossow, W. B., Randall, D., and Schramm, J. L.: Overview of arctic cloud and radiation characteristics, J. Climate, 9, 1731–1764, https://doi.org/10.1175/1520-0442(1996)009<1731:OOACAR>2.0.CO;2, 1996. a, b
Dexheimer, D., Airey, M., Roesler, E., Longbottom, C., Nicoll, K., Kneifel, S., Mei, F., Harrison, R. G., Marlton, G., and Williams, P. D.: Evaluation of ARM tethered-balloon system instrumentation for supercooled liquid water and distributed temperature sensing in mixed-phase Arctic clouds, Atmos. Meas. Tech., 12, 6845–6864, https://doi.org/10.5194/amt-12-6845-2019, 2019. a
Dong, X., Xi, B., Crosby, K., Long, C. N., Stone, R. S., and Shupe, M. D.: A 10 year climatology of Arctic cloud fraction and radiative forcing at Barrow, Alaska, J. Geophys. Res.-Atmos., 115, D17212, https://doi.org/10.1029/2009JD013489, 2010. a
Ebell, K., Nomokonova, T., Maturilli, M., and Ritter, C.: Radiative effect of clouds at ny-Ålesund, svalbard, as inferred from ground-based remote sensing observations, J. Appl. Meteorol. Clim., 59, 3–22, https://doi.org/10.1175/JAMC-D-19-0080.1, 2020. a
Ebell, K., Maturilli, M., Ritter, C., and O'Connor, E.: Custom collection of categorize, classification, droplet effective radius, ice effective radius, ice water content, and liquid water content data from Ny-Ålesund between 1 Sep 2021 and 30 May 2022, ACTRIS Cloud remote sensing data centre unit (CLU), https://doi.org/10.60656/2498625552e84611, 2024. a
Egerer, U., Gottschalk, M., Siebert, H., Ehrlich, A., and Wendisch, M.: The new BELUGA setup for collocated turbulence and radiation measurements using a tethered balloon: first applications in the cloudy Arctic boundary layer, Atmos. Meas. Tech., 12, 4019–4038, https://doi.org/10.5194/amt-12-4019-2019, 2019. a, b, c, d, e, f
Egerer, U., Ehrlich, A., Gottschalk, M., Griesche, H., Neggers, R. A. J., Siebert, H., and Wendisch, M.: Case study of a humidity layer above Arctic stratocumulus and potential turbulent coupling with the cloud top, Atmos. Chem. Phys., 21, 6347–6364, https://doi.org/10.5194/acp-21-6347-2021, 2021. a, b
Egerer, U., Cassano, J. J., Shupe, M. D., de Boer, G., Lawrence, D., Doddi, A., Siebert, H., Jozef, G., Calmer, R., Hamilton, J., Pilz, C., and Lonardi, M.: Estimating turbulent energy flux vertical profiles from uncrewed aircraft system measurements: exemplary results for the MOSAiC campaign, Atmos. Meas. Tech., 16, 2297–2317, https://doi.org/10.5194/amt-16-2297-2023, 2023. a
Ehrlich, A., Wendisch, M., Bierwirth, E., Gayet, J.-F., Mioche, G., Lampert, A., and Mayer, B.: Evidence of ice crystals at cloud top of Arctic boundary-layer mixed-phase clouds derived from airborne remote sensing, Atmos. Chem. Phys., 9, 9401–9416, https://doi.org/10.5194/acp-9-9401-2009, 2009. a
Ehrlich, A., Wendisch, M., Lüpkes, C., Buschmann, M., Bozem, H., Chechin, D., Clemen, H.-C., Dupuy, R., Eppers, O., Hartmann, J., Herber, A., Jäkel, E., Järvinen, E., Jourdan, O., Kästner, U., Kliesch, L.-L., Köllner, F., Mech, M., Mertes, S., Neuber, R., Ruiz-Donoso, E., Schnaiter, M., Schneider, J., Stapf, J., and Zanatta, M.: A comprehensive in situ and remote sensing data set from the Arctic CLoud Observations Using airborne measurements during polar Day (ACLOUD) campaign, Earth Syst. Sci. Data, 11, 1853–1881, https://doi.org/10.5194/essd-11-1853-2019, 2019. a
Emde, C., Buras-Schnell, R., Kylling, A., Mayer, B., Gasteiger, J., Hamann, U., Kylling, J., Richter, B., Pause, C., Dowling, T., and Bugliaro, L.: The libRadtran software package for radiative transfer calculations (version 2.0.1), Geosci. Model Dev., 9, 1647–1672, https://doi.org/10.5194/gmd-9-1647-2016, 2016. a
Engelmann, R., Althausen, D., Baars, H., Griesche, H., Hofer, J., Radenz, M., and Seifert, P.: Custom collection of categorize, classification, ice water content, lidar, and liquid water content data from RV Polarstern between 28 Sep 2019 and 1 Oct 2020, ACTRIS Cloud remote sensing data centre unit (CLU) [data set], https://hdl.handle.net/21.12132/2.241e5a2b37654e45 (last access: 24 May 2023), 2023. a, b
Gierens, R., Kneifel, S., Shupe, M. D., Ebell, K., Maturilli, M., and Löhnert, U.: Low-level mixed-phase clouds in a complex Arctic environment, Atmos. Chem. Phys., 20, 3459–3481, https://doi.org/10.5194/acp-20-3459-2020, 2020. a
Griesche, H. J., Seifert, P., Ansmann, A., Baars, H., Barrientos Velasco, C., Bühl, J., Engelmann, R., Radenz, M., Zhenping, Y., and Macke, A.: Application of the shipborne remote sensing supersite OCEANET for profiling of Arctic aerosols and clouds during Polarstern cruise PS106, Atmos. Meas. Tech., 13, 5335–5358, https://doi.org/10.5194/amt-13-5335-2020, 2020. a
Illingworth, A. J., Hogan, R. J., O'Connor, E. J., Bouniol, D., Brooks, M. E., Delanoë, J., Donovan, D. P., Eastment, J. D., Gaussiat, N., Goddard, J. W., Haeffelin, M., Klein Baltinik, H., Krasnov, O. A., Pelon, J., Piriou, J. M., Protat, A., Russchenberg, H. W., Seifert, A., Tompkins, A. M., van Zadelhoff, G. J., Vinit, F., Willen, U., Wilson, D. R., and Wrench, C. L.: Cloudnet: Continuous evaluation of cloud profiles in seven operational models using ground-based observations, B. Am. Meteorol. Soc., 88, 883–898, https://doi.org/10.1175/BAMS-88-6-883, 2007. a, b
Inoue, J., Tobo, Y., Sato, K., Taketani, F., and Maturilli, M.: Application of cloud particle sensor sondes for estimating the number concentration of cloud water droplets and liquid water content: case studies in the Arctic region, Atmos. Meas. Tech., 14, 4971–4987, https://doi.org/10.5194/amt-14-4971-2021, 2021. a
Intrieri, J. M., Fairall, C. W., Shupe, M. D., Persson, P. O., Andreas, E. L., Guest, P. S., and Moritz, R. E.: An annual cycle of Arctic surface cloud forcing at SHEBA, J. Geophys. Res.-Oceans, 107, 8039, https://doi.org/10.1029/2000jc000439, 2002. a, b
Lawson, R. P., Stamnes, K., Stamnes, J., Zmarzly, P., Koskuliks, J., Roden, C., Mo, Q., Carrithers, M., and Bland, G. L.: Deployment of a tethered-balloon system for microphysics and radiative measurements in mixed-phase clouds at Ny-Ålesund and South Pole, J. Atmos. Ocean. Tech., 28, 656–670, https://doi.org/10.1175/2010JTECHA1439.1, 2011. a
Leaitch, W. R., Korolev, A., Aliabadi, A. A., Burkart, J., Willis, M. D., Abbatt, J. P. D., Bozem, H., Hoor, P., Köllner, F., Schneider, J., Herber, A., Konrad, C., and Brauner, R.: Effects of 20–100 nm particles on liquid clouds in the clean summertime Arctic, Atmos. Chem. Phys., 16, 11107–11124, https://doi.org/10.5194/acp-16-11107-2016, 2016. a
Lonardi, M., Pilz, C., Akansu, E. F., Dahlke, S., Egerer, U., Ehrlich, A., Griesche, H., Heymsfield, A. J., Kirbus, B., Schmitt, C. G., Shupe, M. D., Siebert, H., Wehner, B., and Wendisch, M.: Tethered balloon-borne profile measurements of atmospheric properties in the cloudy atmospheric boundary layer over the Arctic sea ice during MOSAiC: Overview and first results, Elementa, 10, 1–19, https://doi.org/10.1525/elementa.2021.000120, 2022. a, b, c, d, e
Lonardi, M., Pilz, C., Ehrlich, A., and Wendisch, M.: BELUGA TIR radiation profile measurements at MOSAiC and Ny-Alesund, Zenodo [data set] https://doi.org/10.5281/zenodo.8079768, 2023. a
Maturilli, M.: High resolution radiosonde measurements from station Ny-Ålesund (2017-04 et seq), Alfred Wegener Institute – Research Unit Potsdam, PANGAEA [data set], https://doi.org/10.1594/PANGAEA.914973, 2020. a, b
Maturilli, M. and Kayser, M.: Arctic warming, moisture increase and circulation changes observed in the Ny-Ålesund homogenized radiosonde record, Theor. Appl. Climatol., 130, 1–17, https://doi.org/10.1007/s00704-016-1864-0, 2017. a, b
Maturilli, M., Herber, A., and König-Langlo, G.: Climatology and time series of surface meteorology in Ny-Ålesund, Svalbard, Earth Syst. Sci. Data, 5, 155–163, https://doi.org/10.5194/essd-5-155-2013, 2013. a
Maturilli, M., Sommer, M., Holdridge, D. J., Dahlke, S., Graeser, J., Sommerfeld, A., Jaiser, R., Deckelmann, H., and Schulz, A.: MOSAiC radiosonde data (level 3), PANGAEA [data set], https://doi.org/10.1594/PANGAEA.943870, 2022. a, b
Mazzola, M., Viola, A. P., Lanconelli, C., and Vitale, V.: Atmospheric observations at the Amundsen-Nobile Climate Change Tower in Ny-Ålesund, Svalbard, Rend. Lincei, 27, 7–18, https://doi.org/10.1007/s12210-016-0540-8, 2016. a, b
Mazzola, M., Viola, A. P., and Vitale, V.: Climate Change Tower Radiation Data, Italian Arctic Data Center CNR [data set], https://data.iadc.cnr.it/erddap/tabledap/cct_radiation_d2.html, last access: 24 May 2023. a
McFarlane, S. A., Mather, J. H., and Ackerman, T. P.: Analysis of tropical radiative heating profiles: A comparison of models and observations, J. Geophys. Res.-Atmos., 112, D14218, https://doi.org/10.1029/2006JD008290, 2007. a
Miller, N. B., Shupe, M. D., Cox, C. J., Walden, V. P., Turner, D. D., and Steffen, K.: Cloud radiative forcing at Summit, Greenland, J. Climate, 28, 6267–6280, https://doi.org/10.1175/JCLI-D-15-0076.1, 2015. a
Morrison, H., Pinto, J. O., Curry, J. A., and McFarquhar, G. M.: Sensitivity of modeled arctic mixed-phase stratocumulus to cloud condensation and ice nuclei over regionally varying surface conditions, J. Geophys. Res.-Atmos., 113, D05203, https://doi.org/10.1029/2007JD008729, 2008. a
Morrison, H., De Boer, G., Feingold, G., Harrington, J., Shupe, M. D., and Sulia, K.: Resilience of persistent Arctic mixed-phase clouds, Nat. Geosci., 5, 11–17, https://doi.org/10.1038/ngeo1332, 2012. a, b
Nixdorf, U., Dethloff, K., Rex, M., Shupe, M., Sommerfeld, A., Perovich, D. K., Nicolaus, M., Heuzé, C., Rabe, B., Loose, B., Damm, E., Gradinger, R., Fong, A., Maslowski, W., Rinke, A., Kwok, R., Spreen, G., Wendisch, M., Herber, A., Hirsekorn, M., Mohaupt, V., Frickenhaus, S., Immerz, A., Weiss-Tuider, K., König, B., Mengedoht, D., Regnery, J., Gerchow, P., Ransby, D., Krumpen, T., Morgenstern, A., Haas, C., Kanzow, T., Rack, F. R., Saitzev, V., Sokolov, V., Makarov, A., Schwarze, S., Wunderlich, T., Wurr, K., and Boetius, A.: MOSAiC Extended Acknowledgement, Zenodo, https://doi.org/10.5281/zenodo.5541624, 2021. a
Nomokonova, T., Ebell, K., Löhnert, U., Maturilli, M., Ritter, C., and O'Connor, E.: Statistics on clouds and their relation to thermodynamic conditions at Ny-Ålesund using ground-based sensor synergy, Atmos. Chem. Phys., 19, 4105–4126, https://doi.org/10.5194/acp-19-4105-2019, 2019. a, b, c, d
Philipona, R., Kräuchi, A., Kivi, R., Peter, T., Wild, M., Dirksen, R., Fujiwara, M., Sekiguchi, M., Hurst, D. F., and Becker, R.: Balloon-borne radiation measurements demonstrate radiative forcing by water vapor and clouds, Meteorol. Z., 29, 501–509, https://doi.org/10.1127/METZ/2020/1044, 2020. a, b, c
Pilz, C., Düsing, S., Wehner, B., Müller, T., Siebert, H., Voigtländer, J., and Lonardi, M.: CAMP: an instrumented platform for balloon-borne aerosol particle studies in the lower atmosphere, Atmos. Meas. Tech., 15, 6889–6905, https://doi.org/10.5194/amt-15-6889-2022, 2022. a
Pilz, C., Lonardi, M., Egerer, U., Siebert, H., Ehrlich, A., Heymsfield, A. J., Schmitt, C. G., Shupe, M. D., Wehner, B., and Wendisch, M.: Profile observations of the Arctic atmospheric boundary layer with the BELUGA tethered balloon during MOSAiC, Scientific Data, 10, 534, https://doi.org/10.1038/s41597-023-02423-5, 2023. a, b
Pithan, F., Svensson, G., Caballero, R., Chechin, D., Cronin, T. W., Ekman, A. M., Neggers, R., Shupe, M. D., Solomon, A., Tjernström, M., and Wendisch, M.: Role of air-mass transformations in exchange between the Arctic and mid-latitudes, Nat. Geosci., 11, 805–812, https://doi.org/10.1038/s41561-018-0234-1, 2018. a
Ramanathan, V., Cess, R. D., Harrison, E. F., Minnis, P., Barkstrom, B. R., Ahmad, E., and Hartmann, D.: Cloud-radiative forcing and climate: Results from the earth radiation budget experiment, Science, 243, 57–63, https://doi.org/10.1126/science.243.4887.57, 1989. a
Ricchiazzi, P., Yang, S., Gautier, C., and Sowle, D.: SBDART: A Research and Teaching Software Tool for Plane-Parallel Radiative Transfer in the Earth's Atmosphere, B. Am. Meteorol. Soc., 79, 2101–2114, https://doi.org/10.1175/1520-0477(1998)079<2101:SARATS>2.0.CO;2, 1998. a
Rinke, A., Cassano, J. J., Cassano, E. N., Jaiser, R., and Handorf, D.: Meteorological conditions during the MOSAiC expedition: Normal or anomalous?, Elementa, 9, 00023, https://doi.org/10.1525/elementa.2021.00023, 2021. a
Schön, M., Suomi, I., Altstädter, B., van Kesteren, B., Berge, K. Z., Platis, A., Wehner, B., Lampert, A., and Bange, J.: Case studies of the wind field around Ny-Ålesund, Svalbard, using unmanned aircraft, Polar Res., 41, 7884, https://doi.org/10.33265/polar.v41.7884, 2022. a
Serreze, M. C. and Barry, R. G.: Processes and impacts of Arctic amplification: A research synthesis, Global Planet. Change, 77, 85–96, https://doi.org/10.1016/j.gloplacha.2011.03.004, 2011. a
Shettle, E. P.: Models of aerosols, clouds and precipitation for atmospheric propagation studies, AGARD Conference Proceedings, no. 454, 1989. a
Shupe, M. D.: Clouds at arctic atmospheric observatories. Part II: Thermodynamic phase characteristics, J. Appl. Meteorol. Clim., 50, 645–661, https://doi.org/10.1175/2010JAMC2468.1, 2011. a
Shupe, M. D. and Intrieri, J. M.: Cloud radiative forcing of the Arctic surface: The influence of cloud properties, surface albedo, and solar zenith angle, J. Climate, 17, 616–628, https://doi.org/10.1175/1520-0442(2004)017<0616:CRFOTA>2.0.CO;2, 2004. a, b, c, d, e, f, g, h
Shupe, M. D., Persson, P. O. G., Brooks, I. M., Tjernström, M., Sedlar, J., Mauritsen, T., Sjogren, S., and Leck, C.: Cloud and boundary layer interactions over the Arctic sea ice in late summer, Atmos. Chem. Phys., 13, 9379–9399, https://doi.org/10.5194/acp-13-9379-2013, 2013. a, b
Shupe, M. D., Rex, M., Blomquist, B., G. Persson, P. O., Schmale, J., Uttal, T., Althausen, D., Angot, H., Archer, S., Bariteau, L., Beck, I., Bilberry, J., Bucci, S., Buck, C., Boyer, M., Brasseur, Z., Brooks, I. M., Calmer, R., Cassano, J., Castro, V., Chu, D., Costa, D., Cox, C. J., Creamean, J., Crewell, S., Dahlke, S., Damm, E., de Boer, G., Deckelmann, H., Dethloff, K., Dütsch, M., Ebell, K., Ehrlich, A., Ellis, J., Engelmann, R., Fong, A. A., Frey, M. M., Gallagher, M. R., Ganzeveld, L., Gradinger, R., Graeser, J., Greenamyer, V., Griesche, H., Griffiths, S., Hamilton, J., Heinemann, G., Helmig, D., Herber, A., Heuzé, C., Hofer, J., Houchens, T., Howard, D., Inoue, J., Jacobi, H. W., Jaiser, R., Jokinen, T., Jourdan, O., Jozef, G., King, W., Kirchgaessner, A., Klingebiel, M., Krassovski, M., Krumpen, T., Lampert, A., Landing, W., Laurila, T., Lawrence, D., Lonardi, M., Loose, B., Lüpkes, C., Maahn, M., Macke, A., Maslowski, W., Marsay, C., Maturilli, M., Mech, M., Morris, S., Moser, M., Nicolaus, M., Ortega, P., Osborn, J., Pätzold, F., Perovich, D. K., Petäjä, T., Pilz, C., Pirazzini, R., Posman, K., Powers, H., Pratt, K. A., Preußer, A., Quéléver, L., Radenz, M., Rabe, B., Rinke, A., Sachs, T., Schulz, A., Siebert, H., Silva, T., Solomon, A., Sommerfeld, A., Spreen, G., Stephens, M., Stohl, A., Svensson, G., Uin, J., Viegas, J., Voigt, C., von der Gathen, P., Wehner, B., Welker, J. M., Wendisch, M., Werner, M., Xie, Z. Q., and Yue, F.: Overview of the MOSAiC expedition – Atmosphere, Elem. Sci. Anth., 10, 00060, https://doi.org/10.1525/elementa.2021.00060, 2022. a, b, c, d
Sikand, M., Koskulics, J., Stamnes, K., Hamre, B., Stamnes, J. J., and Lawson, R. P.: Estimation of mixed-phase cloud optical depth and position using in situ radiation and cloud microphysical measurements obtained from a tethered-balloon platform, J. Atmos. Sci., 70, 317–329, https://doi.org/10.1175/JAS-D-12-063.1, 2013. a
Solomon, A., Shupe, M. D., Persson, O., Morrison, H., Yamaguchi, T., Caldwell, P. M., and De Boer, G.: The sensitivity of springtime arctic mixed-phase stratocumulus clouds to surface-layer and cloud-top inversion-layer moisture sources, J. Atmos. Sci., 71, 574–595, https://doi.org/10.1175/JAS-D-13-0179.1, 2014. a
Solomon, A., Shupe, M. D., Svensson, G., Barton, N. P., Batrak, Y., Bazile, E., Day, J. J., Doyle, J. D., Frank, H. P., Keeley, S., Remes, T., and Tolstykh, M.: The winter central Arctic surface energy budget: A model evaluation using observations from the MOSAiC campaign, Elementa, 11, 1–23, https://doi.org/10.1525/elementa.2022.00104, 2023. a
Stamnes, K., Tsay, S.-C., Wiscombe, W., and Jayaweera, K.: Numerically stable algorithm for discrete-ordinate-method radiative transfer in multiple scattering and emitting layered media, Appl. Optics, 27, 2502–2509, https://doi.org/10.1364/ao.27.002502, 1988. a
Stapf, J., Ehrlich, A., Jäkel, E., Lüpkes, C., and Wendisch, M.: Reassessment of shortwave surface cloud radiative forcing in the Arctic: consideration of surface-albedo–cloud interactions, Atmos. Chem. Phys., 20, 9895–9914, https://doi.org/10.5194/acp-20-9895-2020, 2020. a
Stapf, J., Ehrlich, A., and Wendisch, M.: Influence of Thermodynamic State Changes on Surface Cloud Radiative Forcing in the Arctic: A Comparison of Two Approaches Using Data From AFLUX and SHEBA, J. Geophys. Res.-Atmos., 126, e2020JD033589, https://doi.org/10.1029/2020JD033589, 2021. a
Stramler, K., Del Genio, A. D., and Rossow, W. B.: Synoptically driven Arctic winter states, J. Climate, 24, 1747–1762, https://doi.org/10.1175/2010JCLI3817.1, 2011. a, b
Sun, Z. and Shine, K. P.: Studies of the radiative properties of ice and mixed‐phase clouds, Q. J. Roy. Meteor. Soc., 120, 111–137, https://doi.org/10.1002/qj.49712051508, 1994. a
Suomi, V. E., Staley, D. O., and Kuhn, P. M.: A direct measurement of infra‐red radiation divergence to 160 mb, Q. J. Roy. Meteor. Soc., 84, 134–141, https://doi.org/10.1002/qj.49708436006, 1958. a
Thorsen, T. J., Fu, Q., and Comstock, J. M.: Cloud effects on radiative heating rate profiles over Darwin using ARM and A-train radar/lidar observations, J. Geophys. Res.-Atmos., 118, 5637–5654, https://doi.org/10.1002/jgrd.50476, 2013. a
Tjernström, M., Birch, C. E., Brooks, I. M., Shupe, M. D., Persson, P. O. G., Sedlar, J., Mauritsen, T., Leck, C., Paatero, J., Szczodrak, M., and Wheeler, C. R.: Meteorological conditions in the central Arctic summer during the Arctic Summer Cloud Ocean Study (ASCOS), Atmos. Chem. Phys., 12, 6863–6889, https://doi.org/10.5194/acp-12-6863-2012, 2012. a
Turner, D. D., Shupe, M. D., and Zwink, A. B.: Characteristic atmospheric radiative heating rate profiles in arctic clouds as observed at Barrow, Alaska, J. Appl. Meteorol. Clim., 57, 953–968, https://doi.org/10.1175/JAMC-D-17-0252.1, 2018. a, b, c, d, e, f, g, h, i, j
Walden, V. P., Hudson, S. R., Cohen, L., Murphy, S. Y., and Granskog, M. A.: Atmospheric components of the surface energy budget over young sea ice: Results from the N-ICE2015 campaign, J. Geophys. Res.-Atmos., 122, 8427–8446, https://doi.org/10.1002/2016JD026091, 2017. a
Walsh, J. E. and Chapman, W. L.: Arctic cloud-radiation-temperature associations in observational data and atmospheric reanalyses, J. Climate, 11, 3030–3045, https://doi.org/10.1175/1520-0442(1998)011<3030:ACRTAI>2.0.CO;2, 1998. a
Wendisch, M., Macke, A., Ehrlich, A., Lüpkes, C., Mech, M., Chechin, D., Dethloff, K., Velasco, C. B., Bozem, H., Brückner, M., Clemen, H. C., Crewell, S., Donth, T., Dupuy, R., Ebell, K., Egerer, U., Engelmann, R., Engler, C., Eppers, O., Gehrmann, M., Gong, X., Gottschalk, M., Gourbeyre, C., Griesche, H., Hartmann, J., Hartmann, M., Heinold, B., Herber, A., Herrmann, H., Heygster, G., Hoor, P., Jafariserajehlou, S., JäKel, E., JäRvinen, E., Jourdan, O., Kästner, U., Kecorius, S., Knudsen, E. M., Köllner, F., Kretzschmar, J., Lelli, L., Leroy, D., Maturilli, M., Mei, L., Mertes, S., Mioche, G., Neuber, R., Nicolaus, M., Nomokonova, T., Notholt, J., Palm, M., Van Pinxteren, M., Quaas, J., Richter, P., Ruiz-Donoso, E., Schäfer, M., Schmieder, K., Schnaiter, M., Schneider, J., Schwarzenböck, A., Seifert, P., Shupe, M. D., Siebert, H., Spreen, G., Stapf, J., Stratmann, F., Vogl, T., Welti, A., Wex, H., Wiedensohler, A., Zanatta, M., and Zeppenfeld, S.: The arctic cloud puzzle using acloud/pascal multiplatform observations to unravel the role of clouds and aerosol particles in arctic amplification, B. Am. Meteorol. Society, 100, 841–871, https://doi.org/10.1175/BAMS-D-18-0072.1, 2019. a, b, c
Wendisch, M., Brückner, M., Crewell, S., Ehrlich, A., Notholt, J., Lüpkes, C., Macke, A., Burrows, J. P., Rinke, A., Quaas, J., Maturilli, M., Schemann, V., Shupe, M. D., Akansu, E. F., Barrientos-Velasco, C., Bärfuss, K., Blechschmidt, A. M., Block, K., Bougoudis, I., Bozem, H., Böckmann, C., Bracher, A., Bresson, H., Bretschneider, L., Buschmann, M., Chechin, D. G., Chylik, J., Dahlke, S., Deneke, H., Dethloff, K., Donth, T., Dorn, W., Dupuy, R., Ebell, K., Egerer, U., Engelmann, R., Eppers, O., Gerdes, R., Gierens, R., Gorodetskaya, I. V., Gottschalk, M., Griesche, H., Gryanik, V. M., Handorf, D., Harm-Altstädter, B., Hartmann, J., Hartmann, M., Heinold, B., Herber, A., Herrmann, H., Heygster, G., Höschel, I., Hofmann, Z., Hölemann, J., Hünerbein, A., Jafariserajehlou, S., Jäkel, E., Jacobi, C., Janout, M., Jansen, F., Jourdan, O., Jurányi, Z., Kalesse-Los, H., Kanzow, T., Käthner, R., Kliesch, L. L., Klingebiel, M., Knudsen, E. M., Kovács, T., Körtke, W., Krampe, D., Kretzschmar, J., Kreyling, D., Kulla, B., Kunkel, D., Lampert, A., Lauer, M., Lelli, L., Von Lerber, A., Linke, O., Löhnert, U., Lonardi, M., Losa, S. N., Losch, M., Maahn, M., Mech, M., Mei, L., Mertes, S., Metzner, E., Mewes, D., Michaelis, J., Mioche, G., Moser, M., Nakoudi, K., Neggers, R., Neuber, R., Nomokonova, T., Oelker, J., Papakonstantinou-Presvelou, I., Pätzold, F., Pefanis, V., Pohl, C., Van Pinxteren, M., Radovan, A., Rhein, M., Rex, M., Richter, A., Risse, N., Ritter, C., Rostosky, P., Rozanov, V. V., Donoso, E. R., Garfias, P. S., Salzmann, M., Schacht, J., Schäfer, M., Schneider, J., Schnierstein, N., Seifert, P., Seo, S., Siebert, H., Soppa, M. A., Spreen, G., Stachlewska, I. S., Stapf, J., Stratmann, F., Tegen, I., Viceto, C., Voigt, C., Vountas, M., Walbröl, A., Walter, M., Wehner, B., Wex, H., Willmes, S., Zanatta, M., and Zeppenfeld, S.: Atmospheric and Surface Processes, and Feedback Mechanisms Determining Arctic Amplification, B. Am. Meteorol. Soc., 104, E208–E242, https://doi.org/10.1175/BAMS-D-21-0218.1, 2023a. a
Wendisch, M., Stapf, J., Becker, S., Ehrlich, A., Jäkel, E., Klingebiel, M., Lüpkes, C., Schäfer, M., and Shupe, M. D.: Effects of variable ice–ocean surface properties and air mass transformation on the Arctic radiative energy budget, Atmos. Chem. Phys., 23, 9647–9667, https://doi.org/10.5194/acp-23-9647-2023, 2023b. a, b, c
Williams, A. S. and Igel, A. L.: Cloud Top Radiative Cooling Rate Drives Non-Precipitating Stratiform Cloud Responses to Aerosol Concentration, Geophys. Res. Lett., 48, 1–11, https://doi.org/10.1029/2021GL094740, 2021. a, b, c
Yamamoto, A., Yamanouchi, T., and Wada, M.: Effective emissivity of clouds from radiometersonde measurements at Syowa station, Antarctica, Proceedings of the NIPR Symposium on Polar Meteorology and Glaciology, 9, 133–145, https://doi.org/10.15094/00003885, 1995. a
- Abstract
- Introduction
- Instruments and methods
- Radiative profiles in cloudless and cloudy conditions
- Impact of elevated clouds
- Profile of cloud radiative effect
- Conclusions
- Data availability
- Author contributions
- Competing interests
- Disclaimer
- Special issue statement
- Acknowledgements
- Financial support
- Review statement
- References