the Creative Commons Attribution 4.0 License.
the Creative Commons Attribution 4.0 License.
 | 08 Feb 2024
Roles of marine biota in the formation of atmospheric bioaerosols, cloud condensation nuclei, and ice-nucleating particles over the North Pacific Ocean, Bering Sea, and Arctic Ocean
Fumikazu Taketani
Kazuhiko Matsumoto
Yutaka Tobo
Yoko Iwamoto
Takuma Miyakawa
Akinori Ito
We investigated the association of marine biological indicators (polysaccharides, protein-like gel particles, and chl a) with the formation of fluorescent aerosol particles, cloud condensation nuclei (CCNs), and ice-nucleating particles (INPs) over the North Pacific Ocean, Bering Sea, and Arctic Ocean during September–November 2019. The abundance of bioindicators was high in the North Pacific Ocean and the Bering Sea (e.g., up to 1.3 mg m−3 of chl a), suggesting high biological activity due to a phytoplankton bloom. In the North Pacific Ocean, particles were characterized by high mass fractions of organics and sulfate with a predominance of terrestrial air masses. Conversely, in the Bering Sea and the Arctic Ocean, particles were characterized by high mass fractions of sea salt and sulfate with a predominance of maritime air masses. The averaged range/value of the CCN concentration at 0.4 % supersaturation were 99–151, 43–139, and 36 cm−3 over the North Pacific Ocean with terrestrial influences, over the Bering Sea with marine biogenic influences, and over the Arctic Ocean with marine influences, respectively, and the corresponding range/value of the hygroscopicity parameter κ were 0.17–0.59, 0.42–0.68, and 0.66, respectively. The averaged INP concentration (NINP) measured at temperatures of −18 and −24 ∘C with marine sources in the North Pacific and Bering Sea was 0.01–0.09 and 0.1–2.5 L−1, respectively, and that over the Arctic Ocean was 0.001–0.016 and 0.012–0.27 L−1, respectively. When marine sources were dominant, fluorescent bioaerosols in the fine mode were strongly correlated with all bioindicator types (R: 0.81–0.88) when the effect of wind-induced uplift from the sea surface to the atmosphere was considered. Correlations between NINP measured at −18 and −24 ∘C and all bioindicator types (R: 0.58–0.95 and 0.79–0.93, respectively) were positive, even when the extreme outlier point was omitted, as were those between NINP and fluorescent bioaerosols (R: 0.50 and 0.60, respectively), suggesting that marine bioindicators contributed substantially as sources of bioaerosols and to cloud formation.
- Article
(4254 KB) - Full-text XML
-
Supplement
(768 KB) - BibTeX
- EndNote


Aerosol particles can affect the climate system directly by absorbing and scattering solar radiation and indirectly by radiative cooling and albedo modulation via cloud processes (Ramanathan et al., 2001). Despite progress, our process-level understanding of aerosols remains far from complete, particularly owing to their diverse roles in aerosol–cloud interactions and complex links to natural systems that include the oceans (IPCC AR6, 2021). Primary biological aerosol particles originating from sea-surface organic matter (OM) derived from marine ecosystems could be uplifted into the atmosphere as sea spray aerosols (SSAs) (Cochran et al., 2017). Such particles could affect cloud processes by acting as cloud condensation nuclei (CCNs) and ice-nucleating particles (INPs) (Brooks and Thornton, 2018). Biological aerosol particles (bioaerosols) are composed of biological material, such as bacteria, algae, fungal spores, pollen, leaves, or cell pigments, and they might be detectable by their fluorescence (Després et al., 2012; Fröhlich-Nowoisky et al., 2016; Fennelly et al., 2018). Online methods, wideband integrated bioaerosol sensors (WIBSs), and ultraviolet aerodynamic particle sizers (UV-APSs) have all been applied to specific target species such as amino acids, proteins, and coenzymes in cells (Pöhlker et al., 2012; Gabey et al., 2010). More visually, microscopic or imaging methods have been adapted to specifically stain the cell nucleus and DNA/RNA for living cell counts (Maki et al., 2013; Fröhlich-Nowoisky et al., 2016). As they are potentially related sea-surface OM derived from marine ecosystems, studies have investigated gel-like organic particles, such as polysaccharide-containing transparent exopolymer particles (TEPs) and protein-containing Coomassie stainable particles (CSPs), because they aggregate in the sea-surface microlayer under low wind speed (WS) conditions and are released into the atmosphere via wave breaking under high WS conditions (Gantt et al., 2011; Sun et al., 2018). Also, chlorophyll a (chl a) is well known as a biological surrogate for predicting sea spray organic enrichment and is commonly used as an input parameter to combine oceanic biology and atmospheric dynamics with WS (Rinaldi et al., 2013).
Bioaerosols originating from biogenic OM in marine ecosystems can contribute to both CCNs and INPs during periods of high biological activity (Vergara-Temprado et al., 2017; Creamean et al., 2019). The interaction and partitioning between CCNs and INPs originating from primary biological aerosol particles with water saturation in mixed-phase clouds are important for understanding the abundance of cloud droplets and ice crystals in cloud processes (Quinn and Bates, 2014; Brooks and Thornton, 2018; Burrows et al., 2022). Generally, CCNs and INPs have different activation characteristics in terms of chemical composition and size. For example, mainly highly hygroscopic particles with high solubility such as sulfate and sea salt in submicron particles are likely to be active as CCNs, whereas less hygroscopic particles such as dust and volcanic ash in the coarse mode are likely to be active as INPs (Sun and Ariya, 2006; Murray et al., 2012). For CCN activation, local biogenic OM and organic aerosols, including surfactants, act as CCNs (Facchini et al., 2008; Fuentes et al., 2011; Ovadnevaite et al., 2011), mainly in submicron particles, while more hygroscopic components such as sulfate and sea salt, mainly in supermicron particles, also contribute (Gong et al., 2019). Some particles may form giant CCNs and be activated as larger-sized cloud droplets (Sun and Ariya, 2006; Möhler et al., 2007). For INP activation, mineral dust particles are the primary contributors to INP concentrations with long-range transport, especially in the Northern Hemisphere (DeMott et al., 2010, 2015), but microorganisms and biological substances (i.e., bacteria and algae) might also contribute, largely in low-level and mixed-phase clouds in regions that are not influenced by dust/terrestrial sources (Burrows et al., 2013), because they can activate as INPs at relatively high temperatures, i.e., higher than −10 ∘C (Hoose and Möhler, 2012). INP activation of biogenic materials is effective in comparison with the case of homogeneous ice nucleation (−36 ∘C) or other typical materials such as dust particles (Murray et al., 2012). However, in comparison with terrestrial bioaerosols (e.g., OM in forests and soil), the amount, behavior, and appropriate indicators of marine bioaerosols remain poorly understood owing to a lack of observations (Xie et al., 2021). Therefore, information gained from in situ observations and modeling studies on the production of bioaerosols and their emission from the sea surface into the atmosphere, their abundance in the atmosphere, and their relative relationships with CCNs and INPs is critical when considering the importance of bioaerosols to the radiative budget and climate effects via aerosol–cloud processes. Previous comprehensive observational studies focusing on sea surface–aerosol–cloud interactions are limited (Abbatt et al., 2019; van Pinxteren et al., 2020; McFarquhar et al., 2021), and only a few studies have discussed the responses of the abundance of CCN and INP number concentrations and activation properties to biogeochemical and environmental conditions based on in situ observations in the Southern Ocean and Antarctic (Schmale et al., 2019; Tatzelt et al., 2022), Arctic Ocean (Shupe et al., 2022), and Mediterranean Sea (Gong et al., 2019; Tang et al., 2022). Recently, an annual cycle of observations was conducted during the Multidisciplinary drifting Observatory for the Study of Arctic Climate (MOSAiC) expedition to investigate the relationship between aerosols and clouds and to assess the impact of aerosols on the climate. Preliminary results revealed seasonal variation in the number concentrations of CCNs and INPs relative to that of total particles (Shupe et al., 2022). However, the specific relationships between biogenic OM in seawater, fluorescent particles that are proxies for bioaerosols, and cloud particle formation remain unclear, and comprehensive cross-sectional studies are yet to be conducted.
In this study, shipboard observations were obtained in the North Pacific Ocean, Bering Sea, and Arctic Ocean to investigate the biogeochemical processes leading to marine biogenic sources, fluorescent bioaerosols, and CCNs and INPs between the sea surface and the atmosphere. We present the physicochemical properties of aerosol particles and oceanic precursors (i.e., chemical compositions, number concentrations and mass concentrations) and discuss the parameters for CCN and INP activation in relation to the biogeochemical cycles between the atmosphere and ocean. Moreover, we provide equations to link the amount of marine bioaerosols, CCNs, and INP concentrations from marine bioindicators with correlation analysis to assess the impact of biological indicators (i.e., TEP, CSP, and chl a) on marine fluorescent bioaerosols and CCN and INP activation.
2.1 Online measurements of atmospheric aerosols and trace gases
Cruise observations were conducted in the North Pacific Ocean, Bering Sea, and Arctic Ocean onboard R/V Mirai (JAMSTEC) during 27 September to 10 November 2019. A WIBS (model-4A, Droplet Measurement Technologies, Longmont, CO, USA) was placed on the compass deck, and particles were introduced directly via the inlet to the instruments at ambient relative humidity. Fluorescent aerosol particles (FAPs) were observed by the WIBS-4A, which detected autofluorescence from individual particles in two wavelength bands (310–400 and 420–650 nm) upon excitation using two xenon flash lamps emitting at different wavelengths, i.e., 280 and 370 nm (Healy et al., 2012). The FAPs were classified into seven types depending on the fluorescence pattern: those with fluorescence band at a single wavelength were Type A (excitation = 280 nm, fluorescence = 310–400 nm), Type B (excitation = 280 nm, fluorescence = 420–650 nm), or Type C (excitation = 370 nm, fluorescence = 420–650 nm), while those with a combination of fluorescence bands were categorized as Type AB, AC, BC, or ABC (Perring et al., 2015). Size distributions of fluorescent and nonfluorescent particles were derived from the scattering intensity measurements obtained using a continuous-wave 635 nm diode laser (O'Connor et al., 2013). Previous studies reported that either a 3σ or 9σ signal level could be used as a baseline threshold to distinguish fluorescent particles from others, with the 1σ level determined as the background fluctuation in the absence of particles (Crawford et al., 2016). In this study, we used 3σ as the threshold value. Fluorescent polystyrene latex particles with a size of 2 µm (PSL, G0200, Thermo Fisher Scientific, Waltham, MA, USA) were introduced before and after the observations were conducted to check the validity of the particle size and the fluorescence intensity detected by the instrument (Robinson et al., 2017; Savage et al., 2017).
For online measurements of atmospheric aerosol particles in dry conditions, an inlet for the total suspended particles (model: URG-2000-30DG, URG, NC, USA) was placed approximately 18 m above sea level on the compass deck. Size-resolved aerosol number concentrations from 10 to 415.8 nm were observed by a scanning mobility particle sizer (SMPS; model: 3910, TSI, USA). The CCN number concentration (NCCN) and condensation nucleus (CN) number concentration were observed by a CCN counter (CCNC; model: 100, Droplet Measurement Technologies, Longmont, CO, USA) and a mixing condensation particle counter (MCPC; model: 1710, Brechtel, Hayward, CA, USA), respectively. Particles fed in via the inlet were dried in a Nafion™ tubing drier (model: MD-700, Perma Pure Inc., NJ, USA) to maintain the relative humidity below 40 %, and the particles were introduced to the instruments in the research laboratory via conductive tubes. Ammonium sulfate particles (purity: 99.999 %, Sigma-Aldrich, USA) were introduced into the CCNC before and after the observations to confirm the different supersaturation (SS) conditions at settings of 0.1 %, 0.2 %, 0.4 %, and 0.7 %. The SS conditions of the CCNC were switched every 15 min (one cycle lasted 1 h). In the analysis of CCNs, the data points from the final 3 min were used for analysis under stable SS and flow conditions (a ratio of sample to sheath flow of 9.5–10.5) (Kawana et al., 2022b).
The CCN activation diameter (dact) was calculated as the critical diameter at which NCCN was equal to the total particles (Ntotal, 10–415.8 nm), with number–size distributions derived from the SMPS in parallel, under the assumption that particles activate as CCNs from larger particles with an internal mixing state (Furutani et al., 2008). Then, the hygroscopicity parameter κ was derived from dact based on the κ-Köhler equation (Petters and Kreidenweis, 2007):
where S is the equilibrium supersaturation, σs is the surface tension, Mw is the molecular weight of water, R is the universal gas constant, T is the absolute temperature, and ρw is the density of water. Here, T was assumed to be 300 K, i.e., the mean temperature of the top of the CCNC column. The value of the surface tension σs was assumed to be that of pure water (71.5 mN m−1). In the calculation of κCCNC, dact was applied as dp,dry, dp,wet was assumed to be the particle diameter in humidified conditions, and S was taken to be the SS conditions in the observation. The detailed procedure for the calculation is described in Kawana et al. (2016). The activation fraction (AF) was obtained as the ratio of NCCN to Ntotal.
In the trace gas measurements, ozone (O3) and carbon monoxide (CO) concentrations were measured using UV (model: 205, 2B Technologies, Boulder, CO, USA) and nondispersive infrared (model: 48C, Thermo Fisher Scientific, Waltham, MA, USA) sensors. The data points were removed when large instabilities or reduced levels of the 1 min O3 were recorded, indicating titration by nitrogen oxide in the fresh ship exhaust (Kanaya et al., 2019). All data points from the online measurements were screened using the same criteria that were applied to the operation of the pump of the high-volume air sampler to avoid contamination from the ship exhaust (see Sect. 2.2).
2.2 Offline measurements of atmospheric aerosols and seawater sampling
In the offline measurements, a high-volume air sampler (model: HV-525PM, Sibata Scientific Technology, Ltd., Tokyo, Japan) used for chemical analysis was placed on the compass deck, and particles with a diameter of <2.5 µm (PM2.5) were collected on a quartz filter (model: QR-100, Advantec, Tokyo, Japan) using an impactor at a flow rate of approximately 500 L min−1 every 2 d. For the chemical analysis, the quartz filter was baked at 900 ∘C to avoid contamination and then packed in a glass bottle before the observation (Taketani et al., 2022). Aliquots of each filter sample were used for the ionic chemical composition, EC/OC (elemental carbon/organic carbon), and levoglucosan analyses. The mass concentrations of ionic species (, Na+, K+, Ca2+, Mg2+, Cl−, , and ) were measured by ion chromatography (model: ICS-1000, Dionex Co., CA, USA), and the mass concentrations of sea salt and non-sea-salt sulfate (nss-) were calculated from Na+ assuming the standard seawater composition (Warneck, 2000). The mass concentrations of OC and EC in the PM2.5 were also obtained using a thermal/optical carbon analyzer (model: DRI 2001, Desert Research Institute, Reno, NV, USA) with the Interagency Monitoring of Protected Visual Environments protocol, and the mass concentrations of water-insoluble organic carbon were derived by subtracting the measured water-soluble organic carbon from the total OC. Levoglucosan was analyzed using a derivatization gas chromatography mass spectrometer (model: GCMS-QP2010Plus, Shimadzu Co., Kyoto, Japan).
Additionally, a custom-made air sampler for INP analysis was installed, and non-size-selective ambient particles were collected onto a polycarbonate membrane filter (0.2 µm pores, Whatman) at a flow rate of 10 L min−1 every 2 d. A polycarbonate filter (φ: 47 mm) was immersed into MilliQ-purified water to prepare a suspension of particles. Then, using particle-containing water droplets with a volume of 5 µL, the number concentrations of INPs upon immersion freezing were obtained using the National Institute of Polar Research Cryogenic Refrigerator Applied to Freezing Test (Tobo, 2016). After performing detections between 0 and −30 ∘C in 0.5 ∘C steps, the number concentrations of INPs determined at three selected temperatures (−18, −24, and −30 ∘C) were used for analysis in this study. The detailed extraction and analysis procedures for INP measurements are described elsewhere (Tobo, 2016; Tobo et al., 2020). Samples for analyzing the chemical composition and INPs were collected in a sterile centrifuge tube and then stored prior to analysis at approximately −20 ∘C in a freezer and at 4 ∘C in a refrigerator, respectively. To prevent contamination from the ship exhaust, a wind selector was used to stop the sampling pumps automatically when the wind direction deviated by more than ±75∘ from the bow direction or when the WS fell below 2 m s−1.
Surface seawater sampling for TEPs and CSPs was performed using a bucket at 22 sampling stations. In the analysis of CSPs, 200 mL of seawater were filtered through a Nuclepore™ polycarbonate membrane filter (cut size: 0.4 µm, Cytiva, Tokyo, Japan), and triplicate filters were obtained from each seawater sample on the ship just after sampling. Coomassie brilliant blue staining solution (1 mL ) was added to the filter, which was then rinsed five times with 1 mL of Milli-Q® water after 1 min of staining. The filters for CSPs were stored at −40 ∘C in a freezer. For TEPs, formalin was added to water samples to give a final concentration of 1 % () after sampling, and they were preserved in a refrigerator (4 ∘C). TEP samples were then filtered in the laboratory in the same manner as CSP samples. In the laboratory analysis of TEPs, 1 mL of Alcian blue staining solution, adjusted to pH 2.5, was added to the filter, and the filter was rinsed three times with 1 mL of Milli-Q® water after 4 s of staining. Filter samples for TEPs were soaked for 2 h in 6 mL of 80 % sulfuric acid for extraction, and absorbance was measured at a wavelength of 787 nm (Alldredge et al., 1993). For CSPs, 1 mL of Coomassie brilliant blue staining solution was added to the filter, which was then rinsed five times with 1 mL of Milli-Q® water after 1 min of staining. Filter samples were soaked for 2 h in 4 mL of 3 % sodium dodecyl sulfate in 50 % isopropyl alcohol with ultrasonic extraction to elute the dye, and the absorbance of the solution was measured at a wavelength of 615 nm (Cisternas-Novoa et al., 2015). The calibration curves for the relationship between absorbance/weight and abundance for TEPs and CSPs were produced using a xanthan gum solution (XG, Sigma-Aldrich Co. LLC, St. Louis, MO, USA) and bovine serum albumin (BSA, Sigma-Aldrich Co. LLC, St. Louis, MO, USA) as a standard solution, respectively. Then, the TEP and CSP concentrations were quantified as the XG-equivalent (Passow and Alldredge, 1995) and BSA-equivalent (Thornton, 2018) concentrations, respectively.
Seawater samples collected from the surface were filtered (500 mL) onto 25 mm Whatman GF/F glass-fiber filters and extracted with N,N-dimethylformamide to determine concentrations of chl a using a fluorometer (model: 10-AU, Turner Designs, Inc., San Jose, USA). Seawater samples (10 mL) were collected and used for nutrient analysis using a continuous segmented flow analyzer (model: QuAAtro 2-HR, BL TEC K.K., Tokyo, Japan). Meteorological parameters at the sea surface, such as the WS and sea surface temperature, were measured by the monitoring system onboard R/V Mirai.
3.1 Air mass origin, chemical composition, and trace gases
We identified five periods with different air mass origins in different sea regions during the cruise (Fig. 1a–e: Period 1 (P1, 30 September to 6 October 2019 in the North Pacific Ocean), where air masses originated from terrestrial regions with anthropogenic sources (i.e., the Asian continent); Period 2 (P2, 7–9 October 2019), Period 3 (P3, 10–27 October 2019), and Period 4 (P4, 28 October to 2 November 2019), with potential influences from the Bering Sea, Arctic Ocean, and Bering Sea, respectively; and Period 5 (P5, 3–7 November 2019 in the North Pacific Ocean), where influences from anthropogenic sources were as evident as in P1. Here, air mass origin was classified according to 5 d backward trajectories obtained using the NOAA HYSPLIT model (Stein et al., 2015) from a starting altitude of 500 m and based on the Global Data Assimilation System with resolution from the National Center for Environmental Prediction. The characteristics of the observational parameters in each period are summarized in Table 1.
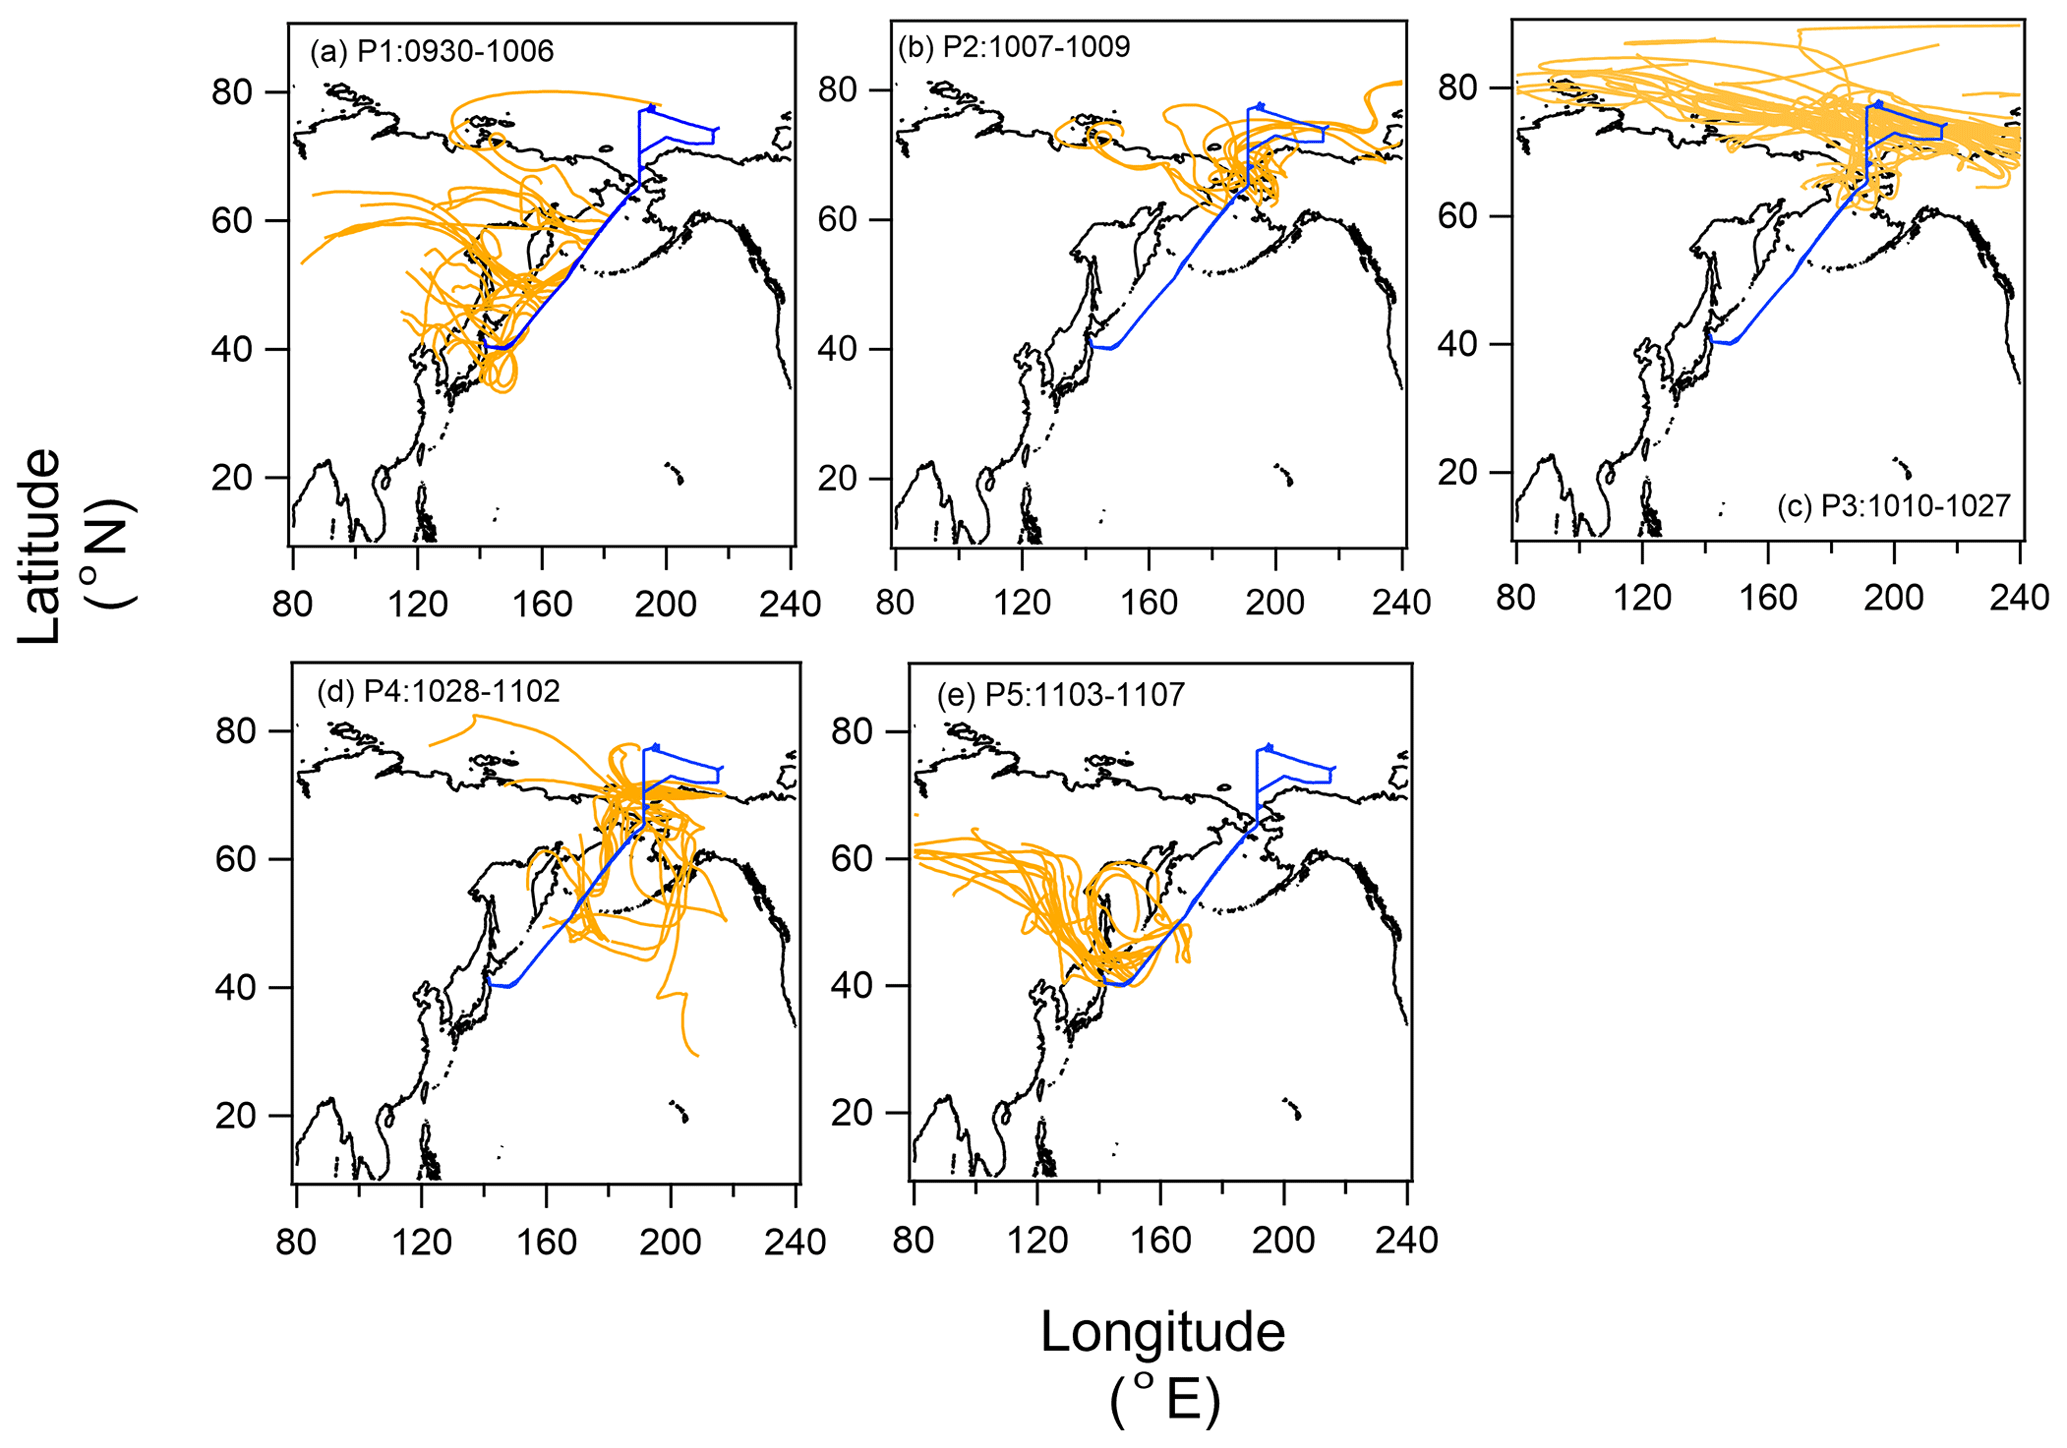
Figure 1Five-day backward trajectories of air parcels along with the cruise track (00:00, 06:00, 12:00, and 18:00 UTC) for (a) Period 1 (P1; 30 September to 6 October 2019), (b) Period 2 (P2; 7–9 October 2019), (c) Period 3 (P3; 10–27 October 2019), (d) Period 4 (P4; 28 October to 2 November 2019), and (e) Period 5 (P5; 3–7 November 2019). The blue line indicates the cruise track.
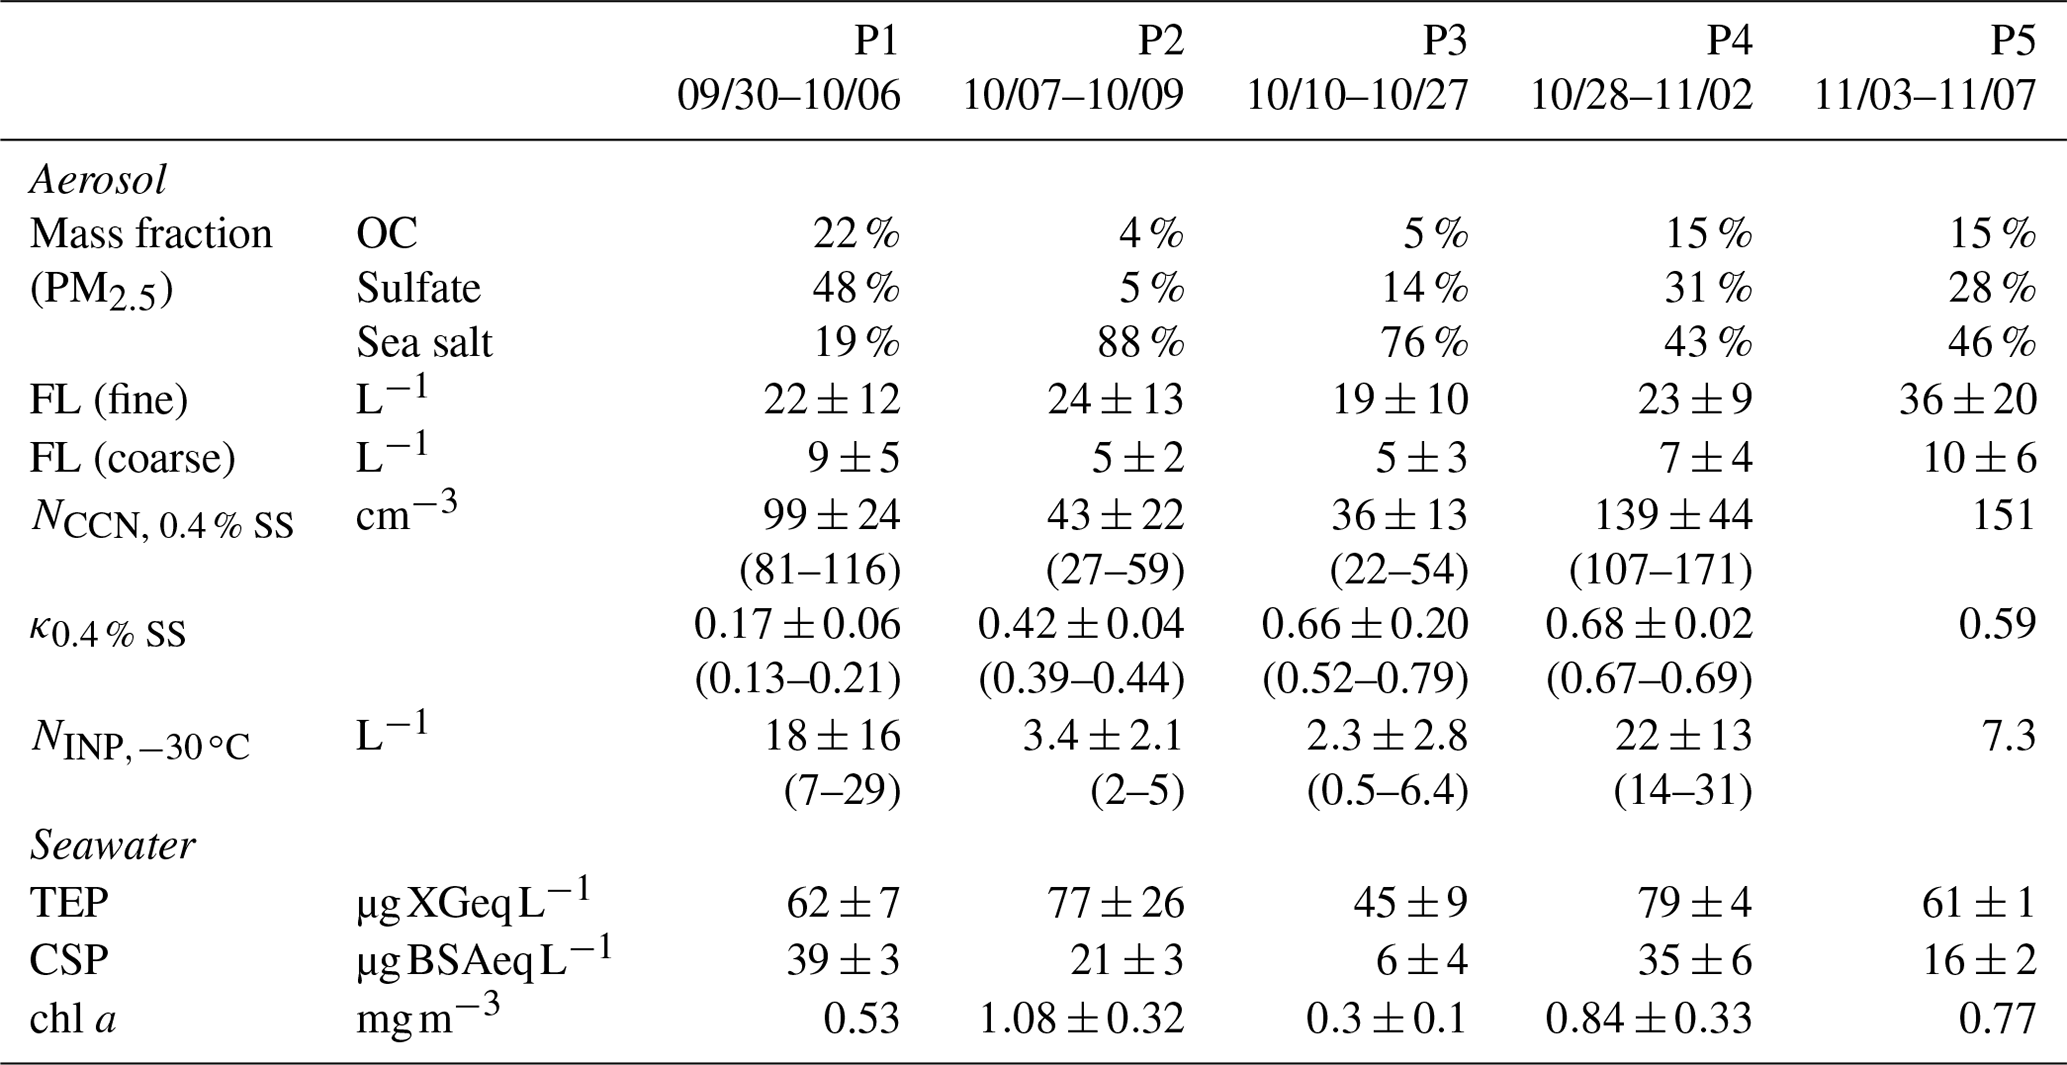
Table 1Summary of observation parameters in each period. FL (fine): fluorescent particles with a diameter of >1 µm ( µm), FL (coarse): fluorescent particles with a diameter of >2.5 µm (Dp>2.5 µm), TEP: transparent exopolymer particle, CSP: Coomassie stainable particle, OC: organic carbon.
The temporal variations in the mass concentrations of major components and mass fractions of chemical components (OC, EC, inorganics (, , and ), and sea salt) in the PM2.5 particles are shown in Fig. 2a–e. The compositional characteristics show a clear response to changes in air mass (Fig. S1 in the Supplement). OC and sulfate represented the main components during P1 and P5 (15 %–22 % and 28 %–48 %, respectively), implying a strong influence from terrestrial sources. Sea salt was the main component during P2 and P3 (76 %–88 %), suggesting a predominance of local marine sources, including biogenic OM with SSAs. During P4, OC, sulfate, and sea salt were dominant (15 %, 31 %, and 43 %, respectively), suggesting a marine influence with relatively high biological activity in this period. During P5, when the air masses originated from the Asian continent, the mass concentrations of Ca2+ and Mg2+ (as indicators of dust mineral particles) and that of levoglucosan (as an indicator of biomass burning) had the highest values (averages: 0.07 µg m−3 for Ca2+ and Mg2+ and 8.1 ng m−3 for levoglucosan, Fig. 2d), whereas the levels of those indicators were lower in the other periods, implying that the influences of both mineral dust particles and biomass burning were limited. The O3 and CO concentrations also varied in accordance with the air mass classification; they were high in the North Pacific Ocean (∼42 and ∼120 ppb, respectively) and low in the Arctic Ocean and the Bering Sea (35–38 and ∼110 ppb, respectively) (Fig. 2f and g).
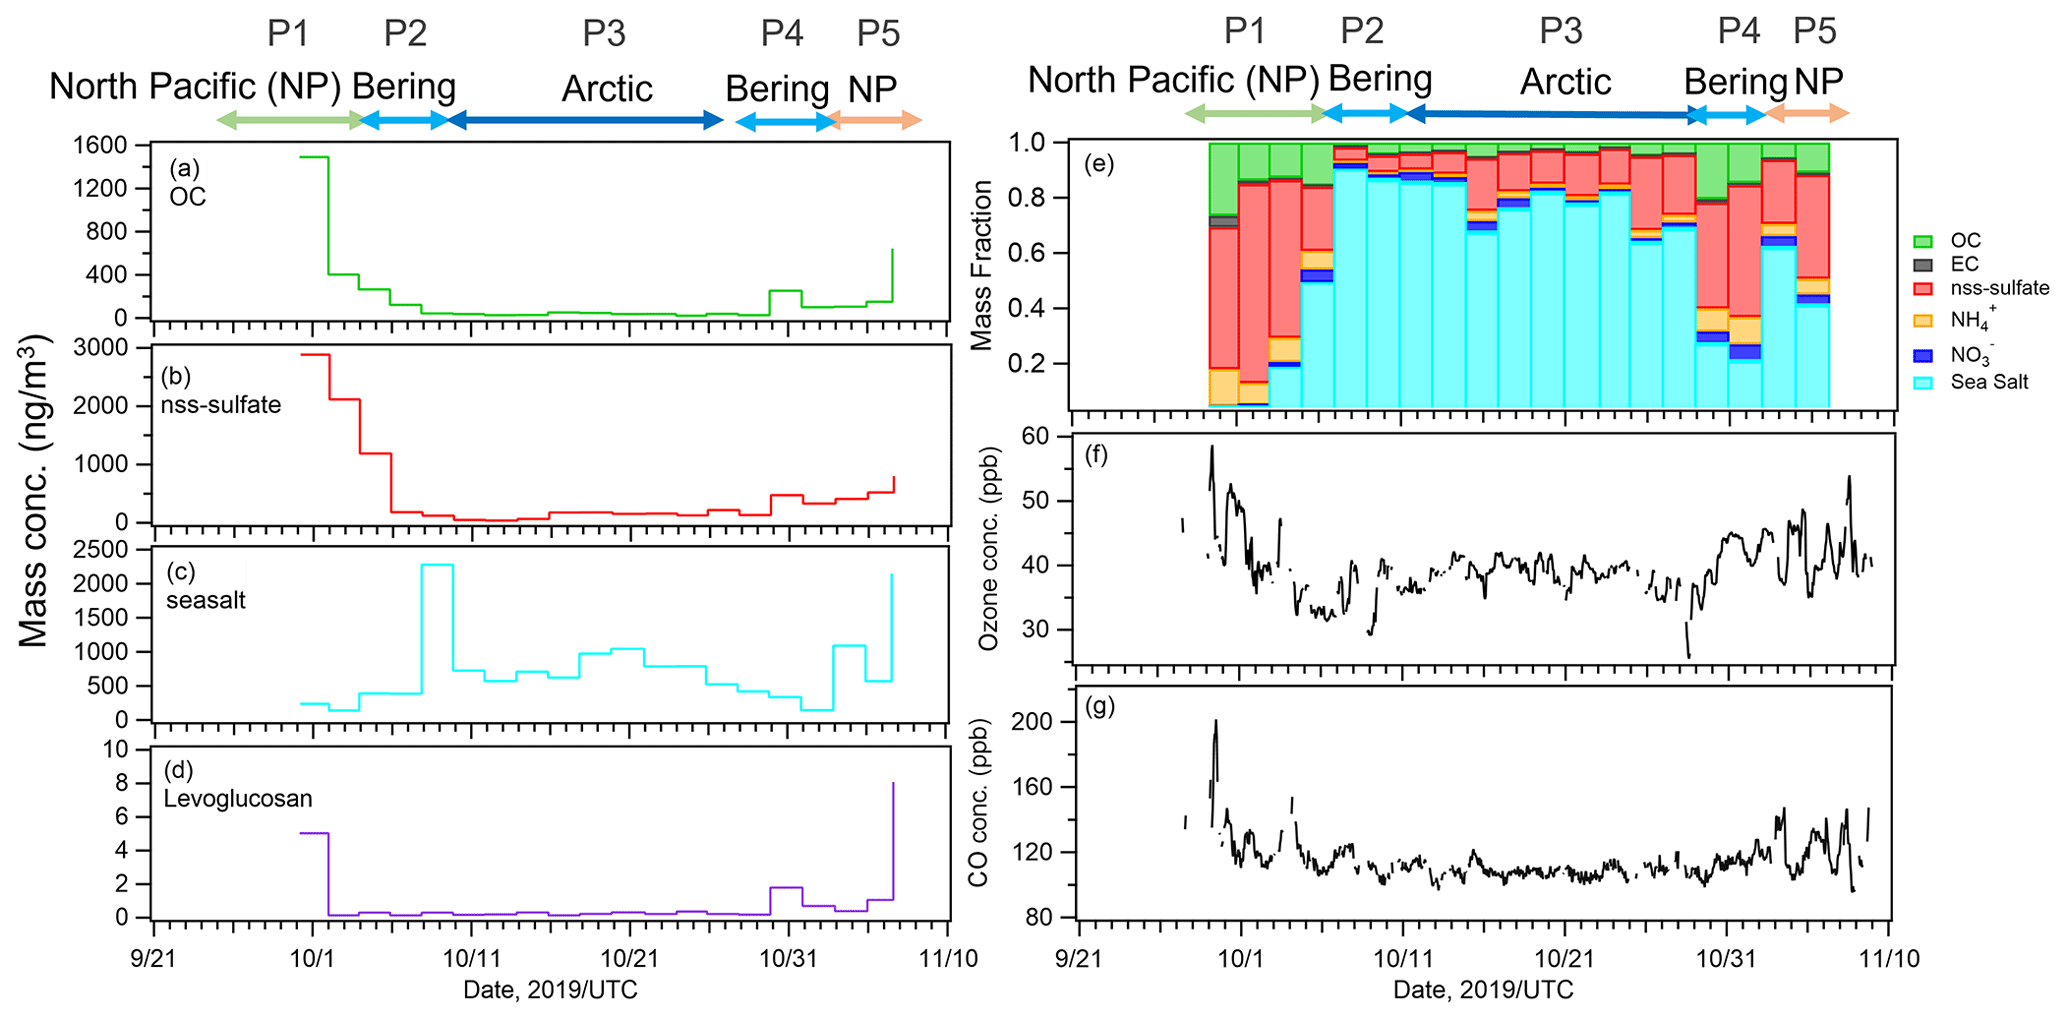
Figure 2Time series of mass concentrations of (a) organic carbon (OC), (b) non-sea-salt sulfate (nss-sulfate), (c) sea salt, and (d) levoglucosan. Time series of (e) mass fractions of chemical components: OC, elemental carbon (EC), nss-sulfate, ammonium, nitrate, and sea salt. (f) Ozone and (g) carbon monoxide (CO) concentrations during the observation period.
3.2 Distributions of biological indicators in surface seawater
Temporal variations of chl a and biological organic gel particles (TEPs and CSPs) in the surface seawater are shown in Fig. 3a and b. The concentration of chl a was high in the North Pacific Ocean and the Bering Sea (mean values ± one standard deviation (1σ): 0.86 ± 0.23 mg m−3), as was the nutrient content (Fig. S2 in the Supplement), suggesting high biological activity (e.g., a phytoplankton bloom). Levels of particulate organic matter in the form of TEPs and CSPs were also relatively high in the North Pacific Ocean and the Bering Sea (mean values ± 1σ: 73 ± 34 µg XGeq L−1 and 24 ± 22 µg BSAeq L−1, respectively), following the trend of chl a. The spatial distributions of TEPs and CSPs are also presented in Fig. 3c and d. In particular, high concentrations of bioindicators (i.e., TEPs, CSPs) were observed from the Bering Sea to the Chukchi Sea (P2 and P4, Fig. 3c and d), corresponding to changes in nutrient concentrations. Conversely, over the Arctic Ocean, the concentration of CSPs decreased markedly to 12 ± 13 µg BSAeq L−1, while TEPs and chl a maintained relatively high concentrations (47 ± 10 µg XGeq L−1 and 0.33 ± 0.12 mg m−3, respectively) in comparison with those previously reported during summer (August–September) (Park et al., 2019, TEPs: ∼20 µg XGeq L−1, CSPs: ∼20 µg BSAeq L−1, and chl a: ∼0.2 mg m−3).
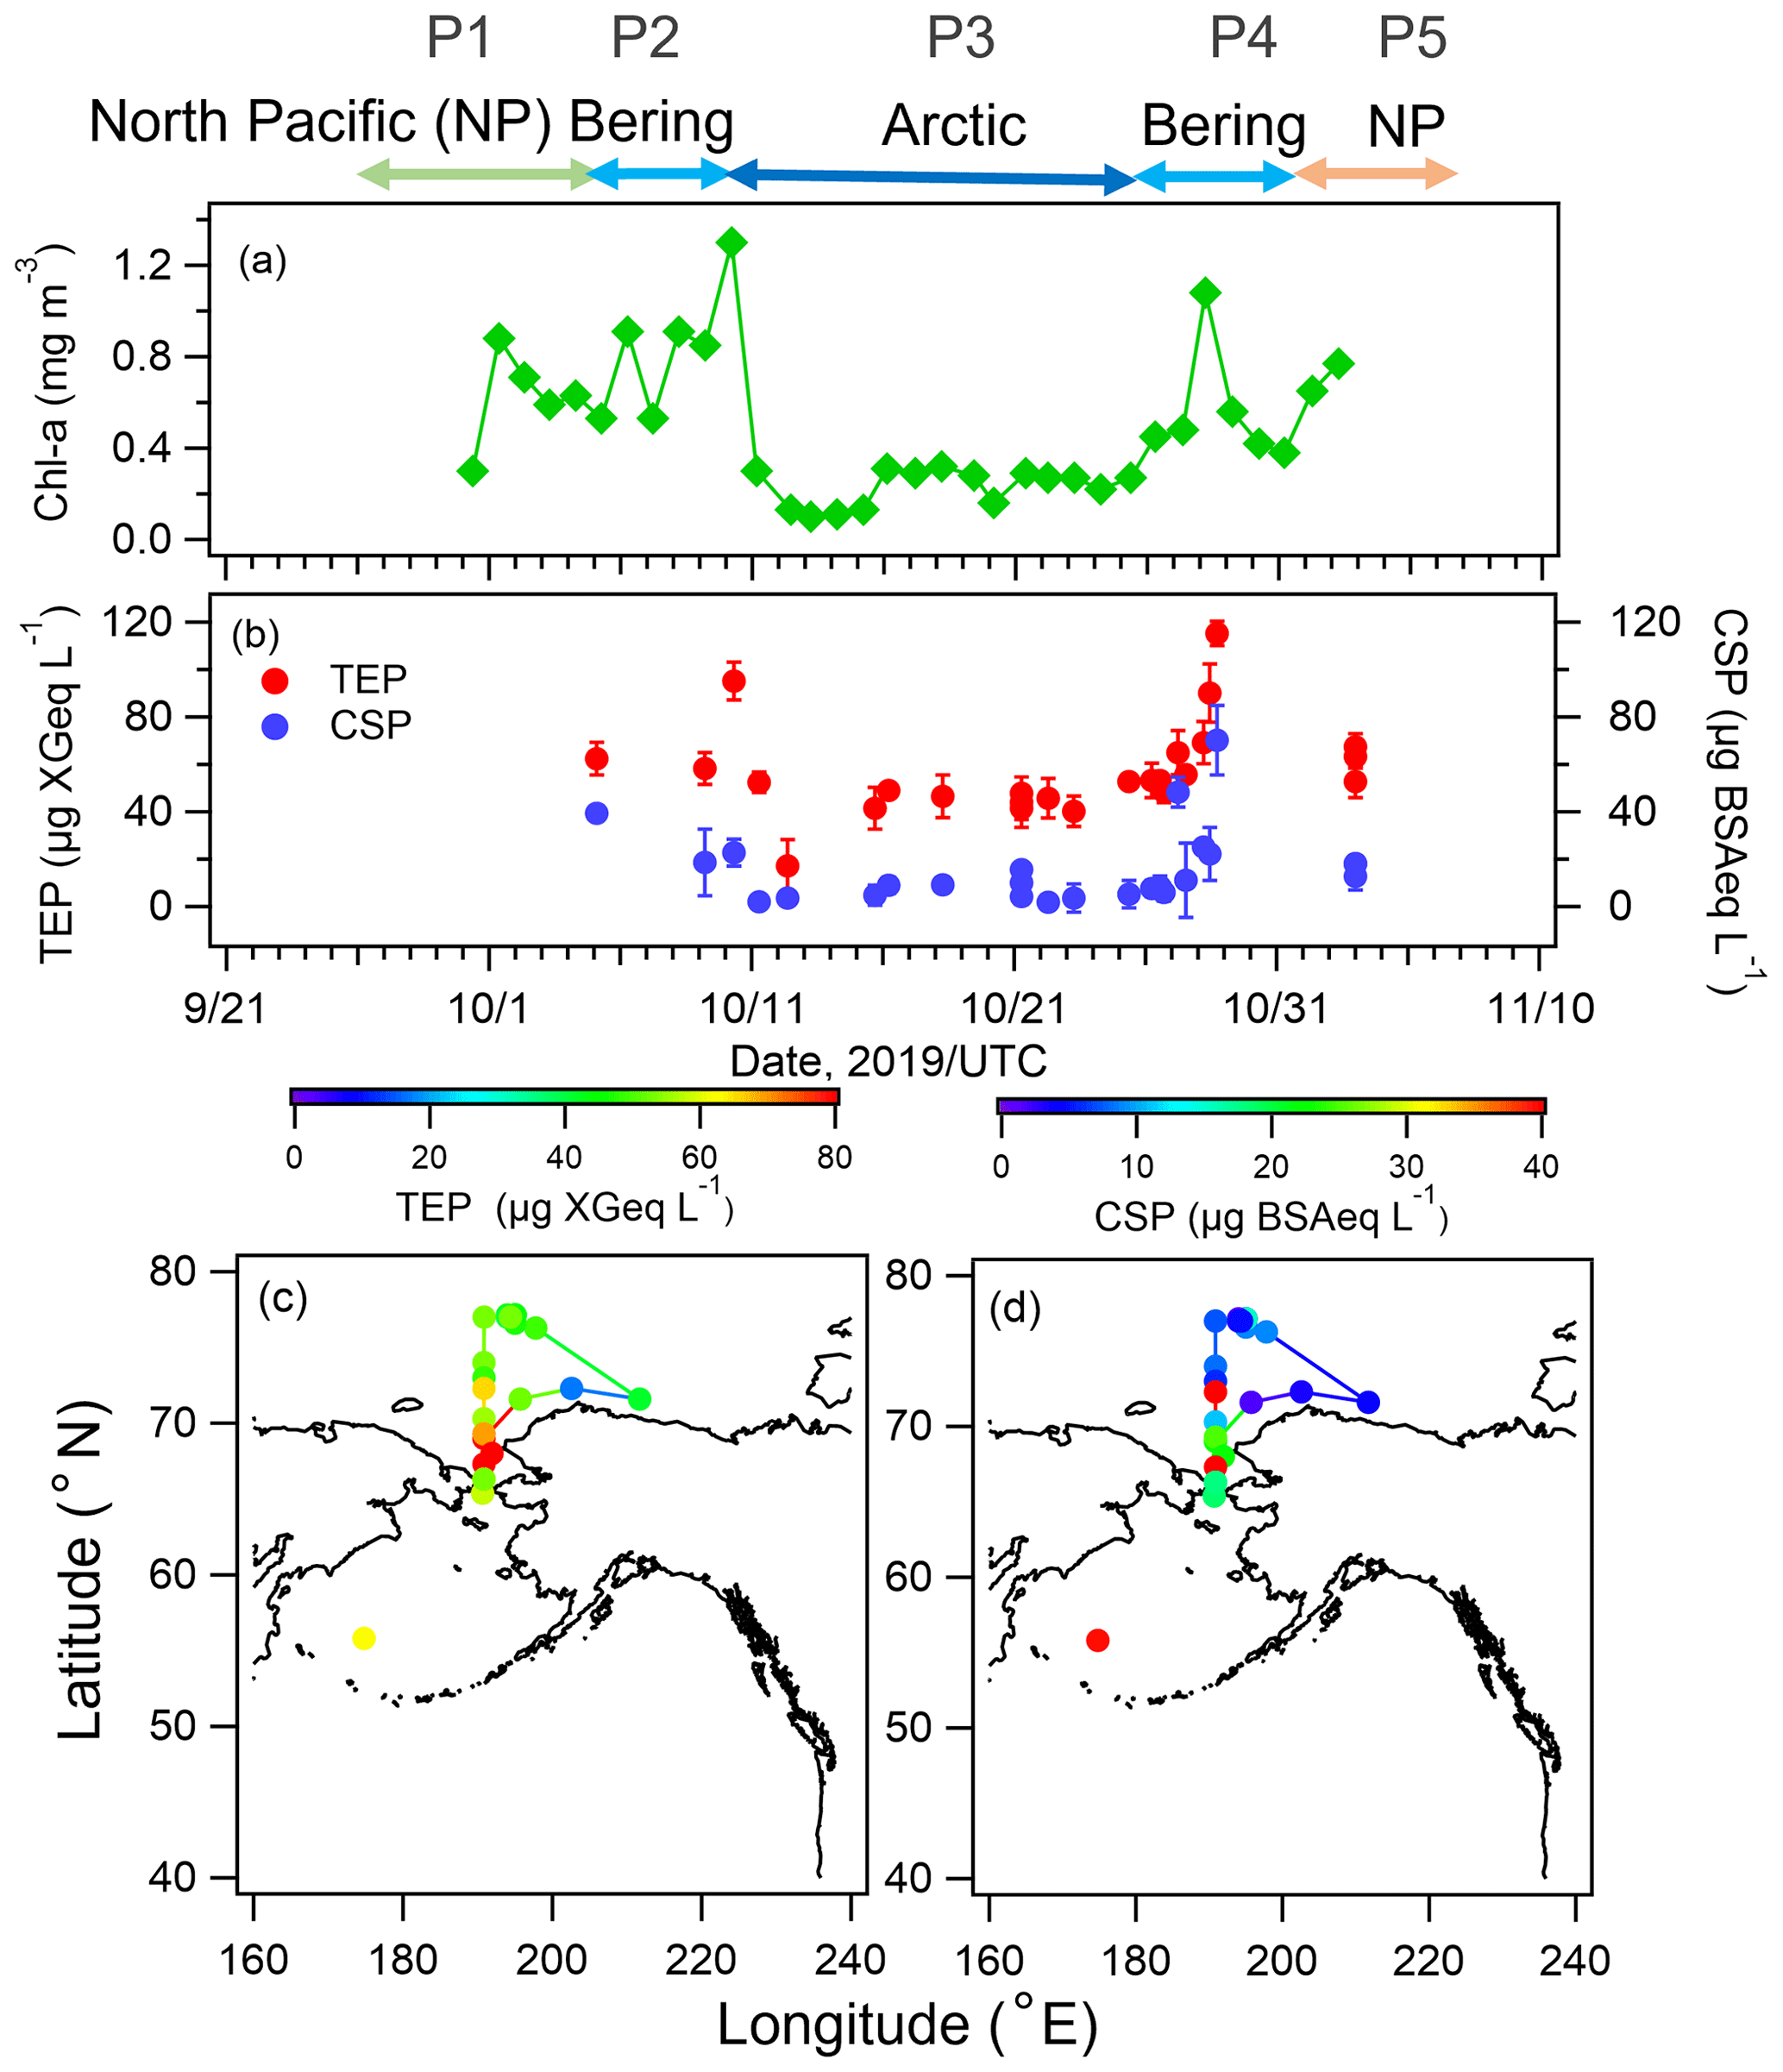
Figure 3Time series of concentrations of (a) chl a, (b) TEPs, and CSPs and geographic distributions of (c) TEPs and (d) CSPs during the observation period. Error bars represent one standard deviation.
In the Bering Sea and the Chukchi Sea, phytoplankton blooms have been observed from late summer to autumn in previous studies. Autumn phytoplankton blooms might be triggered by wind-induced mixing in biological hotspots, where nutrient-rich water originating from the Bering Sea flows into the Chukchi Sea and produces high concentrations of chl a and biological OM (Nishino et al., 2016). Matsuno et al. (2015) also reported that the supply of nutrient-rich water from the deep layer can lead to phytoplankton blooms, with an increase in large-sized chl a (∼10 µm) and variation in the zooplankton community in the biological hotspot of this area. Our results indicate that high concentrations of marine primary OM such as TEPs and CSPs might have resulted from high biological activity due to a phytoplankton bloom associated with the mixing of nutrient-rich water. As mentioned in Sect. 3.1, backward trajectory analysis suggests that air masses with marine sources were generally free of a terrestrial/anthropogenic influence (Fig. 1c) during P2, P3, and P4, and that sea salt was the major component, with OM accounting for 5 %–10 % of the mass of PM2.5 (Fig. 2e). This indicates that primary organic aerosols from biological activity in the ocean surface might have been ejected into the atmosphere as SSAs associated with wave breaking under high-WS conditions (Sun et al., 2018). This process might have been strongly involved in the formation of marine bioaerosols, which could be relevant to local major sources of CCNs and INPs in remote open-ocean areas. We discuss the links between biological activity on the sea surface and bioaerosols in the atmosphere in Sect. 3.3 and examine the consequent impacts on cloud processes in the Arctic in Sects. 3.4 and 3.5.
3.3 Fluorescent aerosol particles (FAPs) over the North Pacific Ocean, Bering Sea, and Arctic Ocean
Figure 4a shows the time series of the number concentrations of FAPs and total (fluorescent and nonfluorescent) particles with an optical diameter (Dp) of >1 µm (i.e., µm) as measured by the WIBS-4A. The average number concentration of FAPs during the entire observation period was 25 particles L−1, representing a 2.5 % fraction of the total particles. In terms of the classified fractions of particles based on the seven fluorescence patterns (Fig. 4b), Types A (41 %), B (28 %), and AB (10 %) were dominant. The total number density of FAPs was correlated positively with WS during the entire observation period (∼R: 0.5) (Fig. 4c and d). The correlation between FAPs and WS was high during P2 (R: 0.57) and P4 (R: 0.80), when the marine biogenic source (according to our bioindicator analysis) was more dominant than in other periods, suggesting that the FAPs over the ocean originated from local emission from the sea surface in association with strong winds and high waves. The number fraction of Type C particles increased over the Arctic Ocean (P3), while that of Types B and BC increased near land at the end of the period (P5). In the case of coarse-mode particles (Dp>2.5 µm, Fig. S3 in the Supplement), the average number concentration of FAPs was 7 particles L−1 and the fraction of fluorescent particles in the total particles was 7 %. The fraction of particles emitting fluorescence in multiple bands, such as Type AB (17 %) and Type ABC (14 %), increased, while Type A (28 %) and Type B (31 %) particles were also dominant. This result is consistent with observations of primary biological aerosol particles emitted with SSAs during summer in the pristine Southern Ocean, i.e., Types A, B, AB, and ABC were the major patterns, and fluorescent particle concentrations ranged from 10−1 to 101 particles L−1 (Moallemi et al., 2021). Regarding the variation of the fluorescence pattern, a previous study based on laboratory experiments using certain bioaerosol materials (i.e., bacteria, fungi, spores, and pollen) found that Type A particles originated from bacterial and fungal species (Hernandez et al., 2016). Our previous oceanographic observations over the central Pacific (Kawana et al., 2021) similarly showed that FAPs of Type A and Type C predominated (75 %) in clean remote oceanic air masses and that their abundance correlated well with oceanic TEPs (polysaccharide polymer) and bacteria when considering the influence of WS on the formation of SSAs, while FAPs of Type B were dominant (30 %) near land and strongly correlated with CSPs (protein-like polymers). The identity of the marine bioaerosols detected by fluorescence observations was certified by comparison to a DNA-staining method during our previous research cruise (Kawana et al., 2021). Santander et al. (2021) also suggested that bacteria were dominant in FAPs of Type A and Type C identified by a WIBS and three-dimensional excitation–emission matrix fluorescence spectra during marine aerosol reference tank experiments using sampled seawater (during bloom/non-bloom periods) or cultured seawater. These results indicate that the dominance of Type A and Type B may come from different sources/origins, although both contribute to forming bioaerosols in the marine environments.
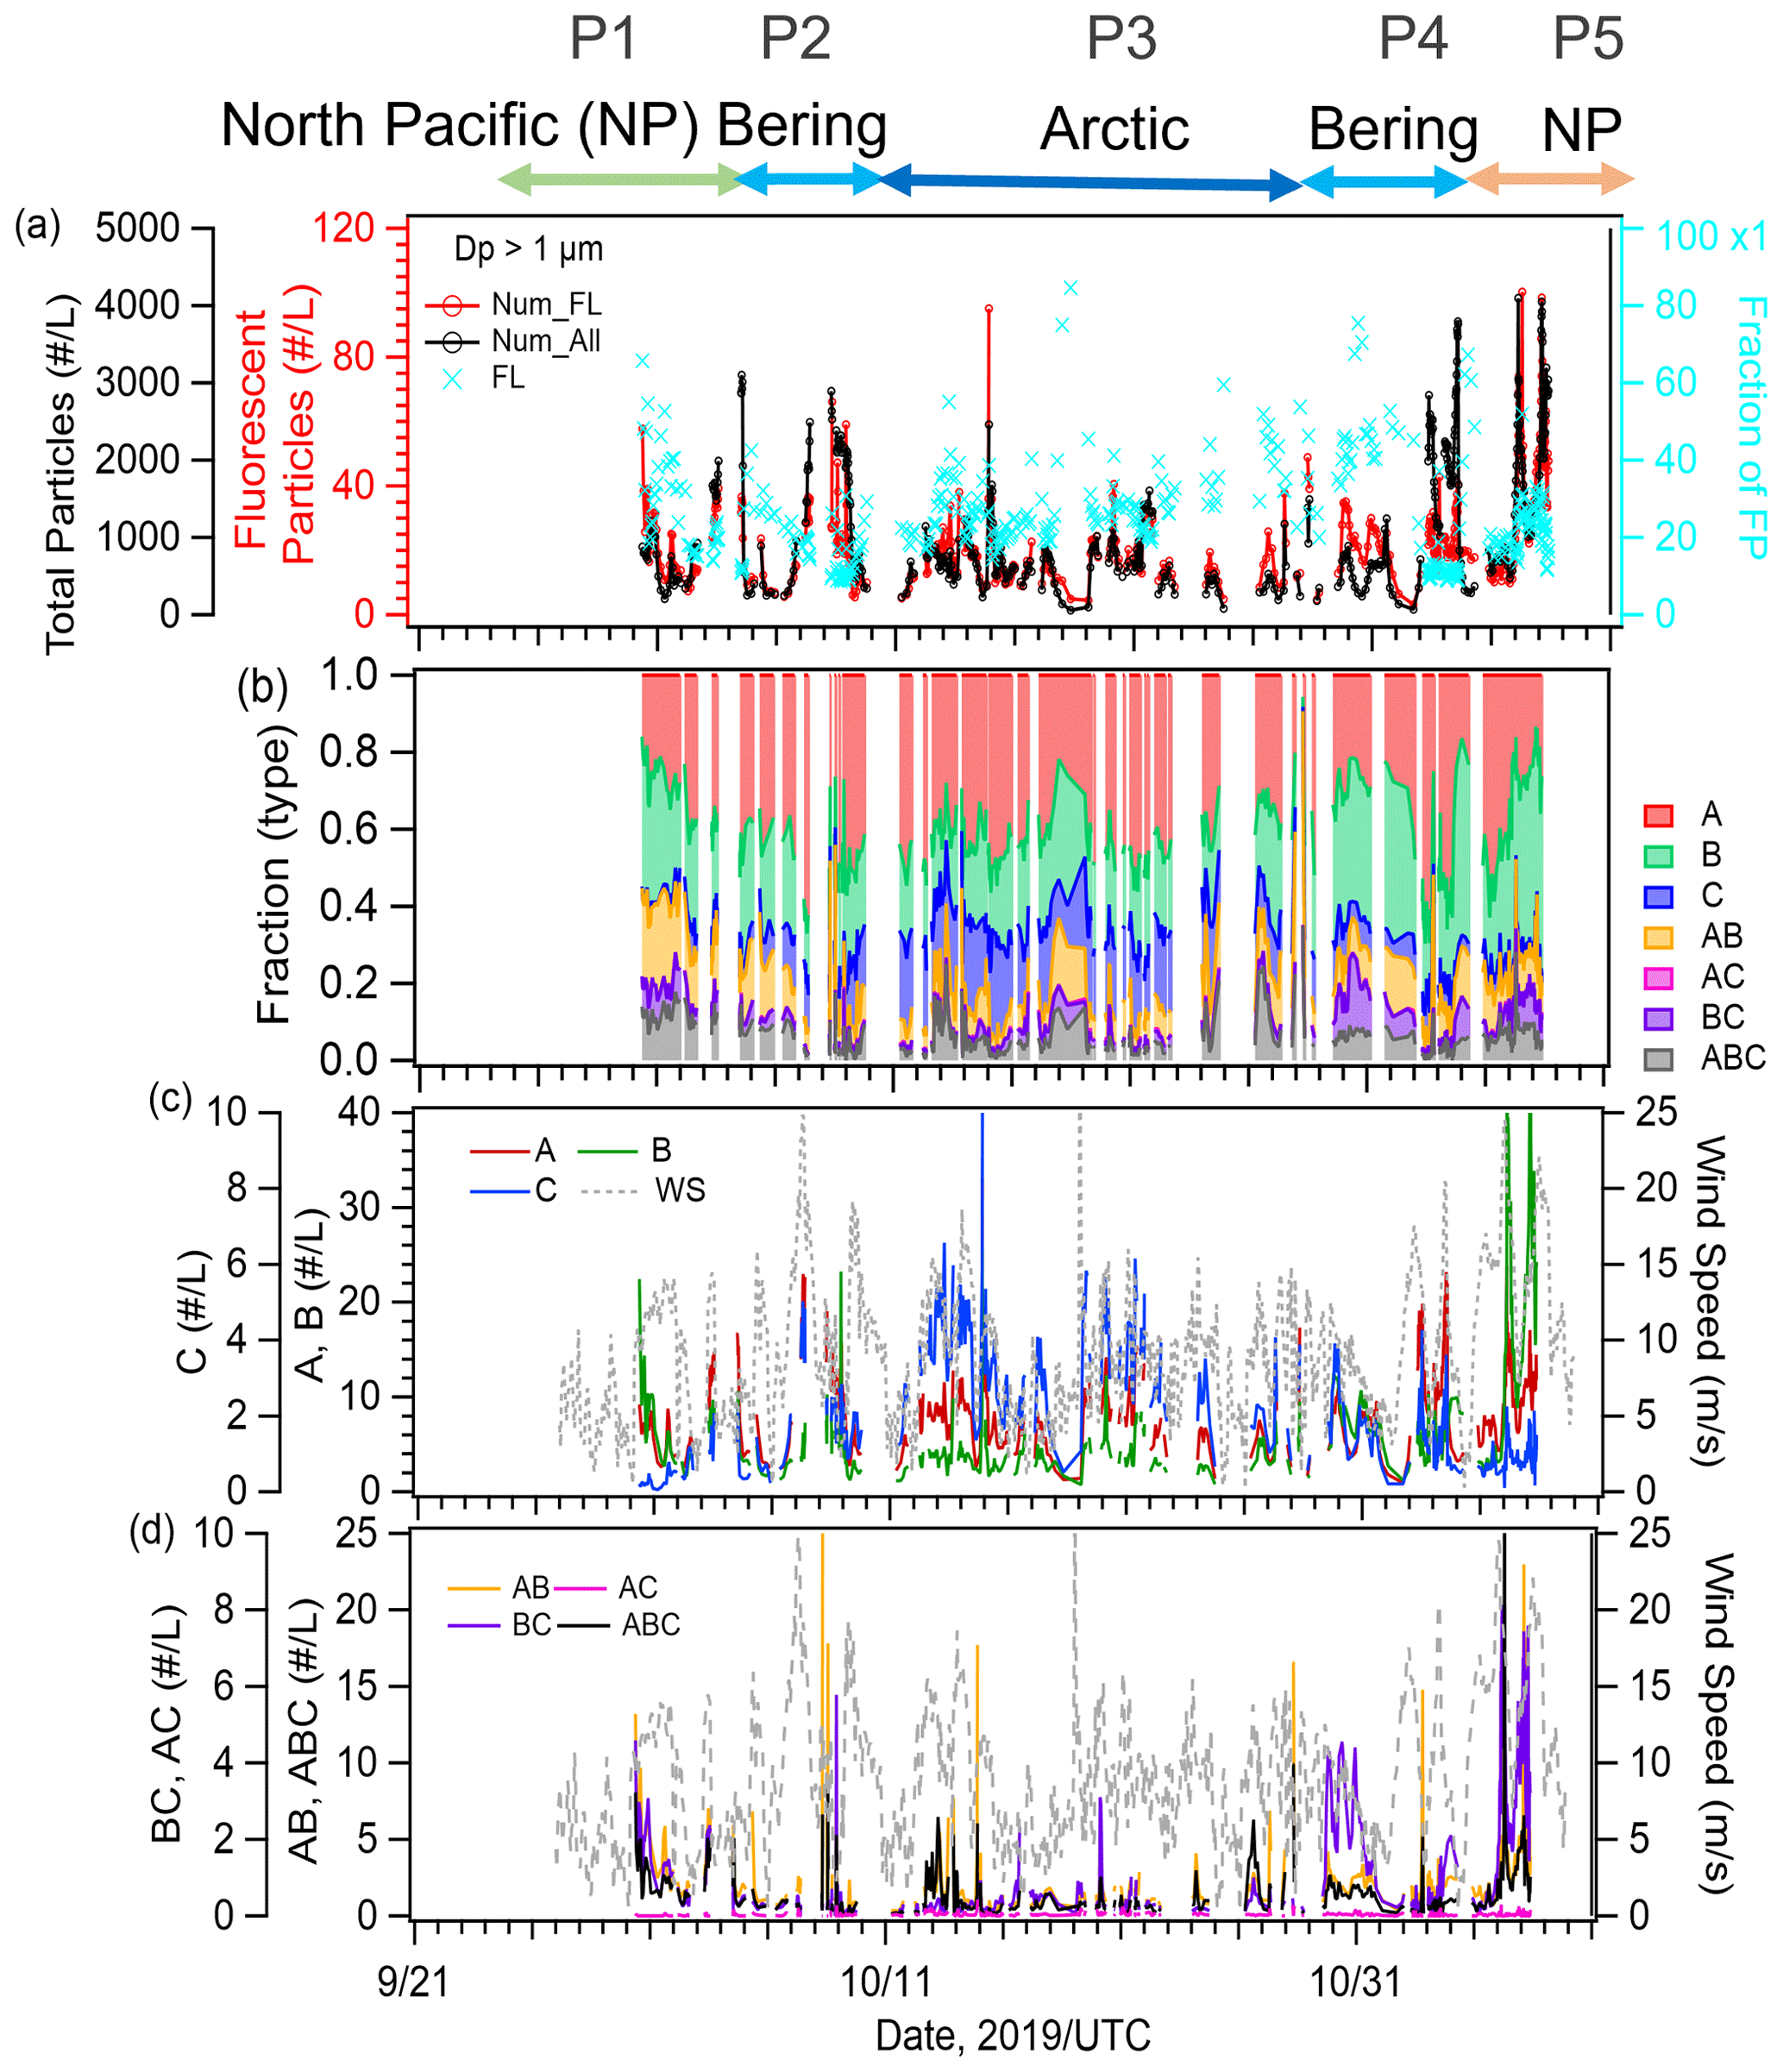
Figure 4(a) Time series of the number concentrations of total particles (black line) and fluorescent aerosol particles (red line) and the number fraction of FAPs (blue marker), (b) relative fractions of particle types with particular fluorescence patterns, (c) number concentrations of Types A, B, and C (second y axis) particles, and (d) number concentrations of Types AB, BC, AC, and ABC. Dashed lines in (c) and (d) represent the local WS.
To further focus on the relationship between marine biota and marine bioaerosols in this study, we extracted data only for P2, P3, and P4, when marine influences were dominant. We assessed the relationship between bioindicators in seawater and the amount of marine biological aerosols over the ocean. We did this to establish how well the abundance of fluorescent particles could be predicted by the amount of oceanic bioindicators and their uplift into the atmosphere and to determine the most relevant bioindicator (Fig. 5 and Table 2). This method, as also used in our previous study characterizing atmospheric bioaerosols over the central Pacific Ocean (Kawana et al., 2021), confirmed that the abundance of TEPs and bacteria at the ocean surface showed strong correlations (R>0.80) when multiplied by the WS, which is indicative of the origin of marine bioaerosols in remote ocean areas. In this study, we examined the correlation for both fine ( µm) and coarse (Dp>2.5 µm) fluorescent particles, and we found a tendency for higher correlation coefficients for the fine particles (Table 2). This might be partly because larger particles are less likely to be uplifted into the atmosphere and are susceptible to complex deposition processes. The correlation coefficient between FAPs and WS in the maritime airmass (n=13) was of medium strength (R: 0.58). The FAPs showed even weaker correlations with chl a (R: 0.33) and with TEPs or CSPs (R<0.1). Nonetheless, the correlation was significantly improved when the local WS was multiplied by the quantities of all bioindicators (R: 0.81–0.88). Regarding the order of WS dependence, it has been reported that atmospheric SSA concentrations can be represented by exponents of the WS ranging from 0.68 to 2.8 at the sea surface (Jaeglé et al., 2011; Ovadnevaite et al., 2012); when the wind effect was considered to be the square of WS (WS2), high correlation coefficients were also obtained (Table 2, R: 0.87–0.90). These results strongly indicate that marine biota contributed to bioaerosol formation. From linear regression, we propose the following equations to predict the abundance of marine fluorescent bioaerosols (Fig. 5e–g):
Note that lower correlations (R∼0.5) were obtained when we considered nonfluorescent particles (Fig. S4 in the Supplement), indicating that fluorescent particles on the ocean surface are particularly notable contributors to the formation of bioaerosols. The correlation coefficients are similar but the slope of the regression line for TEPs is 40 % smaller than it is for TEPs over the central Pacific Ocean (slope: 0.076 ± 0.014, R: 0.88, Kawana et al., 2021), suggesting the possibility of a dependence on the phytoplankton communities in the different oceanic regions (Taylor et al., 2014). Among the marine indicators, polysaccharides (TEPs) were reported to be a major group of ocean-derived OM in seawater samples and SSAs during the ICEALOT cruise, and they might represent an important contributor to CCNs in the Arctic Ocean (Russell et al., 2010). Park et al. (2019) also found that TEPs correlated well with the number concentration of SSA particles (R: 0.86–0.99) over the Arctic Ocean during summer; however, their analysis did not include bioaerosols. Considering that TEPs are not usually fluorescent, these results imply that TEPs aggregating fluorescent bacteria represent a major contributor to marine bioaerosols over the ocean (Russell et al., 2010; Engel et al., 2017; Park et al., 2019). CSP-containing particles may fluoresce due to their amino-acid structure and may simultaneously exhibit an ice-nucleating ability (Hill et al., 2014; Fröhlich-Nowoisky et al., 2016). Considering that the correlations between fluorescent bioaerosols and CSPs were lower (R: 0.5–0.6) in our previous study over the Central Pacific, our results here for the high latitudes represent a case where high correlation coefficients between them were successfully found, suggesting the necessity of ocean-specific studies in the future. Furthermore, in a unique result, we find that chl a is a good predictor (Eq. 4) of marine bioaerosols over high-latitude regions, in contrast to our previous result that showed poor correlation over the central Pacific Ocean (slope: 20.0 ± 19.0, R: 0.47). Nonetheless, the slopes for the two cases agree within the range of uncertainty. The good correlation of fluorescent bioaerosols and chl a in this study might be partly attributable to the strong correlation between chl a and TEPs or CSPs (R: 0.64–0.67); the TEPchl a ratio might vary depending on the key phytoplankton community (Engel et al., 2017). Future studies over different oceanic regions and seasons are required to comprehensively assess the association of bioaerosol evolution with chl a, which is derived from satellite observations and/or Earth system models as a proxy for phytoplankton biomass (Ito et al., 2023) and is useful because it can be used as a biological activity input in model calculations.
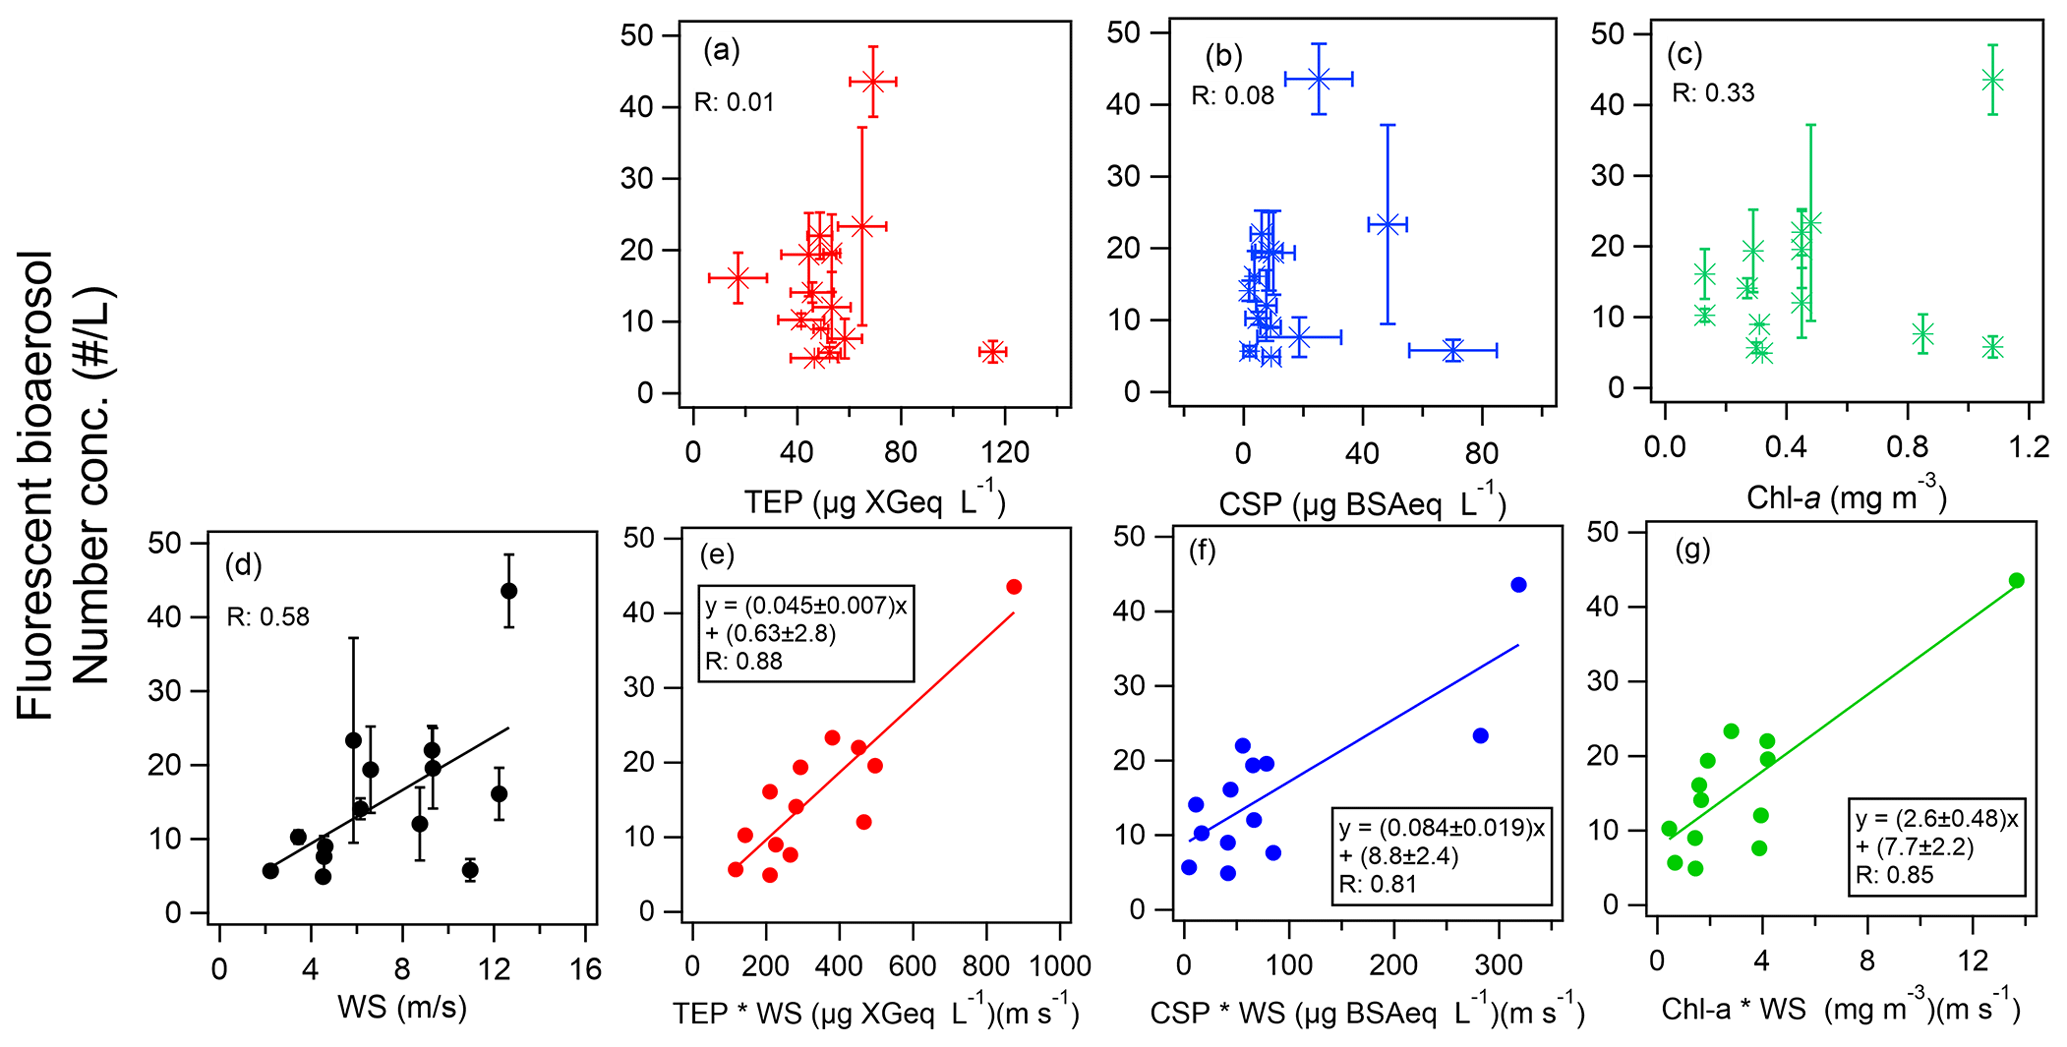
Figure 5(a–c) Scatter plots of fluorescent bioaerosols and a bioindicator (either (a) TEPs, (b) CSPs, or (c) chl a). (d) Scatter plot of fluorescent bioaerosols and WS. (e–g) Equations for the number concentration of fluorescent bioaerosols as a function of the product of WS and a bioindicator (either (e) TEPs, (f) CSPs, or (g) chl a). Colored lines represent orthogonal regression lines. Error bars represent one standard deviation.
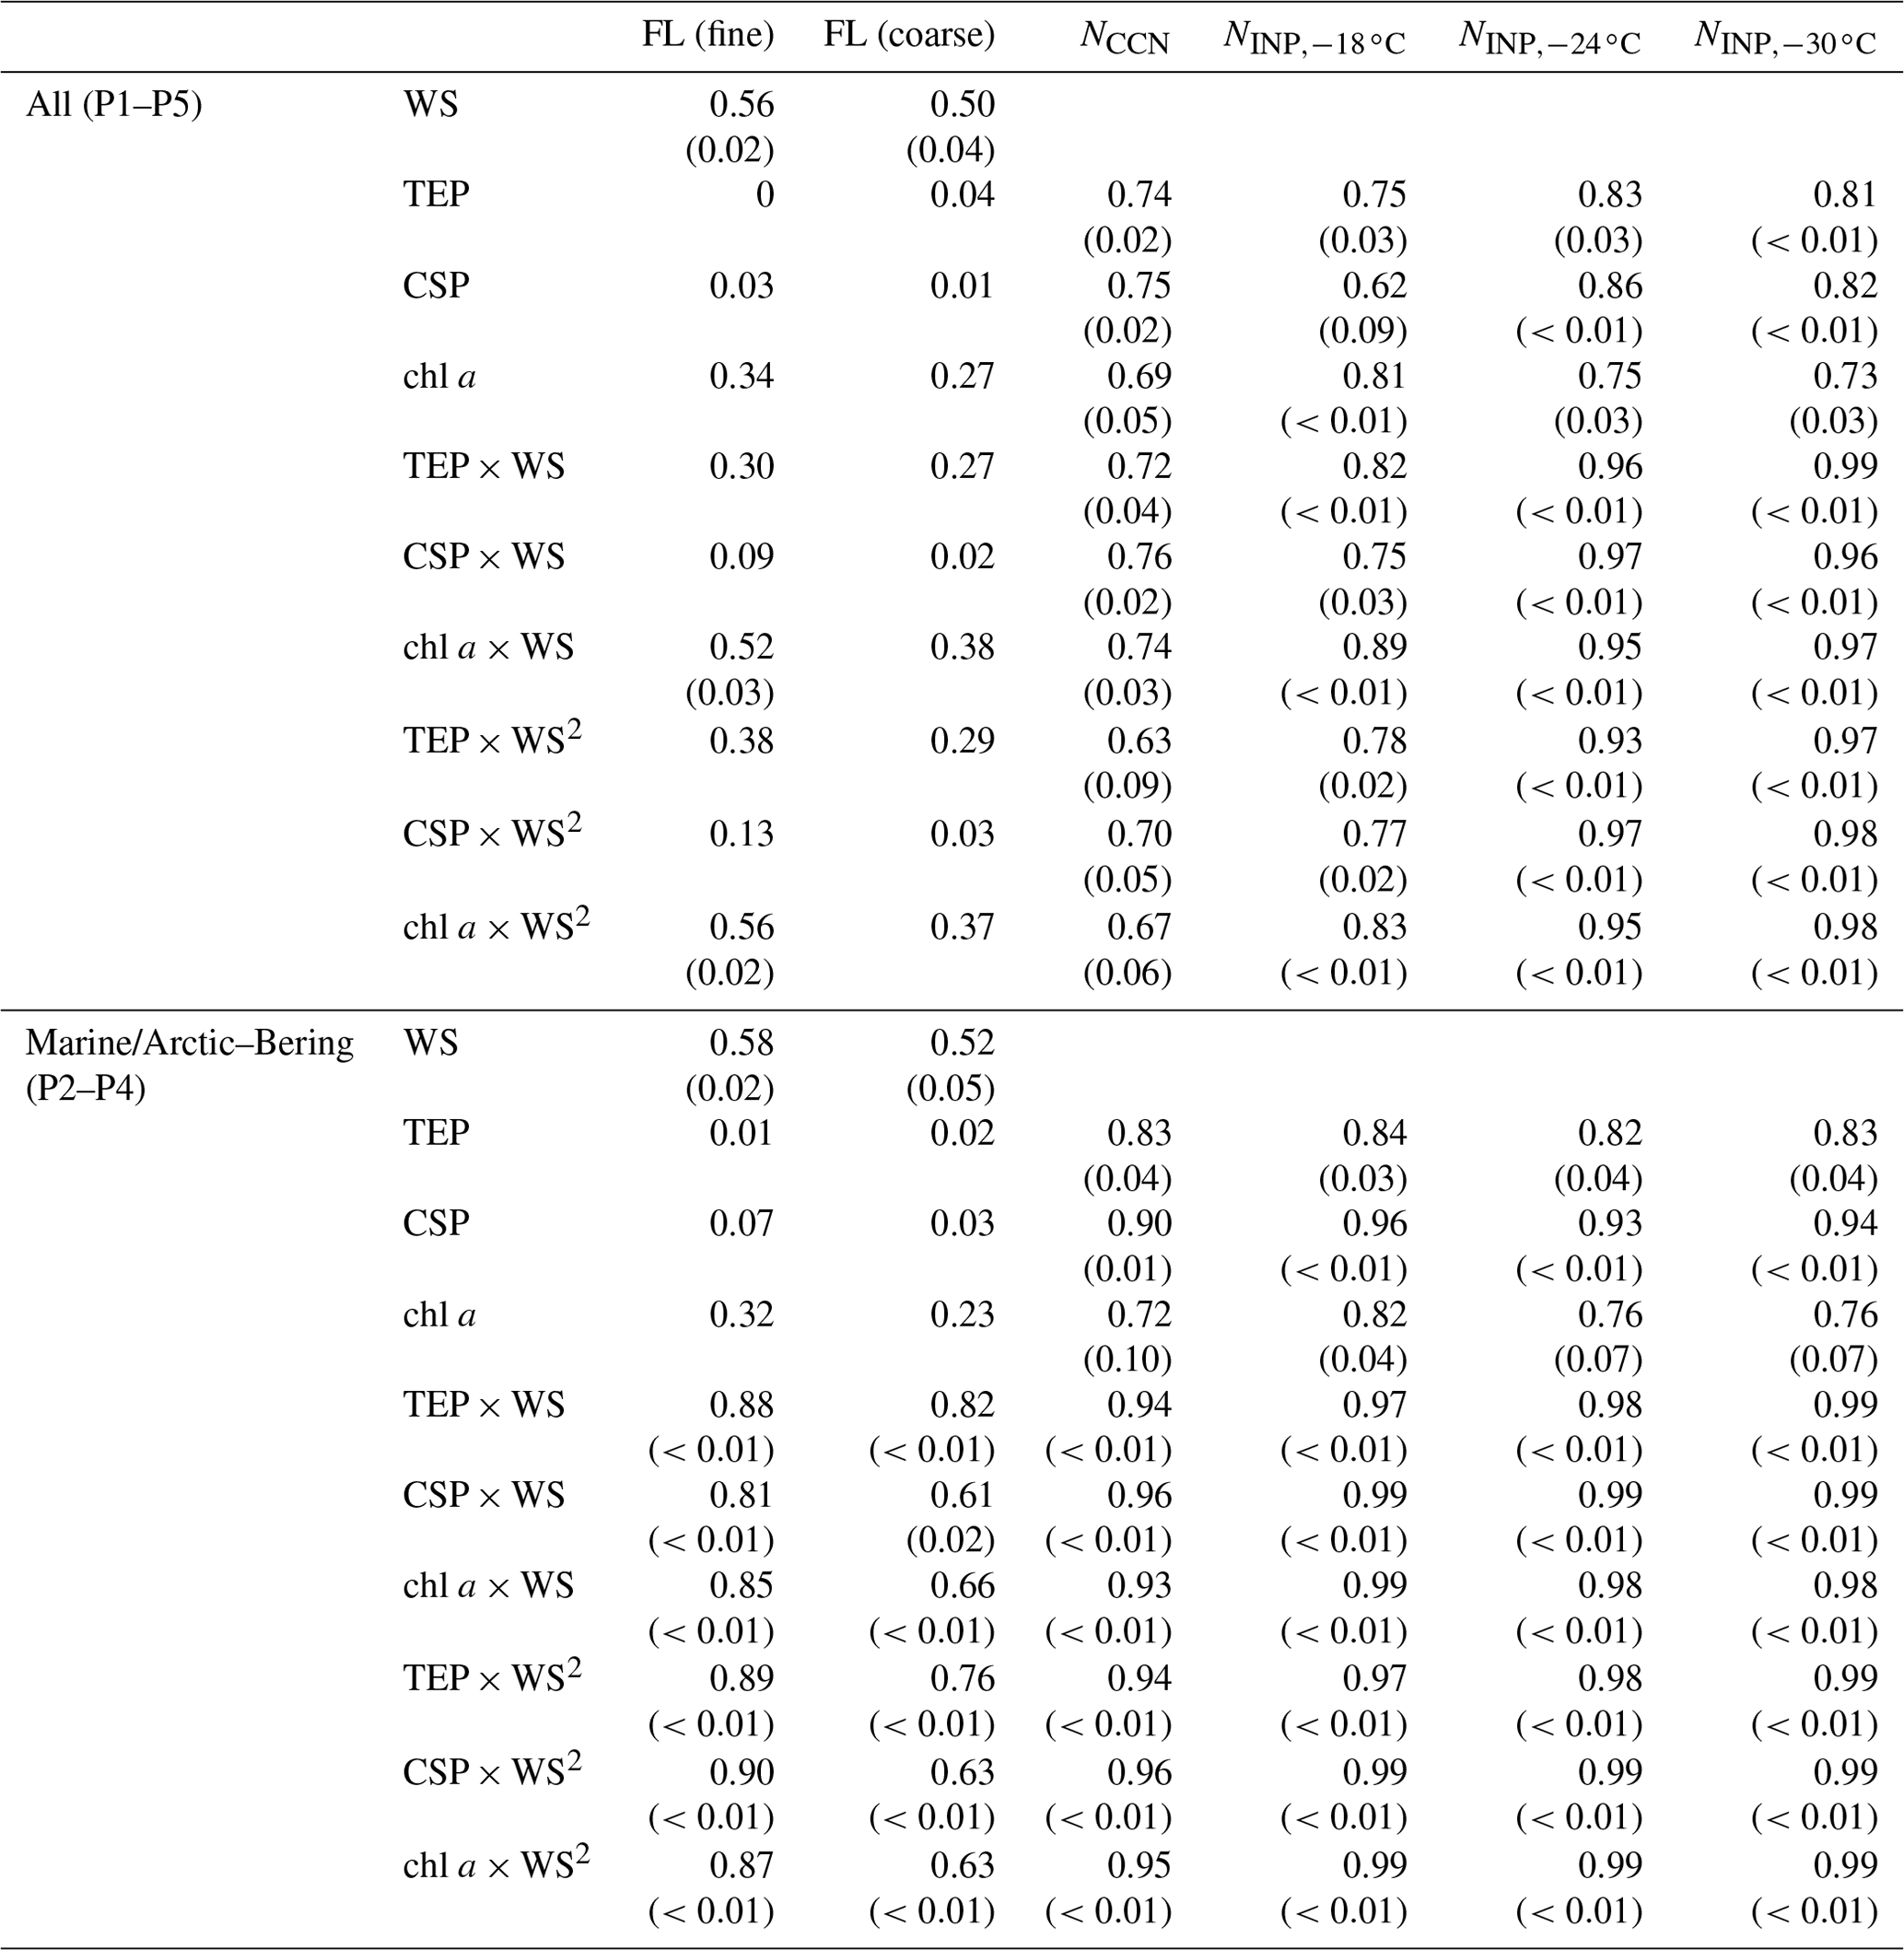
Table 2Correlation coefficients (and P values if the correlation coefficient is larger than 0.50) between the number concentrations of fluorescent bioaerosol particles, CCNs, and INPs in the atmosphere and the WS and/or bioindicator concentrations. Note that in the correlation analysis of INPs and marine biological indicators, the number of data pairs was limited (n=6). Refer to Figs. S4 and S5 for the results of an additional analysis excluding the data point with the highest values (sample obtained on 28 October 2019), which might have affected the correlation. FL (fine): fluorescent particles with a diameter of >1 µm ( µm), FL (coarse): fluorescent particles with a diameter of >2.5 µm (Dp>2.5 µm), WS: wind speed, TEP: transparent exopolymer particle, CSP: Coomassie-stainable particle.
While we obtained good correlations and predictive equations for the abundance of bioaerosols with all the bioindicators when we focused on marine primary organic aerosols in the fine mode, other factors should be investigated to derive accurate equations that link bioindicators in seawater to bioaerosols in atmospheric aerosols. Previous studies suggested that the remaining issues that might cause discrepancies comprise the following: (1) the dependence of organic enrichment on the biogenic OM types in the aerosol particles (i.e., functional groups such as polysaccharide, protein, lipid, and sugar) corresponding to the phytoplankton community and bloom stage (Cravigan et al., 2020; McCluskey et al., 2018b; Ickes et al., 2020; Moallemi et al., 2021) and their description in models (Burrows et al., 2014), (2) the selective transfer of OM (i.e., humic-like, protein-like, and fluorescence pattern) in the seawater to the aerosol phase (Rastelli et al., 2017; Miyazaki et al., 2018; Jung et al., 2020; Santander et al., 2021, 2022), and (3) a delay in the response time to form bioaerosols between atmospheric aerosols (both primary and secondary organic aerosols) and bioindicators in the sea surface (O'Dowd et al., 2015; Freney et al., 2021; Sanchez et al., 2021). Thus, detailed analysis of the behavior of biological particles with respect to OM type and the response to cloud activation is desirable in future studies.
3.4 Abundance and characteristics of CCNs and INPs
For CCN activation, the time series of the aerosol and CCN number concentrations, the CCN activation diameter (dact), and the hygroscopicity parameter κ are presented in Fig. 6a and b. The AF as a function of SS is presented in Fig. 6c. The averaged NCCN values at 0.4 % SS during P1, P2, P3, P4, and P5 were 99 ± 24, 43 ± 22, 36 ± 13, 139 ± 44, and 151 ± 85 cm−3, respectively. The NCCN value was low despite the high concentration of aerosols during P1, especially near land, i.e., approximately 50 % of the aerosol particles were activated as CCNs at 0.4 % SS. This can be attributed to the effects of both particle size and chemical composition; smaller particles require high-SS conditions to be activated as CCNs, and they are typically enriched in less hygroscopic components in the Aitken mode. Indeed, the κ values at 0.4 % SS derived from dact during P1 were particularly low (mean: 0.17 ± 0.06, range: 0.13–0.21, Table 1) when the influence of terrestrial pollutants was large, suggesting a notable contribution of less hygroscopic components such as OM and EC from terrestrial/anthropogenic sources. During P2, the κ values were also much lower (mean: 0.42 ± 0.04, range: 0.39–0.44) than those for sea salt (κ∼1.2), although a high mass fraction of sea salt was observed in the PM2.5 particles (88 %). In this period, high concentrations of marine bioindicators were observed (see Sects. 3.2 and 3.3), i.e., gel organic particles (e.g., TEPs and CSPs) with lower solubility and lower hygroscopicity. These OM types, together with sea salt, are suggested to contribute substantially to the reduction in particle hygroscopicity, especially for fine particles around the CCN activation size range (Facchini et al., 2008; Ovadnevaite et al., 2011). Additionally, the coating of chemically aged particles with less hygroscopic OM (κ∼0.3, Petters and Kreidenweis, 2007) generated from high biological activity might also contribute to their lower hygroscopicity. In contrast, the CCN activation parameters were characterized by high κ values during P3 (mean: 0.66 ± 0.20, range: 0.52–0.79) and P4 (mean: 0.68 ± 0.02, range: 0.67–0.69) and high CCN AFs (64 %–76 %), indicating that hygroscopicity and CCN activity were controlled by highly hygroscopic components from natural sources such as sea salt (κ∼1.2) and sulfate (κ∼0.6). The κ value during P5 was approximately equivalent to that of ammonium sulfate (κ∼0.6), and the influence from the terrestrial region might have been larger, as indicated by the backward trajectories. The averaged NCCN values at 0.4 % SS (36 cm−3 in the Arctic Ocean and 99–151 cm−3 in the North Pacific Ocean) were similar to the NCCN values measured in the remote Arctic Ocean (∼50–70 cm−3, Jung et al., 2018; Lange et al., 2018) and in the North Pacific Ocean (144–574 cm−3, Schulze et al., 2020). Note that dact and κ were calculated under the assumption that larger particles were initially activated as CCNs; the calculations did not consider uncertainties associated with the size dependence of the chemical composition and the external mixing state condition.
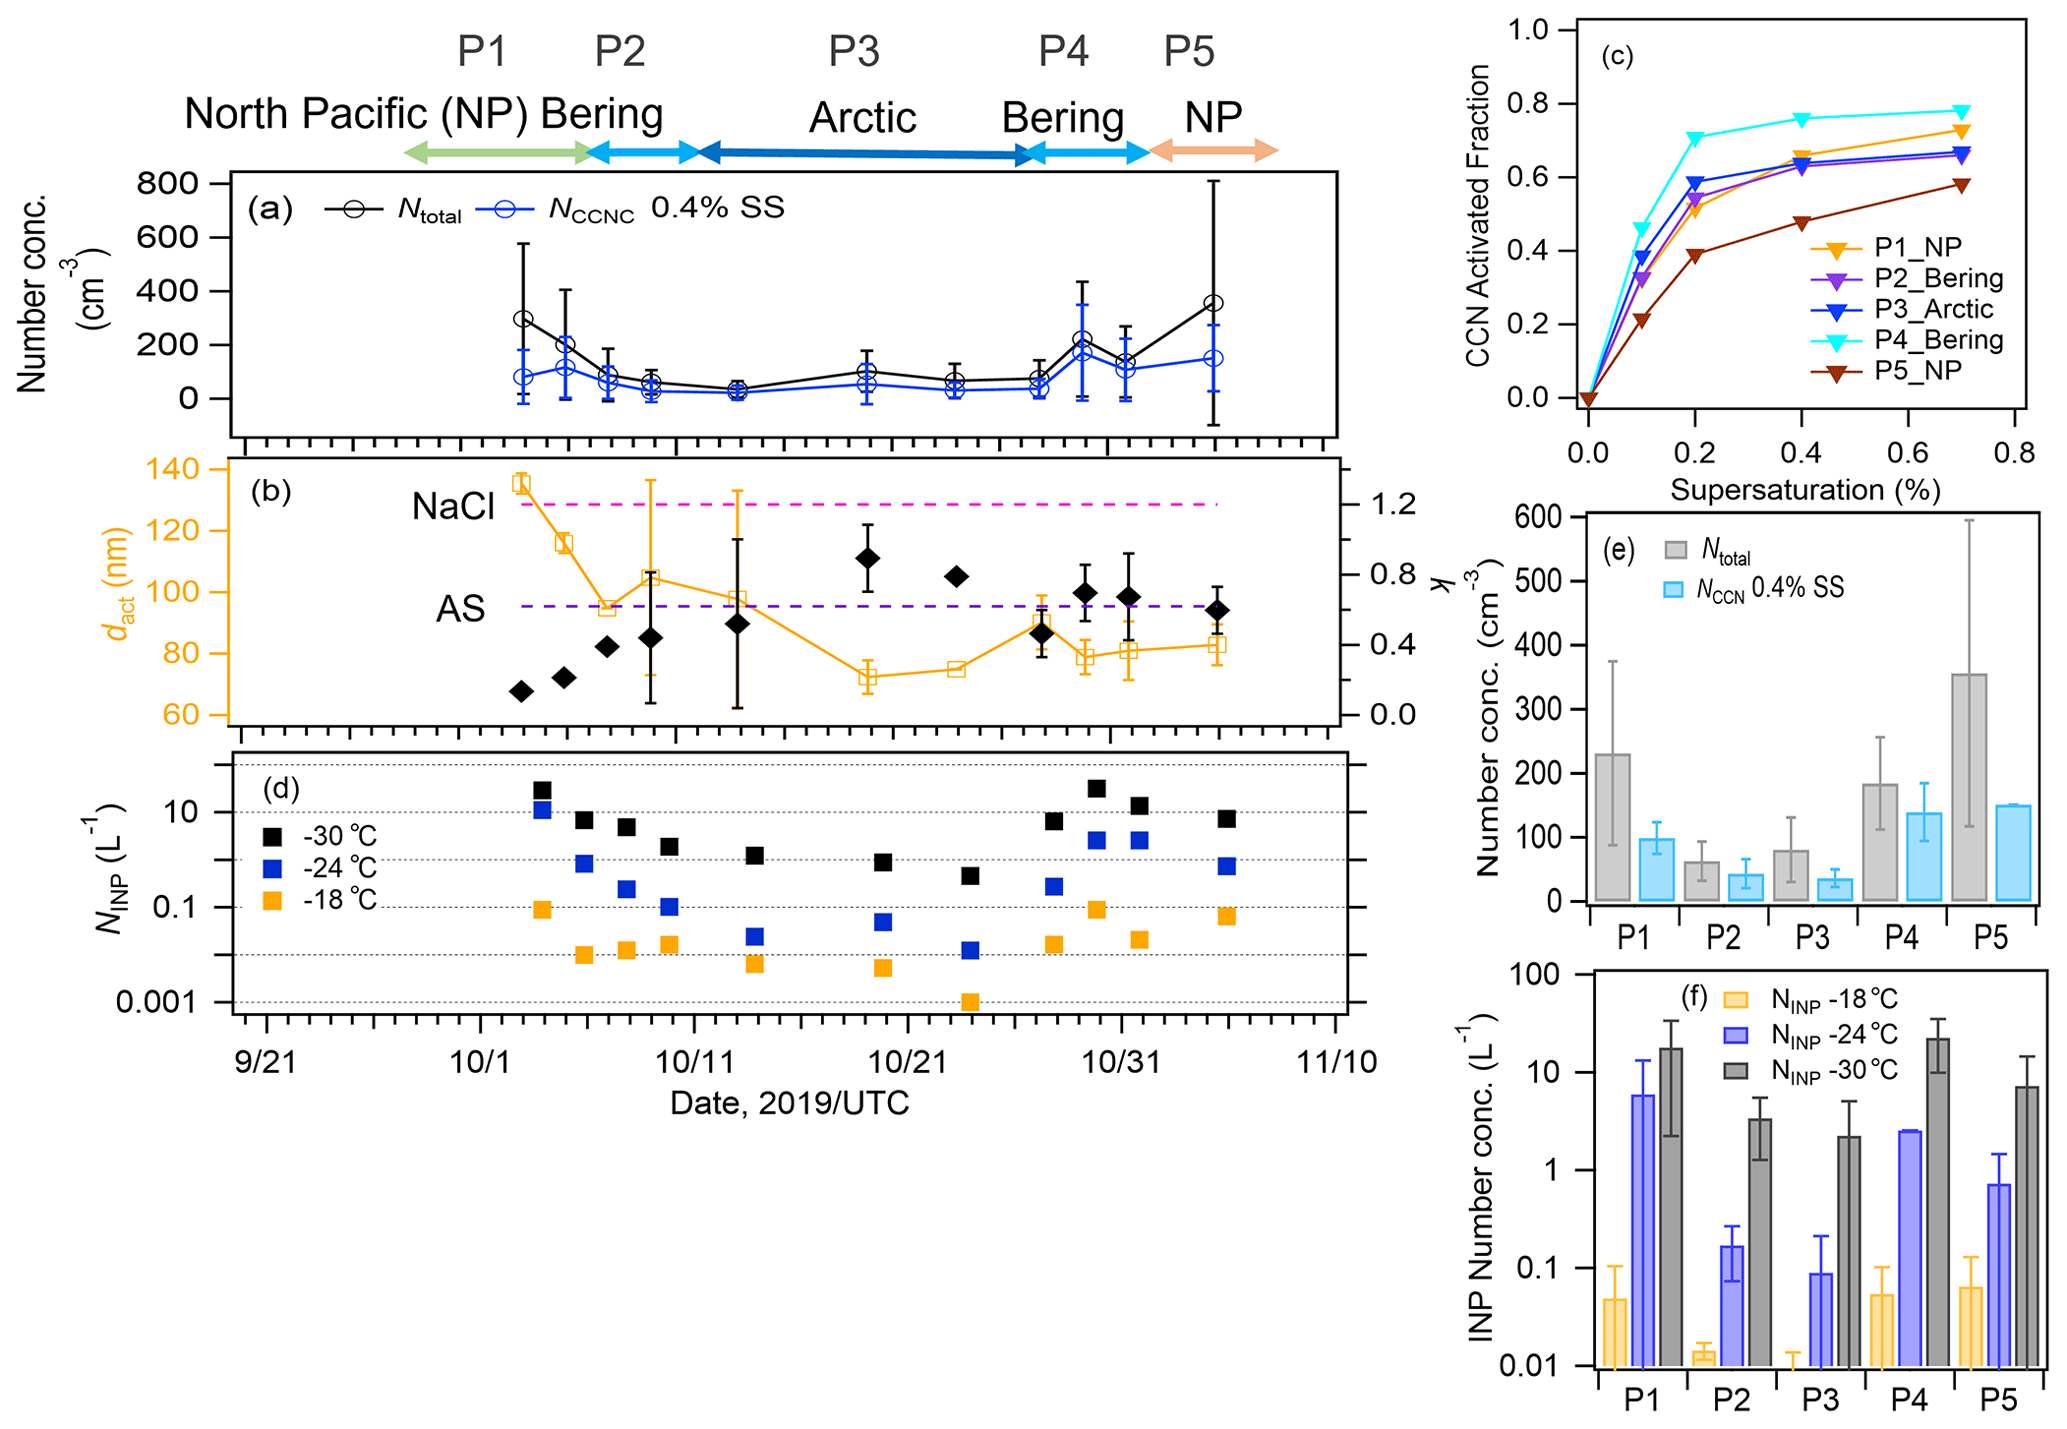
Figure 6Time series of (a) the number concentrations of total particles and CCNs at 0.4 % SS and (b) the CCN activation diameter (dact) and the hygroscopic parameter κ. (c) The AF as a function of SS in each period. (d) Time series of the number concentration of INPs measured at temperatures higher than −18, −24, and −30 ∘C. The number concentrations of (e) total particles and CCNs and (f) INPs in each period. Error bars represent one standard deviation. AS: ammonium sulfate, NaCl: sodium chloride.
In previous studies with yearly cluster analysis, the number–size distributions and the origin of the aerosols were characterized by a large contribution of biogenic OM from local emissions and aged aerosols during summer and early autumn in the Arctic (Lange et al., 2018, 2019). The mean values of κ in the summer and early autumn observations conducted in the northern high-latitude regions were 0.33 (over the Arctic Ocean, Martin et al., 2011), 0.33 (in Greenland, Lange et al., 2018), and ∼0.6 (at the Zeppelin station, Silvergren et al., 2014). Our results (κ: 0.13–0.79) are roughly consistent with previous observations in the marine boundary layer (0.1–0.96, Hendrickson et al., 2021) and the marine environment including the North Pacific Ocean (0.27–0.72, Schulze et al., 2020; 0.49–0.86, Kawana et al., 2022b) and with the modeled global κ in the marine environment (0.72 ± 0.24, Pringle et al., 2010). A wide range of observed CCN AFs at around 0.4 % SS have been reported (40 %–80 %, Silvergren et al., 2014; 40 %–60 %, Jung et al., 2018; 71 %, Lange et al., 2018),. These depend on the emission source, with a tendency for the value to be lower when the fraction of fine particles and biogenic OM is large. In terms of the autumn season and the corresponding hygroscopicity parameters determined in this study, the less and non-hygroscopic OM likely reduced CCN activity during P2 and P4 via high biological activity, while the contributions of sea salt and sulfate were dominant over the Arctic Ocean during P3. These results are consistent with chemical analysis of Arctic aerosols; CCN activation during summer was mainly affected by the less hygroscopic OM associated with marine and terrestrial biological activity, while CCN activation during winter was mainly determined by highly hygroscopic components such as sea salt with limited biological activity (Kawana et al., 2022a). During the spring pre-bloom periods in the North Pacific Ocean, CCN activity was characterized by less hygroscopic OM (estimated κ: 0.13–0.29), which was proportional to the increase in chl a, especially in terms of the fine particles with a relatively high fraction (37 %) of biogenic OM in PM1 (Kawana et al., 2022b). It should be noted that size-resolved chemical composition analysis conducted in previous studies indicated that OM and sulfate are enriched in fine particles (<1 µm), while sea salt is enriched in coarse particles (i.e., Rinaldi et al., 2009). Chemical analysis of maritime Arctic aerosol particles in the non-refractory components of submicron particles using an aerosol mass spectrometer showed that the average mass fractions of OM and sulfate accounted for 20 %–22 % and 21 %–35 %, respectively, and that estimated for sea salt was 37 %–47 % in the polar regions (Arctic and Antarctic, Ovadnevaite et al., 2014; Schmale et al., 2013). The chemical composition obtained in this study was based on PM2.5 particles only, and marine biogenic OM was also present in addition to sea salt and sulfate. Potentially, OM and sulfate represent the major components in the Aitken mode and sea salt represents a major component in the accumulation mode, as inferred from the findings of previous studies. Note that, when considering the general enrichment of organics in fine particles around the CCN activation diameter, a higher fraction of OM may characterize CCNs, especially for fine particles.
The number concentration of INPs (Fig. 6d) exhibited a trend similar to that of the CCNs; specifically, high number concentrations were observed during P1, P4, and P5 (Fig. 6e and f). The NINP values at temperatures higher than −18, −24, and −30 ∘C (, , and ) were in the ranges of 0.01–0.09, 0.7–11, and 7–29 L−1, respectively, during P1 and P5 with a terrestrial influence, and they were in the ranges of 0.01–0.09, 0.1–2, and 2–31 L−1, respectively, during P2 and P4 with a marine influence. The NINP values in the Arctic Ocean during P3 were in the ranges of 0.001–0.016, 0.012–0.27, and 0.5–6.4 L−1, respectively, implying that pristine marine NINP values are approximately one order of magnitude lower than those in the North Pacific Ocean. The NINP values at temperatures higher than −18 and −24 ∘C (from 10−3 to 10−1 L−1) in this study were broadly within the range of the values measured monthly over the Arctic Ocean during the MOSAiC campaign (from 10−4 to 10−2 L−1 during September–November, Creamean et al., 2022) and at the research stations at Alert, Barrow, Ny-Ålesund, and Villum in the Arctic region (from 10−2 to 10−1 L−1, Wex et al., 2019). Previous studies have reported that NINP in marine air masses is 1–3 orders of magnitude lower than NINP in air masses with terrestrial-origin OM and dust that are sources of INPs, while marine biogenic OM can be an important source of INPs in a clean marine environment, especially at high temperatures above −25 ∘C in terms of ice formation (Wilson et al., 2015; DeMott et al., 2016; McCluskey et al., 2017; Welti et al., 2020) or at even higher temperatures of approximately −10 ∘C (Hartmann et al., 2021, European Arctic) or from −15 to −22 ∘C (McCluskey et al., 2018c, Mace Head, Atlantic). Conversely, between −25 and −30 ∘C, owing to the activation of mineral dust in this temperature range, NINP is substantially increased (by approximately two orders of magnitude) based on NINP temperature spectra in the Northern Hemisphere (Welti et al., 2020). Our range of , 0.46–6 L−1, was slightly lower than the reported values (10–100 L−1) in the north polar region (Welti et al., 2020).
3.5 Association of marine biota with the contributions to CCNs and INPs
The observed NINP was characterized in terms of regressions based on bioindicators (Fig. 7 and Table 2) and fluorescent aerosols (Fig. 8 and Table 3). High correlations (R>0.97, n=6, from 9–28 October) were obtained with all marine bioindicators (TEPs, CSPs, and chl a) when the wind effect was considered and the terrestrial influence was found to be low (Fig. 7). The evident tendency was for ; these marine biogenic materials are very likely involved in the process of INP activation at relatively high temperatures. Even in the analysis without the data point with the highest values (the sample obtained on 28 October 2019), which might have affected this correlation analysis (Fig. S5 in the Supplement), high correlation coefficients were obtained for , especially with CSPs (R: 0.93) and with TEPs (R: 0.91). The correlation coefficient with chl a was somewhat lower but still high (R: 0.79). The equations for (as an example) with marine biota and WS are expressed as follows (see Fig. 7g–i):
In the same region in November 2018, based on results from a cruise track similar to that followed by R/V Mirai 1 year earlier, Inoue et al. (2021) reported that INPs were detected at temperatures higher than −14 ∘C in the Arctic at low altitudes when the aerosol particles were characterized by a high mass fraction of OC. Their meteorological analysis implied that marine-derived OM with sea salt was supplied to the atmosphere by high waves and strong winds. Several tank experiments and in situ observations using seawater samples obtained during periods of high biological activity suggested that high concentrations of TEPs and bacteria in the sea surface migrate and transfer to atmospheric aerosols and cloud water and become a major constituent of biogenic INPs at temperatures above −25 ∘C (van Pinxteren et al., 2020, 2022; Santander et al., 2021, 2022; Mitts et al., 2021). The correlation between NCCN and bioindicators was also high (Fig. 7a–c, R: 0.94–0.96), indicating a significant contribution of OM at the ocean surface to the CCN number concentration due to a wind-driven effect. In this study, the correlation coefficients between fine FAPs and CCNs and INPs are higher than those of coarse FAPs in both cases. Our results suggest that OM originating from marine biota, which consists of relatively small particles with a diameter of less than 2.5 µm, are released into the atmosphere as marine bioaerosols and contribute to both CCNs and INPs. Notably, the number of data pairs (n=5 or 6) was limited in this study (Fig. 7) because the observations of INPs and marine biological indicators did not coincide in some cases. Clearly, future verification with a larger number of observational points is recommended.
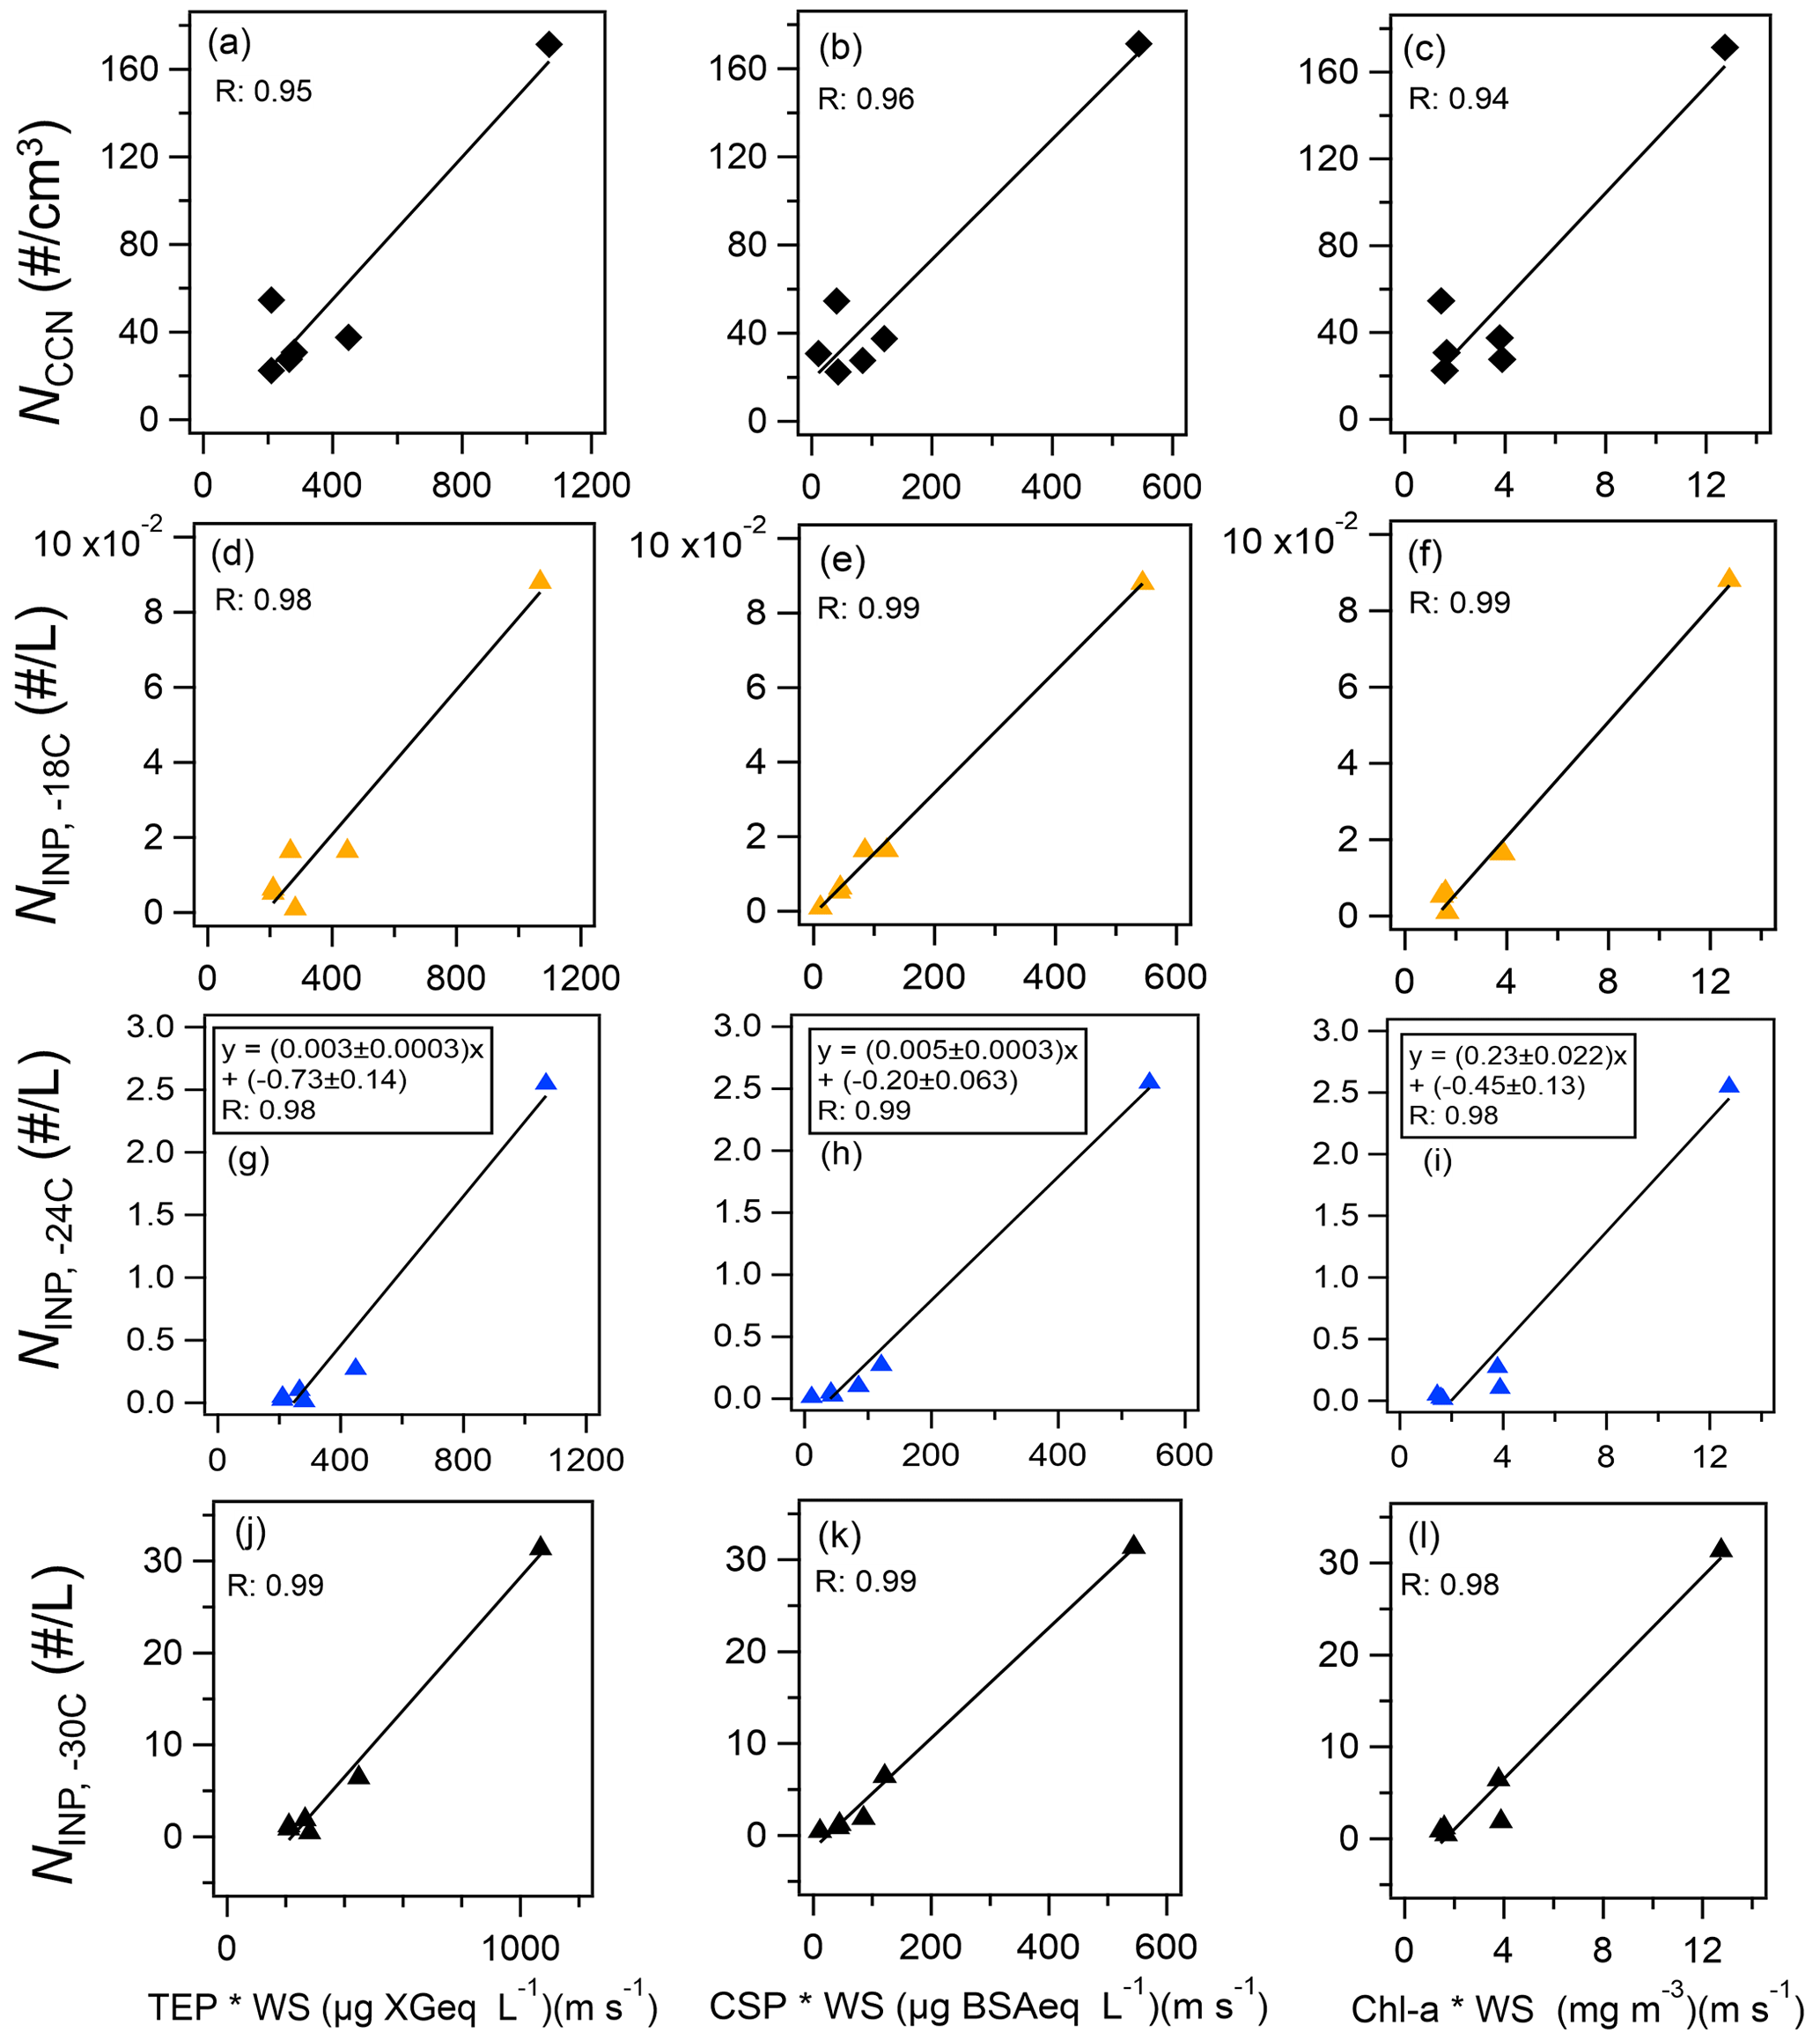
Figure 7Scatterplots of bioindicator concentrations (TEPs, CSPs, and chl a) multiplied by WS versus (a–c) CCN number concentration and (d–l) INP number concentration measured at temperatures higher than (d–f) −18 ∘C, (g–i) −24 ∘C, and (j–l) −30 ∘C. Black lines represent the orthogonal regression lines presented as examples.
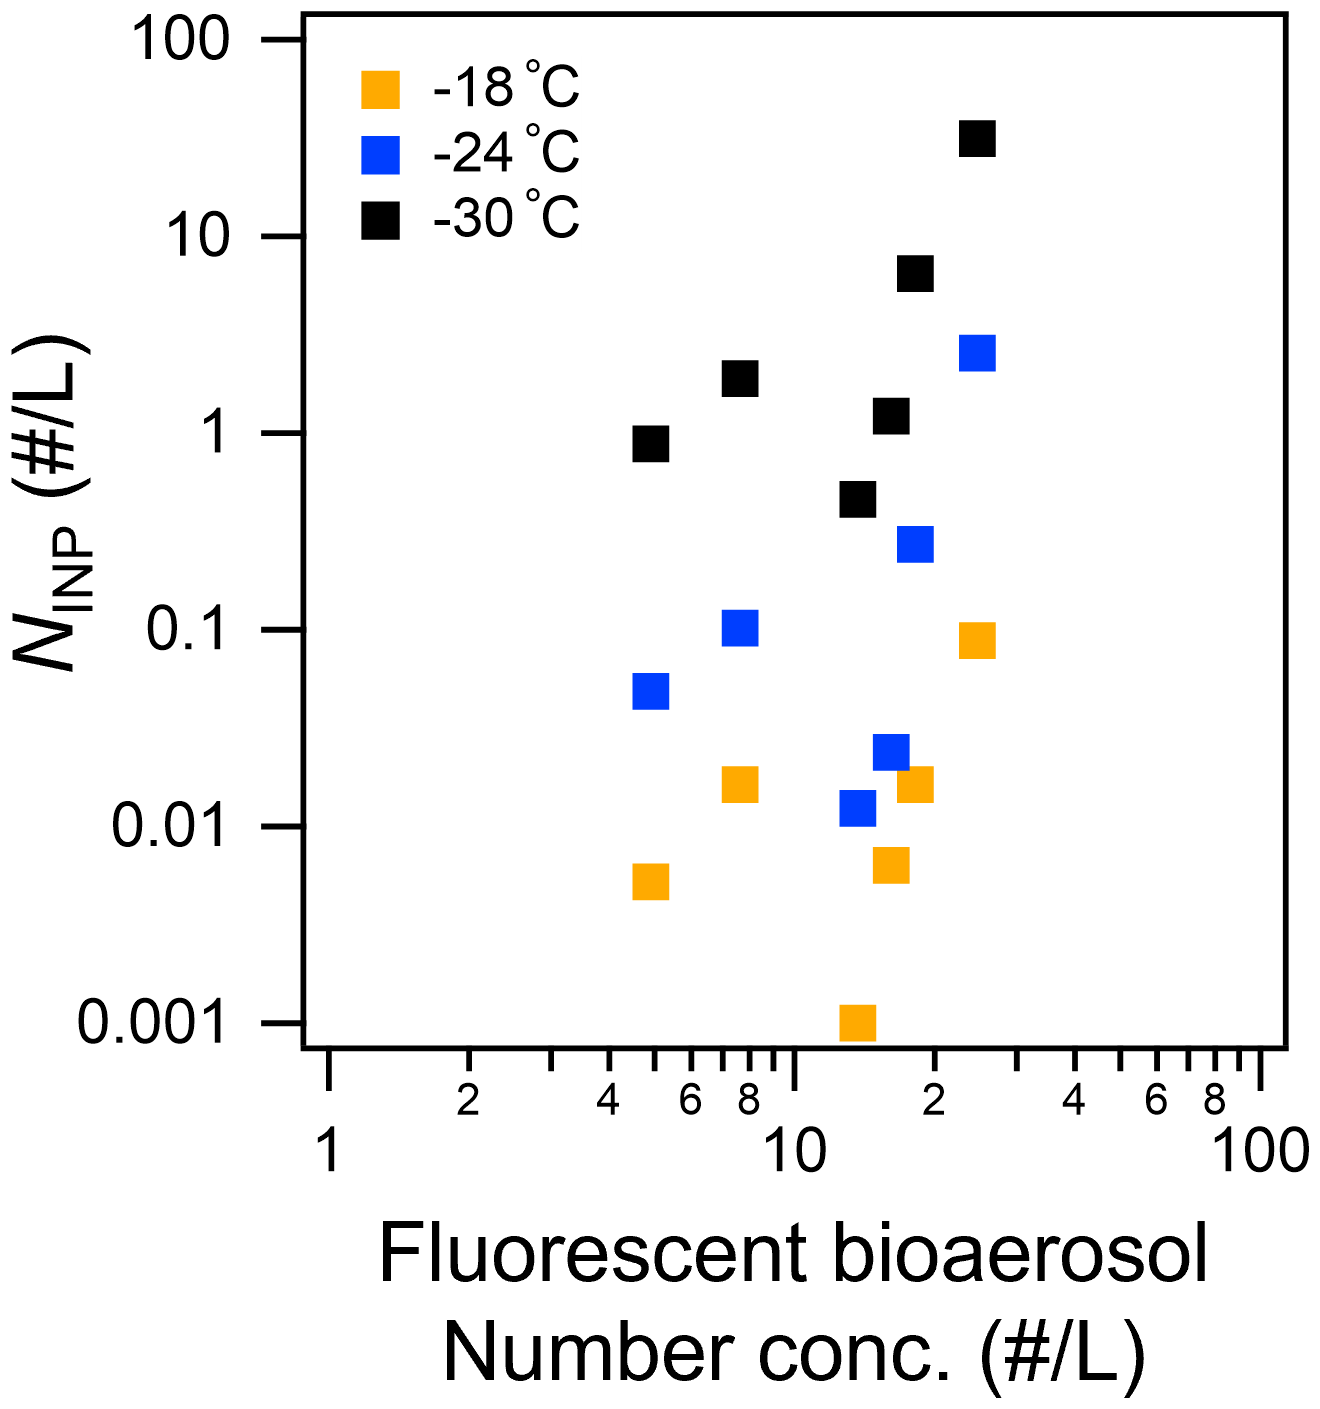
Figure 8Scatterplot of total fluorescent fine particles ( µm, sum of Types A, B, C, AB, AC, BC, and ABC) versus INP number concentration measured at temperatures higher than −18, −24, and −30 ∘C.
Table 3Correlation coefficients (and P values if the correlation coefficient is larger than 0.50) between the number concentrations of CCNs and INPs and fluorescent bioaerosol particles with particular fluorescence patterns. FL (fine): fluorescent particles with a diameter of >1 µm ( µm), FL (coarse): fluorescent particles with a diameter of >2.5 µm (Dp>2.5 µm), WS: wind speed, TEP: transparent exopolymer particle, CSP: Coomassie-stainable particle.
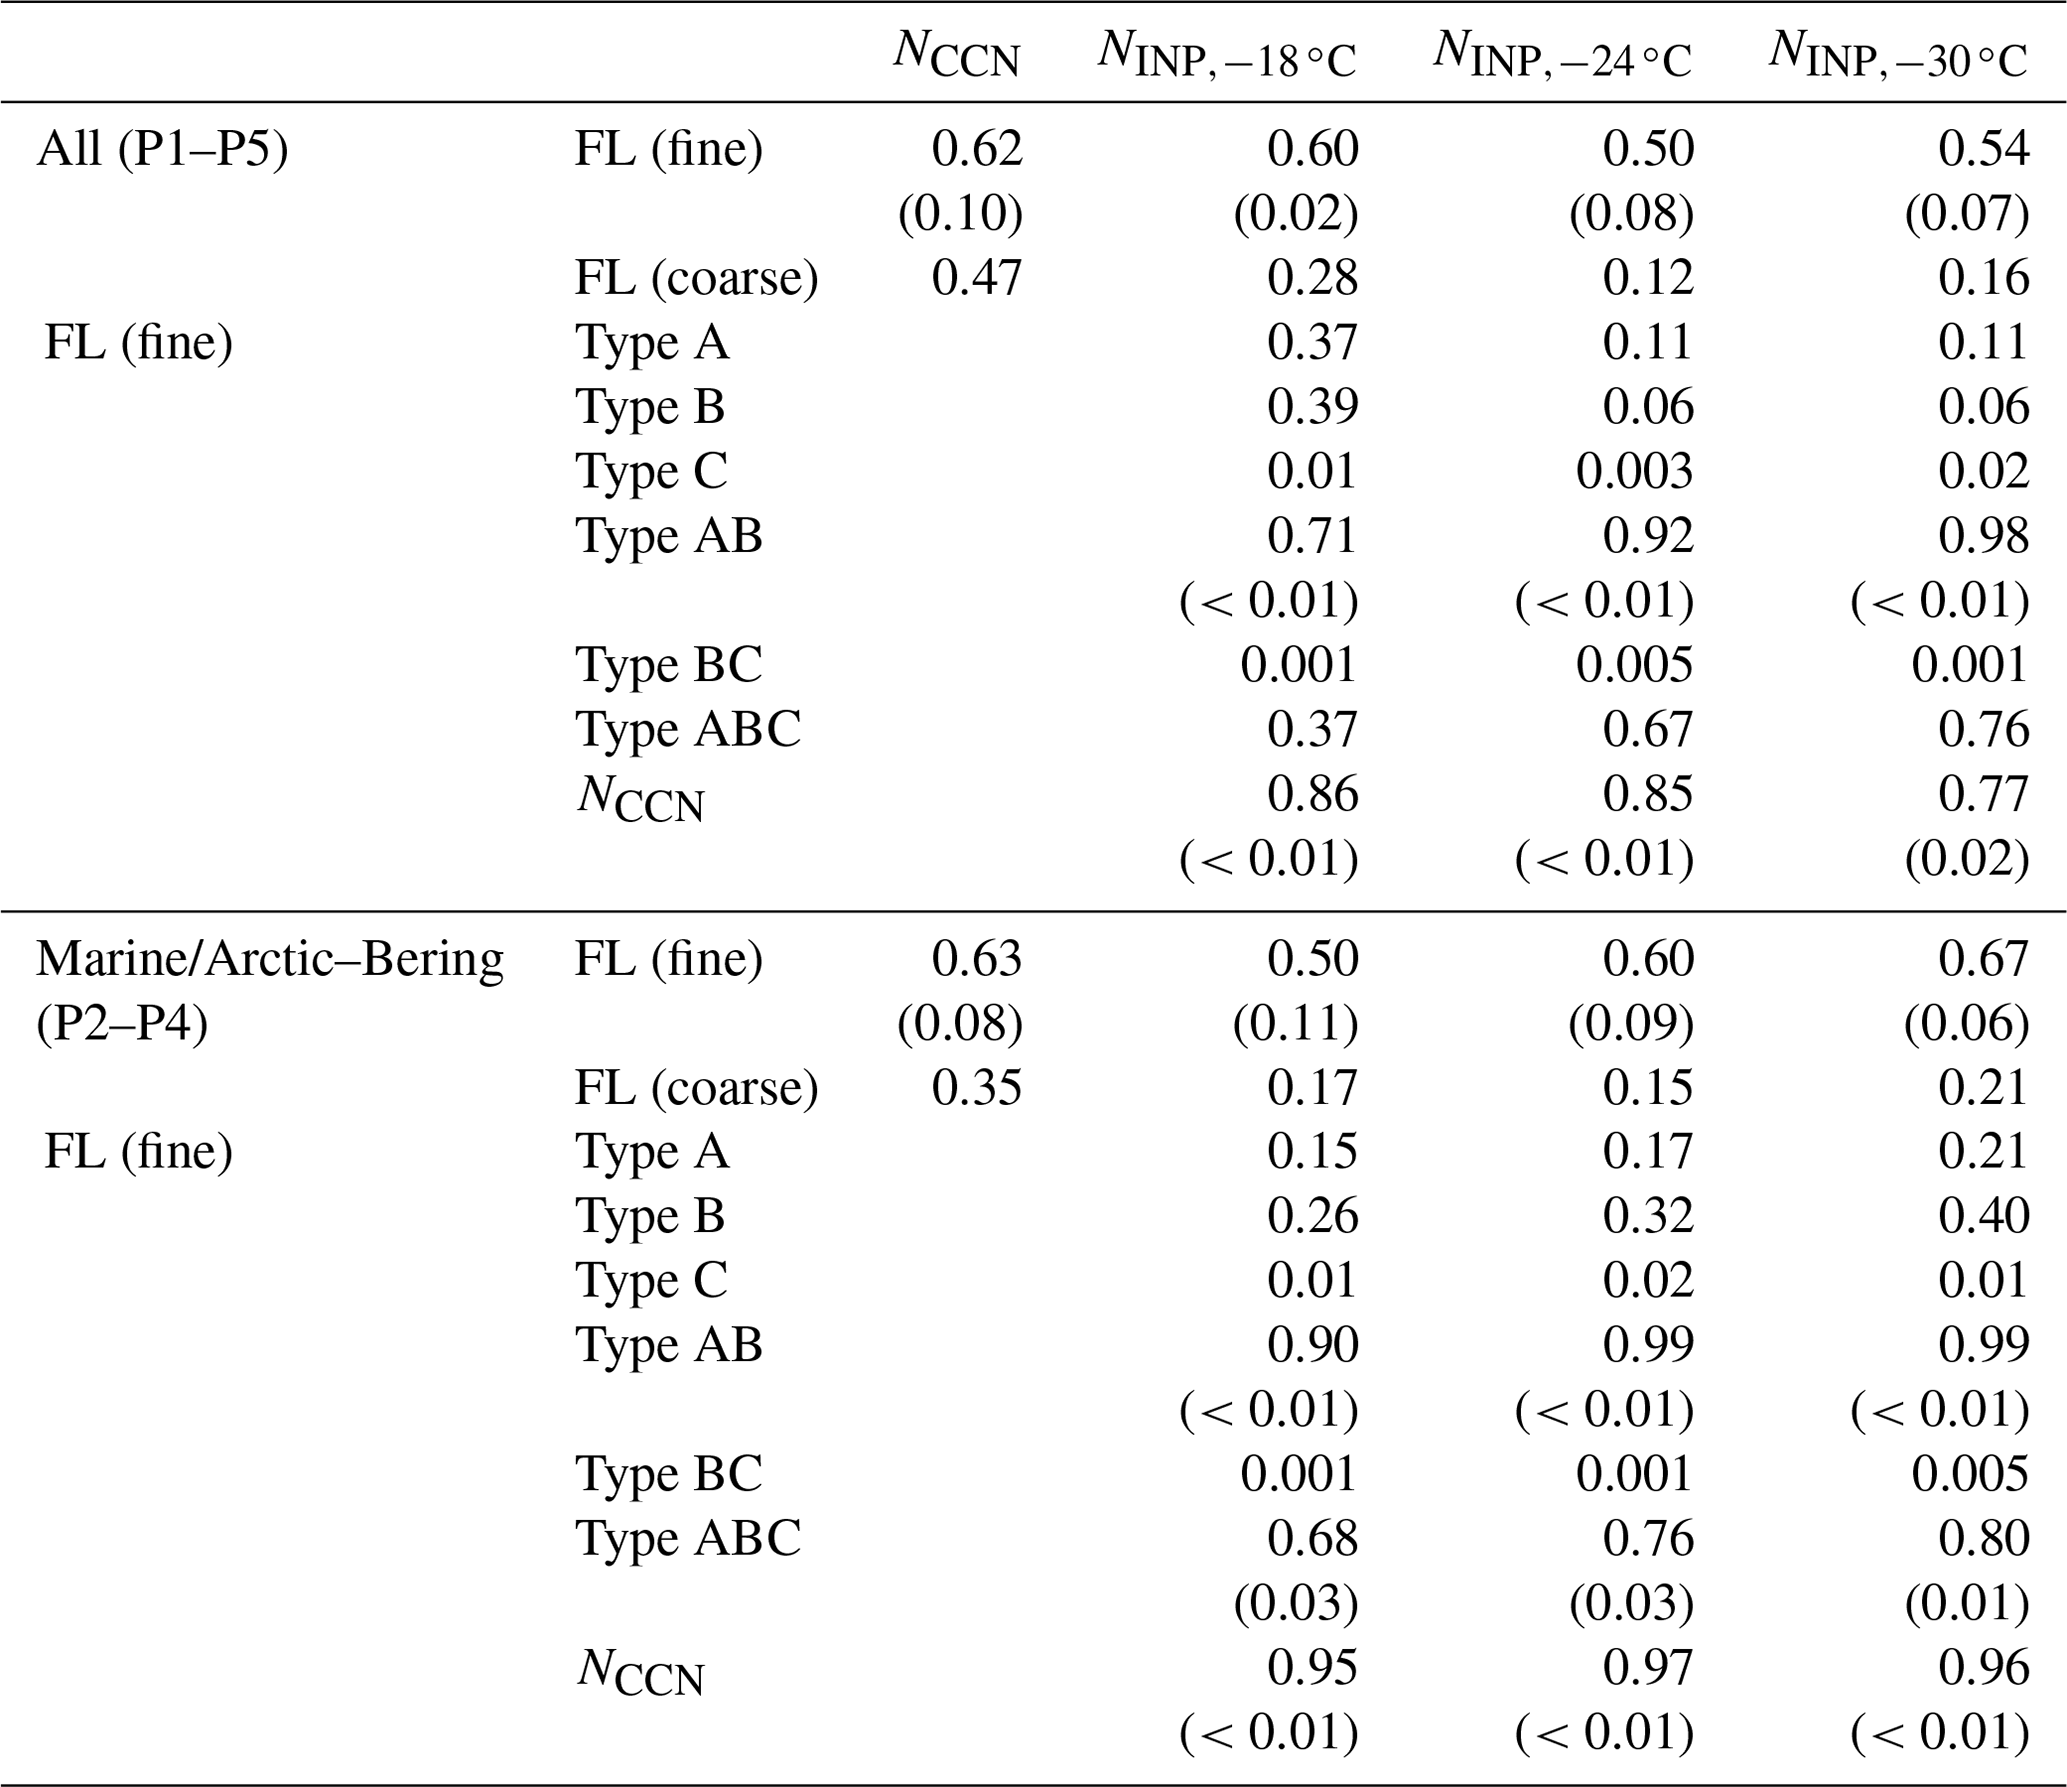
Table 3 and Fig. 8 show that NCCN and NINP correlated more strongly with fine fluorescent particles ( µm; R: 0.50–0.67 for marine air masses) than with coarse fluorescent particles (R: 0.15–0.21; Dp>2.5 µm). This tendency is similar to the relationship between fluorescent particles and bioindicators (see Sect. 3.3). Finally, we propose equations to estimate from all fluorescent particles (FLall), which were derived using Fig. 8:
In terms of fluorescence pattern, Type AB and Type ABC showed stronger correlations (R: 0.90–0.99 and 0.68–0.80), although their number fractions (10 % and 5 %, respectively) were lower than those of Type A and Type B (45 % and 24 %, respectively). The absolute density of Type AB or Type ABC was still higher than that of INPs, suggesting that only a certain proportion of the fluorescent bioaerosol particles would activate as INPs. Following a study in Vancouver Island, Mason et al. (2015) also reported that, based on measurements of fluorescent particles with a WIBS-4A, a large proportion of the particles that become active as INPs at a temperature of between −15 and −25 ∘C come from biological particles, with a high linear correlation (R: 0.83) observed between and FLall over a wide size range (Dp: 0.5–10 µm). This might be in accord with the results mentioned above that suggested that a large proportion of biological particles with marine biogenic sources in the remote ocean become active as INPs at high temperatures (from −10 to −25 ∘C) (Wilson et al., 2015; McCluskey et al., 2017, 2018c; Welti et al., 2020). Note that our analysis did not include particles smaller than 1 µm owing to the uncertainty of the fluorescence measurements, and the number concentration of fluorescent particles was an order of magnitude lower than that found by Mason et al. (2015) in the middle latitudes.
Our results showed for the first time that all of the bioindicators, fluorescent particles, INPs, and CCNs were positively correlated, indicating that marine biological materials contributed substantially to the bioaerosols and cloud particles over the remote Bering Sea and the Arctic Ocean. Uniquely, we also found that simultaneously observed NCCN and NINP showed positive correlations (R: 0.95–0.97, Table 3), suggesting that enhanced marine biological sources and the fluorescent marine bioaerosols that formed contribute to the increases of both CCNs and INPs during a phytoplankton bloom, despite the reduced CCN activity due to the reduced hygroscopicity. This is consistent with the results from microcosm experiments, which suggest that coating SSAs with OM reduces the surface tension, enhancing the emission flux of the particles and thus the CCN concentration (Alpert et al., 2015; Ito et al., 2023). Generally, CCNs (except for giant CCNs) are present mainly in fine particles such as PM1 and are thus more strongly affected by OM, which is more abundant in fine particles (Christiansen et al., 2020). In contrast, particles that can act as INPs are generally dominated by coarse particles with lower hygroscopicity, such as dust, mineral particles, and volcanic ash (Murray et al., 2012), which might be less affected by the presence of OM in the fine particles. Consequently, CCNs and INPs might consist of particles of different sizes and chemical compositions that become activated, with biogenic particles (including both CCNs and INPs) with moderate hygroscopicity involved in the activation processes. For example, Prather et al. (2013) reported that, during a mesocosm experiment with high concentrations of chl a, bacteria, and phytoplankton, OM (i.e., organic gel particles) with sea salt was dominant in the fine particles (diameter: <1 µm), whereas sea salt and biological particles (i.e., bacteria) were dominant in the coarse particles (diameter: >1 µm). Moreover, the activation of CCNs and INPs was suppressed at high concentrations of total organic carbon and with reduced hygroscopicity, possibly owing to an organic film that inhibited the release of particles that act as sources of INPs (Prather et al., 2013). In a report of the simultaneous observation of CCNs and INPs (Gong et al., 2019), the CCN-derived κ values of particles in the Aitken and accumulation modes were 0.21–0.29 and 0.57, respectively, which are indicative of a large contribution of biogenic OM and sulfate to submicron particles, whereas sea salt and, to a lesser extent, dust were the main contributors to supermicron particles, and the values of NINP activated at higher temperatures (−15 ∘C) suggested that INPs were originated from local biogenic sources. Cloud chamber studies with variable water SS and temperature conditions also showed that INP activation (but not CCN activation) might be suppressed by competition for water vapor because the more active CCN particles initially take up all the water (Simpson et al., 2018).
These studies revealed that the temporal evolutions of CCN and INPs in the natural environment are complex and depend on their individual properties (i.e., chemical composition, mixing state, particle size, and number concentration). Recently, climate models representing biogenic sources and cloud formation at the global scale have evolved to incorporate a series of processes that include the abundance and transport of biological material that can be sources of CCN and INPs over the land and sea (Burrows et al., 2009a, b), the adsorption of different types of OM (i.e., polysaccharides, proteins, and lipids) in the sea surface layer and SSA formation (Burrows et al., 2014, 2016), and a comparison of the contributions of biological particles and dust to INP activation (Burrows et al., 2013, 2022). Models estimate that the abundance of bioaerosols is lower in the marine environment than over land, but they remain a major source of INPs in locations unaffected by dust or after long-distance transport of air masses from land in the high-latitude polar regions, which is consistent with observations of INP number concentrations in terrestrial and marine areas (McCluskey et al., 2018a; Welti et al., 2020). In order to constrain the effects of partitioning between CCNs and INPs on number concentration and activation process, additional observational data and experimental verification will be required, including other factors such as the selective and size-dependent transfer of biogenic OM from the sea surface to the aerosol phase and the regulation of kinetics in the processes.
We evaluated potential links of sea-surface biological activity (with TEPs, CSPs, and chl a considered as indicators) to atmospheric fluorescent bioaerosols, CCNs, and INPs based on atmospheric and seawater sampling and online observations conducted in the North Pacific Ocean, the Bering Sea, and the Arctic Ocean during September–November 2019. According to the air mass origins and the associated aerosol chemical compositions, the observations were categorized into five periods. Largely influenced by long-range transport from terrestrial regions including the Asian continent, particle chemical compositions were characterized by high mass fractions of organics and sulfate (15 %–22 % and 28 %–48 %, respectively) during P1 and P5 over the North Pacific Ocean. In contrast, mainly influenced by maritime air masses, high mass fractions of sea salt (43 %–88 %) were noted during P2, P3, and P4 over the Bering Sea and the Arctic Ocean. The concentrations of nutrients and bioindicators (TEPs, CSPs, and chl a) in the seawater from the North Pacific Ocean and the Bering Sea were high (up to 1.3 mg m−3 of chl a), suggesting high biological activity (e.g., a phytoplankton bloom) and associated locally produced biogenic OM. The average number concentration of fluorescent bioaerosols in the range of µm and Dp>2.5 µm was 25 and 7 particles L−1, respectively, with a predominance of Types A, B, AB, and ABC in the fluorescence pattern.
The ranges/value of the CCN number concentration at 0.4 % SS over the North Pacific Ocean, the Bering Sea, and the Arctic Ocean were 99–151, 43–139, and 36 cm−3, respectively, and the corresponding ranges/values of the hygroscopicity parameter κ over the three regions were 0.17–0.59, 0.42–0.68, and 0.66, respectively. During P1, the CCN-derived κ value was as low as 0.17 on average and the activated CCN fraction at 0.4 % SS was approximately 50 %, with a high mass fraction of OM and sulfate, suggesting a large contribution of less hygroscopic components from terrestrial/anthropogenic sources. During P2, when local marine sources were dominant, the averaged κ values were also as low as 0.42, and primary gel organic particles with less solubility (e.g., TEPs and CSPs) were suggested to contribute substantially to the reduction in particle hygroscopicity. Conversely, during P3 and P4, the CCN activation parameters were characterized by high values of averaged κ (0.66–0.68) and high CCN AFs (64 %–76 %), indicating that the hygroscopicity and CCN activity were controlled by the highly hygroscopic components from natural sources such as sea salt and sulfate in addition to biogenic OM. The NINP measured at −18 and −24 ∘C during P2 and P4 (i.e., under the influence of marine sources of SSAs, including biogenic OM) were 0.01–0.09 and 0.1–2.5 L−1, respectively, while those over the Arctic Ocean (during P3) were 0.001–0.016 and 0.012–0.27 L−1, respectively. The NINP values measured at −18 and −24 ∘C (from 10−3 to 10−1 L−1) over the Arctic Ocean were broadly within the range of reported values for the Arctic with a predominance of marine biogenic emission influences.
During periods with predominant marine biological activity, we assessed the impact of marine biota on the formation of fluorescent bioaerosols and CCNs/INPs by examining the correlations among them. We found that the number density of bioaerosols correlated strongly with all types of oceanic bioindicators, i.e., TEPs, CSPs, and chl a (R: 0.81–0.88), when the effect of wind-induced uplift from the sea surface to the atmosphere was taken into account, which suggests a strong link between marine biota and marine bioaerosols. Furthermore, the NINP values measured at relatively high temperatures (−18 and −24 ∘C) correlated positively with the three oceanic bioindicators when the local WS was considered (R: 0.58–0.95 and 0.79–0.93, respectively), even when the extreme outlier point was omitted, and they also correlated positively with the total fluorescent bioaerosols (R: 0.50 and 0.60, respectively) and, particularly, Type AB and Type ABC (R: 0.90–0.99 and 0.68–0.80, respectively). Our results demonstrate that bioindicators, fluorescent particles, INPs, and CCNs correlate positively in any combination, indicating that marine biota contribute substantially as a source of bioaerosols and cloud formation via INPs and CCNs over the remote Arctic Ocean during periods of high biological activity.
Cruise navigation and meteorological/oceanic data are available from the following web site: JAMSTEC (2019) MIRAI MR19-03C Cruise Report and Data Book (https://www.godac.jamstec.go.jp/darwin_tmp/explain/81/j/, last access: 27 December 2023). Our specific dataset of chemical composition, trace gases, fluorescent particles, and bioindicators are available from Zenodo repository (https://doi.org/10.5281/zenodo.10425817, Kawana et al., 2023). Other data are available from the corresponding authors upon request.
The supplement related to this article is available online at: https://doi.org/10.5194/acp-24-1777-2024-supplement.
KK and YK designed the research and KK wrote the manuscript and prepared all figures. FT performed the cruise observations and data collection, including sampling, with contributions from KK, KM, YT, YI, TM, and YK. KK conducted the analysis of fluorescent particles and CCN activity in the atmosphere, with contributions from FT and YI, respectively, and the analysis of bioindicators in the seawater, with a contribution from KM. YT analyzed and provided the data on INP properties. TM analyzed and provided the data on the aerosol number–size distributions. YK analyzed and provided the data on the O3 and CO concentrations. AI conducted model analyses to determine the source contributions.
The authors declare that they have no conflict of interest.
Publisher's note: Copernicus Publications remains neutral with regard to jurisdictional claims made in the text, published maps, institutional affiliations, or any other geographical representation in this paper. While Copernicus Publications makes every effort to include appropriate place names, the final responsibility lies with the authors.
We acknowledge the assistance from the captain and crew of the R/V Mirai and the support from the technical staff at Marine Works Japan, Ltd. and Nippon Marine Enterprise, Ltd. This research was supported by the Ministry of Education, Culture, Sports, Science, and Technology (MEXT) and MEXT/JSPS KAKENHI (grant nos. JP18H04143, 21H04933) and the Arctic Challenge for Sustainability II (ArCSII; program grant no. JPMXD1420318865). We thank James Buxton MSc, from Edanz (https://jp.edanz.com/ac, last access: 27 December 2023), for editing a draft of this manuscript.
This research has been supported by the Japan Society for the Promotion of Science (grant nos. JP18H04143, 21H04933, and JPMXD1420318865).
This paper was edited by Radovan Krejci and reviewed by two anonymous referees.
Abbatt, J. P. D., Leaitch, W. R., Aliabadi, A. A., Bertram, A. K., Blanchet, J.-P., Boivin-Rioux, A., Bozem, H., Burkart, J., Chang, R. Y. W., Charette, J., Chaubey, J. P., Christensen, R. J., Cirisan, A., Collins, D. B., Croft, B., Dionne, J., Evans, G. J., Fletcher, C. G., Galí, M., Ghahreman, R., Girard, E., Gong, W., Gosselin, M., Gourdal, M., Hanna, S. J., Hayashida, H., Herber, A. B., Hesaraki, S., Hoor, P., Huang, L., Hussherr, R., Irish, V. E., Keita, S. A., Kodros, J. K., Köllner, F., Kolonjari, F., Kunkel, D., Ladino, L. A., Law, K., Levasseur, M., Libois, Q., Liggio, J., Lizotte, M., Macdonald, K. M., Mahmood, R., Martin, R. V., Mason, R. H., Miller, L. A., Moravek, A., Mortenson, E., Mungall, E. L., Murphy, J. G., Namazi, M., Norman, A.-L., O'Neill, N. T., Pierce, J. R., Russell, L. M., Schneider, J., Schulz, H., Sharma, S., Si, M., Staebler, R. M., Steiner, N. S., Thomas, J. L., von Salzen, K., Wentzell, J. J. B., Willis, M. D., Wentworth, G. R., Xu, J.-W., and Yakobi-Hancock, J. D.: Overview paper: New insights into aerosol and climate in the Arctic, Atmos. Chem. Phys., 19, 2527–2560, https://doi.org/10.5194/acp-19-2527-2019, 2019.
Alldredge, A. L., Passow, U., and Logan, B. E.: The abundance and significance of a class of large, transparent organic particles in the ocean, Deep-Sea Res. Pt. I, 40, 1131–1140, 1993.
Alpert, P. A., Kilthau, W. P., Bothe, D. W., Radway, J. C., Aller, J. Y., and Knopf, D. A.: The influence of marine microbial activities on aerosol production: a laboratory mesocosm study, J. Geophys. Res.-Atmos., 120, 8841–8860, https://doi.org/10.1002/2015JD023469, 2015.
Brooks, S. D. and Thornton, D. C. O.: Marine aerosols and clouds, Annu. Rev. Mar. Sci., 10, 289–313, https://doi.org/10.1146/annurev-marine-121916-063148, 2018.
Burrows, S. M., Elbert, W., Lawrence, M. G., and Pöschl, U.: Bacteria in the global atmosphere – Part 1: Review and synthesis of literature data for different ecosystems, Atmos. Chem. Phys., 9, 9263–9280, https://doi.org/10.5194/acp-9-9263-2009, 2009a.
Burrows, S. M., Butler, T., Jöckel, P., Tost, H., Kerkweg, A., Pöschl, U., and Lawrence, M. G.: Bacteria in the global atmosphere – Part 2: Modeling of emissions and transport between different ecosystems, Atmos. Chem. Phys., 9, 9281–9297, https://doi.org/10.5194/acp-9-9281-2009, 2009b.
Burrows, S. M., Hoose, C., Pöschl, U., and Lawrence, M. G.: Ice nuclei in marine air: biogenic particles or dust?, Atmos. Chem. Phys., 13, 245–267, https://doi.org/10.5194/acp-13-245-2013, 2013.
Burrows, S. M., Ogunro, O., Frossard, A. A., Russell, L. M., Rasch, P. J., and Elliott, S. M.: A physically based framework for modeling the organic fractionation of sea spray aerosol from bubble film Langmuir equilibria, Atmos. Chem. Phys., 14, 13601–13629, https://doi.org/10.5194/acp-14-13601-2014, 2014.
Burrows, S. M., Gobrogge, E., Fu, L., Link, K., Elliott, S. M., Wang, H., and Walker, R.: OCEANFILMS-2: Representing coadsorption of saccharides in marine films and potential impacts on modeled marine aerosol chemistry, Geophys. Res. Lett., 43, 8306–8313, https://doi.org/10.1002/2016GL069070, 2016.
Burrows, S. M., McCluskey, C. S., Cornwell, G., Steinke, I., Zhang, K., Zhao, B., Zawadowicz, M., Raman, A., Kulkarni, G., China, S., Zelenyuk, A., DeMott, P. J.: Ice-nucleating particles that impact clouds and climate: Observational and modeling research needs, Rev. Geophys., 60, e2021RG000745, https://doi.org/10.1029/2021RG000745, 2022.
Christiansen, S., Ickes, L., Bulatovic, I., Leck, C., Murray, B. J., Bertram, A. K., Wagner, R., Gorokhova, E., Salter, M. E., Ekman, A. M. L., and Bilde, M.: Influence of Arctic microlayers and algal cultures on sea spray hygroscopicity and the possible implications for mixed-phase clouds, J. Geophys. Res.-Atmos., 125, e2020JD032808, https://doi.org/10.1029/2020JD032808, 2020.
Cisternas-Novoa, C., Lee, C., and Engel, A.: Transparent exopolymer particles (TEP) and Coomassie stainable particles (CSP): Differences between their origin and vertical distributions in the ocean, Mar. Chem., 175, 56–71, 2015.
Cochran, R. E., Laskina, O., Trueblood, J. V., Estillore, A. D., Morris, H. S., Jayarathne, T., Sultana, C. M., Lee, C., Lin, P., Laskin, J., Laskin, A., Dowling, J. A., Qin, Z., Cappa, C. D., Bertram, T. H., Tivanski, A. V., Stone, E. A., Prather, K. A., and Grassian, V. H.: Molecular Diversity of Sea Spray Aerosol Particles: Impact of Ocean Biology on Particle Composition and Hygroscopicity, Chem, 2, 655–667, 2017.
Crawford, I., Lloyd, G., Herrmann, E., Hoyle, C. R., Bower, K. N., Connolly, P. J., Flynn, M. J., Kaye, P. H., Choularton, T. W., and Gallagher, M. W.: Observations of fluorescent aerosol–cloud interactions in the free troposphere at the High-Altitude Research Station Jungfraujoch, Atmos. Chem. Phys., 16, 2273–2284, https://doi.org/10.5194/acp-16-2273-2016, 2016.
Cravigan, L. T., Mallet, M. D., Vaattovaara, P., Harvey, M. J., Law, C. S., Modini, R. L., Russell, L. M., Stelcer, E., Cohen, D. D., Olsen, G., Safi, K., Burrell, T. J., and Ristovski, Z.: Sea spray aerosol organic enrichment, water uptake and surface tension effects, Atmos. Chem. Phys., 20, 7955–7977, https://doi.org/10.5194/acp-20-7955-2020, 2020.
Creamean, J. M., Cross, J. N., Pickart, R., McRaven, L., Lin, P., Pacini, A., Hanlon, R., Schmale, D. G., Ceniceros, J., Aydell, T., Colombi, N., Bolger, E., and DeMott, P. J.: Ice nucleating particles carried from below a phytoplankton bloom to the Arctic atmosphere, Geophys. Res. Lett., 14, 8572–8581, https://doi.org/10.1029/2019GL083039, 2019.
Creamean, J. M., Barry, K., Hill, T. C. J., Hume, C., DeMott, P. J., Shupe, M. D., Dahlke, S., Williams, S., Schmale, J., Beck, I., Hoppe, C. J. M., Fong, A., Chamberlain, E., Bowman, J., Scharien, R., and Persson, O.: Annual cycle observations of aerosols capable of ice formation in central Arctic clouds, Nat. Commun., 13, 3537, https://doi.org/10.1038/s41467-022-31182-x, 2022.
DeMott, P. J., Prenni, A. J., Liu, X., Petters, M. D., Twohy, C. H., Richardson, M. S., Eidhammer, T., Kreidenweis, S. M., and Rogers, D. C.: Predicting global atmospheric ice nuclei distributions and their impacts on climate, P. Natl. Acad. Sci. USA, 107, 11217–11222, 2010.
DeMott, P. J., Prenni, A. J., McMeeking, G. R., Sullivan, R. C., Petters, M. D., Tobo, Y., Niemand, M., Möhler, O., Snider, J. R., Wang, Z., and Kreidenweis, S. M.: Integrating laboratory and field data to quantify the immersion freezing ice nucleation activity of mineral dust particles, Atmos. Chem. Phys., 15, 393–409, https://doi.org/10.5194/acp-15-393-2015, 2015.
DeMott, P. J., Hill, T. C. J., McCluskey, C. S., Prather, K. A., Collins, D. B., Sullivan, R. C., Ruppel, M. J., Mason, R. H., Irish, V. E., Lee, T., Hwang, C. Y., Rhee, T. S., Snider, J. R., McMeeking, G. R., Dhaniyala, S., Lewis, E. R., Wentzell, J. J. B., Abbatt, J., Lee, C., Sultana, C. M., Ault, A. P., Axson, J. L., Diaz Martinez, M., Venero, I., Santos-Figueroa, G., Stokes, M. D., Deane, G. B., Mayol-Bracero, O. L., Grassian, V. H., Bertram, T. H., Bertram, A. K., Moffett, B. F., and Franc, G. D.: Sea spray aerosol as a unique source of ice nucleating particles, P. Natl. Acad. Sci. USA, 113, 5797–5803, https://doi.org/10.1073/pnas.1514034112, 2016.
Després, V. R., Huffman, J. A., Burrows, S. M., Hoose, C., Safatov, A. S., Buryak, G., Fröhlich-Nowoisky, J., Elbert, W., Andreae, M. O., Pöschl, U., and Jaenicke, R.: Primary biological aerosol particles in the atmosphere: a review, Tellus B, 64, 15598, https://doi.org/10.3402/tellusb.v64i0.15598, 2012.
Engel, A., Piontek, J., Metfies, K., Endres, S., Sprong, P., Peeken, I., Gäbler-Schwarz, S., and Nöthig, E.-M.: Inter-annual variability of transparent exopolymer particles in the Arctic Ocean reveals high sensitivity to ecosystem changes, Sci. Rep.-UK, 7, 4129, https://doi.org/10.1038/s41598-017-04106-9, 2017.
Facchini, M. C., Rinaldi, M., Decesari, S., Carbone, C., Finessi, E., Mircea, M., Fuzzi, S., Ceburnis, D., Flanagan, R., Nilsson, E. D., de Leeuw, G., Martino, M., Woeltjen, J., and O’Dowd, C. D.: Primary submicron marine aerosol dominated by insoluble organic colloids and aggregates, Geophys. Res. Lett., 35, L17814, https://doi.org/10.1029/2008GL034210, 2008.
Fennelly, M., Sewell, G., Prentice, M. B., O'Connor, D. J., and Sodeau, J. R.: Review: the use of real-time fluorescence instrumentation to monitor ambient primary biological aerosol particles (PBAP), Atmosphere, 9, 1, https://doi.org/10.3390/atmos9010001, 2018.
Freney, E., Sellegri, K., Nicosia, A., Williams, L. R., Rinaldi, M., Trueblood, J. T., Prévôt, A. S. H., Thyssen, M., Grégori, G., Haëntjens, N., Dinasquet, J., Obernosterer, I., Van Wambeke, F., Engel, A., Zäncker, B., Desboeufs, K., Asmi, E., Timonen, H., and Guieu, C.: Mediterranean nascent sea spray organic aerosol and relationships with seawater biogeochemistry, Atmos. Chem. Phys., 21, 10625–10641, https://doi.org/10.5194/acp-21-10625-2021, 2021.
Fröhlich-Nowoisky, J., Kampf, C. J., Weber, B., Huffmann, J. A., Pöhlker, C., Andreae, M. O., Lang-Yona, N., Burrows, S. M., Gunthe, S. S., Elbert, W., Su, H., Hoor, P., Thines, E., Hoffmann, T., Després, V. R., and Pöschl, U.: Bioaerosols in the earth system: Climate, health, and ecosystem interactions, Atmos. Res., 182, 346–376, 2016.
Fuentes, E., Coe, H., Green, D., and McFiggans, G.: On the impacts of phytoplankton-derived organic matter on the properties of the primary marine aerosol – Part 2: Composition, hygroscopicity and cloud condensation activity, Atmos. Chem. Phys., 11, 2585–2602, https://doi.org/10.5194/acp-11-2585-2011, 2011.
Furutani, H., Dall'osto, M., Roberts, G. C., and Prather, K. A.: Assessment of the relative importance of atmospheric aging on CCN activity derived from field observations, Atmos. Environ., 42, 3130–3142, https://doi.org/10.1016/j.atmosenv.2007.09.024, 2008.
Gabey, A. M., Gallagher, M. W., Whitehead, J., Dorsey, J. R., Kaye, P. H., and Stanley, W. R.: Measurements and comparison of primary biological aerosol above and below a tropical forest canopy using a dual channel fluorescence spectrometer, Atmos. Chem. Phys., 10, 4453–4466, https://doi.org/10.5194/acp-10-4453-2010, 2010.
Gantt, B., Meskhidze, N., Facchini, M. C., Rinaldi, M., Ceburnis, D., and O'Dowd, C. D.: Wind speed dependent size-resolved parameterization for the organic mass fraction of sea spray aerosol, Atmos. Chem. Phys., 11, 8777–8790, https://doi.org/10.5194/acp-11-8777-2011, 2011.
Gong, X., Wex, H., Müller, T., Wiedensohler, A., Höhler, K., Kandler, K., Ma, N., Dietel, B., Schiebel, T., Möhler, O., and Stratmann, F.: Characterization of aerosol properties at Cyprus, focusing on cloud condensation nuclei and ice-nucleating particles, Atmos. Chem. Phys., 19, 10883–10900, https://doi.org/10.5194/acp-19-10883-2019, 2019.
Hartmann, M., Gong, X., Kecorius, S., van Pinxteren, M., Vogl, T., Welti, A., Wex, H., Zeppenfeld, S., Herrmann, H., Wiedensohler, A., and Stratmann, F.: Terrestrial or marine – indications towards the origin of ice-nucleating particles during melt season in the European Arctic up to 83.7∘ N, Atmos. Chem. Phys., 21, 11613–11636, https://doi.org/10.5194/acp-21-11613-2021, 2021.
Hendrickson, B. N., Brooks, S. D., Thornton, D. C. O., Moore, R. H., Crosbie, E., Ziemba, L. D., Carlson, C. A., Baetge, N., Mirrielees, J. A., and Alsante, A. N.: Role of sea surface microlayer properties in cloud formation, Frontiers in Marine Science, 7, 596225, https://doi.org/10.3389/fmars.2020.596225, 2021.
Healy, D. A., O'Connor, D. J., Burke, A. M., and Sodeau, J. R.: A laboratory assessment of the Waveband integrated bioaerosol sensor (WIBS-4) using individual samples of pollen and fungal spore material, Atmos. Environ., 60, 534–543, 2012.
Hernandez, M., Perring, A. E., McCabe, K., Kok, G., Granger, G., and Baumgardner, D.: Chamber catalogues of optical and fluorescent signatures distinguish bioaerosol classes, Atmos. Meas. Tech., 9, 3283–3292, https://doi.org/10.5194/amt-9-3283-2016, 2016.
Hill, T. C. J., Moffett, B. F., DeMott, P. J., Georgakopoulos, D. G., Stump, W. L., and Franc, G. D.: Measurement of ice nucleation-active bacteria on plants and in precipitation by quantitative PCR, Appl. Environ. Microb., 80, 1256–1267, https://doi.org/10.1128/AEM.02967-13, 2014.
Hoose, C. and Möhler, O.: Heterogeneous ice nucleation on atmospheric aerosols: a review of results from laboratory experiments, Atmos. Chem. Phys., 12, 9817–9854, https://doi.org/10.5194/acp-12-9817-2012, 2012.
Ickes, L., Porter, G. C. E., Wagner, R., Adams, M. P., Bierbauer, S., Bertram, A. K., Bilde, M., Christiansen, S., Ekman, A. M. L., Gorokhova, E., Höhler, K., Kiselev, A. A., Leck, C., Möhler, O., Murray, B. J., Schiebel, T., Ullrich, R., and Salter, M. E.: The ice-nucleating activity of Arctic sea surface microlayer samples and marine algal cultures, Atmos. Chem. Phys., 20, 11089–11117, https://doi.org/10.5194/acp-20-11089-2020, 2020.
Inoue, J., Tobo, Y., Taketani, F., and Sato, K.: Oceanic supply of ice-nucleating particles and its effect on ice cloud formation: A case study in the Arctic Ocean during a cold-air outbreak in early winter, Geophys. Res. Lett., 48, e2021GL094646, https://doi.org/10.1029/2021GL094646, 2021.
Ito, A., Miyazaki, Y., Taketani, F., Iwamoto, Y., and Kanaya, Y.: Marine aerosol feedback on biogeochemical cycles and the climate in the Anthropocene: lessons learned from the Pacific Ocean, Environ. Sci.: Atmos., 3, 782–798, https://doi.org/10.1039/D2EA00156J, 2023.
Jaeglé, L., Quinn, P. K., Bates, T. S., Alexander, B., and Lin, J.-T.: Global distribution of sea salt aerosols: new constraints from in situ and remote sensing observations, Atmos. Chem. Phys., 11, 3137–3157, https://doi.org/10.5194/acp-11-3137-2011, 2011.
Jung, C. H., Yoon, Y. J., Kang, H. J., Gim, Y., Lee, B. Y., Ström, J., Krejci, R., and Tunved, P.: The seasonal characteristics of cloud condensation nuclei (CCN) in the arctic lower troposphere, Tellus B, 70, 1–13, https://doi.org/10.1080/16000889.2018.1513291, 2018.
Jung, J., Hong, S.-B., Chen, M., Hur, J., Jiao, L., Lee, Y., Park, K., Hahm, D., Choi, J.-O., Yang, E. J., Park, J., Kim, T.-W., and Lee, S.: Characteristics of methanesulfonic acid, non-sea-salt sulfate and organic carbon aerosols over the Amundsen Sea, Antarctica, Atmos. Chem. Phys., 20, 5405–5424, https://doi.org/10.5194/acp-20-5405-2020, 2020.
Kanaya, Y., Miyazaki, K., Taketani, F., Miyakawa, T., Takashima, H., Komazaki, Y., Pan, X., Kato, S., Sudo, K., Sekiya, T., Inoue, J., Sato, K., and Oshima, K.: Ozone and carbon monoxide observations over open oceans on R/V Mirai from 67∘ S to 75∘ N during 2012 to 2017: testing global chemical reanalysis in terms of Arctic processes, low ozone levels at low latitudes, and pollution transport, Atmos. Chem. Phys., 19, 7233–7254, https://doi.org/10.5194/acp-19-7233-2019, 2019.
Kawana, K., Nakayama, T., and Mochida, M.: Hygroscopicity and CCN activity of atmospheric aerosol particles and the relation to organics: Characteristics of urban aerosols in Nagoya, Japan, J. Geophys. Res.-Atmos., 121, 4100–4121, https://doi.org/10.1002/2015JD023213, 2016.
Kawana, K., Matsumoto, K., Taketani, F., Miyakawa, T., and Kanaya, Y.: Fluorescent biological aerosol particles over the central Pacific Ocean: covariation with ocean surface biological activity indicators, Atmos. Chem. Phys., 21, 15969–15983, https://doi.org/10.5194/acp-21-15969-2021, 2021.
Kawana, K., Kawamura, K., Fu, P., and Barrie, L. A.: Hygroscopicity and CCN activity of water-soluble extracts from the Arctic aerosols in winter to early summer, J. Geophys. Res.-Atmos., 127, e2021JD035979, https://doi.org/10.1029/2021JD035979, 2022a.
Kawana, K., Miyazaki, Y., Omori, Y., Tanimoto, H., Kagami, S., Suzuki, K., Yamashita, Y., Nishioka, J., Deng, Y., Yai, H., and Mochida, M.: Number-size distribution and CCN activity of atmospheric aerosols in the western North Pacific during spring pre-bloom period: Influences of terrestrial and marine sources, J. Geophys. Res.-Atmos., 127, e2022JD036690, https://doi.org/10.1029/2022JD036690, 2022b.
Kawana, K., Taketani, F., Matsumoto, K., Miyakawa, T., and Kanaya, Y.: Dataset for “Roles of marine biota in the formation of atmospheric bioaerosols, cloud condensation nuclei, and ice-nucleating particles over the North Pacific Ocean, Bering Sea, and Arctic Ocean”, Zenodo [data set], https://doi.org/10.5281/zenodo.10425817, 2023.
Lange, R., Dall'Osto, M., Skov, H., Nøjgaard, J. K., Nielsen, I. E., Beddows, D. C. S., Simo, R., Harrison, R. M., and Massling, A.: Characterization of distinct Arctic aerosol accumulation modes and their sources, Atmos. Environ., 183, 1–10, https://doi.org/10.1016/j.atmosenv.2018.03.060, 2018.
Lange, R., Dall'Osto, M., Wex, H., Skov, H., and Massling, A: Large summer contribution of organic biogenic aerosols to Arctic cloud condensation nuclei, Geophys. Res. Lett., 46, 11500–11509, https://doi.org/10.1029/2019GL084142, 2019.
Maki, T., Hara, K., Yamada, M., Kobayashi, F., Hasegawa, H., and Iwasaka, Y.: Epifluorescent microscopic observation of aerosol, Earozoru Kenkyu, 28, 201–207, 2013.
Martin, M., Chang, R. Y.-W., Sierau, B., Sjogren, S., Swietlicki, E., Abbatt, J. P. D., Leck, C., and Lohmann, U.: Cloud condensation nuclei closure study on summer arctic aerosol, Atmos. Chem. Phys., 11, 11335–11350, https://doi.org/10.5194/acp-11-11335-2011, 2011.
Mason, R. H., Si, M., Li, J., Chou, C., Dickie, R., Toom-Sauntry, D., Pöhlker, C., Yakobi-Hancock, J. D., Ladino, L. A., Jones, K., Leaitch, W. R., Schiller, C. L., Abbatt, J. P. D., Huffman, J. A., and Bertram, A. K.: Ice nucleating particles at a coastal marine boundary layer site: correlations with aerosol type and meteorological conditions, Atmos. Chem. Phys., 15, 12547–12566, https://doi.org/10.5194/acp-15-12547-2015, 2015.
Matsuno, K., Yamaguchi, A., Nishino, S., Inoue, J., and Kikuchi, T.: Short-term changes in the mesozooplankton community and copepod gut pigment in the Chukchi Sea in autumn: reflections of a strong wind event, Biogeosciences, 12, 4005–4015, https://doi.org/10.5194/bg-12-4005-2015, 2015.
McCluskey, C. S., Hill, T. C. J., Malfatti, F., Sultana, C. M., Lee, C., Santander, M. V., Beall, C. M., Moore, K. A., Cornwell, G. C., Collins, D. B., Prather, K. A., Jayarathne, T., Stone, E. A., Azam, F., Kreidenweis, S. M., and DeMott, P. J.: A Dynamic Link between Ice Nucleating Particles Released in Nascent Sea Spray Aerosol and Oceanic Biological Activity during Two Mesocosm Experiments, J. Atmos. Sci., 74, 151–166, https://doi.org/10.1175/JAS-D-16-0087.1, 2017.
McCluskey, C. S., Hill, T. C. J., Humphries, R. S., Rauker, A. M., Moreau, S., Strutton, P. G., Chambers, S. D., Williams, A. G., McRobert, I., Ward, J., Keywood, M. D., Harnwell, J., Ponsonby, W., Loh, Z. M., Krummel, P. B., Protat, A., Kreidenweis, S. M., and DeMott, P. J.: Observations of ice nucleating particles over Southern Ocean waters, Geophys. Res. Lett., 45, 11989–11997, https://doi.org/10.1029/2018GL079981, 2018a.
McCluskey, C. S., Hill, T. C. J., Sultana, C. M., Laskina, O., Trueblood, J., Santander, M. V., Beall, C. M., Michaud, J. M., Kreidenweis, S. M., Prather, K. A., Grassian, V., and DeMott, P. J.: A Mesocosm Double Feature: Insights into the Chemical Makeup of Marine Ice Nucleating Particles, J. Atmos. Sci., 75, 2405–2423, https://doi.org/10.1175/JAS-D-17-0155.1, 2018b.
McCluskey, C. S., Ovadnevaite, J., Rinaldi, M., Atkinson, J., Belosi, F., Ceburnis, D., Marullo, S., Hill, T. C. J., Lohmann, U., Kanji, Z. A., O'Dowd, C., Kreidenweis, S. M., and DeMott, P. J.: Marine and terrestrial organic ice-nucleating particles in pristine marine to continentally influenced Northeast Atlantic air masses, J. Geophys. Res.-Atmos., 123, 6196–6212, https://doi.org/10.1029/2017JD028033, 2018c.
McFarquhar, G. M., Bretherton, C. S., Marchand, R., Protat, A., DeMott, P. J., Alexander, S. P., Roberts, G. C., Twohy, C. H., Toohey, D., Siems, S., Huang, Y., Wood, R., Rauber, R. M., Lasher-Trapp, S., Jensen, J., Stith, J. L., Mace, J., Um, J., Järvinen, E., Schnaiter, M., Gettelman, A., Sanchez, K. J., McCluskey, C. S., Russell, L. M., McCoy, I. L., Atlas, R. L., Bardeen, C. G., Moore, K. A., Hill, T. C. J., Humphries, R. S., Keywood, M. D., Ristovski, Z., Cravigan, L., Schofield, R., Fairall, C., Mallet, M. D., Kreidenweis, S. M., Rainwater, B., D'Alessandro, J., Wang, Y., Wu, W., Saliba, G., Levin, E. J. T., Ding, S., Lang, F., Truong, S. C. H., Wolff, C., Haggerty, J., Harvey, M. J., Klekociuk, A. R., and McDonald, A: Observations of Clouds, Aerosols, Precipitation, and Surface Radiation over the Southern Ocean: An Overview of CAPRICORN, MARCUS, MICRE, and SOCRATES, B. Am. Meteorol. Soc., 102, E894–E928, 2021.
Mitts, B. A., Wang, X., Lucero, D. D., Beall, C. M., Deane, G. B., DeMott, P. J., and Prather, K. A.: Importance of supermicron ice nucleating particles in nascent sea spray, Geophys. Res. Lett., 48, e2020GL089633, https://doi.org/10.1029/2020GL089633, 2021.
Miyazaki, Y., Yamashita, Y., Kawana, K., Tachibana, E., Kagami, S., Mochida, M., Suzuki, K., and Nishioka, J.: Chemical transfer of dissolved organic matter from surface seawater to sea spray water-soluble organic aerosol in the marine atmosphere, Sci. Rep.-UK, 8, 14861, https://doi.org/10.1038/s41598-018-32864-7, 2018.
Moallemi, A., Landwehr, S., Robinson, C., Simó, R., Zamanillo, M., Chen, G., Baccarini, A., Schnaiter, M., Henning, S., Modini, R. L., Gysel-Beer, M., and Schmale, J.: Sources, occurrence and characteristics of fluorescent biological aerosol particles measured over the pristine Southern Ocean, J. Geophys. Res.-Atmos., 126, e2021JD034811, https://doi.org/10.1029/2021JD034811, 2021.
Möhler, O., DeMott, P. J., Vali, G., and Levin, Z.: Microbiology and atmospheric processes: the role of biological particles in cloud physics, Biogeosciences, 4, 1059–1071, https://doi.org/10.5194/bg-4-1059-2007, 2007.
Murray, B. J., O'Sullivan, D., Atkinson, J. D., and Webb, M. E.: Ice nucleation by particles immersed in supercooled cloud droplets, Chem. Soc. Rev., 41, 6519–6554, 2012.
Nishino, S., Kikuchi, T., Fujiwara, A., Hirawake, T., and Aoyama, M.: Water mass characteristics and their temporal changes in a biological hotspot in the southern Chukchi Sea, Biogeosciences, 13, 2563–2578, https://doi.org/10.5194/bg-13-2563-2016, 2016.
O'Connor, D. J., Healy, D. A., and Sodeau, J. R.: The on-line detection of biological particle emissions from selected agricultural materials using the WIBS-4 (Waveband Integrated Bioaerosol Sensor) technique, Atmos. Environ., 80, 415–425, 2013.
O’Dowd, C., Ceburnis, D., Ovadnevaite, J. Bialek, J., Stengel, D. B., Zacharias, M., Nitschke, U., Connan, S., Rinaldi, M., Fuzzi, S., Decesari, S., Facchini, M. C., Marullo, S., Santoleri, R., Dell’Anno, A., Corinaldesi, C., Tangherlini, M., and Danovaro, R.: Connecting marine productivity to sea-spray via nanoscale biological processes: Phytoplankton dance or death disco?, Sci. Rep.-UK, 5, 14883, https://doi.org/10.1038/srep14883, 2015.
Ovadnevaite, J., Ceburnis, D., Martucci, G., Bialek, J., Monahan, C., Renaldi, M., Facchini, M. C., Berresheim, H., Worsnop, D. R., and O'Dowd, C.: Primary marine organic aerosol: A dichotomy of low hygroscopicity and high CCN activity, Geophys. Res. Lett., 38, L21806, https://doi.org/10.1029/2011GL048869, 2011.
Ovadnevaite, J., Ceburnis, D., Canagaratna, M., Berrescheim, H., Bialek, J., Martucci, G., Worsnop, D. R., and O'Dowd, C.: On the effect of wind speed on submicron sea salt mass concentrations and source fluxes, J. Geophys. Res., 117, D16201, https://doi.org/10.1029/2011JD017379, 2012.
Ovadnevaite, J., Ceburnis, D., Leinert, S., Dall'Osto, M., Canagaratna, M., O'Doherty, S., Berresheim, H., and O'Dowd, C.: Submicron NE Atlantic marine aerosol chemical composition and abundance: Seasonal trends and air mass categorization, J. Geophys. Res.-Atmos., 119, 11850–11863, https://doi.org/10.1002/2013JD021330, 2014.
Park, J., Dall'Osto, M., Park, K., Kim, J.-H., Park, J., Park, K.-T., Hwang, C. Y., Jang, G. I., Gim, Y., Kang, S., Park, S., Jin, Y. K., Yum, S. S., Simo, R., and Yoon, Y. J.: Arctic primary aerosol production strongly influenced by riverine organic matter, Environ. Sci. Technol., 53, 8621–8630, https://doi.org/10.1021/acs.est.9b03399, 2019.
Passow, U. and Alldredge, A. L.: A dye-binding assay for the spectrophotometric measurement of transparent exopolymer particles (TEP) in the ocean, Limnol. Oceanogr., 40, 1326–1335, 1995.
Perring, A. E., Schwarz, J. P., Baumgardner, D., Hernandez, M. T., Spracklen, D. V., Heald, C. L., Gao, R. S., Kok, G., McMeeking, G. R., McQuaid, J. B., and Fahey, D. W.: Airborne observations of regional variation in fluorescent aerosol across the United States, J. Geophys. Res.-Atmos., 120, 1153–1170, https://doi.org/10.1002/2014JD022495, 2015.
Petters, M. D. and Kreidenweis, S. M.: A single parameter representation of hygroscopic growth and cloud condensation nucleus activity, Atmos. Chem. Phys., 7, 1961–1971, https://doi.org/10.5194/acp-7-1961-2007, 2007.
Pöhlker, C., Huffman, J. A., and Pöschl, U.: Autofluorescence of atmospheric bioaerosols – fluorescent biomolecules and potential interferences, Atmos. Meas. Tech., 5, 37–71, https://doi.org/10.5194/amt-5-37-2012, 2012.
Prather, K. A., Bertram, T. H., Grassian, V. H., Deane, G. B., Stokes, M. D., DeMott, P. J., Aluwihare, L. I., Palenik, B. P., Azam, F., Seinfeld, J. H., Moffet, R. C., Molina, M. J., Cappa, C. D., Geiger, F. M., Roberts, G. C., Russell, L. M., Ault, A. P., Baltrusaitis, J., Collins, D. B., Corrigan, C. E., Cuadra-Rodriguez, L. A., Ebben, C. J., Forestieri, S. D., Guasco, T. L., Hersey, S. P., Kim, M. J., Lambert, W. F., Modini, R. L., Mui, W., Pedler, B. E., Ruppel, M. J., Ryder, O. S., Schoepp, N. G., Sullivan, R. C., and Zhao, D.: Bringing the ocean into the laboratory to probe the chemical complexity of sea spray aerosol, P. Natl. Acad. Sci. USA, 110, 7550–7555, https://doi.org/10.1073/pnas.1300262110, 2013.
Pringle, K. J., Tost, H., Pozzer, A., Pöschl, U., and Lelieveld, J.: Global distribution of the effective aerosol hygroscopicity parameter for CCN activation, Atmos. Chem. Phys., 10, 5241–5255, https://doi.org/10.5194/acp-10-5241-2010, 2010.
Quinn, P. K. and Bates, T. S.: Ocean-Derived Aerosol and Its Climate impacts, in: Treatise on Geochemistry, Elsevier, Oxford, 317–330, https://doi.org/10.1016/b978-0-08-095975-7.00416-2, 2014.
Ramanathan, V., Crutzen, P. J., Kiehl, J. T., and Rosenfeld, D.: Atmosphere – Aerosols, climate, and the hydrological cycle, Science, 294, 2119–2124, 2001.
Rastelli, E., Corinaldesi, C., Dell'Anno, A., Martire, M. L., Greco, S., Facchini, M. C., Rinaldi, M., O'Dowd, C., Ceburnis, D., and Danovaro, R.: Transfer of labile organic matter and microbes from the ocean surface to the marine aerosol: an experimental approach, Sci. Rep.-UK, 7, 11475, https://doi.org/10.1038/s41598-017-10563-z, 2017.
Rinaldi, M., Facchini, M. C., Decesari, S., Carbone, C., Finessi, E., Mircea, M., Fuzzi, S., Ceburnis, D., Ehn, M., Kulmala, M., de Leeuw, G., and O'Dowd, C. D.: On the representativeness of coastal aerosol studies to open ocean studies: Mace Head – a case study, Atmos. Chem. Phys., 9, 9635–9646, https://doi.org/10.5194/acp-9-9635-2009, 2009.
Rinaldi, M., Fuzzi, S., Decesari, S., Marullo, S., Santoleri, R., Provenzale, A., von Hardenberg, J., Ceburnis, D., Vaishya, A., O'Dowd, C. D., and Facchini, M. C.: Is chlorophyll-a the best surrogate for organic matter enrichment in submicron primary marine aerosol?, J. Geophys. Res.-Atmos., 118, 4964–4973 https://doi.org/10.1002/jgrd.50417, 2013.
Robinson, E. S., Gao, R.-S., Schwarz, J. P., Fahey, D. W., and Perring, A. E.: Fluorescence calibration method for single-particle aerosol fluorescence instruments, Atmos. Meas. Tech., 10, 1755–1768, https://doi.org/10.5194/amt-10-1755-2017, 2017.
Russell, L. M., Hawkins, L. N., Frossard, A. A., Quinn, P. K., and Bates, T. S.: Carbohydrate-like composition of submicron atmospheric particles and their production from ocean bubble bursting, P. Natl. Acad. Sci. USA, 107, 6652–6657, https://doi.org/10.1073/pnas.0908905107, 2010.
Sanchez, K. J., Zhang, B., Liu, H., Saliba, G., Chen, C.-L., Lewis, S. L., Russell, L. M., Shook, M. A., Crosbie, E. C., Ziemba, L. D., Brown, M. D., Shingler, T. J., Robinson, C. E., Wiggins, E. B., Thornhill, K. L., Winstead, E. L., Jordan, C., Quinn, P. K., Bates, T. S., Porter, J., Bell, T. G., Saltzman, E. S., Behrenfeld, M. J., and Moore, R. H.: Linking marine phytoplankton emissions, meteorological processes, and downwind particle properties with FLEXPART, Atmos. Chem. Phys., 21, 831–851, https://doi.org/10.5194/acp-21-831-2021, 2021.
Santander, M. V., Mitts, B. A., Pendergraft, M. A., Dinasquet, J., Lee, C., Moore, A. N., Cancelada, L. B., Kimble, K. A., Malfatti, F., and Prather, K. A.: Tandem Fluorescence Measurements of Organic Matter and Bacteria Released in Sea Spray Aerosols, Environ. Sci. Technol., 55, 5171–5179, https://doi.org/10.1021/acs.est.0c05493, 2021.
Santander, M. V., Schiffer, J. M., Lee, C., Axson, J. L., Tauber, M. J., and Prather, K. A.: Factors controlling the transfer of biogenic organic species from seawater to sea spray aerosol, Sci. Rep.-UK, 12, 3580, https://doi.org/10.1038/s41598-022-07335-9, 2022.
Savage, N. J., Krentz, C. E., Könemann, T., Han, T. T., Mainelis, G., Pöhlker, C., and Huffman, J. A.: Systematic characterization and fluorescence threshold strategies for the wideband integrated bioaerosol sensor (WIBS) using size-resolved biological and interfering particles, Atmos. Meas. Tech., 10, 4279–4302, https://doi.org/10.5194/amt-10-4279-2017, 2017.
Schmale, J., Schneider, J., Nemitz, E., Tang, Y. S., Dragosits, U., Blackall, T. D., Trathan, P. N., Phillips, G. J., Sutton, M., and Braban, C. F.: Sub-Antarctic marine aerosol: dominant contributions from biogenic sources, Atmos. Chem. Phys., 13, 8669–8694, https://doi.org/10.5194/acp-13-8669-2013, 2013.
Schmale, J., Baccarini, A., Thurnherr, I., Henning, S., Efraim, A., Regayre, L., Bolas, C., Hartmann, M., Welti, A., Lehtipalo, K., Aemisegger, F., Tatzelt, C., Landwehr, S., Modini, R. L., Tummon, F., Johnson, J. S., Harris, N., Schnaiter, M., Toffoli, A., Derkani, M., Bukowiecki, N., Stratmann, F., Dommen, J., Baltensperger, U., Wernli, H., Rosenfeld, D., Gysel-Beer, M., and Carslaw, K. S.:: Overview of the Antarctic Circumnavigation Expedition: study of preindustrial-like aerosols and their climate effects (ACE-SPACE), B. Am. Meteorol. Soc., 100, 2260–2283, https://doi.org/10.1175/BAMS-D-18-0187.1, 2019.
Schulze, B. C., Charan, S. M., Kenseth, C. M., Kong, W., Bates, K. H., Williams, W., Metcalf, A. R., Jonsson, H. H., Woods, R., Sorooshian, A., Flagan, R. C., and Seinfeld, J. H.: Characterization of aerosol hygroscopicity over the Northeast Pacific Ocean: Impacts on Prediction of CCN and Stratocumulus cloud droplet number concentrations, Earth and Space Science, 7, e2020EA001098, https://doi.org/10.1029/2020EA001098, 2020.
Shupe, M. D., Rex, M., Blomquist, B., Persson, P. O. G., Schmale, J., Uttal, T., Althausen, D., Angot, H., Archer, S., Bariteau, L., Beck, I., Bilberry, J., Bucci, S., Buck, C., Boyer, M., Brasseur, Z., Brooks, I. M., Calmer, R., Cassano, J., Castro, V., Chu, D., Costa, D., Cox, C. J., Creamean, J., Crewell, S., Dahlke, S., Damm, E., de Boer, G., Deckelmann, H., Dethloff, K., Dütsch, M., Ebell, K., Ehrlich, A., Ellis, J., Engelmann, R., Fong, A. A., Frey, M. M., Gallagher, M. R., Ganzeveld, L., Gradinger, R., Graeser, J., Greenamyer, V., Griesche, H., Griffiths, S., Hamilton, J., Heinemann, G., Helmig, D., Herber, A., Heuzé, C., Hofer, J., Houchens, T., Howard, D., Inoue, J., Jacobi, H.-W., Jaiser, R., Jokinen, T., Jourdan, O., Jozef, G., King, W., Kirchgaessner, A., Klingebiel, M., Krassovski, M., Krumpen, T., Lampert, A., Landing, W., Laurila, T., Lawrence, D., Lonardi, M., Loose, B., Lüpkes, C., Maahn, M., Macke, A., Maslowski, W., Marsay, C., Maturilli, M., Mech, M., Morris, S., Moser, M., Nicolaus, M., Ortega, P., Osborn, J., Pätzold, F., Perovich, D. K., Petäjä, T., Pilz, C., Pirazzini, R., Posman, K., Powers, H., Pratt, K. A., Preußer, A., Quéléver, L., Radenz, M., Rabe, B., Rinke, A., Sachs, T., Schulz, A., Siebert, H., Silva, T., Solomon, A., Sommerfeld, A., Spreen, G., Stephens, M., Stohl, A., Svensson, G., Uin, J., Viegas, J., Voigt, C., von der Gathen, P., Wehner, B., Welker, J. M., Wendisch, M., Werner, M., Xie, Z., and Yue, F.: Overview of the MOSAiC expedition–Atmosphere, Elementa: Science of the Anthropocene, 10, 00060, https://doi.org/10.1525/elementa.2021.00060, 2022.
Silvergren, S., Wideqvist, U., Ström, J., Sjogren, S., and Svenningsson, B.: Hygroscopic growth and cloud forming potential of Arctic aerosol based on observed chemical and physical characteristics (a 1 year study 2007–2008), J. Geophys. Res., 119, 14080–14097, https://doi.org/10.1002/2014JD021657, 2014.
Simpson, E. L., Connolly, P. J., and McFiggans, G.: Competition for water vapour results in suppression of ice formation in mixed-phase clouds, Atmos. Chem. Phys., 18, 7237–7250, https://doi.org/10.5194/acp-18-7237-2018, 2018.
Stein, A. F., Draxler, R. R., Rolph, G. D., Stunder, B. J. B., Cohen, M. D., and Ngan, F.: NOAA's HYSPLIT atmospheric transport and dispersion modeling system, B. Am. Meteorol. Soc., 96, 2059–2077, 2015.
Sun, C.-C., Sperling, M., and Engel, A.: Effect of wind speed on the size distribution of gel particles in the sea surface microlayer: insights from a wind–wave channel experiment, Biogeosciences, 15, 3577–3589, https://doi.org/10.5194/bg-15-3577-2018, 2018.
Sun, J. and Ariya, P. A.: Atmospheric organic and bio-aerosols as cloud condensation nuclei (CCN): A review, Atmos. Environ., 40, 795–820, https://doi.org/10.1016/j.atmosenv.2005.05.052, 2006.
Taketani, F., Miyakawa, T., Takigawa, M., Yamaguchi, M., Komazaki, Y., Mordovskoi, P., Takashima, H., Zhu, C., Nishino, S., Tohjima, Y., and Kanaya, Y.: Characteristics of atmospheric black carbon and other aerosol particles over the Arctic Ocean in early autumn 2016: Influence from biomass burning as assessed with observed microphysical properties and model simulations, Sci. Total Environ., 848, 157671, https://doi.org/10.1016/j.scitotenv.2022.157671, 2022.
Tang, K., Sánchez-Parra, B., Yordanova, P., Wehking, J., Backes, A. T., Pickersgill, D. A., Maier, S., Sciare, J., Pöschl, U., Weber, B., and Fröhlich-Nowoisky, J.: Bioaerosols and atmospheric ice nuclei in a Mediterranean dryland: community changes related to rainfall, Biogeosciences, 19, 71–91, https://doi.org/10.5194/bg-19-71-2022, 2022.
Tatzelt, C., Henning, S., Welti, A., Baccarini, A., Hartmann, M., Gysel-Beer, M., van Pinxteren, M., Modini, R. L., Schmale, J., and Stratmann, F.: Circum-Antarctic abundance and properties of CCN and INPs, Atmos. Chem. Phys., 22, 9721–9745, https://doi.org/10.5194/acp-22-9721-2022, 2022.
Taylor, J., Cottingham, S., Billinge, J., and Cunliffe, M.: Seasonal microbial community dynamics correlate with phytoplankton-derived polysaccharides in surface coastal waters, ISME J., 8, 245–248, https://doi.org/10.1038/ismej.2013.178, 2014.
Thornton, D. C. O.: Coomassie Stainable Particles (CSP): Protein Containing Exopolymer Particles in the Ocean, Frontiers in Marine Science, 5, 206, https://doi.org/10.3389/fmars.2018.00206, 2018.
Tobo, Y.: An improved approach for measuring immersion freezing in large droplets over a wide temperature range, Sci. Rep.-UK, 6, 32930, https://doi.org/10.1038/srep32930, 2016.
Tobo, Y., Uetake, J., Matsui, H., Moteki, N., Uji, Y., Iwamoto, Y., Miura, K., and Misumi, R.: Seasonal trends of atmospheric ice nucleating particles over Tokyo, J. Geophys. Res.-Atmos., 125, e2020JD033658, https://doi.org/10.1029/2020JD033658, 2020.
van Pinxteren, M., Fomba, K. W., Triesch, N., Stolle, C., Wurl, O., Bahlmann, E., Gong, X., Voigtländer, J., Wex, H., Robinson, T.-B., Barthel, S., Zeppenfeld, S., Hoffmann, E. H., Roveretto, M., Li, C., Grosselin, B., Daële, V., Senf, F., van Pinxteren, D., Manzi, M., Zabalegui, N., Frka, S., Gašparović, B., Pereira, R., Li, T., Wen, L., Li, J., Zhu, C., Chen, H., Chen, J., Fiedler, B., von Tümpling, W., Read, K. A., Punjabi, S., Lewis, A. C., Hopkins, J. R., Carpenter, L. J., Peeken, I., Rixen, T., Schulz-Bull, D., Monge, M. E., Mellouki, A., George, C., Stratmann, F., and Herrmann, H.: Marine organic matter in the remote environment of the Cape Verde islands – an introduction and overview to the MarParCloud campaign, Atmos. Chem. Phys., 20, 6921–6951, https://doi.org/10.5194/acp-20-6921-2020, 2020.
van Pinxteren, M., Robinson, T.-B., Zeppenfeld, S., Gong, X., Bahlmann, E., Fomba, K. W., Triesch, N., Stratmann, F., Wurl, O., Engel, A., Wex, H., and Herrmann, H.: High number concentrations of transparent exopolymer particles in ambient aerosol particles and cloud water – a case study at the tropical Atlantic Ocean, Atmos. Chem. Phys., 22, 5725–5742, https://doi.org/10.5194/acp-22-5725-2022, 2022.
Vergara-Temprado, J., Murray, B. J., Wilson, T. W., O'Sullivan, D., Browse, J., Pringle, K. J., Ardon-Dryer, K., Bertram, A. K., Burrows, S. M., Ceburnis, D., DeMott, P. J., Mason, R. H., O'Dowd, C. D., Rinaldi, M., and Carslaw, K. S.: Contribution of feldspar and marine organic aerosols to global ice nucleating particle concentrations, Atmos. Chem. Phys., 17, 3637–3658, https://doi.org/10.5194/acp-17-3637-2017, 2017.
Warneck, P.: Chemistry of the natural atmosphere, 2nd edn., Academic Press, 9780127329512, 012732951X, 2000.
Welti, A., Bigg, E. K., DeMott, P. J., Gong, X., Hartmann, M., Harvey, M., Henning, S., Herenz, P., Hill, T. C. J., Hornblow, B., Leck, C., Löffler, M., McCluskey, C. S., Rauker, A. M., Schmale, J., Tatzelt, C., van Pinxteren, M., and Stratmann, F.: Ship-based measurements of ice nuclei concentrations over the Arctic, Atlantic, Pacific and Southern oceans, Atmos. Chem. Phys., 20, 15191–15206, https://doi.org/10.5194/acp-20-15191-2020, 2020.
Wex, H., Huang, L., Zhang, W., Hung, H., Traversi, R., Becagli, S., Sheesley, R. J., Moffett, C. E., Barrett, T. E., Bossi, R., Skov, H., Hünerbein, A., Lubitz, J., Löffler, M., Linke, O., Hartmann, M., Herenz, P., and Stratmann, F.: Annual variability of ice-nucleating particle concentrations at different Arctic locations, Atmos. Chem. Phys., 19, 5293–5311, https://doi.org/10.5194/acp-19-5293-2019, 2019.
Wilson, T. W., Ladino, L. A., Alpert, P. A., Breckels, M. N., Brooks, I. M., Browse, J., Burrows, S. M., Carslaw, K. S., Huffmann, J. A., Judd, C., Kilthau, W. P., Mason, R. H., McFiggans, G., Miller, L. A., Nájera, J. J., Polishchuk, E., Rae, S., Schiller, C. L., Si, M., Temprado, J. V., Whale, T. F., Wong, J. P. S., Wurl, O., Yakobi-Hancock, J. D., Abbatt, J. P. D., Aller, J. Y., Bertram, A. K., Knopf, D. A., and Murray, B. J.: A marine biogenic source of atmospheric ice-nucleating particles, Nature, 525, 234–238, https://doi.org/10.1038/nature14986, 2015.
Xie, W., Li, Y., Bai, W., Hou, J., Ma, T., Zeng, X., Zhang, L., and An, T.: The source and transport of bioaerosols in the air: A review, Front. Env. Sci. Eng., 15, 44, https://doi.org/10.1007/s11783-020-1336-8, 2021.