the Creative Commons Attribution 4.0 License.
the Creative Commons Attribution 4.0 License.
 | 31 Jan 2024
Variations of the atmospheric polycyclic aromatic hydrocarbon concentrations, sources, and health risk and the direct medical costs of lung cancer around the Bohai Sea against a background of pollution prevention and control in China
Wenwen Ma
Rong Sun
Xiaoping Wang
Zheng Zong
Shizhen Zhao
Zeyu Sun
Chongguo Tian
Jianhui Tang
Song Cui
Gan Zhang
The Bohai Sea (BS) region, an area of China that is severely polluted with atmospheric polycyclic aromatic hydrocarbons (PAHs), has received wide attention in recent decades. To characterize the variations of the concentrations and sources of PAHs from June 2014 to May 2019, 15 PAH congeners (Σ15PAHs) were measured in atmospheric samples (N = 228) collected at 12 sites around the BS, and the health risk and direct medical costs associated with lung cancer caused by exposure to PAHs were also estimated. The annual daily average concentration of Σ15PAHs was 56.78 ± 4.75 ng m−3, which was dominated by low molecular weight PAHs (LMW-PAHs) containing three rings (58.7 ± 7.8 %). During the 5-year sampling period, the atmospheric Σ15PAHs concentration reduced by 17.5 % for the whole BS region, with an especially large drop of 51.7 % observed in the tightly controlled area of Tianjin (TJ), which was mainly due to a decrease in the concentration of high molecular weight PAHs (HMW-PAHs) containing five or six rings. Generally, the concentration of Σ15PAHs was highest in winter and lowest in summer, which can mainly be attributed to the change in LMW-PAH concentration. Based on the positive matrix factorization (PMF) model, PAHs in the BS region were mainly ascribed to coal combustion and biomass burning. The PAH contributions of coal combustion and motor vehicles showed different trends for the BS region (PAHs from coal combustion rose by 7.2 % and PAHs from motor vehicles fell by 22.4 %) and for TJ (PAHs from coal combustion fell by 12.6 % and PAHs from motor vehicles rose by 6.9 %). The incidence of lung cancer (ILCR) caused by exposure to atmospheric PAHs decreased by 74.1 % and 91.6 % from 2014 to 2018 in the BS region and in TJ, respectively. This was mainly due to the decrease in the concentration of highly toxic HMW-PAHs and was reflected in USD 10.7 million of savings in direct medical costs of lung cancer caused by exposure to PAHs, which represent a decrease of 46.1 % compared to the corresponding costs before air pollution prevention and control was implemented around the BS. There was an even higher reduction in medical costs of 54.5 % in TJ. Hence, this study proves that implementing pollution prevention and control not only effectively reduced the concentration of pollutants and the risks caused by them, but it also significantly reduced the medical costs of diseases caused by the corresponding exposure.
- Article
(1923 KB) - Full-text XML
-
Supplement
(2287 KB) - BibTeX
- EndNote


Polycyclic aromatic hydrocarbons (PAHs), a class of classical organic compounds with at least two benzene rings, have long received attention because of their cytotoxic, teratogenic, mutagenic, or carcinogenic properties (Colvin et al., 2020; Marvin et al., 2020). The United States Environmental Protection Agency (USEPA) identified 16 PAH congeners as priority pollutants (Lv et al., 2020). Previous studies have shown that PAHs in the atmosphere of heavily polluted areas such as factories and urban environments pose a threat to human health, especially that of the respiratory system (Agudelo-Castañeda et al., 2017; Ramírez et al., 2011). Because of their relatively high concentrations, strong toxic potency, and capacity to be transported over long distances, PAH congeners in the atmosphere are considered as a major factor in the lung cancer risk to the public (Ma et al., 2010; Gong et al., 2011; Ma et al., 2013; Hong et al., 2016). In terms of its incidence and the mortality resulting from it, lung cancer is ranked higher than any other cancer around the world, and so the lung cancer risk owing to exposure to PAHs is of particular concern and has been widely assessed (Křůmal and Mikuška, 2020; Liao et al., 2011; Taghvaee et al., 2018; Zhang et al., 2023).
PAHs are emitted primarily via the incomplete combustion and pyrolysis of carbon-contained materials, such as fossil fuels and biomass (Biache et al., 2014). China was found to be the largest emitter of PAHs all over the world for the last two decades because of the rapid development of its economy and its increasing consumption of carbon-containing materials (Y. X. Zhang et al., 2007), particularly in the Bohai Economic Zone, as the third-fastest-developing economic region (Sun et al., 2022). PAH pollution in the atmosphere above the Bohai Sea (BS) is in a severe situation (Wang et al., 2018). The Bohai Economic Zone includes the Beijing–Tianjin–Hebei (BTH) region, the Liaodong Peninsula, and the Shandong Peninsula. The BTH region is the center of economic development in the Bohai Rim economic area (Liang et al., 2018; Zhang et al., 2016). Hence, the Beijing–Tianjin–Hebei (BTH) region is one of the regions with the highest PAH emission intensities and the heaviest atmospheric PAH concentrations in China (Zhang et al., 2007; Y. X. Zhang et al., 2007). Given the presence of such serious pollution, the health risk due to exposure to PAHs is the cause of great concern. The population attributable fraction (PAF) for lung cancer caused by the inhalation of PAHs in the atmosphere in the BTH area was more than twice higher than the mean value for the whole of China in 2009 (Zhang et al., 2009). The incremental lifetime cancer risk (ILCR) due to PAH exposure in Tianjin was in the range of 1 × 10⁻⁵ to 1 × 10⁻³ in 2008, which was much higher than the mean level of 4.56 × 10⁻⁶ for China (Lian et al., 2021). The annual lung cancer morbidity in Tianjin (within the BTH region), 6.99 × 10⁻⁶, was the highest for any city among 35 cancer registries in China (S. W. Zhang et al., 2007). Meanwhile, given the frequent occurrence of haze in the BTH region, more attention has been paid to the concentration levels and the health risk of fine particulate matter with an aerodynamic equivalent diameter of ≤ 2.5 µm (PM2.5) since 2013 (Chen et al., 2020).
PM2.5 pollution in China has clearly improved since the Air Pollution Prevention and Control Action Plan (2013–2017) and the Three-Year Action Plan for Winning the Blue-Sky Defense Battle (2018–2020) were proposed by the Chinese government in 2013 and 2018, respectively (Zhao et al., 2023). As it is one of the severely polluted areas in China, the improvement was more significant in the BTH region, which implemented the strictest pollution control policy (Li et al., 2020). As reported, the concentration of PM2.5 in the BTH region dropped by 52 % from 106 µg m−3 in 2013 to 51 µg m−3 in 2020 (Bulletin of the State of China's Ecological Environment, 2021). Reducing emissions from coal combustion and motor vehicles is a major aim of policies aimed at the prevention and control of pollution (Guo et al., 2018; Li et al., 2019). These two sources have been recognized as primary contributors to the PAHs in the atmosphere as well (Lin et al., 2015; Han et al., 2018). As a result, imposing controls on these two sources reduced not only PM2.5 emissions but also PAH emissions (Zhi et al., 2017). As part of the control processes, the variations in the concentrations and the health risk of PM2.5 in the BTH region have been identified in detail (D. Fang et al., 2016; Yan et al., 2019), but our understanding of the PAHs in this region needs to be updated urgently. In particular, the statistical data on the lung cancer risk due to exposure to PAHs were established 10 years ago (Zhang et al., 2009; Lian et al., 2021).
To track changes in the concentrations and sources of atmospheric PAHs and to estimate the health risk and the direct medical costs associated with lung cancer caused by exposure to PAHs during the air pollution control actions, a field monitoring campaign was conducted at 12 sites around the BS for 5 years from June 2014 to May 2019. The air pollution control measures implemented were different for the BTH region, the Liaodong Peninsula, and the Shandong Peninsula (Huang et al., 2017). Thus, this study provided us with an opportunity to understand the variations in the environmental concentrations, source contributions, and health risk of PAHs. The main aims of this study were (1) to characterize the spatial and temporal changes in the concentrations and components of PAHs in the atmosphere around the BS, (2) to evaluate differences in PAH source contributions, and (3) to assess the changes in direct medical costs of treating lung cancer caused by inhalation exposure to PAHs against a background of atmospheric pollution prevention and control over 5 years.
2.1 Sampling sites and sample collection
The sampling sites used for this study were reported in previous literature (Sun et al., 2021) and are briefly introduced here. Information on the sites is shown in Table S1 in the Supplement. The 12 air sampling sites were located at Beihuangcheng (BH), Dalian (DL), Donggang (DG), Dongying (DY), Gaizhou (GZ), Longkou (LK), Laoting (LT), Rongcheng (RC), Tianjin (TJ), Xingcheng (XC), Yantai (YT), and Zhuanghe (ZH). A passive air sampler with polyurethane foam (PUF, 14.00 cm diameter × 1.35 cm thickness) was used to collect atmospheric samples at each sampling site (Eng et al., 2014). The PUF disks were deployed around 1.5–2.0 m above the ground, and the sampling duration was about 3 months for one batch. 228 samples were collected from June 2014 to May 2019. The sampling rate of atmospheric PAHs was 3.5 m3 d−1 (Jaward et al., 2005; Moeckel et al., 2009). Prior to sampling, the PUF disks were pre-cleaned with methanol, acetone, and hexane. The extracted PUF disks were placed in airtight containers and stored at −18 ∘C before the sampling campaign. After sampling, the samples were prepared and then stored in a freezer at −18 ∘C in the lab for further analyses.
2.2 Sample pretreatment and instrumental analysis
The five PAH surrogates (naphthalene-D8, acenaphthene-D10, phenanthrene-D10, chrysene-D12, and perylene-D12) and the activated copper fragments were added in advance (Qu et al., 2022). The samples were extracted for 24 h with an eluent of acetone and hexane (200 mL, v:v = 1:1) through a Soxhlet apparatus. The extracted solution was concentrated to 1 mL with a rotary evaporator (Zhengzhou Greatwall Ltd., China). Then, a silica-alumina column was used to obtain the aromatic components. The targets were obtained with 40 mL of a mixed solution of dichloromethane and hexane (v:v = 1:1). Finally, the eluent was concentrated and reduced to 500 µL by a gentle nitrogen stream. 400 ng of hexamethylbenzene (Supelco, USA) were added as an internal standard substance to each sample solution before the instrumental analysis.
The targets were detected using a gas chromatograph equipped with a mass spectrometer (GC-MS, Agilent 5975C-7890A, USA), and the chromatographic column was a DB-5MS (Agilent Technologies, 30 m × 0.25 mm × 0.25 µm). Each 1 µL extract was injected in splitless mode. High-purity helium (purity ≥ 99.99 %) with a flow rate of 1.3 mL min−1 was used as the carrier gas. The oven temperature was set and held at 80 ∘C for 3 min; it was then raised at 10 to 310 ∘C, where it was held for 10 min. The temperatures of the inlet and the ion source were 290 and 230 ∘C, respectively. Details regarding the targeted compounds are shown in Table S2. Seven gradients of mixed solutions were established for the quantitative calculation of PAHs. More details were reported in a previous study (Wang et al., 2018).
2.3 Quality assurance and quality control
The mean recovery values of naphthalene-D8, acenaphthene-D10, phenanthrene-D10, chrysene-D12, and perylene-D12 were 77.3 %, 85.9 %, 87.5 %, 88.3 %, and 92.8 %, respectively, with the total range of 66.5 %–123.1 %. All the relative deviations were within 20 % except that for naphthalene-D8. Naphthalene (Nap) was excluded from this investigation because of its low recovery, and another 15 PAHs were determined in this study. For each batch of 12 PUF samples, a field blank and a procedural blank were also analyzed following the same treatment process. In this study, the method detection limits (MDLs, defined as the mean blank value plus 3 times the standard deviation) for the 15 PAH congeners ranged from 0.02 to 0.13 ng sample−1, as shown in Table S2. The final concentrations were not surrogate corrected. The glassware was all cleaned and burned for 8 h in a muffle oven at 450 ∘C before the experiment. The solvents were chromatography pure or had been redistilled and purified before using.
2.4 PAH source apportionment
The model of positive matrix factorization (PMF) released by the USEPA (PMF 5.0) was used to apportion the emission sources of PAHs in this study. The basic calculation formula for the PMF method is given by Eq. (1):
where p represents the number of sources identified by the PMF model, xij represents the original concentration data for the ith chemical species and the jth sample, gik represents the source profile of the kth source and the jth chemical species, fkj represents the contribution ratio of the kth source to the jth sample, and eij represents the simulated residual error of the ith chemical species and the jth sample. Source contributions and profiles are solved in the PMF model by minimizing the objective function Q as in Eq. (2):
where xij, gik, and fkj are the same as in Eq. (1). uij is the uncertainty in xij, and the calculation method for the uncertainty is shown in Text S2. More details have been previously documented (Sofowote et al., 2011; Paatero et al., 2014).
Before the source apportionment, principal component analysis (PCA) was applied to pre-estimate the minimum number of emission sources in this study because PCA was able to explain the overall variability with fewer variables with a minimum loss of information (Liu et al., 2021). SPSS Statistics 25.0 was used to perform the PCA analysis in this study.
2.5 Health risk assessment
The total toxicity equivalent (TEQ, ng m−3) of the 15 PAHs with benzo[a]pyrene (BaP) used as the reference is calculated as in Eq. (3):
where Ci is the concentration of the ith PAH compound (ng m−3) and TEFi is the cancer potency of the ith PAH compound (dimensionless), as shown in Table S2.
In this study, ILCR refers to the cancer risk in a population due to exposure to a specific carcinogen (Zhuo et al., 2017). Its calculation formula is given by Eq. (4):
In the above, URBaP represents the cancer risk when the concentration of BaP is 1 ng m−3. According to the regulations of the World Health Organization (WHO), URBaP can be 8.7 × 10⁻⁵ per ng m−3. That is, for a life span of 70 years, a lifetime of exposure to a BaP concentration of 1 ng m−3 results in a risk of cancer by inhalation of 8.7 × 10⁻⁵ (Luo et al., 2021).
2.6 Medical costs assessment
In this study, the medical costs were assessed by comparing the total direct medical costs for treating lung cancer caused by respiratory exposure to PAHs in the atmosphere under the assumption that there is no air pollution control with the corresponding costs when air pollution control has been implemented. The total direct medical costs for treating lung cancer (Ct) are calculated as in Eq. (5):
where Ct is the total direct medical costs of lung cancer induced by PAH exposure and Cpc is the per capita direct medical costs of lung cancer, for which USD 8700 in China in 2014 was used in this study (Shi et al., 2017). P is the annual population and Iadd is the additional incidence of lung cancer due to PAH inhalation exposure, which is calculated as in Eq. (6):
where I is the incidence of lung cancer. The estimated value of I at Tianjin in 2012 was 87.37 × 10⁻⁵ (Cao et al., 2016), which was used in this study. PAF is the population attributable fraction, defined as the decrease in the incidence or mortality of a disease when a certain risk factor is completely removed or reduced to another lower reference level (Menzler et al., 2008). The PAF can be calculated as in Eq. (7):
where rr is the relative risk; that is, the risk of exposure to a specific concentration relative to no exposure. URR is the unit relative risk, for which a reference value of 4.49 per 100 µg m−3 years of BaP exposure was adopted in this study (Zhang et al., 2009). This reference value is based on an epidemiological study of lung cancer conducted in Xuanwei, China (Menzler et al., 2008) (Gibbs, 1997). This study assumed that the mean life expectancy in China was 70 years and that the lifetime exposure was equivalent to 70 years.
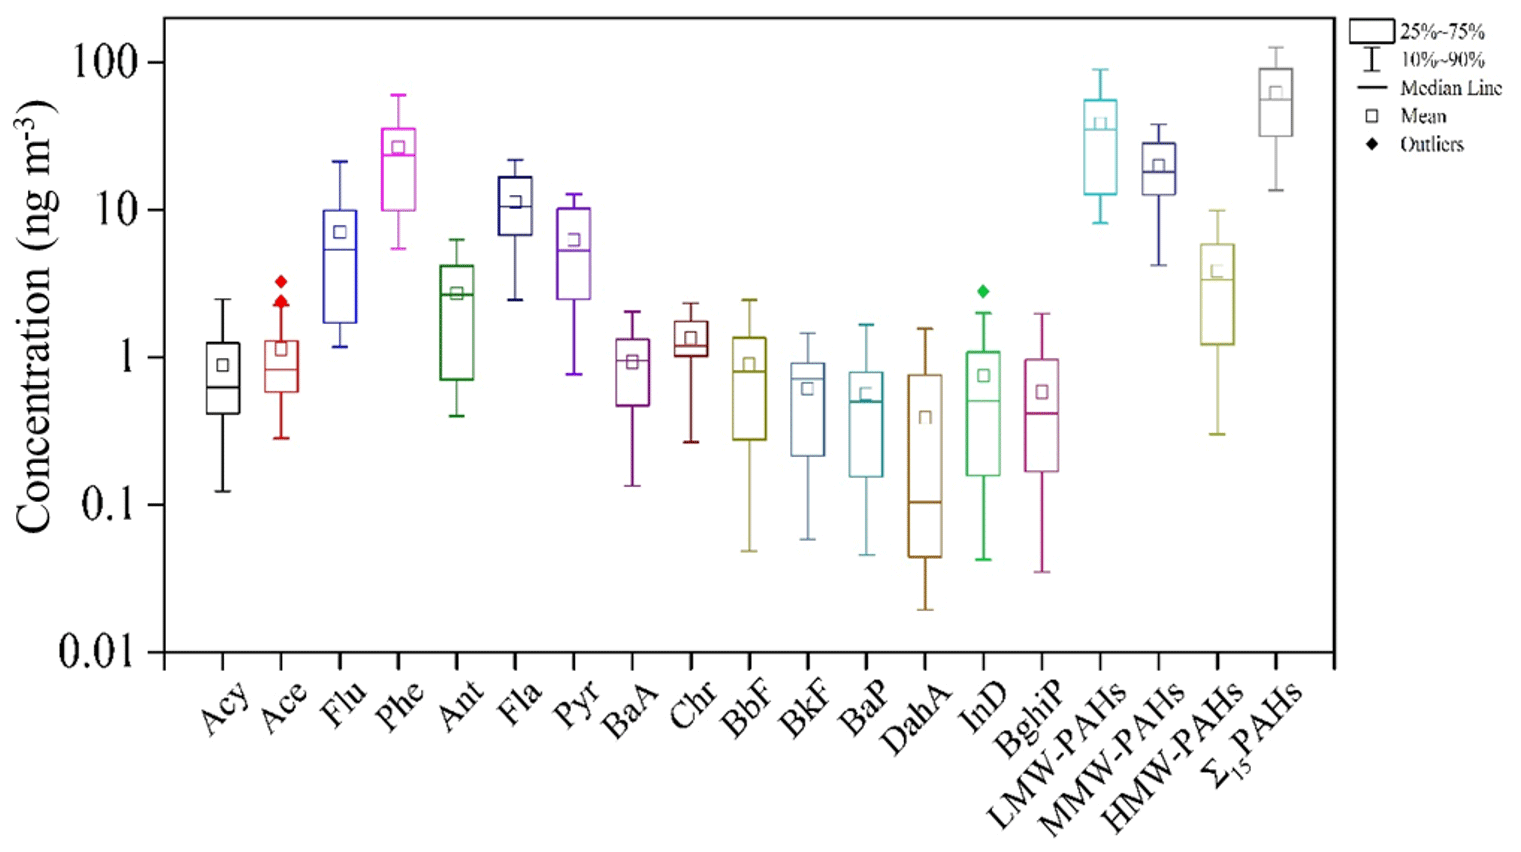
Figure 1Atmospheric concentrations of polycyclic aromatic hydrocarbons (PAHs) around the BS from June 2014 to May 2019. Acenaphthylene (Acy), Acenapthene (Ace), Fluorene (Flu), Phenanthrene (Phe), Anthracene (Ant), Fluoranthene (Fla), Pyrene (Pyr), Benzo[a]anthracene (BaA), Chrysene (Chr), Benzo[b]fluoranthene (BbF), Benzo[k]fluoranthene (BkF), Benzo[a]pyrene (BaP), Dibenzo[a,h]anthracene (DahA), Indeno[1,2,3-cd]pyrene (InD), Benzo[ghi] perylene (BghiP), low molecular weight PAHs (LMW-PAHs), middle molecular weight PAHs (MMW-PAHs), high molecular weight PAHs (HMW-PAHs), and total concentrations of 15 PAH congeners.
3.1 Concentration and composition of PAHs
3.1.1 General information on PAHs
Figure 1 summarizes the annual daily average concentrations of the 15 PAHs in the atmosphere at the 12 sampling sites around the BS from June 2014 to May 2019. The annual daily average concentration of Σ15PAHs around the BS was 56.78 ± 4.75 ng m−3, with a range of 51.39–63.55 ng m−3. The highest concentration was presented by the low molecular weight PAHs (LMW-PAHs, three rings), followed by the middle molecular weight PAHs (MMW-PAHs, four rings) and high molecular weight PAHs (HMW-PAHs, five or six rings), which accounted for 58.7 %, 34.8 %, and 6.7 % of the total concentration, respectively. In this study, the atmospheric PAH concentration was dominated by the LMW-PAHs, of which Phe, Fla, and Flu were the main compounds, accounting for 37.7 %, 19.8 %, and 12.6 % of the total. The atmospheric PAH concentrations around the BS were higher than those around the Yangtze River Delta and the Pearl River Delta, such as those in Ningbo (45 ng m−3) (Tong et al., 2019) and Guangzhou (9.72 ng m−3) (Yu et al., 2016). The atmospheric concentrations of PAHs around the BS were also much higher than those in the atmosphere above the Great Lakes (1.3 ng m−3) (Li et al., 2021) and southern European cities (3.1 ng m−3) (Alves et al., 2017). Overall, it was found that the pollution from atmospheric PAHs around the BS was still worrying.
3.1.2 Temporal variations of PAHs
To obtain a better understanding of the characteristics of the variation in PAHs in the atmosphere, the period from the summer of the previous year to the spring of the next year was taken as a statistical cycle. The concentrations of Σ15PAHs around the BS during five annual cycles were 63.55 ± 58.43 ng m−3 (2014–2015), 55.50 ± 37.94 ng m−3 (2015–2016), 60.90 ± 31.13 ng m−3, (2016–2017), 51.39 ± 29.41 ng m−3 (2017–2018), and 52.50 ± 40.08 ng m−3 (2018–2019) (Table S3). Overall, the concentrations of Σ15PAHs from June 2014 to May 2019 showed a slow downward trend, with a decrease of 17.5 %. The decrease in atmospheric PAH concentrations was mainly due to the decline in the HMW-PAH concentrations. The HMW-PAH composition ratio decreased from 11.3 % (2014–2015) to 3.4 % (2018–2019), while that of the MMW-PAHs rose from 35.5 % (2014–2015) to 41.2 % (2018–2019). The LMW-PAH composition ratio was stable, varying from 53.4 % (2014–2015) to 55.4 % (2018–2019). One factor that affects the concentrations of PAHs in the atmosphere after they have been discharged from the emission source is the meteorological conditions (Fan et al., 2021); the other is the amount of direct emission from the emission source (Ma et al., 2018). PAHs with different ring numbers arise from different sources (Li et al., 2021). LMW-PAHs are mainly produced in the combustion of non-petroleum sources, while HMW-PAHs are mainly from the products of processes based on the high-temperature combustion of fossil fuels, including some activities involving pyrolysis, such as vehicle emissions, industrial production, and other high-temperature source emissions (Zhang et al., 2018; Xing et al., 2020). The significant decrease in HMW-PAH concentrations in the BS region during the 5-year observation period might be related to the decrease in high-temperature emission sources. Due to the high toxicity of HMW-PAHs (Biache et al., 2014; Ma et al., 2020), the decrease in the concentration of HMW-PAHs might indicate a decrease in the environmental toxicity of PAHs.
The seasonal distribution of PAH concentrations in the atmosphere of the BS region showed that concentrations were high in the cold season and low in the warm season. The concentrations of Σ15PAHs in the four seasons were as follows: winter (104.32 ± 9.50 ng m−3) > autumn (53.94 ± 9.10 ng m−3) > spring (43.89 ± 19.54 ng m−3) > summer (26.28 ± 13.42 ng m−3) (Table S5). The concentration of PAHs in winter was about 4 times higher than that in summer, and the maximum and minimum of the annual daily average concentration at the 12 sampling points mostly occurred in winter and summer. In addition, there were significant differences between the total PAH concentration and the concentrations of PAHs with different numbers of rings (p < 0.05; the difference level is shown in Table S6). The seasonal characteristics of PAH concentrations seen in this study were consistent with results reported for North China (Ma et al., 2018; Zhang et al., 2019). Interestingly, it was found that the differences between the PAH concentrations in the four seasons were mainly due to the LMW-PAHs. This indicated that there were nonnegligible pollution sources for LMW-PAHs, especially in winter in the BS region. Thus, identifying the source of LMW-PAHs was crucial for improving the environmental quality of the BS. Studies have shown that coal-burning emissions and biomass burning are the main sources of atmospheric PAHs in this region (Liu et al., 2019). In terms of the spatial distribution of the per capita fuel consumption, the consumption in North and West China is significantly higher than that in Southeast China, principally because of the difference in heating fuel consumption in winter. Therefore, there were significant seasonal variations of per capita fuel consumption, with peak consumption in the winter months being about twice as high as that in the summer months (Zhu et al., 2013). In addition, due to the migration characteristics of atmospheric PAHs, meteorological conditions such as the temperature and wind direction would also affect the observed concentrations in different seasons (Tan et al., 2006). A low temperature and inversion layer in winter are not conducive to atmospheric diffusion, resulting in a relatively high concentration of PAHs in the atmosphere near the surface (Wang et al., 2018).
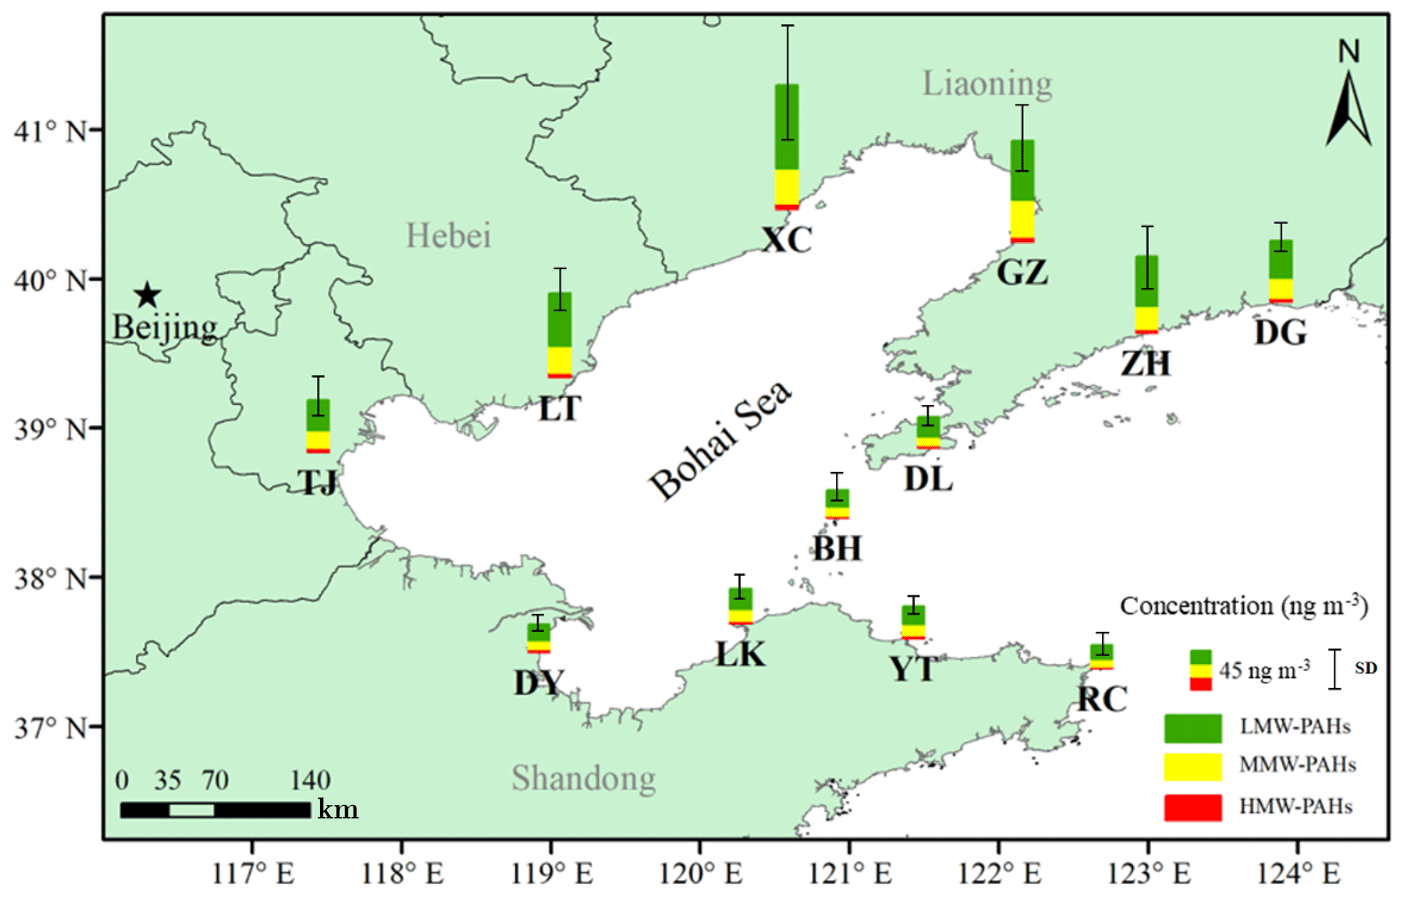
Figure 2The mean concentration distribution of Σ15PAHs at 12 sites around the BS from June 2014 to May 2019.
3.1.3 Spatial characteristics of PAHs
Figure 2 and Table S7 display the distribution of the 5-year mean concentration of Σ15PAHs from June 2014 to May 2019 at the 12 sampling sites around the BS. The concentrations of atmospheric Σ15PAHs ranged from 25.92 ± 6.41 ng m−3 (RC) to 103.71 ± 39.11 ng m−3 (XC). The concentrations of PAHs on the north coast of the BS were twice higher than those on the south coast. PAHs are a class of pollutants that can undergo long-range transport in the atmosphere (Wang et al., 2018), and their spread is greatly affected by local meteorological conditions (Ding and Chan, 2005). The climate in North China and the adjacent oceanic area is greatly affected by the East Asian monsoon, and the characteristic weather phenomenon in the winter monsoon is the strong north and northwest winds (Tian et al., 2009). Due to the additional emissions from fuel consumption for domestic heating in the source areas, the atmospheric PAH concentrations significantly increased (Feng et al., 2007; Gao et al., 2016). Combined with the backward trajectory shown in Fig. S4, this suggests that the elevated PAH concentrations in winter in the north of the BS region were mainly attributable to the outflow of PAHs from the north and northwest source regions, carried by the winter monsoon winds. According to the distribution of atmospheric PAHs in some representative parts of northern China, it was found that the Beijing–Tianjin–Hebei region was greatly affected by nearby sources, while Shandong Province and other places were mainly affected by regional emissions (Zhang et al., 2016). However, the composition of PAHs in the north showed consistency with those in the south (there were no significant differences; Table S8). Overall, the compositions of PAHs at the 12 stations showed that the highest contribution came from LMW-PAHs (north: 60.0 %, south: 57.4 %), followed by MMW-PAHs (north: 32.7 %, south: 32.4 %), while HMW-PAHs provided the lowest (north: 7.3 %, south: 10.8 %). The above results indicate that the emission sources of PAHs in the atmosphere were the same all around the BS region.
However, for TJ, the study found that there was a more significant change in the concentration of atmospheric PAHs over time, as they decreased from 68.61 ng m−3 (2014–2015) to 33.14 ng m−3 (2018–2019). The reason for this was mainly that TJ is located in the Beijing–Tianjin–Hebei region, which has the strictest air pollution prevention and control measures as it is a key area in China's 12th Five Year Plan. To explore the potential differences between the source emissions at the 12 sampling points, Pearson correlation analysis was used to analyze the seasonal distribution of PAH concentrations, as shown in Table S9. Among the five stations LK, DY, TJ, LT, and XC in the western BS region centered on TJ, the correlation coefficients from comparisons of atmospheric PAH concentrations among the four stations except for TJ (0.72–0.89) were greater than the corresponding correlation coefficients between each site and TJ (0.50–0.68). The covariability in PAH concentrations between TJ and the other four stations was weaker. This indicated that there were certain differences in PAH emission sources between TJ and adjacent areas.
3.2 Source apportionment of PAHs
To further probe the causes of the variations of the concentration and composition of PAHs, the source apportionment of PAHs in the atmosphere around the BS region and TJ from 2014–2015 to 2018–2019 was investigated via PCA and PMF. The PCA analysis results showed that when four factors (eigenvalues > 1) were extracted from the data set, the total cumulative load accounted for more than 85 % of the variance (Table S10). This indicated that the atmospheric PAHs were best explained by at least four types of emission sources. For the PMF model, the key process was to determine the correct number of factors, and this study was based on the results of the PCA. Based on a random seed, 4–7 factors were used with the PMF model for source analytical simulation. The source analytical simulation using five factors yielded the most stable results and the most easily interpreted factors. The solution produced Q values (both robust and true) that were close to the theoretical Q values, which indicated that the PAH data set in the modeling input provided appropriate uncertainty (Sun et al., 2021). The data set used for PMF analysis included the concentrations of 228 samples of 15 PAHs and their uncertainties. The diagnostic regression R2 value for the overall concentrations of the 15 PAH components was 0.986. The concentrations of the 15 PAHs predicted via the PMF model were almost the same as the actual concentrations of the 15 PAHs around the BS (Figs. S5 and S6 and Sect. S2). This meant that the model results were good and could be used as the basis for judging the sources of the target species, so these five factors explain the sources of the PAHs well. The sources identified by PCA and PMF were coal combustion, biomass burning, industrial processes, gasoline emissions, and diesel emissions. Detailed information on source identification is shown in Sect. S3.
Fossil fuel combustion emissions were the reason for the significant increase in atmospheric pollutants, and they were also responsible for the elevated PM2.5 levels around the BS region (Yang et al., 2017). To explore the relationship between Σ15PAHs and PM2.5 concentrations, PM2.5 data available online for eight cities that corresponded to sampling sites (DG, DL, DY, GZ, LT, TJ, XC, and YT) (Air quality historical data query, 2014–2019) were collected, and the concentrations were averaged according to the sampling periods in the study (Table S12). The Pearson correlation coefficients of the concentrations of atmospheric PAHs and PM2.5 ranged from 0.485 to 0.868, and the significance levels were greater than 95 %, as listed in Table S13. During the 5-year observation period, the PM2.5 concentration in the BS region decreased by 29.6 % (from 57 to 40 µg m−3), and that at TJ showed an even greater decrease of 33.8 % (from 78 to 51 µg m−3). From 2013, PM2.5 has been strictly controlled year by year by the government, and the significant correlation indicates that this control affected the PAH concentrations in this region. To explore the factors that potentially influence the difference in atmospheric PAH composition between the BS area and TJ, the average annual contributions of various PAH emission sources from 2014–2015 to 2018–2019 were compared, as shown in Fig. 3. During the sampling period of the BS region, the main source of atmospheric PAH emissions in 2014–2015 was coal combustion (44.7 %) followed by biomass burning (24.4 %), but these switched to coal combustion (51.8 %) and industrial processes (24.4 %) in 2018–2019. For TJ, coal combustion was also the main source of atmospheric PAHs emissions (52.5 %) in 2014–2015, followed by biomass burning (20.1 %), which switched to coal combustion (40.0 %), industrial processes (17.8 %), and gasoline emissions (18.3 %) in 2018–2019. The contribution of coal combustion as a source of atmospheric PAHs around the BS increased by 7.2 %, while the corresponding contribution in TJ fell by 12.6 %. The absolute contribution (the total concentration of PAHs multiplied by the percentage contribution of the source) decreased, which indicated that the reduction in the coal contribution as a source significantly improved the atmospheric PAH pollution.
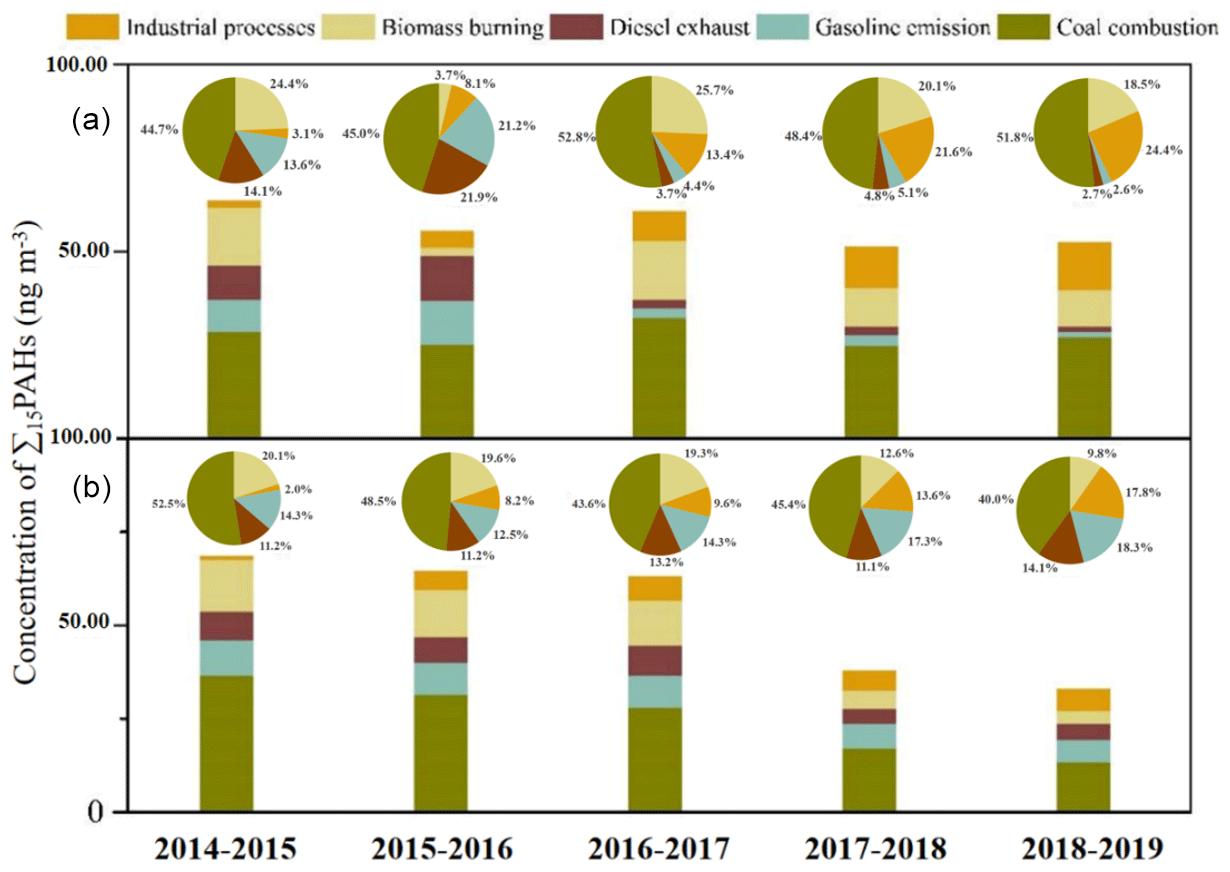
Figure 3Concentrations of Σ15PAHs and contributions of Σ15PAHs sources around the BS (a) and TJ (b) from 2014–2015 to 2018–2019.
The main source of atmospheric PAHs around the BS was coal combustion (Liu et al., 2019; Qu et al., 2022). However, TJ, one of the key areas for air pollution control in China, took stricter measures to control emissions from coal combustion (Wu et al., 2015). For instance, the city took the lead in switching domestic fuel from coal to natural gas and electricity in 2017 to reduce emissions of air pollutants (Zhang et al., 2021). These targeted measures led to more forcefully controlled coal-combustion emissions of PAHs in TJ than in the other places around the BS region (Guo et al., 2018). Vehicle emissions (from gasoline and diesel exhausts) of atmospheric PAHs experienced a sharp drop of 22.4 % in the BS area, while those in TJ rose by 6.9 %. The same trend for vehicle emissions was found in studies of Beijing and Tianjin (Zhang et al., 2016; Chao et al., 2019). The decrease was mainly due to the elimination and scrapping of substandard vehicles by the Chinese government in 2015. Based on the China Vehicle Environmental Management Annual Report, car ownership around the BS increased by about 17.5 million but emissions of hydrocarbons, including PAHs, reduced by 95 000 t from 2014 to 2018 (Fig. S8). The source apportionment showed that the contribution of vehicle emissions to PAHs underwent a sharp decline from the spring of 2016 (Fig. S9), with a decrease of 38 % (19 % for gasoline and 19 % for diesel) around the BS (Huang et al., 2017). Although the contribution of vehicle emissions increased for TJ, the concentration of PAHs decreased. This indicates that these measures also controlled vehicle emissions and kept emissions of PAHs at a low level. Therefore, targeted control measures can effectively control PM2.5 and PAH pollution in the atmosphere in the BS region and TJ. Moreover, PAHs are a kind of organic compound produced along with black carbon (BC), and, to some extent, the molecular characteristics of PAHs have also provided the basic data needed to analyze the sources of BC in the atmosphere of the BS region (Y. Fang et al., 2016). At the same time, the results of the PAH source analysis in this study revealed that the composition and source of atmospheric BC in the BS region also changed from 2014 to 2019. This problem needs our attention and confirmation.
Figure 4 shows the seasonal distribution of five sources of atmospheric PAHs in the BS region. Generally, the seasonal distribution of the five sources of atmospheric PAHs in TJ was consistent with that in the BS region, so they are not separately discussed here. The relevant information for TJ is shown in Fig. S10. Coal combustion was the main emission source across the four seasons, followed by biomass burning, while the contributions of the other sources (industrial processes, gasoline emission, and diesel emission) were similar. The contribution of coal combustion to atmospheric PAHs in the BS region was the highest in winter, followed by spring, while its lowest contribution occurred in summer. This was consistent with the seasonal distribution of the concentration of PAHs in the atmosphere in the BS region. Based on the seasonal distribution of concentration, we can conclude that the increased concentrations of atmospheric PAHs in winter were mainly caused by coal combustion. This might be due to people in northern China relying on coal combustion for heating in cold winters. The contribution from biomass combustion was higher in summer and autumn, which was related to straw burning after the harvest. Given all this, the seasonal distribution of PAH sources indicated that the pollution from atmospheric PAHs was mainly influenced by human activities.
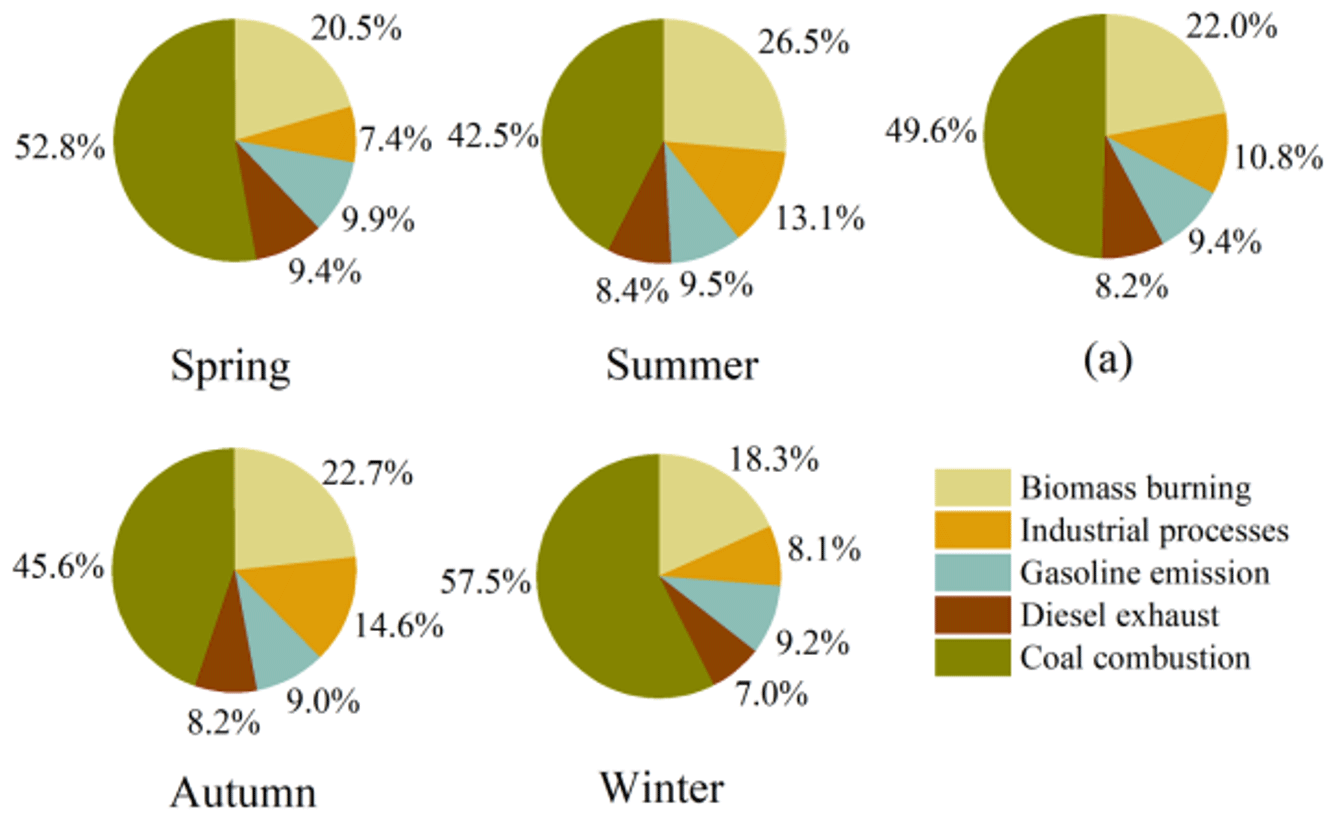
Figure 4The seasonal and average contributions of five sources of Σ15PAHs, as derived from PMF; (a) the 5-year-average contributions of the five sources.
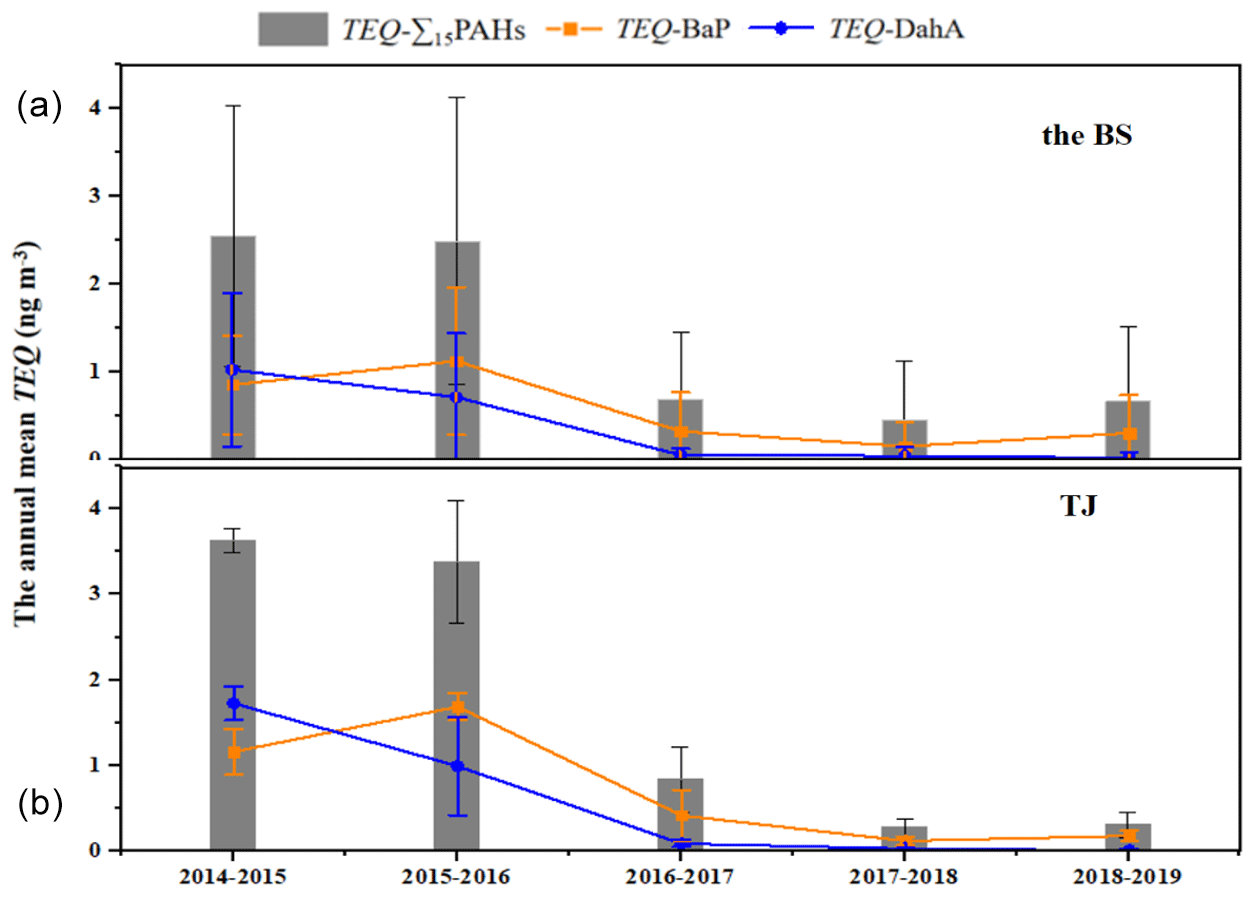
Figure 5The annual mean TEQ values of the 15 PAHs, BaP, Dibenzo[a,h]Anthracene (DahA) and in the atmosphere at the BS (a) and in TJ (b) from June 2014 to May 2019.
3.3 Health risk due to exposure to PAHs
On the basis of Eq. (3), the annual mean TEQ value around the BS region was 1.37 ± 1.05 ng m−3 from June 2014 to May 2019, which is below the national standard (10 ng m−3) but slightly higher than the WHO standard (1 ng m−3). The HMW-PAHs contributed the most (76.4 %) to the total TEQ. However, the concentration of HMW-PAHs in the atmosphere accounted for 6.5 % of the total PAH concentration. The two major TEQ contributors were BaP (38.2 % ± 8.0 %) and DahA (16.6 % ± 9.0 %). For TJ, the annual mean TEQ value was 1.69 ± 1.50 ng m−3, which was slightly higher than that in the BS region. This indicates that a higher health risk was caused by PAH exposure in TJ than around the BS. The HMW-PAHs contributed most (90.9 %) of the total TEQ. However, the concentration of HMW-PAHs in the atmosphere accounted for 8 % of the total PAH concentration. Among the HMW-PAHs, the two major contributors were BaP (47.2 % ± 9.2 %) and DahA (19.7 % ± 16.2 %).
Information on the TEQ in the BS region and in TJ from June 2014 to May 2019 is shown in Fig. 5. The average value of TEQ in the BS region in each of the five annual cycles was 2.55 ± 1.49, 2.49 ± 1.63, 0.69 ± 0.76, 0.47 ± 0.66, and 0.67 ± 0.84 ng m−3, respectively. The value of TEQ in the BS region showed a downward trend year by year. The environmental health risk from PAHs in the fifth year was decreased by 3 times compared to the first year. It was found that the decrease in the HMW-PAH concentration was the main reason for the decrease in the toxicity of the PAHs. For example, the concentration of BaP in the atmosphere in the BS region decreased by 79.1 % in 5 years, and the concentration of DahA, a species with a carcinogenic toxicity equivalent to that of BaP, decreased by 96.1 %. In TJ, the average value of TEQ in each of the five annual cycles was 3.63 ± 0.14, 3.38 ± 0.72, 0.84 ± 0.38, 0.28 ± 0.10, and 0.31 ± 0.15 ng m−3, respectively. The TEQ value of the PAHs in the atmosphere decreased by 91.5 % in TJ during the 5 years. In TJ, BaP and DahA, the major factors contributing to the TEQ in the atmosphere, also showed more significant declines than they did around the BS. To sum up, the results showed that pollution control not only reduced the total concentration of PAHs in the atmosphere in the BS region, but it also affected the composition of the PAHs. It also mainly affected the concentration of HMW-PAH compounds, meaning that the total toxic equivalent of PAHs in the atmosphere in the BS region was remarkably reduced.
Simultaneously, the incremental lifetime cancer risk (ILCR) was used to assess the potential carcinogenic risk from PAHs in the atmosphere in the BS region. According to the USEPA, an ILCR value of less than 1 × 10⁻⁶ is an acceptable risk level. When the ILCR value is equal to or higher than 1 × 10⁻⁶ but less than 1 × 10⁻⁴, there is a serious risk of cancer, and the health issues should be taken seriously. When the ILCR value is equal to or greater than 1 × 10⁻⁴, it is considered life-threatening to humans. The specific calculation is shown in Eq. (4). It was found that the range of ILCR values for the atmospheric PAHs in the BS region across the 5 years was 4.1 × 10⁻⁵ to 2.2 × 10⁻⁴, with an average value of 1.2 × 10⁻⁴, which means that the risk of cancer in this region was at a serious level and more attention should be paid to the consequent health problems. Similarly to the TEQ, the ILCR values were dominated by the HMW-PAHs. The ILCR caused by PAHs is listed in Table S14. The ILCR in the BS region decreased significantly by 74.1 % from 2.2 × 10⁻⁴ in the first year to 5.7 × 10⁻⁵ in the fifth year. Compared with the BS region, the ILCR in TJ decreased more significantly, from 3.2 × 10⁻⁴ to 2.7 × 10⁻⁵ (i.e., by 91.6 %). As shown in Table S15, the study found that the concentration variations of the highly toxic BaP and DahA were basically synchronized with the changes in ILCR, which implied that the decrease in the concentrations of both was the main reason for the cancer risk reduction. The significant reduction in cancer risk in the BS region indicated that the emission of highly toxic HMW-PAHs in the atmosphere was effectively controlled, which also implied that the prevention and control of air pollution had effectively reduced the health risk. In particular, the reducing effect on the PAH exposure risk was more obvious in TJ, where the air pollution control was strict.
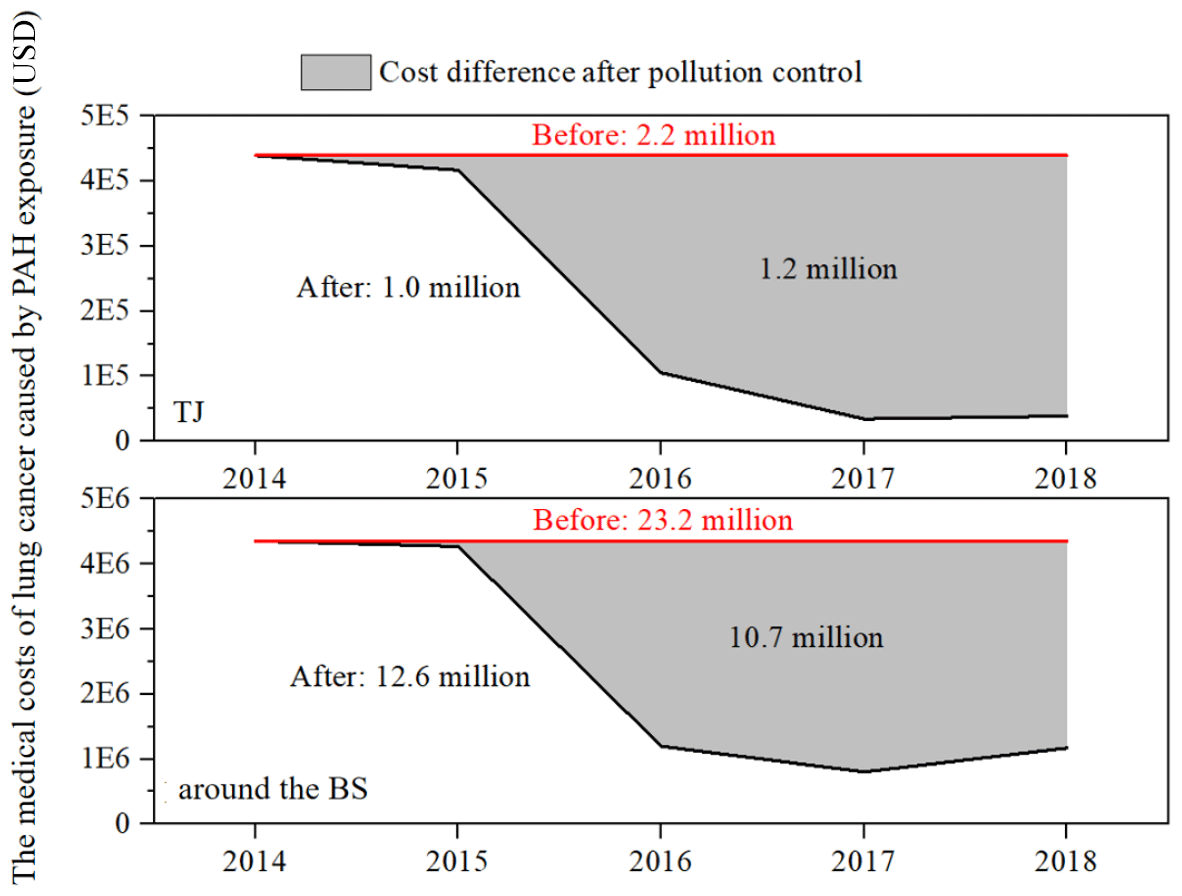
Figure 6The medical costs of lung cancer caused by PAH exposure in TJ and around the BS from 2014 to 2018, before and after air pollution was controlled.
3.4 Direct medical costs of lung cancer caused by exposure to PAHs
This reduction in PAH-related health risk would lead to a reduction in the number of people who develop cancer, thus saving on the costs of cancer treatment. In this study, the direct medical costs of lung cancer caused by respiratory exposure to PAHs were estimated based on the additional incidence of lung cancer caused by PAH exposure, the population in the study area, and the direct medical costs per capita of lung cancer patients. The specific calculation is shown in Eq. (5). In addition to PAH exposure, there are many environmental risk factors that could induce lung cancer. To derive the lung cancer burden caused by respiratory exposure to atmospheric PAHs from the incidence of lung cancer, the percentage of population risk attribution (PAF) was performed in this study. The details are shown in Eqs. (6) and (7). Here, PAF represents the percentage reduction in lung cancer incidence that would occur if PAHs, an environmental factor, were to be completely removed or their concentration were to be reduced. According to the above introduction to the PAF and analysis of TEQ, the directly calculated PAF around the BS during the 5 years ranged from 0.5 ‰ to 2.7 ‰, with an average value of 1.4 ‰. The 5-year PAF in TJ ranged from 0.3 ‰ to 3.8 ‰, with an average value of 1.7 ‰. Remarkably, the PAF values around the BS region and in TJ decreased significantly during the 5 years, from 3.8 ‰ and 2.7 ‰ in the first year to 0.3 ‰ and 0.7 ‰ in the fifth year, respectively. The additional lung cancer incidence (Iadd) due to respiratory exposure to PAHs was calculated using the product of lung cancer incidence and the PAF. Previous studies reported that the incidence of lung cancer in TJ in 2012 was 87.37 × 10⁻⁵ (Cao et al., 2016). In this study, 87.37 × 10⁻⁵ was used as the reference value of lung cancer incidence. The average Iadd caused by respiratory exposure to PAHs around the BS region and in TJ was 1.26 × 10⁻⁶ and 1.55 × 10⁻⁶, respectively. During the 5-year observational period, Iadd around the BS region and in TJ decreased from 2.34 × 10⁻⁶ and 3.33 × 10⁻⁶ in the first year to 6.15 × 10⁻⁷ and 2.87 × 10⁻⁷ in the fifth year, respectively. The population numbers in the study area were all sourced from public data in the statistical yearbook. The estimated results for the BS region and TJ are shown in Tables S16 and S17, respectively. It was reported that the direct cost of an average case of lung cancer in China in 2014 was USD 9042.79 (Shi et al., 2017; Huang et al., 2016). Since no reference data were available for the other years, we took the direct cost per case of lung cancer patients in 2014 as the baseline in this study, and the estimate assumed the same direct medical costs per capita for lung cancer across the 5 years.
Figure 6 shows the comparative results for the direct medical costs of lung cancer in the BS region and in TJ from 2014 to 2018, before and after pollution control. During the 5 years, under the implementation of air pollution control, the total direct medical costs of lung cancer caused by respiratory exposure to PAHs in the Bohai Rim region were USD 12.6 million. Assuming that no air pollution control was implemented, the total direct medical costs of lung cancer caused by PAH exposure did not change in the 5 years, and the total direct medical costs were USD 23.2 million. The effect of the actual implementation of air pollution control on the total direct medical costs of lung cancer was to save USD 10.7 million. In TJ, the total direct medical costs of lung cancer induced by respiratory exposure to PAHs under actual air pollution control were USD 1.0 million. Under the assumption that no air pollution control was implemented, the total direct medical costs of lung cancer caused by PAH exposure were USD 2.2 million, implying a saving of about USD 1.2 million in TJ. Compared to the costs incurred without air pollution control, the total direct medical costs of lung cancer caused by PAH exposure decreased by 46.1 % around the BS region and by an even greater 54.5 % in TJ. This illustrates that the implementation of air pollution control not only reduced the risk of lung cancer caused by PAH exposure around the BS region, but it also created a significant health benefit in the direct medical costs of lung cancer, especially in tightly controlled areas such as TJ. Therefore, the above results show that more precise pollution prevention and control could better reduce the emissions of pollutants and consequently reduce the health risk from human exposure.
Atmospheric PAH observations were conducted at 12 sites around the BS across 5 years from June 2014 to May 2019. The 5-year atmospheric concentration of Σ15PAHs was 56.78 ± 4.75 ng m−3 and was characterized by a dominance of LMW-PAHs (58.7 ± 7.8 %). The maximum annual concentration and seasonal concentrations occurred in the first year and every winter, respectively. The concentrations of ∑15 PAHs in the atmosphere around the BS reduced significantly during the sampling period, especially at the sampling site in TJ. The contributions of coal combustion and vehicle emissions to the PAHs in the atmosphere around the BS during the sampling period showed an increase and a decrease, respectively. However, the variations of coal combustion and vehicle emissions as source contributions in TJ showed just the opposite behavior. From 2014 to 2018, the additional lung cancer incidence caused by PAH exposure around the BS dropped by 74.1 %, and a higher drop of 91.6 % occurred in TJ. From a statistical standpoint, the drop in incidence saved about USD 10.7 million from the total direct medical costs of lung cancer caused by PAH exposure around the BS. Compared to the costs without air pollution control, the total direct medical costs of lung cancer caused by PAH exposure decreased by 46.1 % around the BS region and by an even greater 54.5 % in TJ. These results further certify that pollution reduction is beneficial to human health. In the fight against air pollution, more precise pollution prevention and control strategies are needed.
Corresponding data for the samples can be accessed on request from the corresponding author (Chongguo Tian, cgtian@yic.ac.cn).
The supplement related to this article is available online at: https://doi.org/10.5194/acp-24-1509-2024-supplement.
CT and ZZ designed the research; WM, RS, XW, ZZ, ZS, and CT conducted the sample collection; WM, RS, and XW performed the chemical analyses; WM, RS, XW, and CT analyzed the data, carried out the simulations, and wrote the original article; ZS, SZ, JT, SC, JL, and GZ helped with article submissions. All authors have given their approval to the final version of the manuscript.
The contact author has declared that none of the authors has any competing interests.
Publisher's note: Copernicus Publications remains neutral with regard to jurisdictional claims made in the text, published maps, institutional affiliations, or any other geographical representation in this paper. While Copernicus Publications makes every effort to include appropriate place names, the final responsibility lies with the authors.
This study was supported by the National Natural Science Foundation of China – Shandong Joint Fund (U1906215) and the National Natural Science Foundation of China (nos. 41977190 and 42177089).
This paper was edited by Ralf Ebinghaus and reviewed by two anonymous referees.
Agudelo-Castañeda, D. M., Teixeira, E. C., Schneider, I. L., Lara, S. R., and Silva, L. F. O.: Exposure to polycyclic aromatic hydrocarbons in atmospheric PM1.0 of urban environments: Carcinogenic and mutagenic respiratory health risk by age groups, Environ. Pollut., 224, 158–170, https://doi.org/10.1016/j.envpol.2017.01.075, 2017.
Air quality historical data query: Air quality index monthly statistical historical data, https://www.aqistudy.cn/historydata/ (last access: 31 August 2023), 2014–2019.
Alves, C. A., Vicente, A. M., Custodio, D., Cerqueira, M., Nunes, T., Pio, C., Lucarelli, F., Calzolai, G., Nava, S., Diapouli, E., Eleftheriadis, K., Querol, X., and Musa Bandowe, B. A.: Polycyclic aromatic hydrocarbons and their derivatives (nitro-PAHs, oxygenated PAHs, and azaarenes) in PM2.5 from Southern European cities, Sci. Total Environ., 595, 494–504, https://doi.org/10.1016/j.scitotenv.2017.03.256, 2017.
Biache, C., Mansuy-Huault, L., and Faure, P.: Impact of oxidation and biodegradation on the most commonly used polycyclic aromatic hydrocarbon (PAH) diagnostic ratios: Implications for the source identifications, J. Hazard. Mater., 267, 31–39, https://doi.org/10.1016/j.jhazmat.2013.12.036, 2014.
Bulletin of the State of China's ecological Environment: Environmental quality, http://www.mee.gov.cn/hjzl/sthjzk/zghjzkgb/ (last access: 31 August 2023), 2021.
Cao, M., Wang, M., and Song, F.: Secular trend of lung cancer incidence in Hexi District, Tianjin, 1992–2012, Tumor, 36, 1330–1334, 2016.
Chao, S. H., Liu, J. W., Chen, Y. J., Cao, H. B., and Zhang, A. C.: Implications of seasonal control of PM2.5-bound PAHs: An integrated approach for source apportionment, source region identification and health risk assessment, Environ. Pollut., 247, 685–695, https://doi.org/10.1016/j.envpol.2018.12.074, 2019.
Chen, C., Fang, J. L., Shi, W. Y., Li, T. T., and Shi, X. M.: Clean air actions and health plans in China, Chinese Med. J.-Peking, 133, 1609–1611, https://doi.org/10.1097/cm9.0000000000000888, 2020.
Colvin, K. A., Lewis, C., and Galloway, T. S.: Current issues confounding the rapid toxicological assessment of oil spills, Chemosphere, 245, 125585, https://doi.org/10.1016/j.chemosphere.2019.125585, 2020.
Ding, Y. H. and Chan, J. C. L.: The East Asian summer monsoon: an overview, Meteorol. Atmos. Phys., 89, 117–142, https://doi.org/10.1007/s00703-005-0125-z, 2005.
Eng, A., Harner, T., and Pozo, K.: A prototype passive air sampler for measuring dry deposition of polycyclic aromatic hydrocarbons, Environ. Sci. Technol. Let., 1, 77–81, https://doi.org/10.1021/ez400044z, 2014.
Fan, L. P., Fu, S., Wang, X., Fu, Q. Y., Jia, H. H., Xu, H., Qin, G. M., Hu, X., and Cheng, J. P.: Spatiotemporal variations of ambient air pollutants and meteorological influences over typical urban agglomerations in China during the COVID-19 lockdown, J. Environ. Sci., 106, 26–38, https://doi.org/10.1016/j.jes.2021.01.006, 2021.
Fang, D., Wang, Q., Li, H., Yu, Y., Lu, Y., and Qian, X.: Mortality effects assessment of ambient PM2.5 pollution in the 74 leading cities of China, Sci. Total Environ., 569–570, 1545–1552, https://doi.org/10.1016/j.scitotenv.2016.06.248, 2016.
Fang, Y., Chen, Y., Tian, C., Lin, T., Hu, L., Li, J., and Zhang, G.: Application of PMF receptor model merging with PAHs signatures for source apportionment of black carbon in the continental shelf surface sediments of the Bohai and Yellow Seas, China, J. Geophys. Res.-Oceans., 121, 1346–1359, https://doi.org/10.1002/2015JC011214, 2016.
Feng, J., Guo, Z., Chan, C. K., and Fang, M.: Properties of organic matter in PM2.5 at Changdao Island, China – A rural site in the transport path of the Asian continental outflow, Atmos. Environ., 41, 1924–1935, https://doi.org/10.1016/j.atmosenv.2006.10.064, 2007.
Gao, Y., Guo, X., Ji, H., Li, C., Ding, H., Briki, M., Tang, L., and Zhang, Y.: Potential threat of heavy metals and PAHs in PM2.5 in different urban functional areas of Beijing, Atmos. Res., 178–179, 6–16, https://doi.org/10.1016/j.atmosres.2016.03.015, 2016.
Gibbs, G. W.: Estimating residential polycyclic aromatic hydrocarbon (PAH) related lung cancer risks using occupational data, Ann. Occup. Hyg., 41, 49–53, https://doi.org/10.1093/ANNHYG/41.INHALED_PARTICLES, 1997.
Gong, P., Wang, X. P., and Yao, T. D.: Ambient distribution of particulate- and gas-phase n-alkanes and polycyclic aromatic hydrocarbons in the Tibetan Plateau, Environ. Earth. Sci., 64, 1703–1711, https://doi.org/10.1007/s12665-011-0974-3, 2011.
Guo, X., Zhao, L., Chen, D., Jia, Y., Zhao, N., Liu, W., and Cheng, S.: Air quality improvement and health benefit of PM2.5 reduction from the coal cap policy in the Beijing–Tianjin–Hebei (BTH) region, China, Environ. Sci. Pollut. R., 25, 32709–32720, https://doi.org/10.1007/s11356-018-3014-y, 2018.
Han, M., Liu, S., Liu, M., Lu, M., Yan, W., He, Y., Dang, H., Dai, X., Zhang, Z., Du, X., and Meng, F.: Assessment of the effect of the reduction of the residential coal combustion on the atmospheric BaP pollution in Beijing–Tianjin–Hebei region, China Environmental Science, 38, 3262–3272, 2018.
Hong, W. J., Jia, H., Ma, W. L., Sinha, R. K., Moon, H. B., Nakata, H., Nguyen Hung, M., Chi, K. H., Li, W. L., Kannan, K., Sverko, E., and Li, Y. F.: Distribution, fate, inhalation exposure and lung cancer risk of atmospheric polycyclic aromatic hydrocarbons in some Asian countries, Environ. Sci. Technol., 50, 7163–7174, https://doi.org/10.1021/acs.est.6b01090, 2016.
Huang, C., Wang, Q., Wang, S., Ren, M., Ma, R., and He, Y.: Air pollution prevention and control policy in China, Adv. Exp. Med. Biol., 1017, 243–261, https://doi.org/10.1007/978-981-10-5657-4_11, 2017.
Huang, H. Y., Shi, J. F., Guo, L. W., Zhu, X. Y., Wang, L., Liao, X. Z., Liu, G. X., Bai, Y. N., Mao, A. Y., Ren, J. S., Sun, X. J., Zhang, K., He, J., and Dai, M.: Expenditure and financial burden for common cancers in China: a hospital-based multicentre cross-sectional study, Lancet, 388, 10–10, https://doi.org/10.1016/S0140-6736(16)31937-7, 2016.
Jaward, T. M., Zhang, G., Nam, J. J., Sweetman, A. J., Obbard, J. P., Kobara, Y., and Jones, K. C.: Passive air sampling of polychlorinated biphenyls, organochlorine compounds, and polybrominated diphenyl ethers across Asia, Environ. Sci. Technol., 39, 8638–8645, https://doi.org/10.1021/es051382h, 2005.
Křůmal, K. and Mikuška, P.: Mass concentrations and lung cancer risk assessment of PAHs bound to PM1 aerosol in six industrial, urban, and rural areas in the Czech Republic, Central Europe, Atmos. Pollut. Res., 11, 401–408, https://doi.org/10.1016/j.apr.2019.11.012, 2020.
Li, N., Zhang, X., Shi, M., and Hewings, G. J. D.: Does China's air pollution abatement policy matter? An assessment of the Beijing–Tianjin–Hebei region based on a multi-regional CGE model, Energ. Policy, 127, 213–227, https://doi.org/10.1016/j.enpol.2018.12.019, 2019.
Li, W., Park, R., Alexandrou, N., Dryfhout-Clark, H., Brice, K., and Hung, H.: Multi-year analyses reveal different trends, sources, and implications for source-related human health risks of atmospheric polycyclic aromatic hydrocarbons in the Canadian Great Lakes Basin, Environ. Sci. Technol., 55, 2254–2264, https://doi.org/10.1021/acs.est.0c07079, 2021.
Li, Z. Y., Wang, Y. T., Li, Z. X., Guo, S. T., and Hu, Y.: Levels and Sources of PM2.5-associated PAHs during and after the Wheat Harvest in a Central Rural Area of the Beijing–Tianjin–Hebei (BTH) Region, Aerosol. Air Qual. Res., 20, 1070–1082, https://doi.org/10.4209/aaqr.2020.03.0083, 2020.
Lian, L., Huang, T., Ling, Z., Li, S., Li, J., Jiang, W., Gao, H., Tao, S., Liu, J., Xie, Z., Mao, X., and Ma, J.: Interprovincial trade driven relocation of polycyclic aromatic hydrocarbons and lung cancer risk in China, J. Clean. Prod., 280, 124368, https://doi.org/10.1016/j.jclepro.2020.124368, 2021.
Liang, X., Tian, C., Zong, Z., Wang, X., Jiang, W., Chen, Y., Ma, J., Luo, Y., Li, J., and Zhang, G.: Flux and source-sink relationship of heavy metals and arsenic in the Bohai Sea, China, Environ. Pollut., 242, 1353–1361, https://doi.org/10.1016/j.envpol.2018.08.011, 2018.
Liao, C. M., Chio, C. P., Chen, W. Y., Ju, Y. R., Li, W. H., Cheng, Y. H., Liao, V. H. C., Chen, S. C., and Ling, M. P.: Lung cancer risk in relation to traffic-related nano/ultrafine particle-bound PAHs exposure: A preliminary probabilistic assessment, J. Hazard. Mater., 190, 150–158, https://doi.org/10.1016/j.jhazmat.2011.03.017, 2011.
Lin, Y., Ma, Y., Qiu, X., Li, R., Fang, Y., Wang, J., Zhu, Y., and Hu, D.: Sources, transformation, and health implications of PAHs and their nitrated, hydroxylated, and oxygenated derivatives in PM2.5 in Beijing, J. Geophys. Res., 120, 7219–7228, https://doi.org/10.1002/2015JD023628, 2015.
Liu, H., Li, B., Qi, H., Ma, L., Xu, J., Wang, M., Ma, W., and Tian, C.: Source apportionment and toxic potency of polycyclic aromatic hydrocarbons (PAHs) in the air of Harbin, a cold city in Northern China, Atmosphere-Basel, 12, 297, https://doi.org/10.3390/atmos12030297, 2021.
Liu, W. J., Xu, Y. S., Zhao, Y. Z., Liu, Q. Y., Yu, S. Y., Liu, Y., Wang, X., Liu, Y., Tao, S., and Liu, W. X.: Occurrence, source, and risk assessment of atmospheric parent polycyclic aromatic hydrocarbons in the coastal cities of the Bohai and Yellow Seas, China, Environ. Pollut., 254, 113046, https://doi.org/10.1016/j.envpol.2019.113046, 2019.
Luo, M., Ji, Y. Y., Ren, Y. Q., Gao, F. H., Zhang, H., Zhang, L. H., Yu, Y. Q., and Li, H.: Characteristics and health risk assessment of PM2.5-bound PAHs during heavy air pollution episodes in winter in urban area of Beijing, China, Atmosphere-Basel, 12, 323, https://doi.org/10.3390/atmos12030323, 2021.
Lv, M., Luan, X., Liao, C., Wang, D., Liu, D., Zhang, G., Jiang, G., and Chen, L.: Human impacts on polycyclic aromatic hydrocarbon distribution in Chinese intertidal zones, Nature Sustainability, 3, 878–884, https://doi.org/10.1038/s41893-020-0565-y, 2020.
Ma, W. L., Li, Y. F., Qi, H., Sun, D. Z., Liu, L. Y., and Wang, D. G.: Seasonal variations of sources of polycyclic aromatic hydrocarbons (PAHs) to a northeastern urban city, China, Chemosphere, 79, 441–447, https://doi.org/10.1016/j.chemosphere.2010.01.048, 2010.
Ma, W. L., Liu, L. Y., Jia, H. L., Yang, M., and Li, Y. F.: PAHs in Chinese atmosphere Part I: Concentration, source and temperature dependence, Atmos. Environ., 173, 330–337, https://doi.org/10.1016/j.atmosenv.2017.11.029, 2018.
Ma, W. L., Zhu, F. J., Liu, L. Y., Jia, H. L., Yang, M., and Li, Y. F.: PAHs in Chinese atmosphere Part II: Health risk assessment, Ecotox. Environ. Safe., 200, 110774, https://doi.org/10.1016/j.ecoenv.2020.110774, 2020.
Ma, Y. X., Xie, Z. Y., Yang, H. Z., Moller, A., Halsall, C., Cai, M. H., Sturm, R., and Ebinghaus, R.: Deposition of polycyclic aromatic hydrocarbons in the North Pacific and the Arctic, J. Geophys. Res.-Atmos., 118, 5822–5829, https://doi.org/10.1002/jgrd.50473, 2013.
Marvin, C. H., Tomy, G. T., Thomas, P. J., Holloway, A. C., Sandau, C. D., Idowu, I., and Xia, Z.: Considerations for prioritization of polycyclic aromatic compounds as environmental contaminants, Environ. Sci. Technol., 54, 14787–14789, https://doi.org/10.1021/acs.est.0c04892, 2020.
Menzler, S., Piller, G., Gruson, M., Rosario, A. S., Wichrnann, H. E., and Kreienbrock, L.: Population attributable fraction for lung cancer due to residential radon in Switzerland and Germany, Health Phys., 95, 179–189, https://doi.org/10.1097/01.Hp.0000309769.55126.03, 2008.
Moeckel, C., Harner, T., Nizzetto, L., Strandberg, B., Lindroth, A., and Jones, K. C.: Use of depuration compounds in passive air samplers: results from active sampling-supported field deployment, potential uses, and recommendations, Environ. Sci. Technol., 43, 3227–3232, https://doi.org/10.1021/es802897x, 2009.
Paatero, P., Eberly, S., Brown, S. G., and Norris, G. A.: Methods for estimating uncertainty in factor analytic solutions, Atmos. Meas. Tech., 7, 781–797, https://doi.org/10.5194/amt-7-781-2014, 2014.
Qu, L., Yang, L., Zhang, Y., Wang, X., Sun, R., Li, B., Lv, X., Chen, Y., Wang, Q., Tian, C., and Ji, L.: Source Apportionment and Toxic Potency of PM2.5-Bound Polycyclic Aromatic Hydrocarbons (PAHs) at an Island in the Middle of Bohai Sea, China, Atmosphere-Basel, 13, 699, https://doi.org/10.3390/atmos13050699, 2022.
Ramírez, N., Cuadras, A., Rovira, E., Marcé, R. M., and Borrull, F.: Risk Assessment Related to Atmospheric Polycyclic Aromatic Hydrocarbons in Gas and Particle Phases near Industrial Sites, Environ. Health Perspect., 119, 1110–1116, https://doi.org/10.1289/ehp.1002855, 2011.
Shi, C. L., Lou, P. A., Shi, J. F., Huang, H. Y., Li, J., Yue, Y. P., Wang, L., Dong, Z. M., Chen, P. P., Zhang, P., Zhao, C. Y., Li, F., Zhou, J. Y., and Dai, M.: Economic burden of lung cancer in mainland China,1996-2014: a systematic review, China Journal of Public Health, 33, 1767–1774, https://doi.org/10.11847/zgggws2017-33-12-25, 2017.
Sofowote, U. M., Hung, H., Rastogi, A. K., Westgate, J. N., Deluca, P. F., Su, Y. S., and McCarry, B. E.: Assessing the long-range transport of PAH to a sub-Arctic site using positive matrix factorization and potential source contribution function, Atmos. Environ., 45, 967–976, https://doi.org/10.1016/j.atmosenv.2010.11.005, 2011.
Sun, R., Wang, X., Tian, C., Zong, Z., Ma, W., Zhao, S., Wang, Y., Tang, J., Cui, S., Li, J., and Zhang, G.: Exploring source footprint of Organophosphate esters in the Bohai Sea, China: Insight from temporal and spatial variabilities in the atmosphere from June 2014 to May 2019, Environ. Int., 159, 107044, https://doi.org/10.1016/j.envint.2021.107044, 2022.
Sun, Z., Zong, Z., Tian, C., Li, J., Sun, R., Ma, W., Li, T., and Zhang, G.: Reapportioning the sources of secondary components of PM2.5: combined application of positive matrix factorization and isotopic evidence, Sci. Total Environ., 764, 142925, https://doi.org/10.1016/j.scitotenv.2020.142925, 2021.
Taghvaee, S., Sowlat, M. H., Hassanvand, M. S., Yunesian, M., Naddafi, K., and Sioutas, C.: Source-specific lung cancer risk assessment of ambient PM2.5-bound polycyclic aromatic hydrocarbons (PAHs) in central Tehran, Environ. Int., 120, 321–332, https://doi.org/10.1016/j.envint.2018.08.003, 2018.
Tan, J. H., Bi, X. H., Duan, J. C., Rahn, Kenneth A., Sheng, G. Y., and Fu, J. M.: Seasonal variation of particulate polycyclic aromatic hydrocarbons associated with PM10 in Guangzhou, China, Atmos. Res., 80, 250–262, https://doi.org/10.1016/j.atmosres.2005.09.004, 2006.
Tian, C., Ma, J., Liu, L., Jia, H., Xu, D., and Li, Y. F.: A modeling assessment of association between East Asian summer monsoon and fate/outflow of α-HCH in Northeast Asia, Atmos. Environ., 43, 3891–3901, https://doi.org/10.1016/j.atmosenv.2009.04.056, 2009.
Tong, L., Peng, C. H., Huang, Z. W., Zhang, J. J., Dai, X. R., Xiao, H., Xu, N. B., and He, J.: Identifying the pollution characteristics of atmospheric polycyclic aromatic hydrocarbons associated with functional districts in Ningbo, China, B. Environ. Contam. Tox., 103, 34–40, https://doi.org/10.1007/s00128-018-02535-4, 2019.
Wang, X. P., Zong, Z., Tian, C. G., Chen, Y. J., Luo, C. L., Tang, J. H., Li, J., and Zhang, G.: Assessing on toxic potency of PM2.5-bound polycyclic aromatic hydrocarbons at a national atmospheric background site in North China, Sci. Total Environ., 612, 330–338, https://doi.org/10.1016/j.scitotenv.2017.08.208, 2018.
Wu, D., Xu, Y., and Zhang, S.: Will joint regional air pollution control be more cost-effective? An empirical study of China's Beijing–Tianjin–Hebei region, J. Environ. Manage., 149, 27–36, https://doi.org/10.1016/j.jenvman.2014.09.032, 2015.
Xing, X., Chen, Z., Tian, Q., Mao, Y., Liu, W., Shi, M., Cheng, C., Hu, T., Zhu, G., Li, Y., Zheng, H., Zhang, J., Kong, S., and Qi, S.: Characterization and source identification of PM2.5-bound polycyclic aromatic hydrocarbons in urban, suburban, and rural ambient air, central China during summer harvest, Ecotox. Environ. Safe., 191, 110219, https://doi.org/10.1016/j.ecoenv.2020.110219, 2020.
Yan, Z., Jin, L., Chen, X., Wang, H., Tang, Q., Wang, L., and Lei, Y.: Assessment of air pollutants emission reduction potential and health benefits for residential heating coal changing to electricity in the Beijing–Tianjin–Hebei region, Research of Environmental Sciences, 32, 95–103, https://doi.org/10.13198/j.issn.1001-6929.2018.10.16, 2019.
Yang, Q. Q., Yuan, Q. Q., Li, T. W., Shen, H. F., and Zhang, L. P.: The relationships between PM2.5 and meteorological factors in China: seasonal and regional variations, Int. J. Env. Res. Pub. He., 14, 1510, https://doi.org/10.3390/ijerph14121510, 2017.
Yu, Q. Q., Gao, B., Li, G. H., Zhang, Y. L., He, Q. F., Deng, W., Huang, Z. H., Ding, X., Hu, Q. H., Huang, Z. Z., Wang, Y. J., Bi, X. H., and Wang, X. M.: Attributing risk burden of PM2.5-bound polycyclic aromatic hydrocarbons to major emission sources: Case study in Guangzhou, south China, Atmos. Environ., 142, 313–323, https://doi.org/10.1016/j.atmosenv.2016.08.009, 2016.
Zhang, J., Liu, W., Xu, Y., Cai, C., Liu, Y., Tao, S., and Liu, W.: Distribution characteristics of and personal exposure with polycyclic aromatic hydrocarbons and particulate matter in indoor and outdoor air of rural households in Northern China, Environ. Pollut., 255, 113176, https://doi.org/10.1016/j.envpol.2019.113176, 2019.
Zhang, J. W., Zhao, J., Cai, J., Gao, S. T., Li, J., Zeng, X. Y., and Yu, Z. Q.: Spatial distribution and source apportionment of atmospheric polycyclic aromatic hydrocarbons in the Pearl River Delta, China, Atmos. Pollut. Res., 9, 887–893, https://doi.org/10.1016/j.apr.2018.02.004, 2018.
Zhang, J. W., Feng, L. H., Zhao, Y., Hou, C. C., and Gu, Q.: Health risks of PM2.5-bound polycyclic aromatic hydrocarbon (PAH) and heavy metals (PPAH&HM) during the replacement of central heating with urban natural gas in Tianjin, China, Environ. Geochem. Hlth., 44, 2495–2514, https://doi.org/10.1007/s10653-021-01040-8, 2021.
Zhang, S. W., Chen, W. Q., Kong, L. Z., Li, G. L., and Zhao, P.: An Annual Report: Cancer Incidence in 35 Cancer Registries in China, 2003, China Cancer, 494–507, https://doi.org/10.3969/j.issn.1004-0242.2007.07.001, 2007.
Zhang, X., Leng, S., Qiu, M., Ding, Y., Zhao, L., Ma, N., Sun, Y., Zheng, Z., Wang, S., Li, Y., and Guo, X.: Chemical fingerprints and implicated cancer risks of Polycyclic aromatic hydrocarbons (PAHs) from fine particulate matter deposited in human lungs, Environ. Int., 173, 107845, https://doi.org/10.1016/j.envint.2023.107845, 2023.
Zhang, Y. J., Lin, Y., Cai, J., Liu, Y., Hong, L. N., Qin, M. M., Zhao, Y. F., Ma, J., Wang, X. S., Zhu, T., Qiu, X. H., and Zheng, M.: Atmospheric PAHs in North China: Spatial distribution and sources, Sci. Total Environ., 565, 994–1000, https://doi.org/10.1016/j.scitotenv.2016.05.104, 2016.
Zhang, Y. X., Tao, S., Cao, J., and Coveney, R. M.: Emission of polycyclic aromatic hydrocarbons in China by county, Environ. Sci. Technol., 41, 683–687, https://doi.org/10.1021/es061545h, 2007.
Zhang, Y. X., Tao, S., Shen, H. Z., and Ma, J. M.: Inhalation exposure to ambient polycyclic aromatic hydrocarbons and lung cancer risk of Chinese population, P. Natl. Acad. Sci. USA, 106, 21063–21067, https://doi.org/10.1073/pnas.0905756106, 2009.
Zhao, H., Wu, R., Liu, Y., Cheng, J., Geng, G., Zheng, Y., Tian, H., He, K., and Zhang, Q.: Air pollution health burden embodied in China's supply chains, Environmental Science and Ecotechnology, 16, 100264–100264, https://doi.org/10.1016/j.ese.2023.100264, 2023.
Zhi, Z., Wang, W., Cheng, M., Liu, S., Xu, J., He, Y., and Meng, F.: The contribution of residential coal combustion to PM2.5 pollution over China's Beijing–Tianjin–Hebei region in winter, Atmos. Environ., 159, 147–161, https://doi.org/10.1016/j.atmosenv.2017.03.054, 2017.
Zhu, D., Tao, S., Wang, R., Shen, H., Huang, Y., Shen, G., Wang, B., Li, W., Zhang, Y., Chen, H., Chen, Y., Liu, J., Li, B., Wang, X., and Liu, W.: Temporal and spatial trends of residential energy consumption and air pollutant emissions in China, Appl. Energ., 106, 17–24, https://doi.org/10.1016/j.apenergy.2013.01.040, 2013.
Zhuo, S., Shen, G., Zhu, Y., Du, W., Pan, X., Li, T., Han, Y., Li, B., Liu, J., Cheng, H., Xing, B., and Tao, S.: Source-oriented risk assessment of inhalation exposure to ambient polycyclic aromatic hydrocarbons and contributions of non-priority isomers in urban Nanjing, a megacity located in Yangtze River Delta, China, Environ. Pollut., 224, 796–809, https://doi.org/10.1016/j.envpol.2017.01.039, 2017.