the Creative Commons Attribution 4.0 License.
the Creative Commons Attribution 4.0 License.
Impact of boundary layer stability on urban park cooling effect intensity
Martial Haeffelin
Jean-François Ribaud
Jonnathan Céspedes
Jean-Charles Dupont
Aude Lemonsu
Valéry Masson
Tim Nagel
Simone Kotthaus
The added heat in cities amplifies the health risks of heat waves. At night under calm winds and cloud-free skies, the air in the urban canopy layer can be several degrees warmer than in rural areas. This lower nocturnal cooling in the built-up settings poses severe health risks to the urban inhabitants, as indoor spaces cannot be ventilated effectively. With heat waves becoming more frequent and more intense in future climates, many cities are expanding their green spaces with the aim to introduce cooling through shading, evaporation and lower heat storage capacities. In this study, we assessed how the evening and nighttime cooling effect of urban parks (relative to nearby built-up settings) varies with the park size and the mesoscale atmospheric conditions during warm summer periods. Using a combination of meteorological surface station data and compact radiosondes, the cooling effect is quantified for several urban parks (about 15 ha) and urban woods (about 900 ha). A profiling Doppler wind lidar deployed in the city centre is used to measure turbulent vertical mixing conditions in the urban boundary layer. We find that the maximum nocturnal cooling effects in urban parks range around 1–5 °C during a 1-week heat wave event in mid-July 2022 but also in general during summer 2022 (June–August). Three atmospheric stability and mixing regimes are identified that explain the night-to-night variability in the park cooling effect. We find that very low turbulent vertical mixing in the urban boundary layer (<0.05 m2 s−2) results in the strongest evening cooling in both rural settings and urban parks and the weakest cooling in the built-up environment. This regime specifically occurs during heat waves in connection with large-scale advection of hot air over the region and corresponding subsidence. When nocturnal turbulent vertical mixing above the city is stronger, the evening cooling in urban green spaces is less efficient, so the atmospheric stratification above both urban parks and woods is less stable, and temperature contrasts compared to the built-up environment are less pronounced. These results highlight the fact that urban green spaces have a significant cooling potential during heat waves, with maximum effects at night as advection and mixing transport processes are minimal. This suggests adapting the opening hours of public parks to enable residents to benefit from these cooling islands.
- Article
(6125 KB) - Full-text XML
- BibTeX
- EndNote
Excess heat in cities has impacts on human comfort, labour productivity and health. Mortality has been linked to exceptionally high temperatures during summertime heat waves both at night and during the day (Basu et al., 2002; Keatinge et al., 2000; Pirard et al., 2005). During the day, it is the outdoor radiative temperature that poses the most significant health risk. At night, indoor temperatures are particularly important as people need to rest, and indoor air must be vented to cool the building for the upcoming day. However, urban inhabitants in particular can be exposed to excessive and prolonged heat stress at night as the city and the buildings do not cool efficiently, preventing necessary nocturnal rest. Hot nights following hot days have been shown to make an important contribution to heat-related mortality (Murage et al., 2017; Royé et al., 2021).
Reducing people's exposure to heat in cities can be addressed through urban planning strategies. Increasing the vegetation fraction of urban areas is a widely accepted strategy to mitigate urban heat risk by effectively reducing heat storage uptake during daytime (Grimmond and Oke, 2002). Trees can provide efficient shading, reducing daytime air temperatures by several degrees below their canopy, while evapotranspirative cooling provided by vegetation, including trees, shrubs and grass, maintains the green space temperature several degrees below that of the built-up environment (Shashua-Bar and Hoffman, 2000). Green infrastructure also shows cooling effects at night, through continued evapotranspiration after sunset, generally larger sky-view factors in urban parks than in built-up environments and lower heat capacities. However, reduced radiative cooling and ventilation can retain heat below the canopy at night (Taha et al., 1991).
The cooling effect intensity of urban green infrastructure has been shown to be highly variable (Bowler et al., 2010; Skoulika et al., 2014). Doick et al. (2014) point to a lack of certainty regarding the variables that drive the park cooling effects and regarding the multiple roles of trees and green spaces. Spatial contrasts in nocturnal temperatures between green infrastructure and nearby built-up areas depend on the park perimeter and area (Gao et al., 2022; Cai et al., 2023), on proportion of grass and trees, on tree size (Zhu et al., 2021), on vegetation types and arrangements (street trees vs. parks), on the density of vegetation (Holmer et al., 2013), on park topography (Barradas, 1991; Chang et al., 2007), and on local climates (Ibsen et al., 2021). Other authors investigated the spatial extent of cooling by urban parks, i.e. the cooling effect distance, showing that it depends on both park size and park greenness (e.g. Zhu et al., 2021). From a recent review of park cooling effect studies conducted by Aram et al. (2019), we conclude that most studies focus on the impact of park characteristics, and investigations of the impact of meteorological conditions on park cooling effects are rare.
The impact of meteorological conditions such as cloudiness, wind and turbulence on differential cooling is studied mostly at regional scale in terms of their impact on the urban heat island (UHI) intensity (Oke, 2017). While the influence of cloud cover and wind is rather established (e.g. Morris et al., 2001; Lin et al., 2022), the occurrence and characteristics of nighttime low-level jets are also found to influence UHI intensity (Lemonsu et al., 2009; Céspedes et al., 2024). However, the impact of local- to mesoscale meteorological phenomena on cooling effects of urban green infrastructure is not well quantified.
The combined effects of green infrastructure characteristics and meteorological regimes on nocturnal cooling must hence be better understood so that the cooling effect of urban renaturation projects can be quantified more precisely. Which conditions affect the park cooling effect intensity? What is the relative impact of park characteristics and meteorological processes in the urban boundary layer on the cooling intensity?
The overall objective of this study is to quantify in detail the nocturnal cooling effects of urban parks during warm summertime conditions, taking into account potential cooling effects from the rural surroundings. We carried out this study in the framework of the Heat and Health in Cities project (H2C, Lemonsu et al., 2024) that focuses on the effects of excessive summertime heat and air pollution on human vulnerability (Forceville et al., 2024), with the Paris region (France) as a study area. A dedicated field campaign was designed and carried out in the city of Paris and the surrounding region to monitor spatial and temporal variations in key atmospheric thermodynamic variables in the urban canopy layer and urban boundary layer during summer 2022. The measurements performed, including near-surface and vertical profiles of temperature, humidity, wind and turbulence, and data analysis methodology are presented in Sect. 2. Section 3 presents the analysis of urban park cooling effects in relation to regional UHI and their variability during summer 2022, with a focus on a 1-week heat wave event. Next (Sect. 4), we investigate the characteristics of the urban boundary layer structure under three distinct atmospheric turbulence regimes and their influence on park cooling effects. Finally, we quantify the role of atmospheric stability and vertical turbulent mixing on different evening cooling between built-up locations, urban parks and rural settings (Sect. 5).
The present study is based upon data collected in the Paris region during the first special observation period of the Heat and Health in Cities project (SOP 2022, Fig. 1), which was conducted during summer 2022. This campaign also benefited from measurements carried out in the context of other research initiatives such as the Paris 2024 Olympics and Paralympics World Meteorological Organization (WMO) Research and Development Project (RDP-2024) and the Aerosol, Clouds and Trace Gases Research Infrastructure (ACTRIS; Laj et al., 2024). This multi-project context motivated the pooling of resources, a coordinated strategy for the organisation of the summer 2022 experimental campaigns and the development of a joint data repository under the name PANAME (PAris region urbaN Atmospheric observations and models for Multidisciplinary rEsearch – see https://paname.aeris-data.fr/, last access: 9 December 2024).
2.1 Datasets used in the study
This study combines continuous measurements collected from June to August 2022 and 14 1 d intensive observation periods (IOPs), with data collected from mid-June to the end of July 2022. Measurement locations are shown in Fig. 1.
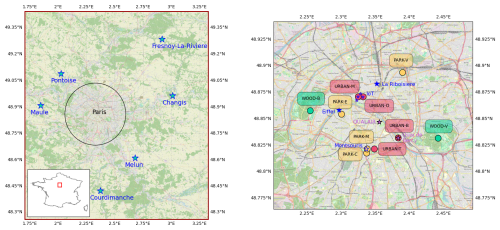
Figure 1(left) Locations of the six weather stations contributing to the rural setting reference. (right) Locations of fixed weather stations in the city of Paris (blue stars) and of Windsond and radiosonde launch sites in urban woods (green dots with WOOD), urban parks (yellow dots with PARK) and built-up areas (red dots with URBAN). © OpenStreetMap contributors 2023. Distributed under the Open Data Commons Open Database License (ODbL) v1.0.
2.1.1 Surface meteorological stations
Météo-France's operational network consists of some 50 ground-based weather stations in the Paris region measuring air temperature at 2 m a.g.l. (metres above ground level) with a 6 min acquisition time step. A few stations provide additional meteorological parameters such as wind speed and direction at 10 m a.g.l., global incoming radiation, precipitation, and cloud cover. The stations are spread across the region in different areas but are always installed on the ground on an open lawn (according to WMO recommendations).
We selected six stations to represent rural settings (local climate zone; Stewart and Oke, 2012) of the Paris region (Fig. 1), located in Changis, Courdimanche, Fresnoy-La-Riviere, Maule, Melun and Pontoise, which are similar to the stations selected by Lemonsu et al. (2015). The stations are geographically distributed in all directions relative to the city centre of Paris and located at altitudes ranging from 50 to 90 m a.s.l. (metres above sea level). In our study, the reference rural setting conditions of temperature, wind speed and direction are computed as the average of the variables measured at those six stations (Changis, Courdimanche, Fresnoy-La-Riviere, Maule, Melun and Pontoise stations).
Near-surface urban park weather conditions are documented by a Météo-France weather station located in the Montsouris Park, a 15 ha park located in the 14th district, south of the Paris city centre. The station, located at an elevation of 75 m a.s.l., provides 2 m air temperature and humidity measurements. Wind speed and direction are measured at 25 m a.g.l. A detailed description of temperature measurements in the Montsouris Park is provided by Dahech et al. (2020).
The Paris built-up setting conditions are sampled using Internet of Things (IoT) temperature and humidity measurements. This compact technology opens up new perspectives in meteorological measurements, particularly in urban environments where measurement and installation conditions are sometimes complicated. More than 20 IoT stations (DecentLab DL-SHT35-001 – air temperature and humidity sensor with radiation shield for LoRaWAN) have been installed in central Paris starting in July 2022. These are compact and lightweight stations installed on lampposts at a height of approximately 5 m a.g.l., following the recommendations made by Oke (2006). The stations have been installed on the north side of the lampposts to limit sensor warming through solar irradiance. The reference built-up setting temperature is computed as the average temperature recorded by four IoT stations located within 500 m of each other in the highly urbanised neighbourhood of the Paris opera house (hereafter referred to as Opera). Note that these stations were operational only from 8 July 2022. For the period prior to this date (1 June to 7 July), the built-up setting temperature is derived from the Météo-France weather station Lariboisière Hospital (10th district of Paris), which is located 2 km northeast of the Opera neighbourhood in an equally dense built-up setting. Comparisons of temperatures measured at Lariboisière and Opera during July and August 2022 do not reveal any significant differences (not shown). The built-up setting temperature (at Lariboisière and Opera) is considered to be uninfluenced by green space cooling, as the closest urban park is about 1 km away and cooling effect distances of parks reported in the literature are far less than 1 km (Aram et al., 2019).
Finally, we used temperature and wind speed and direction measured at the top of the Eiffel Tower (287 m a.g.l.) to monitor conditions at a height generally located in the nocturnal urban boundary layer.
2.1.2 Doppler wind lidar
A Doppler wind lidar (DWL) is used in this study to deduce the intensity of vertical turbulent mixing. The Vaisala DWL WindCube Scan 400 was installed at 90 m a.g.l. at the top of the Zamansky Tower located on the campus of Sorbonne University in the 5th district of Paris (Qualair atmospheric station location shown in Fig. 1; https://qualair.fr/, last access: 9 December 2024) to measure horizontal wind and vertical velocity. In this study, we use the vertical-stare mode of the DWL to derive vertical velocity variance () profiles. Each variance profile is calculated from 300 vertical velocity profiles collected during a 5 min period (one profile per second). Vertical velocity variance profiles are available every 30 min. Due to the installation setup, the first gate available for deriving the vertical velocity variance is at 240 m a.g.l.
2.1.3 Windsond
A Windsond is a lightweight sonde (12 grams) manufactured by Sparv Embedded, Sweden (https://sparvembedded.com/products/windsond, last access: 9 December 2024). This instrument, packaged in a styrofoam cup, records pressure, temperature and relative humidity approximately every second. Latitude and longitude are determined using an onboard GPS receiver. The S1H3 Windsond model calculates wind speed and direction independently from latitude and longitude, utilising the GPS signal. Thanks to its lightweight design, the balloon size is somewhat equivalent to a party balloon, requiring about 50 L of helium, making it particularly suitable for probing the lower parts of the troposphere.
For each IOP, three profiles were produced using Windsonds to monitor evening cooling at 16:00, 20:00 and 00:00 UTC. The 16:00 UTC profile corresponds to conditions of maximum daytime temperatures. The 20:00 UTC profile samples conditions about 1 h after sunset, while the 00:00 UTC profile is performed in conditions close to the maximum nighttime UHI.
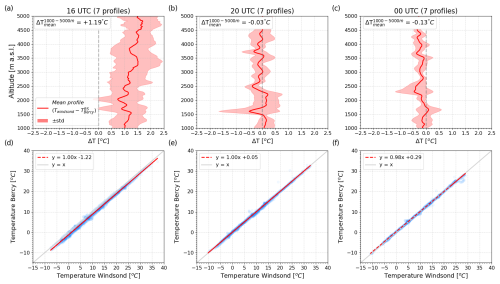
Corrections have been applied to the raw data as follows. Before the Windsond is released, the temperature and humidity sensors are not ventilated. Unventilated data (before launch) are thus carefully compared with the first points of the ventilated profile and corrected if necessary. As the temperature and humidity sensors are outside the styrofoam cup, the Windsond is subject to the influence of solar radiation during the day. Daytime overheating on the order of about +1 °C was observed by comparing those profiles with data collected by Vaisala RS41-SGP radiosondes launched at the same time at the URBAN-B location (see Appendix A). A correction of −1 °C was therefore applied across the entire profile for Windsond data at 16:00 UTC. No radiative correction is applied at 20:00 or 00:00 UTC.
2.2 Sampling methodology
Our study focuses on the evening temperature evolution at various locations across the Paris region under predominantly cloud-free conditions. The cloud cover fraction is derived on an hourly basis using a Lufft CHM 15k automatic lidar ceilometer located at the Site Instrumental de Recherche par Télédétection Atmosphérique (SIRTA) observatory (Haeffelin et al., 2005) and using a second one located at the Qualair atmospheric station. Evening cloud-free conditions are defined as a cloud fraction less than 20 % for each hour between 16:00 and 00:00 UTC. In the period of June–August 2022, 54 d are classified as evening cloud-free conditions. On average this period is characterised by a positive temperature anomaly and a near-zero precipitation anomaly (not shown).
The 14 intensive observation days were selected to focus predominantly on warm to hot daytime conditions followed by cloud-free nights. Two heat wave events were covered with intensive observations, the first one on 16–18 June and the second one on 12–19 July.
Windsond launch sites were classified as three types of settings, i.e. urban woods, urban parks and built-up areas. Two urban woods, located east of the city (Bois de Vincennes, 995 ha; WOOD-V in Fig. 1) and west of the city (Bois de Boulogne, 845 ha; WOOD-B), are mostly wooded, including open lawns, small lakes, buildings and roads. Three urban parks of comparable size were selected to sample different neighbourhoods of the city. One is located south of the city centre (Cité Universitaire, about 32 ha with 50 % green space and 50 % housing and small roads, located across the street from Montsouris Park; PARK-C), the second one is west of the city centre (Eiffel Tower Park, 24 ha, predominantly trees and open lawns; PARK-E) and the third one is northeast of the city centre (La Villette Park, 55 ha including 30 ha of green space and 25 ha of built-up areas; PARK-V). The three selected urban parks differ however in terms of vegetation type (species and fractions of trees, shrubs and grass) and also in terms of irrigation practices and hence soil moisture. These differences and their effects are not accounted for in this study. Windsonds were also launched from four built-up areas: one in the 13th district close to Montsouris Park (URBAN-T in Fig. 1), two in the 9th district close to the Opera IoT stations (URBAN-M and URBAN-O) and one in the 12th district next to the radiosonde launch site (URBAN-B). For the June 3 d heat wave, we sampled one park, one wood and one built-up site. For the July heat wave, we were able to sample the three parks, two woods and two built-up sites. Launch sites are shown in Fig. 1, and IOP dates and launch locations are shown in Table 1.
Table 1Dates of the 14 IOPs with locations and launch times of Windsonds. Locations are shown in Fig. 1. +RS-B indicates that radiosondes were launched from the URBAN-B location at the same time as the Windsonds. The colour indicates the location type for each day: urban park (yellow), urban wood (green) or built-up setting (red).

The cooling effect intensity of an urban park is derived as the temperature difference between a representative built-up neighbourhood and the green infrastructure where we expect cooler nocturnal conditions. In our study, the cooling effect intensity of Montsouris Park is computed on an hourly mean basis as the deficit of temperature measured in the park relative to the air temperature measured in the built-up setting (at the Lariboisière and Opera sites – see detailed definition of locations in Sect. 2). As park cooling effect intensity is reported to be highly variable, we study this variability as a function of the nocturnal UHI in the Paris region, which represents the regional-scale temperature contrasts between the same built-up environment and the vegetated rural reference. The study covers summer 2022, focusing on the 54 evening periods with cloud-free conditions (defined in Sect. 2).
3.1 Summertime urban park cooling effect variability
The regional UHI is known to be dependent on both cloud cover fraction and wind speed. Here we focus on cloud-free nights, for which the UHI has been found to be proportional to the inverse of the square-to-cube root of the wind speed (e.g. Morris et al., 2001). Céspedes et al. (2024) has also shown that the strongest UHI intensities are found for very low vertical velocity variance values, measured above the urban canopy, and that UHI decreases as vertical velocity variance increases.
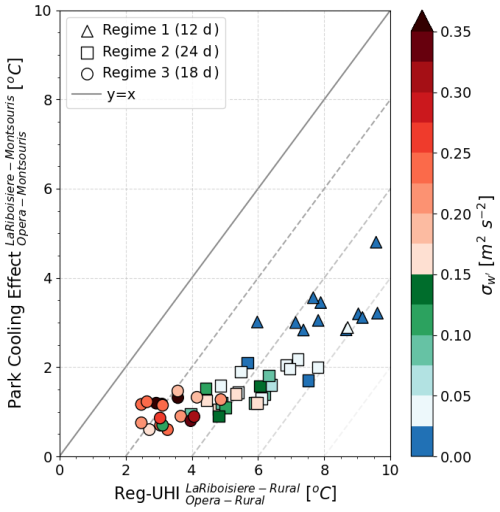
Figure 2Nocturnal urban park cooling effect intensity vs. regional-scale UHI intensity and vertical velocity variance (colour scale) derived from 8 h of measurements (median 19:00–02:00 UTC values) for the 54 cloud-free evenings.
Figure 2 presents the median nocturnal cooling intensity of Montsouris Park (a 15 ha urban park) vs. the median nocturnal regional UHI and median vertical velocity variance computed over the 19:00–02:00 UTC time interval for each night. A k-means clustering method based on the three variables is used to identify different regimes. The figure reveals three different regimes. In conditions of strongest UHI (6–10 °C), we find a group of days where the park cooling effect intensity ranges from 2 to 5 °C. In this regime, the vertical velocity variance is very low, with median nocturnal values ranging from 0.02 to 0.1 m2 s−2. In these conditions, urban park cooling intensity relative to the built-up environment shows a strong variability but is on average half the regional UHI intensity. In conditions of weak UHI intensity (2–4 °C), the park cooling effect is close to 1 °C, while the vertical velocity variances are high (greater than 0.25 m2 s−2). In this regime, intra-urban temperatures are most homogeneous and urban–rural contrasts are minimal, which are likely due to significant advection. In between, we find a number of days where the urban park cooling effect remains limited (1–2 °C), while the urban–rural temperature contrasts are significantly stronger (4–8 °C), by a factor of about 4. In these conditions, we find that the vertical velocity variances range between 0.1 and 0.2 m2 s−2. For those days, the rural environment around the city cools very efficiently, while the urban setting remains hot few little intra-urban contrasts.
In summary, we can state that
-
conditions of strong park cooling intensity combined with strong regional UHI intensity occur in a regime of low vertical velocity variance, a regime that will be referred to as the stagnant regime in the rest of the paper;
-
conditions of moderate park cooling intensity combined with strong regional UHI intensity occur in a regime of moderate vertical velocity variance (referred to as the intermediary regime) and
-
conditions of weak park cooling intensity combined with weak regional UHI intensity occur in a regime of high vertical velocity variance (referred to as the turbulent regime).
Based on these findings, questions arise. What processes drive the evening cooling in the urban park in these different conditions? What is responsible for the different urban park cooling effects that we find for low, moderate and high vertical velocity variance?
3.2 Urban park cooling effect variability in a heatwave period
To better understand factors affecting the variability in nocturnal temperature contrasts between urban parks and the built-up settings, we focus next on an 8 d event (12–19 July 2022) that is characterised by extreme daytime temperature (peak values approaching 40 °C on several days) and a set of diverse evening cooling patterns.
This period is characterised by a powerful anticyclonic axis in the middle of Morocco, France and the British Isles, which gradually warmed the air (Fig. 3). A secondary low-pressure system located between the Azores and Portugal moved towards the Bay of Biscay, strengthening the advection of particularly hot air from the Iberian Peninsula. This contributed to the intensification of a heatwave over the European continent, with an extreme peak over the Paris region on 19 July. As it moved northeastwards over France, this low-pressure system advected cooler oceanic air from the west, causing temperatures to fall and progressing eastwards with thunderstorm activity. During the heatwave, the 850 hPa temperature exceeded 20 °C, while on standard summer days, it is closer to 10 °C.
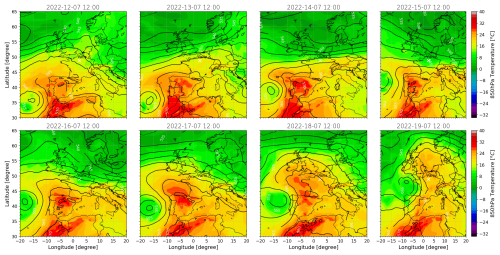
Figure 3Synoptic overview from 12 to 19 July 2022 based on ERA5 reanalysis. The colour bar represents temperature at 850 hPa, and the contours represent the geopotential height difference between 500 and 1000 hPa (dam).
Figure 4 shows the temporal evolution of near-surface atmospheric conditions during the 8 d period. Figure 4a compares the 2 m air temperature measured in the Opera built-up setting, the Montsouris urban park and the rural reference setting. The regimes identified in Sect. 3.1 are also shown for each night. Figure 4b presents the rate of change in temperature over time at the three locations. Figure 4c shows the temperature differences between the built-up site, the urban park and the rural setting. Figure 4d presents the wind speed and direction measured at the Montsouris urban park 25 m a.g.l., and Fig. 4e shows the vertical velocity variance measured at 240 m a.g.l.
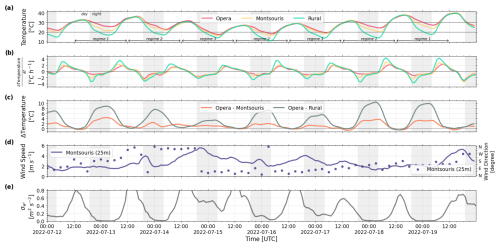
Figure 4Near-surface temperature and nighttime turbulence regimes (a) and cooling rate (b) measured in a built-up environment (Paris Opera district), an urban park (Montsouris Park, 15 ha) and the average of six rural locations around Paris. Urban park cooling effect (Opera–Montsouris temperature difference) and regional-scale UHI (Opera–rural temperature difference) (c), wind speed and direction measured at Montsouris Park 25 m a.g.l. (d), and vertical velocity variance measured in the Paris city centre 240 m a.g.l., 12–19 July 2022. During that week, the sun set at about 19:00 UTC and rose at about 04:00 UTC.
The 8 d period is characterised by a first heat wave on 12 and 13 July (stagnant regime) due to the advection of hot air shown in Fig. 3, with a maximum temperature exceeding 35 °C, followed by 3 d of more moderate heat on 14, 15 and 16 July (intermediary and turbulent regimes, maximum temperature at or below 30 °C and minimum temperatures in the built-up environment less than 20 °C). A second, more intense advection of hot air occurs over the following 3 d on 17, 18 and 19 July (stagnant regime), with daytime maximum temperatures exceeding 35 °C. Figure 4a shows that the daytime maximum temperatures (between 16:00 and 17:00 UTC) in the built-up, urban park and rural settings are close, within 1 °C of each other. Conversely, nighttime minimum temperatures (between 03:00 and 04:00 UTC) differ by 4–10 °C between the built-up and rural settings, with significant day-to-day variations (Fig. 4c).
Figure 4b shows positive heating rates from sunrise until about 1 h before sunset. Peak heating rates reach 2–3 °C h−1 but are on average near 1 °C h−1. Temperature changes become negative (cooling) 1 h before sunset. We observe a two-phase cooling consistent with earlier findings reported in the literature (e.g. Holmer et al., 2013). The first phase lasts from 16:00 to 21:00 UTC. It is characterised by large changes in the cooling rate, reaching maximum values near 19:00–20:00 UTC, and with differences of up to 2 °C h−1 between the built-up, urban park and rural cooling rates (on 12, 17 and 18 July). The second phase starts after 21:00 UTC and lasts until sunrise or about 04:00 UTC. It is characterised by more moderate cooling rates of typically less than −1 °C h−1 and by virtually no contrasts between the built-up, park and rural settings.
In the evening, air temperature cooling in the urban canopy is driven by a combination of processes, including radiative cooling of the surfaces and the air (through radiative flux divergence), turbulent heat exchange (through sensible and latent heat fluxes), release of heat from the ground (storage heat flux), vertical mixing of air, and advection (Oke, 2017). These processes are known to depend on the surface types and properties (albedo, emissivity, heat capacity, soil moisture), the 3D canopy structure (sky view factor), the city morphology, anthropogenic heat emissions, the spatial distribution of surface types (urban-to-rural surface gradients) and synoptic-scale weather conditions (wind, clouds). According to Steeneveld et al. (2006), atmospheric static stability and mesoscale dynamics affect the relative contribution of the radiative and turbulent processes. When the vertical turbulent mixing is low, turbulent heat fluxes are weak; hence, air temperature cooling is dominated by radiative flux divergence, partially compensated by the storage heat flux (Steeneveld et al., 2010).
This is consistent with the cooling rates shown in Fig. 4b. In the rural setting and in the urban park, where the storage heat flux is low, the largest cooling rates (peaking at −3 °C h−1 and −2 °C h−1, respectively) are observed in conditions of low vertical velocity variance (Fig. 4e) on the evenings of 12, 17 and 18 July (stagnant regime). In the built-up area, the radiative cooling is partially compensated by a stronger ground heat flux. On nights with moderate-to-high vertical velocity variance, radiative flux divergence is reduced and also compensated by sensible and latent heat flux releases, which leads to lower cooling rates in both the urban park and rural settings. The excess of urban park cooling compared to the built-up environment lasts 4 to 6 h (from 18:00 to 00:00 UTC), as is the case for the rural surface.
The contrasts in cooling rates between the built-up environment, the urban park and the rural settings can explain the large variability in the nocturnal park cooling effect and regional-scale UHI intensities shown in Fig. 4c. On the three nights with the lowest wind speed (<2 m s−1; Fig. 4d) and lowest vertical velocity variance (<0.05 m2 s−2), that is on 12–13, 17–18 and 18–19 July (stagnant regime), the maximum regional UHI intensity exceeds 8 °C, while the maximum park cooling effect reaches nearly 4 °C. On those nights in the built-up environment, the air temperature cools by 7–9 °C from sunset to sunrise, while the urban park cools an extra 3–4 °C and the rural setting an additional 3–4 °C. On the night with moderate wind speed (3–4 m s−1) and moderate vertical velocity variance, 15–16 July (intermediary regime), the regional UHI peaks near 6 °C, while the park cooling effect reaches about 2 °C. On this night, the air temperature cools by about 10 °C from sunset to sunrise in the built-up environment, while the urban green infrastructure cools an extra 2 °C and the rural setting an additional 3–4 °C. On the nights of 14–15 and 16–17 July (turbulent regime), the wind speed exceeds 4 m s−1 and the park cooling effect reaches just 1 °C, while the maximum regional UHI intensity is about 4 °C.
The analysis of the 12–19 July period confirms the results shown in Fig. 2. Different regimes exist that influence park cooling effect and regional UHI intensities. In particular, during nights with very low wind speeds, the air above the urban park cools significantly more (up to 4 °C) than in our reference built-up environment. To better understand the processes and conditions that affect these nocturnal intra-urban cooling contrasts, we will investigate the dynamics and thermodynamics of the urban boundary layer over green infrastructure of different sizes in the following section.
In this section, we focus on 4 different nights to study the characteristics of evening cooling mechanisms above urban green spaces, considering the dynamics of the urban boundary layer for the three turbulence regimes. For each evening period (16:00–00:00 UTC), we analyse time series of near-surface temperature, humidity and wind measured in the built-up environment, urban green infrastructure and rural settings. To investigate the relative role of relevant cooling mechanisms, i.e. radiative cooling of the surfaces, radiative cooling of the air through radiative flux divergence, turbulent heat exchange, vertical mixing and advection, it is helpful to quantify conditions in the urban boundary layer. Therefore, in order to assess the relative roles of surface-driven and atmospheric-driven processes, the conditions measured at the surface are complemented by an analysis of the observations at the top of the Eiffel Tower (287 m a.g.l.), as well as vertical profiles of meteorological variables obtained from Windsond profile measurements.
4.1 Stagnant regime: strong park cooling effect combined with strong UHI intensity
Here we focus on 2 nights that show the strongest park cooling effect intensity and most significant UHI intensity, classified as the stagnant regime, i.e. 12–13 and 17–18 July. Both selected nights occur in high-pressure synoptic conditions, with mesoscale subsidence over the region. Hot air advection driven by a secondary pressure low located west of the Iberian Peninsula led to 850 hPa temperatures near 20 °C. Both nights are characterised by very warm conditions over the preceding daytime period with daily maximum air temperatures exceeding 32 °C (see Figs. 5a, 6a). Strong regional-scale UHI and park cooling intensities are due to sharp contrasts in peak cooling rates (Figs. 5b and 6b) between built-up, park and rural settings that last for 4–6 h. On both 12 and 17 July, an evening cooling (16:00–00:00 UTC) of −5, −9 and −14 °C is documented in the built-up, urban park and rural settings, respectively, as shown in Table 2.
Table 2Cumulative evening temperature change (16:00–00:00 UTC) and average cooling rate for the three types of turbulence regimes.
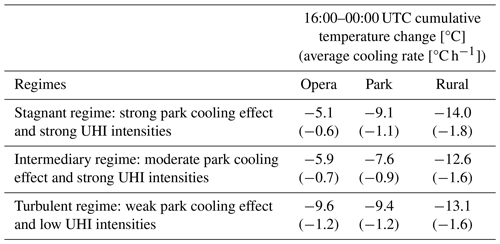
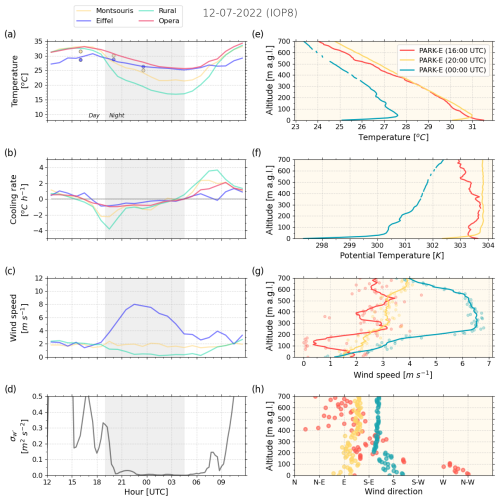
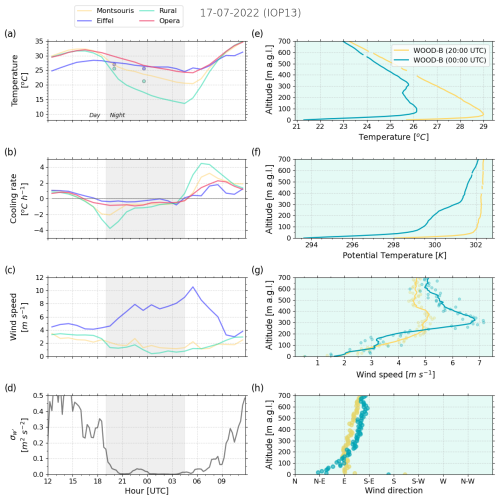
Figure 5Time series and Windsond profile measurements for 12 July 2022. (a–d) Time series measurements from 12:00 UTC to 12:00 UTC (plus 1 d). (a) Temperature at Montsouris Park, rural settings, Opera (built-up) and the top of the Eiffel Tower. The coloured dots show the temperature measured by Windsonds at 16:00, 20:00 and 00:00 UTC at park level and at the height of the Eiffel Tower (287 m a.g.l.). (b) Cooling rate at Montsouris, rural, Opera and Eiffel Tower sites. (c) Wind speed at Montsouris, rural and Eiffel Tower sites. (d) Vertical velocity variance from DWL at 240 m a.g.l. at the Qualair-SU site. (e–h) Vertical profiles from radiosonde measurements released in PARK-E at 16:00, 20:00 and 00:00 UTC, respectively. (e) Temperature profile. (f) Potential temperature profiles. (g) Wind speed profiles. (h) Wind direction profiles.
The relatively strong cooling rate in the urban park compared to the built-up settings suggests that the surface-driven processes (i.e. radiative cooling and/or turbulent latent heat fluxes) are rather efficient on those nights. In comparison, the air temperature at the top of the Eiffel Tower peaks generally around 18:00 UTC, i.e. about 2 h later than near the surface at values 2–3 °C colder than the near-surface air temperature (Figs. 5a and 6a). After 18:00 UTC, the air starts to cool, with a rate of around −0.35 °C h−1, which is nearly half the value of the near-surface cooling rate measured in the built-up environment (Figs. 5b and 6b). Hence, the air at 287 m a.g.l. is only moderately affected by the processes that cool the air close to the surface. This is the first evidence of decoupling between the urban canopy layer (UCL) and the air above and of the decrease in static instability in the urban boundary layer (UBL).
Further evidence of this decoupling due to static stability in the UBL can be found in the wind speed measurements. Figures 5c and 6c show the time series of wind speed at 10 m a.g.l. at the Melun rural site, at 25 m a.g.l. in the Montsouris urban park and at 287 m a.g.l. at the Eiffel Tower for 12 and 17 July, respectively. A comparable temporal evolution of wind speed can be observed in the evening hours on both days. During the afternoon, the wind speed at both the urban park and the rural site are consistent (about 2-4 m s−1 and within 1–2 m s−1 of each other). After about 18:00 UTC, the wind speed at 287 m a.g.l. increases rapidly to reach 8–10 m s−1 before 00:00 UTC, while the rural and urban park wind speeds remain low, at or below 2 m s−1, i.e. often lower than during daytime. This is the second piece of evidence that after sunset, decoupling conditions occur between the surface layer and the air above.
Figures 5g, h and 6g, h show vertical profiles of wind speed and direction derived from Windsond profiles launched at 16:00, 20:00 and 00:00 UTC over an urban park (PARK-E; Fig. 1) on 12 July and over a large urban wood (WOOD-B; Fig. 1) on 17 July, respectively. Both IOPs are characterised by easterly winds with relatively little wind direction evolution in the evening. During daytime (16:00 UTC), the wind speed is moderate (2–4 m s−1) in the first 700 m of the atmospheric boundary layer. The Windsonds launched after sunset (near 20:00 UTC) reveal in both cases low near-surface wind speed (1.5–2.0 m s−1) that gradually increases with height (consistent with results described in the previous paragraph). A 3 m s−1 wind shear can be observed on 17 July between the surface and 200 m a.g.l. The wind shear is not as strong on 12 July, possibly because the profile was measured 45 min earlier than on the other day. This wind shear is a signature of the stabilisation of the atmosphere that inhibits the vertical transfer of momentum and hence decouples the air aloft from surface drag effects, allowing the wind speed to increase aloft (e.g. Barthelmie et al., 1996).
The Windsonds launched at 00:00 UTC reveal even stronger wind shear between the surface and 200 m a.g.l., with a maximum wind speed of around 6.5 m s−1 on both nights near 300 m a.g.l. and a decreasing wind speed above. This vertical structure is known as a low-level jet (LLJ), a condition that occurs frequently on summer nights above Paris according to Céspedes et al. (2024). Their work has shown that very-low-altitude LLJs are associated with low levels of turbulence due to the fact that they form in a statically stable atmosphere that inhibits mechanically induced turbulence.
To characterise the importance of vertical mixing as a potential means for heat transfer between the UCL and the nocturnal urban boundary layer, we use Doppler wind lidar measurements to derive time series of vertical velocity variance (Figs. 5d and 6d). During the convective period of the two IOPs, the vertical velocity variance typically exceeds 0.5 m2 s−2. It then decreases rapidly around sunset. At 20:00 UTC, the values dropped to less than 0.05 m2 s−2 on both 12 and 17 July, and they remained very low all night. This confirms the very low vertical turbulent mixing in the UBL on both nights. It should be noted that in the stagnant regime, the vertical velocity variance values are very low (less than 0.05 m2 s−2) throughout the LLJ layer that extends from 240 to about 500 m a.g.l. or more (not shown). Hence, even though the vertical velocity variance is not constant with height and the measurement height (240 m a.g.l.) is close to the top of the UBL, we conclude that the vertical velocity variance value at 240 m a.g.l. is representative of the nocturnal urban boundary layer turbulence regime.
To characterise the role of vertical radiative flux divergence in the atmospheric boundary layer and to better understand the relative importance of surface-driven vs. atmospheric-driven processes, we analyse the vertical structure of temperature and its temporal evolution. In the Eiffel Tower urban park (PARK-E), we find that near-surface temperatures measured by the Windsond on 12 July are consistent with temperatures recorded by the Montsouris urban park surface station (yellow circles in Fig. 5a). At 20:00 UTC, we observe a 1 °C temperature inversion between the surface and 50 m a.g.l. (Fig. 5f). Above the inversion, the temperature decreases adiabatically by about −1 °C per 100 m such that the potential temperature is nearly constant in a statically neutral layer between 50 and 700 m (Fig. 5f). At 00:00 UTC, the surface-based inversion has become stronger (ΔTair=2.5 °C and Δθair=3.0 °C between the surface and 50 m a.g.l.), and two elevated inversions have formed near 100 and 200 m a.g.l. (Fig. 5f, g), with Δθair=0.5 °C followed by a statically stable layer with a +0.2 °C per 100 m lapse rate (Fig. 5g).
In the urban wood (WOOD-B), near-surface temperatures measured by the Windsond on 17 July are close to temperatures measured in the rural settings (green circles in Fig. 6a). With a 3.5 °C decrease over 50 m, the surface-based temperature inversion at 20:00 UTC (Fig. 6e) is already stronger than the inversion observed at 00:00 UTC over PARK-E on 12 July. Above the inversion, the temperature decreases adiabatically (Fig. 6e, f), and the potential temperature profile confirms that the stable wood UBL is capped by a neutral layer above. At 00:00 UTC, the surface-based inversion strengthens and extends aloft (ΔTair=5.0 °C per 100 m; Δθair=6 °C per 100 m), followed by an elevated inversion near 250 m a.g.l. (Fig. 6f, g). The potential temperature profile is stable between 100 and 300 m a.g.l. (+1.0 °C per 100 m) and moderately stable (+0.2 °C per 100 m) above (Fig. 6g).
These elevated inversions observed over both the urban park and urban wood could be formed through the localised radiative cooling, subsidence and/or advection of statically stable rural air that is commonly observed above the nocturnal UBL (e.g. Tsiringakis et al., 2022). Elevated inversions in nocturnal UBLs are simulated and studied extensively in Martilli (2002). The drag and turbulent kinetic energy production induced by the urban structure increase with increasing wind speed. Vertical mixing of potential temperature leads to a local minimum of temperature at the location of maximum turbulence through a negative turbulent heat flux. According to Martilli (2002), the net results of the vertical turbulent transport are to heat the layer below the base of the inversion and to cool the inversion layer. Cooling of the inversion layer (roughly between 200 and 300 m a.g.l.) is clearly seen on both Windsond temperature profiles measured at 00:00 UTC.
We can conclude that the conditions of the stagnant regime, combining strong park cooling effects and strong UHI intensities, are associated with a significant surface-based inversion that leads to the decoupling of not only the rural nocturnal boundary layer from the residual layer but from also the urban boundary layer and the neutral layer above. The strong stratification suppresses nearly any turbulent vertical motion such that the UBL height is rather shallow – even below the top of the Eiffel Tower. As the flow is no longer subject to surface drag, a regional low-level jet forms that likely advects rural, statically stratified air over the UBL, which can influence the development of elevated inversions. The strong stratification in the park internal UBL is the result of cooling dominated by radiative flux divergence due to low turbulent mixing.
4.2 Intermediary regime: moderate park cooling effect combined with strong UHI intensity
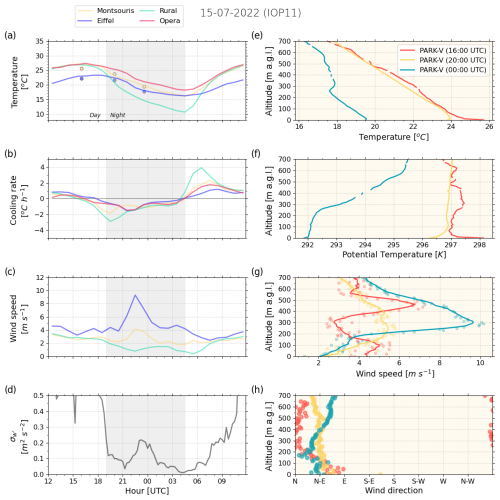
The evening of 15–16 July, compared to those discussed in Sect. 4.1, is characterised by weaker cooling between 16:00 and 00:00 UTC in the rural setting and urban park and stronger cooling in the built-up environment, as shown in Table 2. It is classified as the intermediary regime. Cooling peaks near −3 °C h−1 in the rural setting and −1.5 °C h−1 in urban park, which are slightly less than for the cases of Sect. 4.1 (Fig. 7b). For this regime, the nocturnal near-surface wind only decreases in the rural setting; it increases in the urban park after 21:00 UTC as the wind aloft picks up (Fig. 7c), which indicates that vertical momentum transfer is less inhibited above the urban surface. Figure 7d shows that the vertical turbulent mixing remains above 0.1 m2 s−2 after sunset and increases to 0.2 m2 s−2 during the evening, which confirms that the UBL remains turbulent during the night.
The Windsond profiles carried out in the La Villette urban park (PARK-V in Fig. 1), for which the vegetated area is comparable to that of the Montsouris urban park, reveal a slight surface-based inversion with a neutral layer above at 20:00 UTC, while at 00:00 UTC under brisker turbulent mixing, the UBL remains near neutral from the ground up to a temperature inversion near 300 m a.g.l. It is then likely that the UBL remains neutral due to a sensible heat flux originating from the hot surface combined with turbulent mixing and from the temperature inversion above. Again, a clear low-level jet with peak horizontal velocity >9 m s−1 near the height of the temperature inversion suggests that stably stratified air from rural surroundings is advected over the city.
The intermediary regime highlights the fact that while the rural nocturnal layer becomes statically stable during the evening, as evidenced by the very low near-surface wind speed at the rural site, the UBL remains statically neutral. Vertical turbulent mixing in the UBL prevents a temperature inversion from forming in the UCL, even above the urban green space.
4.3 Turbulent regime: weak park cooling effect combined with weak regional UHI intensity
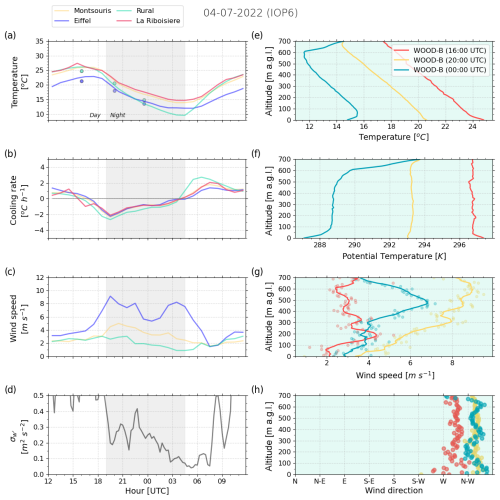
The evening of 4 July, classified in the turbulent regime, is characterised by nearly identical cooling rates in built-up settings, urban green spaces, and aloft at the top of the Eiffel Tower. Cooling peaks near −2 to −2.5 °C h−1 at all locations (Fig. 8b). Wind speed at both rural settings and at the urban park does not decrease after sunset but rather increases after 18:00 UTC as the wind aloft picks up (Fig. 8c). In addition to the strong advection effects, the UBL remains turbulent during the night, as turbulent vertical mixing remains above 0.2 m2 s−2 after sunset (Fig. 8d), both of which indicate that vertical momentum transfer is not inhibited across the region.
The Windsond profiles carried out at the Bois de Boulogne large urban wood (WOOD-B in Fig. 1) detected a neutral UBL from 0 to 700 m a.g.l. at 20:00 UTC. At 00:00 UTC, under continued brisk turbulent mixing, a weak 1 °C temperature inversion forms over the large green space while the neutral UBL extends from 100 to 600 m a.g.l. and is capped by a 5 °C temperature inversion.
To better understand the impact of wind, turbulence and static stability on differential cooling between built-up areas, urban parks and rural settings, we analyse the characteristics of the three turbulence regimes encountered during summer 2022. First, we study the diurnal evolution of wind and turbulence in built-up settings, urban green spaces and rural surroundings (Sect. 5.1) and then investigate the atmospheric static stability in the built-up surfaces and green infrastructure (Sect. 5.2) for the three regimes. Finally, we analyse the diurnal cycle of temperature and discuss the nocturnal cooling in built-up environments, green infrastructure and rural settings for the three regimes (Sect. 5.3).
5.1 Wind and turbulent mixing characteristics of turbulence regimes
First, we study how wind speed evolves at diurnal scales over the city (Montsouris urban park), in the rural setting (Melun) and aloft (the top of the Eiffel Tower) for the turbulence regimes identified in Sect. 3 (Fig. 9).
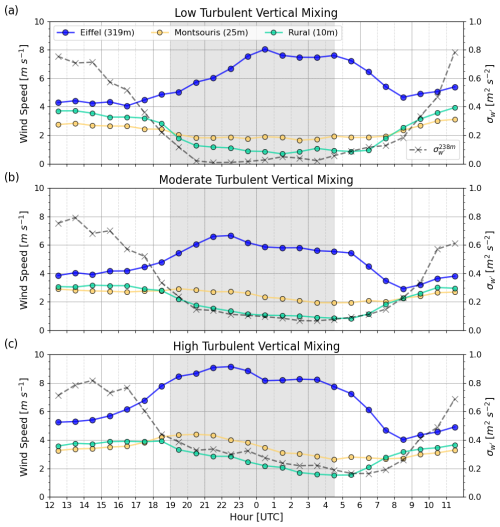
Figure 9Average diurnal cycles over summer 2022 for each of the turbulence regimes (stagnant a, intermediary b and turbulent c): wind speed measured at Melun (rural site), Montsouris Park (urban park) and the top of the Eiffel Tower and vertical velocity variance at 240 m a.g.l. derived from Doppler lidar measurements.
In the stagnant regime (highest UHI intensity and lowest vertical velocity variance), we find that at sunset, when vertical mixing drops, the wind speed aloft increases while the near-surface wind speed decreases both over the urban park and in the rural setting (Fig. 9a). Vertical velocity variance reaches values below 0.05 m2 s−2 shortly after sunset. Not only the rural nocturnal boundary layer but also the UBL becomes stratified, thereby inhibiting the vertical transfer of momentum. The stable UBL becomes decoupled from the neutral layer above, allowing near-surface wind speeds to decrease on average below 2 m s−1 through surface drag, while wind speed aloft experiences reduced friction and hence increases.
In the intermediate regime (strong ΔUHI and moderate vertical velocity variance), we observe that on average, the vertical velocity variance decreases later than in the stagnant regime and is 50 % stronger at sunset, reaching 0.15 m2 s−2 on average during the night (Fig. 9b). The near-surface wind speed in the rural setting decreases at sunset similarly to the stagnant regime, so we can hypothesise that the atmosphere becomes stable in the rural environment. In the urban green spaces, the near-surface wind speed remains unchanged after sunset, which is consistent with a continued vertical transfer of momentum. Still, the stable stratification over the rural area tends to favour the formation of a low-level jet, a phenomenon that occurs 70 % of the nights in Paris in summer 2022 (Céspedes et al., 2024), such that the wind speed above the neutral UBL can double in magnitude between noon and midnight.
In the turbulent regime (low UHI intensity and high vertical velocity variance), vertical velocity variance in the UBL is on average above 0.3 m2 s−2 at sunset (Fig. 9c). Near-surface wind speed in the rural setting remains above 3 m s−1 on average, while then central urban wind speeds increase consistently across the UBL, i.e. both near the surface and at the top of the Eiffel Tower.
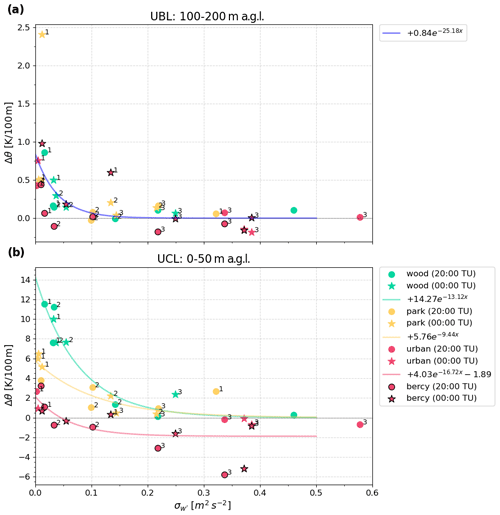
Figure 10Nighttime (20:00 and 00:00 UTC) potential temperature lapse rate above woods (green), parks (orange) and built-up areas (red) as a function of σw in the UBL (at 240 m a.g.l.) for (a) a layer between 100 and 200 m a.g.l. and (b) a layer between 0 and 50 m a.g.l. Symbols indicate time in UTC. Urban labels with black borders correspond to data from radiosondes launched from the URBAN-B site and the others to data from Windsonds (various sites). The number shows the mean evening (19:00–02:00 UTC) turbulence regime for each case.
5.2 Atmospheric stability characteristics of turbulence regimes
In Sect. 4, we found evidence that the static stability above urban parks and urban woods can vary significantly depending on the turbulent vertical mixing in the UBL. To study this variability, we derive the potential temperature lapse rates for each Windsond profile carried out at 20:00 and 00:00 UTC above urban woods and parks, as well as for the radiosonde profiles launched at the same time from the built-up area of Bercy (URBAN-B location in Fig. 1) along the Seine River, and plot them against the vertical velocity variance estimated from the DWL measurements at the same time (Fig. 10). The potential temperature lapse rate is derived for two vertical intervals, 0–50 m a.g.l., representing the height over which surface-based inversions are typically observed (also called the park/wood internal boundary layer), and 100–200 m a.g.l., representing the nocturnal UBL. Vertical velocity variances shown in Fig. 10 are 1 h average values. The turbulence regime derived for each evening (19:00–02:00 UTC) is also shown. Figure 10b reveals that when the vertical velocity variance drops below 0.05 m2 s−2 (corresponding mostly to the stagnant regime), the near-surface potential temperature lapse rate above urban parks (about 20 ha) ranges from 4 to 6 °C per 100 m while those above the woods (about 900 ha) can reach 8–14 °C per 100 m. In the lowest vertical velocity variance conditions (<0.025 m2 s−2), near-surface potential temperature lapse rates in built-up areas also become positive, ranging from 1 to 3 °C per 100 m. This confirms that stable stratification can occur in all settings, but the strength of the stratification depends on the surface type.
For vertical velocity variances ranging from 0.1 to 0.2 m2 s−2, near-surface potential temperature lapse rates above parks and woods range between 0 and 3 °C per 100 m, decreasing to near-adiabatic conditions (0 °C per 100 m) as turbulent mixing increases. In built-up areas, we find that near-surface potential temperature lapse rates become negative (near −1 °C per 100 m) as soon as the vertical velocity variance exceeds 0.05 m2 s−2, a signature of a typical unstable urban surface layer.
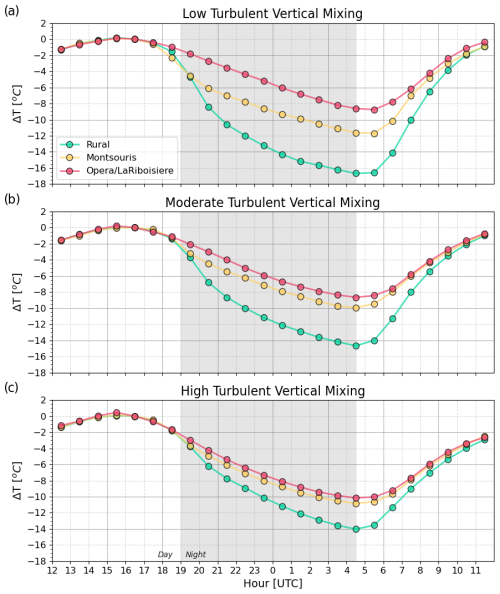
Figure 11Diurnal cycle of temperature difference relative to the temperature at 16:00 UTC at Melun (rural site), Montsouris Park (urban park) and Opera/Lariboisiere (built-up setting) for the stagnant, intermediary and turbulent regimes.
This analysis provides quantitative evidence that evening and nighttime air temperature conditions in the UCL become spatially heterogeneous when turbulent mixing in the UBL is very weak. Only then it is possible for a strong temperature inversion to form over the urban green space through the support of radiative flux divergence. The cool air remains in a local, internal park/wood thermal boundary layer and does not mix with the relatively warm air in the surrounding neighbourhoods. The significance and vertical extent of this cool air pool increases with green space size, and we theorise that green fraction and soil moisture levels would also enhance the effect.
The turbulent mixing in the UBL varies with the static stability of the UBL. As shown in Fig. 10a, when the potential temperature lapse rate at 100–200 m a.g.l. increases to values near +0.5 °C per 100 m for all settings, including built-up areas, the vertical velocity variance decreases below 0.05 m2 s−2. No clear contrast in stability is found above the different surfaces, confirming that under the stagnant regime, the nighttime UBL is very shallow.
5.3 Impact of turbulence regimes on diurnal temperature evolution
Ultimately, we want to determine how the turbulence regimes can impact the nocturnal cooling provided by urban green infrastructure. Figure 11 shows the mean diurnal cycles of temperature for stagnant, intermediary and turbulent regimes (panels a, b and c, respectively). The temperature diurnal cycles are normalised by subtracting the temperature measured at 16:00 UTC (peak daytime temperature). On average, daytime peak temperatures are highest for the stagnant regime, near 31 °C, while they peak at about 27 °C for the other two regimes. Figure 11 shows that after 16:00 UTC, the temperature at all sites decreases to a minimum value by the next morning at sunrise. In 12 h, the temperatures drop between 8 and more than 14 °C depending on the surface type and the turbulence regime. The stagnant regime reveals the strongest contrasts between the settings (Fig. 11a). At 00:00 UTC, 5 h after sunset, the built-up neighbourhood had cooled by 5.5 °C, while the urban park had cooled by 9.0 °C and the rural sites by almost 13.8 °C. This confirms earlier findings (Table 2 and Sect. 5.2) that under low turbulent vertical mixing, the radiative cooling of the surface in urban park and rural settings, combined with low turbulent vertical mixing, provides an efficient cooling of the near-surface atmosphere. In such conditions, urban parks can provide significantly cooler conditions than the built-up neighbourhoods nearby.
In the intermediary regime, the evening cooling rate in the built-up environment is slightly larger than that in the stagnant regime (−6.2 °C at 00:00 UTC, Fig. 11b). In the urban park, the increased UBL turbulent vertical mixing reduces the strength of the near-surface radiative flux divergence. The evening cooling in the urban park is not as strong (−7.5 °C at 00:00 UTC) as in the stagnant regime. In the rural setting, the evening cooling is also reduced in the intermediary regime (−11.7 °C at 00:00 UTC) compared to the stagnant regime, revealing that turbulence is also likely stronger in the rural nocturnal boundary layer.
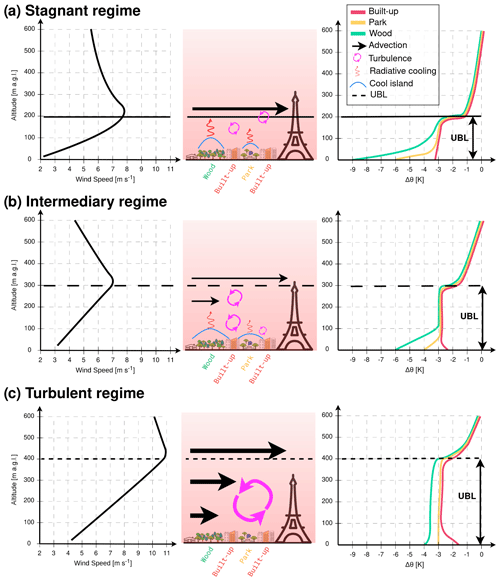
Figure 12Typical nighttime (near 00:00 UTC) vertical structure of wind speed (left) and potential temperature (right) in the urban boundary layer, observed during (a) stagnant, (b) intermediate and (c) turbulent mixing regimes. Potential temperature profiles are represented above built-up environments (red), urban parks (yellow) and urban woods (green). Key processes (advection, turbulent mixing, radiative cooling) affecting nocturnal cooling in the UBL are represented (centre).
In the turbulent regime, with stronger turbulent vertical mixing and higher near-surface wind speed than in the other regimes, the efficiency of the surface-driven cooling in the rural setting is even more reduced, which limits the cooling compared to less turbulent conditions (−10.6 °C at 00:00 UTC, Fig. 11c). In the built-up environment, the air temperature drops by 7.6 °C between 16:00 and 00:00 UTC, i.e. 1.5–2 °C more than in the other regimes. In this turbulent regime, the city centre benefits from the cooling of the rural surroundings through advection – the cooler air is mixed down into the UBL. In the urban park, two competing processes occur. The radiative flux divergence is reduced by the strong mixing, but this again means that cooler air advected from rural surroundings is efficiently mixed down, thereby contributing to a strong cooling in the urban park as well. Hence, we find that the temperature drops by 8.3 °C on average between 16:00 and 00:00 UTC, which is between the cooling of the stagnant and intermediary regimes.
This study shows that the nocturnal cooling effect of urban parks depends on not only their characteristics, such as their size, but also UBL turbulent mixing and static stability regimes that drive the relative importance of radiative and mixing transport cooling processes in the UCL. We find that turbulent vertical mixing conditions measured by a Doppler lidar at about 240 m a.g.l. in the city centre are a very useful indicator to distinguish different evening cooling regimes in the urban environment. These findings are summarised in a schematic (Fig. 12) that represents, for each turbulent mixing regime, typical nighttime vertical profiles of wind and potential temperature above the urban environment and key processes that affect nocturnal cooling.
The highest green space nocturnal cooling intensity occurs under stable stratification in the UBL (statically stable, low turbulent mixing – vertical velocity variance of less than 0.05 m2 s−2) over both rural settings and urban parks. This stagnant regime is associated with large-scale subsidence and large-scale advection of warm air aloft. The potential temperature profiles above the urban parks and woods become statically stable soon after sunset due to radiative cooling of the surface and subsequent cooling of the air by radiative flux divergence in the absence of a significant turbulent heat flux. A few hours after sunset, the entire UBL becomes on average statically stable (about 200–250 m deep) due to subsidence and advection of the stable rural air above the urban environment. Even if the heat release from the urban surface would, in theory, lead to an unstable/near-neutral urban boundary layer at night, we observe that the strong stabilisation from above limits it strongly in height or even totally inhibits it. At the top of the UBL, a low-level jet develops over the night with peak wind speed, but mechanical turbulence is inhibited by the static stability of the UBL. The advected rural air mass remains stable above the urban environment because of unusually low vertical mixing conditions. This stagnant regime exhibits the strongest evening cooling in both rural settings and urban parks and the weakest cooling in the built-up environment; hence, strong nocturnal temperature contrasts occur in the city depending on the vegetation fraction. In this regime, the cooling effect of green infrastructure will depend on their size and likely on the vegetation fraction in these areas. In this stagnant regime, we find comparable nocturnal cooling rates (peaking at −2 °C h−1 around sunset) and static stability in the UCL (lapse rate near 6 °C per 100 m at 00:00 UTC) above Montsouris Park (15 ha) and Eiffel Tower Park (24 ha) that are of roughly the same size. Above urban woods (about 900 ha), near-surface lapse rates can reach twice the value observed above urban parks (near 12 °C per 100 m at 00:00 UTC). This leads to the development of an internal UBL about 50 m (100 m) deep above urban parks (woods).
A second regime is identified, characterised by moderate turbulent vertical mixing in the UBL (for vertical velocity variance between 0.1 and 0.2 m2 s−2). Under this intermediary regime, the potential temperature profiles above the urban park become neutral after sunset. A small temperature inversion (<1 °C above urban parks, <3 °C above urban woods) can be found in the UCL. A few hours after sunset, the UBL remains statically neutral up to 250–300 m due to a positive turbulent heat flux at the surface and at the top of the UBL, which is characterised by a temperature inversion. Advection of rural air brings a statically stable layer above the UBL. Under this intermediary regime, the evening cooling in rural settings is about 2 °C less than in the stagnant regime. The cooling in the urban park is also 2 °C less than in the stagnant regime 2 h after sunset, while the built-up environment is slightly cooler than in the stagnant regime. There is probably vertical and also horizontal air mixing (advection or local turbulence), which diminishes the cooling effect of small-to-medium-sized parks (15–25 ha) by mixing air from the surrounding dense neighbourhoods. Hence, in the intermediary regime, the intra-urban temperature contrasts between areas with varying vegetation fractions are significantly reduced.
The third regime identified in this study results in the weakest nocturnal temperature contrasts. Compared to the stagnant and intermediary regimes, the turbulent regime is characterised by stronger advection and mesoscale circulation, wind shear, and turbulent vertical mixing. The UBL above the urban park becomes neutral after sunset, with a depth that is significantly increased (>400 m) compared to the other two regimes. The UBL remains neutral even several hours after sunset. In this turbulent regime, the evening cooling rates are nearly identical in the built-up environment and in the urban parks. In this regime, high turbulence and wind mix the air and homogenise temperatures at a larger scale (district-to-city scale) than in the intermediary regime (neighbourhood scale), completely encompassing and erasing the cooling effect of parks.
As statically stable low turbulent mixing conditions occur during the strongest heat waves due to large-scale subsidence and advection of hot air, it is important to maintain spatially distributed and accessible vegetated cool island spots in the city so that people can benefit from cooler outdoor nighttime conditions after being exposed to significant daytime heat stress.
The evaluation of the Windsond temperature profiles was conducted by comparing them with the Vaisala RS41 temperature profiles launched at Quai de Bercy (URBAN-B site in Fig. 1) during the SOP 2022. Data from seven IOPs were used for this evaluation, with profiles recorded at 16:00, 20:00 and 00:00 UTC. Von Rohden et al. (2022) find a radiation bias of 0.1 °C in Vaisala RS41 temperature data in the troposphere. Our comparisons reveal an average warm bias of 1.2 °C in Windsond temperature profiles compared to Vaisala RS41 values for the 16:00 UTC profiles. No significant bias was found at 20:00 or 00:00 UTC.
All raw data are available from the AERIS data centre catalogue at https://paname.aeris-data.fr/data-catalogue-2/ (AERIS-PANAME, 2024).
MH, SK, AL and VM planned the campaign; MH, SK, JFR, JCD and JC performed the measurements; MH, JFR, SK and JC analysed the data; MH and SK wrote the manuscript draft; JFR produced the figures; and AL, VM and TN reviewed and edited the paper.
The contact author has declared that none of the authors has any competing interests.
Publisher's note: Copernicus Publications remains neutral with regard to jurisdictional claims made in the text, published maps, institutional affiliations, or any other geographical representation in this paper. While Copernicus Publications makes every effort to include appropriate place names, the final responsibility lies with the authors.
The PANAME experimental programme benefited from several kinds of support, including the research project H2C funded by the French National Research Agency (ANR) with the reference ANR-20-CE22-0013-02; the Research Demonstration Project for Paris Olympics 2024 funded by Météo-France and the Weather Meteorological Organization; the Paris Region PhD programme 2020; investments from DIM QI2, OBS4CLIM-PIA3, CNRS-INSU and the ACTRIS research infrastructure; and data management (AERIS National Data And Services Centre). The authors would like to thank all the volunteers and participants who contributed to the success of the SOP 2022, in particular the teams and many volunteers who carried out the Windsond releases in the parks in the evening and at night and the radiosondes at Bercy. Thanks are extended to Hugo Ricketts for training the IPSL team to operate Windsonds with the support of the European COST action PROBE. The authors would like to express their thanks to the Qualair-SU scientific team who enabled the Doppler lidar deployment on the site at Sorbonne Université.
This research has been supported by the Agence Nationale de la Recherche (grant no. ANR-20-CE22-0013-02).
This paper was edited by Zhanqing Li and reviewed by two anonymous referees.
AERIS–PANAME database: PANAME, https://paname.aeris-data.fr/data-catalogue-2/, last access: 9 December 2024.
Aram, F., Higueras García, E., Solgi, E., and Mansournia S.: Urban green space cooling effect in cities, Heliyon, 5, e01339, https://doi.org/10.1016/j.heliyon.2019.e01339, 2019.
Barradas, V. L.: Air temperature and humidity and human comfort index of some city parks of Mexico City, Int. J. Biometeorol., 35, 24–28, https://doi.org/10.1007/BF01040959, 1991.
Basu, R. and Samet, J. M.: Relation between Elevated Ambient Temperature and Mortality: A Review of the Epidemiologic Evidence, Epidemiol. Rev., 24, 190–202, https://doi.org/10.1093/epirev/mxf007, 2002.
Barthelmie, R. J., Grisogono, B., and Pryor, S. C.: Observations and simulations of diurnal cycles of near-surface wind speeds over land and sea, J. Geophys. Res.-Atmos., 101, 21327–21337, https://doi.org/10.1029/96JD01520, 1996.
Dahech, S., Charfi, S., and Madelin, M.: Représentativité des températures mesurées dans la station météorologique Paris-Montsouris, Climatologie, 17, 5, https://doi.org/10.1051/climat/202017005, 2020.
Bowler D. E., Buyung-Ali, L., Knight, T. M., and Pullin, A. S.: Urban greening to cool towns and cities: A systematic review of the empirical evidence, Landscape and Urban Planning, 97, 147–155, https://doi.org/10.1016/j.landurbplan.2010.05.006, 2010.
Cai, X., Yang, J., Zhang, Y., Xiao, X., and Xia, J.: Cooling island effect in urban parks from the perspective of internal park landscape, Humanities and Social Sciences Communications, 10, 674, https://doi.org/10.1057/s41599-023-02209-5, 2023.
Chang, C. C., Li, M.-H., and Chang, S.-D.: A preliminary study on the local cool-island intensity of Taipei city parks, Landscape and Urban Planning, 80, 386–395, https://doi.org/10.1016/j.landurbplan.2006.09.005, 2007.
Céspedes, J., Kotthaus, S., Preissler, J., Toupoint, C., Thobois, L., Drouin, M.-A., Dupont, J.-C., Faucheux, A., and Haeffelin, M.: The Paris low-level jet during PANAME 2022 and its impact on the summertime urban heat island, Atmos. Chem. Phys., 24, 11477–11496, https://doi.org/10.5194/acp-24-11477-2024, 2024.
Doick K. J., Peace, A., and Hutchings, T. R.: The role of one large greenspace in mitigating London's nocturnal urban heat island, Sci. Total Environ., 493, 662–671, https://doi.org/10.1016/j.scitotenv.2014.06.048, 2014.
Forceville G., Lemonsu, A., Goria, S., Stempfelet, M., Host, S., Alessandrini, J-M., Cordeau, E., and Pascal, M.: Spatial contrasts and temporal changes in fine-scale heat exposure and vulnerability in the Paris region, Sci. Total Environ., 906, 167476, https://doi.org/10.1016/j.scitotenv.2023.167476, 2024.
Gao, Z., Zaitchik, B. F., Hou, Y., and Chen, W.: Toward park design optimization to mitigate the urban heat Island: Assessment of the cooling effect in five US cities, Sustain. Cities Soc., 81, 103870, https://doi.org/10.1016/j.scs.2022.103870, 2022.
Grimmond, C. S. B. and Oke, T. R.: Turbulent Heat Fluxes in Urban Areas: Observations and a Local-Scale Urban Meteorological Parameterization Scheme (LUMPS), J. Appl. Meteor. Climatol., 41, 792–810, https://doi.org/10.1175/1520-0450(2002)041<0792:THFIUA>2.0.CO;2, 2002.
Haeffelin, M., Barthès, L., Bock, O., Boitel, C., Bony, S., Bouniol, D., Chepfer, H., Chiriaco, M., Cuesta, J., Delanoë, J., Drobinski, P., Dufresne, J.-L., Flamant, C., Grall, M., Hodzic, A., Hourdin, F., Lapouge, F., Lemaître, Y., Mathieu, A., Morille, Y., Naud, C., Noël, V., O'Hirok, W., Pelon, J., Pietras, C., Protat, A., Romand, B., Scialom, G., and Vautard, R.: SIRTA, a ground-based atmospheric observatory for cloud and aerosol research, Ann. Geophys., 23, 253–275, https://doi.org/10.5194/angeo-23-253-2005, 2005.
Holmer, B., Thorsson, S., and Lindén, J.: Evening evapotranspirative cooling in relation to vegetation and urban geometry in the city of Ouagadougou, Burkina Faso, Int. J. Climatol., 33, 3089–3105, https://doi.org/10.1002/joc.3561, 2013.
Ibsen, P. C., Borowy, D., Dell, T., Greydanus, H., Gupta, N., Hondula, D. M., Meixner, T., Santelmann, M. V., Shiflett, S. A., Sukop, M. C., Swan, C. M., Talal, M. L., Valencia, M., Wright, M. K., and Jenerette, G. D.: Greater aridity increases the magnitude of urban nighttime vegetation-derived air cooling, Environ. Res. Lett., 16, 034011, https://doi.org/10.1088/1748-9326/abdf8a, 2021.
Keatinge, W. R., Donaldson, G. C., Cordioli, E., Martinelli, M., Kunst, A. E., Mackenbach, J. P., Nayha, S., and Vuori, I.: Heat related mortality in warm and cold regions of Europe: observational study, BMJ, 321, 670, https://doi.org/10.1136/bmj.321.7262.670, 2000.
Laj, P., Lund Myhre, C., Riffault, V., Amiridis, V., Fuchs, H., Eleftheriadis, K., Petäjä, T., Salameh, T., Kivekäs, N., Juurola, E., Saponaro, G., Philippin, S., Cornacchia, C., Alados Arboledas, L., Baars, H., Claude, A., De Mazière, M., Dils, B., Dufresne, M., Evangeliou, N., Favez, O., Fiebig, M., Haeffelin, M., Herrmann, H., Höhler, K., Illmann, N., Kreuter, A., Ludewig, E., Marinou, E., Möhler, O., Mona, L., Eder Murberg, L., Nicolae, D., Novelli, A., O’Connor, E., Ohneiser, K., Petracca Altieri, R. M., Picquet-Varrault, B., van Pinxteren, D., Pospichal, B., Putaud, J., Reimann, S., Siomos, N., Stachlewska, I., Tillmann, R., Voudouri, K. A., Wandinger, U., Wiedensohler, A., Apituley, A., Comerón, A., Gysel-Beer, M., Mihalopoulos, N., Nikolova, N., Pietruczuk, A., Sauvage, S., Sciare, J., Skov, H., Svendby, T., Swietlicki, E., Tonev, D., Vaughan, G., Zdimal, V., Baltensperger, U., Doussin, J., Kulmala, M., Pappalardo, G., Sorvari Sundet, S., and Vana, M.: Aerosol, Clouds and Trace Gases Research Infrastructure–ACTRIS, the European research infrastructure supporting atmospheric science, B. Am. Meteorol. Soc., 105, E1098–E1136, https://doi.org/10.1175/BAMS-D-23-0064.1, 2024.
Lemonsu, A., Belair, S., and Mailhot, J.: The New Canadian Urban Modelling System: Evaluation for Two Cases from the Joint Urban 2003 Oklahoma City Experiment, Bound.-Lay. Meteorol., 133, 47–70, https://doi.org/10.1007/s10546-009-9414-2, 2009.
Lemonsu, A., Viguié, V., Daniel, M., and Masson, V.: Vulnerability to heat waves: Impact of urban expansion scenarios on urban heat island and heat stress in Paris (France), Urban Climate, 14, 586–605, https://doi.org/10.1016/j.uclim.2015.10.007, 2015.
Lemonsu, A., Alessandrini, J.M., Capo, J., Claeys, M., Cordeau, E., de Munck, C., Dahech, S., Dupont, J.C., Dugay, F., Dupuis, V., Forceville, G., Garrigou, S., Garrouste, O., Goret, M., Goria, S., Haeffelin, M., Host, S., Joly, C., Keravec, P., Kotthaus, S., Laruelle, N., Madelin, M., Masson, V., Mauclair, C., Nagel, T., Pascal, M., Ribaud, J-F., Roberts, G., Rosso, A., Roy, A., Sabre, M., Sanchez, O., Stempfelet, M., Wei, W., Wilson, R., and Wurtz, J.: The heat and health in cities (H2C) project to support the prevention of extreme heat in cities, Climate Services, 100472, 2405–8807, https://doi.org/10.1016/j.cliser.2024.100472, 2024.
Lin, Y., Wang, C., Yan, J., Li, J., and He, S.: Observation and Simulation of Low-Level Jet Impacts on 3D Urban Heat Islands in Beijing: A Case Study, J. Atmos. Sci., 79, 2059–2073, https://doi.org/10.1175/JAS-D-21-0245.1, 2022.
Martilli, A.: Numerical Study of Urban Impact on Boundary Layer Structure: Sensitivity to Wind Speed, Urban Morphology, and Rural Soil Moisture, J. Appl. Meteor. Climatol., 41, 1247–1266, https://doi.org/10.1175/1520-0450(2002)041<1247:NSOUIO>2.0.CO;2, 2002.
Morris, C. J. G., Simmonds, I., and Plummer, N.: Quantification of the Influences of Wind and Cloud on the Nocturnal Urban Heat Island of a Large City, J. Appl. Meteor. Climatol., 40, 169–182, https://doi.org/10.1175/1520-0450(2001)040<0169:QOTIOW>2.0.CO;2, 2001.
Murage, P., Hajat, S., and Kovats, R. S.: Effect of night-time temperatures on cause and age-specific mortality in London, Environmental Epidemiology, 1, pe005, https://doi.org/10.1097/EE9.0000000000000005, 2017.
Oke, T.: Towards better scientific communication in urban climate, Theor. Appl. Climatol. 84, 179–190, https://doi.org/10.1007/s00704-005-0153-0, 2006.
Oke, T. R., Mills, G., Christen, A., and Voogt, J. A.: Urban climates, Cambridge University Press, https://doi.org/10.1017/9781139016476, 2017.
Pirard, P., Vandentorren, S., Pascal, M., Laaidi, K., Le Tertre, A., Cassadou, S., and Ledrans M.: Summary of the mortality impact assessment of the 2003 heat wave in France, Euro Surveill., 10, pii=554, https://doi.org/10.2807/esm.10.07.00554-en, 2005.
Royé, D., Sera, F., Tobías, A., Lowe, R., Gasparrini, A., Pascal, M., de'Donato, F., Nunes, B., and Teixeira, J. P.: Effects of Hot Nights on Mortality in Southern Europe, Epidemiology, 32, 487–498, https://doi.org/10.1097/EDE.0000000000001359, 2021.
Shashua-Bar, L. and Hoffman, M. E.: Vegetation as a climatic component in the design of an urban street: An empirical model for predicting the cooling effect of urban green areas with trees, Energ. Buildings, 31, 221–235, https://doi.org/10.1016/S0378-7788(99)00018-3, 2000.
Skoulika, F., Santamouris, M., Boemi, N., and Kolokotsa, D.: On the thermal characteristics and the mitigation potential of a medium size urban park in Athens, Greece, Landsc. Urban Plan., 123, 73–86, 2014.
Steeneveld, G. J., van de Wiel, B. J. H., and Holtslag, A. A. M.: Modeling the Evolution of the Atmospheric Boundary Layer Coupled to the Land Surface for Three Contrasting Nights in CASES-99, J. Atmos. Sci., 63, 920–935, https://doi.org/10.1175/JAS3654.1, 2006.
Steeneveld, G. J., Wokke, M. J. J., Groot Zwaaftink, C. D., Pijlman, S., Heusinkveld, B. G. Jacobs, A. F. G., and Holtslag, A. A. M.: Observations of the radiation divergence in the surface layer and its implication for its parameterization in numerical weather prediction models, J. Geophys. Res., 115, D06107, https://doi.org/10.1029/2009JD013074, 2010.
Stewart, I. D. and T. R. Oke: Local Climate Zones for Urban Temperature Studies, Bull. Amer. Meteor. Soc., 93, 1879–1900, https://doi.org/10.1175/BAMS-D-11-00019.1, 2012.
Taha, H., Akbari, H., and Rosenfeld, A.: Heat island and oasis effects of vegetative canopies: Micro-meteorological field-measurements, Theor. Appl. Climatol., 44, 123–138, https://doi.org/10.1007/BF00867999, 1991.
Tsiringakis, A., Theeuwes, N. E., Barlow, J. F., and Steeneveld, G.-J.: Interactions Between the Nocturnal Low-Level Jets and the Urban Boundary Layer: A Case Study over London, Bound.-Lay. Meteorol., 183, 249–272, https://doi.org/10.1007/s10546-021-00681-7, 2022.
von Rohden, C., Sommer, M., Naebert, T., Motuz, V., and Dirksen, R. J.: Laboratory characterisation of the radiation temperature error of radiosondes and its application to the GRUAN data processing for the Vaisala RS41, Atmos. Meas. Tech., 15, 383–405, https://doi.org/10.5194/amt-15-383-2022, 2022.
Zhu, W., Sun, J., Yang, C., Liu, M., Xu, X., and Ji, C.: How to Measure the Urban Park Cooling Island? A Perspective of Absolute and Relative Indicators Using Remote Sensing and Buffer Analysis, Remote Sens., 13, 3154, https://doi.org/10.3390/rs13163154, 2021.
- Abstract
- Introduction
- Data and methodologies
- Urban park cooling effect in relation to regional-scale UHI
- Evening cooling in and above urban parks and urban woods
- Characteristics and impacts of turbulence regimes
- Conclusions
- Appendix A: Windsond temperature profiles assessment
- Data availability
- Author contributions
- Competing interests
- Disclaimer
- Acknowledgements
- Financial support
- Review statement
- References


