the Creative Commons Attribution 4.0 License.
the Creative Commons Attribution 4.0 License.
 | 05 Jan 2024
Introducing the novel concept of cumulative concentration roses for studying the transport of ultrafine particles from an airport to adjacent residential areas
Julius Seidler
Markus N. Friedrich
Christoph K. Thomas
Anke C. Nölscher
Airports are often surrounded by urban residential areas, which is both a motivation and challenge for studying their potential impact on local air quality. Airports are a relevant source of ultrafine particles (UFPs), which can pose a risk to human health due to their small size (particle diameter Dp≤100 nm). However, in urban environments, UFPs originate from a multitude of biogenic and anthropogenic sources. Here, we investigate UFPs in close proximity to an airport to disentangle their impact on local air quality from other urban sources.
We present observations and analyses of airborne UFP concentrations and size distributions determined at two sites in close proximity to Munich Airport. Therefore, two novel measurement stations were established north and south of the airport but were neither situated on the axis of prevailing wind directions nor impacted by fly overs. This set-up allowed us to explore a mainly advection-driven distribution of UFPs into the most populated adjacent residential areas. The observation period covered a full year from August 2021 to July 2022. We analysed the data set in three steps. (1) First, we derived UFP concentration roses using the wind data as reported at 10 m height at the airport to represent the local wind field. An increase in particle number concentrations and a shift of the modal maximum towards smaller mobility diameters became evident for wind directions, including those approaching from the airport. During the airport's operation hours during the daytime, median particle number concentrations were 2.2- and 1.6-fold compared to nighttime at the northern station and the southern station. However, our data had a high variability, and the direction-based analysis was uncertain due to other potential UFP sources in the surroundings and the assumption of a homogeneous, local wind field. (2) Next, we derived concentration roses employing the airflow observations from the two measuring stations at 5.3 m height. While the annual concentration rose in principle yielded the same conclusions as the first analysis step, a significant seasonal and diurnal variability of UFPs and wind became evident. The influencing factors were likely other urban local UFP sources, an increased surface roughness due to green vegetation, and the atmospheric boundary layer development. (3) In order to assess the possible advection of UFPs from the direction of Munich Airport relative to all other directions over the course of the year, we calculated cumulative concentration roses with both local- and site-scale wind data. Under the assumption of a homogeneous local wind field, the fraction of all UFPs sampled in airflows approaching from the airport's direction was 21 % (N322) and 40 % (S229). Considering a local background, the range of UFP advection from Munich Airport to the adjacent residential areas was up to 10 % in the north and 14 % in the south. It has to be noted that these values highlight the relative magnitude of the maximum impact of the airport on local air quality as they do not distinguish between UFP sources from the airport and other measuring sites. Additionally, they integrate over a time period during which the airport did not reach its full capacity compared to pre-COVID-19 times.
- Article
(10521 KB) - Full-text XML
-
Supplement
(3045 KB) - BibTeX
- EndNote


Airports are a source of airborne ultrafine particles (UFPs). However, their net source function and impact on the local air quality of adjacent residential areas is not well understood. In particular, the emission and dispersion of UFPs in the atmosphere became a recent research focus as their small size (particle diameter Dp≤100 nm) enables them to enter the alveoli inside the lungs, pass on to the blood circulatory system, and maybe even reach the nervous system across the blood–brain barrier. Aspirated UFPs are a potential risk to human health depending on their atmospheric number concentration, size, surface characteristics, and chemical composition (e.g. Ohlwein et al., 2018; Schraufnagel, 2020; Bendtsen et al., 2021).
Generally, UFPs can be of biogenic and/or anthropogenic origins. Their atmospheric fate is naturally of importance to weather and climate, for example by serving as cloud condensation nuclei or through their interaction with incoming solar radiation. As UFPs typically dominate the atmospheric particle concentration in number, the total particle number concentration can be used as a proxy to assess their number concentrations. In the lowermost atmosphere, typical annual means of total particle number concentrations occur between a few thousand (Finish rural site) and several tens of thousands of particles per cubic centimetre (London roadside) (e.g. von Bismarck-Osten et al., 2013; Jesus et al., 2019). Their particle size distribution exhibits a characteristic maximum in the nucleation mode or the Aitken mode, depending on the type of nearby sources. These sources can be primary, such as from transportation and heat and energy production, or secondary, such as from the nucleation of biogenic and anthropogenic gas-phase precursors. Furthermore, the surrounding topography; land use; vegetation type; atmospheric state, including near-surface air flow; atmospheric stability; temperature; humidity; solar radiative forcing; and oxidative capacity determine how UFPs are mixed, transported, and aged (Riffault et al., 2015; Oke et al., 2017; Sun et al., 2019; Trebs et al., 2023). The airborne mixture of UFPs is thus highly variable in space and time since all of these factors play a role in the size, composition, morphology, and number concentration.
At airports, the sources of airborne UFPs are thought to be due to ground-based processes and to aviation itself. Auxiliary power units, traffic, and aeroplane taxiing take place on the ground (Masiol and Harrison, 2014), whereas the incomplete combustion of jet fuels or jet engine lubrication oils potentially leads to UFP release upon take-off in the air (Fushimi et al., 2019; Ungeheuer et al., 2022). During take-off and approach in particular, wing tip vortices might enhance the dispersion of UFPs from very low altitudes towards the ground (Graham and Raper, 2006; Westerdahl et al., 2008; Hudda et al., 2020). As airports are typically situated in urban or sub-urban environments with a dense transportation infrastructure, they cannot be viewed as an isolated point source. Disentangling the prevalent UFP sources and transport processes from their impact on adjacent residential areas has thus been the focus of airport-related air quality studies worldwide. Despite heterogeneous study designs, instrumentation, and airport layouts, these studies consistently showed generally increased particle number concentrations of UFPs for cases of advection from the airport to the surrounding areas, for example in Los Angeles, Boston, London, Seattle, Narita, Amsterdam, Zurich, Lisbon, and Frankfurt (Westerdahl et al., 2008; Zhu et al., 2011; Hudda et al., 2014; Herndon et al., 2005; Austin et al., 2021; Fushimi et al., 2019; Keuken et al., 2015; Lammers et al., 2020; Lopes et al., 2019; Ungeheuer et al., 2021, 2022).
The first evidence of airports being a potential source of UFPs arose from ambient observations made in Boston and Los Angeles. The particle number concentrations a few hundred metres downwind of the airport were unexpectedly larger compared to upwind, with a high variability in diameter and compositions (Herndon et al., 2005; Westerdahl et al., 2008). In the case of Los Angeles International Airport, particles with diameters of less than 600 nm had mean background concentrations of 2500 cm−3 on the seaside of the airport (Westerdahl et al., 2008). About 500 m downwind of the airport inland, the number concentration rose to a mean of 50 000 cm−3. The modal maximum was observed for particles with mobility diameters from 10 to 15 nm. Further studies examined the association between departing aeroplanes and airborne UFP number concentrations in close proximity to departure runways (e.g. Hsu et al., 2013; Zhu et al., 2011). For example, Yu et al. (2019) calculated that aviation contributed about 7 % to the ultrafine particulate matter in downtown Los Angeles next to other regional sources such as the consumption of natural gas, on-road traffic, and cooking. However, the model was too coarse to resolve finer spatial scale variations in residential areas in close proximity to the airport.
Combining ground-based observations and modelling, particle mass and number concentrations were calculated for the surroundings of Zurich Airport using a Lagrangian dispersion model and mesoscale weather conditions (Zhang et al., 2020). The annual particulate mass concentrations increased only by 1 % due to aviation particles in most studied nearby locations. The background levels of particle number concentrations were increased by a factor of about 2 to 10, with annual mean number concentrations ranging from 10 000 to 100 000 cm−3 in nearby communities within a 2 km distance from the airport and up to 1000 cm−3 in communities that were located more than 4 km from the airport.
Increased particle number concentrations were also observed at greater distances, for example 40 km from the airport Schiphol Amsterdam (Keuken et al., 2015). The mean annual particle number concentration was 9600 cm−3, showing an increase of about a factor of 3 when the wind was from the airport. Similarly, for the nearer surroundings (0 to 10 km) of Frankfurt Airport, an advection of UFPs was described. Generally, the particle number concentration rose for particles with diameters of 10 nm ≤ Dp ≤ 500 nm, and the size distribution showed a maximum for particles with diameters of Dp ≤ 30 nm when the wind arrived from the direction of the airport during its operating hours (Ditas et al., 2022). In Raunheim, a residential area within about 5 km distance from the airport, the total and airport-impacted mean number concentrations were 8600 cm−3 and 15 090 cm−3, respectively. These numbers were obtained before the COVID-19 pandemic times and were compared to periods of reduced airport activities during the COVID-19 pandemic. The mean number concentrations were 7990 cm−3 in total and 11 040 cm−3 when the wind direction was in the direction of the airport. Thus, at the location, the reduced airport operations led to a decline of up to 30 % in recorded mean particle number concentrations.
Very recently, close to London Gatwick Airport, size-resolved sub-micron particle observations were combined with positive matrix factorisation to explore the factors contributing to particle number concentrations measured in the air at two stations, with potential impacts by both ground-based and aviation traffic. Here, ambient particles were characterised by mean campaign concentrations of 7500 to 12 000 cm−3 and a peaking mode at mobility diameters of about 18 to 20 nm. The airport contributed to the measured number concentration with a calculated fraction of about 17 %. However, at the two locations, more than 50 % of the detected particles originated from other traffic sources (Tremper et al., 2022).
Furthermore, a spike in the mean diurnal cycles of airborne UFP number concentrations with the start of airport activities at Luxembourg Findel Airport was observed (Trebs et al., 2023). Here, a substantial fraction was attributed to nucleation-mode particles (1 nm ≤ Dp ≤ 30 nm), hinting at an airport contribution rather than from the on-road rush-hour traffic. However, despite frequent flight activities during the day, mean UFP concentrations declined until the afternoon and increased again during the night. This diurnal variability was explained by characteristic turbulent mixing within the daytime atmospheric boundary layer and the formation of a shallow stable nocturnal boundary layer, which either dilute or concentrate any UFPs emitted into the atmosphere.
This list of studies is not exhaustive but provides examples of the assessment of the impact of airport-released UFPs on local air quality in adjacent residential areas. Despite a great heterogeneity, it is commonly suggested that the distribution of UFPs in the local environment is particularly driven by advection and the airports' states of operation (e.g. time of day, number of flights per time, prevailing direction of departure). However, the underlying processes are generally masked by the local concert of UFP sources and atmospheric effects on their transport, such as boundary layer development or the near-surface wind field.
Here, we present a study that addresses the aforementioned uncertainties via three steps analysing the spatial and temporal variations of UFPs and wind data for two residential areas adjacent to Munich Airport for the time period of 1 year. Unlike most previous studies, we conducted simultaneous observations of airborne particle size distributions in two residential areas which were in close proximity to the airport but were neither downwind or upwind in terms of the prevalent wind directions nor within fly-over areas (Fig. 1). Hence, we expect the sole contribution of the airport to the local air quality to be in terms of UFPs via advection from sources related to ground-based operations and take-offs or landings of aeroplanes. This novel set-up allowed us to assess
-
the overall potential impact of the airport on air quality in adjacent residential areas, testing the abovementioned view of linear advection via the annual statistics of UFP concentrations and particle size distributions with respect to wind measured at the airport at about 10 m height above ground level, representing the local wind distribution;
-
the site-specific spatio-temporal characteristics of this impact, analysing the seasonal and diurnal variations of UFP concentrations with respect to wind measured at the measurement site at 5.3 m height above ground level; and
-
the upper and lower limits of potential UFP advection from Munich Airport into the adjacent residential areas, comparing local and site-specific wind data with cumulative UFPs for the time period of 1 year.
With the aim of studying the potential effects of UFPs originating from Munich Airport on the residential areas in nearest proximity to the airport, measurement stations were established at two sites for atmospheric observations north and south of the airport. Data and analyses reported here cover a period of 1 year from August 2021 to July 2022.
2.1 Munich Airport as study site
Munich Airport is located about 14 km north-northeast of Munich. The location can be described as rural as the surroundings are mostly for agricultural use or are natural protected areas. The cities in closest proximity are Freising to the north (about 48 900 inhabitants) and Hallbergmoos to the south (about 11 100 inhabitants).
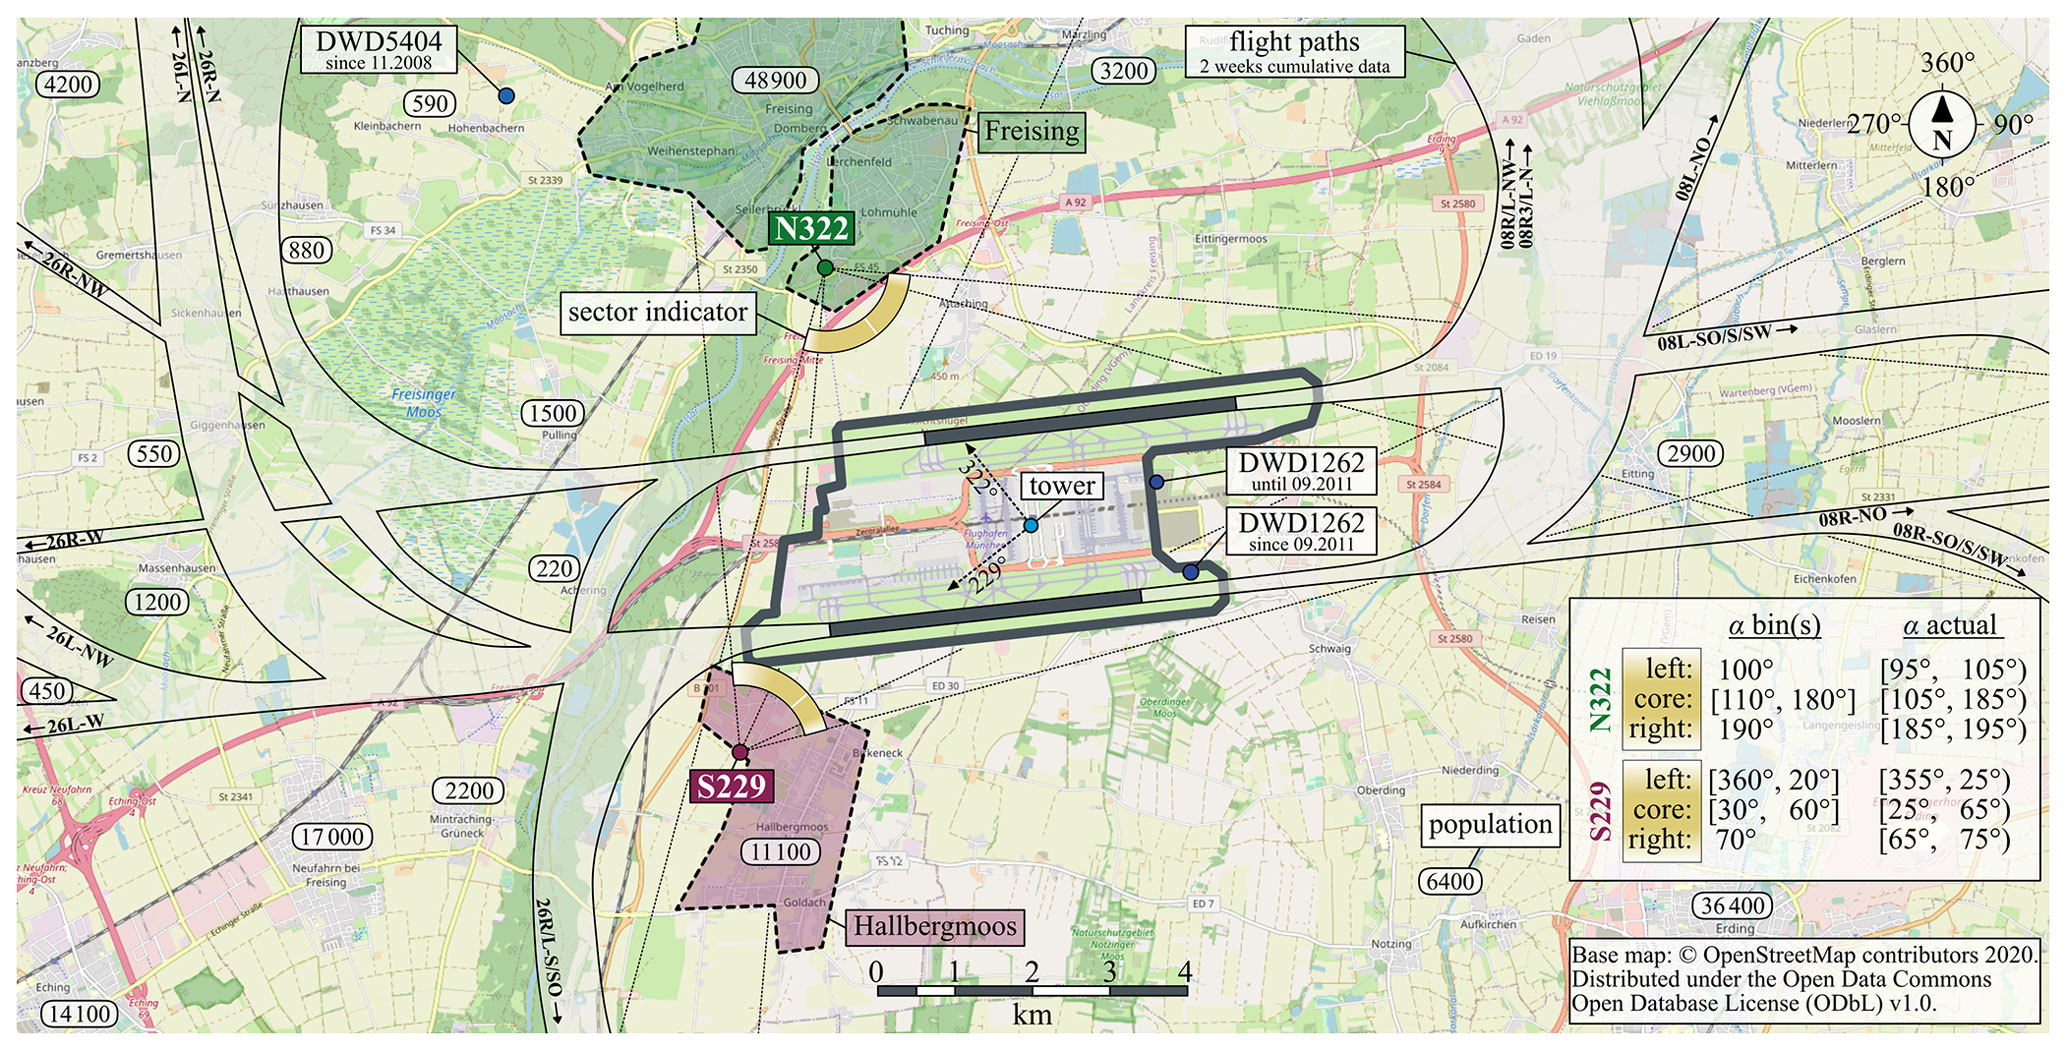
Figure 1Map section of the premises of Munich Airport and its surroundings, with the two measuring sites N322 to the north in Freising and S229 to the south in Hallbergmoos. Transparent polygons roughly mark the two populated city areas. Whitish areas mark cumulative flight paths, with labels giving official corridor identifiers. The airport sector is indicated as a yellowish arc. The table insert shows both sites' sector definitions, with values of the 10∘ bins and the actual wind directions α that are covered by each sector part.
The airport has two parallel runways that face east–west, with a slight tilt of about −10∘ (see Fig. 1). The runway orientation is 84∘/264∘ and falls on the axis of the two dominant wind directions. Both runways can be operated at the same time, alternating between landing and take-off. For the 3 years preceding the COVID-19 pandemic, the 24 h mean was one flight per minute. Each landing or take-off is counted as one flight. We describe the geographical centre of Munich Airport by the location of its tower (48.352992∘ N, 11.785936∘ E), which is slightly shifted from the geometrical centre of the airport premises at an elevation of 450 m above mean sea level. Parking at Munich Airport spreads across multiple parking areas on the premises of the airport and is not incorporated into a single large-scale car park.
In the pre-COVID-19 pandemic years of 2017 to 2019, Munich Airport handled from 44 to 48 million passengers per year, ranked second in Germany behind Frankfurt Airport. This ranking persisted throughout the years 2020 and 2021, which were affected by the COVID-19 pandemic (ADV, 2018, 2019, 2020, 2021, 2022). During these 2 years, 11.1 million and 12.5 million passengers were handled at Munich Airport. The pandemic restrictions, as well as seasonal fluctuations, resulted in 17 778 flights being recorded in August 2021, which is the start of the observations reported here. Cumulative flight paths were created with 2 weeks of pre-COVID-19 pandemic data from 2020, shown in Fig. 1. The data were obtained from the German air navigation service provider Deutsche Flugsicherung (DFS) through their web application STANLY_TRACK3.
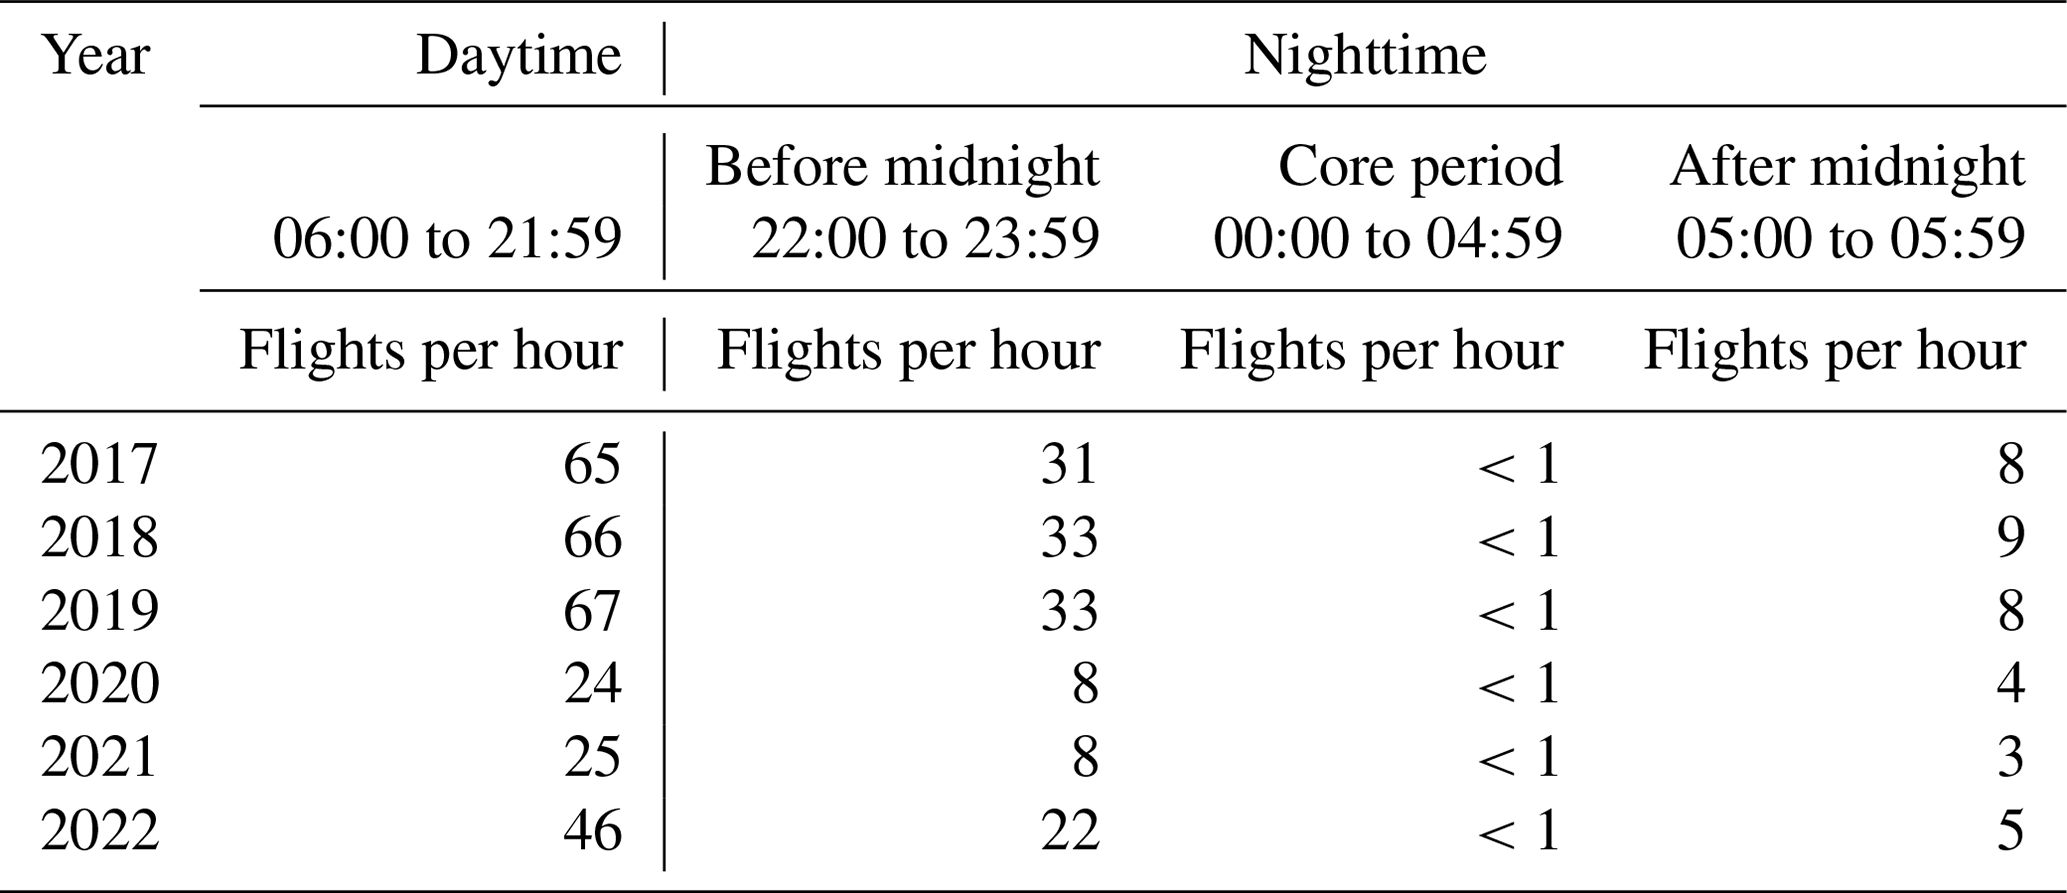
Munich Airport is subject to night flight restrictions during the nighttime from 22:00 to 05:59. This includes a ban on flights in the so-called core period from 00:00 to 04:59. Based on this data, we here define daytime as the time period with airport activity from 05:00 to 23:59 as opposed to nighttime, the period without airport activity, from 00:00 to 04:59.
Table 1Annual mean flights per hour depending on time of day for the three pre-COVID-19 years of 2017 to 2019 and the two years of 2021 and 2022 that include the time period covered by this study. Own calculations; data obtained from annual night flight reports by Flughafen München GmbH for the respective years. Flights per hour are rounded to full flights, except for values less than 1, which are indicated as <1.
2.2 The two measuring sites
The two measuring sites were to the north in Freising (site N322; 48.38237∘ N, 11.75161∘ E) and to the south in Hallbergmoos (site S229; 48.32526∘ N, 11.73778∘ E). We use the airport and its tower as a geographical reference point in its surroundings. The measuring sites are identified from the tower's point of view by giving the corresponding cardinal direction and adding the angle in degrees, rounded to full degrees (see Fig. 1). Site N322 and site S229 have the shortest site-to-runway distances of 2.5 and 2.0 km, respectively. The direct distance between both sites is 6.4 km. Based on the flight corridors assigned by the DFS for approaching and starting planes, neither of the two stations experiences fly-overs during regular operation (see cumulative tracks in Fig. 1). In order to allow free advection from all wind directions, the locations for both sites were chosen to be as open as possible. Still, due to their positioning within the city areas, both sites are potentially influenced by their closer surroundings.
Site N322 to the north is located within the southern urban area of Freising on the premises of a city gardener and is 444 m above mean sea level. In close proximity, only low-frequency traffic from the gardener's activities is expected. The surroundings are characterised by non-manufacturing business parks about 60 m distance to the northeast and about 200 m distance to the south and southeast; a highway at about 490 m distance; and the highway'’s feeder spanning from south to southeast at about 50 m distance. In that direction, at about 35 m distance, a single row of trees and shrubs (max. 6 m in height) borders the premises of the city gardener. A small meadow with tree heights of about 20 m is located about 50 m to the west. From about 250 m to the north and northeast, residential areas begin to predominate (see Fig. S5a and c in the Supplement).
Site S229 to the south is placed in a wide, open space west of the city Hallbergmoos and is 456 m above mean sea level. To the east and northeast, residential areas are located at about 300 m distance. When looking north in the airport's direction, a single row of young trees and shrubs spans from 310 to 110∘. The shortest distance to S229 is about 12 m. The tree heights vary (about 6 m), depending on season. In the same direction, a non-manufacturing business park is situated between the southern runway and site S229 at about 250 m distance, along with an automobile-manufacturing plant. The surroundings in westerly directions are mostly under agricultural use but are crossed by federal highway B301 in a north–south direction. Overall, site S229 can be considered to be under less road traffic influence than N322 (see Fig. S5b and d).
2.3 Experimental set-up
At both sites, identical laboratory containers are operated as measuring stations. These containers house the instrumentation for determining the particle size distribution in the ultrafine range and for monitoring meteorological conditions. The containers are climatised and set to 23 ∘C (room temperature); the annual mean atmospheric air pressure is 965 mbar.
Meteorological data, including wind speed and direction, were measured by a compact weather sensor (Lufft, WS700-UMB). The sensor was mounted on top of an aluminium pole, placing the sensor 2.2 m above the container roof and 5.3 m above ground level at the container corner farthest from the PM10 inlet (see below). The weather sensors were mounted with a deviation of a maximum of 10∘ to the north. The remaining deviation was corrected by continuous position monitoring by the sensor's built-in compass. The local declination was calculated to be 3∘ during the observation period covered in this study and was accounted for.
From outside the container, air is probed via a PM10 inlet (R&P, RP57-000596), designed for 16.7 L min−1. The PM10 inlet allows undisturbed sampling of air with particles with aerodynamic diameters less than 10 µm at a height of 1.1 m above the container roof and 4.2 m above ground level. The inlet is maintained at an overall flow rate of 16.7 L min−1 and is connected to an isokinetic flow splitter (Dockweiler, MB6709) inside the container by seamless stainless-steel tubing (1.25 in × 0.065 in). From the flow splitter, a sub-stream of air passes a 3/8 in membrane dryer (TROPOS, 300 mm Nafion dryer) and is then connected to the inlet of a mobility particle size spectrometer (MPSS) by conductive silicone tubing (TSI, 3001788). The overall distance passed by the probed air from the PM10 inlet to the MPSS inlet is about 3.1 m, and this results in a residence time of about 7 s.
Particle size distributions were measured with the MPSS (TROPOS). Each MPSS was equipped with a modified Hauke-type medium differential mobility analyser (DMA) and a 370 MBq neutraliser with 85Kr (Eckert and Ziegler Cesio, NER 8275). In each MPSS, a European Committee for Standardization (CEN)-certified condensation particle counter (CPC) with a diameter for 50 % counting efficiency nm was used (TSI, 3750). A full scan over the mobility diameter range of 10 to 800 nm took 5 min and combined one up scan and one down scan, each with a resolution of 71 bins, 43 of which covered the mobility diameters from 10 to 100 nm. The nominal aerosol flow rate through the MPSS was 1 L min−1. The aerosol to sheath air flow rate ratio was 1:5. All membrane dryers were operated in countercurrent flow using particle-free and dry pressurised air.
For operation and maintenance of the MPSS, we followed standard protocols as, for example, established by Wiedensohler et al. (2012). Every 3 to 4 weeks, the MPSS was calibrated with a latex standard (203 (4) nm, Thermo Scientific, 3200A) to check sizing accuracy, sheath air flow, and plumbing time; high-voltage output and flows were evaluated and re-adjusted if necessary. Checking zero air and flow was performed for both the MPSS and CPC separately.
2.4 Wind data
Meteorological conditions at the airport have been continuously monitored by the German Weather Service (Deutscher Wetterdienst, DWD) since 1992, with a minor relocation of the monitoring station DWD1262 on the airport premises by about 1 km in September 2011 to its current location (445 m above mean sea level; 48.34771∘ N, 11.81338∘ E). The 10-year mean from 2010 to 2019 (see Fig. S1) has two maxima in the directions of west and east, highlighting the two dominant wind directions, which occur 41 % and 26 % of the time, respectively. Calm conditions with wind speeds <0.3 m s−1 were observed 2.2 % of the time. The wind rose within the herein-reported observation period was generally similar to the 10-year mean, with westerly and easterly winds occurring 43 % and 22 % of the time and with calm condition 1.1 % of the time (Figs. 2 and S1). The DWD operates another monitoring station DWD5404 in Weihenstephan-Dürnast, about 10.7 km northwest of DWD1262 (477 m above mean sea level; 48.40253∘ N, 11.69457∘ E). Despite their differences in distance and altitude, the west–east pattern observed for DWD1262 is also found at DWD5404. The DWD reports wind data based on a wind rose with 36 bins ranging from 10 to 360∘. The actual bin width is −5.0/+4.9∘. Calm conditions are set to 0∘.
Here, we use the airport's wind data (DWD1262) as reference and representation for the local wind field. As we have wind data from our measuring sites as well, we can explore the effect of the site-specific, micro-scale wind field for comparison. At each site, the station's wind data are retrieved in close proximity to the particle sampling at 5.3 m height. Due to a shifted start of the meteorological observations, this data set is only complete for November 2021 to July 2022. We handled our data according to the standards of the DWD, using the same 36 bins and reporting calm conditions in the centre of each wind rose (see Fig. 2). The meteorological data measured at the measuring sites N322 and S229 are processed according to DWD quality guidelines (Lanzinger et al., 2021).
Based on the wind direction binning, we defined a sector for each site that is considered to be under potential airport influence when assuming linear advection. The sector is made of a core covering the projected width of the runways for each site but without leaving the airport premises. The left and right sector parts include the wind direction bins needed to cover the remaining area of the airport premises completely. A schematic representation and the resulting sectors are included in Fig. 1.
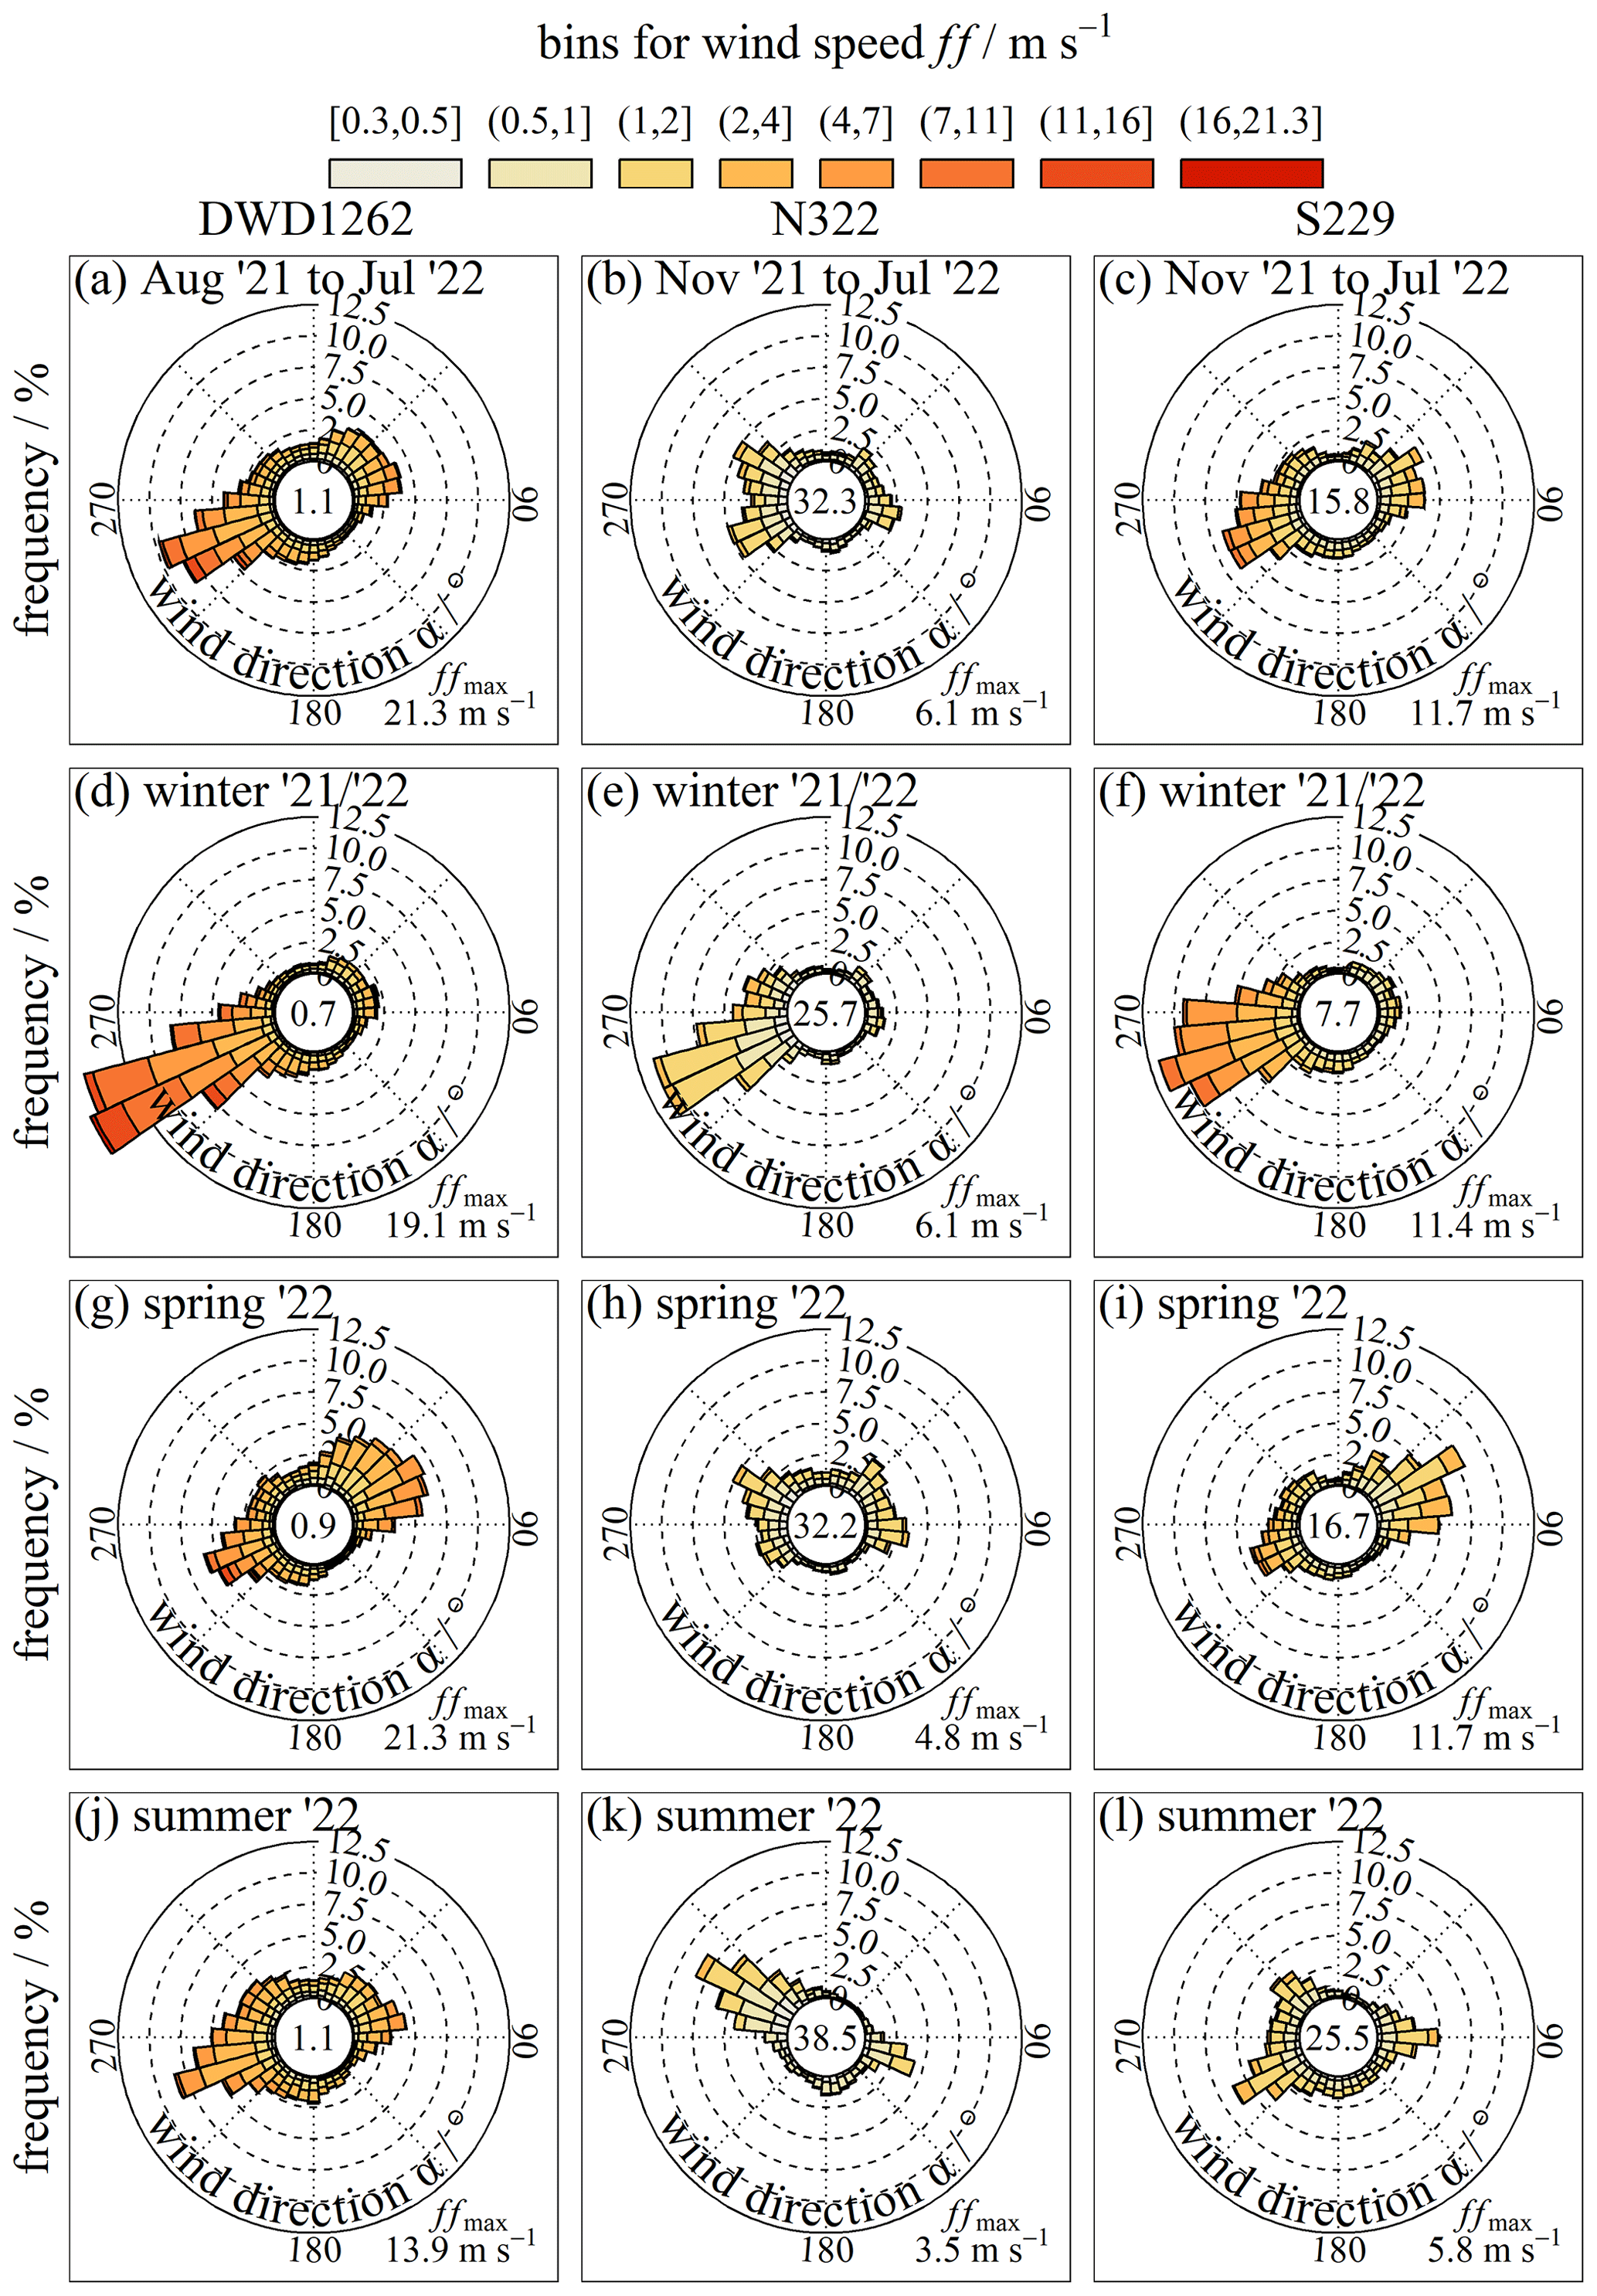
Figure 2Wind roses based on local-scale wind data from DWD1262 (source is the DWD) (a, d, g, j) and site-scale wind data from sites N322 (b, e, h, k) and S229 (c, f, i, l) for the period of this study (a, b, c) and the three seasons covered by it (winter 2021/2022, spring 2022, summer 2022). The bottom-right corner gives the maximum wind speed observed for each data set. Center values denote the frequency of the claims. Autumn is not shown due to missing site-scale data – see Sect. 2.4.
2.5 Data processing and analysis
When post-processing the MPSS data, we followed standard protocols as, for example, established by Wiedensohler et al. (2012), with inversion from particle mobility to particle number size distributions via bin width normalisation and multiple-charge correction. The data were corrected for the particle losses considering the equivalent lengths and individual flow rates of all flow-through components from the PM10 inlet to the CPC inside the MPSS. Further, the data were corrected for internal losses due to diffusion and the individual CPC counting efficiency. In accordance with Aerosol, Clouds and Trace Gases Research Infrastructure (ACTRIS) calibration standards from intercomparison workshops in December 2020 and March 2023, the overall uncertainty is ±10 %.
With regard to particle number concentrations, size distributions, and modal particle diameters, we note the following. All particle number concentrations in this study are reported non-normalised as N and not as normalised (logDp). The unit is particles per centimetre cubed ([N] = cm−3). The MPSS recorded particle size distributions, which can be used to assess various characteristics of the ambient aerosol (see Fig. 3). Firstly, we determined the number concentration of all particles between the mobility diameters 10 to 800 nm, with this being N800. The UFP number concentration, being N100, was derived from the interval of mobility diameters between 10 to 100 nm. Secondly, the MPSS particle size distribution was used to derive the modal particle diameter.
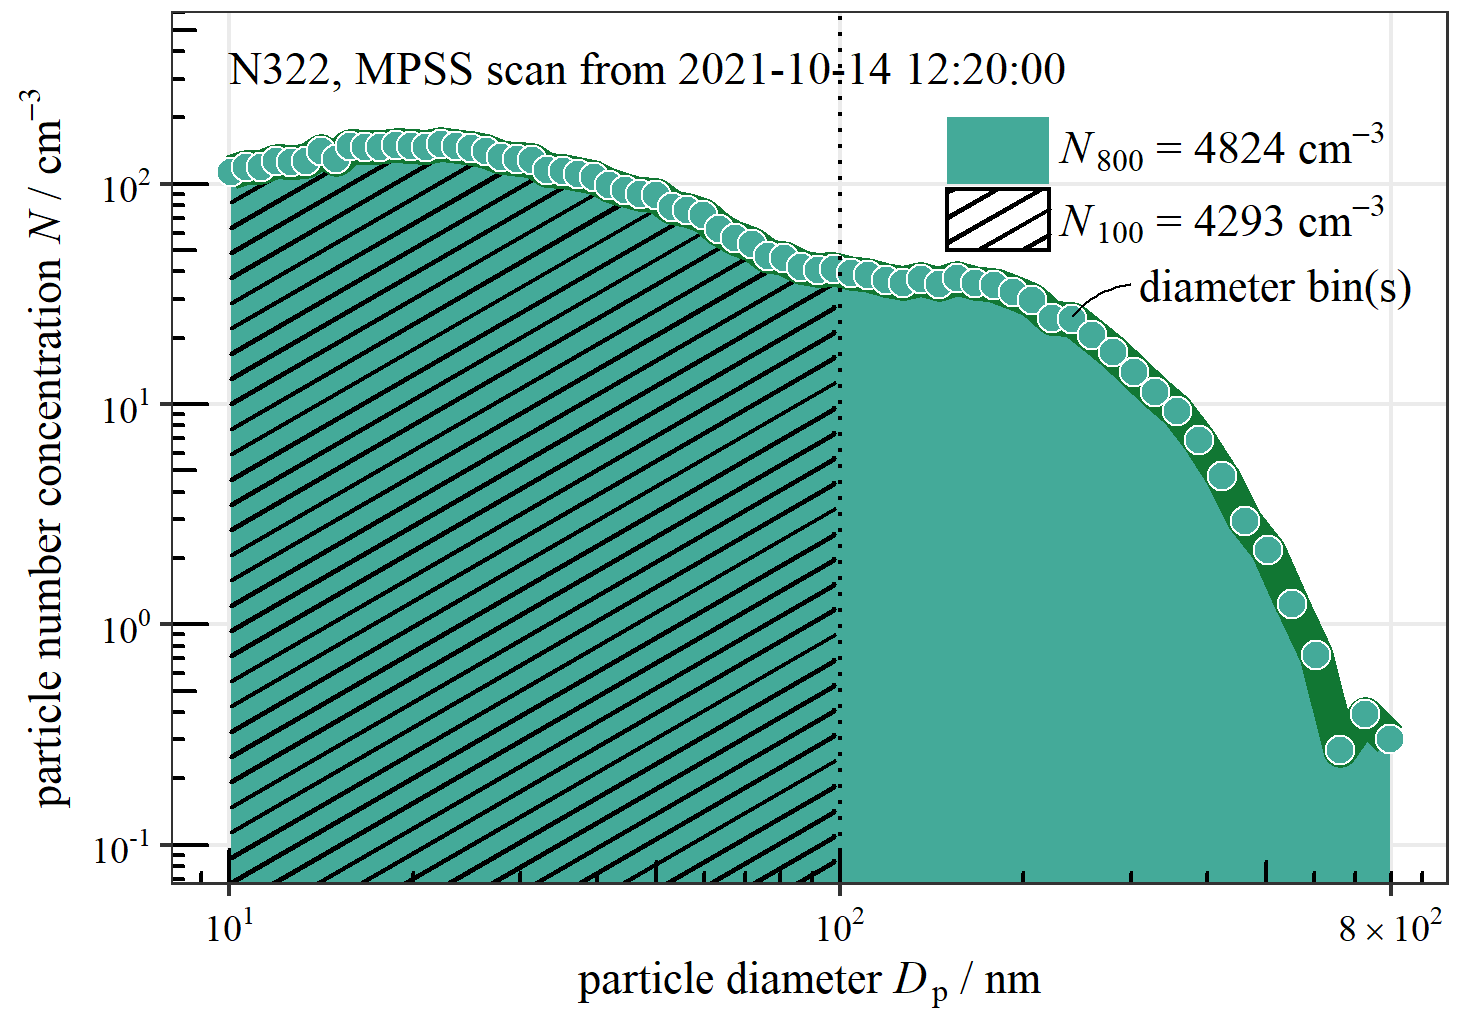
Figure 3Single MPSS scan from site N322 for the period of this study over the particle mobility diameter range of 10 to 800 nm. Diameter bins are marked at their midpoints. The coloured and hatched areas represent the integrated ranges for calculating N800 and N100 from N.
In terms of expressing uncertainty, if not stated otherwise, we express the uncertainty of the mean of measurements as the standard deviation, noted as mean (standard deviation). The relative standard deviation or the coefficient of variation cv is the ratio of the standard deviation to the mean and is reported as [cv] = %.
With regard to date and time, all dates and times are reported as local time, which means either CET (UTC+01) or CEST (UTC+02), depending on the actual date–time pair.
With regard to annual and seasonal statistics, these are reported here as means with the standard deviation, as median values, and as the interquartile range (i.e. the distance between the 25th and 75th percentiles). The statistical distribution of the particle number concentrations is non-Gaussian, which can be seen from Fig. 4. Thus, the mean is increased by the extremes in the analysed data set, and we present the median as well. The median is an adequate measure to describe the statistical distribution and the typical particle concentrations throughout the year or the seasons. For the latter, the meteorological definition of the season was used, with the start of spring being on 1 March, the start of summer being on 1 June, the start of autumn being on 1 September, and the start of winter being on 1 December. Due to the missing meteorological data in autumn, only winter, spring, and summer have been analysed in detail for the site-scale view. Note that, when reporting values for summer 2022, this covers only the first 2 months, June and July, but not August (see also Figs. 10 and S3–5).
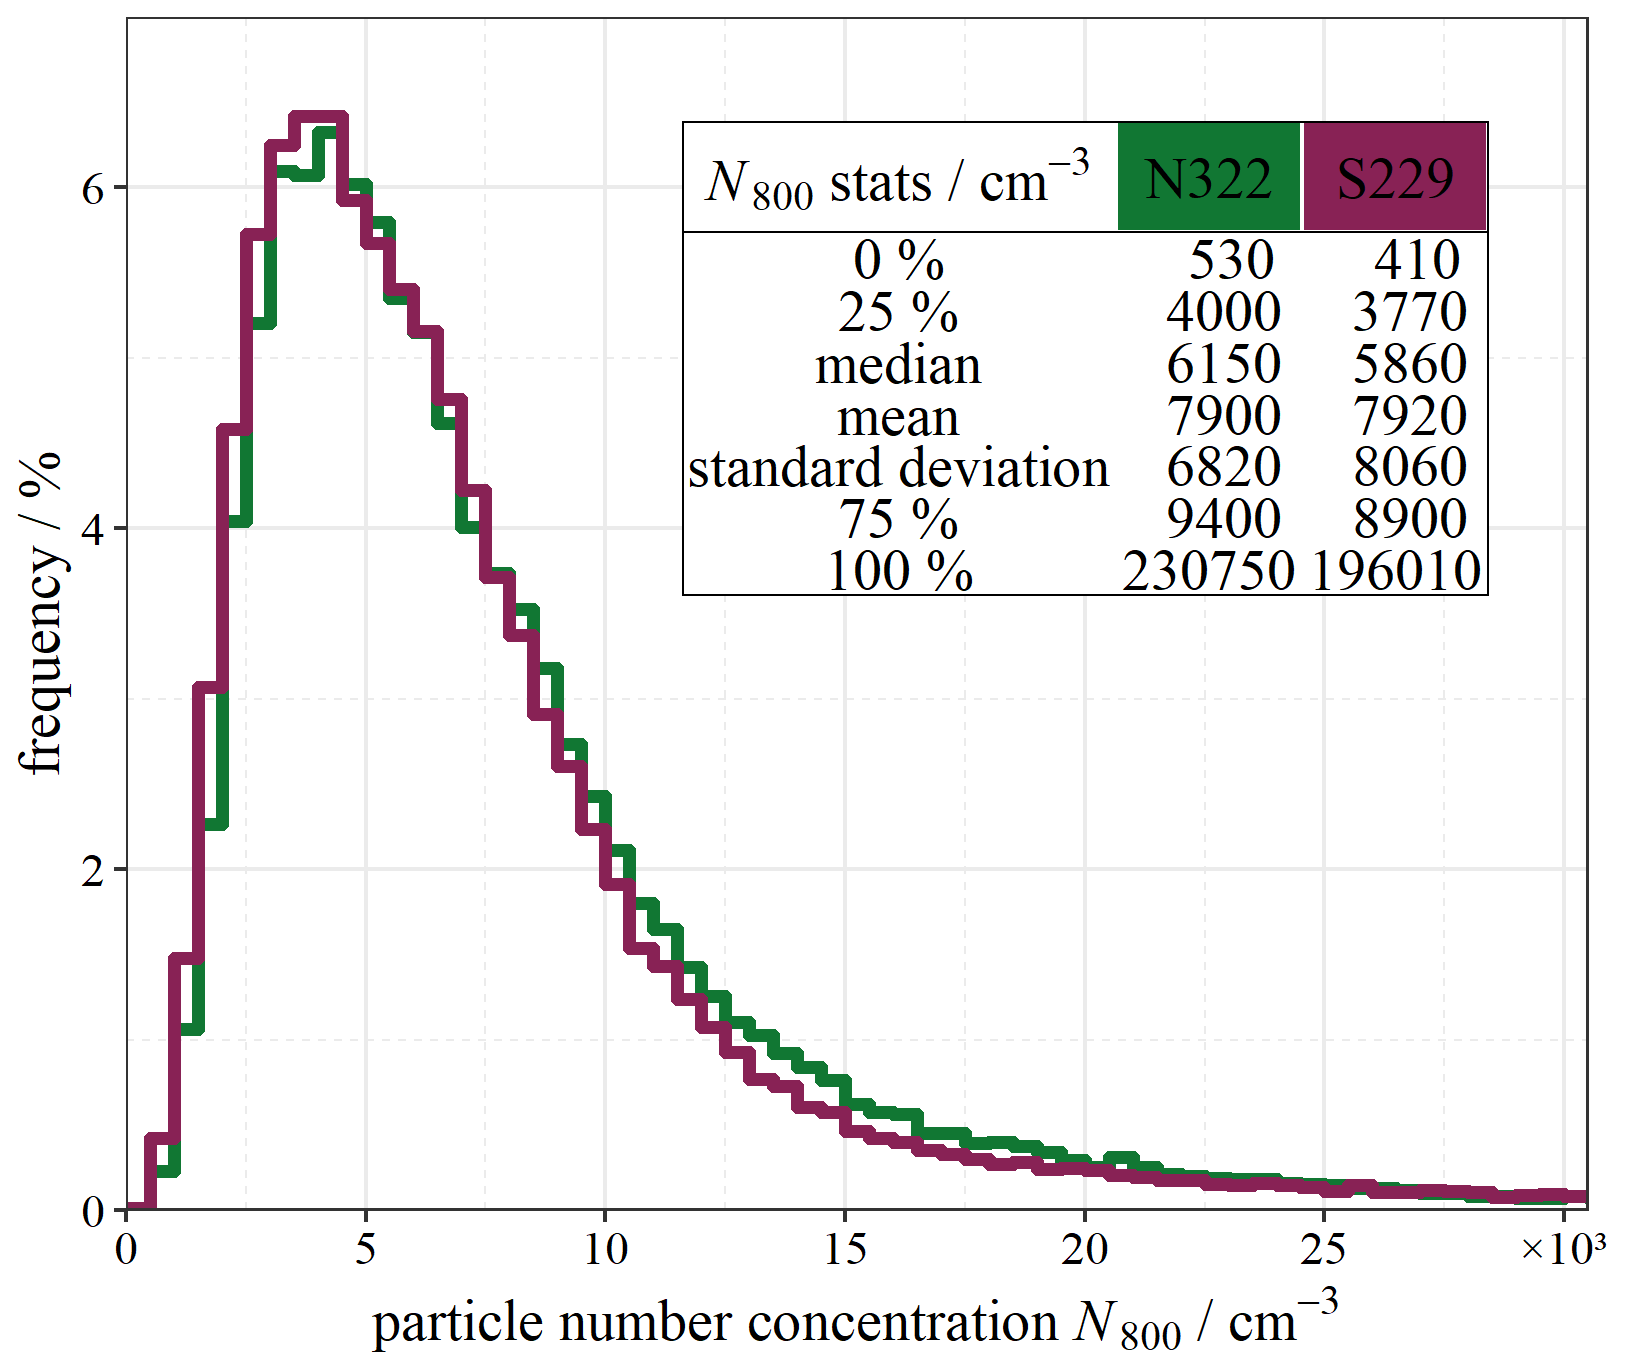
Figure 4Frequency histogram and annual statistics of N800 particle number concentrations at the sites N322 in Freising and S229 in Hallbergmoos for the observation period of this study. The plot is cut at N800=30 000 cm−3. Bin width is 500 cm−3. The table contains descriptive statistics, rounded to full multiples of 10.
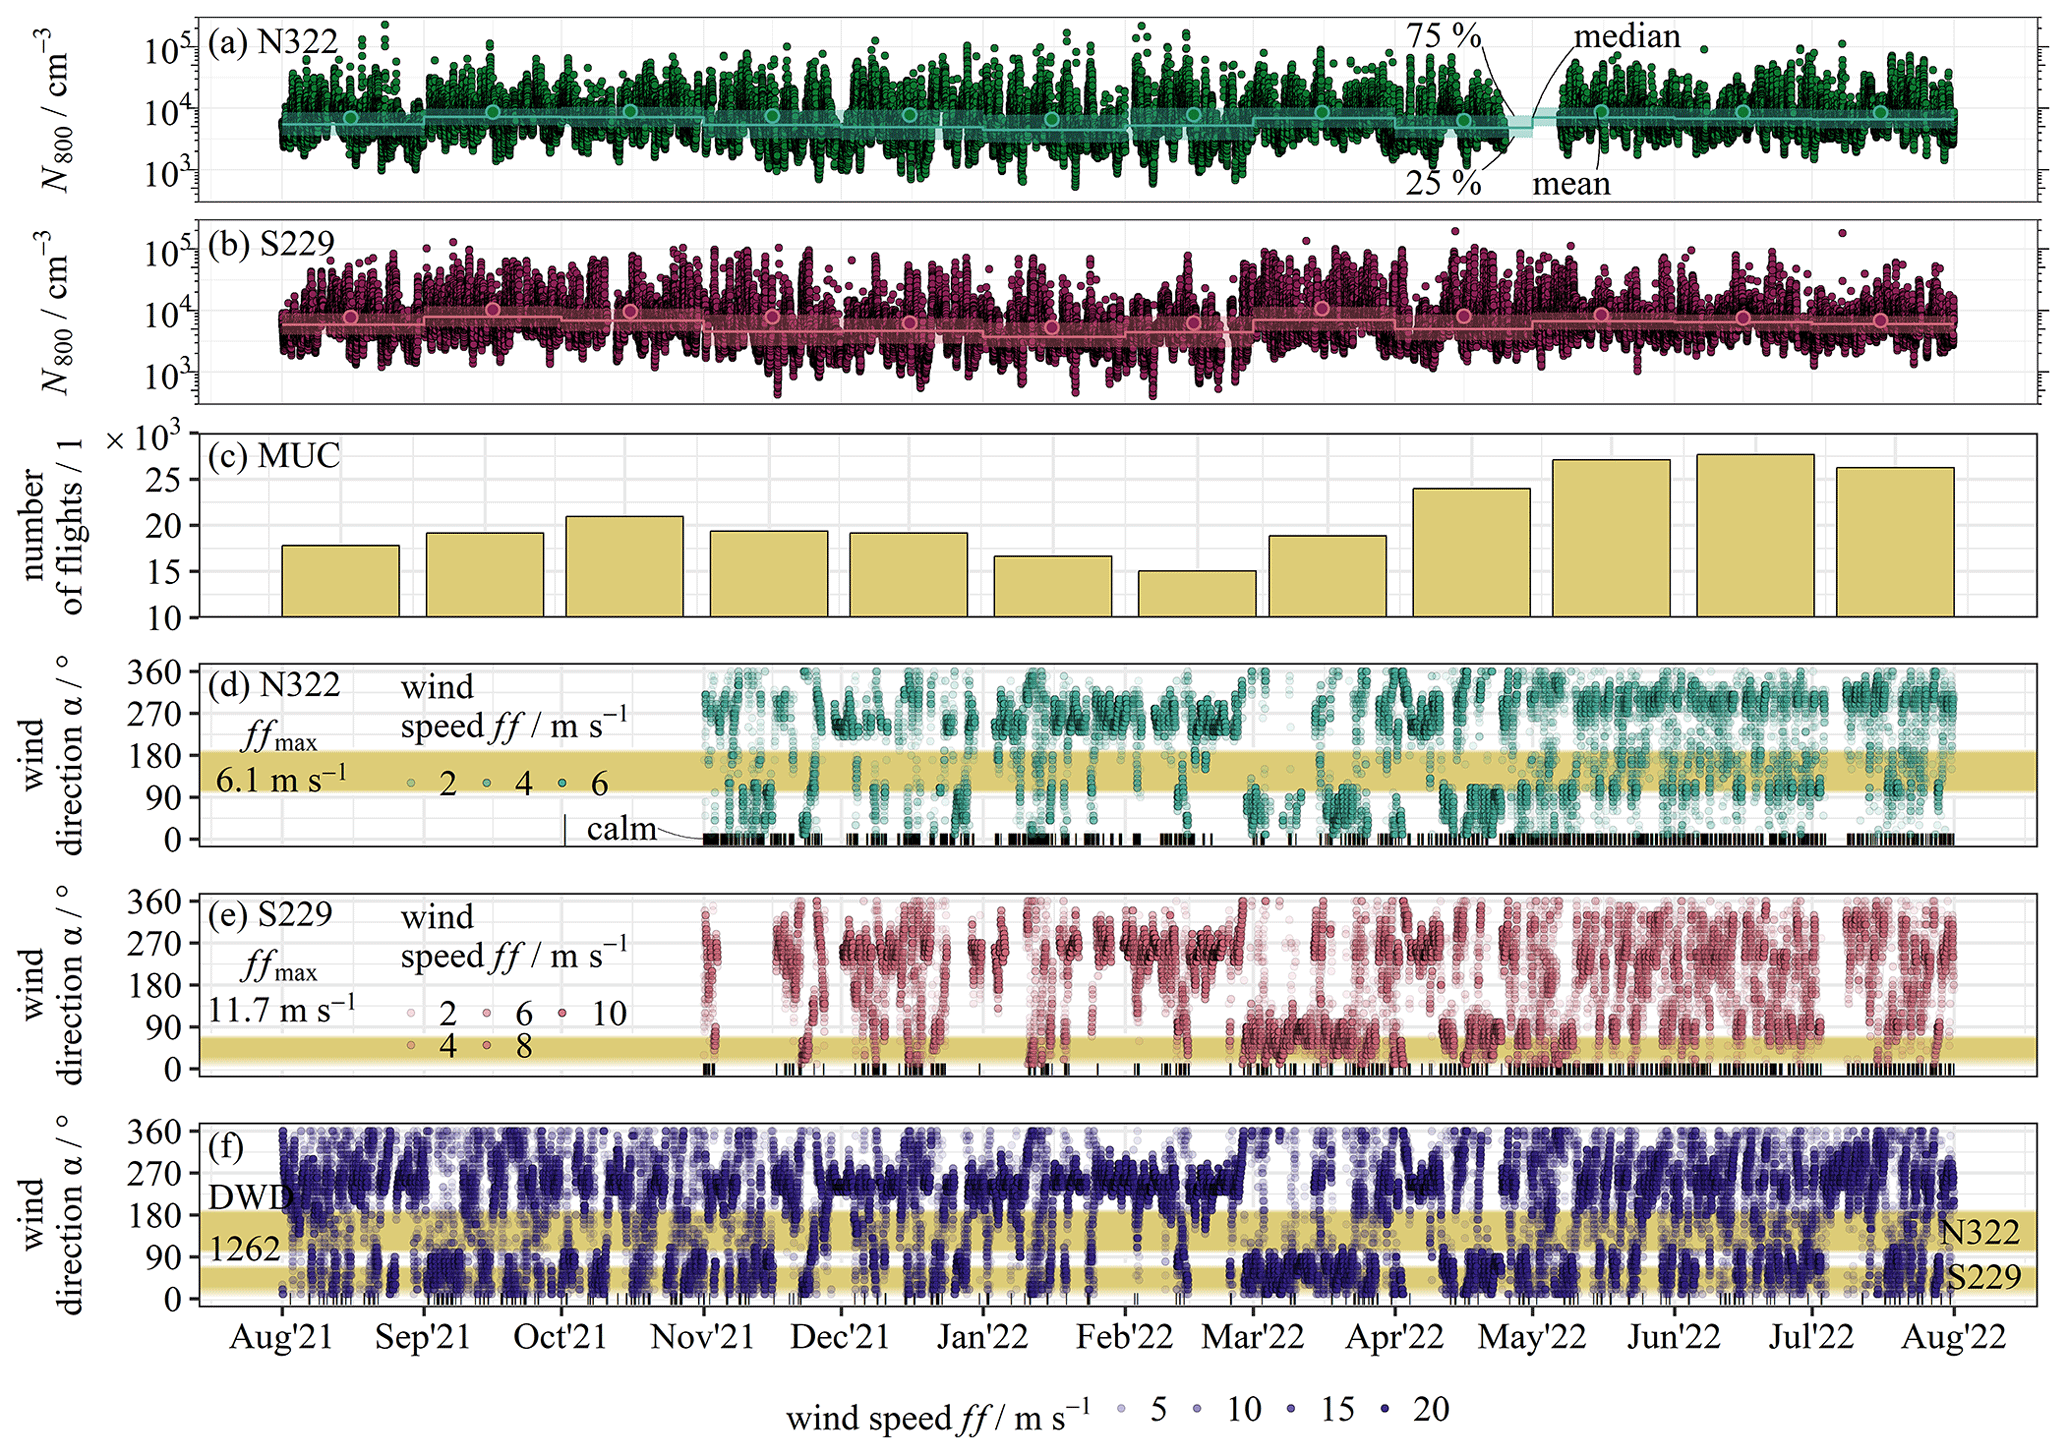
Figure 5Overview of the entire data set for August 2021 to July 2022, presenting the timelines of particle number concentrations N800 at sites N322 in Freising (a) and S229 in Hallbergmoos (b), with running boxplots per month; the sum of flights per month at Munich Airport (c); the site-scale wind measured at sites N322 (d) and S229 (e); and the local-scale wind recorded by DWD1262 at Munich Airport (f) (source is the DWD). Calm conditions α=0∘ are indicated separately for panels (d–f). The maximum wind speed is ffmax=21.3 m s−1 for panel (f).
With regard to the concentration rose, for deriving the relation between the observed particle number concentrations and the wind directions, we combined these data sets as concentration roses by means of polar boxplots or so-called squeeze boxplots. Throughout this study, we present two versions of the concentration rose as we aim to evaluate the commonly applied strategy of using the wind data monitored at the airport (local scale) and to explore the effect of using the measurement stations' wind data at each site (site scale). For the local scale, first, the wind as monitored at the airport is combined with the observed particle number concentrations. The wind is measured at 10 m height and with no distortions of flow. Because the topography around the airport is a plane, it can be assumed that the wind field is rather homogeneous at that height. To test the effect on sampling within the increment of the supposedly urban background environments of Freising and Hallbergmoos, we assessed the site-scale wind data of our measurement sites to derive concentration roses.
In terms of the cumulative concentration rose, the presented data cover the annual cycle of the observation period from August 2021 to July 2022 almost completely, with data availability of 92 % for site N322 and 94 % for site S229. Additionally, no extreme particle emissions were observed, and the data set is a good representation of typical airborne particle loads at the two sites during the course of 1 year. Hence, we first summed up all particle number concentrations to a cumulative number concentration for N100 or N800 at each site. The final cumulated particle number concentration represents the total particle load at each site after 1 year (100 %). Next, the observed particle number concentrations were grouped by the wind direction that occurred at the given time (36 bins + 1 calm bin, see Sect. 2.4). For each bin, a cumulative number concentration is calculated and divided by the total particle load. This way. the contribution of each bin relative to the total particle load for N100 or N800 over the course of the observation period can be expressed as a fraction in percent.
Except for the map in Fig. 1, all geographical data (positions, distances, angles, and elevations) were obtained by combining base maps from OpenStreetMap (©OpenStreetMap contributors, https://www.openstreetmap.org/copyright, last access: summer 2020) with base maps and orthophotos from the Bavarian Surveying and Mapping Authority (https://www.ldbv.bayern.de/, last access: 20 April 2023, CC BY 4.0, https://www.creativecommons.org/licenses/by/4.0/, last access: 20 April 2023) in GIS software.
During August 2021 to July 2022, the N800 particle number concentrations varied from 410 to more than 190 000 cm−3, with a tendency towards smaller number concentrations in the winter at both sites, as shown in Fig. 5a and b. We observed significant differences in atmospheric particle number concentrations between the two stations on an annual basis. The distribution was non-Gaussian according to the Anderson–Darling test, with pN322≪0.05 and pS229≪0.05, and both sites featured non-similar distributions according to the Kolmogorov–Smirnov test, with p≪0.05 (see Fig. 4). The annual mean N800 particle number concentrations were similar for both sites, with 7900 (6820) cm−3 and 7920 (8060) cm−3 at sites N322 and S229, respectively. The annual median of N800 particle number concentrations was 6150 cm−3 for site N322 and 5860 cm−3 for S229. These median particle concentrations are similar to other German urban background stations, for which a multi-annual median of about 4300 to 7400 cm−3 (for Dp = 20 to 800 nm) was reported by Sun et al. (2019). For both sites, the median fraction of N100 in N800 particles was 85 (9) %.
The number of flights per month at Munich Airport seemed to exhibit a similar seasonality compared to the monthly mean particle number concentrations for N800. We tested whether the data sets can be correlated but did not find a linear relationship, with and . For the median of N800, the results were the same, with and . Generally, the relatively lower N800 particle number concentrations in wintertime occurred within stormy periods when highest wind speeds were reached (< 20 m s−1 for wind measured at 10 m height, DWD1262) and when wind from the west was most frequent. Figures 2 and 5 also present the wind data determined at the airport by DWD1262 and at the two sites, N322 and S229. The latter are relatively more affected by vegetation and building-induced surface roughness when compared to the 10 m wind data determined at the airport. For example, at the site N322 in Freising, the frequency of observed wind directions displays features besides the prevailing wind directions, and maximum wind speeds were measured to be about a factor of 3 smaller than at the airport (see Fig. 5). Calm wind conditions were monitored more frequently, occurring for 32.3 % (N322) and 15.8 % (S229) of all recorded data points during the observation period compared to 1.1 % at the airport (see Fig. 2).
These data sets were the basis for the following combined analysis, with three steps from the local- to site-scale view leading to a novel approach via cumulative concentration roses.
3.1 Integrated, local view on overall potential impact of the airport on air quality in adjacent residential areas
For exploring the variation in particle number concentrations with wind direction, a concentration rose based on the wind data as monitored at the airport itself (local scale) and the particle number concentrations as observed at sites N322 and S229 were calculated and displayed in Fig. 6. Here, the wind measured at Munich Airport at 10 m height above ground was used to represent the local wind distribution. The combination with the sites' N800 particle concentration shows an increase for the observations at site N322 for wind directions between 95 to 225∘. At site S229 in Hallbergmoos, the increase is of a similar order, but the wind directions are 305 to 55∘. For both sites, the wind directions with generally increased particle number concentrations include those that we defined as winds with a possible impact by Munich Airport (see Sect. 2.1). Assuming linear advection and a homogeneous local wind field, our sites could have received wind from Munich Airport. If we compare the wind directions attributed as being influenced by Munich Airport with all other wind directions within the observation period of 1 year, the median N800 particle number concentrations are higher by about a factor of 1.7 and 1.5 in Freising and Hallbergmoos.
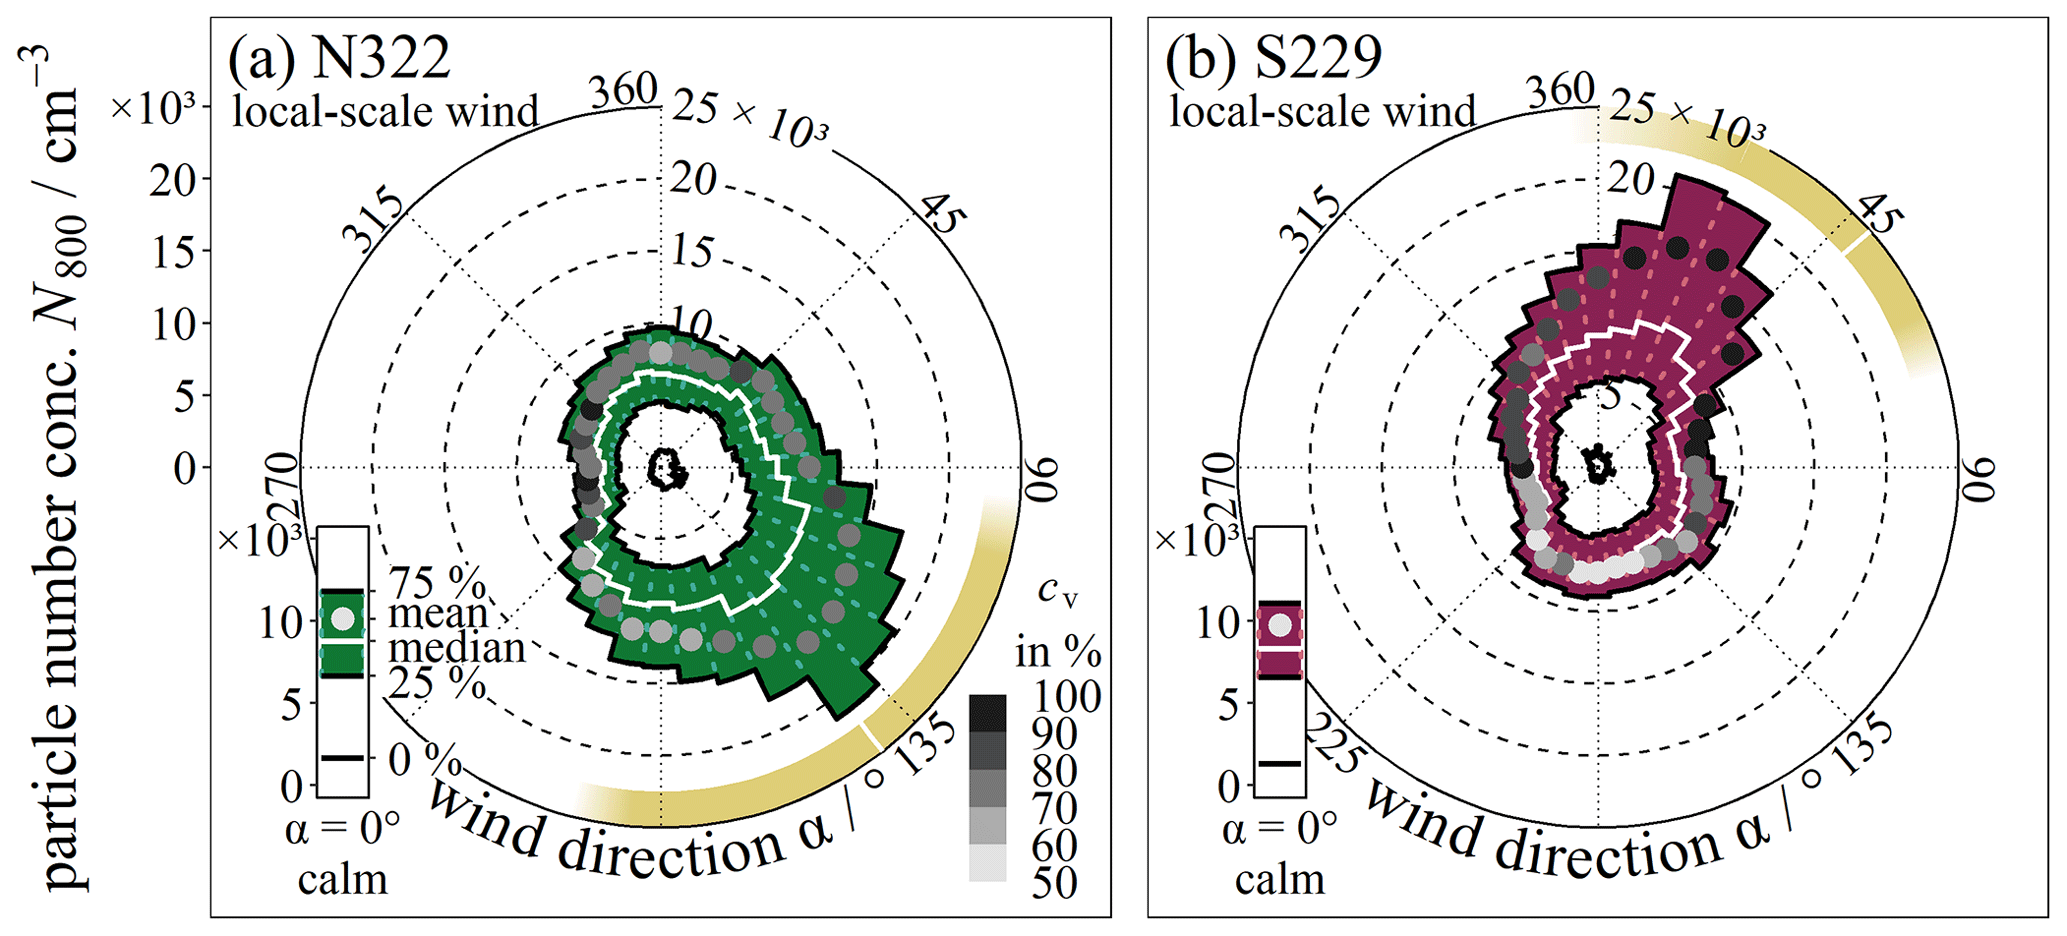
Figure 6Concentration roses as squeeze boxplots of local-scale wind data measured at the airport by DWD1262 (source is the DWD) and statistics for N800 number concentrations for sites N322 (a) and S229 (b) for the observation period of this study. Boxes represent the 0 percentile, 25th percentile, median, mean (position) combined with the relative standard deviation cv (grey shades coded), and 75th percentile. The inset plot shows the same statistics for calm conditions. Angular bin width is 10∘; the bins are centred. The yellowish arc is the airport sector indicator – see Fig. 1.
The same tendency was found for airborne UFP (N100) number concentrations with respect to local wind. Figure 7 displays concentration roses for daytime, recorded only during the airport operation hours, and nighttime, when no flights were scheduled (see Sect. 2.1). Daytime median N100 number concentrations are about a factor of 2.2 and 1.6 higher for wind directions arriving from the airport compared to all others for sites N322 and S229, respectively. During the nighttime, this is reduced to 1.4 (N322) and 1.2 (S229). Interestingly, the relative standard deviation is much lower during the nighttime. The relative standard deviation is 62 % as opposed to 98 % during the daytime at site N322 and 70 % as opposed to 115 % during the daytime at S229 considering all measured UFP number concentrations and all wind directions. Furthermore, the particle size distribution varied characteristically between day and night.
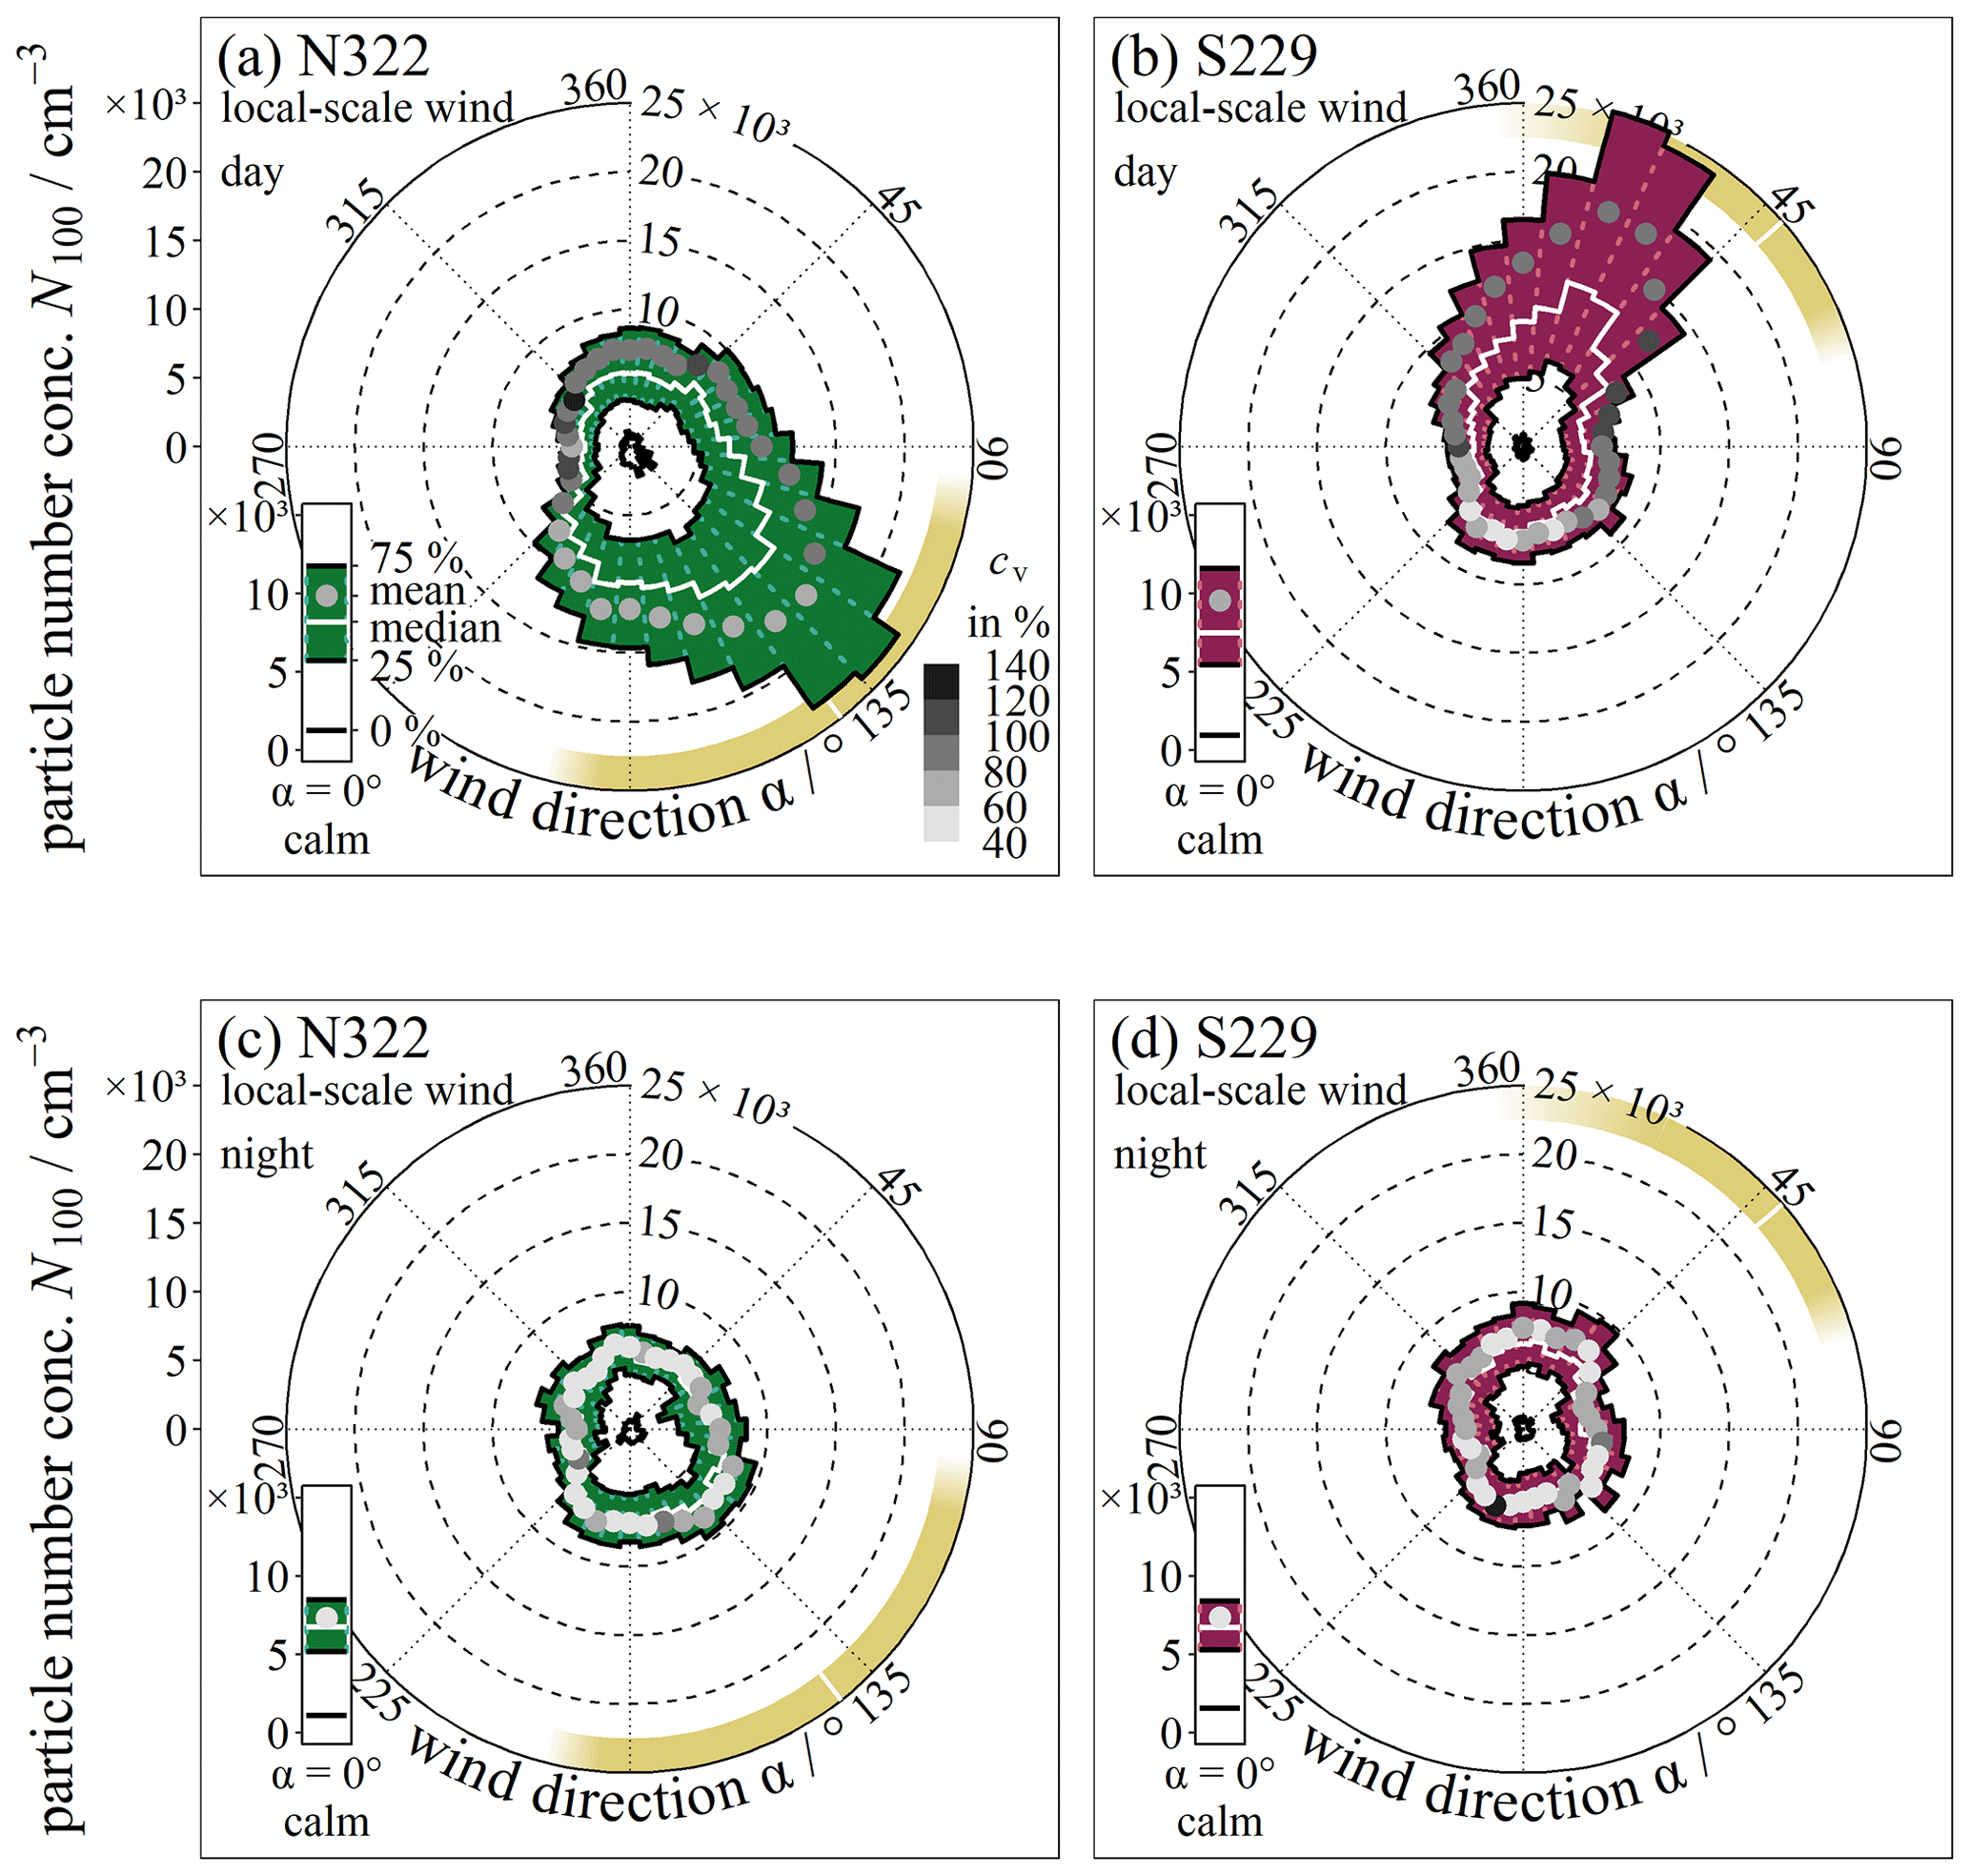
Figure 7Concentration roses as squeeze boxplots of local-scale wind data as measured at Munich Airport (source is the DWD) and statistics for particle number concentrations N100 for sites N322 (a, c) and S229 (b, d) for the observation period of this study. Top and bottom panels distinguish between daytime and nighttime as defined in Sect. 2.1. The yellowish arc is the airport sector indicator – see Fig. 1.
Figure 8 presents a shift for the annual median maximum in the particle size distribution towards larger mobility particle diameters during the nighttime (25 to 50 nm). During the daytime, the smallest modal particle diameters were 10 to 15 nm and were observed at site N322. These occurred for the same wind directions that received the highest annual median particle number concentrations. Interestingly, at site S229 in Hallbergmoos, the modal diameters were 15 to 25 nm for all wind directions except for easterly winds. Here, the median modal particle diameters were greater than 30 nm, and the fraction of N100 in N800 reaches the overall smallest values of about 80 % (Fig. S2). Considering only the daytime for August 2021 to July 2022, the median ratio of N100 to N800 particle number concentrations was 92 % in Freising and 88 % in Hallbergmoos for observations with potential wind from the airport. For all other directions, it was 87 % and 88 % at the stations in Freising and Hallbergmoos. Within the given variability, the difference was insignificant, with pN322≪0.05 and pS229≪0.05 from the Wilcoxon rank sum test (see Fig. S2).
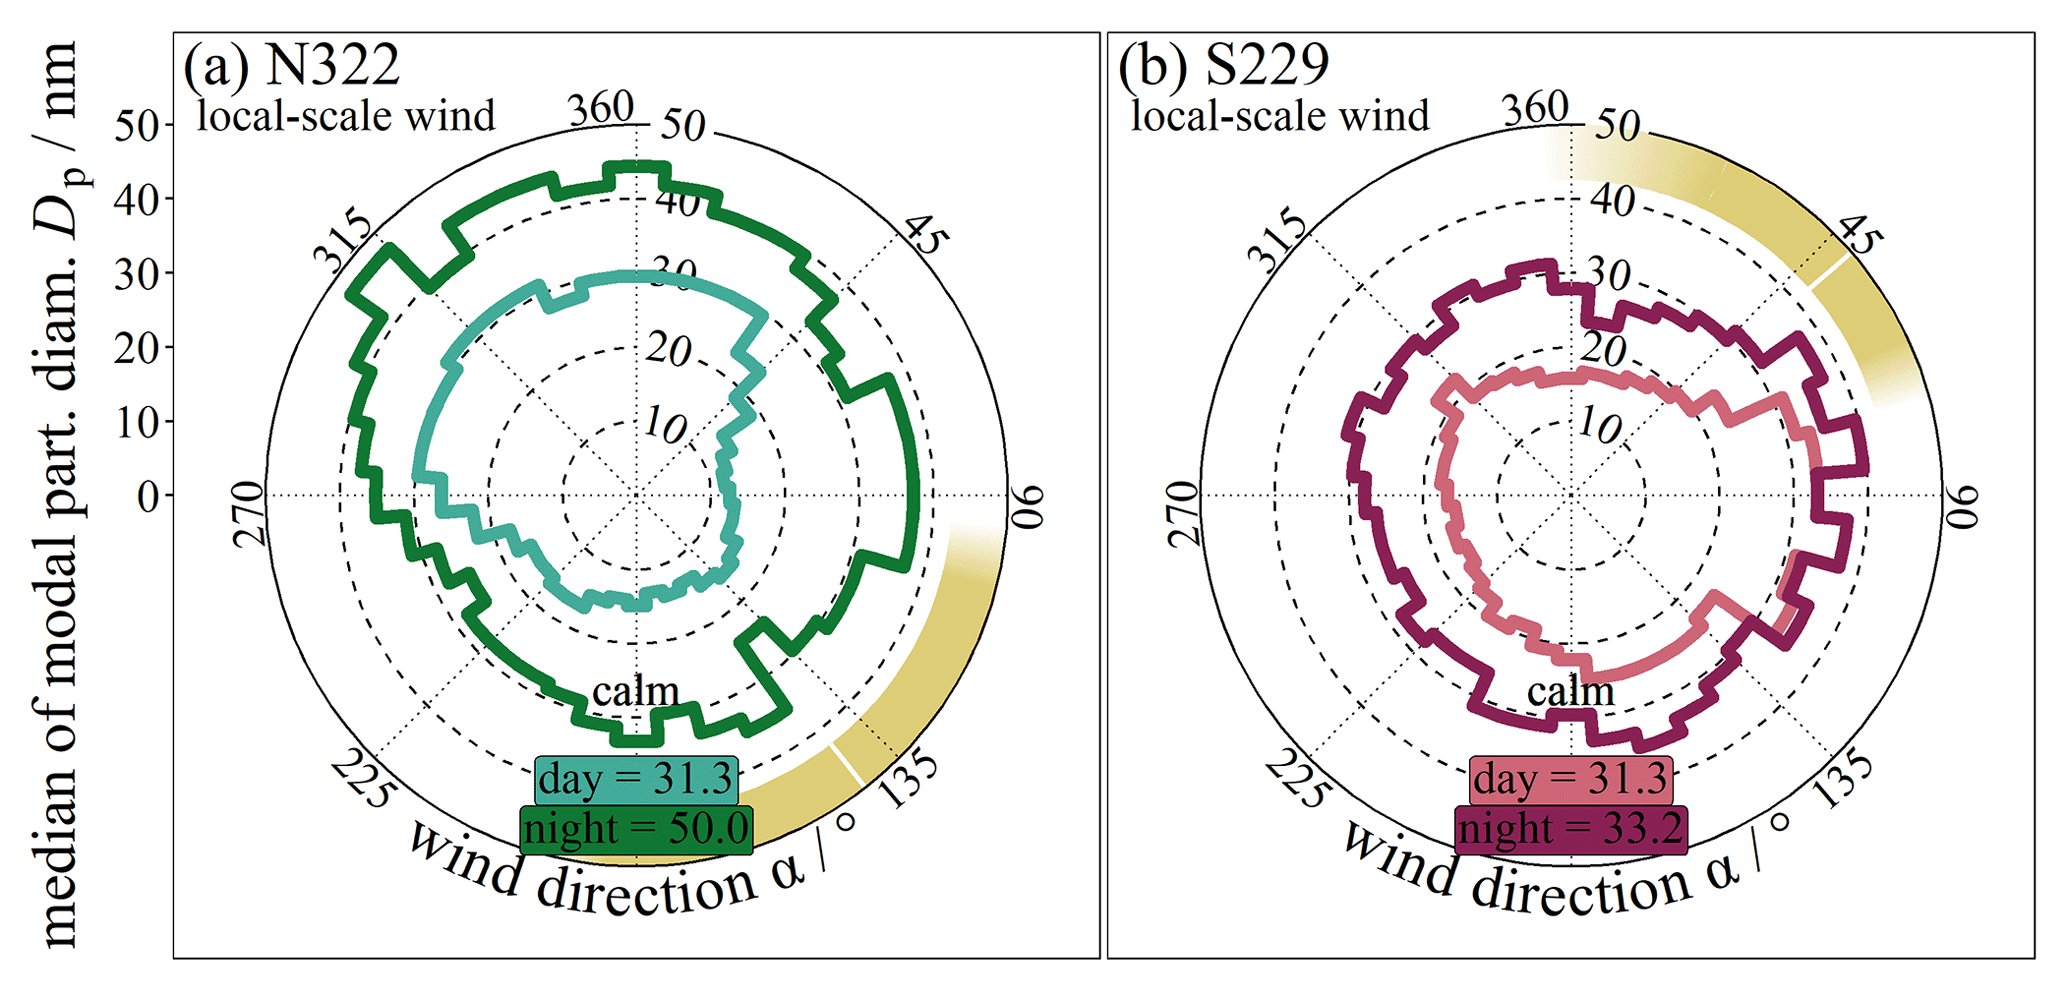
Figure 8Median of modal particle diameter Dp as derived from the particle size distribution during the entire observation period for sites N322 in Freising (a) and S229 in Hallbergmoos (b) for local-scale wind data (source is the DWD) and depending on whether it is daytime or nighttime. The yellowish arc is the airport sector indicator – see Fig. 1.
After exploring the effect of the local wind field on the potential transport of UFPs from the airport into the adjacent residential areas, we find three important points of discussion. (1) For airflow from the airport, previous studies highlighted a shift towards smaller particle diameters, mainly to Dp<30 nm (Keuken et al., 2015; Fushimi et al., 2019; Rose et al., 2020; Ungeheuer et al., 2021; Ditas et al., 2022). Our findings show a shift to 10 to 25 nm as well; however, we cannot precisely attribute this to the defined wind directions with potential airport impact. Particularly for the southern site in Hallbergmoos, a wide range of wind directions was associated with such small modal diameters. Possibly, this is related to aeroplanes taking off during westerly winds to southern destinations (see Fig. 1 and corridor 26R/L-S/SO). (2) Our view on the variation of the N800 particle number concentrations with wind direction generally agrees with the findings of other studies that established the view of a mainly linear advection-driven transport of particles from the airport in the surroundings (e.g. Ditas et al., 2022; Keuken et al., 2015). At the two sites studied here, the annual median particle concentrations for N800 were about a factor of 1.7 and 1.5 (N322 and S229; see Table S1) higher for times with wind from the direction of the airport relative to all other wind directions. Calculating the same for the annual mean particle concentrations results in a significant increase of 1.9 to 2.0 (Welch two-sample t test for large non-Gaussian samples – pN322 and pS229≪0.05). However, large relative standard deviations for N100 of % and % for sites N322 and S229 highlight a strong variability in the time series. (3) Thirdly, we observe a dependence on the time of the day, similarly to Frankfurt Airport (Ditas et al., 2022). During the daytime, it is likely that the higher variability and elevated particle number concentrations result from the airport's operations. Yet the analysis of the concentration roses does not allow differentiation from urban activities such as rush-hour traffic in close proximity to the measuring sites. Approaching the variability in the observed particle number concentrations in combination with the wind data from Munich Airport assuming a local, homogeneous wind field thus serves only as a first estimate here. This is a common approach for describing the transport of particles in the atmosphere in close proximity to a source; however, this also simplifies the contribution of other atmospheric processes as drivers for particle transport, such as turbulent mixing and the development of the atmospheric boundary layer. For this reason, we next explored whether we could add precision to the results and discussion when considering the variability of wind as monitored at the measuring stations directly.
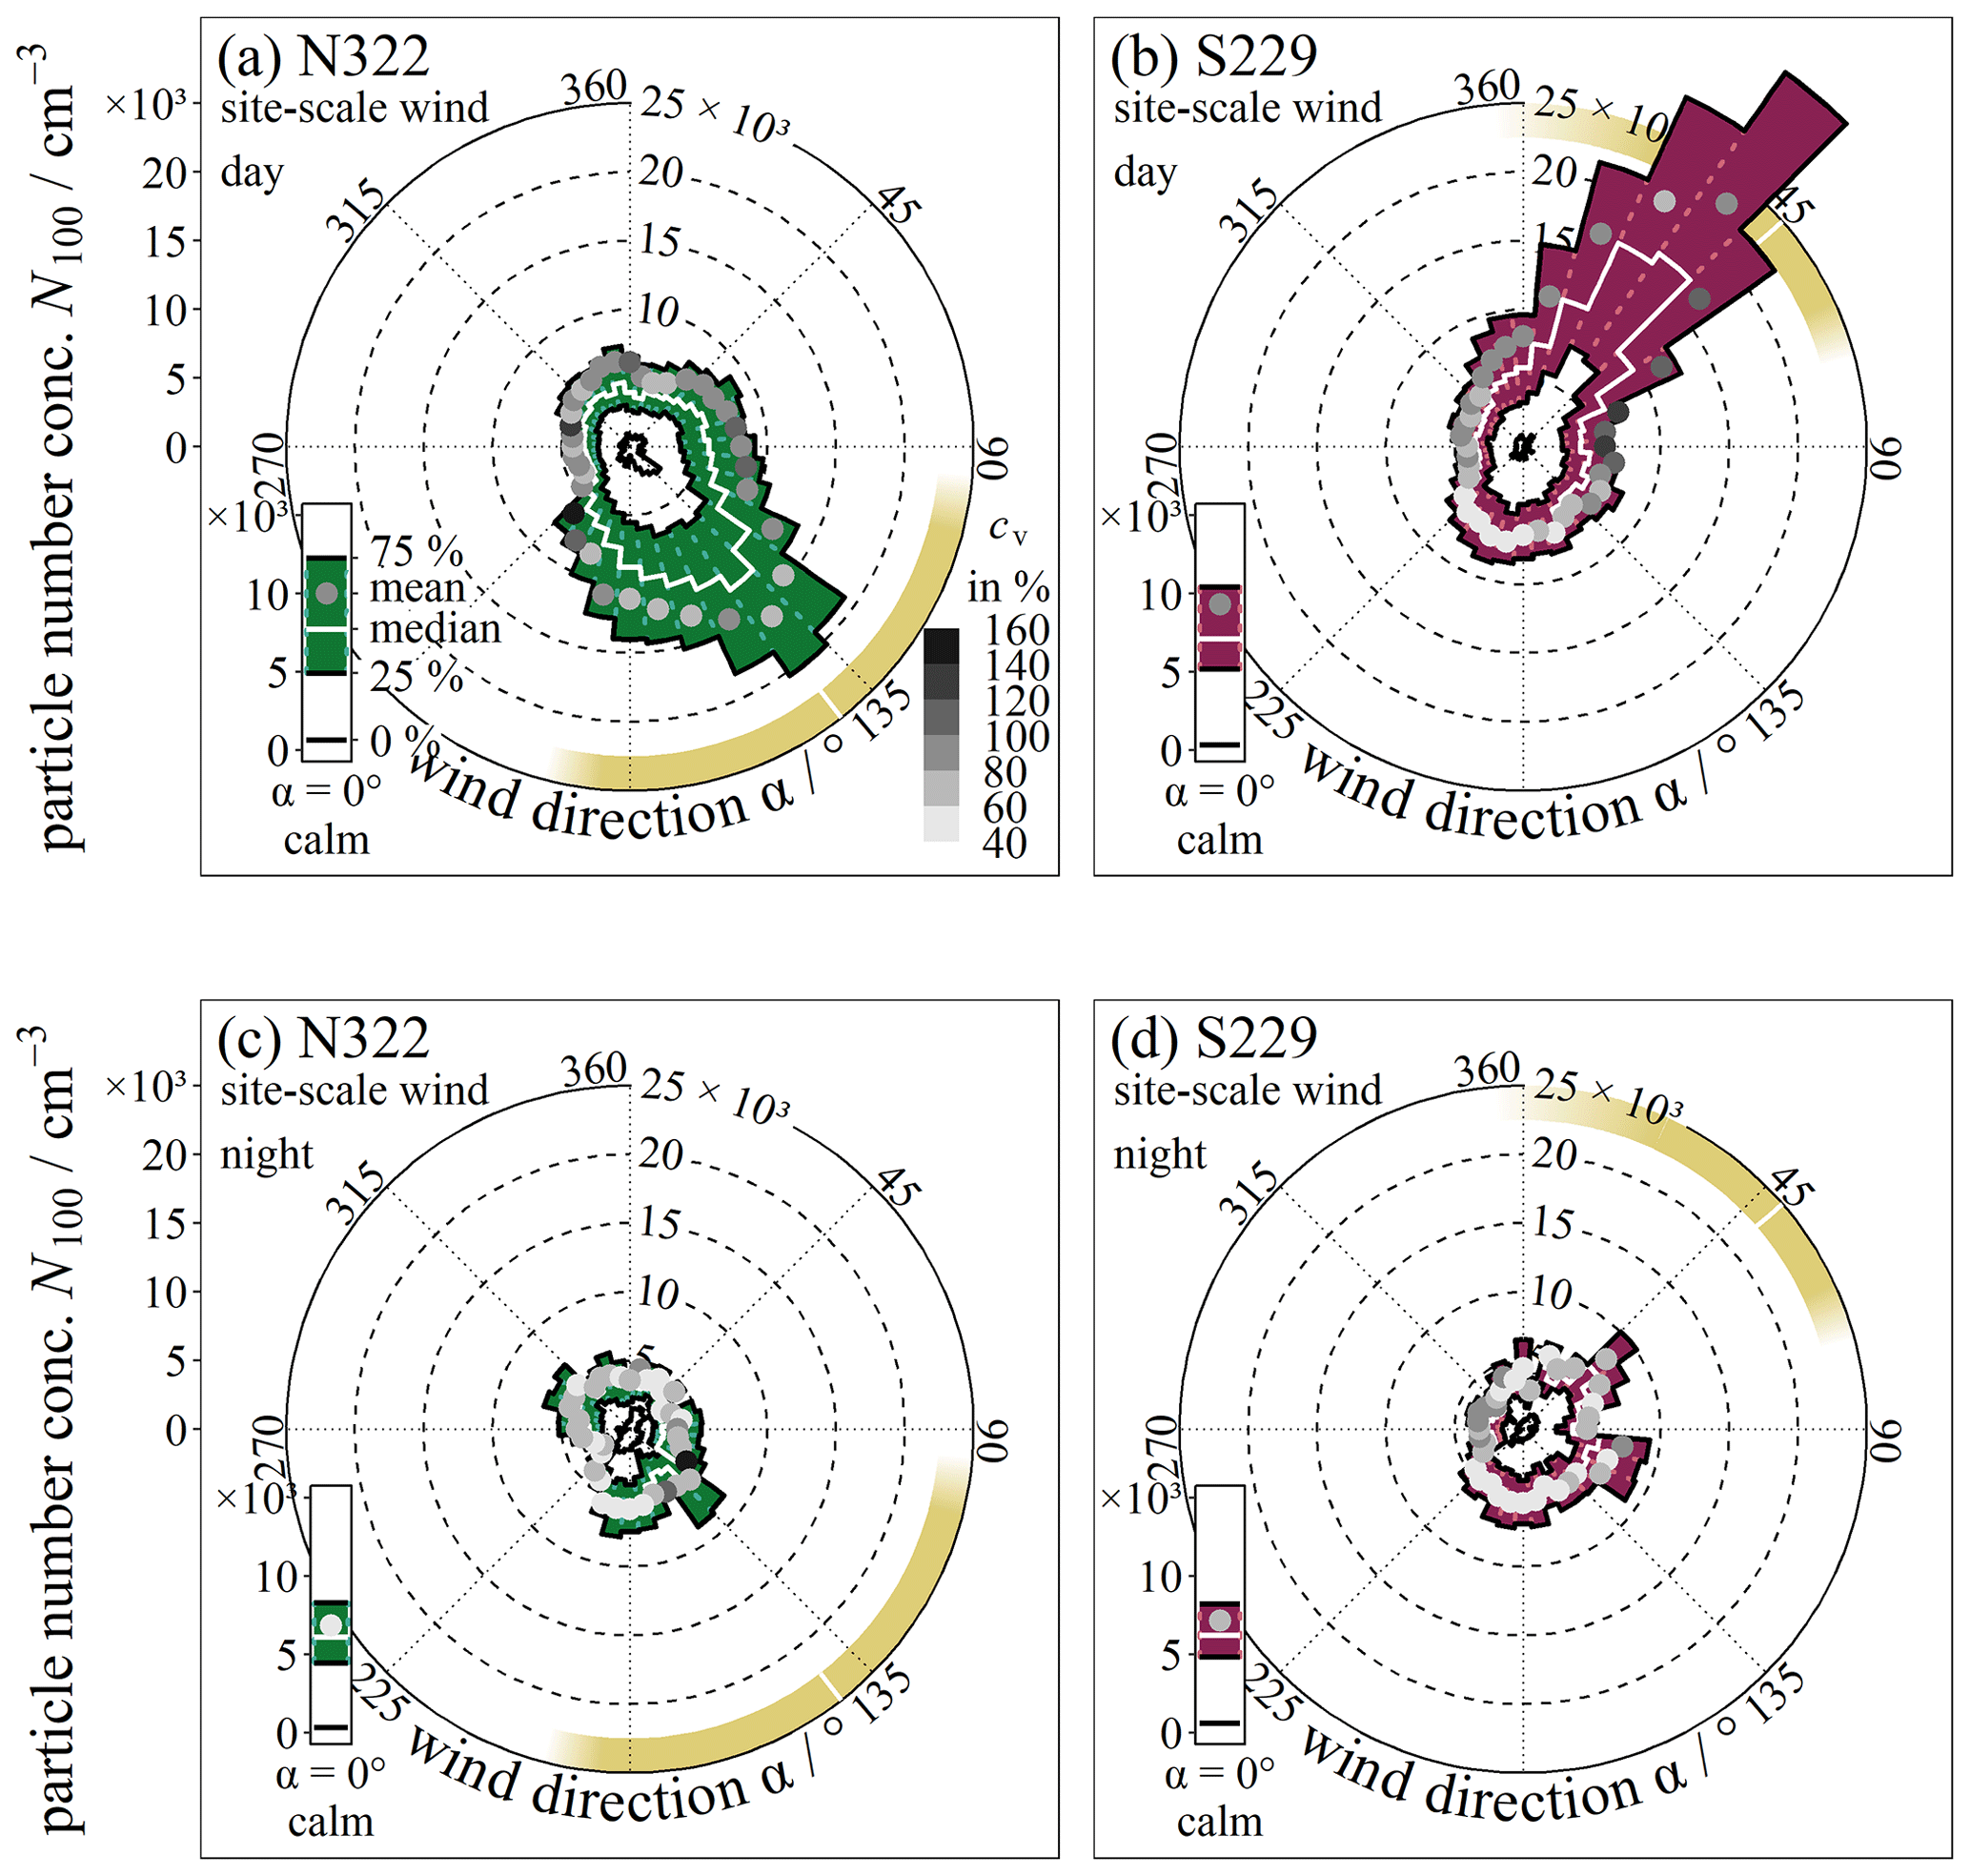
Figure 9Concentration roses as squeeze boxplots of site-scale wind data as measured directly at the sites and statistics for particle number concentrations N100 for sites N322 (a, c) and S229 (b, d) for the time period of November 2021 to July 2022. Top and bottom panels distinguish between daytime and nighttime as defined in Sect. 2.1. The yellowish arc is the airport sector indicator – see Fig. 1.
3.2 Detailed view on the site-specific spatio-temporal characteristics with respect to air quality in airport-adjacent residential areas
To test whether a more detailed view on the site scale would confine the previous findings or lead to different conclusions, we used here the measuring stations' wind data determined at 5.3 m height. Thus, Fig. 9 presents the same concentration roses as displayed in Fig. 7 for N100 particle number concentrations but with the wind data from the respective measuring sites. In comparison, the previously described main features persist. The concentration rose exhibits an elevation in the same directions for the entire year. In Freising, median N100 particle number concentrations were significantly increased by a factor of 2.0 during the day and 1.5 during the night (Wilcoxon rank sum test with p≪0.05) when comparing wind directions with a potential impact by Munich Airport to all others except for calms (see. Table S1). In Hallbergmoos, the factor of the increase was 1.8 during the day and 1.3 during the night (Wilcoxon rank rum test with p≪0.05). The greatest difference is the lower variability during the nighttime, which can be seen from the lower relative standard deviations of about 67 % and 75 % at sites N322 and S229.
From Fig. 2, we further notice a characteristic seasonality of the sites' wind roses. While the wind rose as monitored at 10 m height at Munich Airport (DWD1262) falls into the two main wind directions for all defined time periods in the entire time series (winter, spring, and summer), the wind rose measured at 5.3 m height at the site in Freising was different for spring and summer. The wind rose determined at the southern station in Hallbergmoos (S229) deviated in summer from that across the entire year. The predominant wind direction shifted. For example, in spring 2022 for site N322, four maxima could be noted, and for site S229, the wind approached relatively more frequently from the northeast. Generally, wind speeds were reduced at the two measuring sites compared to those at the airport. The occurrence of calm conditions was greatest in summer, with 38.5 % (N322) and 25.5 % (S229). It is likely that the additional surface roughness by vegetation and buildings impacted wind directions and speed and hence the transport of airborne particles close to the ground.
This seasonality is also pictured in the concentration roses when separating winter, spring, and summer from the entire observation period (Fig. S3–5). The main message persists, and an increase can always be noticed. However, its amplitude varies from maximum values in the wintertime in Freising, with a factor of 3, for N100 considering daytime and nighttime data to minimum values of 1.3 for summertime in Hallbergmoos.
Similarly, the diurnal variation of each site's particle concentrations was prone to seasonality, as presented in Fig. 10. Both sites exhibit a similar diurnal variation despite different site-specific surroundings. N100 particle number concentrations increased during the morning rush hour, reaching a maximum at 07:00 and 08:00 for summer and winter, respectively. In winter, a second, more pronounced peak can be noted in the evening (maximum means at 18:00 to 20:00). In summer, the second maximum was recorded later at around 21:00 to 23:00. For the example of site N322 (Freising), the wintertime maximum median N100 concentrations reached 5610 cm−3 in the morning at 08:00 and 6720 cm−3 in the evening at 19:00. We note that the summertime N100 particle concentrations were generally elevated compared to wintertime, reaching the two maxima with median values of 8260 cm−3 (07:00) and 8500 cm−3 (23:00). In the afternoon, median N100 particle number concentrations declined at both sites. It is interesting to look at the difference between mean and median values as the means are driven by extremes, for example by events with high particle number concentrations but short durations. The first periods with noticeable differences between the mean and median are the morning and evening rush-hour times for both wintertime and summertime. The second period is the summertime afternoon, when median values declined but means increased.
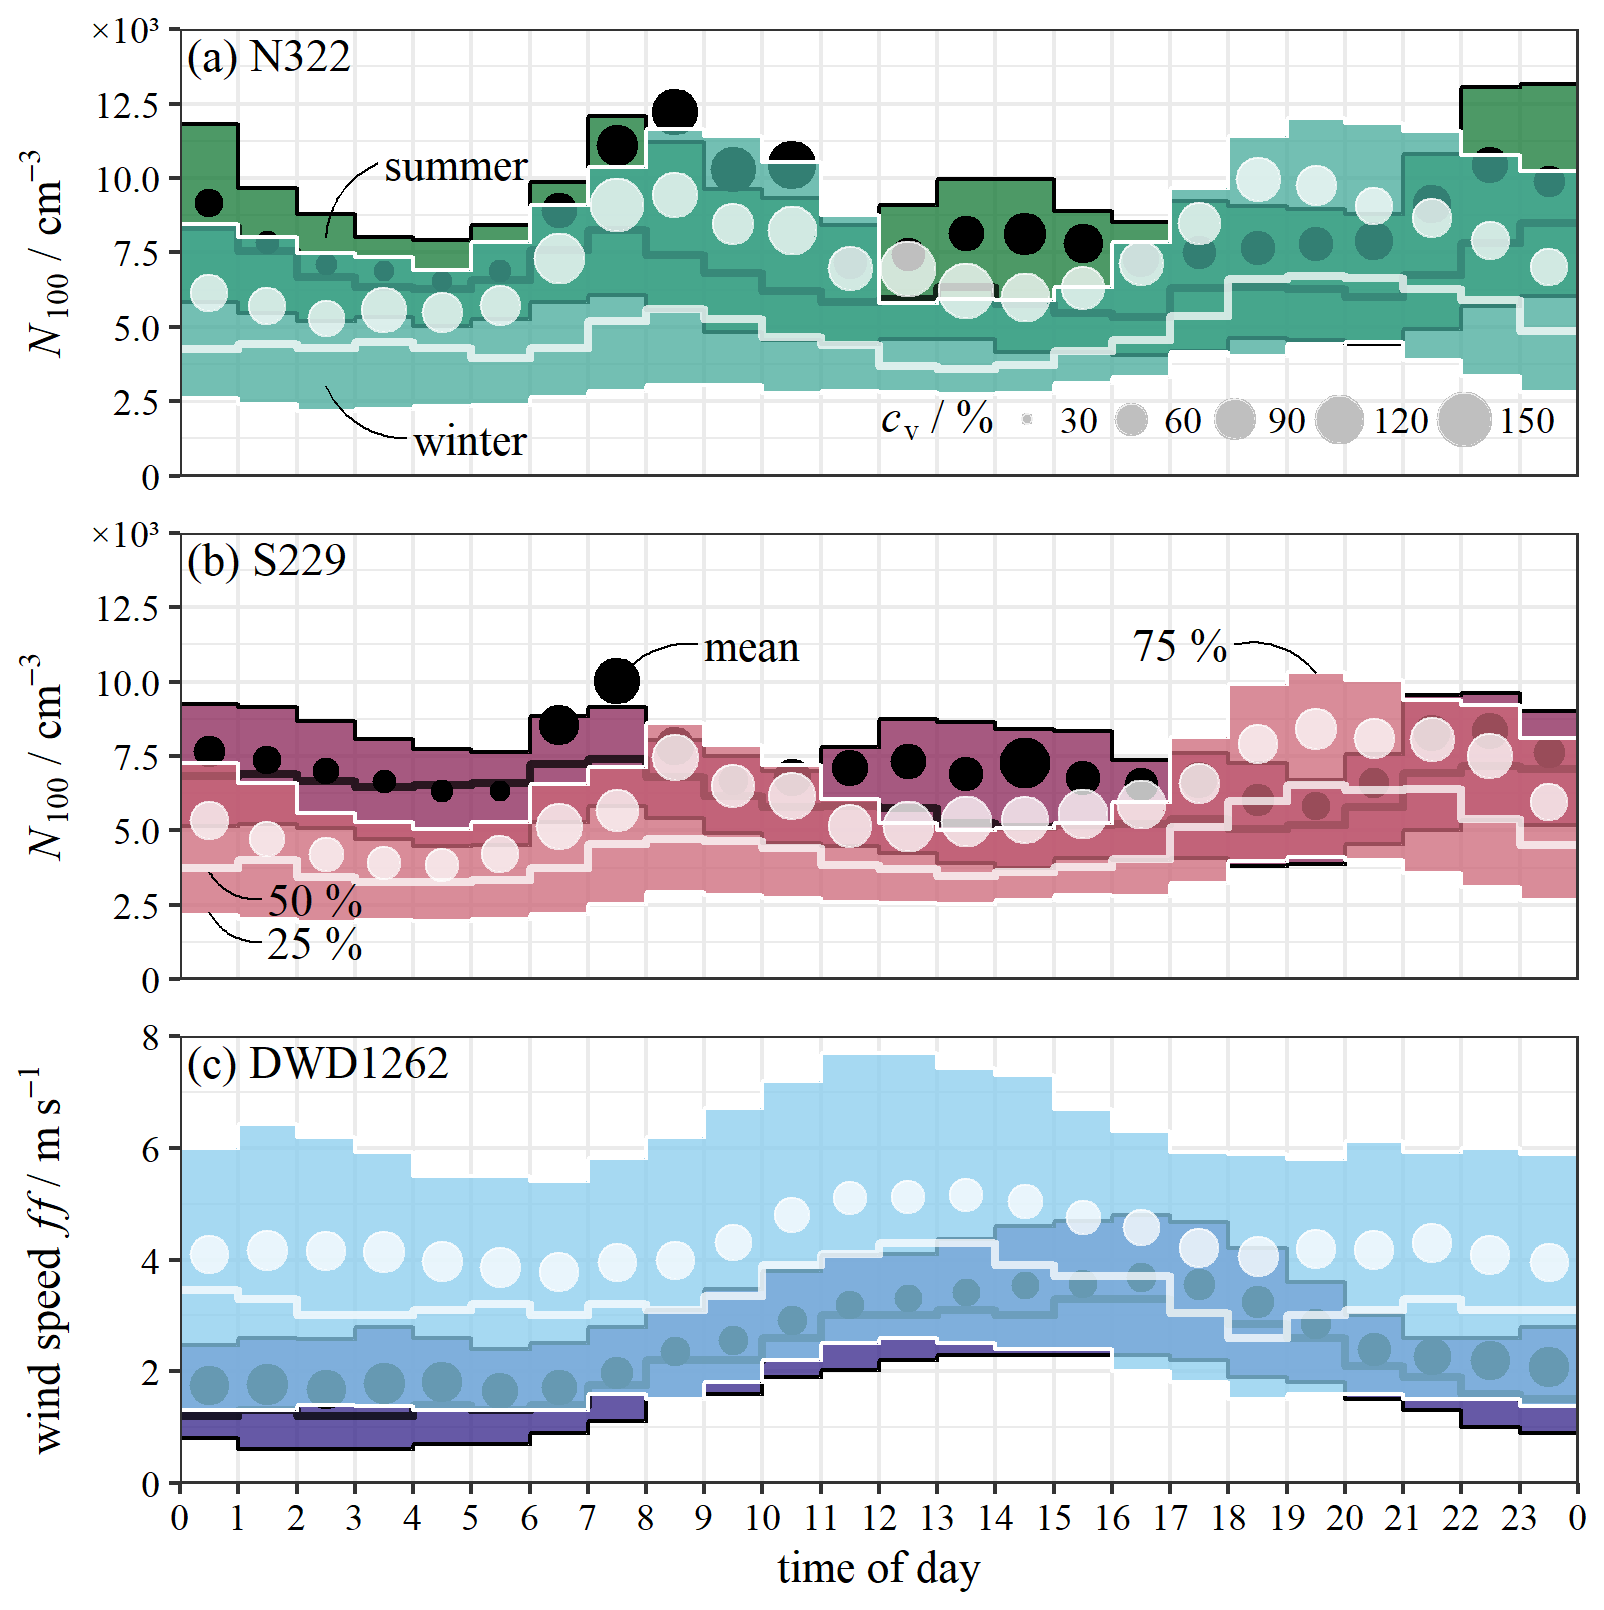
Figure 10Diurnal variation as 1 h boxplots of number concentrations N100 for sites N322 (a) and S229 (b) for local-scale wind data from DWD1262, as well as scalar wind speed ff measured by DWD1262 (source is the DWD) (c) for summer and winter. Maximum and minimum values are not shown. Given are data for summer 2022 and winter 2021/2022 from our observation period.
Based on these observations, we discuss the observed spatio-temporal variability of the particle number concentrations at the two sites. The diurnal variation of particle number concentrations likely displays the interplay of a typical urban air mixture between local particle sources and atmospheric processes of transport and ageing during the development of the boundary layer. First, the deviation between means and medians provides evidence for local sources, which cause non-Gaussian statistics and higher skewness. Typical local sources other than the airport include road traffic, residential heating, photochemistry leading to particle formation, and agricultural activities. Previous studies attributed the two peaks in the morning and evening to particles emitted within the rush-hour traffic (e.g. von Bismarck-Osten et al., 2013; Jesus et al., 2019; Tremper et al., 2022). Residential heating likely contributed to the observed particle number concentrations in winter (Yu et al., 2019). During summertime afternoons, it is possible that two effects might have increased the hourly mean N100 particle number concentrations: (1) photochemistry leading to new particle formation and/or (2) airport UFP emissions. Secondly, the development of the atmospheric boundary layer typically leads to a larger mixing volume during the daytime compared to a shallow stable layer during the nighttime. Hence, during the daytime, emissions are diluted rapidly and mixed via turbulent and advective air movement. During the night, mixing and transport can be reduced (Hudda et al., 2014; Trebs et al., 2023). These effects can be noticed, for example, for summertime at site N322, when the rush-hour peak of mean N100 particle number concentrations declined almost twice as rapidly during the day than during the night (decline rate of hourly means: morning (08:00 to 12:00) = 1260 cm−3 h−1 and evening (22:00 to 04:00) = 710 cm−3 h−1). Similarly, a decline in UFPs during the daytime, despite a high frequency of flights, was reported by Trebs et al. (2023) for the airport in Findel, Luxembourg. Furthermore, we observed larger median modal diameters (up to 50 nm) during the night for both sites (see Fig. 8), which is an indication that relatively more aged and not freshly emitted or formed particles were detected at these times.
Overall, it is difficult to assess the impact of the airport on the local air quality from this view on the diurnal variation of UFP number concentrations at the two sites only. However, the combined results show that the concentration roses for winds blowing from the direction of the airport had the highest daytime UFP number concentrations. Local- and site-scale concentration roses agreed on this view when considering the entire data set over the period of 1 year (see Fig. 7 and Fig. 9). However, we find that the concentration roses lack information about the potential background particle load; additional sources in the same direction; and, most importantly, the frequency of occurrence of a wind direction.
3.3 Upper limit and lower limit of cumulative UFP transport from Munich Airport into adjacent residential areas considering wind on both local and site scales
As the presented data cover the annual cycle of the observation period of August 2021 to July 2022 almost completely, they can be used to sum up the observed particle number concentrations to a cumulative value – see Sect. 2.5 on cumulative number concentrations. The normalised cumulative number concentrations of N800 and N100 particles rise constantly throughout the year. Furthermore, the total cumulative number concentrations are similar for both locations ( cm−3 and 759×106 cm−3 at sites N322 and S229). The fractions of cumulative N100 in cumulative N800 are 89 % and 88 % for sites N322 and S229.
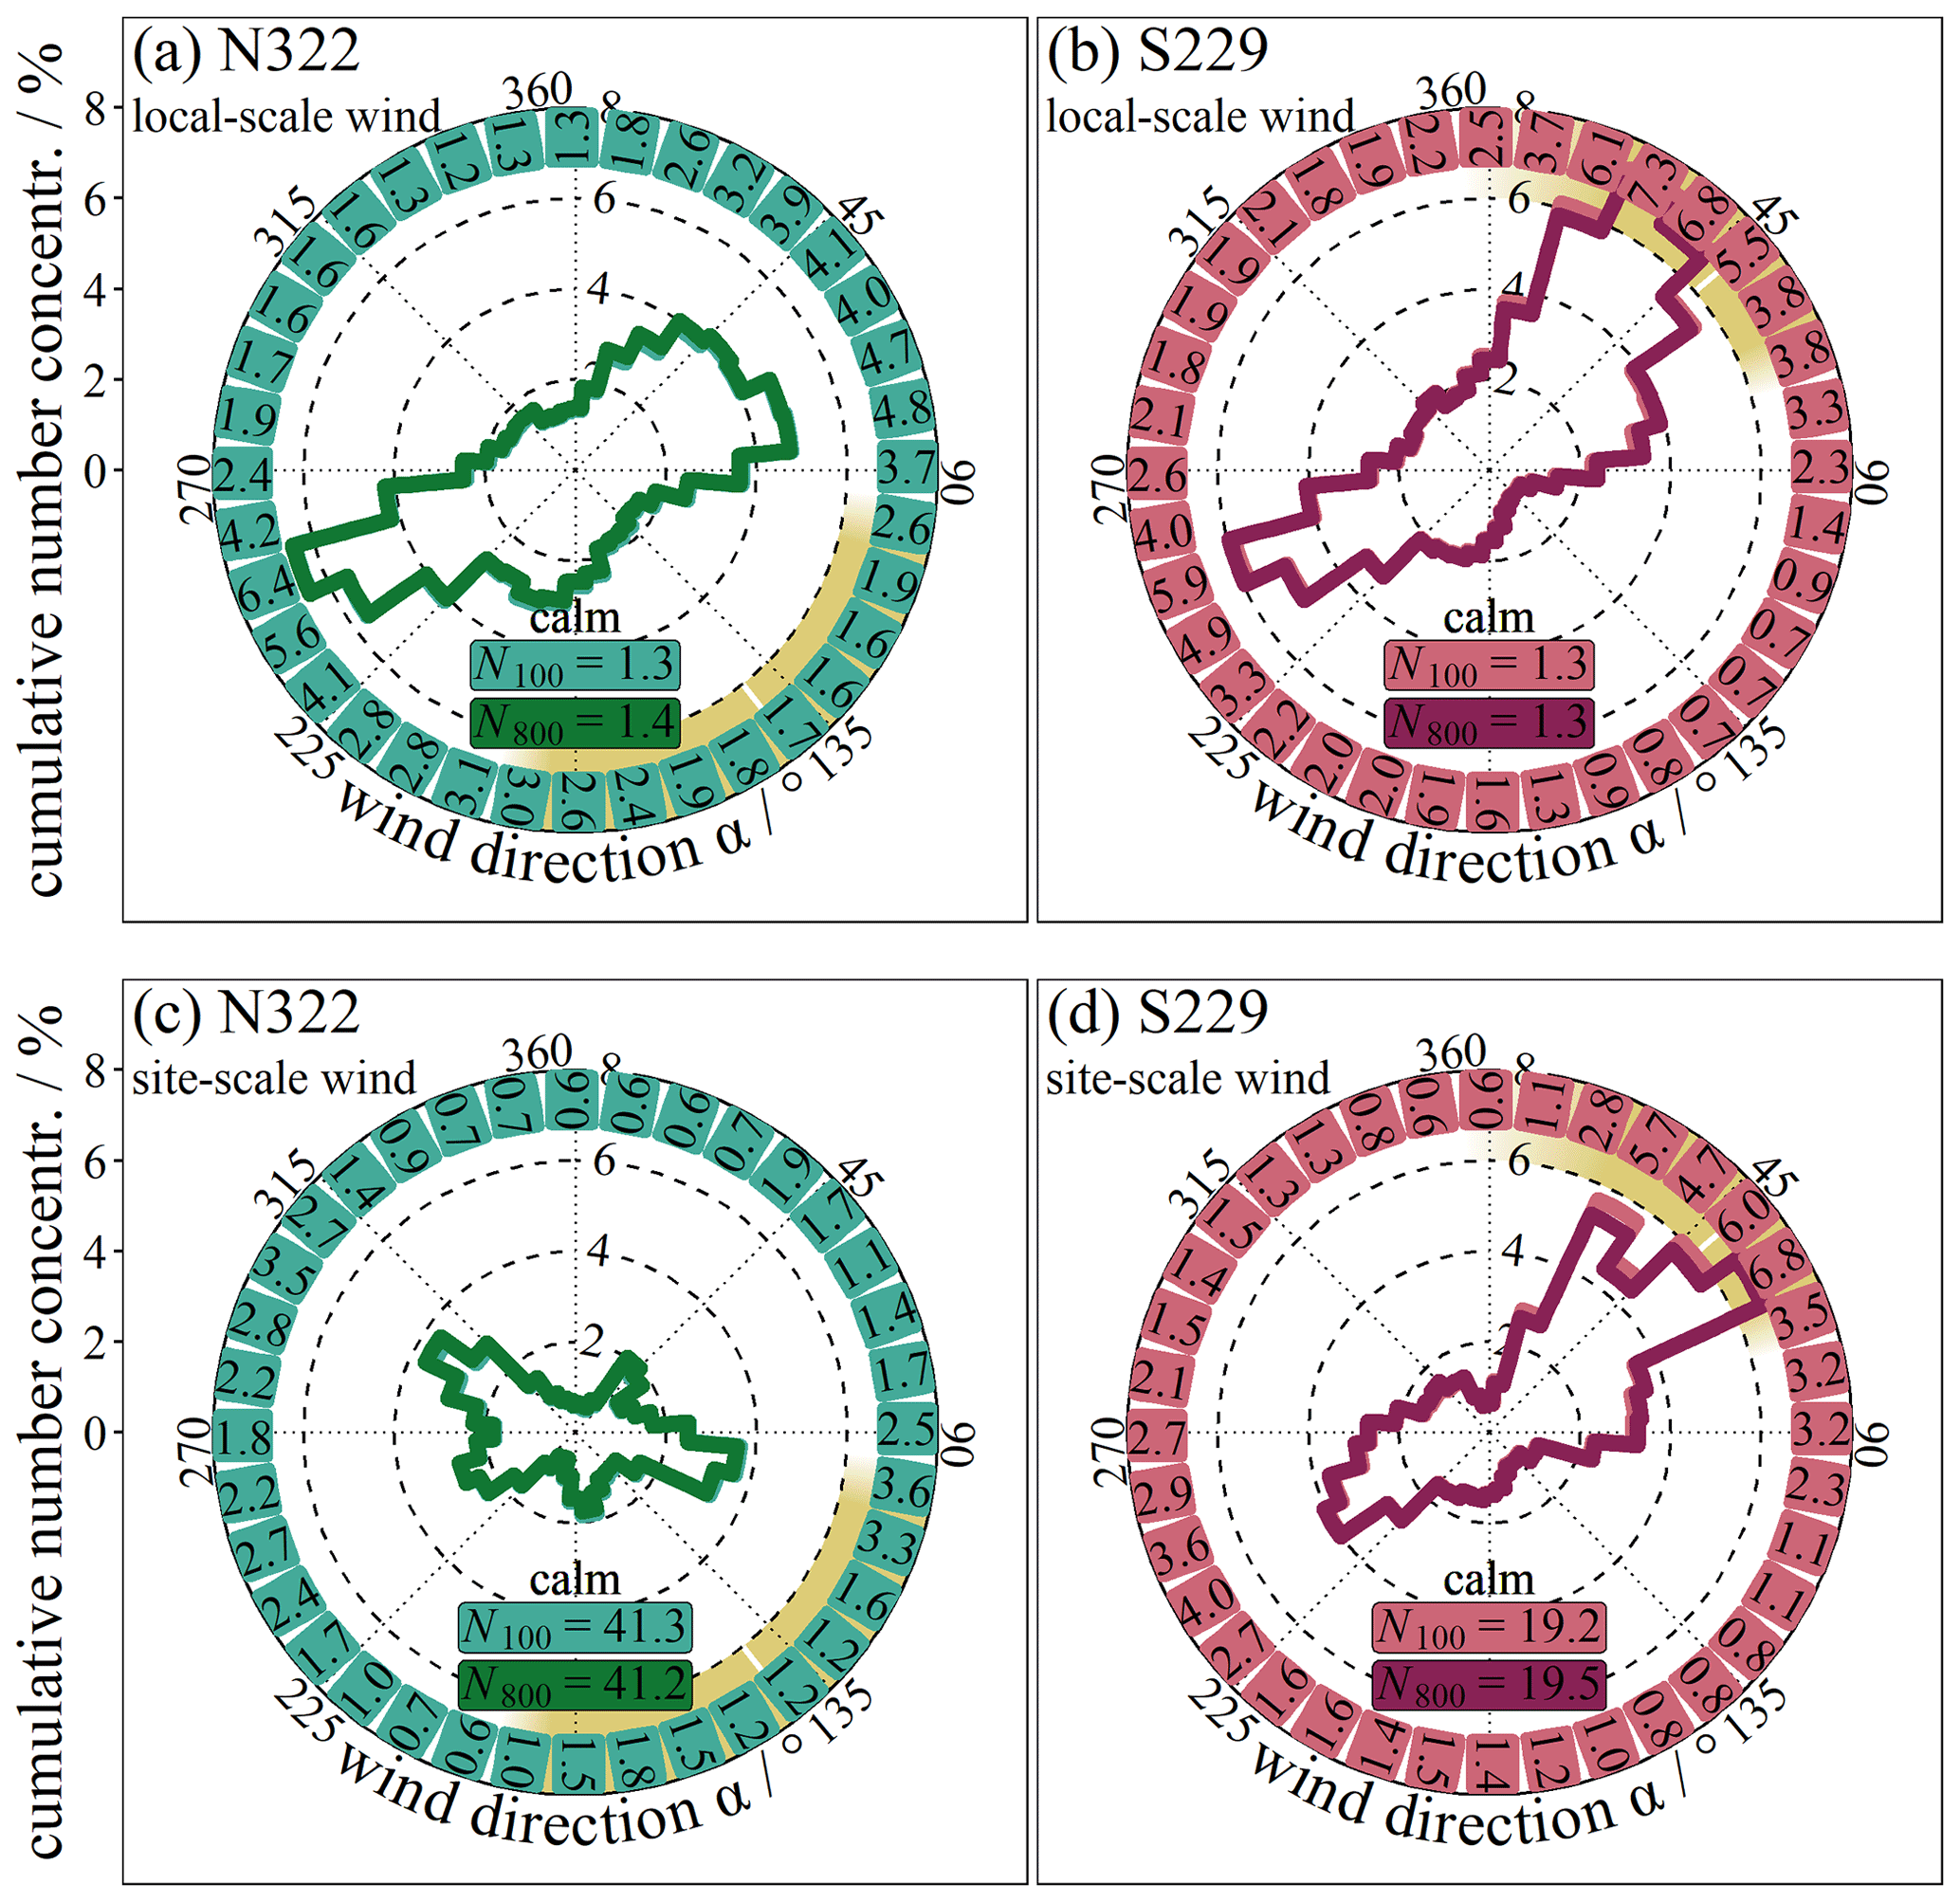
Figure 11Comparing cumulative concentration roses based on local-scale wind (source is the DWD) (top row) and site-scale wind (bottom row) for sites N322 in Freising (a, c) and S229 in Hallbergmoos (b, d) during the entire observation period for (a) and (b) and for November 2021 to July 2022 for (c) and (d) – see Fig. 5. The outer ring contains the values for the N100 fraction in each of the 36 bins; calms are noted as extra. The revolving labels are centred with the bins – see Table 2. The yellowish arc is the airport sector indicator – see Fig. 1.
To quantify the extent to which northern and southern adjacent residential areas were potentially impacted by UFPs advected from Munich Airport, the normalised cumulative number concentrations were again displayed as a function of wind direction in Fig. 11. This way, we can account for both (1) the frequency of wind directions as relatively more frequent wind directions are adding proportionally more to the cumulative particle number concentrations measured at each station and (2) the elevation of particle number concentrations as we previously observed with the concentration roses for certain wind directions.
Table 2Upper and lower limits of contribution for the sector including Munich Airport to cumulative particle number concentrations based on local-scale wind for certain size fractions. See also Fig. 11. All values are given in percentage (%).
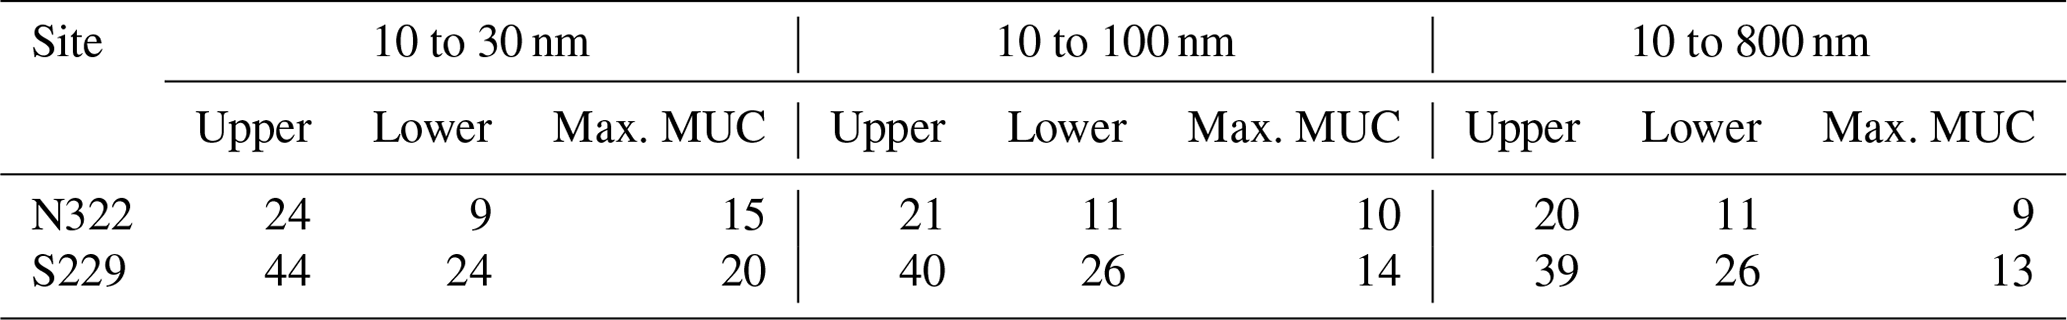
At first glance, the cumulative concentration roses appear to be more similar to the corresponding wind roses (Fig. 11) than to the concentration roses (Figs. 7 and 9). For the entire year and considering the local wind field based on data from DWD1262, at site N322 in Freising, 21 % of all N100 particles were sampled when wind was from Munich Airport (Table 2; Fig. 11, top row); 78 % of all N100 particles were sampled when wind came from other wind directions. The cumulative concentration rose is shaped differently when considering the wind data directly measured at each site (Fig. 12, bottom row). In this analysis, 18 % of all N100 particles were collected during times when wind directions included Munich Airport, while 41 % could be attributed to other wind directions and 41 % to calm conditions.
For site S229 in Hallbergmoos, local- and site-scale wind data overlap better, which can likely be explained by the more open surroundings of the site, with similar conditions as the DWD station at Munich Airport. Here, the fractions of N100 particles sampled with wind from the airport sector and with wind from all other directions were 40 % and 59 % when considering local wind data from DWD1262. They were 31 % and 50 % when considering wind data measured at the site, with 19 % of all N100 particles collected during calm conditions.
We consider these values from the sector including Munich Airport as the upper limit of the airport's possible contribution to the overall UFP mixture at a site. This is because parts of these particles may be transported along with the air prior to approaching Munich Airport, and other parts might have been introduced by additional sources between the airport and our sites. For interpretation, we can combine both stations' data in order to exclude the particles that originate from sources prior to Munich Airport and to estimate a background level, a lower limit.
For the example of Freising, the northern site N322, the wind directions with a potential impact by the airport are 95 to 195∘ (see Fig. 1). We can use the observed particle number concentrations at the southern station S229 in this particular sector as a background at site N322 for the following reasons: (1) both stations recorded almost the same cumulative number of particles during the course of the observation period and therefore are comparable. (2) Our comparison between local- and site-scale wind data showed agreement within the variability of the data set when considering the entire observation period of 1 year. Hence, we assume linear advection within a homogeneous, local wind field to be the main driver for particle transport. (3) The backgrounds of both sites are assumed to be similar because no other significant particle sources or only sources that contribute to the background of Freising and Hallbergmoos exist in close proximity prior to the airport for winds approaching from the southeast or the northeast. The background or lower limit of site S229 is calculated vice versa. Differences between the upper and lower limits give an estimate for the possible airport contribution to the annual cumulative particle concentration.
This estimate is a maximum value since the lower limit cannot account for sources that are in between the airport and the measuring sites.
For site N322, we calculate the lower and upper limits as 11 % and 21 %. Thus, out of all UFPs monitored in Freising in August 2021 to July 2022, up to 10 % were likely to have directly originated from Munich Airport and the surrounding infrastructure. For site S229, the lower and upper limits were calculated as 26 % and 40 %. This means that, out of all N100 particles detected in Hallbergmoos, 26 % approached from the wind directions attributed to the airport but are possibly background. Therefore, the airport likely contributed up to 14 % of all UFPs that were measured during the observation period. A summary of upper and lower limits for possible direct airport contributions is given in Table 2. Here, the fraction of particles with smaller mobility diameters (10 to 30 nm) has a relatively higher fraction of cumulative particle concentrations attributable to Munich Airport, with 15 % and 20 % for Freising and Hallbergmoos, respectively.
In this study, we presented the first UFP observations in adjacent residential areas around Munich Airport, covering 1 year (from August 2021 to July 2022). Our set-up presents a novel perspective on the ongoing discussion about the extent to which airports can impact the local air quality. We conducted simultaneous measurements at two sites, N322 (Freising) and S229 (Hallbergmoos), in close proximity to the airport that neither covered prevailing wind directions nor experienced any fly-overs. Hence, the sole import of UFPs from the airport into the adjacent residential areas was possible through advection from potential emission sources of ground-based activities or take-off and landing. With this novel approach, we explored three important aspects:
-
Overall potential impact of the airport on air quality in adjacent residential areas. Both locations had a similar airborne particle load as integrating over the entire measurement period of 1 year showed great agreement between the observed particle number concentrations at both sites for mean, median, and cumulative values. The annual median N800 particle number concentrations of 6150 cm−3 (N322, Freising) and 5860 cm−3 (S229, Hallbergmoos) were similar to other German urban background stations. Considering local wind, we found evidence of the airport's impact on the local air quality (1) from increases in N800 and N100 particle number concentrations for wind directions facing the airport by about a factor of 1.5 to 1.8 for the annual median, (2) from a shift of the modal maximum towards smaller mobility particle diameters associated with wind directions including the direction of Munich Airport, and (3) from a dependence of particle number concentrations and the size distribution on the airport's operation hours. We also found that the analysis of the combined data set of particle number concentrations monitored at the two sites and the local wind data monitored at the airport had limitations. Although the data set covers 1 year and therefore provides a statistically sound basis for analysis, a high variability persists, and the assumption of a local, homogeneous wind field likely added inaccuracy to the conclusions. For this reason, we next explored diurnal and seasonal effects, as well as the site-specific wind data.
-
The site-specific spatio-temporal characteristics of the airport's impact on local air quality. For the entire year, local- and site-scale concentration roses exhibited a similar shape and elevation ratio for particle number concentrations towards wind directions facing the airport. However, when we resolved the details of diurnal and seasonal variations, a potential impact of the airport on the two sites became less evident as it was likely covered by the variability of other sources and atmospheric conditions. The diurnal variation of particle number concentrations was typical for an urban air mixture displaying both local sources and atmospheric boundary layer development. The concentration roses featured a distinct seasonality, with a potential effect of vegetation on the surface roughness and hence on wind speed and flows. This in turn likely affects the simplified view of an advection-driven particle transport. Over the time period of 1 year, this might be negligible; however, in light of many field-campaign-based studies covering limited time periods, these site-specific alterations should be taken into account.
-
Upper and lower limits of potential UFP advection from Munich Airport into the adjacent residential areas. We introduced here a cumulative concentration rose which displays the number concentration of UFPs that a person would be exposed to when standing at the measuring sites N322 and S229 around Munich Airport for 1 year. This approach not only allowed us to explore the elevation of particle number concentrations for one wind direction in comparison to another but also provided a measure for the relative frequency of wind directions as they occurred during the observation period. Up to 21 % of all UFPs measured in Freising were measured during wind that was from the airport's direction. In the south, this fraction was higher at about 40 %. However, we found that there was a background of 11 % in Freising and 26 % in Hallbergmoos. Hence, it is likely that the ranges of UFP advection from Munich Airport to the measuring sites in Freising and Hallbergmoos were up to 10 % and 14 %. With this novel approach, we provided evidence for the contribution of the airport to the air quality of adjacent residential areas. We could account for the stations' backgrounds to estimate the relative magnitude of this contribution. However, UFP sources situated between the airport and measuring sites, such as traffic on the highway and related infrastructure, cannot be separated from this.
Note that, during the observation period analysed here, air traffic was still below that of pre-COVID-19 pandemic years in terms of flights. The airport's impact on local air quality will likely increase with increasing numbers of flights. Nevertheless, this study highlighted the importance of exploring the spatio-temporal variability of the combined view on particle number concentrations, size distributions, and wind direction frequency in detail. While further insight into the details of the underlying processes remains to be derived, we assessed here for the first time the potential impact of UFPs from Munich Airport on the air quality of adjacent residential areas.
The code and data used in this study are available by request to the corresponding author or to anke.noelscher@uni-bayreuth.de.
The supplement related to this article is available online at: https://doi.org/10.5194/acp-24-137-2024-supplement.
AN did the funding acquisition and conceptualisation of the project and provided supervision. AN and JS were responsible for project administration and developed the methodology. JS and MF conducted the investigation, operated the measurement stations, and assured validation of the results. JS was in charge of data curation, formal analysis, and visualisation and wrote the scripts and packages utilised for these tasks with support from CT and AN. JS and AN prepared the paper with contributions from all the co-authors.
The contact author has declared that none of the authors has any competing interests.
Publisher's note: Copernicus Publications remains neutral with regard to jurisdictional claims made in the text, published maps, institutional affiliations, or any other geographical representation in this paper. While Copernicus Publications makes every effort to include appropriate place names, the final responsibility lies with the authors.
We thank the cities of Freising and Hallbergmoos for their support during the site surveying and for the provision of the installation areas for our measurement stations. In addition, we thank the city of Freising for the ongoing financial support of the project. We would like to thank Kay Weinhold from the Leibniz Institute for Tropospheric Research and Sebastian Schmitt from TSI Germany GmbH for their support regarding the operation and quality assurance of MPSS and CPC devices. Also, we thank Alexander Vogel from the Goethe-University Frankfurt and Martin Obst from the University of Bayreuth for the critical discussion of the results. We thank Mike Pitz and Adam Mühlbauer from the Bavarian Environment Agency for the exchange on and the technology of the UFP measurement stations. Further, we thank the mechanical workshop at faculty II of the University of Bayreuth for manufacturing all the customised and special parts of our measuring containers. A special thank you goes to Agnes Bednorz and Andrej Einhorn, representing all the support we received from the members of the Atmospheric Chemistry group at the University of Bayreuth. This study was funded by the Deutsche Forschungsgemeinschaft (DFG, German Research Foundation) (grant no. 491183248) and by the Open Access Publication Fund of the University of Bayreuth.
This research has been funded by the Bavarian State Ministry of the Environment and Consumer protection (grant no. TLK01U-76519). This open-access publication was funded by the Open Access Publishing Fund of the University of Bayreuth and the Deutsche Forschungsgemeinschaft (DFG, German Research Foundation, grant no. 491183248).
This open-access publication was funded by the University of Bayreuth.
This paper was edited by James Allan and reviewed by two anonymous referees.
ADV (Arbeitsgemeinschaft Deutscher Verkehrsflughäfen): ADV Monthly Traffic Report 12/2017, Arbeitsgemeinschaft Deutscher Verkehrsflughäfen (ADV), Berlin, https://www.adv.aero/wp-content/uploads/2018/03/12.2017-ADVMonatsstatistik.pdf (last access: 7 October 2022), 2018.
ADV (Arbeitsgemeinschaft Deutscher Verkehrsflughäfen): ADV Monthly Traffic Report 12/2018, Arbeitsgemeinschaft Deutscher Verkehrsflughäfen (ADV), Berlin, https://www.adv.aero/wp-content/uploads/2019/03/12.2018-ADVMonatsstatistik.pdf (last access: 7 October 2022), 2019.
ADV (Arbeitsgemeinschaft Deutscher Verkehrsflughäfen): ADV Monthly Traffic Report 12/2019, Arbeitsgemeinschaft Deutscher Verkehrsflughäfen (ADV), Berlin, https://www.adv.aero/wp-content/uploads/2016/02/12.2019-ADVMonatsstatistik.pdf (last access: 7 October 2022), 2020.
ADV (Arbeitsgemeinschaft Deutscher Verkehrsflughäfen): ADV Monthly Traffic Report 12/2020, Arbeitsgemeinschaft Deutscher Verkehrsflughäfen (ADV), Berlin, https://www.adv.aero/wp-content/uploads/2015/11/12.2020-ADVMonatsstatistik-1.pdf (last access: 7 October 2022), 2021.
ADV (Arbeitsgemeinschaft Deutscher Verkehrsflughäfen): ADV Monthly Traffic Report Dezember 2021, Arbeitsgemeinschaft Deutscher Verkehrsflughäfen (ADV), Berlin, https://www.adv.aero/wp-content/uploads/2015/11/12.2021-ADVMonatsstatistik.pdf (last access: 7 October 2022), 2022.
Austin, E., Xiang, J., Gould, T. R., Shirai, J. H., Yun, S., Yost, M. G., Larson, T. V., and Seto, E.: Distinct Ultrafine Particle Profiles Associated with Aircraft and Roadway Traffic, Environ. Sci. Technol., 55, 2847–2858, https://doi.org/10.1021/acs.est.0c05933, 2021.
Bendtsen, K. M., Bengtsen, E., Saber, A. T., and Vogel, U.: A review of health effects associated with exposure to jet engine emissions in and around airports, Environ. Health, 20, 10, https://doi.org/10.1186/s12940-020-00690-y, 2021.
Ditas, F., Rose, D., and Jacobi, S.: 4. Bericht zur Untersuchung der regionalen Luftqualität auf ultrafeine Partikel im Bereich des Flughafen Frankfurt, Hessisches Landesamt für Naturschutz, Umwelt und Geologie (HLNUG), Wiesbaden, https://www.hlnug.de/fileadmin/dokumente/luft/luftqualitaet/sondermessprogramme/ufp/UFP-Bericht-4.pdf (last access: 5 October 2022), 2022.
Fushimi, A., Saitoh, K., Fujitani, Y., and Takegawa, N.: Identification of jet lubrication oil as a major component of aircraft exhaust nanoparticles, Atmos. Chem. Phys., 19, 6389–6399, https://doi.org/10.5194/acp-19-6389-2019, 2019.
Graham, A. and Raper, D. W.: Transport to ground of emissions in aircraft wakes. Part I: Processes, Atmos. Environ., 40, 5574–5585, https://doi.org/10.1016/j.atmosenv.2006.05.015, 2006.
Herndon, S. C., Onasch, T. B., Frank, B. P., Marr, L. C., Jayne, J. T., Canagaratna, M. R., Grygas, J., Lanni, T., Anderson, B. E., Worsnop, D., and Miake-Lye, R. C.: Particulate Emissions from in-use Commercial Aircraft, Aerosol Sci. Technol., 39, 799–809, https://doi.org/10.1080/02786820500247363, 2005.
Hsu, H.-H., Adamkiewicz, G., Houseman, E. A., Zarubiak, D., Spengler, J. D., and Levy, J. I.: Contributions of aircraft arrivals and departures to ultrafine particle counts near Los Angeles International Airport, Sci. Total Environ., 444, 347–355, https://doi.org/10.1016/j.scitotenv.2012.12.010, 2013.
Hudda, N., Gould, T., Hartin, K., Larson, T. V., and Fruin, S. A.: Emissions from an International Airport Increase Particle Number Concentrations 4-fold at 10 km Downwind, Environ. Sci. Technol., 48, 6628–6635, https://doi.org/10.1021/es5001566, 2014.
Hudda, N., Durant, L. W., Fruin, S. A., and Durant, J. L.: Impacts of Aviation Emissions on Near-Airport Residential Air Quality, Environ. Sci. Technol., 54, 8580–8588, https://doi.org/10.1021/acs.est.0c01859, 2020.
Jesus, A. L. de, Rahman, M. M., Mazaheri, M., Thompson, H., Knibbs, L. D., Jeong, C., Evans, G., Nei, W., Ding, A., Qiao, L., Li, L., Portin, H., Niemi, J. V., Timonen, H., Luoma, K., Petäjä, T., Kulmala, M., Kowalski, M., Peters, A., Cyrys, J., Ferrero, L., Manigrasso, M., Avino, P., Buonano, G., Reche, C., Querol, X., Beddows, D., Harrison, R. M., Sowlat, M. H., Sioutas, C., and Morawska, L.: Ultrafine particles and PM2.5 in the air of cities around the world: Are they representative of each other?, Environment Int., 129, 118–135, https://doi.org/10.1016/j.envint.2019.05.021, 2019.
Keuken, M. P., Moerman, M., Zandveld, P., Henzing, J. S., and Hoek, G.: Total and size-resolved particle number and black carbon concentrations in urban areas near Schiphol airport (the Netherlands), Atmos. Environ., 104, 132–142, https://doi.org/10.1016/j.atmosenv.2015.01.015, 2015.
Lammers, A., Janssen, N. A. H., Boere, A. J. F., Berger, M., Longo, C., Vijverberg, S. J. H., Neerincx, A. H., Maitland-van der Zee, A. H., and Cassee, F. R.: Effects of short-term exposures to ultrafine particles near an airport in healthy subjects, Environ. Int., 141, https://doi.org/10.1016/j.envint.2020.105779, 2020.
Lanzinger, E., Salzinger, F., and Jellinghaus, K.: Sensorik und System für den Wetterbeobachtungs- und Wettermeldedienst, v3.0., edited by: Wetterdienst (DWD), D., https://www.dwd.de/DE/leistungen/lf_11_flugwetterbetriebsdienste/handbuch_band_tech_v3.0.pdf?__blob=publicationFile&v=3 (last access: 12 May 2023), 2021.
Lopes, M., Russo, A., Monjardino, J., Gouveia, C., and Ferreira, F.: Monitoring of ultrafine particles in the surrounding urban area of a civilian airport, Atmos. Pollut. Res., 10, 1454–1463, https://doi.org/10.1016/j.apr.2019.04.002, 2019.
Masiol, M. and Harrison, R. M.: Aircraft engine exhaust emissions and other airport-related contributions to ambient air pollution: A review, Atmos. Environ., 95, 409–455, https://doi.org/10.1016/j.atmosenv.2014.05.070, 2014.
Ohlwein, S., Hoffmann, B., Kappeler, R., Joss, M. K., and Künzli, N.: Health Effects of Ultrafine Particles: Systematic literature search and the potential transferability of the results to the German setting, Umweltbundesamt, https://digital.bibliothek.uni-halle.de/pe/download/pdf/2901143 (last access: 11 April 2023), 2018.
Oke, T. R., Mills, G., Christen, A., and Voogt, J. A.: Air Pollution, in: Urban Climates, Cambridge University Press, 294–331, https://doi.org/10.1017/9781139016476.012, 2017.
Riffault, V., Arndt, J., Marris, H., Mbengue, S., Setyan, A., Alleman, L. Y., Deboudt, K., Flament, P., Augustin, P., Delbarre, H., and Wenger, J.: Fine and Ultrafine Particles in the Vicinity of Industrial Activities: A Review, Crit. Rev. Env. Sci. Tec., 45, 2305–2356, https://doi.org/10.1080/10643389.2015.1025636, 2015.
Rose, D., Ditas, F., and Jacobi, S.: 3. Bericht zur Untersuchung der regionalen Luftqualität auf ultrafeine Partikel im Bereich des Flughafens Frankfurt: Auswirkung des reduzierten Flugbetriebs während der COVID-19 Pandemie, Hessisches Landesamt für Naturschutz, Umwelt und Geologie, Wiesbaden, https://www.hlnug.de/fileadmin/dokumente/luft/sonstige_berichte/ufp/UFP_Bericht_Teil3_20201016.pdf (last access: 30 October 2020), 2020.
Schraufnagel, D. E.: The health effects of ultrafine particles, Exp. Mol. Med., 52, 311–317, https://doi.org/10.1038/s12276-020-0403-3, 2020.
Sun, J., Birmili, W., Hermann, M., Tuch, T., Weinhold, K., Spindler, G., Schladitz, A., Bastian, S., Löschau, G., Cyrys, J., Gu, J., Flentje, H., Briel, B., Asbach, C., Kaminski, H., Ries, L., Sohmer, R., Gerwig, H., Wirtz, K., Meinhardt, F., Schwerin, A., Bath, O., Ma, N., and Wiedensohler, A.: Variability of black carbon mass concentrations, sub-micrometer particle number concentrations and size distributions: results of the German Ultrafine Aerosol Network ranging from city street to High Alpine locations, Atmos. Environ., 202, 256–268, https://doi.org/10.1016/j.atmosenv.2018.12.029, 2019.
Trebs, I., Lett, C., Krein, A., and Junk, J.: Air quality impacts of aviation activities at a mid-sized airport in central Europe, Atmos. Pollut. Res., 14, 101696, https://doi.org/10.1016/j.apr.2023.101696, 2023.
Tremper, A. H., Jephcote, C., Gulliver, J., Hibbs, L., Green, D. C., Font, A., Priestman, M., Hansell, A. L., and Fuller, G. W.: Sources of particle number concentration and noise near London Gatwick Airport, Environ. Int., 161, 107092, https://doi.org/10.1016/j.envint.2022.107092, 2022.
Ungeheuer, F., van Pinxteren, D., and Vogel, A. L.: Identification and source attribution of organic compounds in ultrafine particles near Frankfurt International Airport, Atmos. Chem. Phys., 21, 3763–3775, https://doi.org/10.5194/acp-21-3763-2021, 2021.
Ungeheuer, F., Caudillo, L., Ditas, F., Simon, M., van Pinxteren, D., Kılıç, D., Rose, D., Jacobi, S., Kürten, A., Curtius, J., and Vogel, A. L.: Nucleation of jet engine oil vapours is a large source of aviation-related ultrafine particles, Commun. Earth Environ., 3, 319, https://doi.org/10.1038/s43247-022-00653-w, 2022.
von Bismarck-Osten, C., Birmili, W., Ketzel, M., Massling, A., Petäjä, T., and Weber, S.: Characterization of parameters influencing the spatio-temporal variability of urban particle number size distributions in four European cities, Atmos. Environ., 77, 415–429, https://doi.org/10.1016/j.atmosenv.2013.05.029, 2013.
Westerdahl, D., Fruin, S. A., Fine, P. L., and Sioutas, C.: The Los Angeles International Airport as a source of ultrafine particles and other pollutants to nearby communities, Atmos. Environ., 42, 3143–3155, https://doi.org/10.1016/j.atmosenv.2007.09.006, 2008.
Wiedensohler, A., Birmili, W., Nowak, A., Sonntag, A., Weinhold, K., Merkel, M., Wehner, B., Tuch, T., Pfeifer, S., Fiebig, M., Fjäraa, A. M., Asmi, E., Sellegri, K., Depuy, R., Venzac, H., Villani, P., Laj, P., Aalto, P., Ogren, J. A., Swietlicki, E., Williams, P., Roldin, P., Quincey, P., Hüglin, C., Fierz-Schmidhauser, R., Gysel, M., Weingartner, E., Riccobono, F., Santos, S., Grüning, C., Faloon, K., Beddows, D., Harrison, R., Monahan, C., Jennings, S. G., O'Dowd, C. D., Marinoni, A., Horn, H.-G., Keck, L., Jiang, J., Scheckman, J., McMurry, P. H., Deng, Z., Zhao, C. S., Moerman, M., Henzing, B., de Leeuw, G., Löschau, G., and Bastian, S.: Mobility particle size spectrometers: harmonization of technical standards and data structure to facilitate high quality long-term observations of atmospheric particle number size distributions, Atmos. Meas. Tech., 5, 657–685, https://doi.org/10.5194/amt-5-657-2012, 2012.
Yu, X., Venecek, M., Kumar, A., Hu, J., Tanrikulu, S., Soon, S.-T., Tran, C., Fairley, D., and Kleeman, M. J.: Regional sources of airborne ultrafine particle number and mass concentrations in California, Atmos. Chem. Phys., 19, 14677–14702, https://doi.org/10.5194/acp-19-14677-2019, 2019.
Zhang, X., Karl, M., Zhang, L., and Wang, J.: Influence of Aviation Emission on the Particle Number Concentration near Zurich Airport, Environ. Sci. Technol., 54, 14161–14171, https://doi.org/10.1021/acs.est.0c02249, 2020.
Zhu, Y., Fanning, E., Yu, R. C., Zhang, Q., and Froines, J. R.: Aircraft emissions and local air quality impacts from takeoff activities at a large International Airport, Atmos. Environ., 45, 6526–6533, https://doi.org/10.1016/j.atmosenv.2011.08.062, 2011.