the Creative Commons Attribution 4.0 License.
the Creative Commons Attribution 4.0 License.
Emissions of methane from coal fields, thermal power plants, and wetlands and their implications for atmospheric methane across the south Asian region
Mahalakshmi Venkata Dangeti
Kanchana Lakshmi Asuri
Sujatha Peethani
Ibrahim Shaik
Rajan Krishnan Sundara
Vijay Kumar Sagar
Raja Pushpanathan
Yogesh Kumar Tiwari
Prakash Chauhan
Atmospheric methane (CH4) is a potent climate change agent responsible for a fraction of global warming. The present study investigated the spatiotemporal variability of atmospheric-column-averaged CH4 (XCH4) concentrations using data from the Greenhouse gases Observing SATellite (GOSAT) and the TROPOspheric Monitoring Instrument on board the Sentinel-5 Precursor (S5P/TROPOMI) from 2009 to 2022 over the south Asian region. During the study period, the long-term trends in XCH4 increased from 1700 to 1950 ppb, with an annual growth rate of 8.76 ppb yr−1. Among all natural and anthropogenic sources of CH4, the rate of increase in XCH4 was higher over the coal site at about 10.15 ± 0.55 ppb yr−1 (Paschim Bardhaman) followed by Mundra Ultra Mega Power Project at about 9.72 ± 0.41 ppb yr−1. Most of the wetlands exhibit an annual trend of XCH4 of more than 9.50 ppb yr−1, with a minimum rate of 8.72 ± 0.3 ppb yr−1 over Wular Lake. The WetCHARTs-based emissions of CH4 from the wetlands were minimal during the winter and pre-monsoon seasons. Maximum CH4 emissions were reported during the monsoon, with a maximum value of 23.62 ± 3.66 mg m−2 per month over the Sundarbans Wetland. For the 15 Indian agroclimatic zones, significant high emissions of CH4 were observed over the Middle Gangetic Plain, Trans-Gangetic Plain, Upper Gangetic Plain, Eastern Coastal Plains, Lower Gangetic Plain, and East Gangetic Plain. Further, the bottom-up anthropogenic CH4 emissions data are mapped against the XCH4 concentrations, and a high correlation was found in the Indo-Gangetic Plain region, indicating the hotspots of anthropogenic CH4.
- Article
(6296 KB) - Full-text XML
- BibTeX
- EndNote
Atmospheric methane (CH4) is one of the high-potential greenhouse gases (GHGs) and plays a vital role in the chemistry of the atmosphere. In the troposphere, CH4 oxidation is due to hydroxyl (OH) radicals and produces carbon monoxide, carbon dioxide, and ozone in the presence of increased amounts of oxides of nitrogen. In contrast, in the stratosphere, oxidation of CH4 is by OH radicals, atomic oxygen, and chlorine (Nair and Kavitha, 2020). CH4 has enormous potential for global warming, about 28 times that of CO2 over 100 years (IPCC, 2021), and a comparatively short perturbation lifespan of about 12 years (Balcombe et al., 2018). Over the past decade, the research community has become more interested in anthropogenic CH4 concentration due to its persistent rise in the atmosphere and a lack of knowledge regarding its source or sink (Huang et al., 2015; Schneising et al., 2009). The long-term CH4 observations from the National Oceanic and Atmospheric Administration (NOAA) have shown a yearly increase of 8 ppb yr−1, while Shadnagar, an Indian site, shows an increase of 10 ppb yr−1 (Sreenivas et al., 2022). Though the emissions have increased over the past 20 years, the causes remain unclear. Recent research suggests that a combination of fossil fuel and agricultural emissions, with fluctuations in the CH4 sink in the atmosphere, also plays a part (Schaefer et al., 2016; Worden et al., 2017; Turner et al., 2019; Zhang et al., 2022). The decadal budget indicates that relative uncertainties may range from 20 % to 35 % for inventories of anthropogenic emissions in specific sectors (agriculture, waste, fossil fuels); 50 % for emissions from burning biomass and emissions from natural wetland ecosystems; and 100 % or more for emissions from other natural sources, which include inland waters and geological sources (Saunois et al., 2024). Maasakkers et al. (2023) reported the annual gridded CH4 emission inventory over the United States of America (USA) while meeting the US Environmental Protection Agency (USEPA) emission inventory standards at 0.1° × 0.1° spatial resolution. These data were submitted to the United Nations in 2020, reporting improved uncertainties in the global Emission Database for Global Atmospheric Research (EDGAR). Geographically, India's wetlands comprise 4.7 % of the nation's total land area (Bassi et al., 2014; Kavitha and Nair, 2016). The primary sources of CH4 emissions include natural emissions from freshwater systems, wetlands, and geological sources and anthropogenic emissions from waste management, agriculture, and the mining and burning of fossil fuels (Kirschke et al., 2013; Saunois et al., 2016; Ganesan et al., 2019).
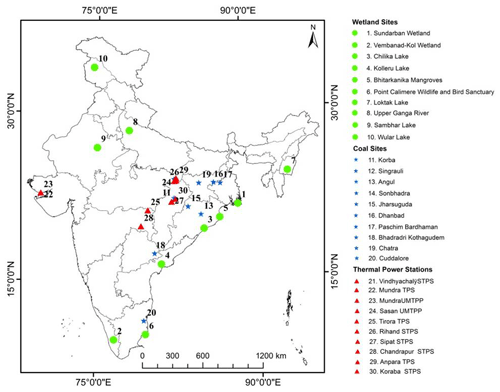
Figure 1Study locations are as follows: top 10 wetlands selected based on the area, represented by green circles; top 10 coal mine locations in India based on production capacity, indicated by blue stars; and top 10 thermal power stations, denoted by red triangles.
Wetlands are a natural source that contributes 20 % to 40 % of global emissions and dominate the inter-annual variability (Parker et al., 2018). Only limited studies have been conducted in India about CH4 discharge from wetlands. A recent study (Vinna et al., 2021) shows that natural wetlands could produce 50 % to 80 % more CH4 emissions by 2100. According to Schlesinger et al. (2009), wetlands, rice paddies, and ruminants are the leading producers of CH4 on the Indian subcontinent. According to Hayashida et al. (2013), there is a seasonal pattern in the CH4 concentration over the Indian subcontinent, with higher values during the post-monsoon and minima in the pre-monsoon period. Kavitha and Nair (2016) used the SCIAMACHY-retrieved methane product over the Indian region to understand the spatiotemporal variations. The salient findings of this study are that during the monsoon and post-monsoon periods, high column CH4 (XCH4) values are observed in the northern regions. Different seasonal behaviour is observed, with a seasonal peak in the post-monsoon period and low levels during the monsoon in the southern peninsular regions. These regional variations are due to the distribution of sources like livestock population, rice cultivation, wetland, biomass burning, and oil and gas mining. Along with temperature, precipitation, and radiation, the CH4 emissions from the natural wetlands might affect the region's heat budgeting, exacerbating global warming on a local, regional, and even global scale (Sakalli et al., 2017). Thermal power plants are responsible for a large amount of the GHG emissions from the energy sector. Each thermal power plant has a different set of emission factors for methane and nitrous oxide, based on operating conditions and combustion technology (Kang et al., 2019). The integrated measure of CH4 includes contributions from the various vertical atmospheric layers, ranging from the Earth's surface measurement point to the uppermost layer of the atmosphere. Chandra et al. (2017) studied the raised air mass in the 600–200 hPa height layer over northern India, which accounts for 40 % of the seasonal CH4 augmentation during the southwest (SW) monsoon season. Conversely, in the semi-arid region, the height over 600 hPa contributed up to approximately 88 % of the amplitude of the XCH4 seasonal cycle, while the atmosphere below 600 hPa contributed only around 12 %. Air mass transport processes in the Asian monsoon region are the main reason for the increased contributions from above 600 hPa across the northern Indian region.
Insufficient datasets exist regarding the CH4 feedback originating from wetlands; a study on the precise estimation of CH4 outflow from wetlands and its impact on local/regional global warming scenarios is urgently needed. The ability to identify spatial and temporal fluctuations in atmospheric CH4 from space, due to recent technological developments in remote sensing, could help fill in the gaps left by measurements performed by ships, planes, and the ground (Frankenberg et al., 2011; Kuze et al., 2009; Kavitha et al., 2018). The present study focuses on the implications of emissions from coal fields, thermal power plants, and wetlands for atmospheric methane over south Asia using XCH4 data from the Greenhouse gases Observing SATellite (GOSAT) and the TROPOspheric Monitoring Instrument on board the Sentinel-5 Precursor (S5P/TROPOMI) from 2009 to 2022. It has further analysed the spatial and temporal pattern of atmospheric CH4 variations and emissions and their correlation with anthropogenic CH4 emissions from the bottom-up emission inventory of EDGAR. The wetland methane emissions were addressed using WetCHARTs v1.3.1 over the top 10 wetland sites of the present study. The response of atmospheric CH4 concentrations to anthropogenic emissions in various agroclimatic zones of India was further highlighted in this study using XCH4 data from 2001 to 2022.
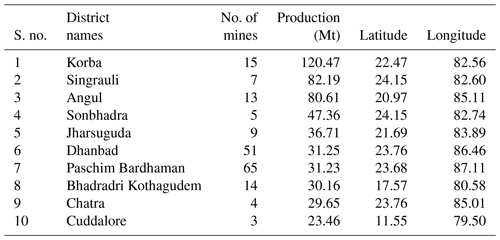
The distribution of CH4 sources over the Indian region is shown in Fig. 1. The focus of the study was three CH4 source regions – coal fields, thermal power plants, and the Ramsar wetlands. More details about Ramsar wetlands can be found in the following. The number of coal mines in India varies from 1 to 65, and the top 10 coal fields were selected for this study based on their production capacity. During 2019–2020, coal and lignite production ranged between 0.1 and 120.47 Mt. The details of the studied coal mines are provided in Table 1. Similarly, Table 2 lists the thermal power stations according to their respective power generation.
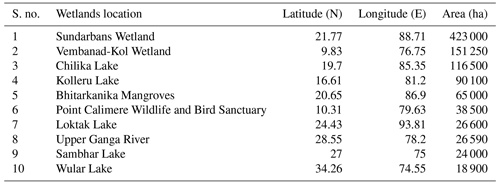
The Ramsar Convention is an international agreement that was created in 1971 to protect wetlands and promote their sustainable use (https://rsis.ramsar.org, last access: 15 January 2023). As of November 2022, the Ministry of Environment, Forests and Climate Change (MoEFCC), Government of India, identified 75 Ramsar wetland sites in India, spanning a total area of 1 335 530 ha. Based on the total geographical area coverage (Table 3), the top 10 sites were selected for the current investigation. The size of these wetlands ranges from 423 000 ha (Sundarbans Wetland, West Bengal) to 18 900 ha (Wular Lake, Jammu, and Kashmir) (https://indianwetlands.in/wetlands-overview/indias-wetlands-of-international-importance/, last access: 10 April 2024; PIB Press Release on World Wetlands Day, dated 26 August 2022).
The GOSAT series developed by the Japan Aerospace Exploration Agency (JAXA) continuously monitors CO2 and CH4 from space (Kuze et al., 2009). The present study obtained the level-2 (L2) column CH4 (XCH4) from the GOSAT. On board the GOSAT, the Thermal And Near-infrared (NIR) Sensor for carbon Observation Fourier Transform Spectrometer (TANSO-FTS) is used to detect the CO2 and CH4 absorption spectra in the shortwave IR (1.60 µm & 2.0 µm) region (Kuze et al., 2009; Kavitha et al., 2018). Ground-based Fourier transform infrared (FTIR) measurements of XCH4 by the Total Carbon Column Observing Network (TCCON) are used extensively to validate the GOSAT retrievals. Retrieval bias and precision of column abundance from GOSAT SWIR observations have been estimated as approximately 15–20 ppb and 1 %, respectively (Morino et al., 2011; Yoshida et al., 2013). In the present study, the atmospheric CH4 was obtained from 2009 to 2022 within a 100 km radius of the coal mines. The data corresponding to the quality flag =0 were considered for the study only.
The Sentinel-5 Precursor satellite, launched on 13 October 2017, is equipped with the TROPOspheric Monitoring Instrument (TROPOMI), which tracks cloud characteristics, aerosols, and trace gases (Sentinel-5P, 2019). With a daily pass time of approximately 13:30 local solar time, the instrument's spectrometer measures reflected sunlight in the ultraviolet, visible, NIR, and SWIR spectral windows. The CH4 retrieval algorithm uses the two spectral bands, i.e. reflectance in NIR (757–774 nm) and SWIR (2305–2385 nm) (Kozicka et al., 2023). Initially, retrievals based on TROPOMI had a spatial resolution of 7×7 km2 (along track × across track, Lorente et al., 2021). From August 2019 to the present, the resolution was increased to 5.5×7 km2 (Sagar et al., 2022). The latest data version is now v2 from 1 July 2021 to the present. The quality flag <0.5 was only considered as per the product README file document (Sentinel-5P, 2019). Methane retrieval from TROPOMI agrees with ground-based FTIR XCH4 retrievals from TCCON and the Network for Detection of Atmospheric Composition Change (NDACC). The systematic differences of the bias-corrected XCH4 data with respect to TCCON and NDACC data are, on average, −0.26 ± 0.56 % and 0.57 ± 0.83 %, respectively (Song et al., 2023).
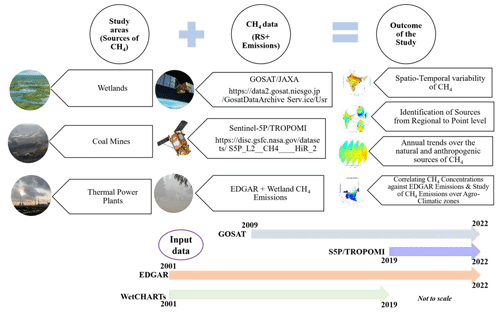
The data within the coal mines and wetlands area were taken from 1 May 2018 to 30 April 2022. The individual shapefiles were given for each wetland field, and the satellite passes within the area were considered for the current study. As shown in Fig. 2, a detailed procedure is explained in this section. The present study utilized the total anthropogenic emissions from EDGAR (https://edgar.jrc.ec.europa.eu/gallery?release=v50&substance=CH4§or=TOTALS, last access: 1 November 2023). Uncertainties in the information on source intensity, activity, and other statistical data are key parameters for the uncertainties in the EDGAR emission inventory (Janardanan et al., 2017). Bottom-up inventory uncertainties range between 20 % and 35 % for agriculture, waste, and fossil fuel sectors; 50 % for biomass burning and natural wetland emissions; and 100 % or higher for natural sources such as geological seeps and inland waters for global methane emissions (Saunois et al., 2024).
Further, the present study also utilized wetland methane emissions (mg m−2 per month) from WetCHARTs v1.3.1 (https://daac.ornl.gov/CMS/guides/MonthlyWetland_CH4_WetCHARTs.html, last access: 4 August 2024) which is available at a spatial resolution of 0.5° × 0.5° with monthly temporal resolution. The scale factor utilized here is 124.5 Tg CH4 yr−1. We selected the coal fields based on production as shown in Table 1. The data on all coal mines in India, their production, and their location are available in Pai and Zeriffi (2021) and Halder et al. (2024). Each district has open-cast or underground types of mines found in India, and the number of coal mines varies from 1 to 65. The coal/lignite production ranged from 0.1 to 120.47 Mt during 2019–2020. The details of the coal mines in the present study are summarized in Table 1, and their locations are mapped in Fig. 1.
The list is prepared based on the descending order of total production in each district in India. There are 262 thermal power stations with a full capacity of 229.335 GW (gigawatts) and a total unit of 2689 in India, based on diesel, gas turbine, and steam as on 31 March 2020. Table 2 shows the list of thermal power stations.
There are 11 new Ramsar sites that were identified in 2022 (total 75 sites) by the Ministry of Environment, Forests and Climate Change (MoEFCC), India, covering a total area of 1 093 636 ha as of 2022. The present study considered the top 10 sites based on high area coverage (Table 3). The area ranges from 18 900 ha (Wular Lake) to 423 000 ha (Sundarbans Wetland).
4.1 Spatiotemporal variability of space-based atmospheric CH4
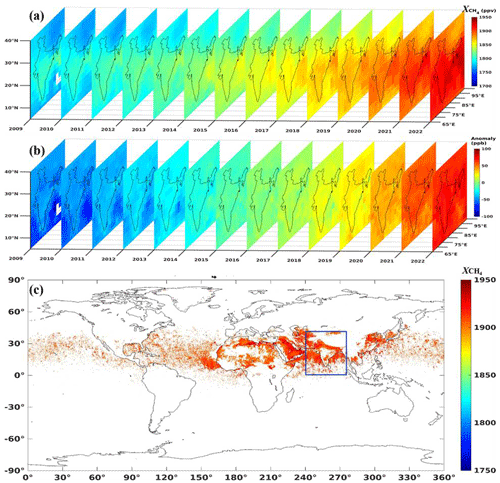
Figure 3(a) Remote sensing (GOSAT) of atmospheric CH4 variability over the Indian subcontinent, (b) anomaly during 2009 to 2022, and (c) identification of probable high CH4 concentration using S5P/TROPOMI data from 2019 to 2022 over the study region.
In the present study, we examined the annual space–time distribution of the XCH4, obtained from the GOSAT-1 and GOSAT-2 over south Asia as shown in Fig. 3a–b from 2009 to 2022 (N=14 years) – the long-term trends in XCH4 increased from 1700 to 1950 ppb from 2009 to 2022, with an annual growth rate of 8.76 ppb yr−1. This growth rate is statistically tested, with a p value of less than 0.05 for n=3803 observations. A distinct, evident annual growth in CH4 is seen over the Indian subcontinent. Figure 3b shows the spatiotemporal residuals calculated using the data from 2009 to 2022. Residuals indicate that the acceleration of CH4 emissions in India has been significant since 2015. Before 2015, the CH4 concentrations were lower by 20 to 50 ppb compared to the total mean of the study period, indicating a slow rise in CH4 activities. However, post-2015, an increase in CH4 was observed at a maximum of 100 ppb compared to the total mean, which indicates the surged emission rates from varied sources of CH4 (Lu et al., 2023). To identify the critical potential high-emission zones of CH4, the present study applied the 90th percentile statistical filter, as shown in Fig. 3c. The percentile is often used to detect the points that are significantly different from the rest of the data. Statistically significant high concentrations of CH4 are observed in tropical regions (Feng et al., 2023). In the box highlighted blue (latitude: 0°–40° N and longitude: 60°–100° E), higher concentrations of CH4 were observed in the Indo-Gangetic Plain (IGP) and northwest (NW) areas of India, southeast (SE) China, and NW China. Southern China and northern China are marked with wetlands and rice paddy fields, which are the primary sources of CH4 (Kavitha et al., 2018; Chandra et al., 2019; Guo et al., 2023). High concentrations of CH4 over the IGP and NW of India are due to the population density and various industries that contribute to the emissions of CH4 and emissions from the rice paddy fields, respectively. In the present study, Fig. 1 also shows the locations of coal and thermal power plants in India. Globally, the tropical wetlands ecosystem accounts for about 20 % of the total global source (Saunois et al., 2020; Shaw et al., 2022), evidenced by bottom-up and top-down inventories. The study in the following sections assessed the CH4 growth rate associated with the source type over the Indian region.

Figure 4(a) Spatiotemporal distribution of annual XCH4 as a function of latitude during 2010 to 2022. (b) Global XCH4 trend (ppb yr−1) using GOSAT data.
Figure 4 shows the spatiotemporal distribution of XCH4 as a function of latitude, which depicts the annual variability at each latitude covering the Northern Hemisphere (NH) and Southern Hemisphere (SH). There is a transparent latitudinal gradient in space. A strong diffusion of CH4 is observed from the Northern Hemisphere to SH during 2009 to 2022. During 2010, the XCH4 was distributed nearly constantly at all latitudes, indicating the stability of emissions from natural and anthropogenic sources. However, the gradient between the NH and SH has narrowed down, with a growth rate of 12 ppb yr−1 in 2022, reflecting the dominance of anthropogenic emissions over the tropics and unidentified leaks from the tropical wetlands and natural gas (Rocher-Ros et al., 2023). More thoroughly, the characteristics of regional and global spatiotemporal variations are revealed by the continuous XCH4 data in space and time. Figure 4 displays a latitudinal gradient, and each latitudinal zone's growth tendencies are comparable. Figure 4b shows XCH4 has increased the global mean trend from 7 to 9 ppb yr−1. There are hotspots in the XCH4 trend observed in the Tibetan Plateau (8.2 to 9 ppb yr−1), South America (8.2 to 8.8 ppb yr−1), and the African continent (8 to 8.4 ppb yr−1), and in the rest of the world it varies from 6.75 to 8 ppb yr−1. Similarly high values were reported in the Tibetan Plateau from 2010 to 2022 (Wei et al., 2019) and 8 ppb yr−1 (Song et al., 2023) from 2009 to 2021 using GOSAT data.
4.2 Assessment of XCH4 over different source types in India
Figures 5a–c show the monthly time series of XCH4 over the specific sources of CH4 plotted in the Indian region from 2009 to 2022. Over the Indian subcontinent and SE Asia, the October–November period exhibits the highest amounts of CH4, while the period from March through June often sees the lowest (Sreenivas et al., 2016; Song et al., 2023) because of the enormous diversity in the climate zones of the Asian region. The seasonal cycle (peak and trough) of XCH4 is strongly associated with the vegetation during the active phase of cultivation and reduced photochemical reaction by the hydroxyl radicals, respectively. The major sink for CH4 is by the oxidation of OH radicals in the troposphere, which removes 90 % of CH4 from the atmosphere (Crutzen and Zimmermann, 1991). However, the potential availability of OH radicals in the atmosphere is not steady and changes rapidly depending upon the presence of solar ultraviolet radiation and other trace gases such as ozone, oxides of nitrogen (NO+NO2), and water vapour (Sreenivas et al., 2016).
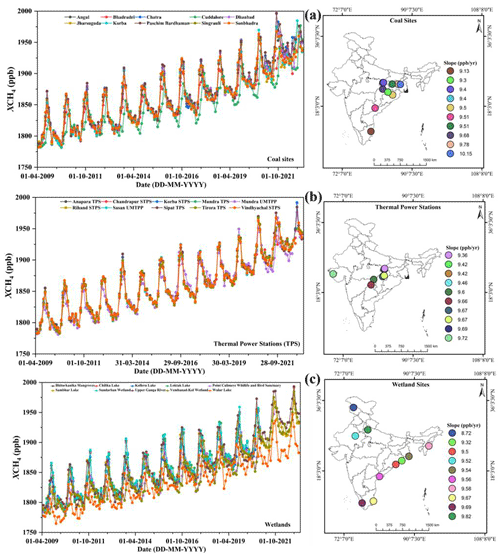
Figure 5Monthly time series of XCH4 over the (a) coal sites, (b) thermal power stations, and (c) wetlands showing the sources of emissions and the overall growth rate at the respective site.
Over the coal fields, thermal power plants, and wetlands, the XCH4 shows typical seasonal behaviour, with maximum activity during the post-monsoon (October–November) and minimum activity in the pre-monsoon (March–May) period, as shown in Fig. 6. A seasonal maximum of XCH4 was observed over coal fields and thermal power plants from September to October and a minimum in the pre-monsoon period (March–May). In the case of wetlands, a shift in seasonal maxima varies from site to site, indicating their respective active phase of methanogens and the magnitude of the seasonal amplitude, which is a function of the individual wetland area. Methanogens are microscopic organisms that break down organic substances in an oxygen-free environment. Thus, wetlands are perfect for methanogens to grow and release CH4 since they are usually oxygen-poor, moist habitats (Zhang et al., 2023). Therefore, the present study investigated the above-listed wetlands. Most of the wetlands exhibit an annual growth rate of XCH4 greater than 9.50 ppb yr−1, with high concentrations over Sundarbans Wetland (area = 423 000 ha), and there is pronounced seasonality at all sites and lower concentrations over Wular Lake (area = 18 900 ha), with an annual trend of 8.72 ± 0.3 ppb yr−1. During the examination period, the seasonal trends (slope) at each location, as summarized in Tables 1–3, were evaluated using Sen's slope-based Mann–Kendall test, with a significance of p value < 0.05 (Pathakoti et al., 2021). The rate of increase in XCH4 was higher over the Upper Ganga (area = 26 590 ha) with a slope of 9.82 ± 0.52 ppb yr−1, followed by Vembanad-Kol Wetland (area = 151 250 ha) with a slope of 9.69 ± 0.44 ppb yr−1. Over the Sundarbans Wetland, West Bengal (area = 423 000 ha), the rate of increase in XCH4 is 9.54 ± 0.51 ppb yr−1. To investigate further, the present study quantified the source-based natural CH4 fluxes from each wetland using the WetCHARTs data in the following section.
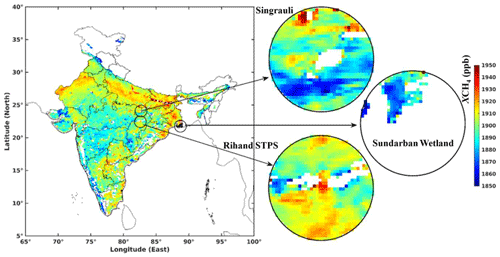
Figure 7S5P/TROPOMI XCH4 gridded to 0.05° × 0.05° over the Indian region and XCH4 over wetlands, coal field, and thermal power plant sites with a radius of 100 km.
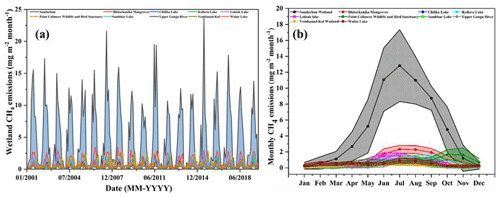
Figure 8(a) Monthly time series of methane emissions (mg m−2 per month) over the wetland sites and (b) seasonal methane emissions over the wetland sites from 2001 to 2019.
Typically, the Indian climate is hot and humid, causing disturbances in the rainfall patterns; an increase in the waterlogged soils expands the wetlands (Zhang et al., 2023). Typical tropical wetlands are acting as positive feedback to climate change (Salimi et al., 2021). Irrespective of the power production capacity, over the thermal power plants, the CH4 exhibited stabilized seasonality at each location. However, the growth rate of XCH4 was higher over Mundra Ultra Mega Power Project (UMPP), Gujarat, with a slope of 9.72 ± 0.41 ppb yr−1, followed by Mundra Thermal Power Station (TPS), with a slope of 9.69 ± 0.4 ppb yr−1. The Mundra TPS and UMPP, Gujarat, have a total power capacity of 8620 MW with 14 units. With 2630 MW installed power capacity, the Anpara TPS exhibited an XCH4 growth rate of 9.36 ± 0.5 ppb yr−1. This indicated that the higher-potential power plants contribute more CH4 emissions to the atmosphere. Over the coal mines, Paschim Bardhaman (31.23 Mt, 65 mines) shows a high XCH4 trend of about 10.15 ± 0.55 ppb yr−1, followed by Dhanbad (31.25 Mt, 51 mines) and Korba (120.47 Mt, 15 mines), which shows a XCH4 trend of 9.78 ± 0.53 ppb yr−1 and 9.68 ± 0.52 ppb yr−1, respectively. Angul (80.61 Mt, 13 mines) and Chatra (29.65 Mt, 4 mines) show a XCH4 trend of 9.51 ± 0.5 ppb yr−1. The lowest annual trend in XCH4 was observed over the Cuddalore coal mine (23.46 Mt, 3 mines), which is about 9.13 ± 0.4 ppb yr−1. Anthropogenic emissions influence the methane growth trend. Wetland and biomass burning emissions determine the interannual variability (Fu et al., 2024).
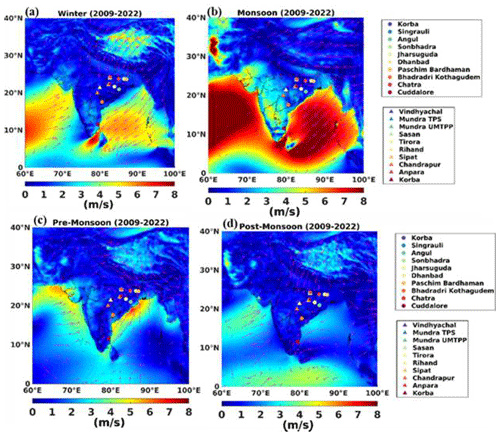
Figure 9Long-term seasonal winds for source types (coal fields and thermal power plants) for the period 2009–2022: (a) winter, (b) monsoon, (c) pre-monsoon, and (d) post-monsoon periods, respectively.
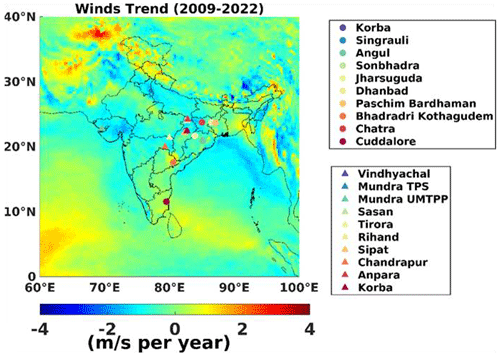
Figure 10Long-term spatial trend of winds over the Indian region covering source types (coal fields and thermal power plants) for the period 2009–2022.
Figure 7 shows the continuous XCH4 data from the S5P/TROPOMI at 0.05° × 0.05°, complementing the GOSAT efforts in monitoring the XCH4 dynamics in space and time. We demonstrated the spatiotemporal variation characteristics of XCH4 more comprehensively at three different source type locations (wetland, coal field, and thermal power plant): high XCH4 concentrations over the coal field and thermal power station sites and relatively lower concentrations at the wetland site. We concluded that the high-resolution S5P/TROPOMI has the potential to detect the point source variability. The growth rates of XCH4 over the wetlands compete with coal sites, indicating an equivalent anthropogenic source. Results of the analysis in the context of thermal power plants and coal mines indicate that the emissions from the fossil fuel industries are significant, and the release of CH4 into the atmosphere is commensurate with the production of the power and mining capacity.
4.3 CH4 emission from India’s wetlands
In addition to the anthropogenic emissions, the present study utilized the global monthly wetlands emission estimates from the Wetland Methane Emissions and Uncertainty (WetCHARTs v1.3.1) inventory (Bloom et al., 2017a, b; Bloom et al., 2021). Figure 8a shows the monthly CH4 emission over India's top 10 wetland sites from 2001 to 2019, and Fig. 8b represents the long-term seasonally averaged CH4 emission over wetlands. Emissions of CH4 from the wetlands were minimal in the winter season (December to February) and pre-monsoon (March–May). In the tropical region, winter and pre-monsoon seasons are considered dry months, with moderate to high temperatures and less precipitation.
A study by Peng et al. (2022) and Feng et al. (2022) hypothesized that warmer and wetter wetlands contribute significantly to the high CH4 emissions to the atmosphere. Typical climatological (1991–2020) mean temperatures (accumulated seasonal precipitation) over India during winter, pre-monsoon, monsoon, and post-monsoon periods are 20 °C (23 mm), 28 °C (98 mm), 26 °C (867 mm), and 23 °C (106 mm), respectively (https://climateknowledgeportal.worldbank.org/country/india/climate-data-historical, last access: 29 August 2024). At all the wetland study sites during the study period, the maximum CH4 emission was reported during the monsoon months with a maximum value of 23.62 ± 3.66 mg m−2 per month over the Sundarbans Wetland, which is the largest protected wetland of India and mangrove forest in the world. Besides climatic conditions, the emissions of CH4 are positively correlated with the size of the wetland, thus reporting maximum CH4 emission over the Sundarbans site. High natural CH4 emissions during the monsoon positively correlate with the atmospheric XCH4 concentrations.
Further, Mann–Kendall-based statistical analysis was carried out to assess the annual trend in the CH4 emissions, and a significant trend was found over Wular Lake, with an increasing rate of 0.04 mg m−2 yr−1, with a p value of 0.01. An annual trend of XCH4 was about 8.72 ± 0.3 ppb yr−1 in this study. The current research highlights the need for further investigation to correlate the temperature and associated precipitation influence on methane oxidation and microbial activities in detail, which thus modulates the CH4 emissions from the wetlands.
4.4 Long-term seasonal winds over the source locations
The 10 m u wind component of wind from ERA5, which is the reanalysis product used in the present study for the period 2009–2022. Figure 9 shows the long-term seasonal winds for coal fields and thermal power plants for the period 2009–2022. During winter, winds are primarily from a northeast (NE) direction, with low wind speeds at the study locations. During monsoon and pre-monsoon periods, the majority of winds are from the SW direction, with medium to high wind speeds arriving at the source locations. At the coal fields and thermal power plants, winds from the SW during the pre-monsoon period, when relatively clean air mass is transported from the ocean to land, could also influence the observed low CH4 concentrations along with the continued source activity and seasonality. Quantification of CH4 fluxes with an improved accuracy also needs information about the prevailing winds at the source locations. Bussmann et al. (2024) established a detailed relationship between modulation in CH4 fluxes against the wind speed and direction in their studies.
Figure 10 shows the trend in wind speeds over the coal fields and thermal power plants from 2009–2022. Around the coal mine sites, a positive trend in wind speed is observed over the Cuddalore coal mine site (0.42 m s−1 yr−1), whereas the remaining coal mine sites show a negative trend in wind speed. The maximum negative trend is observed over the Sonbhadra coal mine site (1.21 m s−1 yr−1), and the minimum negative trend is observed over the Bhadradri Kothagudem coal mine (0.18 m s−1 yr−1). A negative trend in wind speed is observed over all the thermal power plants, with a maximum trend observed over the Vindhyachal Super Thermal Power Station (STPS; 1.23 m s−1 yr−1) and a minimum over the Sipat STPS (0.63 m s−1 yr−1). Over the wetland sites, a positive trend in wind speed is observed over the Point Calimere Wildlife and Bird Sanctuary (0.25 m s−1 yr−1) and Wular Lake (0.20 m s−1 yr−1). All the remaining wetland sites show a negative trend in wind speed. Besides the surface emissions, column CH4 values are also varied by the background flow advection and unstable boundary layer due to strong convection (vertical mixing) in the daytime (Ricaud et al., 2014; Francis et al., 2023). A negative trend is observed over the source locations in the present study, indicating relatively slower dispersion at these locations, thus modulating column CH4 values.
4.5 CH4 emissions over India’s agroclimatic zones
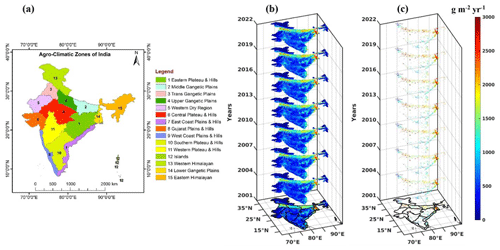
India is divided into 15 agroclimatic zones according to the combination of soil types and climatic conditions (Choudhary and Sirohi, 2022). These zones offer a structure for the nation's development and execution of agricultural policies and practices. The crops and farming methods that are most appropriate for the environmental conditions in each zone are distinct from one another. Out of natural and anthropogenic sources of CH4, agricultural activity is also one of the dominant contributors to CH4 dynamics in the atmosphere. Figure 11a–c show India's 15 agroclimatic zones and spatiotemporal trends of CH4 emissions obtained from the bottom-up emission inventory of EDGAR (Crippa et al., 2020) from 2001 to 2022. Significant high emissions of CH4, as shown in Fig. 11c, were reported over the Middle Gangetic Plain (MGP) (2), Trans-Gangetic Plain (TGP) (3), Upper Gangetic Plain (UGP) (4), Eastern Coastal Plains (ECPH) (7), Lower Gangetic Plain (LGP) (14), and East Gangetic Plain (EGP) (15). These agroclimatic zones have active farming in rice, wheat, sugarcane, maize, millet, gram, cotton, etc. Besides traditional farming, the Lower Gangetic Plain has also actively contributed to livestock, horticulture, and forage production (Ahmad et al., 2017). Among all 15 agroclimatic zones, the MGP, TGP, UGP, ECPH, LGP, and EGP have exhibited high emissions of CH4, indicating the diversification of agricultural practices and homogenous traditions of agricultural production. A production system based on rice–wheat (R-W) is mainly being practised in this region, which is causing negative effects on climate (Taneja et al., 2019). CH4 emissions over the northwest region are exhibiting a weak contribution compared to other agroclimatic zones of India.
4.6 Spatial correlation between XCH4 concentrations and emissions over India
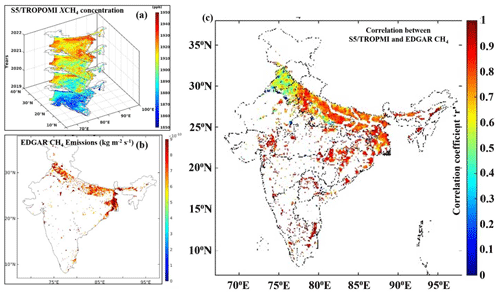
To understand the relationship between India's high XCH4 concentration zones and emissions, we have computed pixel-level correlation between S5P/TROPOMI-measured XCH4 concentrations and the bottom-up inventory of EDGAR-based XCH4 anthropogenic emissions. Figure 12a–c show XCH4 concentrations from S5P/TROPOMI, EDGAR-based anthropogenic emissions, and their correlation coefficient. The spatial patterns of XCH4 concentrations agree well with the high-emission regions. The correlation coefficient r is strongly positive in the IGP region, which shows more CH4 emission into the atmosphere through rapid industrial activity and anthropogenic contribution from human activity due to the high population density. Besides the IGP region, the r value is also strong in the east and northeast region due to the emissions from natural sources such as agricultural activities, livestock, and wetlands (Behera et al., 2022).
Since the beginning of the Industrial Revolution, growing human populations have resulted in increased waste production, agriculture, and the use of fossil fuels. Therefore, this study demonstrated the spatiotemporal dynamics of XCH4 in the atmosphere and associated natural (wetlands) and anthropogenic sources (coal fields and thermal power plants) in the Indian region. The present study utilized the remote-sensing-based XCH4 data from the GOSAT and the S5P/TROPOMI from 2009 to 2022. The following are the salient findings of the study.
-
The present study demonstrated the continuous XCH4 data from the S5P/TROPOMI and the GOSAT to effectively monitor the XCH4 dynamics in space and time.
-
Long-term trends of XCH4 show significant annual growth from 2009 to 2022 in CH4 over the Indian subcontinent, with a yearly growth rate of 8.76 ppb, which is in line with the global trend.
-
Long-term temporal and spatial distribution characteristics and variations of CH4 emissions in India have accelerated in the last decade, and globally, a substantial diffusion of CH4 is observed from the Northern to the Southern Hemisphere.
-
XCH4 levels peak in September–October over coal fields and thermal power plants but reach their minimum during March–May. The seasonal maxima of wetlands vary from site to site and are related to their size and active phase of methanogens.
-
The majority of the wetlands show an annual growth rate in XCH4 of about 9.50 ppb yr−1, which indicates areas that are rich in moist habitats and active methanogen processes.
-
The high XCH4 trend of 9.72 ± 0.41 ppb yr−1 from Mundra UMPP, Gujarat, and the Paschim Bardhaman coal mine (slope of 10.15 ± 0.55 ppb yr−1) indicated elevated and significant emissions from fossil fuel industries as compared to natural sources.
-
The highest CH4 emission estimate was observed during the monsoon season over the Sundarbans Wetland, the largest protected wetland in India, with a maximum value of 23.62 ± 3.66 mg m−2 per month. Among the wetland sites, Wular Lake has a rising methane rate of 0.04 mg m−2 per month, with a p value of 0.01.
-
The high levels of CH4 emissions seen in the MGP, TGP, UGP, ECPH, LGP, and EGP agroclimatic zones may be related to the varied farming methods and traditional agricultural output in these regions. Most of these areas revolve around the rice–wheat farming system, which is negatively impacting the climate.
-
The spatial patterns of XCH4 concentrations agree well with the high-emission regions. The correlation coefficient r is strongly positive in the IGP region.
-
Therefore we conclude that the space-based XCH4 dataset provides significant support in tracking long-term changes in CH4 and provides insightful information on the causes and feedback mechanisms for the elevated concentrations of methane across the south Asian region.
The code used in the present study will be available from the author upon request.
GOSAT data (https://data2.gosat.nies.go.jp/index_ja.html, GOSAT, 2024), TROPOMI data (https://doi.org/10.5270/S5P-3p6lnwd, Copernicus Sentinel data processed by ESA, 2019), the EDGAR bottom-up inventory (https://edgar.jrc.ec.europa.eu/gallery?release=v50&substance=CH4§or=TOTALS, European Commission, 2024), and wetland methane emissions and uncertainty data (https://doi.org/10.3334/ORNLDAAC/1915, Bloom et al., 2021) used in the present study are freely available and can be downloaded as summarized in Fig. 2 with the user’s credentials.
DVM: conceptualization, formal analysis, writing (original draft). MP: conceptualization, formal analysis, writing (original draft). ALK: conceptualization, formal analysis, writing (original draft). SP: formal data analysis and writing (original draft). IS: analysis. KSR: writing (review and editing). VKS: formal data analysis and data curation. PR: writing (review and editing). YKT: writing (review and editing). PC: writing (review and editing).
The contact author has declared that none of the authors has any competing interests.
Publisher’s note: Copernicus Publications remains neutral with regard to jurisdictional claims made in the text, published maps, institutional affiliations, or any other geographical representation in this paper. While Copernicus Publications makes every effort to include appropriate place names, the final responsibility lies with the authors.
We sincerely thank the director of NRSC-ISRO, for his kind guidance and support. Authors greatly acknowledge JAXA and the National Institute of Environmental Studies (NIES) for providing free access to the GOSAT XCH4 observations (https://data2.gosat.niesgo.jp/GosatDataArchiveServ.ice/usr/download, last access: 15 June 2023) and NASA Earthdata for giving access to the S5P/TROPOMI (https://disc.gsfc.nasa.gov/datasets/S5P_L2_CH4_HiR_2/summary, last access: 15 June 2023) data. We also thank the European Commission’s Joint Research Centre (JRC) for providing the CH4 bottom-up inventory of EDGAR (https://edgar.jrc.ec.europa.eu/gallery?release=v50&substance=CH4§or=TOTALS, last access: 25 July 2023). We also thank the Oak Ridge National Laboratory (ORNL) Distributed Active Archive Center (DAAC) for providing the wetland methane emissions data. This work has been carried out as part of the Technology Development Project (TDP) entitled “Investigation of Atmospheric GHGs Emissions over the Indian Region (AGE)” and the Land-Ocean-Atmospheric GHG Interaction Experiments (LOAGIN-X) of the Geosphere-Biosphere programme of the Climate and Atmospheric Processes of ISRO (CAP-IGBP). We are very grateful to the anonymous reviewers and the handling editor for their constructive comments and suggestions, which helped us to improve the manuscript.
This paper was edited by Bryan N. Duncan and reviewed by three anonymous referees.
Ahmad, L., Kanth, R., Parvaze, S., and Mahdi, S.: Agro-climatic and Agro-ecological Zones of India. In: Experimental Agrometeorology: A Practical Manual. Springer, Cham., ISBN 978-3-31-969185-5, 99–118, https://doi.org/10.1007/978-3-319-69185-5_15, 2017.
Balcombe, P., Speirs, J. F., Brandon, N. P., and Hawkes, A. D.: Methane emissions: Choosing the right climate metric and time horizon, Environ. Sci. Process. Impacts, 20, 1323–1339, https://doi.org/10.1039/C8EM00414E, 2018.
Bassi, N., Dinesh, K. M., Anuradha, S., and PardhaSaradhi, P.: Status of wetlands in India: A review of extent, ecosystem benefits, threats and management strategies, J. Hydrol. Reg. Stud., 2, 1–19, https://doi.org/10.1016/j.ejrh.2014.07.001, 2014.
Behera, M. D., Mudi, S., Shome, P., Das, P. K., Kumar, S., Joshi, A., Rathore, A., Deep, A., Kumar, A., Sanwariya, C., and Kumar, N.: COVID-19 slowdown induced improvement in air quality in India: Rapid assessment using Sentinel-5P TROPOMI data, Geocarto Int., 37, 8127–8147, https://doi.org/10.1080/10106049.2021.1993351, 2022.
Bloom, A. A., Bowman, K. W., Lee, M., Turner, A. J., Schroeder, R., Worden, J. R., Weidner, R., McDonald, K. C., and Jacob, D. J.: A global wetland methane emissions and uncertainty dataset for atmospheric chemical transport models (WetCHARTs version 1.0), Geosci. Model Dev., 10, 2141–2156, https://doi.org/10.5194/gmd-10-2141-2017, 2017a.
Bloom, A. A., Bowman, K. W., Lee, M., Turner, A. J., Schroeder, R., Worden, J. R., Weidner, K. C., McDonald, K. C., and Jacob, D. J.: CMS: Global 0.5-deg Wetland Methane Emissions and Uncertainty (WetCHARTs v1.0), ORNL DAAC, Oak Ridge, Tennessee, USA, https://doi.org/10.3334/ORNLDAAC/1502, 2017b.
Bloom, A. A., Bowman, K. W., Lee, M., Turner, A. J., Schroeder, R., Worden, J. R., Weidner, K. C., McDonald, K. C., and Jacob, D. J.: CMS: Global 0.5-deg Wetland Methane Emissions and Uncertainty (WetCHARTs v1.3.1), ORNL DAAC, Oak Ridge, Tennessee, USA [data set], https://doi.org/10.3334/ORNLDAAC/1915, 2021.
Bussmann, I., Achterberg, E. P., Brix, H., Brüggemann, N., Flöser, G., Schütze, C., and Fischer, P.: Influence of wind strength and direction on diffusive methane fluxes and atmospheric methane concentrations above the North Sea, Biogeosciences, 21, 3819–3838, https://doi.org/10.5194/bg-21-3819-2024, 2024.
Chandra, N., Hayashida, S., Saeki, T., and Patra, P. K.: What controls the seasonal cycle of columnar methane observed by GOSAT over different regions in India?, Atmos. Chem. Phys., 17, 12633–12643, https://doi.org/10.5194/acp-17-12633-2017, 2017.
Chandra, N., Venkataramani, S., Lal, S., Patra, P. K., Ramonet, M., Lin, X., and Sharma, S. K.: Observational evidence of high methane emissions over a city in western India, Atmos. Environ., 202, 41–52 https://doi.org/10.1016/j.atmosenv.2019.01.007, 2019.
Choudhary, B. B. and Sirohi, S.: Understanding vulnerability of agricultural production system to climatic stressors in North Indian Plains: a meso-analysis, Environ. Dev. Sustain., 24, 13522–13541, https://doi.org/10.1007/s10668-021-01997-7, 2022.
Copernicus Sentinel data processed by ESA: Koninklijk Nederlands Meteorologisch Instituut (KNMI)/Netherlands Institute for Space Research (SRON): Sentinel-5P TROPOMI Methane CH4 1-Orbit L2 5.5 km × 7 km, Greenbelt, MD, USA, Goddard Earth Sciences Data and Information Services Center (GES DISC), https://doi.org/10.5270/S5P-3p6lnwd, 2019.
Crippa, M., Solazzo, E., Huang, G., Guizzardi, D., Koffi, E., Muntean, M., Schieberle, C., Friedrich, R., and Janssens-Maenhout, G.: High resolution temporal profiles in the Emissions Database for Global Atmospheric Research, Sci. Data, 7, 1–17 pp., https://doi.org/10.1038/s41597-020-0462-2, 2020.
Crutzen, P. J. and Zimmermann, P. H.: The changing photochemistry of the troposphere, Tellus B, 43, 136–151, https://doi.org/10.3402/tellusb.v43i4.15403, 1991.
European Commission: Global Greenhouse Gas Emissions – EDGAR v5.0, EDGAR – Emissions Database for Global Atmospheric Research, European Commission [data set], https://edgar.jrc.ec.europa.eu/gallery?release=v50&substance=CH4§or=TOTALS (last access: 25 December 2022), 2024.
Feng, L., Palmer, P. I., Zhu, S., Parker, R. J., and Liu, Y.: Tropical methane emissions explain large fraction of recent changes in global atmospheric methane growth rate, Nat. Commun., 13, 1378, https://doi.org/10.1038/s41467-022-28989-z, 2022.
Feng, L., Palmer, P. I., Parker, R. J., Lunt, M. F., and Bösch, H.: Methane emissions are predominantly responsible for record-breaking atmospheric methane growth rates in 2020 and 2021, Atmos. Chem. Phys., 23, 4863–4880, https://doi.org/10.5194/acp-23-4863-2023, 2023.
Francis, D., Weston, M., Fonseca, R., Temimi, M., and Alsuwaidi, A.: Trends and variability in methane concentrations over the Southeastern Arabian Peninsula, Front. Environ. Sci., 11, 1177877, https://doi.org/10.3389/fenvs.2023.1177877, 2023.
Frankenberg, C., Aben, I., Bergamaschi, P., Dlugokencky, E. J., Van Hees, R., Houweling, S., Van Der Meer, R., Snel, R., and Tol, P.: Global column-averaged methane mixing ratios from 2003 to 2009 as derived from SCIAMACHY: Trends and variability, J. Geophys. Res.-Atmos., 116, D04302, https://doi.org/10.1029/2010JD014849, 2011.
Fu, B., Jiang, Y., Chen, G., Lu, M., Lai, Y., Suo, X., and Li, B.: Unraveling the dynamics of atmospheric methane: the impact of anthropogenic and natural emissions, Environ. Res. Lett., 19, 064001, https://doi.org/10.1088/1748-9326/ad4617, 2024.
Ganesan, A. L., Schwietzke, S., Poulter, B., Arnold, T., Lan, X., Rigby, M., Vogel, F. R., van der Werf, G. R., Janssens-Maenhout, G., Boesch, H., Pandey, S., Manning, A. J., Jackson, R. B., Nisbet, E. G., and Manning, M. R.: Advancing scientific understanding of the global methane budget in support of the Paris Agreement, Global Biogeochem. Cy., 33, 1475–1512, https://doi.org/10.1029/2018GB006065, 2019.
GOSAT: News and Topics, GOSAT Data Archive Service (GDAS), https://data2.gosat.nies.go.jp/index_ja.html (last access: 6 November 2022), 2024.
Guo, M., Cheng, C. and Wu, X.: Mapping the heterogeneity of global methane footprint in China at the subnational level, J. Environ. Manage., 345, 118479, https://doi.org/10.1016/j.jenvman.2023.118479, 2023.
Halder, B., Bandyopadhyay, J., and Mukherjee, S.: An assessment of environmental impacts in mining areas of Paschim Bardhhaman district, West Bengal, India, Discov. Geosci., 2, 9, https://doi.org/10.1007/s44288-024-00009-1, 2024.
Hayashida, S., Ono, A., Yoshizaki, S., Frankenberg, C., Takeuchi, W., and Yan, X.: Methane concentrations over Monsoon Asia as observed by SCIAMACHY: signals of methane emission from rice cultivation, Remote Sens. Environ., 139, 246–256, https://doi.org/10.1016/j.rse.2013.08.008, 2013.
Huang, L., Tang, M., Fan, M., and Cheng, H.: Density functional theory study on the reaction between hematite and methane during chemical looping process, Appl. Energy, 159, 132–144, https://doi.org/10.1016/j.apenergy.2015.08.011, 2015.
IPCC: Climate change: The physical science basis, Contribution of Working Group I to the sixth assessment report of the intergovernmental panel on climate change, https://www.ipcc.ch/report/ar6/wg1/ (last access: 10 January 2024), 2021.
Janardanan, R., Maksyutov, S., Ito, A., Yukio, Y. and Matsunaga, T.: Assessment of anthropogenic methane emissions over large regions based on GOSAT observations and high-resolution transport modelling, Remote Sens., 9, 941, https://doi.org/10.3390/rs9090941, 2017.
Kang, M., Mauzerall, D. L., Ma, Z., and Celia, M. A.: Reducing methane emissions from abandoned oil and gas wells: Strategies and costs, Energy Pol., 132, 594–601, https://doi.org/10.1016/j.enpol.2019.05.045, 2019.
Kavitha, M. and Nair, P. R.: Region-dependent seasonal pattern of methane over Indian region as observed by SCIAMACHY, Atmos. Environ., 131, 316–325, https://doi.org/10.1016/j.atmosenv.2016.02.008, 2016.
Kavitha, M., Nair, P. R., Girach, I. A., Aneesh, S., Sijikumar, S., and Renju, R.: Diurnal and seasonal variations in surface methane at a tropical coastal station: Role of mesoscale meteorology, Sci. Total Environ., 631, 1472–1485, https://doi.org/10.1016/j.scitotenv.2018.03.123, 2018.
Kirschke, S., Bousquet, P., Ciais, P., Saunois, M., Canadell, J. G., Dlugokencky, E. J., Bergamaschi, P., Bergmann, D., Blake, D. R., Bruhwiler, L., Cameron-Smith, P., Castaldi, S., Chevallier, F., Feng, L., Fraser, A., Heimann, M., Hodson, E. L., Houweling, S., Josse, B., Fraser, P. J., Krummel, P. B., Lamarque, J.-F., Langenfelds, R. L., Le Quéré, C., Naik, V., O’Doherty, S., Palmer, P. I., Pison, I., Plummer, D., Poulter, B., Prinn, R. G., Rigby, M., Ringeval, B., Santini, M., Schmidt, M., Shindell, D. T., Simpson, I. J., Spahni, R., Steele, L. P., Strode, S. A., Sudo, K., Szopa, S., van der Werf, G. R., Weiss, R. F., Williams, J. E., and Zeng, G.: Three decades of global methane sources and sinks, Nat. Geosci., 6, 813–823, https://doi.org/10.1038/ngeo1955, 2013.
Kozicka, K., Orazalina, Z., Gozdowski, D., and Wójcik-Gront, E.: Evaluation of temporal changes in methane content in the atmosphere for areas with a very high rice concentration based on Sentinel-5P data, Remote Sens. Appl.: Soc. Environ., 30, 100972, https://doi.org/10.1016/j.rsase.2023.100972, 2023.
Kuze, A., Suto, H., Nakajima, M., and Hamazaki, T.: Thermal and near infrared sensor for carbon observation Fourier-transform spectrometer on the Greenhouse Gases Observing Satellite for greenhouse gases monitoring, Appl. Opt., 48, 6716–6733, https://doi.org/10.1364/AO.48.006716, 2009.
Lan, X., Thoning, K. W., and Dlugokencky, E. J.: Trends in globally-averaged CH4, N2O, and SF6 determined from NOAA Global Monitoring Laboratory measurements, Version 2024-01, https://doi.org/10.15138/P8XG-AA10, 2024.
Feng, L., Palmer, P. I., Parker, R. J., Lunt, M. F., and Bösch, H.: Methane emissions are predominantly responsible for record-breaking atmospheric methane growth rates in 2020 and 2021, Atmos. Chem. Phys., 23, 4863–4880, https://doi.org/10.5194/acp-23-4863-2023, 2023.
Lu, X., Jacob, D. J., Zhang, Y., Shen, L., Sulprizio, M. P., Maasakkers, J. D., Varon, D. J., Qu, Z., Chen, Z., Hmiel, B., and Parker, R. J.: Observation-derived 2010-2019 trends in methane emissions and intensities from US oil and gas fields tied to activity metrics, P. Natl. Acad. Sci. USA, 120, e2217900120, https://doi.org/10.1073/pnas.1814297116, 2023.
Maasakkers, J. D., McDuffie, E. E., Sulprizio, M. P., Chen, C., Schultz, M., Brunelle, L., Thrush, R., Steller, J., Sherry, C., Jacob, D. J., Jeong, S., Irving, B., and Weitz, M.: A gridded inventory of annual 2012–2018 US anthropogenic methane emissions, Environ. Sci. Technol., 57, 16276–16288, 2023.
Morino, I., Uchino, O., Inoue, M., Yoshida, Y., Yokota, T., Wennberg, P. O., Toon, G. C., Wunch, D., Roehl, C. M., Notholt, J., Warneke, T., Messerschmidt, J., Griffith, D. W. T., Deutscher, N. M., Sherlock, V., Connor, B., Robinson, J., Sussmann, R., and Rettinger, M.: Preliminary validation of column-averaged volume mixing ratios of carbon dioxide and methane retrieved from GOSAT short-wavelength infrared spectra, Atmos. Meas. Tech., 4, 1061–1076, https://doi.org/10.5194/amt-4-1061-2011, 2011.
Nair, P. R. and Kavitha, M.: Stratospheric distribution of methane over a tropical region as observed by MIPAS on board ENVISAT, Int. J. Remote Sens., 41, 8380–8405, 2020.
Pai, S. and Zeriffi, H.: A novel dataset for analysing sub-national socioeconomic developments in the Indian coal industry, IOP SciNotes, 2, 014001, https://doi.org/10.1088/2633-1357/abdbbb, 2021.
Parker, R. J., Boesch, H., McNorton, J., Comyn-Platt, E., Gloor, M., Wilson, C., Chipperfield, M. P., Hayman, G. D., and Bloom, A. A.: Evaluating year-to-year anomalies in tropical wetland methane emissions using satellite CH4 observations, Remote Sens. Environ., 211, 261–275, https://doi.org/10.1016/j.rse.2018.02.011, 2018.
Pathakoti, M., Santhoshi, T., Aarathi, M., Mahalakshmi, D. V., Kanchana, A. L., Srinivasulu, J., Soni, V. K., and Raja, P.: Assessment of spatio-temporal climatological trends of ozone over the Indian region using machine learning, Spat. Stat., 43, 100513, https://doi.org/10.1016/j.spasta.2021.100513, 2021.
Peng, S., Lin, X., Thompson, R. L., Xi, Y., Liu, G., Hauglustaine, D., Lan, X., Poulter, B., Ramonet, M., Saunois, M., and Yin, Y.: Wetland emission and atmospheric sink changes explain methane growth in 2020, Nature, 612, 477–482, https://doi.org/10.1038/s41586-022-05588-1, 2022.
Ricaud, P., Sič, B., El Amraoui, L., Attié, J.-L., Zbinden, R., Huszar, P., Szopa, S., Parmentier, J., Jaidan, N., Michou, M., Abida, R., Carminati, F., Hauglustaine, D., August, T., Warner, J., Imasu, R., Saitoh, N., and Peuch, V.-H.: Impact of the Asian monsoon anticyclone on the variability of mid-to-upper tropospheric methane above the Mediterranean Basin, Atmos. Chem. Phys., 14, 11427–11446, https://doi.org/10.5194/acp-14-11427-2014, 2014.
Rocher-Ros, G., Stanley, E. H., Loken, L. C., Casson, N. J., Raymond, P. A., Liu, S., Amatulli, G., and Sponseller, R. A.: Global methane emissions from rivers and streams, Nature, 621, 530–535, https://doi.org/10.1038/s41586-023-06344-6, 2023.
Salimi, S., Almuktar, S. A., and Scholz, M.: Impact of climate change on wetland ecosystems: A critical review of experimental wetlands, J. Environ. Manage., 286, 112160, https://doi.org/10.1016/j.jenvman.2021.112160, 2021.
Sagar, V. K., Pathakoti, M., Mahalakshmi, D. V., Rajan, K. S., MVR, S. S., Hase, F., and Sha, M. K.: Ground-Based Remote Sensing of Total Columnar CO2, CH4, and CO Using EM27/SUN FTIR Spectrometer at a Suburban Location (Shadnagar) in India and Validation of Sentinel-5P/TROPOMI, IEEE Geosci. Remote Sens. Lett., 19, 1–5, https://doi.org/10.1109/LGRS.2022.3171216, 2022.
Sakalli, A., Cescatti, A., Dosio, A., and Gücel, M. U.: Impacts of 2 °C global warming on primary production and soil carbon storage capacity at pan-European level, Clim. Services, 7, 64–77, https://doi.org/10.1016/j.cliser.2017.06.002, 2017.
Saunois, M., Bousquet, P., Poulter, B., Peregon, A., Ciais, P., Canadell, J. G., Dlugokencky, E. J., Etiope, G., Bastviken, D., Houweling, S., Janssens-Maenhout, G., Tubiello, F. N., Castaldi, S., Jackson, R. B., Alexe, M., Arora, V. K., Beerling, D. J., Bergamaschi, P., Blake, D. R., Brailsford, G., Brovkin, V., Bruhwiler, L., Crevoisier, C., Crill, P., Covey, K., Curry, C., Frankenberg, C., Gedney, N., Höglund-Isaksson, L., Ishizawa, M., Ito, A., Joos, F., Kim, H.-S., Kleinen, T., Krummel, P., Lamarque, J.-F., Langenfelds, R., Locatelli, R., Machida, T., Maksyutov, S., McDonald, K. C., Marshall, J., Melton, J. R., Morino, I., Naik, V., O'Doherty, S., Parmentier, F.-J. W., Patra, P. K., Peng, C., Peng, S., Peters, G. P., Pison, I., Prigent, C., Prinn, R., Ramonet, M., Riley, W. J., Saito, M., Santini, M., Schroeder, R., Simpson, I. J., Spahni, R., Steele, P., Takizawa, A., Thornton, B. F., Tian, H., Tohjima, Y., Viovy, N., Voulgarakis, A., van Weele, M., van der Werf, G. R., Weiss, R., Wiedinmyer, C., Wilton, D. J., Wiltshire, A., Worthy, D., Wunch, D., Xu, X., Yoshida, Y., Zhang, B., Zhang, Z., and Zhu, Q.: The global methane budget 2000–2012, Earth Syst. Sci. Data, 8, 697–751, https://doi.org/10.5194/essd-8-697-2016, 2016.
Saunois, M., Stavert, A. R., Poulter, B., Bousquet, P., Canadell, J. G., Jackson, R. B., Raymond, P. A., Dlugokencky, E. J., Houweling, S., Patra, P. K., Ciais, P., Arora, V. K., Bastviken, D., Bergamaschi, P., Blake, D. R., Brailsford, G., Bruhwiler, L., Carlson, K. M., Carrol, M., Castaldi, S., Chandra, N., Crevoisier, C., Crill, P. M., Covey, K., Curry, C. L., Etiope, G., Frankenberg, C., Gedney, N., Hegglin, M. I., Höglund-Isaksson, L., Hugelius, G., Ishizawa, M., Ito, A., Janssens-Maenhout, G., Jensen, K. M., Joos, F., Kleinen, T., Krummel, P. B., Langenfelds, R. L., Laruelle, G. G., Liu, L., Machida, T., Maksyutov, S., McDonald, K. C., McNorton, J., Miller, P. A., Melton, J. R., Morino, I., Müller, J., Murguia-Flores, F., Naik, V., Niwa, Y., Noce, S., O'Doherty, S., Parker, R. J., Peng, C., Peng, S., Peters, G. P., Prigent, C., Prinn, R., Ramonet, M., Regnier, P., Riley, W. J., Rosentreter, J. A., Segers, A., Simpson, I. J., Shi, H., Smith, S. J., Steele, L. P., Thornton, B. F., Tian, H., Tohjima, Y., Tubiello, F. N., Tsuruta, A., Viovy, N., Voulgarakis, A., Weber, T. S., van Weele, M., van der Werf, G. R., Weiss, R. F., Worthy, D., Wunch, D., Yin, Y., Yoshida, Y., Zhang, W., Zhang, Z., Zhao, Y., Zheng, B., Zhu, Q., Zhu, Q., and Zhuang, Q.: The Global Methane Budget 2000–2017, Earth Syst. Sci. Data, 12, 1561–1623, https://doi.org/10.5194/essd-12-1561-2020, 2020.
Saunois, M., Martinez, A., Poulter, B., Zhang, Z., Raymond, P., Regnier, P., Canadell, J. G., Jackson, R. B., Patra, P. K., Bousquet, P., Ciais, P., Dlugokencky, E. J., Lan, X., Allen, G. H., Bastviken, D., Beerling, D. J., Belikov, D. A., Blake, D. R., Castaldi, S., Crippa, M., Deemer, B. R., Dennison, F., Etiope, G., Gedney, N., Höglund-Isaksson, L., Holgerson, M. A., Hopcroft, P. O., Hugelius, G., Ito, A., Jain, A. K., Janardanan, R., Johnson, M. S., Kleinen, T., Krummel, P., Lauerwald, R., Li, T., Liu, X., McDonald, K. C., Melton, J. R., Mühle, J., Müller, J., Murguia-Flores, F., Niwa, Y., Noce, S., Pan, S., Parker, R. J., Peng, C., Ramonet, M., Riley, W. J., Rocher-Ros, G., Rosentreter, J. A., Sasakawa, M., Segers, A., Smith, S. J., Stanley, E. H., Thanwerdas, J., Tian, H., Tsuruta, A., Tubiello, F. N., Weber, T. S., van der Werf, G., Worthy, D. E., Xi, Y., Yoshida, Y., Zhang, W., Zheng, B., Zhu, Q., Zhu, Q., and Zhuang, Q.: Global Methane Budget 2000–2020, Earth Syst. Sci. Data Discuss. [preprint], https://doi.org/10.5194/essd-2024-115, in review, 2024.
Schaefer, H., Fletcher, S. E. M., Veidt, C., Lassey, K. R., Brailsford, G. W., Bromley, T. M., Dlugokencky, E. J., Michel, S. E., Miller, J. B., Levin, I., Lowe, D. C., Martin, R. J., Vaughn, B. H., and White, J. W. C.: A 21st century shift from fossil-fuel to biogenic methane emissions indicated by 13CH4, Science, 352, 80–84, https://doi.org/10.1126/science.aad2705, 2016.
Schlesinger, W. H., Belnap, J., and Marion, G.: On carbon sequestration in desert ecosystems, Glob. Change Biol., 15, 1488–1490, https://doi.org/10.1111/j.1365-2486.2008.01763.x, 2009.
Schneising, O., Buchwitz, M., Burrows, J. P., Bovensmann, H., Bergamaschi, P., and Peters, W.: Three years of greenhouse gas column-averaged dry air mole fractions retrieved from satellite – Part 2: Methane, Atmos. Chem. Phys., 9, 443–465, https://doi.org/10.5194/acp-9-443-2009, 2009.
Shaw, J. T., Allen, G., Barker, P., Pitt, J. R., Pasternak, D., Bauguitte, S. J. B., Lee, J., Bower, K. N., Daly, M. C., Lunt, M. F., Ganesan, A. L., Vaughan, A. R., Chibesankunda, F., Lambakasa, M., Fisher, R. E., France, J. L., Lowry, D., Palmer, P. I., Metzger, S., Parker, R. J., Gedney, N., Bareson, P., Cain, M., Lorente, A., Borsdorff, T., and Nisbet, E. G.: Large Methane Emission Fluxes Observed from Tropical Wetlands in Zambia, Global Biogeochem. Cy., 36, e2021GB007261, https://doi.org/10.1029/2021GB007261, 2022.
Song, H., Sheng, M., Lei, L., Guo, K., Zhang, S., and Ji, Z.: Spatial and Temporal Variations of Atmospheric CH4 in Monsoon Asia Detected by Satellite Observations of GOSAT and TROPOMI, Remote Sens., 15, 3389, https://doi.org/10.3390/rs15133389, 2023.
Sreenivas, G., Mahesh, P., Subin, J., Kanchana, A. L., Rao, P. V. N., and Dadhwal, V. K.: Influence of Meteorology and interrelationship with greenhouse gases (CO2 and CH4) at a suburban site of India, Atmos. Chem. Phys., 16, 3953–3967, https://doi.org/10.5194/acp-16-3953-2016, 2016.
Sreenivas, G., Mahesh, P., Mahalakshmi, D. V., Kanchana, A. L., Naveen Chandra, Prabir, K., Patra, Raja, P., Shesha Sai, M. V. R., Sripada, S., Rao, P. V., and Dadhwal, V. K.: Seasonal and annual variations of CO2 and CH4 at Shadnagar, a semi-urban site, Sci. Total Environ., 819, 153114, https://doi.org/10.1016/j.scitotenv.2022.153114, 2022.
Taneja, G., Pal, B. D., Joshi, P. K., Aggarwal, P. K., and Tyagi, N. K.: Farmers’ preferences for climate-smart agriculture—an assessment in the Indo-Gangetic Plain, Springer, Singapore, 91–111, https://doi.org/10.1007/978-981-10-8171-2_5, 2019.
Turner, A. J., Frankenberg, C., and Kort, E. A.: Interpreting contemporary trends in atmospheric methane, P. Natl. Acad. Sci. USA, 116, 2805–2813, https://doi.org/10.1073/pnas.1814297116, 2019.
Vinna, L., Medhaug, I., and Schmid, M.: The vulnerability of lakes to climate change along an altitudinal gradient, Commun. Earth Environ., 2, 35, https://doi.org/10.1038/s43247-021-00106-w, 2021.
Wei, D., Li, T., and Wang, X.: Overestimation of China's marshland CH4 release, Glob. Change Biol., 25, 2515–2517, https://doi.org/10.1111/gcb.14679, 2019.
Worden, J. R., Bloom, A. A., Pandey, S., Jiang, Z., Worden, H. M., Walker, T. W., Houweling, S., and Röckmann, T.: Reduced biomass burning emissions reconcile conflicting estimates of the post-2006 atmospheric methane budget, Nat. Commun., 8, 1–11, https://doi.org/10.1038/s41467-017-02246-0, 2017.
Yoshida, Y., Kikuchi, N., Morino, I., Uchino, O., Oshchepkov, S., Bril, A., Saeki, T., Schutgens, N., Toon, G. C., Wunch, D., Roehl, C. M., Wennberg, P. O., Griffith, D. W. T., Deutscher, N. M., Warneke, T., Notholt, J., Robinson, J., Sherlock, V., Connor, B., Rettinger, M., Sussmann, R., Ahonen, P., Heikkinen, P., Kyrö, E., Mendonca, J., Strong, K., Hase, F., Dohe, S., and Yokota, T.: Improvement of the retrieval algorithm for GOSAT SWIR XCO2 and XCH4 and their validation using TCCON data, Atmos. Meas. Tech., 6, 1533–1547, https://doi.org/10.5194/amt-6-1533-2013, 2013.
Zhang, L., Tian, H., Shi, H., Pan, S., Chang, J., Dangal, S. R., and Jackson, R. B.: A 130-year global inventory of methane emissions from livestock: Trends, patterns, and drivers, Global Change Biol., 28, 5142–5158, https://doi.org/10.1111/gcb.16280, 2022.
Zhang, Z., Poulter, B., Feldman, A. F., Ying, Q., Ciais, P., Peng, S., and Li, X.: Recent intensification of wetland methane feedback, Nat. Clim. Change, 13, 430–433, https://doi.org/10.1038/s41558-023-01629-0, 2023.


