the Creative Commons Attribution 4.0 License.
the Creative Commons Attribution 4.0 License.
Diurnal variation in an amplified canopy urban heat island during heat wave periods in the megacity of Beijing: roles of mountain–valley breeze and urban morphology
Tao Shi
Yuanjian Yang
Ping Qi
Simone Lolli
Against the background of global warming and rapid urbanization, heat waves (HWs) have become increasingly prevalent, amplifying canopy urban heat island intensity (CUHII). The megacity of Beijing, characterized by rapid urbanization, frequent high-temperature events, and exceptionally complex terrain, presents a unique case to study the synergies between HWs and canopy urban heat islands (CUHIs). However, research exploring the formation mechanisms of the amplified CUHII (ΔCUHII) during HW periods in the megacity of Beijing from the perspectives of mountain–valley breeze and urban morphology remains scarce. This study found that compared to non-heat-wave (NHW) periods, the average daily CUHII during HW periods significantly increased by 59.33 %. On the urban scale, the wind direction reversal of the mountain–valley breeze might contribute to the north–south asymmetry in the ΔCUHII. On the street scale, wind speed was inversely proportional to the ΔCUHII. In addition, the ΔCUHII was closely related to urban morphology, particularly the three-dimensional indicators of buildings. During the mountain breeze phase, high-rise buildings with lower sky view factors (SVFs) had a more pronounced effect on amplifying CUHII compared to low-rise buildings with higher SVFs. Conversely, during the valley breeze phase, high-rise buildings exerted a dual influence on amplifying CUHII. Our findings provide scientific insights into the driving mechanisms of urban overheating and contribute to mitigating the escalating risks associated with urban excess warming.
- Article
(9133 KB) - Full-text XML
-
Supplement
(818 KB) - BibTeX
- EndNote
The interaction between climate and urbanization has become one of the key topics in current global climate change research (Seto et al., 2012; Ding, 2018), e.g., the interaction between increased heat wave (HW) events and enhanced canopy urban heat island intensity (CUHII) (Li and Bou-Zeid, 2013; Founda et al., 2015; Khan et al., 2020; Ngarambe et al., 2020; Zinzi et al., 2020). Even during hiatuses in global warming, the frequency and duration of HW events also exhibited an increasing trend worldwide, posing significant challenges to the management of urban thermal environments and public health safety (IPCC, 2023; Patz et al., 2005; Xu et al., 2016; Yang et al., 2013). With the acceleration of urbanization and population aggregation, canopy urban heat islands (CUHIs) in megacities have become increasingly prominent (Liu et al., 2007; Zheng et al., 2018a; Yang et al., 2020), exacerbating the occurrence of regional extreme high-temperature events (Zong et al., 2021) and seriously affecting urban development and the health of residents (Gao et al., 2015; Jiang et al., 2019). For instance, compared to non-heat-wave (NHW) periods, the average CUHII in Shanghai has increased by 128.91 % during HW periods (Yang et al., 2023), while the maximum CUHII in Seoul has increased by 4.5 °C during HW periods (Ngarambe et al., 2020). The rate of the contribution of urbanization to excess mortality caused by high temperatures can reach more than 45 % in high-density urban areas (Zong et al., 2022). Therefore, in the context of global warming and rapid urbanization, it is very important to explore various driving mechanisms for the synergies between HWs and CUHIs.
In terms of natural impact factors, the uneven temporal and spatial distribution of urban excess warming is significantly affected by local circulation in different geographical environments (Zhang et al., 2011; Zhou et al., 2020; Chen et al., 2022). A few studies have focused on the impact of local circulation on the ΔCUHII (Yang et al., 2023; Xue et al., 2023). Mountain–valley breeze represents a local circulation within mountainous terrains induced by the mesoscale to small-scale thermal effects between mountains and valleys. In detail, the air in valleys and slopes warms up more significantly than the free atmosphere at the same altitude in mountainous regions during the daytime, leading to a temperature gradient that drives the air to ascend along the slopes, forming the valley breeze. In contrast, the adjacent air rapidly cools and becomes denser in mountainous regions during the nighttime with radiative cooling over the underlying surface, thereby flowing downslope and giving rise to mountain breeze (Jiang et al., 1994; Fu, 1997; Dong et al., 2017). The characteristics of the mountain–valley breeze are contingent upon various factors, including local topography and large-scale synoptic conditions (Whiteman and Doran, 1993; Zängl, 2009), atmospheric stability (Rao and Snodgrass, 1981; Whiteman and Zhong, 2008), underlying surface types (Wang et al., 2015; Letcher and Minder, 2018), and insolation conditions (An et al., 2002). Notably, under the effects of the underlying urban surface surrounding mountains, the CUHI circulation and mountain–valley breeze at mountain slopes interact and reinforce each other (Li et al., 2017). However, only a limited number of studies have delved into the influence of mountain–valley breeze on the synergies between HWs and CUHIs (Xue et al., 2023; Yang et al., 2024). One such study found that during HW periods, the mountain–valley breeze enhanced the vertical turbulent heat transfer and improved ventilation conditions reduced aerosol concentration (the urban canopy received more shortwave radiation), both of which were beneficial to the amplifying CUHII in Lanzhou (Xue et al., 2023). The current understanding of how local circulation patterns modulate the ΔCUHII is still in the exploratory stage.
From the perspective of anthropogenic factors, urban morphology is also an important factor influencing the local thermal environment (Oke, 2004; Merckx et al., 2018; Tian et al., 2019). Building height has a complex impact on solar radiation during the daytime, and longwave radiation has a complex impact at night (Srivanit and Kazunori, 2011; Oke et al., 2017), while building density alters the wind field in open spaces (Radfar, 2012; Ao et al., 2019). Local climate zones (LCZs) have been identified, defined by a range of values for parameters such as land cover, average building height, and the sky view factor (SVF) within a climate zone and enabling the discovery of the characteristics of thermal environmental variations within cities (Stewart and Oke, 2012; Stewart et al., 2014). Scholars have studied the urban excess warming in different LCZs, advancing quantitative research on the synergies between HWs and CUHIs (Ngarambe et al., 2020; Zheng et al., 2022; Xue et al., 2023; Yang et al., 2023). The intensity, frequency, and duration of HW events in LCZ1 and LCZ2 (dominated by dense mid-rise and high-rise buildings, respectively) are significantly stronger than in other types of climate zones (Yang et al., 2023). LCZs are a comprehensive indicator of urban morphology, and the aforementioned studies have not quantified the contribution of different urban morphological parameters to the local thermal environment, nor have they taken into account the nonlinear driving effects of urban morphology on the local thermal environment (Alonso and Renard, 2020; Chen et al., 2022).
In the context of frequent HW events, rapid urbanization has induced a pronounced CUHI effect in the megacity of Beijing. Coupled with Beijing's exceptionally complex terrain, the megacity presents a unique case study for investigating the synergies between HWs and CUHIs. However, previous research has predominantly centered on the spatiotemporal variations in the ΔCUHII in the megacity of Beijing (Zong et al., 2021; Jiang et al., 2019), leaving a gap in knowledge regarding the driving mechanisms of local circulation and urban morphology in amplifying CUHII during HW periods. To address this, this study focused on the megacity of Beijing, utilizing automatic weather station observations, remote sensing data, an LCZ dataset, and machine learning models. We conducted a thorough analysis of the spatiotemporal characteristics and forming mechanisms of the ΔCUHII. Ultimately, our objectives are to strengthen technical support for high-temperature forecasting, improve human settlements, and inform urban planning and management strategies.
2.1 Study area
In 2022, Beijing's population exceeded 20 million and the built area was more than 1400 km2, making it one of the most urbanized cities in China. The terrain of Beijing is exceptionally complex, bounded by the Yan Mountains to the north and the Taihang Mountains in the west. The altitudes of those mountains exceed 2000 m. The northeastern region comprises hilly terrain, while the southern region is dominated by plains. The area extending from the east to the southeast is a zone where land and sea intersect, bordering Bohai Bay. Under the control of a weak weather system with no clouds or few clouds (You et al., 2006; Liu et al., 2009; Dong et al., 2017), the mountain–valley breeze formed by the complex terrain plays a dominant role in the atmospheric circulation of the Beijing area (Liu et al., 2009; Miao et al., 2013; Dou et al., 2014). The near-surface boundary layer features including wind and temperature fields during summer in Beijing, China, have been investigated by numerical simulation (Hu et al., 2005). The results revealed a notable CUHI effect in the city center, with the boundary layer wind field being significantly influenced by the mountainous terrain in the northwest. Furthermore, the impact of mountainous terrain on the lower atmospheric boundary layer in the Beijing area during summer was investigated (Cai et al., 2002; You et al., 2006). It was discovered that the influence of mountain–valley winds could extend to cover the plain regions around Beijing to a significant degree.
2.2 Data
2.2.1 Urban-morphology datasets
Land cover modulates the energy exchange and water and carbon cycles between different regions of the Earth. In the past few decades, the land cover in China has greatly changed with the development of the economy. The annual China land cover dataset (CLCD) is a dynamic dataset accounting for land use in China released by Yang and Huang (2021). They made the land cover dataset with a spatial resolution of 30 m based on 335 709 Landsat images available via Google Earth Engine. The latest versions contain information on China's land cover from 1985 to 2021, and the overall precision of land classification is 80 %. The LCZ datasets in this article were provided by the Institute of Urban Meteorology, China Meteorological Administration. Stewart and Oke (2012) introduced the concept of LCZs, defining them as geographical regions spanning hundreds to thousands of meters in size. These zones are characterized by uniformity in land use patterns, comparable spatial arrangements and building materials, and congruent patterns of human activity. The building skyline and floor data of the electronic map were extracted using the Python language. The height of each floor was set to 3 m to obtain information on the height of the buildings within the study area.
2.2.2 AWS observation data
The hourly automatic weather station (AWS) observation data used in this article were obtained from the China Meteorological Data Service Centre (http://data.cma.cn/en, last access: 1 April 2024), which primarily includes near-surface air temperature, wind speed, wind direction, humidity, and precipitation. To ensure the rigor of the data, we conducted quality control for the observed meteorological data at ground stations. Following previous methods (Yang et al., 2011; Xu et al., 2013), missing values in observation sequences were replaced with the average of synchronous observation data from the five nearest stations surrounding the given station, and stations with excessive error records were excluded. Consequently, AWS observation data were used for a detailed analysis of the spatiotemporal characteristics of the near-surface thermodynamic field in Beijing.
2.3 Methods
2.3.1 Calculations of CUHII and definition of HWs
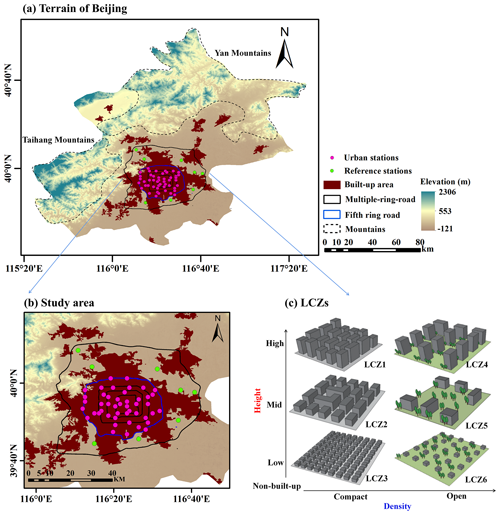
In general, scholars define CUHII as the temperature difference between the urban station and the reference station (Ren et al., 2007; Shi et al., 2015). The 5th Ring Road in Beijing, with a length of 98.6 km and an area of approximately 300 km2 (depicted by the blue loop in Fig. 1), essentially covers the primary regions of the built-up area (Yang et al., 2013). Therefore, in this study, we have designated stations within the 5th Ring Road urban stations. The selection of reference stations is crucial for calculating the CUHII. In this study, we first identified reference stations with significantly lower temperatures than those of urban stations. Additionally, the reference stations must be located more than 50 km away from the city center, in a rural environment, and predominantly within areas of sparse trees and shrubs (Yang et al., 2023). They should also be evenly distributed across different directions of the entire city. According to these criteria, eight reference stations were selected (green circles in Fig. 1), with an average altitude of 39.6 m, which is only 8.8 m lower than the average altitude of 45 urban stations (pink circles in Fig. 1). The summer CUHII of urban stations could be obtained by calculating the air temperature difference between the urban stations and the reference stations during the summertime.
Due to variations in climatic backgrounds, geographical conditions, socioeconomic factors, and other variables, different standards have been adopted for studying HW events across the world. The World Meteorological Organization suggests that an HW event occurs when the daily maximum temperature exceeds 32 °C and persists for more than 3 consecutive days. The National Oceanic and Atmospheric Administration of the United States defines an HW index that combines temperature and relative humidity, issuing a heat alert when the HW index exceeds 40.5 °C for at least 3 h on 2 consecutive days during the daytime or when it is forecasted to exceed 46.5 °C at any time. The Royal Netherlands Meteorological Institute stipulates that an HW event occurs when the daily maximum temperature is above 25 °C for more than 5 consecutive days, with at least 3 of those days having a maximum temperature exceeding 30 °C. In contrast, the China Meteorological Administration (CMA) defines an HW event as a period when the daily maximum temperature exceeds 35 °C for 3 consecutive days. In this study, the HW criteria published by the CMA were adopted. Considering that the daily maximum temperature at urban stations can be influenced by urbanization, this study utilizes the daily maximum temperature from reference stations to identify HW events. During the summer, if more than two reference stations experience an HW event on a given day, the day featuring an HW event is defined as an HW day; otherwise, it is considered an NHW day. In addition, the ΔCUHII was obtained by subtracting the summer CUHII during the NHW periods from the summer CUHII during the HW periods, providing valuable insights into the impact of extreme heat events on the environmental parameter in question (Yang et al., 2023; Xue et al., 2023).
2.3.2 Calculation of mountain–valley breeze
In the Beijing region, the most significant local circulation is the mountain–valley breeze. During the day, the wind blows from the valley to the mountain due to the thermal difference between the valley and its surrounding air, while at night, the wind reverses direction, blowing from the mountain to the valley (Tian and Miao, 2019). However, local circulation can be difficult to observe as a result of the influence of mesoscale weather patterns. Therefore, when analyzing mountain–valley breeze, it is crucial to remove the effects of the mesoscale wind field. Referencing relevant methods (Cao et al., 2015; Zheng et al., 2018b), the mountain–valley breeze is extracted, and the details are shown below. Firstly, the hourly wind data from each observation station were decomposed into the components of u (east–west direction) and v (north–south direction). From June to August between 2016 and 2020, the average values of the hourly wind components were calculated, yielding hourly average values and . Subsequently, the diurnal average values U and V were obtained by averaging all the hourly average values and , respectively. The hourly anomalies u′ and v′ were then derived by subtracting the diurnal average values U and V from the hourly average values and , respectively. The diurnal average values U and V can be interpreted as the systematic wind or background wind, while the hourly average values and can be considered the actual wind. The local wind u′ and v′, obtained by subtracting the systematic wind from the actual wind, can be utilized in studies focused on regional local circulation, in particular for the mountain–valley breeze.
2.3.3 Indicators of urban morphology
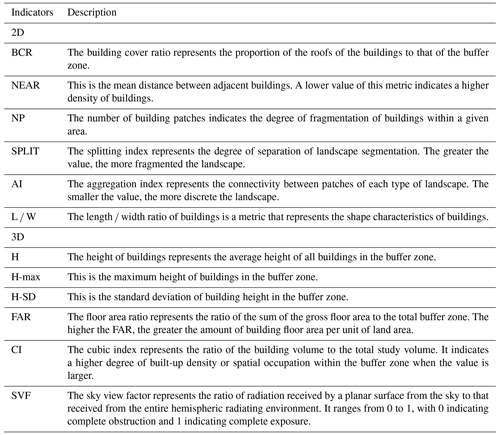
Numerous two-dimensional (2D) indicators and three-dimensional (3D) indicators have been used to quantify urban morphology (Zakšek et al., 2011; Tompalski and Wężyk, 2012; Berger et al., 2017). Here, we selected six 2D indicators and six 3D indicators to measure the morphological characteristics of buildings within a 500 m buffer zone surrounding the AWS (Oke, 2004), as shown in Table 1. The 2D indicators represent the physical properties of the underlying surface and were used to explore the effect of the underlying surface on the air temperature. The 3D indicators reflect the complex effect of landscape patterns on wind fields and solar radiation within neighborhoods. The calculation of 2D and 3D urban morphological indicators was based on land cover datasets and building height information.
2.3.4 Fitting model
Multiple linear regression analysis is a statistical method to determine the quantitative relationship between dependent variables and multiple independent variables (Li, 2020). Although the traditional linear regression model is straightforward and intuitive, it frequently falls short in effectively addressing intricate nonlinear relationships. Support vector regression (SVR) is widely used as an effective supervised learning method. By introducing the concept of support vectors, SVR improves the fitting ability of data while maintaining the complexity of the model (Smola and Schölkopf, 2004). The random forest (RF) model, a popular and highly flexible machine learning approach (Breiman, 2001), can simulate complex nonlinear relationships between predictive values and diverse predictors (Hastie et al., 2010). The RF model exhibits low sensitivity to outliers and missing values in datasets, and due to the law of large numbers, it is less prone to overfitting. Previous studies have shown that the RF model is effective in fitting complex problems and measuring the importance of factors (Tan et al., 2017; Yu et al., 2020).
Taking the ΔCUHII as the dependent variable, the influencing factors were input into the linear model, the SVR model, and the RF model including 2D indicators and 3D indicators as independent variables. The evaluation of the influence of urban morphology on the ΔCUHII was conducted by assessing the significance and importance scores of the input parameters employed in the model. The construction of various models, the importance scores of the influencing factors, and the significance testing were implemented using Python code.
3.1 The spatial–temporal pattern of urban excess warming
In the context of climate warming, vast urban expansion has led to a constant increase in urban population density, while human activities have generated significant anthropogenic heat and pollutant emissions, thereby amplifying urban excess warming to a certain extent.
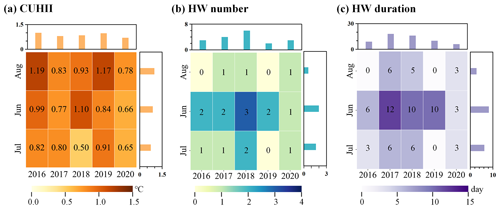
Figure 2The temporal variations in CUHII and HW events from 2016 to 2020: (a) the CUHII based on urban stations and reference stations, (b) the number of HW events based on reference stations, and (c) the duration of HW events based on reference stations.
Figure 2 illustrates significant inter-annual variations in CUHII, HW number, and HW duration in Beijing. The most prominent years for urban excess warming, specifically in terms of CUHII, were 2016 and 2019, with intensities of 1.00 and 0.97 °C, respectively. In these 2 years, the HW numbers were three and two occurrences, while the HW durations were 9 and 10 d, respectively. The occurrence and persistence of such widespread high-temperature events in the northern China region are closely related to specific atmospheric circulation anomalies. Potential influencing factors include the circulation pattern of the 500 hPa geopotential height field (Sun et al., 2011) and ocean–atmosphere anomalies such as changes in the cold and warm phases in the equatorial central and eastern Pacific, as well as the position and intensity of the warm high-pressure ridge over the continent or the subtropical high over the northwest Pacific (Wei and Sun, 2007). Furthermore, there are distinct intraseasonal variations in CUHII and HW events in Beijing. HW events are stronger in June and July, averaging 6.2 d per month, which is significantly higher than in August. Intraseasonal variations in urban excess warming may be associated with the combined differences in weather conditions, including precipitation, wind vectors, cloud cover, and air pollution (Unger et al., 2001; He, 2018; Chen et al., 2022).
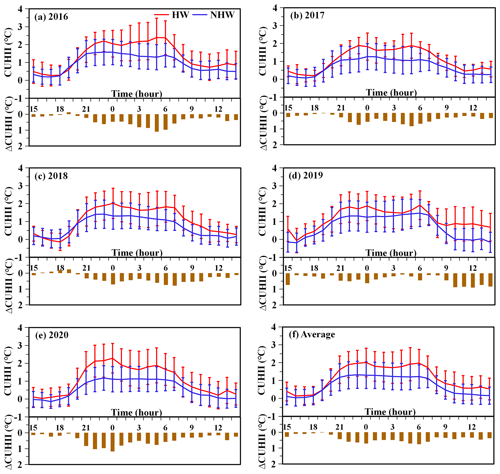
Figure 3Summer diurnal variation (Beijing time, BJT) and standard deviation of CUHII during HW periods and NHW periods based on the urban stations and reference stations in Beijing: (a) 2016, (b) 2017, (c) 2018, (d) 2019, (e) 2020, and (f) average values from 2016 to 2020. The red line represents the CUHII during HW periods, while the blue line depicts the CUHII during NHW periods. The bars indicate the ΔCUHII during HW periods.
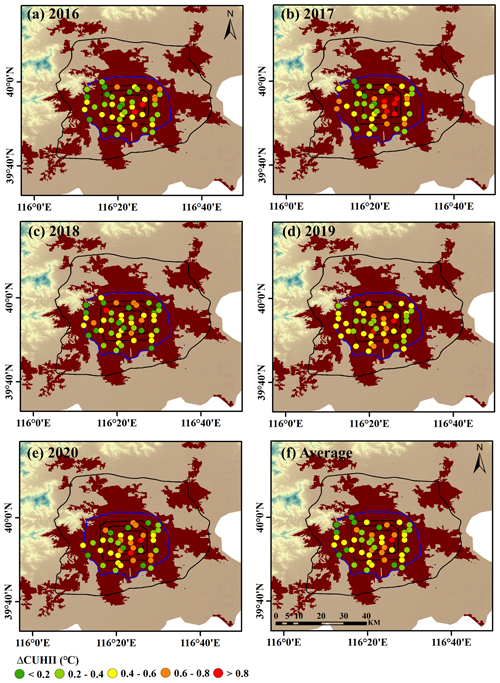
Figure 4Spatial patterns of daily average ΔCUHII based on the urban stations in Beijing during HW periods: (a) 2016, (b) 2017, (c) 2018, (d) 2019, (e) 2020, and (f) average values from 2016 to 2020. Differently colored dots represent different ranks of the ΔCUHII.
In Fig. 3, the summer diurnal variation in the CUHII in Beijing shows a U-shaped fluctuation. CUHII started to slowly decrease from 06:00 Beijing time (BJT, known outside China as “China standard time”) and hit its lowest point at 16:00 BJT. Then CUHII gradually increased and remained at a high plateau consistently from 22:00 until 05:00 BJT the next day. The diurnal variation in the ΔCUHII was also examined in this study. Apart from 19:00 BJT in 2016 (Fig. 3a) and 2018 (Fig. 3c), the hourly ΔCUHII values for all other years were positive. Taking the annual average as an example (Fig. 3f), during HW periods, the CUHII ranged between 0.18 and 2.06 °C during HW periods, which is much larger than that during NHW periods: between 0.03 and 1.32 °C. In particular, the average daily CUHII during HW periods exhibited a significant increase of 59.33 % compared to that during NHW periods. The maximum ΔCUHII was 0.76 °C, occurring at 00:00 BJT, while the minimum ΔCUHII was 0.05 °C, observed at 19:00 BJT. It should be noted that the ΔCUHII remained positive throughout the daytime and nighttime, indicating the persistent synergies between HWs and CUHIs in the built-up area of Beijing.
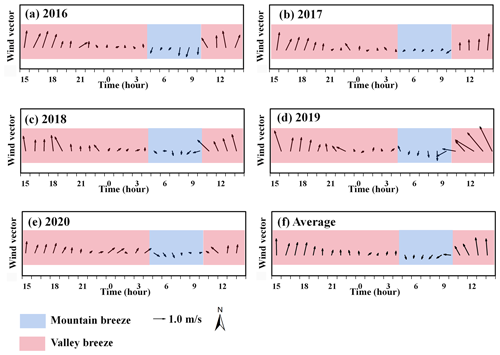
Figure 5Diurnal variations (Beijing time, BJT) in the wind direction and wind speed of the reference stations in Beijing during HW periods: (a) 2016, (b) 2017, (c) 2018, (d) 2019, (e) 2020, and (f) average values from 2016 to 2020.
Figure 4 illustrates that the ΔCUHII values were strongest in 2017, with the ΔCUHII exceeding 0.8 °C at six stations in the urban center. Conversely, the weakest ΔCUHII occurred in 2018, with only one station in the urban center recording the ΔCUHII above 0.8 °C. Significant spatial variations were observed in the distribution of the ΔCUHII. Regarding the overall pattern of the ΔCUHII across the city, taking the average ΔCUHII as an illustrative example (Fig. 4f), it is evident that the ΔCUHII in the urban north exceeds 0.6 °C at five stations, while in the urban south, only four stations record the ΔCUHII above this threshold, indicating the stronger ΔCUHII in the north compared to the south. It is well documented that the mountain–valley breeze exhibits pronounced wind direction reversal, accompanied by notable differences in wind speeds between the mountain breeze and valley breeze (Zhang et al., 2018b; Xue et al., 2023). Furthermore, examining the average ΔCUHII within the built-up area, it is noteworthy that only one station within the 2nd Ring Road records the ΔCUHII exceeding 0.6 °C, with all other stations exceeding this value located beyond the 2nd Ring Road. Notably, the built-up area within the 2nd Ring Road in Beijing is predominantly characterized by low-rise buildings, with taller structures concentrated beyond this perimeter (Guo et al., 2024). Consequently, the following analysis will delve into the potential causes of the ΔCUHII pattern in the built-up area of Beijing from two perspectives: mountain–valley breeze and urban morphology.
3.2 Modulation of the ΔCUHII by mountain–valley breeze
Local circulation patterns caused by different geographical environments have a significant impact on the spatial and temporal distribution of urban extreme high temperatures (Zhang et al., 2011; Zhou et al., 2020; Chen et al., 2022). The western and northern parts of Beijing are surrounded by mountains, and the mountain–valley breeze strongly impacts the near-surface thermal dynamic field of the megacity of Beijing (Miao et al., 2013; Dou et al., 2014). In this section, our research analyzes the modulation of the synergies between HWs and CUHII by the mountain–valley breeze using wind field and temperature data from AWSs.
Based on previous research, it is well established that there exists a pronounced wind direction reversal between the mountain breeze phase and the valley breeze phase, characterized by significant differences in wind speeds (Jiang et al., 1994; Fu, 1997; Dong et al., 2017). To mitigate the influence of the urban environment disturbing the surface wind measurement, we first analyzed the diurnal variation in mountain–valley breeze using solely observation data from reference stations. As depicted in Fig. 5, the reference stations were dominated by northerly winds from 05:00 to 10:00 BJT, with a notable reversal in wind direction occurring at 11:00 BJT resulting in southerly winds dominating the reference stations until 04:00 BJT the following day. The mountain breeze persisted for approximately 5 h, while the valley breeze lasted for approximately 19 h. The average speed of the mountain breeze (0.40 m s−1) was significantly lower than that of the valley breeze (0.72 m s−1), consistent with a previous study (Zheng et al., 2018b). This phenomenon indicated the significant presence of mountain–valley breeze in Beijing during summer. Based on the statistics presented above, we further analyzed observational data from urban stations and found that the average ΔCUHII during the mountain breeze phase (0.53 °C) was higher than that during the valley breeze phase (0.36 °C). The effectiveness of urban natural ventilation is contingent upon the exchange and flow of air within the urban canopy layer, which, in turn, exert a direct influence on the high-temperature environment prevalent within cities (Yang et al., 2023). Consequently, we explored whether the observed discrepancy in the ΔCUHII between the mountain breeze phase and valley breeze phase was potentially linked to the wind speed difference between these two breeze phases. Figure 6a–b illustrate that, regardless of whether it was the mountain breeze phase or the valley breeze phase, the correlations between the wind speed and the ΔCUHII were both negative. Except for the mountain breeze phase in the urban south, the other p values were lower than 0.1. In the future, we plan to expand our research area to encompass the Beijing–Tianjin–Hebei urban agglomeration. Low wind speeds typically result in poorer-urban-ventilation environments (Ng, 2009; Bady et al., 2011), especially in areas with densely packed urban buildings that hinder the flow of cold air. With reduced airflow and limited heat dispersion under weak wind conditions, these conditions further exacerbate urban excess warming (Gemechu, 2022).
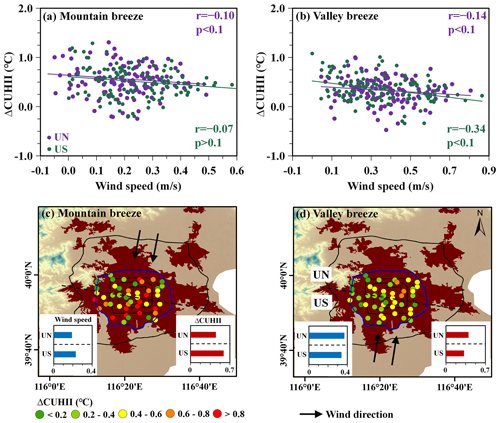
Figure 6Correlation analysis between the wind speed and the ΔCUHII at urban stations from 2016 to 2020 during the mountain breeze phase (a) and the valley breeze phase (b). The spatial patterns of the ΔCUHII during the mountain breeze phase (c) and valley breeze phase (d). In (c) and (d), the bar chart in the lower-left corner represents the average wind speed in the urban north (UN) and urban south (US), while the bar chart in the lower-right corner represents the average ΔCUHII in the UN and US.
We analyzed the spatial patterns of the ΔCUHII in the urban north (UN) and urban south (US) (as delineated by the dashed black line in Fig. 6c–d). During the mountain breeze phase, the wind direction was from north to south. As shown in Fig. S1 in the Supplement, in the urban north, the year with the highest average ΔCUHII was 2016, and the urban south experienced its maximum ΔCUHII in 2018. As shown in Fig. 6c, despite the slightly higher average wind speed in the urban south (0.23 m s−1) compared to that in the urban north (0.19 m s−1), the annual average ΔCUHII in the urban south (0.57 °C) was higher than that in the urban north (0.48 °C). During the valley breeze phase, the wind blew from south to north. In Fig. S2, the year with the highest average ΔCUHII in the urban north was 2017. In the urban south, the maximum average ΔCUHII occurred in 2020. In Fig. 6d, although the average wind speed in the urban north (0.38 m s−1) was higher than that in the urban south (0.34 m s−1), the annual average ΔCUHII in the urban north (0.40 °C) was higher than that in the urban south (0.32 °C). On an urban scale, it was evident that wind speed might not be the primary regulatory factor for urban excess warming.
According to the above analysis, on the street scale, wind speed was inversely proportional to the ΔCUHII at individual stations, suggesting that favorable ventilation conditions could enhance the thermal environment surrounding specific locations. On the urban scale, the wind direction of the mountain–valley breeze might induce a north–south asymmetrical pattern of urban excess warming during HW periods. Below, we will proceed to analyze the driving effects of urban morphology on the synergies between HWs and CUHIs.
3.3 Response of the ΔCUHII to urban morphology
The spatial heterogeneity of urban areas and their infrastructure can directly contribute to the spatially inhomogeneous distribution of the near-surface air temperature (Fenner et al., 2017). In this section, we further explore the driving factors of the synergies of HWs and CUHII in Beijing, focusing on urban morphology.
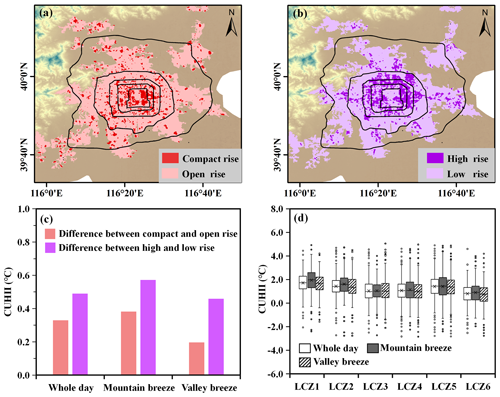
Figure 7(a) Urban configuration structures with density information, including compact (LCZ1, LCZ2, LCZ3) and open (LCZ4, LCZ5, LCZ6) configurations. (b) Urban configuration structures with height information, including high-rise (LCZ1, LCZ2, LCZ4, LCZ5) and low-rise (LCZ3, LCZ6) buildings. (c) Differences in CUHII between compact and open configurations and between high-rise and low-rise buildings. (d) Box-and-whisker plots comparing the CUHII values for various LCZs.
From the perspective of urban configuration structures (Fig. 7a–b), compact configurations were mainly concentrated within the 2nd Ring Road of the built-up area, while high-rise buildings were primarily distributed between the 2nd Ring Road and 4th Ring Road. Notably, most of the stations with high urban excess warming were located in areas with high-rise buildings. Figure 7c demonstrates that the difference in CUHII between compact and open configurations ranged from 0.20–0.39 °C, while the difference between high-rise and low-rise buildings was 0.46–0.57 °C. Previous studies have shown that in densely populated high-rise areas of Beijing, HW events occur more frequently and last longer (Zong et al., 2021). Similar results are obtained in this study. Among various LCZs, LCZ1, which was dominated by compact high-rise buildings, had the highest average CUHII value in the built-up area of Beijing, while LCZ6, which was dominated by open low-rise buildings, had the lowest average CUHII value in the built-up area of Beijing (Fig. 7d). Therefore, apart from local circulation patterns, the CUHII was also dependent on the characteristics of the urban morphology.
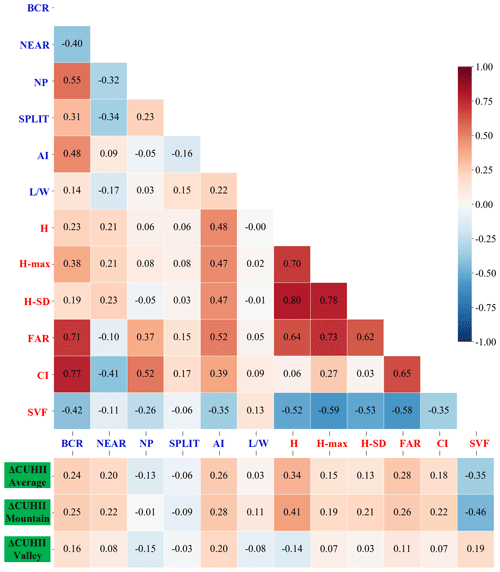
Figure 8Spearman rank correlation coefficients between the urban morphological indicators and the ΔCUHII during different local circulation phases. The blue characters represent the 2D urban morphological indicators, while the red characters represent the 3D urban morphological indicators. The color legend on the right represents the value of correlation coefficients, with blue indicating a low correlation and red indicating a high correlation.
The Spearman correlation analysis showed that the associations between the 3D indicators and the ΔCUHII were generally higher than those between the 2D indicators and the ΔCUHII (Fig. 8). Indicators using a combination of morphological aspects generally had stronger correlations with temperature (Tian et al., 2019). For example, SVF had the highest correlations with the ΔCUHII among 3D indicators. The correlation between the floor area ratio (FAR) and the ΔCUHII was stronger than that between the building cover ratio (BCR) and the ΔCUHII. Furthermore, the correlations between the 2D indicators and the ΔCUHII, as well as those between the 3D morphological indicators and the ΔCUHII, varied significantly during different local circulation phases. During the mountain breeze phase, the relationship between the urban morphological indicators and the ΔCUHII was stronger, whereas during the valley breeze phase, this relationship was weaker.
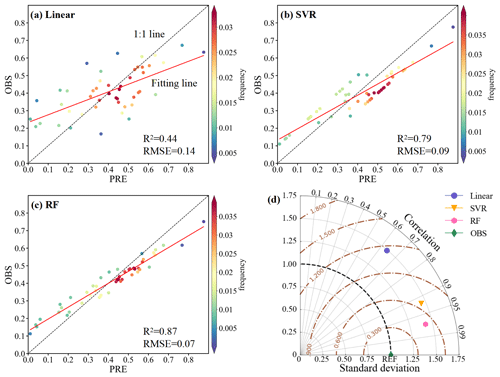
Figure 9Comparison of the simulation accuracy across different models: (a) linear model, (b) SVR model, and (c) RF model. ΔCUHII (OBS) represents the observed ΔCUHII values, while ΔCUHII (PRE) represents the modeled ΔCUHII values. The color legend on the right of panels (a)–(c) represents the frequency of sample occurrence. (d) Taylor diagram for various models, where the straight gray lines represent the correlation between the simulated and observed values, and the dash-dotted brown lines indicate the root mean square error between the simulated and observed data.
As depicted in Fig. 9a, the linear model yielded a coefficient of determination (R2) of 0.44 and a root mean square error (RMSE) of 0.14 °C, indicating a relatively large modeling error. Consequently, while the linear model provided a foundational framework for modeling the ΔCUHII, it might not be the most optimal choice for our study. Figure 9b illustrates that the SVR model demonstrated superior performance compared to the linear model, achieving an R2 value of 0.79 and an RMSE value of 0.09 °C. Moreover, the RF model was used to explain the contribution of each feature to the modeling of the ΔCUHII. Based on the performance values given in Fig. 9c, it appeared that RF had the highest R2 value of 0.87 and the lowest RMSE value of 0.07 °C, which indicated that it had the lowest modeling error and was potentially more accurate than other models. In Fig. 9d, the straight gray lines in the Taylor diagram indicate that the correlation between the data from the linear model and the observed data was relatively low. Additionally, the variation in the linear model data was significantly greater than the observed variation (indicated by the excessive distance from the origin). In both cases, this results in a relatively large centered root mean square error (dash-dotted brown lines) for the linear model. These results suggest that the performance of the linear model was relatively poor. The RF data were 87 % correlated to the real data, while the linear and SVR data had a weaker correlation with the real data. The good performance of RF could be proved by its strong correlation with the real dataset. Therefore, the RF model could be considered a reliable tool for fitting the relationship between the ΔCUHII and the urban morphology.
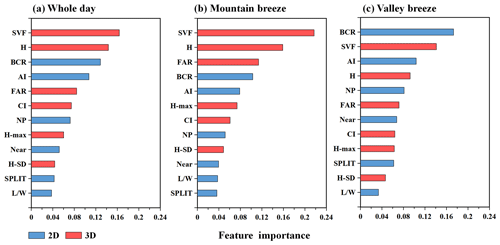
Figure 10The feature importance rank of urban morphological indicators for the RF model estimating the ΔCUHII: (a) whole day, (b) mountain breeze phase, and (c) valley breeze phase. The blue bars represent 2D urban morphological indicators, while the red bars represent 3D urban morphological indicators.
This paper constructed an RF model to compare the relative importance of urban morphology in modeling the ΔCUHII. The importance of indicators varied by different local circulation phases. Throughout the whole day (Fig. 10a), the relative importance was listed in descending order of importance: SVF, FAR, H, BCR, CI, AI, NP, H-max, NEAR, H-SD, SPLIT, and L W. During the mountain breeze phase (Fig. 10b), despite the alteration in the order of importance of indicators, SVF was still the most important morphology indicator for modeling the ΔCUHII. Previous studies have shown that SVF is closely related to urban land surface temperature (LST) (Peng et al., 2017; Scarano and Mancini, 2017) and air temperature (Rafiee et al., 2016; Drach et al., 2018). Compared to the immediately neighboring rural area, SVF had a more important influence on determining the LST for the high-rise buildings of the built-up area (Jia et al., 2023). During the valley breeze phase (Fig. 10c), the importance of SVF to the ΔCUHII weakened, ranking second in the importance list. H and SVF had weaker correlations with daytime temperature but showed stronger correlations with nighttime temperature (Tian et al., 2019). Overall, the importance list showed that the effects of 3D indicators on the ΔCUHII were stronger than the effects of 2D indicators on the ΔCUHII.
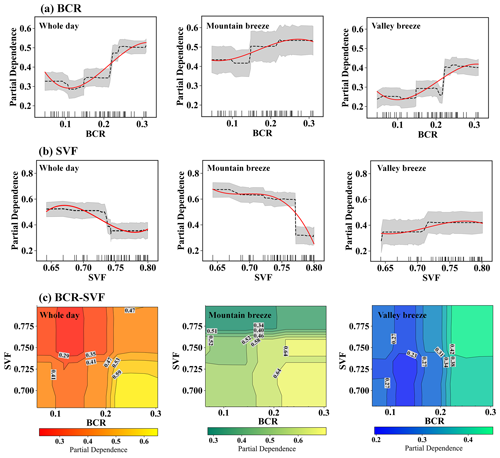
Figure 11(a–b) Partial dependence plots of the ΔCUHII on BCR and SVF. The red line represents the fitted curve, while the gray lines indicate the 95 % confidence interval. The rug plots (small vertical lines) along the x axis represent the distribution of the feature values. (c) The two-way plots partial dependence of the ΔCUHII on BCR and SVF. The x axis represents the BCR feature, while the y axis represents the SVF feature. The interpolated colors of the panel, ranging from dark to light, signified the partial dependence decreasing from large to small.
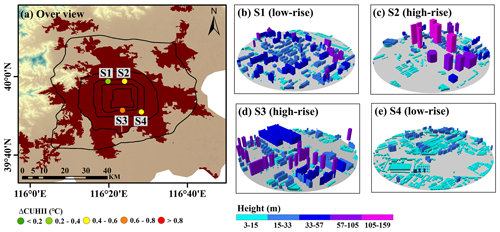
Figure 12(a) An overview of representative urban stations in the built-up area of Beijing. (b–e) Urban morphology around the representative stations. The different colors of the buildings represent their respective heights.
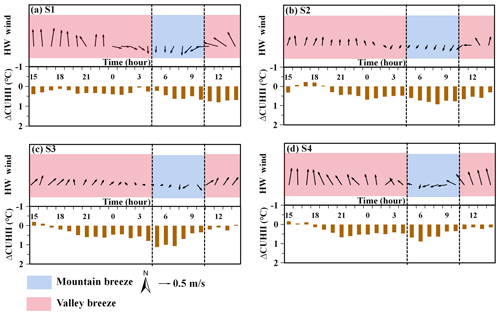
Figure 13Diurnal variations in the wind direction, the wind speed, and the ΔCUHII in the built-up area of Beijing during HW periods. The blue boxes represent the mountain breeze phase, while the red boxes represent the valley breeze phase.
As previously demonstrated, the importance of SVF and BCR among the 3D and 2D indicators was the highest. Partial dependence, in the context of machine learning, refers to the assessment of the relationship between a single feature and the model's predicted outcome while all other features in the dataset are held constant (Friedman, 2001). This function represents the effect of selected explanatory variables and can be used to interpret “black-box” models (Cutler et al., 2007; Shiroyama and Yoshimura, 2016). In Fig. 11a, it can be seen that as BCR increased in summer, the ΔCUHII showed a continuous upward trend overall. The growth trend of the ΔCUHII during the mountain breeze phase was higher than that during both the whole-day phase and the mountain–valley breeze phase. When BCR exceeded 0.1, the dependence of the ΔCUHII on BCR increased rapidly. There might have been a threshold for the building area, and when this threshold was exceeded, the promoting effect of the building area on the ΔCUHII was significantly enhanced. This complex pattern of association is closely related to urban climatic conditions, vegetation coverage in the built-up area, the frequency of human activities, and seasonal and spatial differences in energy consumption (Guo et al., 2016; Yang et al., 2018; Zhou et al., 2014). In Fig. 11b, during both the whole-day phase and the mountain breeze phase, as SVF increased in summer, the overall synergistic effect exhibited a continuous downward trend. However, during the valley breeze phase, the dependence increased with increasing SVF, indicating that SVF had an inhibitory effect on the ΔCUHII. In addition, two-way partial dependence plots were constructed to explore the joint effect of two dominant factors (Fig. 11c). The interactions between BCR and SVF relied on their relative values. During both the whole-day phase and the mountain breeze phase, the peak partial dependence of the ΔCUHII was observed in regions characterized by BCR values exceeding 0.2 and SVF values of less than 0.72. During the valley wind phase, the region demonstrating the highest ΔCUHII dependence continued to be located within areas where BCR exceeded 0.2, but the SVF value was significantly higher than 0.72, showing that SVF had a dual impact on the ΔCUHII.
The preceding analysis demonstrated that the RF model served as a reliable tool for simulating the relationship between the ΔCUHII and the urban morphology. The importance ranking highlighted that 3D morphological indicators exerted a more significant influence on the ΔCUHII compared to 2D morphological indicators. Notably, the impact of SVF on the ΔCUHII was intricate. In the following Discussions section, we will select representative sites for further investigation.
Local circulation patterns and urban morphology played pivotal roles in influencing the ΔCUHII. In the following, we describe how selected representative stations with typical geographic locations and spatial characteristics of buildings to analyze how local circulation patterns and urban morphology alter the ΔCUHII.
Taking into account the influence of the mountain–valley breeze, representative stations were selected in the urban south and north. Additionally, based on the driving effects of urban morphology, we selected high-rise and low-rise buildings as the criterion of representative stations. Figure 12 illustrates that the stations S1 and S2 are situated between the northern parts of the 3rd Ring Road and 4th Ring Road, with S1 predominantly surrounded by low-rise buildings and S2 surrounded by high-rise buildings. Meanwhile, S3 and S4 were situated between the southern parts of the 3rd Ring Road and 4th Ring Road, with S3 mainly surrounded by high-rise buildings and S4 surrounded by low-rise buildings. A comparison of the ΔCUHII difference between stations in the urban north (S1 and S2) and stations in the urban south (S3 and S4) could be utilized to study the impact of mountain–valley breeze on the ΔCUHII. Furthermore, contrasting the ΔCUHII difference between stations surrounded by low-rise buildings with larger SVFs (S1 and S4) and stations surrounded by high-rise buildings with smaller SVFs (S2 and S3) provided an opportunity to analyze the influence of urban morphology on the ΔCUHII.
During the mountain breeze phase, the wind direction is from north to south. As depicted in Fig. 13, the observed ΔCUHII in the urban north (S1 at 0.51 °C, S2 at 0.76 °C) was lower than that in the urban south (S3 at 0.77 °C, S4 at 0.59 °C). For the entire city, a more consistent wind field at the ground level results in a stronger heat transport capacity (Xie et al., 2022; Yang et al., 2023). Combining these results with the statistical results in Fig. 6c–d, we suggest that the direction of the mountain–valley breeze might alter the pattern of the ΔCUHII across the entire urban area. In the following, we examine the influence of urban morphology on the ΔCUHII. Using urban north stations (S1 and S2) as examples, S2 (surrounded by high-rise buildings) exhibited stronger ΔCUHII than S1 (surrounded by low-rise buildings). High-rise residential buildings are associated with higher population densities with greater capacities to mitigate heat, translating into more air conditioners, which, when operating, release additional heat (Ryu and Baik, 2012). High-rise neighborhoods have smaller SVFs and thus have less outgoing longwave radiation (Unger, 2004). High-rise neighborhoods with smaller SVFs tend to experience lower wind speeds (Hang et al., 2011). The lower wind speed limited the loss of sensible heat through atmospheric convection and advection, making it difficult for heat to dissipate from the streets (Wang et al., 2009). During the mountain breeze phase, the SVFs of buildings primarily had an enhancing effect on the ΔCUHII.
During the valley breeze phase, the wind direction is from south to north. The ΔCUHII observed at S1 (0.35 °C) and S2 (0.34 °C) located in the urban north was greater than that at S3 (0.31 °C) and S4 (0.32 °C) located in the urban south. We contend that this pattern might be related to the influence of large-scale horizontal heat transport. In terms of urban morphology, between 11:00 and 18:00 BJT, the ΔCUHII at S3 (surrounded by high-rise buildings) was 0.01 °C lower than that at S4 (surrounded by low-rise buildings), indicating that the inhibitory effect of high-rise buildings on the ΔCUHII was dominant. Although high-rise buildings can enhance the ΔCUHII by reducing outgoing longwave radiation and wind speed, they prevent more shortwave solar radiation from reaching the ground, and their shading effect contributes to a decrease in near-surface air temperature (Zhang et al., 2016; Krayenhoff and Voogt, 2016; Taleghani et al., 2016; Cai and Xu, 2017). After sunset (19:00 BJT), the ΔCUHII observed at S3 was 0.07 °C higher than that at S4, signifying that the enhancement of the ΔCUHII due to high-rise buildings reasserted its dominance. During the valley breeze phase, the high-rise buildings with smaller SVFs exerted a dual influence on the ΔCUHII.
In this study, the megacity of Beijing was selected as the research subject, utilizing high-density AWS data from 2016 to 2020 for the research sample. Through remote sensing data and machine learning models, the synergies between HWs and CUHIs were analyzed.
During HW periods, the average daily CUHII underwent a substantial increase of 59.33 % compared to during NHW periods. The maximum urban excess warming was observed between the 2nd Ring Road and 4th Ring Road of Beijing. On an urban scale, the large-scale horizontal heat transport caused by the wind direction reversal of mountain–valley breeze might have led to an asymmetric pattern of the ΔCUHII. On a street scale, the wind speed and ΔCUHII exhibited a negative correlation. Additionally, the impact of urban morphology could not be ignored. The average CUHII of compact high-rise buildings (LCZ1) was significantly higher than that of open low-rise buildings (LCZ6). The importance order of the RF model indicated that the effects of 3D indicators were stronger than the effects of 2D indicators on the ΔCUHII. In the partial dependence plots, it can be seen that the SVFs of buildings had a complex influence on the synergies between HWs and CUHIs. Ultimately, through the analysis of representative stations, we observed that during the mountain breeze phase, high-rise buildings with lower SVFs primarily enhanced the ΔCUHII. However, during the valley breeze phase, the effect of high-rise buildings with lower SVFs on the ΔCUHII was dual. In the future, we will continue to investigate the mechanism of synergies between HWs and CUHIs using high-resolution observational data and numerical models to provide crucial theoretical foundations and technological support for the construction of a comprehensive high-temperature monitoring, forecasting, and warning system.
The hourly AWS observation data are available upon request from the China Meteorological Data Service Centre (http://data.cma.cn/en/?r=data/detail&dataCode=A.0012.0001, NSTI, 2024). The land cover data are available at https://doi.org/10.5281/zenodo.4417809 (Yang and Huang, 2022).
The supplement related to this article is available online at: https://doi.org/10.5194/acp-24-12807-2024-supplement.
YY conceptualized the study. TS wrote the original manuscript and plotted all the figures. YY, PQ, and SL assisted in the model development. All the authors contributed to the manuscript preparation, discussion, and writing.
The contact author has declared that none of the authors has any competing interests.
Publisher's note: Copernicus Publications remains neutral with regard to jurisdictional claims made in the text, published maps, institutional affiliations, or any other geographical representation in this paper. While Copernicus Publications makes every effort to include appropriate place names, the final responsibility lies with the authors.
The authors express their gratitude to the editor and reviewers for their constructive comments and suggestions for improvement of this paper. Additionally, the authors would like to thank all the organizations and groups that provided the important datasets used in this study.
This study was supported by the National Natural Science Foundation of China (grant nos. 42105147 and 42222503), the Joint Research Project for Meteorological Capacity Improvement (grant no. 22NLTSQ013), and the Collaborative Innovation Fund of the Education Department of Anhui Province (grant no. GXXT-2023-050).
This paper was edited by Michael Byrne and reviewed by two anonymous referees.
Alonso, L. and Renard, F: A new approach for understanding urban microclimate by integrating complementary predictors at different scales in regression and machine learning models, Remote Sens., 12, 2434, https://doi.org/10.3390/rs12152434, 2020.
An, X., Chen, Y., and Lv, S.: Mesoscale simulations of winter low-level wind and temperature fields in Lanzhou city, Plateau Meteorol., 21, 2, 186–192, https://doi.org/10.3321/j.issn:1000-0534.2002.02.011, 2002.
Ao, X., Wang, L., Zhi, X., Gu, W., Yang, H., and Li, D.: Observed synergies between urban heat islands and heat waves and their controlling factors in Shanghai, China, J. Appl. Meteorol. Climatol., 74, 1789–1802, https://doi.org/10.1175/jamc-d-19-0073.1, 2019.
Bady, M., Kato, S., Takahashi, T., and Huang, H.: An experimental investigation of the wind environment and air quality within a densely populated urban street canyon, J. Wind Eng. Indust. Aerodynam., 99, 857–867, https://doi.org/10.1016/j.jweia.2011.06.005, 2011.
Berger, C., Rosentreter, J., Voltersen, M., Baumgart, C., Schmullius, C., and Hese, S.: Spatio-temporal analysis of the relationship between 2D/3D urban site characteristics and land surface temperature, Remote Sens. Environ., 193, 225–243, https://doi.org/10.1016/j.rse.2017.02.020, 2017.
Breiman, L.: Random forest, Mach. Learn., 45, 5–32, 2001.
Cai, H. and Xu, X.: Impacts of built-up area expansion in 2D and 3D on regional surface temperature, Sustainability, 9, 10, https://doi.org/10.3390/su9101862, 2017.
Cai, X., Guo, Y., Liu, H., and Chen, J.: Flow patterns of lower atmosphere over Beijing area, Acta Scientiarum Naturalium Universitatis Pekinensis, 38, 5, 698–704, https://doi.org/10.3321/j.issn:0479-8023.2002.03.015, 2002.
Cao, J., Liu, X., Li, G., and Zou, H.: Analysis of the phenomenon of lake-land breeze in Poyang Lake area, Plateau Meteorol., 34, 426–435, https://doi.org/10.7522/J.ISSN.1000-0534.2013.00197, 2015.
Chen, S., Yang, Y., Deng, F., Zhang, Y., Liu, D., Liu, C., and Gao, Z.: A high-resolution monitoring approach of canopy urban heat island using a random forest model and multi-platform observations, Atmos. Meas. Tech., 15, 735–756, https://doi.org/10.5194/amt-15-735-2022, 2022.
Cutler, D. R., Edwards, T. C., Beard, K. H., Cutler, A., Kyle, T., Gibson, J., Lawler, J. J., Beard, H., and Hess, T.: Random forests for classification in ecology, Ecology, 88, 2783–2792, https://doi.org/10.1890/07-0539.12007, 2007.
Ding, Y.: Scientific questions and answers on climate change, Beijing:China Environmental Science Press, ISBN 9787511128805, 2018.
Dong, Q., Zhao, P., Wang, Y., Miao, S., and Gao, J.: Impact of mountain-valley wind circulation on typical cases of air pollution in Beijing, Environmental Science, 38, 6, 2218–2230, https://doi.org/10.13227/j.hjkx.201609231, 2017.
Dou, J., Wang, Y., and Miao, S.: Fine spatial and temporal characteristics of humidity and wind in Beijing urban area, J. Appl. Meteorol. Sci., 25, 559–569, https://doi.org/10.11898/1001-7313.20140505, 2014.
Drach, P., Krüger, E. L., and Emmanuel, R.: Effects of atmospheric stability and urban morphology on daytime intra-urban temperature variability for Glasgow, UK, Sci. Total Environ., 627, 782–791, https://doi.org/10.1016/j.scitotenv.2018.01.285, 2018.
Fenner, D., Meier, F., Bechtel, B., Otto, M., and Scherer, D.: Intra and inter “local climate zone” variability of air temperature as observed by crowdsourced citizen weather stations in Berlin, Germany, Meteorol. Z., 26, 525–547, https://doi.org/10.1127/metz/2017/0861, 2017.
Founda, D., Pierros, F., Petrakis, M., and Zerefos, C.: Interdecadal variations and trends of the urban heat island in Athens (Greece) and its response to heat waves, Atmos. Res., 161–162, 1–13, https://doi.org/10.1016/j.atmosres.2015.03.016, 2015.
Friedman, J. H.: Greedy function approximation: a gradient boosting machine, Ann. Stat., 29, 1189–1232, https://doi.org/10.1214/aos/1013203451, 2001.
Fu, B.: A method for calculating the velocity and local circulation by wind observation data, J. Meteorol. Sci., 17, 258–267, 1997.
Gao, J., Sun, Y., Liu, Q., Zhou, M., Lu, Y., and Li, L.: Impact of extreme high temperature on mortality and regional level definition of heat wave: A multi-city study in China, Sci. Total Environ., 505, 535–544, https://doi.org/10.1016/j.scitotenv.2014.10.028, 2015.
Gemechu, F. G.: How the interaction of heatwaves and urban heat islands amplify urban warming, Adv. Environ. Eng. Res., 3, 2, https://doi.org/10.21926/aeer.2202022, 2022.
Guo, G., Zhou, X., Wu, Z., Xiao, R., and Chen, Y.: Characterizing the impact of urban morphology heterogeneity on land surface temperature in Guangzhou, China, Environ. Model. Softw., 84, 427–439, https://doi.org/10.1016/j.envsoft.2016.06.021, 2016.
Guo, F., Hu, D., and Schlink, U.: A comprehensive metric scheme for characterizing the heterogeneity of urban thermal landscapes: A case study of 14-year evaluation in Beijing, Ecol. Indicator., 16, 112268–112268, https://doi.org/10.1016/j.ecolind.2024.112268, 2024.
Hang, J., Li, Y., and Sandberg, M.: Experimental and numerical studies of flows through and within high-rise building arrays and their link to ventilation strategy, J. Wind Eng. Indust., 99, 1036–1055, https://doi.org/10.1016/j.envsoft.2016.06.021, 2011.
Hastie, T., Tibshirani, R., and Friedman, J.: The elements of statistical learning: Data mining, inference, and prediction, 2nd Edition, Springer Series in Statistics, Springer, New York, 66, 4, https://doi.org/10.1111/j.1541-0420.2010.01516.x, 2010.
He B.: Potentials of meteorological characteristics and synoptic conditions to mitigate urban heat island effects, Urban Clim., 24, 26–33, https://doi.org/10.1016/j.uclim.2018.01.004, 2018.
Hu, X., Liu, S., Liang, F.,Wang, J., Liu, H., Li, J., and Wang, Y.: Numerical simulation of features of surface boundary-layer over Beijing area, Acta Scientiarum Naturalium Universitatis Pekinensis, 41, 514–522, https://doi.org/10.3321/j.issn:0479-8023.2005.04.003, 2005.
IPCC (Intergovernmental panel on climate change): Climate Change 2021: The physical science basis. Contribution of working group I to the sixth assessment report of the intergovernmental panel on climate change, Cambridge University Press, ISBN 9781009157896, 2023.
Jia, S., J., Wang, Y., Chen, L., and Bi, X.: A novel approach to estimating urban land surface temperature by the combination of geographically weighted regression and deep neural network models, Urban Clim., 47, 101390, https://doi.org/10.1016/j.uclim.2022.101390, 2023.
Jiang, S., Lee, X., Wang, J., and Wang, K.: Amplified urban heat islands during heat wave periods, J. Geophys. Res.-Atmos., 124, 7797–7812, https://doi.org/10.1029/2018jd030230, 2019.
Jiang, W., Xu, Y., and Yu, H.: Fundamentals of boundary layer meteorology, Nanjing: Nanjing University Press, ISBN 9787305025983, 1994.
Khan, H. S., Paolini, R., Santamouris, M., and Caccetta, P.: Exploring the synergies between urban overheating and heatwaves (HWs) in Western Sydney, Energies, 13, 470, https://doi.org/10.3390/en13020470, 2020.
Krayenhoff, E. S. and Voogt, J. A.: Daytime thermal anisotropy of urban neighbourhoods: Morphological causation, Remote Sens., 8, 2, https://doi.org/10.3390/rs8020108, 2016.
Letcher, T. W. and Minder, J. R.: The simulated impact of the snow albedo feedback on the large-scale mountain-plain circulation east of the Colorado Rocky mountains, J. Atmos. Sci., 75, 755–774, https://doi.org/10.1175/JAS-D-17-0166.1, 2018.
Li, Q.: Statistical modeling experiment of land precipitation variations since the start of the 20th Century with external forcing factors, Chinese Sci. Bull., 65, 2266–2278, https://doi.org/10.1360/TB-2020-0305, 2020.
Li, D. and Bou-Zeid, E.: Synergistic interactions between urban heat islands and heat waves: The impact in cities is larger than the sum of its parts, J. Appl. Meteorol. Climatol., 52, 2051–2064, https://doi.org/10.1175/JAMC-D-13-02.1, 2013.
Li, M., Wang, T., Xie, M., Zhuang, B., Li, S., Han, Y., and Cheng, N.: Modeling of urban heat island and its impacts on thermal circulations in the Beijing–Tianjin–Hebei region, China, Theor. Appl. Climatol., 128, 999–1013, https://doi.org/10.1007/s00704-016-1903-x, 2017.
Liu, S., Liu, Z., Li, J., Wang, Y,; Ma, Y., Sheng, L., Liu, H., Liang, F., Xin, G., and Wang, J.: Numerical simulation for the coupling effect of local atmospheric circulations over the area of Beijing, Tianjin and Hebei Province, Sci. China (Series D: Earth Sciences), 52, 382–392, https://doi.org/10.1007/s11430-009-0030-2, 2009.
Liu, W., Ji, C., Zhong, J., Jiang, X., and Zheng, Z.: Temporal characteristics of the Beijing urban heat island, Theor. Appl. Climatol., 87, 213–221, https://doi.org/10.1007/s00704-005-0192-6, 2007.
Merckx, T., Souffreau, C., Kaiser, A., Baardsen, L. F., Backeljau, T.,; Bonte, D., Brans, K. I., Cours, M., Dahirel, M., Debortoli, N.,Wolf, K, D., Engelen, J. M. T., Fontaneto, D., Gianuca, A. T., Govaert, L., Hendrickx, F., Higuti, J., Lens, L., Martens, K., Matheve, H., Matthysen, E., Piano, E., Sablon, R., Schön, L., Doninck, K. V., Meester, L. D., and Dyck, H. V.: Body-size shifts in aquatic and terrestrial urban communities, Nature, 558, 7708, https://doi.org/10.1038/s41586-018-0140-0, 2018.
Miao, Y., Liu, S., Chen, B., Zhang, B., Wang, S., and Li, S.: Simulating urban flow and dispersion in Beijing by coupling a CFD model with the WRF model, Adv. Atmos. Sci., 30, 1663–1678, https://doi.org/10.1007/s00376-013-2234-9, 2013.
Ng, E.: Policies and technical guidelines for urban planning of high-density cities-air ventilation assessment (AVA) of Hong Kong, Build. Environ., 44, 1478–1488, https://doi.org/10.1016/j.buildenv.2008.06.013, 2009.
Ngarambe, J., Nganyiyimana, J., Kim, I., Santamouris, M., and Yun, G. Y.: Synergies between urban heat island and heat waves in Seoul: The role of wind speed and land use characteristics, PLoS ONE, 15, 12, https://doi.org/10.1371/journal.pone.0243571, 2020.
NSTI: Daily Timed Data from automated weather stations in China, China Meteorological Data Service Centre, NSTI [data set], http://data.cma.cn/en/?r=data/detail&dataCode=A.0012.0001 (last access: 1 April 2024), 2024.
Oke, T. R.: Initial guidance to obtain representative meteorological observations at urban sites, University of British Columbia, IOM Rep. 81, WMO/TD-No. 1250, 2004.
Oke, T. R., Mills, G., Christen, A., and Voogt, J. A.: Urban Climates, Cambridge University Press, ISBN 9780521849500, 2017.
Patz, J. A., Campbell-Lendrum, D., Holloway, T., and Foley, J. A.: Impact of regional climate change on human health, Nature, 438, 310–317, https://doi.org/10.1038/nature04188, 2005.
Peng, F., Wong M. S., Ho, H. C., Nichol, J., and Chan, P. W.: Reconstruction of historical datasets for analyzing spatiotemporal influence of built environment on urban microclimates across a compact city, Build. Environ., 123, 649–660, https://doi.org/10.1016/j.buildenv.2017.07.038, 2017.
Radfar, M.: Urban microclimate, designing the spaces between buildings. Housing Stud., 27, 2, 293–294, https://doi.org/10.1080/02673037.2011.615987, 2012.
Rafiee, A., Dias, E., and Koomen, E.: Urban forestry & urban greening Local impact of tree volume on nocturnal urban heat island: a case study in Amsterdam, Urban For Urban Green, 16, 50–61, https://doi.org/10.1016/j.ufug.2016.01.008, 2016.
Rao, K. S. and Snodgrass, H. F.: A nonstationary nocturnal drainage flow model, Bound.-Lay. Meteorol., 20, 309–320, https://doi.org/10.1007/BF00121375, 1981.
Ren, G., Chu, Z., Chen, Z., and Ren, Y.: Implications of temporal change in urban heat island intensity observed at Beijing and Wuhan stations, Geophys. Res. Lett., 34, 5, https://doi.org/10.1029/2006GL027927, 2007.
Ryu, Y. H. and Baik, J. J.: Quantitative analysis of factors contributing to urban heat island intensity, J. Appl. Meteorol. Climatol., 51, 842–854, https://doi.org/10.1175/JAMC-D-11-098.1, 2012.
Scarano, M. and Mancini, F.: Assessing the relationship between sky view factor and land surface temperature to the spatial resolution, International J. Remote Sens., 38, 6910–6929, https://doi.org/10.1080/01431161.2017.1368099, 2017.
Seto, K. C., Guneralp, B., and Hutyra, L. R.: Global forecasts of urban expansion to 2030 and direct impacts on biodiversity and carbon pools, P. Natl. Acad. Sci. USA, 109, 16083–16088, https://doi.org/10.1073/pnas.1211658109, 2012.
Shi, T., Huang, Y., Shi, C., and Yang, Y.: Influence of urbanization on the thermal environment of meteorological stations: Satellite-observational evidence, Adv. Clim. Change Res., 1, 7–15, https://doi.org/10.1016/j.accre.2015.07.001, 2015.
Shiroyama, R. and Yoshimura, C.: Assessing bluegill (Lepomis macrochirus) habitat suitability using partial dependence function combined with classification approaches, Ecol. Inform., 35, 9–18, https://doi.org/10.1016/j.ecoinf.2016.06.005, 2016.
Smola, A. J. and Schölkopf, B.: A tutorial on support vector regression, Stat. Comput., 14, 199–222, https://doi.org/10.1023/B:STCO.0000035301.49549.88, 2004.
Srivanit, M. and Kazunori, H.: The influence of urban morphology indicators on summer diurnal range of urban climate in Bangkok metropolitan area, Thailand, Int. J. Civil Environ. Eng., 11, 34–46, 2011.
Stewart, I. D. and Oke T. R.: Local climate zones for urban temperature studies, B. Am. Meteorol. Soc., 93, 1879–1900, https://doi.org/10.1175/BAMS-D-11-00019.1, 2012.
Stewart, I. D., Oke, T. R., and Krayenhoff, E. S.: Evaluation of the 'local climate zone' scheme using temperature observations and model simulations, Int. J. Climatol., 34, 1062–1080, https://doi.org/10.1002/joc.3746, 2014.
Sun, J., Wang, H., and Yuan, W.: Decadal variability of the extreme hot event in China and its association with atmospheric circulations, Clim. Environ. Res., 16, 199–208, 2011.
Taleghani, M., Sailor, D., and Ban-Weiss, G. A.: Micrometeorological simulations to predict the impacts of heat mitigation strategies on pedestrian thermal comfort in a Los Angeles neighborhood, Environ. Res. Lett., 11, 2, https://doi.org/10.1088/1748-9326/11/2/024003, 2016.
Tan, M., Liu, K., Liu, L.,Zhu, Y., and Wang, D.: Population spatialization of 30 m grid in pearl river delta based on stochastic forest model, Prog. Geogr., 36, 122–130, https://doi.org/10.18306/dlkxjz.2017.10.012, 2017.
Tian, Y. and Miao, J.: Overview of mountain-valley breeze studies in China, Meteorol. Sci. Technol., 47, 11, https://doi.org/10.19517/j.1671-6345.20170777, 2019.
Tian, Y., Zhou, W., Qian, Y., Zheng, Z., and Yan, J.: The effect of urban 2D and 3D morphology on air temperature in residential neighborhoods, Landscape Ecol., 34, 1161–1178, https://doi.org/10.1007/s10980-019-00834-7, 2019.
Tompalski, P. and Wężyk, P.: LiDAR and VHRS Data for Assessing living quality in cities-an approach based on 3D spatial indices, International Archives of the Photogrammetry, Remote Sens. Spatial Inf. Sci., XXXIX-B6, 173–176, https://doi.org/10.5194/isprsarchives-XXXIX-B6-173-2012, 2012.
Unger, J.: Intra-urban relationship between surface geometry and urban heat island: review and new approach, Clim. Res., 27, 253–264, https://doi.org/10.3354/cr0272532004, 2004.
Unger, J., Sümeghy, Z., and Zoboki, J.: Temperature cross-section features in an urban area, Atmos. Res., 58, 117–127, https://doi.org/10.1016/S0169-8095(01)00087-4, 2001.
Wang, X., Wang, C., and Li, Q.: Wind regimes above and below a temperate deciduous forest canopy in complex terrain: Interactions between slope and valley winds, Atmosphere, 6, 60–87, https://doi.org/10.3390/atmos6010060, 2015.
Wang, Y., Zheng, D., and Li, Q.: Urban meteorological disasters. Beijing: China Meteorological Press, ISBN 9787502947163, 2009.
Wei, J. and Sun, J.: The analysis of summer heat wave and sultry weather in North China, Clim. Environ. Res., 12, 453–463, https://doi.org/10.1175/1520-0442(1998)011<3030:acrtai>2.0.co;2, 2007.
Whiteman, C. D. and Doran, J. C.: The relationship between overlying synoptic-scale flows and winds within a valley, J. Appl. Meteorol., 32, 1669–1682, https://doi.org/10.1175/1520-0450(1993)0322.0.CO;2, 1993.
Whiteman, C. D. and Zhong, S.: Downslope flows on a low-angle slope and their interactions with valley inversions, Part I: Observations, J. Appl. Meteorol. Climatol., 47, 2023–2038, https://doi.org/10.1175/2007JAMC1669.1, 2008.
Xie, J., Sun, T., Liu, C., Li, L., Xu, X., Miao, S., Lin, L., Chen, Y., and Fan, S.: Quantitative evaluation of impacts of the steadiness and duration of urban surface wind patterns on air quality, Sci. Total Environ., 850, 157957, https://doi.org/10.1016/j.scitotenv.2022.157957, 2022.
Xu, W. H., Li, Q. X., Wang, X. L., Yang, S., Cao, L., and Feng, Y.: Homogenization of Chinese daily surface air temperatures and analysis of trends in the extreme temperature indices, J. Geophys. Res.-Atmos., 118, 9708–9720, https://doi.org/10.1002/jgrd.50791, 2013.
Xu, Z., Fitzgerald, G., Guo, Y., Jalaludin, B., and Tong, S.: Impact of heatwave on mortality under different heatwave definitions: A systematic review and meta-analysis, Environ. Int., 89–90, 193–203, https://doi.org/10.1016/j.envint.2016.02.007, 2016.
Xue, J., Zong, L., Yang ,Y., Bi, X., Zhang, Y., and Zhao, M.: Diurnal and interannual variations of canopy urban heat island (CUHI) effects over a mountain-valley city with a semi-arid climate, Urban Clim., 48, 101425, https://doi.org/10.1016/j.uclim.2023.101425, 2023.
Yang, J. and Huang, X.: The 30 m annual land cover dataset and its dynamics in China from 1990 to 2019, Earth Syst. Sci. Data, 13, 3907–3925, https://doi.org/10.5194/essd-13-3907-2021, 2021.
Yang, J. and Huang, X.: The 30 m annual land cover datasets and its dynamics in China from 1990 to 2021, in: Earth System Science Data (1.0.1, Vol. 13, Number 1, 3907–3925 pp., Zenodo [data set], https://doi.org/10.5281/zenodo.5816591, 2022.
Yang, J., Su, J., Xia, J., Jin, C., Li, X., and Ge, Q.: The impact of spatial form of urban architecture on the urban thermal environment: A case study of the Zhongshan District, Dalian, China, IEEE J. Select. Top. Appl. Earth Observ. Remote Sens., 11, 2709–2716, https://doi.org/10.1109/JSTARS.2018.2808469, 2018.
Yang, P., Liu, W., Zhong, J., and Yang, J.: Evaluating the quality of temperature measured at automatic weather stations in Beijing, J. Appl. Meteorol. Sci., 22, 706–715, https://doi.org/10.1016/j.buildenv.2023.110180, 2011 (in Chinese).
Yang, P., Ren, G., and Liu, W.: Spatial and temporal characteristics of Beijing urban heat island intensity, J. Appl. Meteorol. Climatol., 52, 1803–1816, https://doi.org/10.1175/JAMC-D-12-0125.1, 2013.
Yang, Y., Guo, M., Wang, L., Zong, L., Liu, D., Zhang, W., Wang, M., Wan, B., and Guo, Y.: Unevenly spatiotemporal distribution of urban excess warming in coastal Shanghai megacity, China: Roles of geophysical environment, ventilation and sea breeze, Build. Environ., 235, 110180, https://doi.org/10.1016/j.buildenv.2023.110180, 2023.
Yang, Y., Luo, F., Xue, J., Zong, L., Tian, W., and Shi, T.: Research progress and perspective on synergy between urban heat waves and canopy urban heat island, Adv. Earth Sci., 39, 1–16, https://doi.org/10.11867/j.issn.1001-8166.2024.032, 2024.
Yang, Y., Zheng, X., Gao, Z., Wang, H., Wang, T., Li, Y., Lau, G. N. C., and Yim, S. H. L.: Long-term trends of persistent synoptic circulation events in planetary boundary layer and their relationships with haze pollution in winter half year over Eastern China, J. Geophys. Res.-Atmos., 123, 10991–11007, https://doi.org/10.1029/2018JD028982, 2018.
Yang, Y., Zheng, Z., Yim, S. Y. L., Roth, M., Ren, G., Gao, Z., Wang, T., Li, Q., Shi, C., and Ning, G.: PM2.5 pollution modulates wintertime urban heat island intensity in the BeijingTianjin-Hebei Megalopolis, China, Geophys. Res. Lett., 47, 1–12, https://doi.org/10.1029/2019GL084288, 2020.
You, C., Cai, X., Song, Y., and Guo, H.: Local atmospheric circulations over Beijing-Tianjin Area in summer, Acta Scientiarum Naturalium Universitatis Pekinensis, 42, 779–783, https://doi.org/10.3321/j.issn:0479-8023.2006.06.015, 2006.
Yu, Z., Chen, S., Wong, N., Ignatius, M., Deng, J., He, Y., and Hii, D. J. C.: Dependence between urban morphology and outdoor air temperature: A tropical campus study using random forests algorithm, Sustain. Cities Soc., 61, 1–12, https://doi.org/10.1016/j.scs.2020.102200, 2020.
Zakšek, K., Oštir, K., and Kokalj, Ž.: Sky-view factor as a relief visualization technique, Remote Sens., 3, 398–415, https://doi.org/10.3390/rs3020398, 2011.
Zängl, G.: The impact of weak synoptic forcing on the valley-wind circulation in the Alpine Inn valley, Meteorol. Atmos. Phys., 105, 37–53, https://doi.org/10.1007/s00703-009-0030-y, 2009.
Zhang, H., Zhu, S., Gao, Y., and Zhang, G.: The relationship between urban spatial morphology parameters and urban heat island intensity under fine weather condition, J. Appl. Meteorol. Sci., 27, 249–256, https://doi.org/10.11898/1001-7313.20160213, 2016.
Zhang, N., Zhu, L. F., and Zhu, Y.: Urban heat island and boundary layer structures under hot weather synoptic conditions: A case study of Suzhou City, China, Adv. Atmos. Sci., 28, 855–865, https://doi.org/10.1007/s00376-010-0040-1, 2011.
Zheng, Z., Ren, G., Wang, H., Dou, J., Gao, Z., Duan, C., Li, Y., Ngarukiyimana, J. P., Zhao, C., Cao, C., Jiang, M., and Yang, Y.: Relationship between fine-particle pollution and the urban heat island in Beijing, China: Observational evidence, Bound.-Lay. Meteorol., 169, 93–113, https://doi.org/10.1007/s10546-018-0362-6, 2018a.
Zheng, Z., Ren, G., and Gao, H.: Analysis of the local circulation in Beijing area, Meteorol. Monthly, 44, 425–433, https://doi.org/10.7519/j.issn.1000-0526.2018.03.009, 2018b.
Zheng, Z., Ren, G., Gao, H., and Yang, Y.: Urban ventilation planning and its associated benefits based on numerical experiments: A case study in beijing, China, Build. Environ., 222, 109383, https://doi.org/10.1016/j.buildenv.2022.109383, 2022.
Zhou, D., Zhao, S., Liu, S., Zhang, L., and Zhu, C.: Surface urban heat island in China's 32 major cities: Spatial patterns and drivers, Remote Sens. Environ., 152, 51–61, https://doi.org/10.1016/j.rse.2014.05.017, 2014.
Zhou, X., Okaze, T., Ren, C., Cai, M., and Mochida, A.: Evaluation of urban heat islands using local climate zones under the influences of sea-Land breeze, Sustain. Cities Soc., 55, 102060, https://doi.org/10.1016/j.scs.2020.102060, 2020.
Zinzi, M., Agnoli, S., Burattini, C., and Mattoni, B.: On the thermal response of buildings under the synergic effect of heat waves and urban heat island, Solar Energy, 211, 1270–1282, https://doi.org/10.1016/j.solener.2020.10.050, 2020.
Zong, L., Liu, S., Yang, Y., Ren, G., Yu, M., Zhang, Y., and Li, Y.: Synergistic influence of local climate zones and wind speeds on the urban heat island and heat waves in the Megacity of Beijing, China, Front. Earth Sci., 9, 673786, https://doi.org/10.3389/feart.2021.673786, 2021.
Zong, L., Yang, Y., Xia, H., Gao, M., Sun, Z., Zheng, Z., Li, X., Ning, G., Li, Y., and Lolli, S.: Joint occurrence of heatwaves and ozone pollution and increased health risks in Beijing, China: role of synoptic weather pattern and urbanization, Atmos. Chem. Phys., 22, 6523–6538, https://doi.org/10.5194/acp-22-6523-2022, 2022.


