the Creative Commons Attribution 4.0 License.
the Creative Commons Attribution 4.0 License.
Interpreting summertime hourly variation of NO2 columns with implications for geostationary satellite applications
Deepangsu Chatterjee
Randall V. Martin
Dandan Zhang
Haihui Zhu
Daven K. Henze
James H. Crawford
Ronald C. Cohen
Lok N. Lamsal
Alexander M. Cede
Accurate representation of the hourly variation in the NO2-column-to-surface relationship is essential for interpreting geostationary observations of NO2 columns. Previous research indicated inconsistencies in this hourly variation. This study employs the high-performance configuration of the GEOS-Chem model (GCHP) to analyze daytime hourly NO2 total columns and surface concentrations during summer. We use measurements from globally distributed Pandora sun photometers and aircraft observations over the United States. We correct Pandora total NO2 vertical columns for (1) hourly variations in effective temperature driven by vertically resolved contributions to the total column and (2) changes in local solar time along the Pandora line of sight. These corrections increase the total NO2 columns by 5–6 × 10¹⁴ molec. cm−2 at 09:00 and 18:00 across all sites. Fine-scale simulations from GHCP (∼12 km) reduce the normalized bias (NB) against Pandora total NO2 columns from 19 % to 10 % and against aircraft measurements from 25 % to 13 % in Maryland, Texas, and Colorado. Similar reductions are observed in NO2 columns over the eastern US (17 % to 9 %), the western US (22 % to 14 %), Europe (24 % to 15 %), and Asia (29 % to 21 %) when compared to 55 km simulations. Our analysis attributes the weaker hourly variability in the total NO2 column to (1) hourly variations in column effective temperature, (2) local solar time changes along the Pandora line of sight, and (3) differences in hourly NO2 variability from different atmospheric layers, with the lowest 500 m exhibiting greater variability, while the dominant residual column above 500 m exhibits weaker variability.
- Article
(3746 KB) - Full-text XML
- BibTeX
- EndNote
Nitrogen oxides (NOx ≡ NO+ NO2) affect air quality and human health directly by contributing to premature mortality (Burnett et al., 2004; Tao et al., 2012) and asthma for children and adults (Anenberg et al., 2018) and indirectly by acting as precursors for tropospheric ozone (O3) formation (Jacob et al., 1996) and nitrate aerosols (Bauer et al., 2007). Significant spatial gaps in ground-based monitoring of surface NO2 concentrations and pronounced NO2 heterogeneity inhibit exposure assessment. To fill in the knowledge of NO2 exposures across a greater fraction of the human population, satellite remote sensing offers the potential for spatially comprehensive measurements. Major advances in satellite remote sensing from sun-synchronous low-Earth orbit (LEO) has achieved global characterization of tropospheric NO2 columns at specific times of the day (Duncan et al., 2013; Veefkind et al., 2012) that have been applied to infer ground-level NO2 concentrations (Anenberg et al., 2022; Lamsal et al., 2011; Geddes and Martin, 2017; Cooper et al., 2022). The emerging geostationary constellation (Al-Saadi et al., 2017), including the Geostationary Environmental Monitoring Spectrophotometer (GEMS) over Asia, Tropospheric Emissions: Monitoring Pollution (TEMPO) over North America, and Sentinel-4 over Europe, offers the prospect of inferring spatially comprehensive maps of hourly ground-level NO2 concentrations. Toward this goal, there is a need to develop an accurate representation of the hourly NO2-column-to-surface relationship.
Understanding the hourly variation of the relationship of NO2 columns with surface concentrations is of particular interest due to its role in the inference of hourly surface NO2 from satellite remote sensing. Numerous studies have separately examined the role of processes such as surface emissions, boundary layer mixing, chemistry, deposition, and advection (Yang et al., 2023; Herman et al., 2009; Ghude et al., 2020; Zhang et al., 2016) in the hourly variation of NO2 columns and in surface NO2 concentrations in the United States (Day et al., 2009), Spain (Van Stratum et al., 2012), India (David and Nair, 2011), South Korea (Yang et al., 2023, 2024), and China (Tong et al., 2017). Differences have been identified in the daytime hourly variation of NO2 tropospheric columns and surface concentrations during the NASA DISCOVER-AQ (Deriving Information on Surface Conditions from Column and Vertically Resolved Observations Relevant to Air Quality) and KORUS-AQ (Korea–United States Air Quality) campaigns, with pronounced variation in surface concentrations that is not evident in the columns (Choi et al., 2020; Crawford et al., 2021). Differences have also been noted in hourly variation of NO2 measured by aircraft and ground-based Pandora instruments (Li et al., 2021). There is a need to understand the factors that can affect the relationship of hourly NO2 columns with surface concentrations.
Major challenges in the interpretation of satellite NO2 observations include the short lifetime of NOx (Laughner and Cohen, 2019) and localized emissions (Crippa et al., 2018) that affect its spatial heterogeneity. Course-resolution inputs to satellite retrieval algorithms (e.g., terrain height, albedo, and a priori NO2 profiles) can lead to biases (Laughner et al., 2018, 2019; Russell et al., 2011). Complications with ground-based measurements of the NO2 columns as part of Pandora include uncertainties at steeper solar zenith angles during morning and evening hours (Herman et al., 2009; Reed et al., 2015) and the changing Pandora field of view (FOV) during morning and late evening (Li et al., 2021). Nonlinearities in the relationship between NO2 concentrations and NOx sources or sinks can lead to biases in coarse-resolution chemical transport models (CTMs) (Valin et al., 2011) that necessitate CTMs with a finer resolution (Li et al., 2021, 2023a). Recent advances in the simulation of global atmospheric composition at fine resolution (Eastham et al., 2018; Hu et al., 2018; Martin et al., 2022) offer the opportunity to address the resolution need at the global scales of the geostationary constellation.
An important consideration in the inference of surface NO2 concentrations with columnar satellite observations is the vertical profile of NO2 concentrations. Aircraft observations from the NASA Deriving Information on Surface Conditions from Column and Vertically Resolved Observations Relevant to Air Quality (DISCOVER-AQ) campaign offer measurements of the NO2 vertical profile in the lower troposphere for evaluation of modeled vertical profiles (Flynn et al., 2014; Reed et al., 2015). The Pandonia Global Network (PGN) is a global sun photometer network that offers hourly measurements of total NO2 columns (Verhoelst et al., 2021), useful for interpretation of the daytime variation of NO2 columns and evaluation of simulated columns. In this study, we interpret the summertime NO2 measurements from the NASA P-3B aircraft using high-performance GEOS-Chem (GCHP) simulations along aircraft flight tracks and account for the line of sight of the Pandora sun photometers over Maryland, Texas, and Colorado during the DISCOVER-AQ campaign. We also explore the effect of vertical changes in the hourly variation of temperature on the NO2 cross-section and the raw Pandora columns. We further investigate the hourly variation of NO2 columns and surface concentrations from 50 PGN sites across the Northern Hemisphere. Section 2 describes the datasets and methods used in this study to interpret the variation of NO2 columns, surface concentrations, and vertical distribution over DISCOVER-AQ and PGN sites. Section 3 examines the consistency between the NO2 vertical columns and surface concentrations across DISCOVER-AQ sites and PGN sites across the contiguous United States (CONUS), Europe, and Asia. We explore the effects of model resolution and boundary layer height adjustments on the hourly variation of NO2 total columns and surface concentrations as a function of hourly variation in mixed layer depth and photochemistry, as well as measurement characteristics of Pandora sun photometers over PGN sites across CONUS, Europe, and Asia.
2.1 Aircraft measurements of NO2 vertical profiles
The DISCOVER-AQ campaign offers comprehensive datasets of airborne and surface observations relevant for accessing air quality. One of the main objectives of the campaign was to examine the hourly variation of the relationship between the column and surface concentrations. In this study, we use aircraft, Pandora, and surface measurements over Maryland (July 2011), Texas (September 2013), and Colorado (July–August 2014) to investigate the hourly variation of NO2 vertical profiles during summer when a long duration of daylight exists for analysis. Figure A1 shows the flight tracks, altitude variation, roadways, and Pandora instrument locations over Maryland, Texas, and Colorado during the DISCOVER-AQ campaign. We focus on the aircraft spirals since they are designed to sample the vertical profile. We use NO2 concentrations measured by the thermal dissociation laser-induced fluorescence (TD-LIF) technique (Thornton et al., 2000; Day et al., 2002) during the campaign. The laser-induced fluorescence method is highly sensitive for directly measuring NO2, with a measurement uncertainty of 5 % and a detection limit of 30 pptv (Thornton et al., 2000). It also attempts to correct for positive interferences (Nault et al., 2015; Yang et al., 2023). We use aircraft measurements from a height of about 300 m above ground level (a.g.l.) up to 4 km a.g.l. where high measurement frequency facilitates regional representation.
2.2 Pandonia Global Network NO2 total column densities
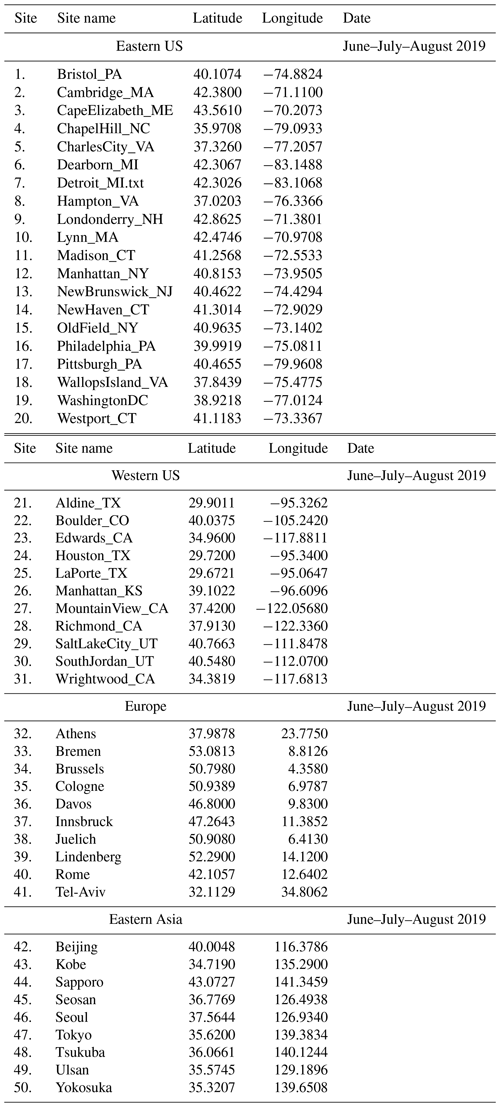
The PGN is a global network of ground-based sun photometers that measure sun and sky radiance from 270 to 530 nm, allowing retrievals of various trace gases including NO2. Retrieval precision for total vertical NO2 columns (“NO2 columns” hereafter) is 5.4×10¹⁴ molec. cm−2 with a nominal accuracy of 2.7 × 10¹⁵ molec. cm−2 under clear-sky conditions (Herman et al., 2009; Cede, 2021). We obtained the level 2 data product from the version rnvs3p1-8 for PGN and DISCOVER-AQ (data source listed in the “Code and data availability” section). We also include surface NO2 observations from co-located DISCOVER-AQ and PGN sites. We use NO2 columns and surface concentrations employed during the DISCOVER-AQ campaign from 18 sites over Maryland, Texas, and Colorado. We also include NO2 columns and surface concentrations from 50 PGN sites (the US: 31, Europe: 10, Asia: 9) for June–July–August (JJA) 2019. We focus on the NO2 observations between 09:00–18:00 local solar time for consistency in observation frequency across all PGN sites. Tables A1 and A2 contain the names and locations of the DISCOVER-AQ and PGN sites, respectively. We exclude Pandora measurements with SZA > 80° (SZA: solar zenith angle). We use total NO2 columns including the stratosphere because the use of external information sources to remove the stratospheric NO2 columns from PGN can introduce errors in the residual tropospheric columns (Choi et al., 2020).
2.3 GEOS-Chem simulations
We use GCHP, the high-performance configuration of the GEOS-Chem model that operates with a distributed-memory framework for massive parallelization (Eastham et al., 2018), to interpret the NO2 column, vertical distribution, and surface observations. GCHP offers the ability to simulate the entire atmospheric column needed to interpret Pandora measurements and the fine spatial resolution needed to interpret aircraft measurements. GEOS-Chem is driven by assimilated meteorological data from the NASA Goddard Earth Observation System (GEOS). GEOS-Chem includes a comprehensive Ox–NOx–VOC–halogen–aerosol chemical mechanism in the troposphere (VOC: volatile organic compound), in addition to the unified tropospheric–stratospheric chemistry extension in the stratosphere (Eastham et al., 2014). We use GEOS-Chem 14.1.1, which includes recent updates to GCHP (Martin et al., 2022), NOx heterogenous and cloud chemistry (Holmes et al., 2019), isoprene chemistry (Bates and Jacob, 2019), and aromatic chemistry (Bates et al., 2021). The ISORROPIA II module simulates the thermodynamic partitioning between the gas and condensed phase (Fountoukis and Nenes, 2007). Natural emissions include biogenic volatile organic compounds (VOCs) (Weng et al., 2020), lightning NOx (Murray et al., 2012), and soil NOx (Weng et al., 2020). GEOS-Chem includes an updated aircraft NOx emissions inventory for 2019, developed with the Aircraft Emissions Inventory Code (Simone et al., 2013). Fig. A2 shows the hourly variation of NOx emissions across the PGN sites. For the interpretation of PGN measurements in 2019, we conduct the simulations for the year 2019 using GEOS-FP meteorology and the stretched grid capability (Bindle et al., 2021) at a cubed sphere resolution of C180 (∼55 km) and stretch factor of 4.0, yielding a regional refinement of ∼12 km. All simulations were conducted with a 2-week spin-up. We interpolate hourly GCHP outputs of simulated NO2 columns and surface concentrations to the local solar time at the PGN observation sites.
For interpretation of the DISCOVER-AQ aircraft campaigns, we conduct simulations over Maryland (July 2011), Texas (September 2013), and Colorado (July–August 2014) with identical stretched grid configurations, with sampling along the aircraft flight tracks. We use MERRA-2 meteorology for these simulations as GEOS-FP meteorology datasets are not available prior to 2014. A sensitivity test for the year 2019 using either GEOS-FP or MERRA-2 affects the local simulated NO2 columns and surface concentrations by less than 5 % for both 12 and 55 km resolutions.
Hourly variation of the planetary boundary layer height (PBLH) can influence the vertical distribution and hence the surface concentration of aerosols and trace gases (Lin and McElroy, 2010). Millet et al. (2015) found that GEOS-FP reanalysis overestimates daytime PBLH compared to observations; correcting for PBLH estimations can lead to better agreement of ozone (Oak et al., 2019) and PM2.5 (Li et al., 2023b) with measurements. Our base case simulation uses the PBLH derived from the Aircraft Meteorological Data Reports (AMDAR) at 54 sites across CONUS to adjust the PBLH estimates as described in Li et al. (2023b). We examine the effect of using the adjusted PBLH for simulations over CONUS, Europe, and East Asia. Table 1 shows the three simulation cases conducted over Maryland, Texas, Colorado, CONUS, Europe, and East Asia.
2.4 Effective temperature of Pandora measurements
The NO2 cross-section is temperature-dependent, with the magnitude of spectral features in a 294 K NO2 spectrum about 80 % of those in a 220 K NO2 spectrum (Vandaele et al., 2002). Thus, the NO2 columns fitted with a 220 K NO2 spectrum are about 80 % of those fitted with the 294 K NO2 spectrum. Prior studies have identified biases in the Pandora total ozone column effective temperature driven by variations in seasonal temperature (Zhao et al., 2016; Herman et al., 2015). To account for the hourly variations in temperature vertical profiles, we calculate simulated NO2 effective temperatures Teff using the site-specific hourly GEOS-FP temperature profiles (T)i, NO2 cross-section , and GCHP NO2 vertical profiles following Eq. (1) of Herman et al. (2009).
The comparison between GCHP-simulated and Pandora-observed effective temperature is discussed in Sect. 3.2.
2.5 Local solar time along Pandora line of sight
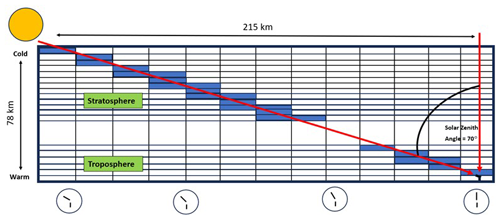
For observing scenarios with large solar zenith angles, the Pandora sun photometer observes air masses with varying local solar time at different altitudes along the line of sight. This feature is particularly noteworthy for comparing hourly Pandora observations with other measurements or simulations. Figure 1 shows the sampling process of GCHP simulations along the line of sight of the Pandora sun photometer. GCHP grid boxes are integrated along the viewing geometry of the Pandora instrument to create a “staircase column” that accounts for the effects of local solar time on the horizontal and vertical variation in NO2 concentrations. The variation in local solar time is most relevant near sunrise and sunset when the NO2 NOx ratios change rapidly as discussed in Sect. 3.2. We correct the vertical columns reported by PGN to the local solar time of the instrument by applying the ratio of integrated staircase columns to vertical columns.
2.6 Ground-based surface NO2 measurements
We use hourly NO2 surface concentrations from the catalytic converter measurements over DISCOVER-AQ and PGN sites. Based on the approach of Lamsal et al. (2008) and Shah et al. (2020), we correct the interference of organic nitrates and HNO3 in the NO2 measurements using a correction factor derived from GCHP-simulated site-specific NO2, organic nitrates, and HNO3 mixing ratios. The correction for HNO3 and organic nitrates reduced the summertime mean NO2 surface concentrations by 18 % over DISCOVER-AQ sites and 23 % over PGN sites.
2.7 Normalized bias
We use normalized absolute bias or normalized bias (NB) to evaluate the simulations. The NB is calculated using the following equation:
where Oi is the observation and Si is the corresponding simulated value, i refers to the index of the observation, and N refers to the total number of observations.
3.1 Hourly variation of observed and simulated NO2 vertical profiles
Figure 2 shows the hourly variation in the airborne TD-LIF measurements and simulated NO2 vertical profiles at 12 km resolution (Base_12) over Maryland, Texas, and Colorado during the DISCOVER-AQ campaign. The measurements exhibit a pronounced maximum at 500 m at 10:00 (squares) that diminishes by a factor of 2 in the afternoon as concentrations become more uniform below 1.5 km (triangles and diamonds), driven by the hourly variation in PBLH mixing from early morning to late afternoon. For all three DISCOVER-AQ campaigns, the 12 km simulated NO2 mixing ratios represent the vertical profile well, with normalized bias (NB) below 16 % at local times 10:00, 14:00, and 17:00. Differences tend to be larger within 1–2 km above ground level in the afternoon (14:00 and 17:00 local time), which integrates to a lower simulated partial column of 6×10¹⁴ molec. cm−2. The simulated NO2 vertical profiles at 12 km without PBLH modifications (NoΔBL_12) are similar to those with the PBLH modification (Fig. A3). Figure A4 shows the 55 km simulated NO2 vertical profiles (NoΔBL_55). The 55 km GCHP simulations have increased NB by a factor of 2 compared to 12 km. Overall, the NO2 vertical profile exhibits greater consistency with observations at 12 km than at 55 km by better resolving the heterogeneous conditions along the aircraft flight tracks.
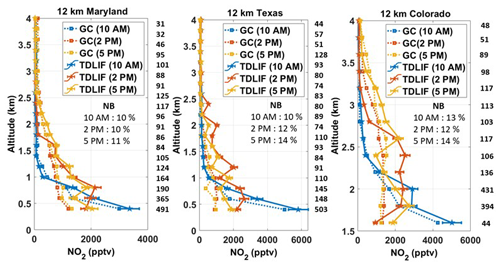
Figure 2NO2 vertical profiles from the TD-LIF instrument aboard P-3B during the DISCOVER-AQ campaign over Maryland, Texas, and Colorado. The solid colored lines with pentagram markers represent observations. The dotted colored lines with square markers represent 12 km GCHP-simulated mixing ratios. The inset values in the boxes show the normalized biases (NBs) at 10:00, 14:00, and 17:00. The numbers on the right of each panel represent the number of observations associated with the corresponding altitude level. Error bars indicate standard errors in measurements.
3.2 Corrections to Pandora effective temperature
The left panel in Fig. 3 shows the Pandora and simulated mean hourly effective temperature of the NO2 columns over all PGN sites during June–August as inferred using hourly GEOS-FP temperature profiles and GCHP NO2 vertical profiles. The Pandora effective temperatures exhibit weak hourly variation with a warmer temperature at the Asian sites where boundary layer NO2 concentrations are typically higher than in the US and Europe. The GCHP-simulated effective temperature is also warmer for Asian sites; however, the effective temperature is lower during the early afternoon when near-surface NO2 concentrations tend to be minimum such that the stratospheric NO2 makes a larger fractional contribution to the total column. The simulated effective temperature further deviates from the Pandora effective temperature, with an increase toward sunrise and sunset, contributing to higher surface NO2 concentrations. The corresponding correction factor (CF) for hourly variation in the effective temperature is calculated as
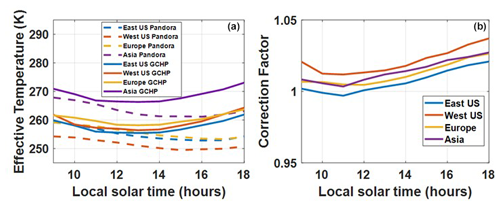
Figure 3Hourly variation of the total NO2 column mean effective temperature across all PGN sites (a) and the corresponding correction factors (b).
The factor of reflects the difference between the NO2 columns fitted with a 220 K NO2 spectrum that are about 80 % of those fitted with a 294 K NO2 spectrum. The CF for the Pandora NO2 columns increases toward sunrise and sunset due to the increased effective temperature, reflecting the greater abundance of NO2 molecules observed per unit absorption. We apply site-specific CFs across all Pandora observations.
3.3 Hourly variation of observed and simulated total NO2 columns
Figure 4 (left) shows the mean hourly daytime Pandora vertical NO2 columns summarized from the summertime DISCOVER-AQ campaign measurements. The raw Pandora NO2 columns exhibit weak hourly variation of 8×10¹⁴ molec. cm−2 (within 10 % of the daytime mean) that is inconsistent with the aircraft measurements, which indicate total columns in the morning and evening of about 1.5×10¹⁵ molec. cm−2 greater than afternoon. The corrected Pandora measurements that account for hourly variation in effective temperature and local solar time along the line of sight exhibit greater NO2 columns in the morning and evening by about 1.3×10¹⁵ molec. cm−2, similar to the aircraft measurements. Since the Pandora instruments track the sun, viewing stratospheric air masses 100–200 km away from the measurement station to the east in the morning and to the west in the evening, the local solar time of stratospheric NO2 observed by Pandora instruments near sunrise and sunset is systematically shifted by about 5–10 min towards noon. This shift can be particularly important during sunrise and sunset when NO2 columns in the stratosphere undergo a pronounced increase driven by an increasing NO2 NOx ratio (Fig. A5). The 12 km simulated vertical columns generally represent the corrected Pandora-observed columns, with an NB of 10 %. Excluding the PBLH modification would have increased the NB to 13 %. Using a coarser 55 km simulation would have further degraded the agreement with an NB of 19 %. We sample the GCHP-simulated NO2 columns between 300 m and 4 km to compare with the aircraft columns (right panel). The hourly variation of partial NO2 columns over 300 m to 4 km a.g.l. from aircraft observations exhibits a distinct increase in the morning and evening and is well represented by the 12 km base case simulation (NB = 13 %). Similar to our analysis for Pandora sites, excluding the PBLH modification and coarsening the simulation to 55 km degrades the performance (NB = 15 % and 25 %) versus aircraft columns.
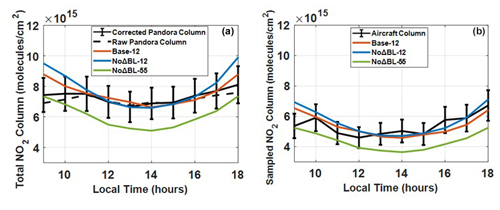
Figure 4Panel (a) shows the total NO2 vertical columns from corrected DISCOVER-AQ Pandora columns (black), raw DISCOVER-AQ Pandora columns (black dotted), the 12 km base case simulation (red), 12 km without modified PBLH (blue), and 55 km without modified PBLH (green) during the DISCOVER-AQ campaigns over Maryland (2011), Texas (2013), and Colorado (2014). The corrected Pandora columns account for the hourly variation in the effective temperature and the local solar time along the line of sight. Panel (b) shows aircraft-sampled and simulated partial columns (300 m a.g.l.–4 km a.g.l). Error bars indicate standard error.
Figure 5 extends our analysis to all PGN sites across CONUS, Europe, and East Asia. Raw measurements across all regions exhibit weak hourly variation. The correction for effective temperature and local solar time along the Pandora line of site increases the mean NO2 columns in the morning and evening by about 6×10¹⁴ molec. cm−2 across all regions. The base case simulation generally reproduces measurements with NB of 9 % for the eastern US, 14 % for the western US, 15 % for Europe, and 21 % for East Asia. Excluding the PBLH correction would have increased the NB (eastern US: 12 %, western US: 18 %, Europe: 18 %, and eastern Asia: 26 %), with the largest change in Asia. Excluding the PBLH correction yields a higher daytime PBLH, resulting in increased chemical lifetime of NOx, reduced NO2 dry deposition rates, and increased NO2 NOx ratio during afternoon and evening (Fig. A6), thus leading to an hourly variation that deviates from the Pandora observations. Coarser resolution generally further increases the bias, reflecting resolution effects discussed in the next section. The increase in the simulated total NO2 columns between 15:00–18:00 across all PGN sites reflects an increase in the NO2 NOx ratio throughout the column, driven by a reduction in HOx (Fig. A7).
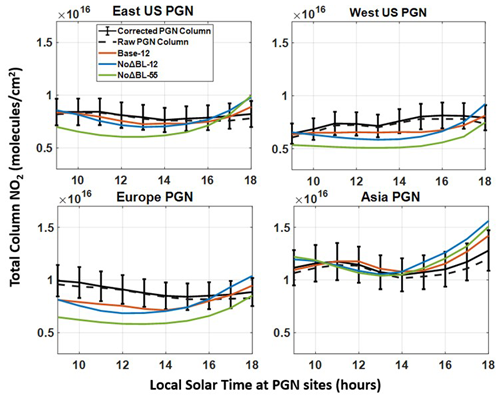
Figure 5The total NO2 vertical columns from corrected Pandora columns (black), raw Pandora columns (black dotted), the 12 km base case simulation (red), 12 km without modified PBLH (blue), and 55 km without modified PBLH (green) sampled over PGN sites for the summer months of June–July–August in 2019. Error bars indicate standard error.
3.4 Simulated total NO2 columns
Figure 6 shows the 12 km and 55 km simulated total NO2 columns for the summer months of June–July–August in 2019 between 09:00 and 18:00 (local solar time) over CONUS. The overlaid circles show the PGN mean total NO2 columns. The 12 km simulated NO2 columns exhibit greater heterogeneity and better consistency with PGN-observed columns (NB = 13 %) compared to the 55 km simulated NO2 columns (NB = 20 %). This is primarily driven by better representation of emission and chemical processes at fine resolution (Zhang et al., 2023; Li et al., 2023a). Emissions at these sites are dominated by the transportation sector (Table A3). Figure 7 shows the total NO2 columns from the PGN, 12 km simulation, and 55 km simulation for the summer months of June–July–August in 2019 between 09:00 and 18:00 local solar time over Europe and East Asia. We find enhanced NO2 vertical columns over urban areas in western Europe, eastern China, Japan, and the Korean peninsula. The 12 km simulated NO2 columns exhibit more resolved combustion features and better agreement with Pandora-observed columns for Europe (NB = 15 %) and East Asia (NB = 17 %) compared to the 55 km simulated NO2 columns for Europe (NB = 24 %) and East Asia (NB = 29 %).
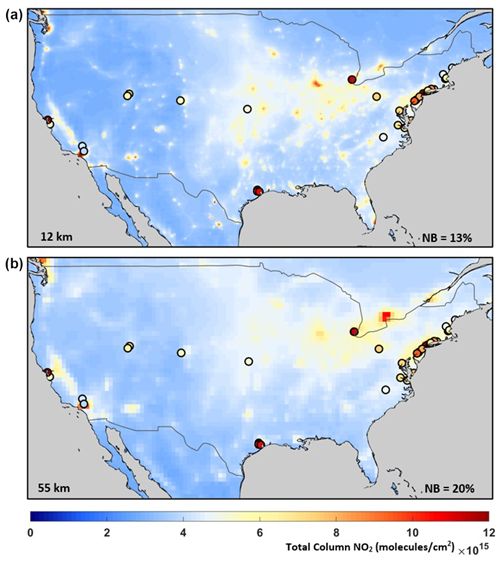
Figure 6Simulated NO2 total columns at 12 km (a) and 55 km (b) horizontal resolutions for the 3-month average of June–July–August 2019 over domains where PGN monitors were available between 09:00–18:00 local solar time. The solid circles represent the PGN mean total columns between 09:00–18:00 local solar time for PGN sites in CONUS (31).
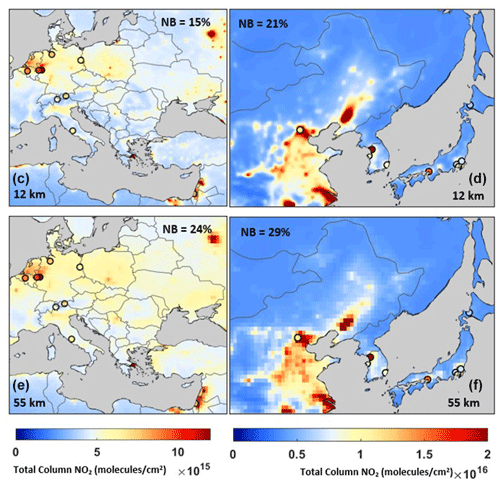
Figure 7Simulated NO2 total columns at 12 km (c, d) and 55 km (e, f) horizontal resolutions for the 3-month average of June–July–August 2019 over domains where PGN monitors were available between 09:00–18:00 local solar time. The solid circles represent the PGN mean total columns between 09:00–18:00 local solar time for the PGN sites in Europe (10) and Asia (9).
3.5 Hourly variation of observed and simulated surface NO2 concentrations
Figure 8 shows the hourly variation in surface NO2 mixing ratios from the corrected in situ measurements and 12 km simulations over Maryland, Texas, and Colorado. Measured NO2 mixing ratios are greater in the morning and evening than in the afternoon as expected from the mixed layer growth and shorter NOx lifetime in the afternoon. Observed NO2 surface concentrations over PGN sites in Asia show enhancement during evening hours (17:00–18:00) compared to PGN sites elsewhere.

Figure 8Panel (a) shows the hourly variation of corrected surface NO2 mixing ratios from observations during the DISCOVER-AQ campaign. Panels (b) and (c) show the hourly variation of observed and 12 km simulated surface NO2 mixing ratios averaged over the PGN sites with and without PBLH modification, respectively. Error bars indicate standard error.
The measurements are better represented at 12 km (NB = 21 %) than at 55 km (NB = 63 %) by better resolving high NOx emissions near measurement sites. Both Base_12 and NoΔBL_12 simulated NO2 concentrations generally represent the observations, well with NB = 18 % (Base_12) and NB = 20 % (NoΔBL_12), across all PGN sites.
3.6 Hourly variation of layer contributions to simulated total NO2 columns
Given the overall skill of the 12 km simulations in representing the Pandora, aircraft, and surface NO2 we proceed to apply the 12 km simulations to understand how the simulated NO2 vertical profile affects the simulated NO2-column-to-surface relationship. Figure 9 shows the hourly variation of simulated contributions to the NO2 total columns (Base_12) from different vertical layers for multiple regions. In all four regions, within the troposphere, the layer below 0.5 km is the largest contributor at 09:00, with a diminishing contribution into the afternoon associated with mixed layer growth followed by an increasing contribution towards evening. The contribution from layers between 0.5 km and the tropopause has weaker variation, contributing to the overall weaker variation in total columns. Fractional layer contributions are shown in Fig. A8. Fractional hourly variation of the layers above 0.5 km exhibits a compensating inverse behavior, with a pronounced variation in the stratospheric fraction. Contributions from the free troposphere are relatively high for the eastern US, reflecting the lightning contribution (Shah et al., 2023; Dang et al., 2023). Over Asia the fractional contribution below 0.5 km is the highest (26 %–42 %), reflecting major surface contributions. Overall, we find that for all four regions, the hourly variation in the total column reflects hourly variation below 500 m, dampened by greater column contributions above 500 m that dominate the total column.
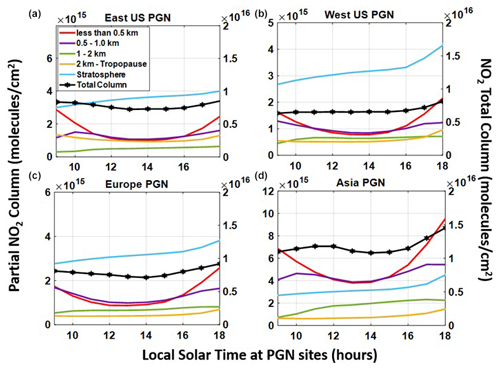
Figure 9The simulated absolute contribution of NO2 columns at different hours of the day averaged over the summer months of June–July–August for 2019 for PGN sites over the eastern US, the western US, Europe, and eastern Asia. The colored lines resemble the absolute concentrations from different sections of the column. The black line (hexagon) represents the total NO2 column. The right y axis (specifically for the total NO2 column representing the marked black line) shows the total columns of NO2.
We applied GCHP to investigate the hourly variation of summertime NO2 columns and surface concentrations by interpreting DISCOVER-AQ aircraft and ground-based measurements over Maryland, Texas, and Colorado and PGN measurements over CONUS, Europe, and eastern Asia. We corrected the hourly variation in Pandora observations for the effects of temperature on the NO2 cross-section and the local solar time along the Pandora line of sight. The site-specific effective temperature correction factors typically increase the hourly variation of the Pandora-observed columns over DISCOVER_AQ sites (3.5 % from the daytime mean) and PGN sites (4 % from the daytime mean). Near sunrise and sunset, differences in local solar time observed by Pandora in the stratosphere versus the measurement site reflect displacement of 5–10 min in local solar time toward noon, which is relevant in the stratosphere near sunrise and sunset when the NO2 NOx ratio is varying rapidly. These corrections to the Pandora measurements improve their consistency with the hourly variation in the NO2 columns inferred from DISCOVER-AQ aircraft measurements. We find that fine-scale simulations at 12 km better represent the NO2 vertical profile measured by aircraft, reducing the NB from 23 % to 16 % compared to simulations at a moderate resolution of 55 km. Simulations at fine resolution (∼12 km) of vertical columns along the line of sight of Pandora instruments have lower NB with Pandora sun photometers at DISCOVER-AQ sites (10 %) and across the eastern US (9 %), the western US (14 %), Europe (15 %), and Asia (21 %) compared to moderate resolution (55 km). Fine resolution represents atmospheric physical and chemical processes with greater accuracy. Excluding the effects of model resolution and the PBLH modification increases the NB to 21 % across DISCOVER-AQ sites (over Maryland, Texas, and Colorado) and increases the NB at PGN sites over the eastern US (17 %), the western US (24 %), Europe (24 %), and East Asia (29 %). Adjusting the PBLH to represent observations improves the daytime variation in NO2 NOx ratios by increasing the NO2 NOx ratio in midday and decreasing the NO2 NOx ratio in the afternoon and evening.
Our study highlights the importance of fine-scale total NO2 columns (troposphere and stratosphere) to interpret the hourly variation of NO2-column-to-surface relationships compared to tropospheric columns exclusively described in prior studies. Given the overall skill of the 12 km GCHP simulations in representing the corrected Pandora, aircraft, and surface NO2 measurements, we apply them to derive the hourly contribution of vertical layers to the total tropospheric columns. We find weaker hourly variation in total NO2 columns than in the lowest 500 m where NO2 concentrations are greater in the morning and evening than midday, while the residual tropospheric column above 500 m dominates the total column with weaker variability. Thus, the weak hourly variation in the column reflects fractional contributions from NO2 below and above 500 m.
Despite the skill of the 12 km simulations in representing the Pandora column measurements, there appears to be greater hourly variation in the simulation, the aircraft measurements, and the surface measurements than in the Pandora observations. Future work should continue in order to understand this relationship. Future work should also leverage the information developed here to test the performance of surface NO2 concentrations inferred from the geostationary constellation against ground-based measurements.
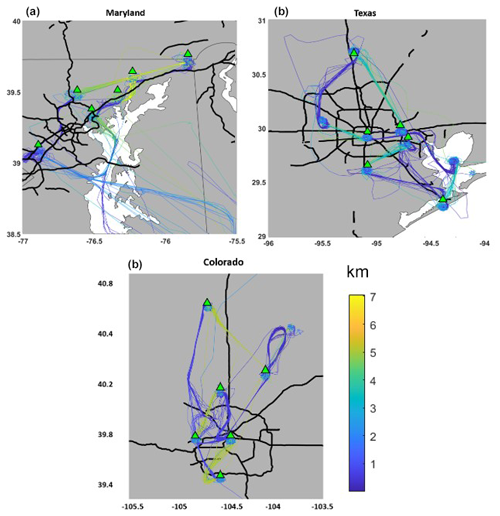
Figure A1Flight tracks showing the path and altitude of the P-3B aircraft during the DISCOVER-AQ campaign over Maryland during July 2011 (a), over Texas during September 2013 (b), and over Colorado during July–August 2014 (b). The green triangles show the locations of the Pandora sun photometers that have been used in this study. The site names and coordinates are listed in Table A1. Gray indicates land, and white indicates water. The bold black lines indicate roads.
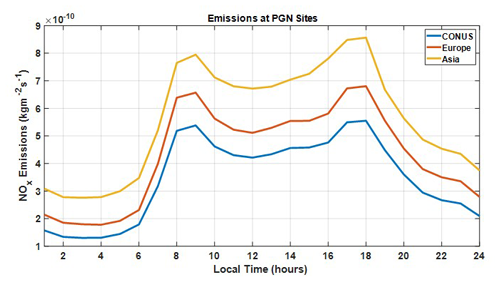
Figure A2Hourly variation of NOx emissions including all sectors across 50 PGN sites over CONUS, Europe, and East Asia.
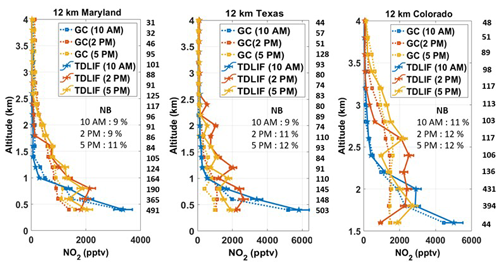
Figure A3NO2 vertical profiles from the TD-LIF instrument aboard P-3B during the DISCOVER-AQ campaign over Maryland, Texas, and Colorado. The solid colored lines with pentagram markers represent observations. The dotted colored lines with square markers represent 12 km GCHP-simulated mixing ratios. The inset values in the boxes show the NB at 10:00, 14:00, and 17:00. The numbers in the middle represent the number of observations associated with the corresponding altitude level. Error bars indicate standard errors in measurements.
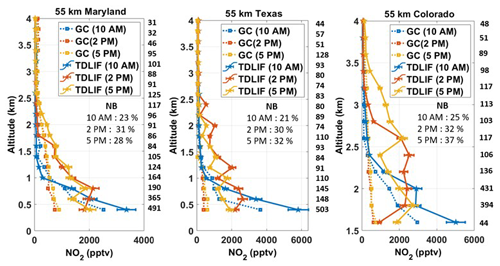
Figure A4NO2 vertical profiles from the TD-LIF instrument aboard P-3B during the DISCOVER-AQ campaign over Maryland, Texas, and Colorado. The solid colored lines with pentagram markers represent observations. The dotted colored lines with square markers represent 12 km GCHP-simulated mixing ratios. The inset values in the boxes show the NB at 10:00, 14:00, and 17:00. The numbers in the middle represent the number of observations associated with the corresponding altitude level. Error bars indicate standard errors in measurements.
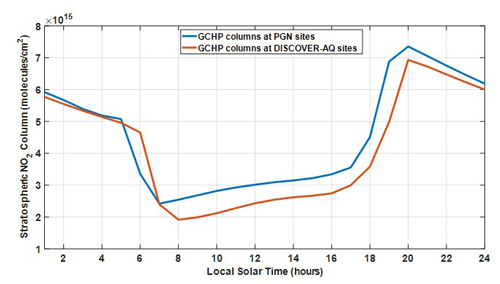
Figure A5GCHP NO2 stratospheric columns for the 3-month average of June–July–August at DISCOVER-AQ sites (red) and PGN sites (blue).
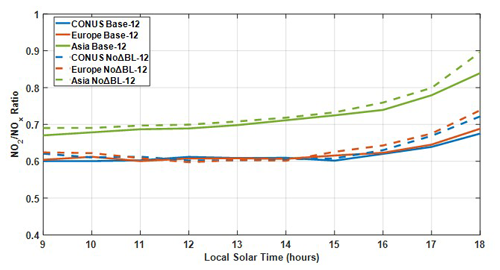
Figure A6Hourly variation of 12 km simulated column NO2 NOx ratios across 50 PGN sites over CONUS (red), Europe (blue), and East Asia (green). The dotted lines show the 12 km simulated NO2 NOx ratios without modified PBLH.
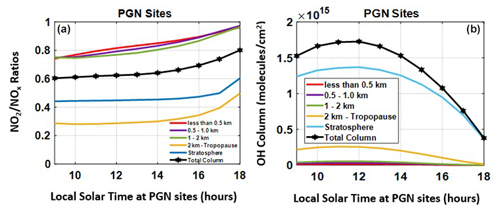
Figure A7Simulated NO2 NOx ratios (a) and simulated partial and total OH columns (b) at different hours of the day averaged over the summer months of June–July–August for 2019 for PGN sites over the eastern US, the western US, Europe, and eastern Asia.
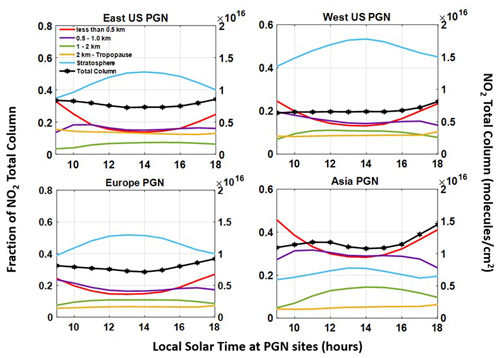
Figure A8The simulated fractional contribution of NO2 columns at different hours of the day averaged over the summer months of June–July–August for 2019 for PGN sites over the eastern US, the western US, Europe, and eastern Asia. The right y axis shows the total columns of NO2.
Table A1Site name, latitude, and longitude for 18 sites in Texas, Maryland, and Colorado that have concurrent Pandora and aircraft measurements.
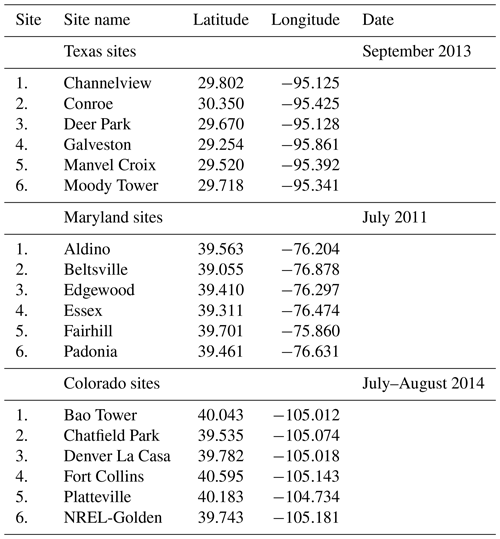
Table A2Site name, latitude, and longitude for 31 sites in CONUS; 11 sites in Europe, North Africa, and the Middle East; and 9 sites in East Asia from the PGN database.
GEOS-Chem 14.1.1, along with the GCHP code, is available for download at https://github.com/geoschem/GCHP.git (International GEOS-Chem Community, 2024). The PGN data are available at https://data.pandonia-global-network.org/ (NASA Goddard Earth Sciences Data and Information Services Center and European Space Agency, 2024). The DISCOVER-AQ aircraft and Pandora data are available here: https://asdc.larc.nasa.gov/project/DISCOVER-AQ (NASA Langley Research Center, 2024). For hourly simulated NO2 datasets please contact the author (deepangsuchatterjee@wustl.edu; deepangsuchatterjee@gmail.com).
The manuscript was written using contributions from all authors. The conceptualization was initialized by DC and RVM. The methodology was developed by DC and RVM. DC conducted the model simulations. DC conducted the data analysis with help from CL, DZ, HZ, LNL, DHK, and RCC. JHC conducted the DISCOVER-AQ campaign. AMC manages the PGN datasets. DC and RVM wrote the original draft. All authors have reviewed, edited, and approved the final version of the manuscript.
The contact author has declared that none of the authors has any competing interests.
Publisher's note: Copernicus Publications remains neutral with regard to jurisdictional claims made in the text, published maps, institutional affiliations, or any other geographical representation in this paper. While Copernicus Publications makes every effort to include appropriate place names, the final responsibility lies with the authors.
This work has been supported by NASA grants 80NSSC21K1343 and 80NSSC21K0508 and NSF grant 2244984. We thank the GEOS-Chem support team for maintaining the model used in this work.
This research has been supported by the National Aeronautics and Space Administration (grant nos. 80NSSC21K1343 and 80NSSC21K0508) and the National Science Foundation (grant no. 2244984)
This paper was edited by Hang Su and reviewed by two anonymous referees.
Al-Saadi, J., Kim, J., Lambert, J.-C., Veihelmann, B., and Chance, K.: Geostationary Satellite Constellation for Observing Global Air Quality: Geophysical Validation Needs, https://tempo.si.edu/presentations/April2017/CEOS-Geo-AQ-Constellation-geophysical-validation-needs (last access: 13 November 2024), 2017.
Anenberg, S. C., Henze, D. K., Tinney, V., Kinney, P. L., Raich, W., Fann, N., Malley, C. S., Roman, H., Lamsal, L., Duncan, B., Martin, R. V., van Donkelaar, A., Brauer, M., Doherty, R., Jonson, J. E., Davila, Y., Sudo, K., and Kuylenstierna, J. C. I.: Estimates of the global burden of ambient PM2.5, ozone, and NO2 on asthma incidence and emergency room visits, Environ. Health Perspect., 126, 1–14, https://doi.org/10.1289/EHP3766, 2018.
Anenberg, S. C., Mohegh, A., Goldberg, D. L., Kerr, G. H., Brauer, M., Burkart, K., Hystad, P., Larkin, A., Wozniak, S., and Lamsal, L.: Long-term trends in urban NO2 concentrations and associated paediatric asthma incidence: estimates from global datasets, Lancet Planet. Heal., 6, e49–e58, https://doi.org/10.1016/S2542-5196(21)00255-2, 2022.
Bates, K. H. and Jacob, D. J.: A new model mechanism for atmospheric oxidation of isoprene: global effects on oxidants, nitrogen oxides, organic products, and secondary organic aerosol, Atmos. Chem. Phys., 19, 9613–9640, https://doi.org/10.5194/acp-19-9613-2019, 2019.
Bates, K. H., Jacob, D. J., Li, K., Ivatt, P. D., Evans, M. J., Yan, Y., and Lin, J.: Development and evaluation of a new compact mechanism for aromatic oxidation in atmospheric models, Atmos. Chem. Phys., 21, 18351–18374, https://doi.org/10.5194/acp-21-18351-2021, 2021.
Bauer, S. E., Koch, D., Unger, N., Metzger, S. M., Shindell, D. T., and Streets, D. G.: Nitrate aerosols today and in 2030: a global simulation including aerosols and tropospheric ozone, Atmos. Chem. Phys., 7, 5043–5059, https://doi.org/10.5194/acp-7-5043-2007, 2007.
Belinha, J.: Manual for FEMAS Manual for FEMAS, 1–83, 2016.
Bindle, L., Martin, R. V., Cooper, M. J., Lundgren, E. W., Eastham, S. D., Auer, B. M., Clune, T. L., Weng, H., Lin, J., Murray, L. T., Meng, J., Keller, C. A., Putman, W. M., Pawson, S., and Jacob, D. J.: Grid-stretching capability for the GEOS-Chem 13.0.0 atmospheric chemistry model, Geosci. Model Dev., 14, 5977–5997, https://doi.org/10.5194/gmd-14-5977-2021, 2021.
Burnett, R. T., Stieb, D., Brook, J. R., Cakmak, S., Dales, R., Raizenne, M., Vincent, R., and Dann, T.: Associations between Short-Term Changes in Nitrogen Dioxide and Mortality in Canadian Cities, Arch. Environ. Heal. An Int. J., 59, 228–236, https://doi.org/10.3200/AEOH.59.5.228-236, 2004.
Cede, A.: Pandonia Global Network User Manual 1.8-4, https://www.pandonia-global-network.org/wp-content/uploads/2021/09/BlickSoftwareSuite_Manual_v1-8-4.pdf (last access: 15 December 2023), 2021.
Choi, S., Lamsal, L. N., Follette-Cook, M., Joiner, J., Krotkov, N. A., Swartz, W. H., Pickering, K. E., Loughner, C. P., Appel, W., Pfister, G., Saide, P. E., Cohen, R. C., Weinheimer, A. J., and Herman, J. R.: Assessment of NO2 observations during DISCOVER-AQ and KORUS-AQ field campaigns, Atmos. Meas. Tech., 13, 2523–2546, https://doi.org/10.5194/amt-13-2523-2020, 2020.
Cooper, M. J., Martin, R. V., Hammer, M. S., Levelt, P. F., Veefkind, P., Lamsal, L. N., Krotkov, N. A., Brook, J. R., and McLinden, C. A.: Global fine-scale changes in ambient NO2 during COVID-19 lockdowns, Nature, 601, 380–387, https://doi.org/10.1038/s41586-021-04229-0, 2022.
Crawford, J. H., Ahn, J., Al-saadi, J., Chang, L., Emmons, L. K., Kim, J., Lee, G., Park, J., Park, R. J., Woo, J. H., Song, C., Hong, J., Hong, Y., Lefer, B. L., Lee, M., Lee, T., Kim, S., Min, K., Yum, S. S., Shin, H. J., Kim, Y., Choi, J., Park, J., Szykman, J. J., Long, R. W., Jordan, C. E., Simpson, I. J., Fried, A., Dibb, J. E., Cho, S., and Kim, Y. P.: The Korea-United States Air Quality (KORUS-AQ) field study, Elementa, 9, 00163 https://doi.org/10.1525/elementa.2020.00163, 2021.
Crippa, M., Guizzardi, D., Muntean, M., Schaaf, E., Dentener, F., van Aardenne, J. A., Monni, S., Doering, U., Olivier, J. G. J., Pagliari, V., and Janssens-Maenhout, G.: Gridded emissions of air pollutants for the period 1970–2012 within EDGAR v4.3.2, Earth Syst. Sci. Data, 10, 1987–2013, https://doi.org/10.5194/essd-10-1987-2018, 2018.
Dang, R., Jacob, D. J., Shah, V., Eastham, S. D., Fritz, T. M., Mickley, L. J., Liu, T., Wang, Y., and Wang, J.: Background nitrogen dioxide (NO2) over the United States and its implications for satellite observations and trends: effects of nitrate photolysis, aircraft, and open fires, Atmos. Chem. Phys., 23, 6271–6284, https://doi.org/10.5194/acp-23-6271-2023, 2023.
David, L. M. and Nair, P. R.: Diurnal and seasonal variability of surface ozone and NOx at a tropical coastal site: Association with mesoscale and synoptic meteorological conditions, J. Geophys. Res., 116, 1–16, https://doi.org/10.1029/2010jd015076, 2011.
Day, D. A., Wooldridge, P. J., Dillon, M. B., Thornton, J. A., and Cohen, R. C.: A thermal dissociation laser-induced fluorescence instrument for in situ detection NO2, peroxy nitrates, alkyl nitrates, and HNO3, J. Geophys. Res. Atmos., 107, 4046, https://doi.org/10.1029/2001jd000779, 2002.
Day, D. A., Farmer, D. K., Goldstein, A. H., Wooldridge, P. J., Minejima, C., and Cohen, R. C.: Observations of NOx, ΣPNs, ΣANs, and HNO3 at a Rural Site in the California Sierra Nevada Mountains: summertime diurnal cycles, Atmos. Chem. Phys., 9, 4879–4896, https://doi.org/10.5194/acp-9-4879-2009, 2009.
Duncan, B. N., Yoshida, Y., De Foy, B., Lamsal, L. N., Streets, D. G., Lu, Z., Pickering, K. E., and Krotkov, N. A.: The observed response of Ozone Monitoring Instrument (OMI) NO2 columns to NOx emission controls on power plants in the United States: 2005–2011, Atmos. Environ., 81, 102–111, https://doi.org/10.1016/j.atmosenv.2013.08.068, 2013.
Eastham, S. D., Weisenstein, D. K., and Barrett, S. R. H.: Development and evaluation of the unified tropospheric-stratospheric chemistry extension (UCX) for the global chemistry-transport model GEOS-Chem, Atmos. Environ., 89, 52–63, https://doi.org/10.1016/j.atmosenv.2014.02.001, 2014.
Eastham, S. D., Long, M. S., Keller, C. A., Lundgren, E., Yantosca, R. M., Zhuang, J., Li, C., Lee, C. J., Yannetti, M., Auer, B. M., Clune, T. L., Kouatchou, J., Putman, W. M., Thompson, M. A., Trayanov, A. L., Molod, A. M., Martin, R. V., and Jacob, D. J.: GEOS-Chem High Performance (GCHP v11-02c): a next-generation implementation of the GEOS-Chem chemical transport model for massively parallel applications, Geosci. Model Dev., 11, 2941–2953, https://doi.org/10.5194/gmd-11-2941-2018, 2018.
Flynn, C. M., Pickering, K. E., Crawford, J. H., Lamsal, L., Krotkov, N., Herman, J., Weinheimer, A., Chen, G., Liu, X., Szykman, J., Tsay, S. C., Loughner, C., Hains, J., Lee, P., Dickerson, R. R., Stehr, J. W., and Brent, L.: Relationship between column-density and surface mixing ratio: Statistical analysis of O3 and NO2 data from the July 2011 Maryland DISCOVER-AQ mission, Atmos. Environ., 92, 429–441, https://doi.org/10.1016/j.atmosenv.2014.04.041, 2014.
Fountoukis, C. and Nenes, A.: ISORROPIAII: A computationally efficient thermodynamic equilibrium model for K+-Ca2+-Mg2+-NH-Na+-SO-NO-Cl−-H2O aerosols, Atmos. Chem. Phys., 7, 4639–4659, https://doi.org/10.5194/ACP-7-4639-2007, 2007.
Geddes, J. A. and Martin, R. V.: Global deposition of total reactive nitrogen oxides from 1996 to 2014 constrained with satellite observations of NO2 columns, Atmos. Chem. Phys., 17, 10071–10091, https://doi.org/10.5194/acp-17-10071-2017, 2017.
Ghude, S. D., Karumuri, R. K., Jena, C., Kulkarni, R., Pfister, G. G., Sajjan, V. S., Pithani, P., Debnath, S., Kumar, R., Upendra, B., Kulkarni, S. H., Lal, D. M., Vander A, R. J., and Mahajan, A. S.: What is driving the diurnal variation in tropospheric NO2 columns over a cluster of high emission thermal power plants in India?, Atmos. Environ. X, 5, 100058, https://doi.org/10.1016/j.aeaoa.2019.100058, 2020.
Herman, J., Cede, A., Spinei, E., Mount, G., Tzortziou, M., and Abuhassan, N.: NO2 column amounts from ground-based Pandora and MFDOAS spectrometers using the direct-sun DOAS technique: Intercomparisons and application to OMI validation, J. Geophys. Res. Atmos., 114, 1–20, https://doi.org/10.1029/2009jd011848, 2009.
Herman, J., Evans, R., Cede, A., Abuhassan, N., Petropavlovskikh, I., and McConville, G.: Comparison of ozone retrievals from the Pandora spectrometer system and Dobson spectrophotometer in Boulder, Colorado, Atmos. Meas. Tech., 8, 3407–3418, https://doi.org/10.5194/amt-8-3407-2015, 2015.
Holmes, C. D., Bertram, T. H., Confer, K. L., Graham, K. A., Ronan, A. C., Wirks, C. K., and Shah, V.: The Role of Clouds in the Tropospheric NOx Cycle: A New Modeling Approach for Cloud Chemistry and Its Global Implications, Geophys. Res. Lett., 46, 4980–4990, https://doi.org/10.1029/2019GL081990, 2019.
Hu, L., Keller, C. A., Long, M. S., Sherwen, T., Auer, B., Da Silva, A., Nielsen, J. E., Pawson, S., Thompson, M. A., Trayanov, A. L., Travis, K. R., Grange, S. K., Evans, M. J., and Jacob, D. J.: Global simulation of tropospheric chemistry at 12.5 km resolution: performance and evaluation of the GEOS-Chem chemical module (v10-1) within the NASA GEOS Earth system model (GEOS-5 ESM), Geosci. Model Dev., 11, 4603–4620, https://doi.org/10.5194/gmd-11-4603-2018, 2018.
International GEOS-Chem Community: geoschem/GCHP, GitHub [code], https://github.com/ geoschem/GCHP.git (last access: 13 November 2024), 2024.
Jacob, D. J., Heikes, B. G., Fan, S. M., Logan, J. A., Mauzerall, D. L., Bradshaw, J. D., Singh, H. B., Gregory, G. L., Talbot, R. W., Blake, D. R., and Sachse, G. W.: Origin of ozone and NOx in the tropical troposphere: A photochemical analysis of aircraft observations over the South Atlantic basin, J. Geophys. Res. Atmos., 101, 24235–24250, https://doi.org/10.1029/96jd00336, 1996.
Lamsal, L. N., Martin, R. V., van Donkelaar, A., Steinbacher, M., Celarier, E. A., Bucsela, E., Dunlea, E. J., and Pinto, J. P.: Ground-level nitrogen dioxide concentrations inferred from the satellite-borne Ozone Monitoring Instrument, J. Geophys. Res. Atmos., 113, 1–15, https://doi.org/10.1029/2007JD009235, 2008.
Lamsal, L. N., Martin, R. V., Padmanabhan, A., Van Donkelaar, A., Zhang, Q., Sioris, C. E., Chance, K., Kurosu, T. P., and Newchurch, M. J.: Application of satellite observations for timely updates to global anthropogenic NOx emission inventories, Geophys. Res. Lett., 38, L05810, https://doi.org/10.1029/2010GL046476, 2011.
Laughner, J. and Cohen, R. C.: Direct observation of changing NO, Science, 366, 723–727, 2019.
Laughner, J. L., Zhu, Q., and Cohen, R. C.: The Berkeley High Resolution Tropospheric NO2 product, Earth Syst. Sci. Data, 10, 2069–2095, https://doi.org/10.5194/essd-10-2069-2018, 2018.
Laughner, J. L., Zhu, Q., and Cohen, R. C.: Evaluation of version 3.0B of the BEHR OMI NO2 product, Atmos. Meas. Tech., 12, 129–146, https://doi.org/10.5194/amt-12-129-2019, 2019.
Li, C., Martin, R. V., Cohen, R. C., Bindle, L., Zhang, D., Chatterjee, D., Weng, H., and Lin, J.: Variable effects of spatial resolution on modeling of nitrogen oxides, Atmos. Chem. Phys., 23, 3031–3049, https://doi.org/10.5194/acp-23-3031-2023, 2023a.
Li, J., Wang, Y., Zhang, R., Smeltzer, C., Weinheimer, A., Herman, J., Boersma, K. F., Celarier, E. A., Long, R. W., Szykman, J. J., Delgado, R., Thompson, A. M., Knepp, T. N., Lamsal, L. N., Janz, S. J., Kowalewski, M. G., Liu, X., and Nowlan, C. R.: Comprehensive evaluations of diurnal NO2 measurements during DISCOVER-AQ 2011: effects of resolution-dependent representation of NOx emissions, Atmos. Chem. Phys., 21, 11133–11160, https://doi.org/10.5194/acp-21-11133-2021, 2021.
Li, Y., Martin, R. V., Li, C., Boys, B. L., van Donkelaar, A., Meng, J., and Pierce, J. R.: Development and evaluation of processes affecting simulation of diel fine particulate matter variation in the GEOS-Chem model, Atmos. Chem. Phys., 23, 12525–12543, https://doi.org/10.5194/acp-23-12525-2023, 2023b.
Lin, J. T. and McElroy, M. B.: Impacts of boundary layer mixing on pollutant vertical profiles in the lower troposphere: Implications to satellite remote sensing, Atmos. Environ., 44, 1726–1739, https://doi.org/10.1016/j.atmosenv.2010.02.009, 2010.
Martin, R. V., Eastham, S. D., Bindle, L., Lundgren, E. W., Clune, T. L., Keller, C. A., Downs, W., Zhang, D., Lucchesi, R. A., Sulprizio, M. P., Yantosca, R. M., Li, Y., Estrada, L., Putman, W. M., Auer, B. M., Trayanov, A. L., Pawson, S., and Jacob, D. J.: Improved advection, resolution, performance, and community access in the new generation (version 13) of the high-performance GEOS-Chem global atmospheric chemistry model (GCHP), Geosci. Model Dev., 15, 8731–8748, https://doi.org/10.5194/gmd-15-8731-2022, 2022.
Millet, D. B., Baasandorj, M., Farmer, D. K., Thornton, J. A., Baumann, K., Brophy, P., Chaliyakunnel, S., de Gouw, J. A., Graus, M., Hu, L., Koss, A., Lee, B. H., Lopez-Hilfiker, F. D., Neuman, J. A., Paulot, F., Peischl, J., Pollack, I. B., Ryerson, T. B., Warneke, C., Williams, B. J., and Xu, J.: A large and ubiquitous source of atmospheric formic acid, Atmos. Chem. Phys., 15, 6283–6304, https://doi.org/10.5194/acp-15-6283-2015, 2015.
Murray, L. T., Jacob, D. J., Logan, J. A., Hudman, R. C., and Koshak, W. J.: Optimized regional and interannual variability of lightning in a global chemical transport model constrained by LIS/OTD satellite data, J. Geophys. Res. Atmos., 117, 1–14, https://doi.org/10.1029/2012JD017934, 2012.
NASA Goddard Earth Sciences Data and Information Services Center and European Space Agency: Pandonia Global Network level 2 NO2 total columns, NASA Goddard Earth Sciences Data and Information Services Center and European Space Agency [data set], https://data.pandonia-global-network.org/ (last access: 1 October 2024), 2024.
NASA Langley Research Center: Deriving Information on Surface Conditions from Column and Vertically Resolved Observations Relevant to Air Quality, NASA Langley Research Center [data set], https://asdc.larc.nasa.gov/project/DISCOVER-AQ (last access: 1 October 2024), 2024.
Nault, B. A., Garland, C., Pusede, S. E., Wooldridge, P. J., Ullmann, K., Hall, S. R., and Cohen, R. C.: Measurements of CH3O2NO2 in the upper troposphere, Atmos. Meas. Tech., 8, 987–997, https://doi.org/10.5194/amt-8-987-2015, 2015.
Oak, Y. J., Park, R. J., Schroeder, J. R., Crawford, J. H., Blake, D. R., Weinheimer, A. J., Woo, J. H., Kim, S. W., Yeo, H., Fried, A., Wisthaler, A., and Brune, W. H.: Evaluation of simulated O3 production efficiency during the KORUS-AQ campaign: Implications for anthropogenic NOx emissions in Korea, Elementa, 7, 56, https://doi.org/10.1525/elementa.394, 2019.
Reed, A. J., Thompson, A. M., Kollonige, D. E., Martins, D. K., Tzortziou, M. A., Herman, J. R., Berkoff, T. A., Abuhassan, N. K., and Cede, A.: Effects of local meteorology and aerosols on ozone and nitrogen dioxide retrievals from OMI and pandora spectrometers in Maryland, USA during DISCOVER-AQ 2011, J. Atmos. Chem., 72, 455–482, https://doi.org/10.1007/s10874-013-9254-9, 2015.
Russell, A. R., Perring, A. E., Valin, L. C., Bucsela, E. J., Browne, E. C., Wooldridge, P. J., and Cohen, R. C.: A high spatial resolution retrieval of NO2 column densities from OMI: method and evaluation, Atmos. Chem. Phys., 11, 8543–8554, https://doi.org/10.5194/acp-11-8543-2011, 2011.
Shah, V., Jacob, D. J., Li, K., Silvern, R. F., Zhai, S., Liu, M., Lin, J., and Zhang, Q.: Effect of changing NOx lifetime on the seasonality and long-term trends of satellite-observed tropospheric NO2 columns over China, Atmos. Chem. Phys., 20, 1483–1495, https://doi.org/10.5194/acp-20-1483-2020, 2020.
Shah, V., Jacob, D. J., Dang, R., Lamsal, L. N., Strode, S. A., Steenrod, S. D., Boersma, K. F., Eastham, S. D., Fritz, T. M., Thompson, C., Peischl, J., Bourgeois, I., Pollack, I. B., Nault, B. A., Cohen, R. C., Campuzano-Jost, P., Jimenez, J. L., Andersen, S. T., Carpenter, L. J., Sherwen, T., and Evans, M. J.: Nitrogen oxides in the free troposphere: implications for tropospheric oxidants and the interpretation of satellite NO2 measurements, Atmos. Chem. Phys., 23, 1227–1257, https://doi.org/10.5194/acp-23-1227-2023, 2023.
Simone, N. W., Stettler, M. E. J., and Barrett, S. R. H.: Rapid estimation of global civil aviation emissions with uncertainty quantification, Transp. Res. Part D Transp. Environ., 25, 33–41, https://doi.org/10.1016/j.trd.2013.07.001, 2013.
van Stratum, B. J. H., Vilà-Guerau de Arellano, J., Ouwersloot, H. G., van den Dries, K., van Laar, T. W., Martinez, M., Lelieveld, J., Diesch, J.-M., Drewnick, F., Fischer, H., Hosaynali Beygi, Z., Harder, H., Regelin, E., Sinha, V., Adame, J. A., Sörgel, M., Sander, R., Bozem, H., Song, W., Williams, J., and Yassaa, N.: Case study of the diurnal variability of chemically active species with respect to boundary layer dynamics during DOMINO, Atmos. Chem. Phys., 12, 5329–5341, https://doi.org/10.5194/acp-12-5329-2012, 2012.
Tao, Y., Huang, W., Huang, X., Zhong, L., Lu, S. E., Li, Y., Dai, L., Zhang, Y., and Zhu, T.: Estimated acute effects of ambient ozone and nitrogen dioxide on mortality in the Pearl River Delta of southern China, Environ. Health Perspect., 120, 393–398, https://doi.org/10.1289/ehp.1103715, 2012.
Thornton, J. A., Wooldridge, P. J., and Cohen, R. C.: Atmospheric NO2: In Situ laser-induced fluorescence detection at parts per trillion mixing ratios, Anal. Chem., 72, 528–539, https://doi.org/10.1021/ac9908905, 2000.
Tong, L., Zhang, H., Yu, J., He, M., Xu, N., Zhang, J., Qian, F., Feng, J., and Xiao, H.: Characteristics of surface ozone and nitrogen oxides at urban, suburban and rural sites in Ningbo, China, Atmos. Res., 187, 57–68, https://doi.org/10.1016/j.atmosres.2016.12.006, 2017.
Valin, L. C., Russell, A. R., Hudman, R. C., and Cohen, R. C.: Effects of model resolution on the interpretation of satellite NO2 observations, Atmos. Chem. Phys., 11, 11647–11655, https://doi.org/10.5194/acp-11-11647-2011, 2011.
Vandaele, A. C., Hermans, C., Fally, S., Carleer, M., Colin, R., Mérienne, M. F., Jenouvrier, A., and Coquart, B.: High-resolution Fourier transform measurement of the NO2 visible and near-infrared absorption cross sections: Temperature and pressure effects, J. Geophys. Res. Atmos., 107, ACH 3-1–ACH 3-12, https://doi.org/10.1029/2001JD000971, 2002.
Veefkind, J. P., Aben, I., McMullan, K., Förster, H., de Vries, J., Otter, G., Claas, J., Eskes, H. J., de Haan, J. F., Kleipool, Q., van Weele, M., Hasekamp, O., Hoogeveen, R., Landgraf, J., Snel, R., Tol, P., Ingmann, P., Voors, R., Kruizinga, B., Vink, R., Visser, H., and Levelt, P. F.: TROPOMI on the ESA Sentinel-5 Precursor: A GMES mission for global observations of the atmospheric composition for climate, air quality and ozone layer applications, Remote Sens. Environ., 120, 70–83, https://doi.org/10.1016/j.rse.2011.09.027, 2012.
Verhoelst, T., Compernolle, S., Pinardi, G., Lambert, J.-C., Eskes, H. J., Eichmann, K.-U., Fjæraa, A. M., Granville, J., Niemeijer, S., Cede, A., Tiefengraber, M., Hendrick, F., Pazmiño, A., Bais, A., Bazureau, A., Boersma, K. F., Bognar, K., Dehn, A., Donner, S., Elokhov, A., Gebetsberger, M., Goutail, F., Grutter de la Mora, M., Gruzdev, A., Gratsea, M., Hansen, G. H., Irie, H., Jepsen, N., Kanaya, Y., Karagkiozidis, D., Kivi, R., Kreher, K., Levelt, P. F., Liu, C., Müller, M., Navarro Comas, M., Piters, A. J. M., Pommereau, J.-P., Portafaix, T., Prados-Roman, C., Puentedura, O., Querel, R., Remmers, J., Richter, A., Rimmer, J., Rivera Cárdenas, C., Saavedra de Miguel, L., Sinyakov, V. P., Stremme, W., Strong, K., Van Roozendael, M., Veefkind, J. P., Wagner, T., Wittrock, F., Yela González, M., and Zehner, C.: Ground-based validation of the Copernicus Sentinel-5P TROPOMI NO2 measurements with the NDACC ZSL-DOAS, MAX-DOAS and Pandonia global networks, Atmos. Meas. Tech., 14, 481–510, https://doi.org/10.5194/amt-14-481-2021, 2021.
Weng, H., Lin, J., Martin, R., Millet, D. B., Jaeglé, L., Ridley, D., Keller, C., Li, C., Du, M., and Meng, J.: Global high-resolution emissions of soil NOx, sea salt aerosols, and biogenic volatile organic compounds, Sci. Data, 7, 1–15, https://doi.org/10.1038/s41597-020-0488-5, 2020.
Yang, L. H., Jacob, D. J., Colombi, N. K., Zhai, S., Bates, K. H., Shah, V., Beaudry, E., Yantosca, R. M., Lin, H., Brewer, J. F., Chong, H., Travis, K. R., Crawford, J. H., Lamsal, L. N., Koo, J.-H., and Kim, J.: Tropospheric NO2 vertical profiles over South Korea and their relation to oxidant chemistry: implications for geostationary satellite retrievals and the observation of NO2 diurnal variation from space, Atmos. Chem. Phys., 23, 2465–2481, https://doi.org/10.5194/acp-23-2465-2023, 2023.
Yang, L. H., Jacob, D. J., Dang, R., Oak, Y. J., Lin, H., Kim, J., Zhai, S., Colombi, N. K., Pendergrass, D. C., Beaudry, E., Shah, V., Feng, X., Yantosca, R. M., Chong, H., Park, J., Lee, H., Lee, W.-J., Kim, S., Kim, E., Travis, K. R., Crawford, J. H., and Liao, H.: Interpreting Geostationary Environment Monitoring Spectrometer (GEMS) geostationary satellite observations of the diurnal variation in nitrogen dioxide (NO2) over East Asia, Atmos. Chem. Phys., 24, 7027–7039, https://doi.org/10.5194/acp-24-7027-2024, 2024.
Zhang, D., Martin, R. V., Bindle, L., Li, C., Eastham, S. D., van Donkelaar, A., and Gallardo, L.: Advances in Simulating the Global Spatial Heterogeneity of Air Quality and Source Sector Contributions: Insights into the Global South, Environ. Sci. Technol., 57, 6955–6964, https://doi.org/10.1021/acs.est.2c07253, 2023.
Zhang, Y., Wang, Y., Chen, G., Smeltzer, C., Crawford, J., Olson, J., Szykman, J., Weinheimer, A. J., Knapp, D. J., Montzka, D. D., Wisthaler, A., Mikoviny, T., Fried, A., and Diskin, G.: Large vertical gradient of reactive nitrogen oxides in the boundary layer: Modeling analysis of DISCOVER-AQ 2011 observations, J. Geophys. Res. Atmos., 121, 1922–1934, https://doi.org/10.1002/2015JD024203, 2016.
Zhao, X., Fioletov, V., Cede, A., Davies, J., and Strong, K.: Accuracy, precision, and temperature dependence of Pandora total ozone measurements estimated from a comparison with the Brewer triad in Toronto, Atmos. Meas. Tech., 9, 5747–5761, https://doi.org/10.5194/amt-9-5747-2016, 2016.


