the Creative Commons Attribution 4.0 License.
the Creative Commons Attribution 4.0 License.
A global re-analysis of regionally resolved emissions and atmospheric mole fractions of SF6 for the period 2005–2021
Andreas Plach
Saurabh Annadate
Sunyoung Park
Gawon Lee
Pallav Purohit
Florian Lindl
Jens Mühle
Rona L. Thompson
Andreas Stohl
We determine the global emission distribution of the potent greenhouse gas sulfur hexafluoride (SF6) for the period 2005–2021 using inverse modelling. The inversion is based on 50 d backward simulations with the Lagrangian particle dispersion model (LPDM) FLEXPART and on a comprehensive observation data set of SF6 mole fractions in which we combine continuous with flask measurements sampled at fixed surface locations and observations from aircraft and ship campaigns. We use a global-distribution-based (GDB) approach to determine baseline mole fractions directly from global SF6 mole fraction fields at the termination points of the backward trajectories. We compute these fields by performing an atmospheric SF6 re-analysis, assimilating global SF6 observations into modelled global three-dimensional mole fraction fields. Our inversion results are in excellent agreement with several regional inversion studies in the USA, Europe, and China. We find that (1) annual US SF6 emissions strongly decreased from 1.25 Gg in 2005 to 0.48 Gg in 2021; however, they were on average twice as high as the reported emissions to the United Nations. (2) SF6 emissions from EU countries show an average decreasing trend of −0.006 Gg yr−1 during the period 2005 to 2021, including a substantial drop in 2018. This drop is likely a direct result of the EU's F-gas regulation 517/2014, which bans the use of SF6 for recycling magnesium die-casting alloys as of 2018 and requires leak detection systems for electrical switch gear. (3) Chinese annual emissions grew from 1.28 Gg in 2005 to 5.16 Gg in 2021, with a trend of 0.21 Gg yr−1, which is even higher than the average global total emission trend of 0.20 Gg yr−1. (4) National reports for the USA, Europe, and China all underestimated their SF6 emissions. (5) Our results indicate increasing emissions in poorly monitored areas (e.g. India, Africa, and South America); however, these results are uncertain due to weak observational constraints, highlighting the need for enhanced monitoring in these areas. (6) Global total SF6 emissions are comparable to estimates in previous studies but are sensitive to a priori estimates due to the low network sensitivity in poorly monitored regions. (7) Monthly inversions indicate that SF6 emissions in the Northern Hemisphere were on average higher in summer than in winter throughout the study period.
- Article
(14780 KB) - Full-text XML
-
Supplement
(37761 KB) - BibTeX
- EndNote
Sulfur hexafluoride (SF6) is the greenhouse gas (GHG) with the highest known global warming potential (GWP), 24 300, over a 100-year time horizon (Smith et al., 2021). Once emitted, SF6 accumulates in the atmosphere, as it is only slowly degraded via photolysis and electron attachment (Ravishankara et al., 1993), resulting in a very long atmospheric lifetime, with estimates ranging from 580 to 3200 years (Kovács et al., 2017; Patra et al., 1997; Ravishankara et al., 1993; Ray et al., 2017). The ocean also acts as a sink for atmospheric SF6; however, its magnitude is debated, with estimates ranging up to 7 % of the global annual emissions (Ni et al., 2023). Regardless of its exact lifetime and possible ocean sink, SF6 emissions will cause a positive radiative forcing for hundreds of years.
Since the early 2000s, global mole fractions of SF6 have undergone a rapid increase, more than doubling from roughly 4.5 ppt (parts per trillion) in 2000 to 10 ppt in 2020 (Lan et al., 2024). In 2020, the radiative forcing of SF6 was 5.9 mW m−2 (Laube et al., 2023). This value could surge 10-fold by the end of the 21st century if the upward trend in global SF6 emissions persists, as pointed out by Hu et al. (2023).
SF6 plays a crucial role in various industrial applications due to its remarkable insulating properties and chemical stability (e.g. Cui et al., 2024). It is primarily used in high-voltage electrical equipment in the power industry, such as gas-insulated switch gears (IEEE, 2012), transmission lines (Koch, 2008), and transformers (Gouda et al., 2012), where it acts as a dielectric and insulator. Here, emissions occur primarily during leakage, maintenance, and decommissioning of equipment (Zhou et al., 2018). Furthermore, SF6 finds applications in semiconductor manufacturing, facilitating precise etching processes (Lee et al., 2004), and serves as blanketing gas or for degassing in the magnesium or aluminium metal industry (Maiss and Brenninkmeijer, 1998). Moreover, it is used in medicine (Lee et al., 2017; Brinton and Wilkinson, 2009); photovoltaic manufacturing (Andersen et al., 2014); military applications (Koch, 2004); particle accelerators (Lichter et al., 2023); soundproof glazing (Schwarz, 2005); sport shoes (Pedersen, 2000); car tyres (Schwaab, 2000); wind turbines (EPA, 2023); and as a tracer gas in the atmosphere (Martin et al., 2011), in groundwater (Okofo et al., 2022), in rivers (Ho et al., 2002), and in oceans (Tanhua et al., 2004).
SF6 is regulated under the Kyoto Protocol. Thus, countries classified as Annex I nations must submit reports detailing their SF6 emissions to the United Nations Framework Convention on Climate Change (UNFCCC). These national inventories are almost exclusively created by bottom-up methods, wherein statistical data of industrial production and consumption are used, along with source-specific emission factors to estimate the emissions. However, SF6 emissions have been shown to be strongly underestimated by the bottom-up reports, underlining the need for independent verification methods (Levin et al., 2010). Therefore, top-down approaches such as inverse modelling on the basis of atmospheric measurements have been used in several studies to estimate SF6 emissions (e.g. Brunner et al., 2017; Fang et al., 2014; Ganesan et al., 2014; Hu et al., 2023; Rigby et al., 2011; Simmonds et al., 2020; Vojta et al., 2022).
Around the year 2000, there was a notable shift in the global SF6 emission pattern from a declining to an increasing trend, which has continued since then (Simmonds et al., 2020). This rising trend was primarily attributed to the increasing emissions from non-Annex-I Asian countries (Rigby et al., 2010). An inversion study by Fang et al. (2014) confirmed a strong increase in East Asian SF6 emissions between 2006 and 2009 and found its contribution to the global total emissions to be 45 %–49 % between 2009 and 2012, with China being the largest contributor. Several other inversion studies identified China as the major contributor to global SF6 emissions (e.g. Ganesan et al., 2014; Rigby et al., 2011; Vojta et al., 2022). From 2007 to 2018, China's annual emissions increased from 1.4 to 3.2 Gg yr−1, accounting for 36 % of the global total emissions in 2018, according to Simmonds et al. (2020). A recent inversion study by An et al. (2024) had access to data from a relatively dense monitoring network inside China and estimated even higher Chinese emissions, with an increase from 2.6 Gg yr−1 in 2011 to 5.1 Gg yr−1 in 2021. Simmonds et al. (2020) also constrained western European SF6 emissions for the years 2013–2018, using three different regional inversion systems. Two of these inversion systems closely matched the emissions reported to the UNFCCC, while the third indicated substantially higher emissions. Brunner et al. (2017) found that western European SF6 emissions were 47 % higher than reported to the UNFCCC for the year 2011. As part of the UK annual report to the UNFCCC, Manning et al. (2022) reported inversion results for SF6 emissions in northwestern Europe and found a decreasing trend, dropping from 0.37 Gg yr−1 in 2004 to 0.18 Gg yr−1 in 2021. An atmospheric inversion study by Hu et al. (2023) found that annual US SF6 emissions decreased between 2007 and 2018 but were, on an annual basis, 40 %–250 % higher than calculated by the U.S. Environmental Protection Agency's national inventory submitted to UNFCCC. They also suggested that US SF6 emissions were substantially higher in the winter than in the summer.
Global total SF6 emissions can be well constrained by global box models, such as the AGAGE 12-box model (e.g. Rigby et al., 2013). While Rigby et al. (2010, 2011) presented global SF6 inversion studies, and recent regional studies have estimated SF6 emissions in specific regions (e.g. Hu et al., 2023; An et al., 2024), an updated, comprehensive, and top-down perspective of the global SF6 emission distribution is needed. Moreover, existing inversion studies often only use data from continuous surface station measurements or from specific observation networks, potentially missing valuable information from other available observations. In the absence of accurate global SF6 mole fraction fields, many studies use statistical observation-based methods to determine initial conditions for their inversions, which are suspected of introducing systematic errors in the inversion results (Vojta et al., 2022). Last, the seasonality of SF6 emissions has not been considered by inversion studies so far, with the exception of the recent study by Hu et al. (2023).
Our study offers a comprehensive global and regionally resolved top-down perspective of SF6 emissions, using inverse modelling to determine the global emission distribution for the period between 2005 and 2021. We use all available SF6 observations that we could track down by merging continuous surface station measurements, flask measurements, and observations from aircraft and ship campaigns. We consider multiple a priori emission fields for our inversion. For the initial conditions (Vojta et al., 2022), we assimilate global SF6 observations into modelled global three-dimensional SF6 concentration fields, resulting in an atmospheric SF6 re-analysis for the period 2005–2021. We investigate regional and national SF6 emission trends with annual and also monthly resolutions and compare our results to various existing regional studies. Finally, we discuss our global total emission trend and compare it to results from the AGAGE 12-box model and to global emissions directly calculated from annual increases in globally averaged atmospheric SF6 mole fractions provided by NOAA (Lan et al., 2024).
2.1 Measurement data
The SF6 re-analysis (Sect. 2.3) and the atmospheric inversion (Sect. 2.5) are based on globally distributed atmospheric observations of SF6 dry-air mole fractions collected during the period 2005 to 2021. Our data set combines both continuous online and instantaneous flask sample measurements from surface stations, with observations from moving platforms. Figure 1 shows all surface station sites included in the inversion and the re-analysis. Figure A1 gives an overview of all the measurements from moving platforms, highlighting the measurement date and altitude with different colours. In addition, Sect. S3, as well as Tables S1 (continuous surface stations), S2, S3 (flask measurement stations), and S4 (moving platforms) in the Supplement, lists all the data sets used and gives further details. The measurements were provided by several independent organisations and by international observation networks such as AGAGE and NOAA. Table S5 lists all the individual providers and their acronyms. Most of the data can be found in databases like WDCGG (di Sarra et al., 2022), EBAS (Tørseth et al., 2012), and CEDA (CEDA, 2023). We standardise all observations to the Scripps Institution of Oceanography's SIO-2005 calibration scale, as described in Sect. S4.
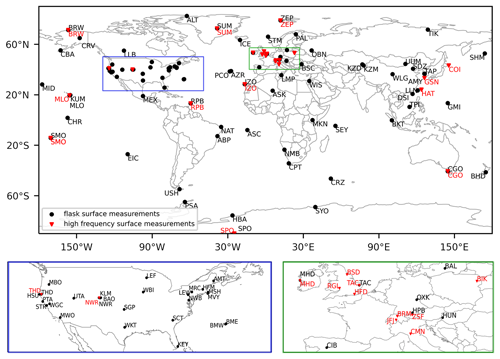
Figure 1Locations of stations with continuous surface measurements (red triangles) and surface flask measurements (black dots) used in the inversion.
For the inversion, continuous surface measurements were averaged over 3 h intervals. Observations from moving platforms were averaged on a spatiotemporal grid with a temporal resolution of 3 h and a spatial resolution of 0.5° in latitude, 0.5° in longitude, and 300 m in height. No observation averaging was performed for the re-analysis. In addition, we adopted a method by Stohl et al. (2009) to identify observations that cannot be brought into agreement with modelled mole fractions by the inversion, which we removed entirely (in contrast to Stohl et al., 2009, who assigned larger uncertainties to these observations). We utilised the kurtosis of the a posteriori error frequency distribution and iteratively excluded observations causing the largest absolute errors until the kurtosis of the remaining error values fell below 5, approximating a Gaussian distribution. Our complete data set consists of around 2.7 million observations, while the averaged data set comprises roughly 800 000 observations. Figure S1 in the Supplement shows the total number of annual observations available for (a) the entire data set and (b) the averaged data set.
2.2 Atmospheric transport
We use the Lagrangian particle dispersion model (LPDM) FLEXPART 10.4 (Pisso et al., 2019a) to simulate the atmospheric transport of SF6 between the emission sources and the measurement locations. The model does not account for removal processes, as SF6 is almost inert in the troposphere to middle stratosphere. We run FLEXPART in backward mode, releasing 50 000 particles continuously over 3 h intervals from the measurement locations and tracking them backward in time for 50 d. The choice of the 50 d simulation period was motivated by the findings of Vojta et al. (2022), who tested the effect of different simulation periods (1–50 d) and found that 50 d simulations resulted in an improved model–measurement agreement and in more robust inversion results in comparison to shorter periods (e.g. 1, 5, 10, or 20 d). For the continuous and moving platform observations, the 3 h intervals are identical to the 3 h averaging windows mentioned above (Sect. 2.1). For the flask measurements, the 3 h intervals are centred around the measurement time. FLEXPART determines emission sensitivities shown as the linear operator He, which allows us to relate mole fraction values at the measurement location and time y with the corresponding emissions e occurring during the 50 d simulation period. The emissions prior to the simulation cannot be directly related but still contribute to the measured mole fraction value and thus must be accounted for in the model as well (Sect. 2.2.2). Therefore, FLEXPART also determines sensitivities to the initial conditions, which are shown as the linear operator Hi, which is multiplied by a three-dimensional SF6 mole fraction field yi (Sect. 2.3) 50 d before the respective measurement to obtain the baseline Hiyi. The relationship between receptor mole fractions y, initial conditions yi and emissions e is given by
where H is the complete atmospheric transport operator combining He and Hi, and x is the state vector combining e and yi. Note at this point that for the optimisation, we aggregate grid cells of the emission grid (see Sect. 2.5) and that the just-defined variables (He, e, Hi, and yi) refer to aggregated groups of grid cells. For a detailed description, please see Thompson and Stohl (2014).
We run FLEXPART with hourly ECMWF ERA5 wind fields (Hersbach et al., 2018) with 0.5°×0.5° resolution and 137 vertical levels. The global output grid has a resolution of 1°×1° and 18 vertical layers with interface heights at 0.1, 0.5, 1, 2, 3, 4, 5, 7, 9, 11, 13, 15, 17, 20, 25, 30, 40, and 50 km above ground level (a.g.l.). The emission sensitivities were calculated only for the lowest layer from 0 to 100 m a.g.l., where most emissions occur.
2.2.1 Emission sensitivities
Figure 2 shows the annual averaged emission sensitivities for all observations made in the example year 2019. Areas of high sensitivity are well covered by the measurement data set, so that emissions can be well constrained by the inversion. Emission sensitivities in the Northern Hemisphere are much higher than in the Southern Hemisphere, and the high-SF6-emitting countries of China and the USA are reasonably well covered. The largest values are observed in northwestern Europe, which is very well monitored by the dense British observation network. However, large land areas in the Southern Hemisphere, including South America, southern Africa, and northern Australia, are poorly sampled due to a lack of continuous measurements. India, which is considered to have high SF6 emissions, is also poorly covered. In these areas, the emissions may not be determined well by the inversion.
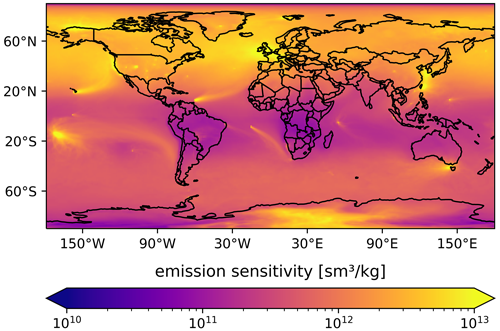
Figure 2Annually averaged emission sensitivities for the example year 2019 obtained from FLEXPART 50 d backward simulations. Notice that values represent averages over all cases for which FLEXPART calculations were made. Thus, sites with high-frequency online observations are weighted more strongly than sites where only flask measurements are made or where observations are made from moving platforms.
2.2.2 Initial conditions
Using a LPDM to calculate emission sensitivities for atmospheric inversions, we release virtual particles directly from the measurement location and benefit from almost infinite resolution at the receptor. The disadvantage of using a LPDM is that we have to deal with the initial conditions, as virtual particles can be followed backward only for a limited period due to the computational costs. Only emissions that occur within this LPDM simulation period can be directly related to observed mole fraction values and are accessible to the inversion. We, therefore, need to define a baseline that accounts for all the emission contributions prior to the simulation period that contribute to the observed mole fraction. In this study, we use the global-distribution-based (GDB) method (Vojta et al., 2022) to determine the baseline. We couple the mole fraction sensitivity at the endpoints of the FLEXPART back trajectories to a global field of SF6 mole fractions (for more details, see Thompson and Stohl, 2014). In essence, this propagates the time-resolved three-dimensional mole fractions in space and time along the 50 d trajectories to the receptor location and time. As pointed out by Vojta et al. (2022), the GDB method has many advantages over observation-based filtering methods. GDB baselines are consistent with the LPDM backward simulation length, account for meteorological variability, and allow the inclusion of low-frequency measurements and measurements from moving platforms in the inversion. However, the method requires unbiased global time-resolved three-dimensional fields of SF6.
2.3 Global SF6 fields
In this study, we generate global fields of SF6 mole fractions for the period between 2005 and 2021, using the LPDM FLEXPART 8-CTM-1.1 (Henne et al., 2018). The model is described by Groot Zwaaftink et al. (2018), who tested its performance for CH4, while Vojta et al. (2022) applied it to SF6. We operate FLEXPART-CTM in a domain-filling mode, where 80 million virtual particles are dispersed globally in proportion to air density. The initialisation is based on a latitudinal SF6 profile determined by interpolation of surface measurements and accounts for the “age of air” (Stiller et al., 2021) at higher altitudes (for more details, see Sect. S5). Released particles are tracked forward in time and carry both an air tracer and the chemical species SF6. When they reside in the atmospheric boundary layer, the model accounts for SF6 emissions by increasing the SF6 masses of the respective particles. The emission uptake of the particles is driven by the “UP” a priori emission data set (see Sect. 2.4).
As model errors and inaccurate emission fields lead to errors and biases in the global SF6 fields, a nudging routine is used to push the simulated mole fractions towards the observations within predefined kernels centred around the measurement locations. We include the entire observation data set in the nudging routine, comprising continuous surface station measurements, flask measurements, and observations from aircraft and ship campaigns. Furthermore, we assign different kernel sizes to individual observations, according to the observed variability in a selected time window for stationary sites and according to the measurement height for moving platforms. Small kernels are attributed to observations with higher variability and observations close to the surface to preserve the spatial variability in SF6 mole fractions over land masses. Detailed kernel configurations can be found in Table S6. We run the model with the 0.5°×0.5° ERA5 data set and produce daily average output with a resolution of 3°×2°. The daily-resolved global SF6 mole fraction fields between 2005 and 2021 can be freely downloaded from https://doi.org/10.25365/phaidra.489 (Vojta, 2024).
2.4 A priori emissions
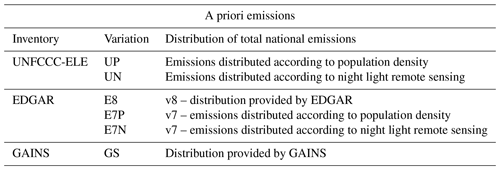
We generate six different annually resolved global SF6 emission fields for the period 2005 to 2021 that are used as a priori emissions in the inversions (Sect. 2.5). One of these fields is also used to drive FLEXPART-CTM (Sect. 2.3). Our six a priori emissions are based on three different inventories (see Table 1) and globally gridded based on different proxy information at a resolution of 1°×1°.
2.4.1 UNFCCC-ELE
For every year, we gather total national SF6 emissions reported to the UNFCCC (UNFCCC, 2021) and add total Chinese emissions estimated by Fang et al. (2014). We then subtract the total emissions of these countries from the total global SF6 emissions calculated by Simmonds et al. (2020). The residual emissions are then distributed among all other countries proportionally to their national electricity generation. Gaps in the SF6 emissions or electricity generation data are filled by linear interpolation. Last, the attributed total national SF6 emissions are further distributed within the respective borders of each country according to two different proxy data sets, (1) the gridded population density (CIESIN, 2018) (UP) and (2) night light remote sensing data (Elvidge et al., 2021) (UN), thus resulting in two different UNFCCC-ELE a priori emission versions.
2.4.2 EDGAR
We use the gridded annual global SF6 emission inventory provided by the Emissions Database for Global Atmospheric Research (EDGAR, 2023; Crippa et al., 2023), part of the recently updated data set EDGARv8.0 (E8). In addition, we also utilise the national annual totals of SF6 emissions provided by EDGARv7.0 (EDGAR, 2022; Crippa et al., 2021), which are not gridded. As for the UNFCCC-ELE emissions, we distribute those national totals according to the gridded population density (CIESIN, 2018) (E7P) or night light remote sensing (Elvidge et al., 2021) (E7N).
2.4.3 GAINS
Furthermore, we use the GAINS gridded global emission inventory. This inventory is based on the study by Purohit and Höglund-Isaksson (2017) and was updated until 2020 as described in Sect. S6. The provided data set was extended to 2021 by linear extrapolation (GS).
2.4.4 Comparison
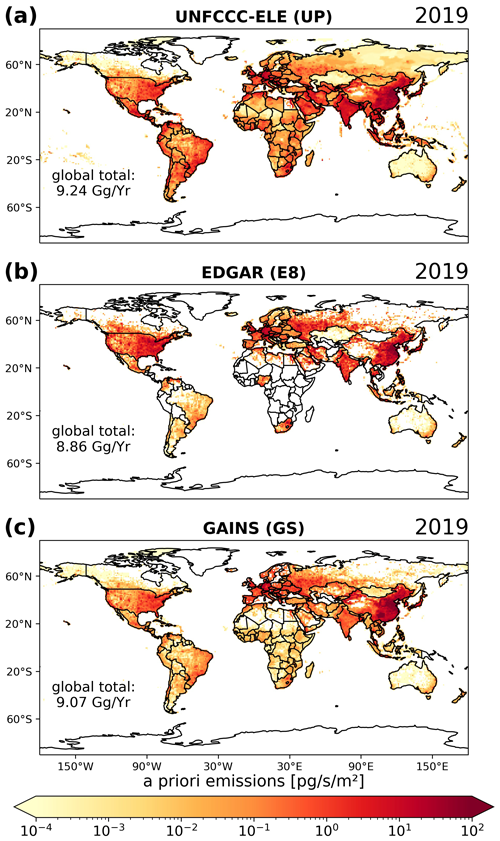
Emission fields from the three inventories (UNFCCC-ELE, EDGAR, and GAINS) show much stronger differences than the two variations in UNFCCC-ELE and EDGAR generated using different proxy information for spatial distribution. In Fig. 3, we therefore only compare three a priori emissions (UP, E8, and GS) for 2019, as an example, while UN, E7N, and E7P are shown in the Supplement (Fig. S25). It is noteworthy that all a priori emission fields show similar global total SF6 emissions in 2019. Figure 3 shows significantly higher emissions in the Northern Hemisphere than in the Southern Hemisphere for all three fields, with China being the biggest emitter. Other high-emitting areas are Europe, the USA, and India. While emissions in Europe are comparable across all data sets, notable differences can be seen in other regions: (1) UNFCCC-ELE (electricity generation distributed data for non-reporting countries) shows relatively high emissions in India and the Southern Hemisphere compared to EDGAR and GAINS, (2) EDGAR shows higher emissions in the USA than the other two a priori fields, and (3) GAINS exhibits higher emissions in China than UNFCCC-ELE and EDGAR.
2.5 Inversion method
We employ the inversion framework FLEXINVERT+ (Thompson and Stohl, 2014) to calculate optimised emissions (a posteriori emissions). FLEXINVERT+ uses Eq. (1), the atmospheric transport operator H, a priori emissions xp, initial conditions yi, and observed mole fractions y to minimise the cost function J (Eq. 2), which represents the negative exponent of the a posteriori emission probability distribution, derived by the Bayes' theorem (e.g. Tarantola, 2005). The a posteriori emissions defined by the maximum of the distribution are found by minimising the mismatch between modelled and observed mole fractions weighted by the observation error covariance matrix R and the difference between emissions x and their a priori values xp weighted by the a priori emission error covariance matrix B.
We use the analytic solution to minimise J, which reads
with the defined gain matrix G,
We optimise emissions on a 6-monthly basis and average the results for each year to obtain annual emissions between 2005 and 2021. In addition to the emissions, we also optimise the baseline (Hiyi) in the inversion, where the whole field is adjusted on a monthly basis. The uncertainty in the baseline is set to 0.15 ppt. The a priori emission uncertainty is estimated to be 70 % of the a priori value in each grid cell with a minimum value of kg m−2 h−1. Correlations between emission uncertainties are accounted for using an exponential decay model with a spatial scale length of 250 km and a temporal scale length of 90 d. FLEXINVERT+ assumes a diagonal observation error covariance matrix R and, therefore, does not account for possible error correlations between different observations. The diagonal elements represent the sum of measurement and model error, where we assume the latter to be dominant. Our error estimates are based on a number of initial inversion runs, where we assessed the model error according to the a posteriori model residuals (difference between observed and a posteriori simulated mole fractions) and such that the reduced chi-square value (the value of the cost function at minimum divided by the number of observations and divided by 2) is close to 1. The a posteriori emission error covariance matrix is calculated as
The relative uncertainty reduction was calculated for every grid cell, based on the a priori and a posteriori emission uncertainties in the respective cell as .
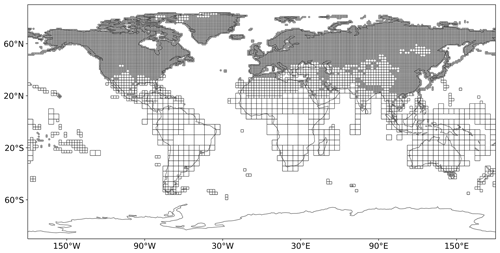
For the inversion, we use emission grids with different cell sizes (Figs. 4, S2, and S3), defined by the aggregation of grid cells with low-emission contributions based on emission sensitivities and a priori emissions. Emissions in the fine grid are thereby weighted according to the ratio of the area of the fine grid to the variable-resolution coarse grid into which it is aggregated. After the inversion, optimised emissions in the variable grid were redistributed onto the fine grid according to the relative distribution of the a priori emissions (see Thompson and Stohl, 2014, for a detailed description). We also exclude grid cells over the oceans from the inversion. The global inversion grid has a resolution of 1 to 16°, and the total number of grid cells varies between years, ranging from a minimum of 5841 (2005) to a maximum of 11 901 (2016), which is related to the number of available observations in each year (see Fig. S1). To study the seasonal emission patterns, we also perform monthly inversions, using a coarser global inversion grid of 953 grid cells for all years and a timescale length of 30 d for the correlation between a priori emission uncertainties.
For SF6, we only expect positive fluxes over land. However, the inversion algorithm may create negative a posteriori fluxes. To address this issue, we apply an inequality constraint on the a posteriori emissions, using the truncated Gaussian approach by Thacker (2007). A posteriori emissions are corrected to positive values by applying inequality constraints as error-free observations as follows:
where P represents a matrix operator selecting the fluxes violating the inequality constraint, and c is a vector of the inequality constraint. x and A represent the a posteriori emissions and error covariance matrix, respectively.
2.6 Sensitivity tests and setup
Before deciding on our final inversion setup, we performed several sensitivity tests. We tested different (1) a priori emission uncertainties between 50 % and 100 % of the respective a priori values and minimal absolute uncertainties between and kg m−2 h−1; (2) spatial and temporal correlation scale lengths of the a priori uncertainties of 100 to 300 km and 30 to 180 d, respectively; and (3) baseline uncertainties from 0.05 to 0.25 ppt. We found that inversion results were relatively stable for these different settings (see Sect. S7) and that the choice of the a priori emission inventory (UNFCCC-ELE, EDGAR, or GAINS) showed the biggest influence on the inversion results. While the inversion results were similar when using different variations in the UNFCCC-ELE (UP and UN) or EDGAR (E8, E7P, and E7N) a priori emissions (see Sect. 2.4), we found substantial differences when switching between UNFCCC-ELE, EDGAR, and GAINS. Therefore, we ran inversions with all six variations listed in Table 1 individually and averaged the results of UP and UN, as well as E8, E7P, and E7N, to compile one inversion result for each a priori emission inventory (UNFCCC-ELE, EDGAR, and GAINS). Since it is challenging to identify the most accurate inventory, we also provide an average of these three inversion results. In order to reflect the sensitivity of the results to the a priori emissions, we define the uncertainty intervals of aggregated emissions as the minimum and maximum 1σ uncertainty limits across the inversion results, using the different a priori emissions.
3.1 Observed and modelled mole fractions
To illustrate the inversion optimisation process, we compare observed and modelled mole fractions (before and after the inversion) at the Gosan observation station (Fig. 5a), at the Ragged Point station (Fig. 5b), and all other continuous surface measurement sites (Figs. A2, A3, and S4–S23), using the E7P emissions field as the a priori in the inversion. The Gosan station is situated on the southwestern tip of the South Korean island of Jeju, monitoring pollution events from East Asia. However, during the Asian summer monsoon, typically from June to September, clean air from the Southern Hemisphere, low in SF6, is episodically passing over the station (e.g. Li et al., 2018), making it challenging to accurately define the baseline during this period. The background station, Ragged Point, located on Barbados' eastern edge, primarily receives clean air masses from the Atlantic. It also exhibits intrusions of southern air masses that are low in SF6 during the summer, resulting in distinct minima in the mole fraction time series and a complex baseline. With the GDB method, we can address these challenges of complex baselines. As illustrated in Fig. 5, the calculated baselines capture the low summer observations, representing a significant advantage over statistical baseline methods. This advantage also becomes apparent for other stations with complex baselines such as Hateruma (Japan; Fig. A2) or Izaña (Tenerife; Fig. A3). Additionally, the optimisation of the baseline shows relatively little impact at all stations, implying that the GDB method and the utilised global SF6 mole fraction fields already lead to a well-fitting baseline that cannot be improved substantially by the inversion. Figure 5a also illustrates the emission improvement achieved by the inversion. The optimised a posteriori emissions result in mole fractions that are much closer to the observations than the a priori modelled values. For Gosan, the correlation (r2) between (detrended, i.e. removing the 2005–2021 trend from the time series) observed and modelled values improves from 65% to 81% and the mean squared error (MSE) halves from 0.4 to 0.2 ppt2. Table S7 and Fig. S24 demonstrate the statistical improvements at all continuous surface stations, emphasising the proper functioning of the inversion.
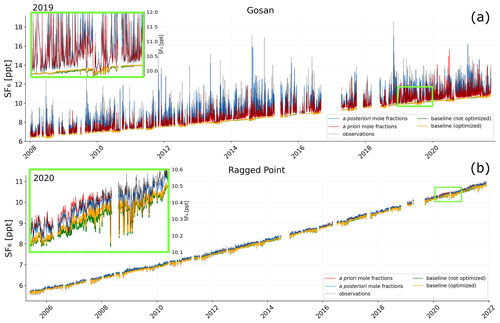
Figure 5Mole fraction time series at the (a) Gosan and (b) Ragged Point measurement stations. Red lines represent the modelled a priori mole fractions calculated with the E7P a priori emissions and blue lines represent the modelled a posteriori mole fractions. The green line illustrates the baseline derived by the GDB method, and the orange line shows the optimised baseline. The grey line represents the observed mole fractions. The insets zoom into the year (a) 2019 (Gosan) and (b) 2020 (Ragged Point), as illustrated by the light green rectangles.
3.2 Inversion increments and relative error reduction
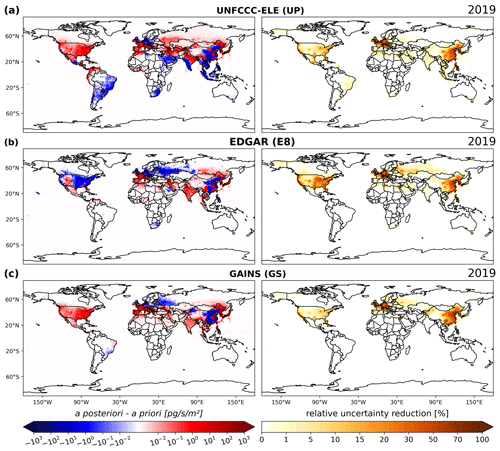
Figure 6 shows the inversion increments (a posteriori minus a priori emissions) and the relative uncertainty reductions achieved by the inversion for the example year 2019 when using the a priori emission fields UP (UNFCCC-ELE), E8 (EDGAR), and GS (GAINS), while the results for UN, E7N, and E7P are shown in the Supplement (Fig. S26). Across all cases, the emission optimisation predominantly occurs in the Northern Hemisphere, characterised by non-zero inversion increments and large error reductions. The limited number of observations in the Southern Hemisphere results in small emission sensitivities there (see Fig. 2), limiting the effects of the inversion primarily to Northern Hemisphere emissions. Only in the case of the UNFCCC-ELE inventory, does Fig. 6a show (negative) inversion increments and a notable error reduction in southern regions like South America and southern Africa. This might indicate that the UNFCCC-ELE a priori emissions are significantly overestimated in these areas. All three data sets show the biggest error reduction and inversion increments in the USA, Europe, and China, where the a priori emissions are high, and many observations are available. While the increments look similar for the three a priori emissions for Europe and China, they are very different for the USA, where the inversion produces predominantly negative increments when using the EDGAR inventory, while only positive increments are obtained using UNFCCC-ELE and GAINS. These differences suggest that the true 2019 US emissions lie between the high EDGAR and the lower UNFCCC-ELE/GAINS estimates.
3.3 National and regional emissions
Figure 7 illustrates the global SF6 a posteriori emissions for the example year of 2019, averaged over all emission fields as described in Sect. 2.6. The individual a posteriori emission fields using the different a priori emissions are shown in the Supplement (Fig. S27). The highest SF6 emissions can be seen in the USA, Europe, China, and India, while emissions are smaller in South America, Africa, and Australia. SF6 emissions of these countries and regions are discussed in more detail in the following subsections, showing their national/regional emission time series between 2005 and 2021. National and regional emissions are calculated by aggregating the emissions within the respective grid cells of the corresponding country or region, employing a national identifier grid (CIESIN, 2018).
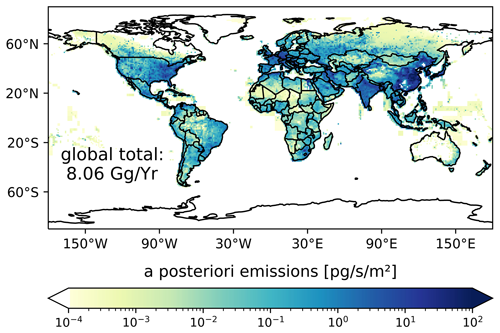
Figure 7Global a posteriori emissions for the example year of 2019 averaged over the inversion results, using the six different a priori emissions.
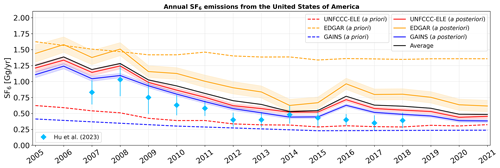
Figure 8Annual a priori (dashed lines) and a posteriori (solid lines) SF6 emissions in the US shown for the period between 2005 and 2021 when using different a priori emission inventories (UNFCCC-ELE in red, EDGAR in orange, and GAINS in blue). A posteriori emissions are illustrated, together with their respective uncertainties (coloured shadings are defined as the minimum and maximum 1σ uncertainty limits across the inversion results for different a priori variations). The a posteriori emissions averaged over the inversion results, using the different inventories, are shown with a solid black line. The results of Hu et al. (2023) are shown with blue diamonds, together with their respective 2σ uncertainties.
3.3.1 Emissions from the United States of America
Figure 8 shows the annual a priori and a posteriori US SF6 emissions for the different priors for the period between 2005 and 2021. The inversion results show a clearly declining annual emission trend of −0.054 Gg yr−1, dropping from 1.25 [1.06–1.58] Gg in 2005 to 0.48 [0.36–0.71] Gg in 2021 (Fig. 8; a posteriori average). The uncertainty intervals represent the minimum and maximum 1-σ uncertainty limits across the inversion results, using the different a priori inventories. The a posteriori emissions are larger (by a factor of 2 on average) than the emissions reported to UNFCCC (Fig. 8; a priori UNFCCC-ELE) throughout the entire study period. While the different a priori emissions show big differences, a posteriori emissions agree much better. At the beginning of the study period, all three a posteriori emissions are substantially higher than the UNFCCC-reported a priori emissions and closer to the EDGAR a priori estimates. Between 2005 and 2012, the a posteriori emissions show a substantial decrease, after which they approach the UNFCCC-reported values but still remain higher. It also seems that the GAINS a priori emissions are far too low at the beginning of our study period, while the EDGAR a priori emissions are far too high at the end of our study period. Our results are a bit higher compared to the regional inversion study by Hu et al. (2023); however, they show a remarkably similar declining trend in US SF6 emissions between 2007 and 2018.
3.3.2 Total emissions from EU countries
Figure 9 illustrates the total annual a priori and a posteriori SF6 emissions from all EU countries1. Here, the three a priori data sets show almost no trend and are very similar to each other throughout the study period, indicating a consistent framework for bottom-up reporting of EU emissions. The annual a posteriori emissions show a decreasing trend of −0.006 Gg yr−1, dropping from 0.41 [0.35–0.46] Gg in 2005 to 0.25 [0.22–0.29] Gg in 2021 (Fig. 9; a posteriori average). While a posteriori emissions are relatively stable and exceed the a priori emissions until 2017, there is a significant drop in 2018, after which they are closer to the a priori emissions. It seems plausible that this drop in SF6 emissions in 2018 was a result of the EU's F-gas regulation 517/2014 (European Parliament and Council of the European Union, 2014), which requires new electrical switch gear put into service from 2017 onwards to be equipped with a leak detection system and bans the use of SF6 for recycling magnesium die-casting alloys as of 2018. Our results suggest that in their reports to the UNFCCC, EU countries underestimated their SF6 emissions prior to 2018 but at the same time underestimated the positive effect of the F-gas regulation 517/2014 in cutting SF6 emissions.
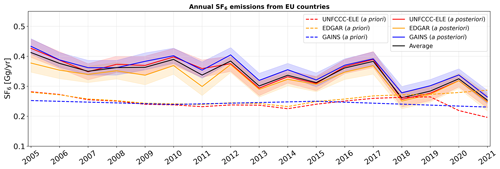
Figure 9Annual a priori (dashed lines) and a posteriori (solid lines) SF6 emissions aggregated for all EU countries, shown for the period between 2005 and 2021 when using different a priori emission inventories (UNFCCC-ELE in red, EDGAR in orange, and GAINS in blue). A posteriori emissions are illustrated, together with their respective uncertainties (coloured shadings are defined as the minimum and maximum 1σ uncertainty limits across the inversion results for different a priori variations). The a posteriori emissions averaged over the inversion results, using the different inventories, are shown with a solid black line.
As one of only three countries, the United Kingdom also includes top-down inversion results in its annual UNFCCC reports (Manning et al., 2022). As part of this top-down approach, Manning et al. (2022) also reported emissions of northwestern Europe2 to which we compare our inversion results (Fig. A4). The a posteriori emissions from northwestern Europe are generally similar to EU emissions shown in Fig. 9; however, they show an even clearer negative trend of −0.009 Gg yr−1. Our results agree well, on average within 16 %, and they agree better after 2012 with those reported by Manning et al. (2022). Furthermore, Simmonds et al. (2020) presented inversion-derived emissions for western Europe3 for four different inversion setups. Our a posteriori emissions agree very well with three of these four inversions (Fig. A5). The fourth inversion shows consistently lower emissions; however, this inversion setup used fewer observation stations than the other three and is likely less accurate. It is likewise noteworthy that the first three inversions of Simmonds et al. (2020) show an emission drop in 2018, which we also find.
3.3.3 Emissions from China
Chinese a priori and a posteriori SF6 emissions are illustrated in Fig. 10. The inversion-derived a posteriori emissions reveal a distinct positive trend of 0.21 Gg yr−1 (Fig. 10; a posteriori average without GAINS), with a particularly rapid increase between 2006 and 2014 (0.35 Gg yr−1), followed by a stabilisation thereafter. The UNFCCC-ELE a priori Chinese emissions slightly exceed the EDGAR a priori emissions between 2007 and 2011, after which they align well. UNFCCC-ELE and EDGAR a posteriori emissions show almost identical Chinese emissions that are also close to their a priori values. The GAINS a priori Chinese emissions differ significantly from the other two inventories. After 2005, the GAINS a priori emissions show a very strong upward trend, increasingly diverging from the other two priors until the end of the study period, at which point the GAINS Chinese emissions are almost twice as high as the other priors. In the GAINS inventory, China's 2021 emissions alone would account for almost all of the known total global SF6 emissions (see Sect. 3.3.5), which seems unrealistic. The GAINS a posteriori emissions for China show lower values compared to the a priori emissions; however, they still exceed the UNFCCC-ELE- and EDGAR-derived results. It seems likely that the inversion improves the overestimated Chinese GAINS emissions, yet it may not entirely correct them, given the considerably overestimated a priori estimates. Due to these concerns about the Chinese GAINS a priori emissions, we provide both a Chinese a posteriori emission average including (see Table A3) and excluding GAINS inversions (solid black line in Fig. 10).
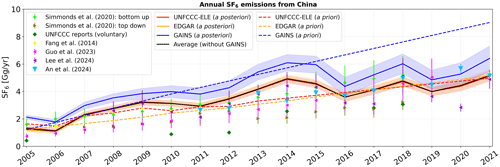
Figure 10Annual a priori (dashed lines) and a posteriori (solid lines) SF6 emissions from China, shown for the period between 2005 and 2021 when using different a priori emission inventories (UNFCCC-ELE in red, EDGAR in orange, and GAINS in blue). A posteriori emissions are illustrated, together with their respective uncertainties (coloured shadings are defined as the minimum and maximum 1σ uncertainty limits across the inversion results for different a priori variations). The a posteriori emissions averaged over the inversion results, using EDGAR and UNFCCC-ELE, are shown with a solid black line.
China is not obliged to report its national emissions, but it voluntarily reported bottom-up SF6 estimates in their national communications and biennial updates to the UNFCCC for 2005 (China, 2012), 2010 (China, 2018a), 2012 (China, 2016), 2014 (China, 2018b), 2017 (China, 2023a), and 2018 (China, 2023b). These reported values are much smaller than our a posteriori emissions, especially in 2010, 2012, and 2014. The values from the more recent reports in 2017 and 2018 are, however, closer to our inversion results, indicating an improvement in Chinese reports. We also compare our results to various other studies of Chinese emissions, using bottom-up or top-down approaches. Our results agree within 15 % with the inversion study by Fang et al. (2014), who used a similar inversion setup, based on the continuous measurements in Gosan (South Korea), Hateruma (Japan), and Cape Ochiishi (Japan), and FLEXPART atmospheric transport modelling. Furthermore, our results align closely with a recent inversion study by An et al. (2024) (agreeing within 12 %), who had access to data from a relatively dense monitoring network over China. Our results also agree well (within 15 %) with the findings of Gawon Lee (personal communication, 2024), whose regional inversion study (in preparation) utilises observations from Gosan to estimate emissions in Southeast Asia. Note that the patterns of our time series are very similar to the ones of Gawon Lee (personal communication, 2024), suggesting that our Chinese a posteriori emissions are highly influenced by the Gosan observation station. Our derived emissions also agree well (within 8 %) with bottom-up estimates by Guo et al. (2023) after 2015 and (within 18 %) with the bottom-up estimates by Simmonds et al. (2020). Our results are, however, higher than the bottom-up estimates by Guo et al. (2023) between 2008 and 2015 and the inversion-derived emissions by Simmonds et al. (2020). However, Simmonds et al. (2020) based their inversion results on only one station (Gosan), coarser meteorology, and an inversion domain representing only 34 % of China's population, which could have resulted in a substantial underestimation of the emissions.
3.3.4 Other regions
In this section, we present the a priori and a posteriori SF6 emissions from Africa, South America, Australia, and India. It is important to note that there are no emission reports to the UNFCCC for Africa, South America, and India. In these regions, the UNFCCC-ELE a priori emissions are derived by distributing the emissions residuals from the global total emissions (Simmonds et al., 2020) when subtracting the cumulative reported emissions from Annex I countries, according to the national electricity generation (Sect. 2.4).
Africa
Figure 11 shows African a priori and a posteriori SF6 emissions. One can see that the GAINS inventory is very low and the UNFCCC-ELE inventory is very high in comparison to the EDGAR inventory. Before 2018, the UNFCCC-ELE a posteriori emissions are lower than the a priori values and align with them afterwards. EDGAR a posteriori emissions are overall higher than the respective a priori emissions. It seems likely that the inversion improves the UNFCCC-ELE overestimation and the EDGAR underestimation but cannot, however, entirely correct them, as large parts of Africa are poorly covered by the observation network (see Fig. 2). The GAINS a posteriori emissions are consistently higher than the GAINS a priori emissions, but the increases are very small. It seems that the GAINS a priori emissions are too small, and the inversion tries to increase them but is bound by the low uncertainties assumed, resulting only in minor corrections. Thus, even the GAINS a posteriori likely underestimate the true emissions. Note that both UNFCCC-ELE and EDGAR a posteriori emissions show a larger positive trend than the a priori emissions. This is also true for the GAINS prior; however, the differences are very small. The averaged a posteriori emissions are close to the EDGAR inventory and show a slowly increasing trend of 0.006 Gg yr−1, growing from 0.13 [0.02–0.31] Gg in 2005 to 0.25 [0.02–0.47] Gg in 2021.
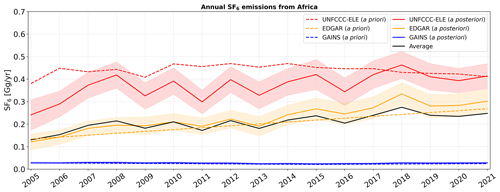
Figure 11Annual a priori (dashed lines) and a posteriori (solid lines) SF6 emissions from Africa, shown for the period between 2005 and 2021 when using different a priori emission inventories (UNFCCC-ELE in red, EDGAR in orange, and GAINS in blue). A posteriori emissions are illustrated, together with their respective uncertainties (coloured shadings are defined as the minimum and maximum 1σ uncertainty limits across the inversion results for different a priori variations). The a posteriori emissions averaged over the inversion results, using the different inventories, are shown with a solid black line.
South America
For South America (see Fig. A6), the UNFCCC-ELE inventory is more than 10 times higher than the EDGAR and GAINS inventory, and GAINS is on average 38 % higher than EDGAR. Due to the narrow uncertainty bands and the poor observational coverage of South America, the inversion results stay close to the a priori emissions for EDGAR and GAINS. For UNFCCC-ELE a posteriori emissions are smaller than the a priori values, especially at the beginning of the study period. We therefore suspect a substantial overestimation by the UNFCCC-ELE a priori inventory, given that the UNFCCC-ELE a posteriori emissions are partly lowered considerably, despite the poor coverage. Note also that UNFCCC-ELE inversion results show a positive trend of 0.007 Gg yr−1, in contrast to the a priori inventory.
Australia
Figure A7 shows Australian a priori and a posteriori SF6 emissions. All a priori emission inventories show similar values throughout the whole study period which are well below 0.01 Gg yr−1. The inversion results stay close to the a priori values. Note that our results are lower than the top-down estimates from Rigby et al. (2010), who estimated Oceanian (Australia plus Aotearoa / New Zealand) emissions of roughly 0.02 Gg yr−1 between 2004 and 2008.
India
India can be identified as the most challenging region for SF6 inverse modelling, where a priori emission inventories show substantial differences but where emissions could be of global significance (UNFCCC-ELE emissions are about 8 % of global emissions in 2021) (Fig. A8). For the UNFCCC-ELE inventory, Indian inversion increments are much higher compared to EDGAR or GAINS (see Fig. 6), resulting in large discrepancies across the a posteriori emissions of the different inventories (Fig. A8). This can be related to the poor observational coverage (see Fig. 2) in combination with the relatively high UNFCCC-ELE a priori uncertainties, which might allow the algorithm to excessively relate the distant high East Asian measurements to Indian emissions. The GAINS inventory shows by far the lowest Indian a priori emission, while inversion results stay very close to the prior values, due to the small a priori uncertainty bands. However, all inversions show a much stronger trend in a posteriori SF6 emissions than in the a priori emissions. A strong upward trend in SF6 emissions may indeed be expected given that the installed electric power generation capacity in India has almost quadrupled between 2002 and 2022 (Government of India, 2023).
3.3.5 The global perspective
Our study aimed to incorporate all globally accessible SF6 observations in the inversion in combination with long backward trajectories of 50 d to make the best use of the observation network (Vojta et al., 2022). These are optimal conditions for constraining both regional and global SF6 emissions. To judge the quality of our a posteriori global emission, we compare our results with the global emissions calculated by Simmonds et al. (2020) for the years 2005 to 2018 and updated until 2021 (An et al., 2024; Laube et al., 2023) using the AGAGE 12-box model (e.g. Rigby et al., 2013). Such box models are considered to be capable of constraining the global total SF6 emissions to within a few percent because the average atmospheric growth rate can be measured accurately, and the very long atmospheric lifetime of SF6 leads to small uncertainties in global total emissions. In addition, we compare our results with global emissions directly calculated from annual increases in globally averaged atmospheric SF6 mole fractions provided by NOAA (Lan et al., 2024), which we multiply by the factor , where and Mair represent the molecular weights of SF6 and air, and matm is the mass of the atmosphere. We refer to these emissions as “NOAA growth rate emissions”.
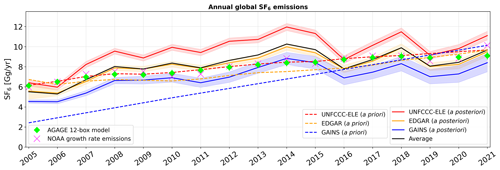
Figure 12Annual total global a priori (dashed lines) and a posteriori (solid lines) SF6 emissions, shown for the period between 2005 and 2021, when using different a priori emission inventories (UNFCCC-ELE in red, EDGAR in orange, and GAINS in blue). A posteriori emissions are illustrated, together with their respective uncertainties (coloured shadings are defined as the minimum and maximum 1σ uncertainty limits across the inversion results for different a priori variations). The a posteriori emissions averaged over the inversion results, using the different inventories, are shown with a solid black line. Reference values of the AGAGE 12-box model and NOAA growth rate emissions are shown with green diamonds and purple crosses, respectively.
Figure 12 illustrates the a priori and a posteriori total global SF6 emissions, compared to the reference values of the AGAGE 12-box model and the NOAA growth rate emissions. In general, the NOAA growth rate emissions agree well with the box model; however, they show more temporal variability. The UNFCCC-ELE a priori global emissions coincide per definition with the AGAGE 12-box model (Sect. 2.4), while the UNFCCC-ELE a posteriori global emissions are on average 18 % higher. The uncertainties stated for the AGAGE 12-box model are only about 3 %, with an additional 1 % that may be attributed to SF6 lifetime uncertainties (Simmonds et al., 2020). Overall, our UNFCCC-ELE a posteriori global emissions seem to be systematically too high. One possibility for explaining this discrepancy is a potential ocean sink of SF6 that is not accounted for in the AGAGE 12-box model, leading to a potential underestimation of global emissions in the box model. Ni et al. (2023) recently suggested that such an ocean sink may account for about 7 % of the global SF6 emissions. They estimated this global oceanic sink by scaling up calculations of sea–air fluxes based on simultaneous measurements of SF6 concentrations in the atmosphere and surface seawater of the western Pacific and eastern Indian Ocean. However, since the ocean fluxes are highly inhomogeneous (strong oceanic sources might exist in other regions), we suspect the upscaled estimate to be very uncertain. Nevertheless, we tested the hypothesis by allowing for an oceanic sink in our inversion. However, the inversion-derived oceanic a posteriori emissions showed either a lot of noise or no fluxes at all (in the case of optimising ocean fluxes in one aggregated oceanic grid cell). Therefore, we were unable to confirm the presence of oceanic SF6 sinks with our inversion. Yet, another possible explanation for the increase in the global UNFCCC-ELE emissions by the inversion is the positivity constraint employed on the emissions over land, which might lead to a positive bias of the a posteriori global emissions. However, tests showed that the positivity constraint on the a posteriori emissions had very little effect (<1 %) on the total global emissions. There is a better explanation for our a posteriori UNFCCC-ELE emissions that are too high. As discussed in Sect. 3.2, the measurement data put relatively strong constraints on the high-emitting regions of China, Europe, and the USA that are responsible for the largest share of the global SF6 emissions. National inversion results showed that reported UNFCCC emissions in these regions are predominantly underestimated. Consequently, to match the global total emission, our UNFCCC-ELE inventory attributed excessive emissions to countries not reporting their emissions to the UNFCCC (e.g. in South America, Africa, or India). Unfortunately, the emissions in these regions are very poorly constrained by the existing observation network (see Fig. 2). As shown in Sect. 3.3.4, the inversion can reduce large biases in these regions, but we cannot expect it to remove them completely, and this leads to a positive bias in a posteriori global emissions.
The global GAINS a priori emissions are lower than all other inventories at the beginning of the study period, and its positive trend is larger than, and inconsistent with, the global atmospheric SF6 growth derived by the box model and the NOAA measurements. Due to this rapid increase, the GAINS a priori emissions converge with the other emission inventories by the end of the study period. The global GAINS a posteriori emissions are much closer to the AGAGE box model results and NOAA growth rate emissions than the a priori emissions and align well with their trends. However, a posteriori emissions are 15 % lower on average, indicating that aggregated emissions are underestimated in poorly monitored areas. This claim can be supported by comparing the global GAINS and Chinese GAINS a priori emissions (Fig. 10). At the beginning of the study period, GAINS seems to produce realistic Chinese emissions, while at the same time global GAINS emissions are significantly underestimated. After rapid growth, global GAINS emissions are close to the reference box model value, while Chinese GAINS emissions are significantly overestimated at the end of the study period. In both cases, this suggests an underestimation of the emission residuals between the global and the Chinese emissions. Consequently, GAINS also provides the lowest a posteriori emission estimates in almost all shown regions, except China, resulting in an underestimation of the global emissions.
In the case of EDGAR, both the a priori and a posteriori emissions agree with the reference values of the AGAGE 12-box model and NOAA growth rate emissions within 8 %–9 %. While the a priori emissions are on average biased low by 6 %, the a posteriori emissions show on average almost no bias (<1 %) compared to the reference values. We, therefore, conclude that EDGAR provides a good estimate for the accumulated SF6 emissions, also from poorly monitored areas, which is well suited for global inversions.

Figure 13Inversion results from monthly SF6 inversions for the Northern Hemisphere. (a) Monthly a posteriori emissions for the period 2005–2021, (b) detrended a posteriori emissions averaged for each month across all years, and (c) semi-annual a posteriori emissions. Distinct months are highlighted with different colours. In panel (c), the specified summer (April–September) and winter periods (October–March) are shown in red and white, respectively.
The average of the total global emissions of the different discussed cases provides a very good estimate for the global SF6 emissions, showing average biases of +2.2 % and 1.4 % compared to the AGAGE box model and the NOAA growth rate emissions, with an agreement within 10 %. Its trend shows an increase until 2014, followed by a stabilisation thereafter (similar to the Chinese emission trend). This is a pattern that can be also observed for the annual increases in the globally averaged NOAA atmospheric SF6 mole fractions and derived emissions. Note also that the average global trend (0.20 Gg yr−1) is similar to the Chinese emission trend (0.21 Gg yr−1).
Despite some potential problems with our inversion setup that can lead to biased a posteriori global emissions (as could be clearly seen and explained with the UNFCCC-ELE and GAINS a priori emissions in poorly observed regions), overall our a posteriori global emissions seem to be quite accurate, with average biases to the box model and NOAA growth rate emissions of +18 %, −15 %, and <1 % for UNFCCC-ELE, GAINS, and EDGAR, respectively. Even strongly biased global a priori emissions, as for GAINS until 2015, could be brought relatively close to these previous estimates. This is beneficial, since our regional estimates combined are then consistent with the global emissions. However, the uncertainties in the inversion-derived emissions remain large in India and the Southern Hemisphere. While the aggregated emission in these regions is also quite well known as the residual between global emissions and emissions in well-monitored areas, the distribution of the emissions between and within these regions is less well known.
3.3.6 Seasonality of SF6 emissions
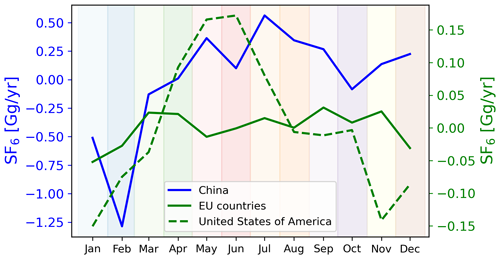
Our a priori emission data sets contain no seasonal information and are assumed to be constant throughout the year. Figure 13 shows the monthly resolved a posteriori total SF6 emissions in the Northern Hemisphere, using the E7P a priori emission inventory. Figure 13a shows the whole time series, and Fig. 13b presents monthly averages over this time period, after detrending the time series. While different years have unique seasonal patterns, a notable emission minimum can be observed at the beginning of every year (January/February), and emissions tend to be highest in the summer. This is most clearly seen in the averaged seasonal cycle (Fig. 13b), which shows a minimum in February and a broad maximum from May to September. To better demonstrate the consistency of this seasonal cycle throughout the entire period of our study, Fig. 13c shows semi-annual SF6 emissions in the Northern Hemisphere, derived by averaging seasonal emissions for winter (October–March) and summer (April–September). In line with Fig. 13a and b, Fig. 13c shows higher emissions in summer than in winter, and this pattern is found in almost every individual year. However, the seasonal SF6 emission patterns vary by region (shown for China, the USA, and the EU in Fig. A9). For the EU emissions, no clear seasonal cycle can be seen. Note at this point that SF6 emissions from northwestern Europe were found to maximise in the winter (Redington et al., 2019); however, this was observed without showing a very systematic seasonal cycle. For Chinese SF6 emissions, the seasonality is similar to the one in the Northern Hemisphere (Fig. 13b). For the USA, we find an even stronger seasonal variation with a May/June peak of SF6 emissions. This result is in contradiction to Hu et al. (2023), who suggested US SF6 emissions to peak in winter. Hu et al. (2023) argued that many US companies maintain electrical equipment in the winter rather than in the summer and that cold temperatures can cause sealing materials in electrical equipment to become brittle, resulting in more leaks. We suspect that the contradictions between our two studies are mainly due to the different baseline treatments. As discussed in Sect. 3.1, our baseline lowers in the summer for several stations, a feature which we argued is realistic and reflects the transport of different, cleaner air masses over the respective stations. Neglecting such a lowered baseline would lead to underestimated summer emissions. In addition, high-frequency measurements from Trinidad Head (THD) and Niwot Ridge (NWR) have not been used by Hu et al. (2023). A possible explanation for the summer emission maximum might be the seasonal variability in electricity generation, which peaks in summer for most of the Northern Hemisphere (see, e.g., https://www.eia.gov/electricity/, last access: 1 July 2024). In addition, the increasing SF6 pressure at high summer temperatures and heat stress of the electrical equipment could lead to more leakage. However, further research on the seasonal cycle of SF6 emissions is needed to provide a more conclusive answer as to the cause(s).
Our inversion study provides observation-based, regionally resolved global SF6 emission estimates for the period 2005–2021, using initial conditions based on an atmospheric SF6 re-analysis. We further consider different a priori emission inventories and use a newly compiled, extensive observation data set, along with 50 d LPDM backward simulations to provide accurate estimates of the global spatially distributed SF6 emissions. Our main findings are the following:
-
The GDB approach is a robust method for estimating boundary conditions, especially at challenging measurement stations. We demonstrate that it successfully accounts for meteorological variability (e.g. the Asian summer monsoon) in the baseline, reducing the need for baseline optimisation by the inversion.
-
Our inversion produces regional a posteriori emissions that, taken together, are consistent within 10 % with the well-known global emissions based on observed atmospheric growth rates.
-
The global inversion shows the largest emission improvements in the high-emitting regions of China, the USA, and Europe, where the observation networks used have good coverage. Our annual inversion results are in excellent agreement with several existing regional inversion studies focusing on these three regions.
-
Annual US SF6 emissions strongly decreased from 1.25 [1.06–1.58] Gg in 2005 to 0.48 [0.36–0.71] Gg in 2021, showing a trend of −0.054 Gg yr−1. However, these inversion-derived emissions are on average twice as high as the emissions reported to the UNFCCC. Thus, we find that the US is systematically underreporting its SF6 emissions.
-
Annual total SF6 emissions from EU countries show a decreasing trend of −0.006 Gg yr−1 from 0.41 [0.35–0.46] Gg in 2005 to 0.25 [0.22–0.29] Gg in 2021. However, Europe also systematically underreports its SF6 emissions to UNFCCC.
-
The European emissions show a substantial drop in 2018, resulting most likely from the EU's F-gas regulation 517/2014 (European Parliament and Council of the European Union, 2014), which requires the new electrical switch gear put into service from 2017 onwards to be equipped with a leak detection system and bans the use of SF6 for recycling magnesium die-casting alloys as of 2018. This might suggest that the EU's new F-gas regulation was almost immediately successful in reducing SF6 emissions.
-
Chinese SF6 emissions show an increasing trend of 0.21 Gg yr−1, growing from 1.28 [1.03–1.57] Gg in 2005 to 5.16 [4.75–5.60] Gg in 2021, with a particularly steep trend until 2014 and a flattening afterwards. China's official voluntary reports substantially underestimate their SF6 emissions (by more than 50 %); however, the latest reports in 2017 and 2018 seem to have improved.
-
SF6 emissions in the Southern Hemisphere and some other parts of the world (e.g. India) are hard to constrain due to insufficient coverage by observations. While the inversion most likely reduces large biases of a priori estimated emissions in Africa and South America, substantial uncertainties about these emissions remain. The EDGAR bottom-up inventory seems to provide a relatively good estimate for the total emissions aggregated over all the poorly monitored regions (residual between global emissions and emissions in well-monitored areas) as, otherwise, the global a posteriori emissions would be more strongly biased against the relatively well-known global emissions based on atmospheric growth rates. Nevertheless, more observations are needed to investigate if also regional emission patterns in those areas are accurate.
-
Our inversions suggest globally significant and strongly increasing emissions in India since 2005. However, the results for this region are very uncertain because of a weak observational constraint. Adding monitoring capacity in this region should have a high future priority.
-
Our monthly inversion results show overall higher SF6 emissions in the summer (April–September) than in winter (October–March) in the Northern Hemisphere, with a distinct minimum at the beginning of the year. While America's SF6 emissions show a clear peak in May and June, and China's emission pattern is similar to the Northern Hemisphere, no clear seasonal pattern is identified for Europe. As our findings for the US contradict Hu et al. (2023), we suggest that more research on the seasonality of SF6 emissions is needed.
-
On the basis of the inversion results, we can neither confirm nor refute the hypothesis that the ocean sink of SF6 is a substantial part (up to 7 %, according to Ni et al., 2023) of the anthropogenic emission fluxes.
-
Since we find that national reports for the US, Europe, and China all underreport their SF6 emissions, while other countries with potentially high emissions (e.g. India) do not report their emissions at all, we suggest that bottom-up methods to determine the emissions need to be refined. This should include a better quantification of the processes causing the emissions that could explain the emission seasonality found here.
Table A1Inversion results for the annual SF6 emissions from the United States of America for the period 2005–2021. Annual emissions are shown, together with their uncertainties, for different a priori emission inventories. We also provide an average of the inversion results, while respective uncertainties represent the minimum and maximum uncertainty limits across the results.
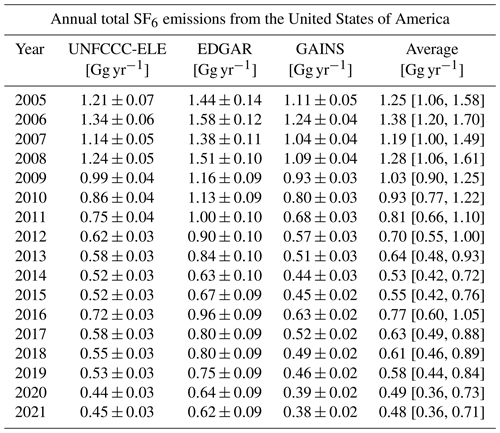
Table A2Inversion results for the annual total SF6 emissions from EU countries for the period 2005–2021. Annual emissions are shown, together with their uncertainties, for different a priori emission inventories. We also provide an average of the inversion results, while respective uncertainties represent the minimum and maximum uncertainty limits across the results.
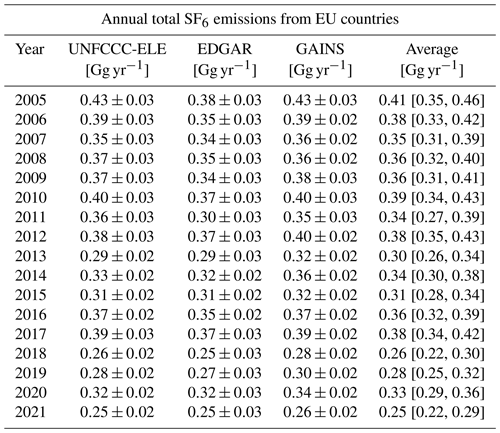
Table A3Inversion results for the annual Chinese SF6 emissions for the period 2005–2021. Annual emissions are shown, together with their uncertainties, for different a priori emission inventories. We also provide an average of the inversion results and an average excluding the GAINS-derived inversion, while uncertainties represent the minimum and maximum uncertainty limits across the results.
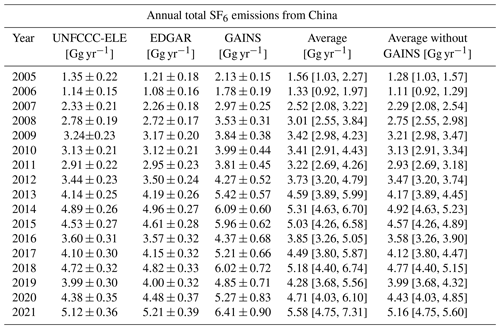
Table A4Inversion results for the annual global total SF6 emissions for the period 2005–2021. Annual emissions are shown, together with their uncertainties, for different a priori emission inventories. We also provide an average of the inversion results, while respective uncertainties represent the minimum and maximum uncertainty limits across the results.
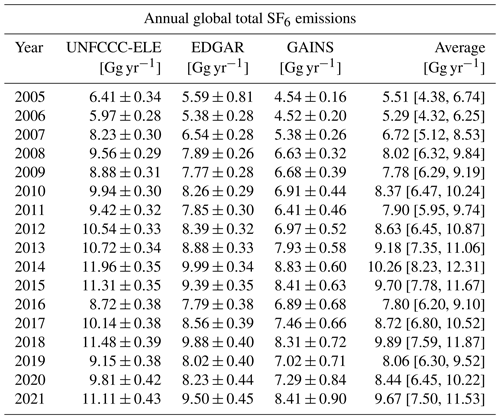
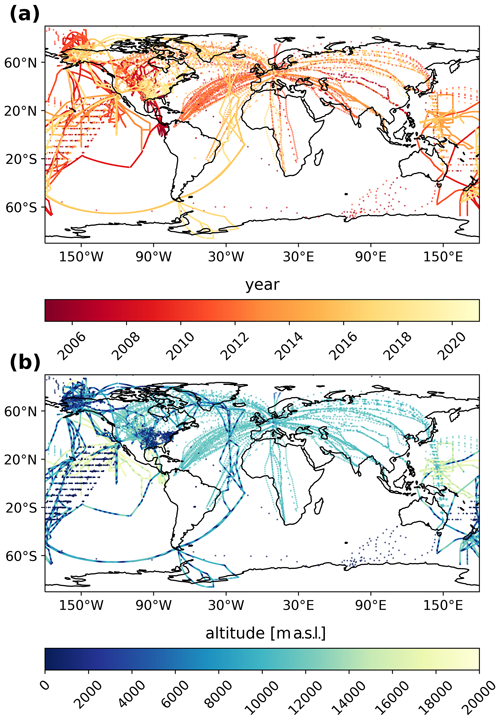
Figure A1Observations from aircraft and ship campaigns from 2005–2021. The colour bars indicate (a) the measurement date and (b) the altitude of the respective observations.

Figure A2Mole fraction time series at the Hateruma (Japan) measurement station. Red lines represent the modelled a priori mole fractions calculated with the UP a priori emissions and blue lines represent the modelled a posteriori mole fractions. The green line illustrates the baseline derived by the GDB method, and the orange line shows the optimised baseline. The grey line represents the observed mole fractions. The inset panel zooms into the year 2018, as illustrated by the light green rectangle.

Figure A3Mole fraction time series at the Izaña (Tenerife) measurement station. Red lines represent the modelled a priori mole fractions calculated with the UP a priori emissions and blue lines represent the modelled a posteriori mole fractions. The green line illustrates the baseline derived by the GDB method, and the orange line shows the optimised baseline. The grey line represents the observed mole fractions. The inset panel zooms into the year 2010, as illustrated by the light green rectangle.
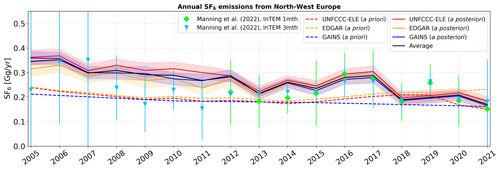
Figure A4Annual a priori (dashed lines) and a posteriori (solid lines) SF6 emissions from northwestern Europe, shown for the period between 2005 and 2021 when using different a priori emission inventories (UNFCCC-ELE in red, EDGAR in orange, and GAINS in blue). A posteriori emissions are illustrated, together with their respective uncertainties (coloured shadings are defined as the minimum and maximum 1σ uncertainty limits across the inversion results for different a priori variations). The a posteriori emissions averaged over the inversion results, using the different inventories, are shown with a solid black line. The blue rectangles and the green diamonds represent the results from Manning et al. (2022), using the InTEM (Inversion Technique for Emissions Modelling) model, with inversion time frames set to 3 and 1 months, respectively.
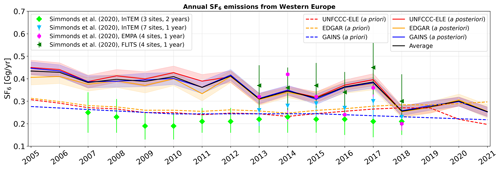
Figure A5Annual a priori (dashed lines) and a posteriori (solid lines) SF6 emissions from western Europe shown for the period between 2005 and 2021 when using different a priori emission inventories (UNFCCC-ELE in red, EDGAR in orange, and GAINS in blue). A posteriori emissions are illustrated, together with their respective uncertainties (coloured shadings are defined as the minimum and maximum 1σ uncertainty limits across the inversion results for different a priori variations). The a posteriori emissions averaged over the inversion results, using the different inventories, are shown with a solid black line. Furthermore, the results from Simmonds et al. (2020) are shown, using four different inversion setups.
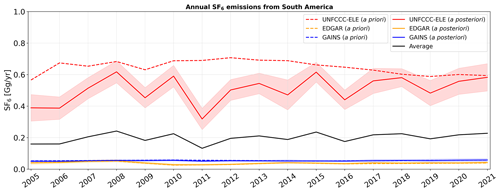
Figure A6Annual a priori (dashed lines) and a posteriori (solid lines) SF6 emissions from South America, shown for the period between 2005 and 2021 when using different a priori emission inventories (UNFCCC-ELE in red, EDGAR in orange, and GAINS in blue). A posteriori emissions are illustrated, together with their respective uncertainties (coloured shadings are defined as the minimum and maximum 1σ uncertainty limits across the inversion results for different a priori variations). The a posteriori emissions averaged over the inversion results, using the different inventories, are shown with a solid black line.

Figure A7Annual a priori (dashed lines) and a posteriori (solid lines) SF6 emissions from Australia are shown for the period between 2005 and 2021 when using different a priori emission inventories (UNFCCC-ELE in red, EDGAR in orange, and GAINS in blue). A posteriori emissions are illustrated, together with their respective uncertainties (coloured shadings are defined as the minimum and maximum 1σ uncertainty limits across the inversion results for different a priori variations). The a posteriori emissions averaged over the inversion results using the different inventories are shown with a solid black line.

Figure A8Annual a priori (dashed lines) and a posteriori (solid lines) SF6 emissions from India, shown for the period between 2005 and 2021 when using different a priori emission inventories (UNFCCC-ELE in red, EDGAR in orange, and GAINS in blue). A posteriori emissions are illustrated together with their respective uncertainties (coloured shadings are defined as the minimum and maximum 1σ uncertainty limits across the inversion results for different a priori variations). The a posteriori emissions averaged over the inversion results, using the different inventories, are shown with a solid black line.
Daily-resolved global SF6 mole fraction fields between 2005 and 2021 from the global re-analysis are provided at https://doi.org/10.25365/phaidra.489 (Vojta, 2024). The used source code of FLEXPART 10.4 (described in detail by Pisso et al., 2019a) can be found at https://doi.org/10.5281/zenodo.3542278 (Pisso et al., 2019b). The used FLEXINVERT+ code (described in detail by Thompson and Stohl, 2014), together with setting files, is provided at https://doi.org/10.25365/phaidra.488 (Vojta, 2024). The source code of FLEXPART 8-CTM-1.1, together with a user's guide, can be freely downloaded at https://doi.org/10.5281/zenodo.1249190 (Henne et al., 2018). Atmospheric mole fraction measurements of SF6 used in this study are freely available from the following sources: AGAGE data at https://agage2.eas.gatech.edu/data_archive/agage/gc-ms-medusa/ (AGAGE, 2024; Prinn et al., 2018); Heathfield tall tower data at https://catalogue.ceda.ac.uk/uuid/df502fe4715c4177ab5e4e367a99316b (Arnold et al., 2019); Bilsdale tall tower data at https://catalogue.ceda.ac.uk/uuid/d2090552c8fe4c16a2fd7d616adc2d9f (O'Doherty et al., 2019); Zeppelin mountain data at https://ebas-data.nilu.no/Pages/DataSetList.aspx?key=4548F59E3CBD48E0A505E8968BD268EB (2005–2010 EBAS, 2024); NOAA/GML Chromatograph for Atmospheric Trace Species (CATS) programme at https://doi.org/10.7289/V5X0659V (all stations; hourly data; Dutton and Hall, 2023); Monte Cimone, Cape Ochiishi, Izaña, Ragged Point, and Zugspitze–Schneefernerhaus at https://doi.org/10.50849/WDCGG_SF6_ALL_2022 (di Sarra et al., 2022); atmospheric SF6 dry-air mole fractions from the NOAA GML Carbon Cycle Cooperative Global Air Sampling Network at https://doi.org/10.15138/p646-pa37 (Lan et al., 2023); NOAA Global Greenhouse Gas Reference Network provided the flask-air Programmable Flask Package (PFP) sample measurements of SF6 at tall towers and other continental sites at https://doi.org/10.15138/5R14-K382 (Andrews et al., 2022); atmospheric sulfur hexafluoride dry-air mole fractions from the NOAA GML Carbon Cycle Aircraft Vertical Profile Network at https://doi.org/10.15138/39HR-9N34 (McKain et al., 2022); NOAA ObsPACK SF6 data at https://doi.org/10.15138/g3ks7p (NOAA Carbon Cycle Group ObsPack Team, 2018); IAGOS-CARIBIC Aircraft measurements at https://doi.org/10.5281/zenodo.10495039 (Schuck and Obersteiner, 2024); and NOAA/ESRL/GMD/HATS trace gas measurements from airborne platforms at https://gml.noaa.gov/aftp/data/hats/airborne/ (Elkins et al., 2020). For the observations at BIK (Białystok, Poland) (Popa et al., 2010), BRM (Beromünster, Switzerland) (Rust et al., 2022), GSN (Gosan, South Korea) (Kim et al., 2012), and HAT (Hateruma, Japan) (Saikawa et al., 2012), we refer to Elena Popa (epopa2@yahoo.com), Stefan Reimann (stefan.reimann@empa.ch), Sunyoung Park (sparky@knu.ac.kr), and Takuya Saito (saito.takuya@nies.go.jp), respectively.
The supplement related to this article is available online at: https://doi.org/10.5194/acp-24-12465-2024-supplement.
MV, AP, and AS designed the study. MV performed the FLEXPART, FLEXPART CTM, and FLEXINVERT+ simulations. RT helped with the FLEXINVERT+ setup and simulation issues. MV made the figures with contributions from SA. JM, SP, and GL provided atmospheric observation data. PP and FL provided GAINS emissions estimates. MV wrote the text, with input from AP, SA, SP, GL, PP, FL, XL, JM, RT, and AS.
The contact author has declared that none of the authors has any competing interests.
Publisher's note: Copernicus Publications remains neutral with regard to jurisdictional claims made in the text, published maps, institutional affiliations, or any other geographical representation in this paper. While Copernicus Publications makes every effort to include appropriate place names, the final responsibility lies with the authors.
We thank the whole AGAGE team for providing measurement data, including Christina M. Harth, Jens Mühle, Peter K. Salameh, and Ray F. Weiss (Scripps Institution of Oceanography, UCSD); Paul B. Krummel, Paul J. Fraser, and Paul Steele (CSIRO Environment); Hsiang-Jui (Ray) Wang (Georgia Institute of Technology); Simon O'Doherty, Dickon Young, and Kieran M. Stanley (University of Bristol); Martin K. Vollmer and Stefan Reimann (Empa, Swiss Federal Laboratories for Materials Science and Technology); and Chris Rene Lunder and Ove Hermanson (NILU, Norwegian Institute for Air Research), and particularly all station managers and station operators. AGAGE operations at Mace Head, Trinidad Head, Cape Matatula, Ragged Point, and Kennaook / Cape Grim are supported by NASA (USA) grants to MIT (grant nos. NAG5-12669, NNX07AE89G, NNX11AF17G, and NNX16AC98G) and SIO (grant nos. NNX07AE87G, NNX07AF09G, NNX11AF15G, NNX11AF16G, NNX16AC96G, and NNX16AC97G) and also by the Department for Business, Energy and Industrial Strategy (BEIS, UK) under contract no. 5488/11/2021 to the University of Bristol for Mace Head and NOAA (USA); under contract no. 1305M319CNRMJ0028 to the University of Bristol for Ragged Point; CSIRO, BoM, DCCEEW, and RRA (Australia); NILU (Norway); KNU (Korea); CMA (China); NIES (Japan); and Urbino University (Italy). For Jungfraujoch, funding is acknowledged for the project of HALCLIM/CLIMGAS-CH by the Swiss Federal Office for the Environment (FOEN) and for ICOS (Integrated Carbon Observation System) by the Swiss National Science Foundation. In addition, measurements are supported by the International Foundation High Altitude Research Stations Jungfraujoch and Gornergrat (HFSJG). The Commonwealth Scientific and Industrial Research Organisation (CSIRO, Australia) and Bureau of Meteorology (Australia) are thanked for their ongoing long-term support and funding of the Kennaook / Cape Grim station and the Kennaook / Cape Grim science programme. Operations of the Gosan station on Jeju Island, South Korea, were supported by the National Research Foundation of Korea grant funded by the South Korean government MSIT (grant no. RS-2023-00229318). We also thank the NOAA Global Monitoring Laboratory for providing access to their data, including Geoff Dutton, James W. Elkins, Fred Moore, Eric Hintsa, Dale Hurst, Bradley Hall, Kathryn McKain, Stephen Montzka, John Bharat Miller, Colm Sweeney, Ed Dlugokencky, Arlyn Andrews, David Nance, and Christina M. Harth and the key partners Le Huang (EC) and Kenneth Davis (PSU). Observations collected in the Southern Great Plains (SGP) by Sébastien Biraud (Lawrence Berkeley National Laboratory, USA) were supported by the Office of Biological and Environmental Research of the U.S. Department of Energy under contract no. DE‐AC02‐05CH11231 as part of the Atmospheric Radiation Measurement Program (ARM) and Environmental System Science (ESS) Program.
We further acknowledge the following people and institutions for sharing their observation data: Takuya Saito (National Institute for Environmental Studies, Japan), Emilio Cuevas (State Meteorological Agency, Spain), Dan Say (University of Bristol), Jgor Arduini (University of Urbino), Cedric Couret (German Environment Agency), Elena Popa (Utrecht University), Satoshi Sugawara (Miyagi University of Education, Japan), Armin Rauthe and Jonathan Williams (Max Planck Institute for Chemistry), Tanja Schuck (Goethe University Frankfurt), Florian Obersteiner (Karlsruhe Institute of Technology), and Luciana Vanni Gatti (Instituto Nacional de Pesquisas Espaciais).
The computational results presented have been achieved in part using the Vienna Scientific Cluster (VSC), project no. 71878, demonstration of a Lagrangian re-analysis, for which we are grateful. We further acknowledgement the use of ECMWF's computing and archive facilities provided through a special project (spatvojt) in this research. The study has been supported by EYE-CLIMA, a European Union Horizon Europe research and innovation programme under grant no. 101081395. We thank Lei Hu and Christina Groot Zwaaftink for the discussions. We also thank Marina Dütsch, Lucie Bakels, Silvia Bucci, Katharina Baier, Daria Tatsii, Anjumol Raju, Rakesh Subramanian, Sophie Wittig, Omid Nabavi, Ioanna Evangelou, Michael Blaschek, Andrey Skorokhod, and Petra Seibert (University of Vienna) for their support. Finally, we want to thank Matthew Toohey for editing our paper and the two anonymous reviewers for their constructive comments, which substantially improved our work.
This paper was edited by Matthew Toohey and reviewed by two anonymous referees.
AGAGE – Advanced Global Atmospheric Gases Experiment: Medusa GC-MS SF6 time series, all stations, years 2005–2021, AGAGE [data set], https://agage2.eas.gatech.edu/data_archive/agage/gc-ms-medusa/ (last access: 1 November 2024), 2024. a
An, M., Prinn, R., Western, L., Zhao, X., Yao, B., Hu, J., Ganesan, A. L., Mühle, J., Weiss, R. F., Krummel, P. B., O'Doherty, S., Young, D., and Rigby, M.: Sustained growth of sulfur hexafluoride emissions in China inferred from atmospheric observations, Nat Commun., 15, 1997, https://doi.org/10.1038/s41467-024-46084-3, 2024. a, b, c, d
Andersen, O., Gilpin, G., and Andrae, A. S.: Cradle-to-gate life cycle assessment of the dry etching step in the manufacturing of photovoltaic cells, AIMS Energy, 2, 410–423, https://doi.org/10.3934/energy.2014.4.410, 2014. a
Andrews, A., Crotwell, A., Crotwell, M., Handley, P., Higgs, J., Kofler, J., Lan, X., Legard, T., Madronich, M., McKain, K., Miller, J., Moglia, E., Mund, J., Neff, D., Newberger, T., Petron, G., Turnbull, J., Vimont, I., Wolter, S., and NOAA Global Monitoring Laboratory: NOAA Global Greenhouse Gas Reference Network Flask-Air PFP Sample Measurements of SF6 at Tall Tower and other Continental Sites, 2005–Present, Version 2022-11-01, NOAA GML [data set], https://doi.org/10.15138/5R14-K382, 2022. a
Arnold, T., Rennick, C., O'Doherty, S., Say, D., Young, D., Stavert, A., and Wenger, A.: Deriving Emissions related to Climate Change Network: CO2, CH4, N2O, SF6 and CO measurements from Heathfield Tall Tower, East Sussex, Centre for Environmental Data Analysis [data set], https://catalogue.ceda.ac.uk/uuid/df502fe4715c4177ab5e4e367a99316b (last access: 1 February 2024), 2019. a
Brinton, D. A. and Wilkinson, C. P.: Retinal Detachment: Priniciples and Practice, in: vol. 1, Oxford University Press, ISBN 978-0-19-533082-3, 2009. a
Brunner, D., Arnold, T., Henne, S., Manning, A., Thompson, R. L., Maione, M., O'Doherty, S., and Reimann, S.: Comparison of four inverse modelling systems applied to the estimation of HFC-125, HFC-134a, and SF6 emissions over Europe, Atmos. Chem. Phys., 17, 10651–10674, https://doi.org/10.5194/acp-17-10651-2017, 2017. a, b
CEDA: World Data Centre for Greenhouse Gases, https://archive.ceda.ac.uk// (last access: 10 September 2023), 2023. a
China: The People's Republic of China second national communication on climate change, https://unfccc.int/resource/docs/natc/chnnc2e.pdf (last access: 27 January 2024), 2012. a
China: The People's Republic of China first biennial update report on climate change, https://unfccc.int/sites/default/files/resource/3_China_FSV_Presentation.pdf (last access: 27 January 2024), 2016. a
China: The People's Republic of China third national communication on climate change, https://english.mee.gov.cn/Resources/Reports/reports/201907/P020190702566752327206.pdf (last access: 27 January 2024), 2018a. a
China: The People's Republic of China second biennial update report on climate change, https://unfccc.int/sites/default/files/resource/China 2BUR_English.pdf (last access: 27 January 2024), 2018b. a
China: The People's Republic of China fourth national communication on climate change, https://unfccc.int/sites/default/files/resource/China_NC4_English.pdf (last access: 27 January 2024), 2023a. a
China: The People's Republic of China third biennial update report on climate change, https://unfccc.int/sites/default/files/resource/China_BUR3_English.pdf (last access: 27 January 2024), 2023b. a
CIESIN: Center for International Earth Science Information Network, Columbia University, Gridded Population of the World, Version 4 (GPWv4): Population Density, Revision 11, NASA Socioeconomic Data and Applications Center (SEDAC), Palisades, NY, https://doi.org/10.7927/H49C6VHW, 2018. a, b, c
Crippa, M., Guizzardi, D., Solazzo, E., Muntean, M., Schaaf, E., Monforti-Ferrario, F., Banja, M., Olivier, J., Grassi, G., Rossi, S., and Vignati, E.: GHG emissions of all world countries – 2021 Report, EUR 30831 EN, Publications Office of the European Union, Luxembourg, ISBN 978-92-76-41547-3, https://doi.org/10.2760/173513, 2021. a
Crippa, M., D., G., Pagani, F., Banja, M., Muntean, M., E., S., Becker, W., Monforti-Ferrario, F., Quadrelli, R., Risquez Martin, A., Taghavi-Moharamli, P., Köykkä, J., Grassi, G., Rossi, S., Brandao De Melo, J., Oom, D., Branco, A., San-Miguel, J., and Vignati, E.: GHG emissions of all world countries, Publications Office of the European Union, Luxembourg, https://doi.org/10.2760/953322, 2023. a
Cui, Z., Li, Y., Xiao, S., Tian, S., Tang, J., Hao, Y., and Zhang, X.: Recent progresses, challenges and proposals on SF6 emission reduction approaches, Sci. Total Environ., 906, 167347, https://doi.org/10.1016/j.scitotenv.2023.167347, 2024. a
di Sarra, A., Hall, B. D., Dylag, C., Couret, C., Lunder, C., Sweeney, C., Sferlazzo, D., Say, D., Mondeel, D. J., Young, D., Dlugokencky, E., Cuevas, E., Meinhardt, F., Technos, G. E., Dutton, G. S., Lee, H., Nance, J. D., Arduini, J., Pitt, J., Tsuboi, K., Stanley, K., Gatti, L. V., Steinbacher, M., Vollmer, M., Krummel, P., Rivas, P., Weiss, R. F., Wang, R., Chiavarini, S., Piacentino, S., O'Doherty, S., Reimann, S., A. Montzka, S., Saito, T., and Lan, X.: All SF6 data contributed to WDCGG by GAW stations and mobiles by 2022-09-05, WDCGG [data set], https://doi.org/10.50849/WDCGG_SF6_ALL_2022, 2022. a, b
Dutton, G. and Hall, B.: Global Atmospheric Sulfur hexaflouride Dry Air Mole Fractions from the NOAA GML Halocarbons in situ Network, 1998–2023, Version 2023-04-13, NOAA [data set], https://doi.org/10.7289/V5X0659V, 2023. a
EBAS: Measured sulfur hexafluoride mole fractions at the Zeppelin mountain (Ny-Ålesund) station [data-set] (2005–2010), EBAS [data set], https://ebas-data.nilu.no/Pages/DataSetList.aspx?key=4548F59E3CBD48E0A505E8968BD268EB (last access: 1 February 2024), 2024. a
EDGAR: (Emissions Database for Global Atmospheric Research) Community GHG Database version 7.0, European Commission, Joint Research Centre (JRC), the International Energy Agency (IEA), Datasets, https://edgar.jrc.ec.europa.eu/dataset_ghg70 (last access: 27 January 2024), 2022. a
EDGAR: (Emissions Database for Global Atmospheric Research) Community GHG Database version 8.0, European Commission, Joint Research Centre (JRC), the International Energy Agency (IEA), Datasets, https://edgar.jrc.ec.europa.eu/dataset_ghg80 (last access: 27 January 2024), 2023. a
Elkins, J. W., Moore, F., Hintsa, E., Hurst, D., Hall, B., Montzka, S., Miller, B., Dutton, G., and Nance, D.: HATS Airborne Projects, NOAA [data set], https://gml.noaa.gov/hats/airborne/ (last access: 1 February 2024), 2020. a
Elvidge, C. D., Zhizhin, M., Ghosh, T., Hsu, F.-C., and Taneja, J.: Annual time series of global VIIRS nighttime lights derived from monthly averages: 2012 to 2019, Remote Sens., 13, 922, https://doi.org/10.3390/rs13050922, 2021. a, b
EPA: Assessment of the Use of Sulfur Hexafluoride (SF6) Gas Insulated Switchgears (GIS) within the Offshore Wind, Environmental Protection Agency (EPA), Eastern Research Group, https://www.epa.gov/system/files/documents/2023-12/ocs-sf6.pdf (last access: 15 February 2024), 2023. a
European Parliament and Council of the European Union: Regulation (EU) No. 517/2014 of the European Parliament and of the Council on fluorinated greenhouse gases and repealing Regulation (EC) No. 842/2006, Official Journal of the European Union, L 150/195, https://faolex.fao.org/docs/pdf/eur133686.pdf (last access: 31 January 2024), 2014. a, b
Fang, X., Thompson, R. L., Saito, T., Yokouchi, Y., Kim, J., Li, S., Kim, K. R., Park, S., Graziosi, F., and Stohl, A.: Sulfur hexafluoride (SF6) emissions in East Asia determined by inverse modeling, Atmos. Chem. Phys., 14, 4779–4791, https://doi.org/10.5194/acp-14-4779-2014, 2014. a, b, c, d
Ganesan, A. L., Rigby, M., Zammit-Mangion, A., Manning, A. J., Prinn, R. G., Fraser, P. J., Harth, C. M., Kim, K.-R., Krummel, P. B., Li, S., Mühle, J., O'Doherty, S. J., Park, S., Salameh, P. K., Steele, L. P., and Weiss, R. F.: Characterization of uncertainties in atmospheric trace gas inversions using hierarchical Bayesian methods, Atmos. Chem. Phys., 14, 3855–3864, https://doi.org/10.5194/acp-14-3855-2014, 2014. a, b
Gouda, O. E., Ali, M. D., and Ali-Hassan, A.-H.: Comparasion between Oil Immersed and SF6 Gas Power Transformers Ratings, TELKOMNIKA (Telecommunication Computing Electronics and Control), 10, 43–54, https://doi.org/10.12928/telkomnika.v10i1.797, 2012. a
Government of India: Growth of electricity sector in India from 1947-2023. Government of India, Ministry of Power, Central electricity authority, New Dehli, https://cea.nic.in/wp-content/uploads/pdm/2023/10/Growth_Book_2.pdf (last access: 15 March 2024), 2023. a
Groot Zwaaftink, C. D., Henne, S., Thompson, R. L., Dlugokencky, E. J., Machida, T., Paris, J.-D., Sasakawa, M., Segers, A., Sweeney, C., and Stohl, A.: Three-dimensional methane distribution simulated with FLEXPART 8-CTM-1.1 constrained with observation data, Geosci. Model Dev., 11, 4469–4487, https://doi.org/10.5194/gmd-11-4469-2018, 2018. a
Guo, L., Yang, Y., Fraser, P. J., Velders, G. J., Liu, Z., Cui, D., Quan, J., Cai, Z., Yao, B., Hu, J., and Fang, X.: Projected increases in emissions of high global warming potential fluorinated gases in China, Commun. Earth Environ., 4, 205, https://doi.org/10.1038/s43247-023-00859-6, 2023. a, b
Henne, S., Brunner, D., Groot Zwaaftink, C. D., and Stohl, A.: FLEXPART 8-CTM-1.1: Atmospheric Lagrangian Particle Dispersion Model for global tracer transport, Zenodo [code], https://doi.org/10.5281/zenodo.1249190, 2018. a, b
Hersbach, H., de Rosnay, P., Bell, B., Schepers, D., Simmons, A., Soci, C., Abdalla, S., Alonso-Balmaseda, M., Balsamo, G., Bechtold, P., Berrisford, P., Bidlot, J.-R., de Boisséson, E., Bonavita, M., Browne, P., Buizza, R., Dahlgren, P., Dee, D., Dragani, R., Diamantakis, M., Flemming, J., Forbes, R., Geer, A., Haiden, T., Hólm, E., Haimberger, L., Hogan, R., Horányi, A., Janiskova, M., Laloyaux, P., Lopez, P., Munoz-Sabater, J., Peubey, C., Radu, R., Richardson, D., Thépaut, J.-N., Vitart, F., Yang, X., Zsótér, E., and Zuo, H.: Operational global reanalysis: progress, future directions and synergies with NWP, ERA Report, https://doi.org/10.21957/tkic6g3wm, 2018. a
Ho, D. T., Schlosser, P., and Caplow, T.: Determination of longitudinal dispersion coefficient and net advection in the tidal Hudson River with a large-scale, high resolution SF6 tracer release experiment, Environ. Sci. Technol., 36, 3234–3241, https://doi.org/10.1021/es015814+, 2002. a
Hu, L., Ottinger, D., Bogle, S., Montzka, S. A., DeCola, P. L., Dlugokencky, E., Andrews, A., Thoning, K., Sweeney, C., Dutton, G., Aepli, L., and Crotwell, A.: Declining, seasonal-varying emissions of sulfur hexafluoride from the United States, Atmos. Chem. Phys., 23, 1437–1448, https://doi.org/10.5194/acp-23-1437-2023, 2023. a, b, c, d, e, f, g, h, i, j, k
IEEE: IEEE Guide for Sulphur Hexafluoride (SF6) Gas Handling for High-Voltage (over 1000 Vac) Equipment, IEEE, https://doi.org/10.1109/IEEESTD.2012.6127885, 2012. a
Kim, J., Li, S., Mühle, J., Stohl, A., Kim, S.-K., Park, S., Park, M.-K., Weiss, R. F., and Kim, K.-R.: Overview of the findings from measurements of halogenated compounds at Gosan (Jeju Island, Korea) quantifying emissions in East Asia, J. Integr. Environ. Sci., 9, 71–80, https://doi.org/10.1080/1943815X.2012.696548, 2012. a
Koch, E.-C.: Special materials in pyrotechnics: III. Application of lithium and its compounds in energetic systems, Propellants, Explosives, Pyrotechnics, 29, 67–80, https://doi.org/10.1002/prep.200400032, 2004. a
Koch, H.: Basic information on gas insulated transmission lines (GIL), in: 2008 IEEE Power and Energy Society General Meeting-Conversion and Delivery of Electrical Energy in the 21st Century, 23–27 January 2000, Singapore, 1–4, https://doi.org/10.1109/PESW.2000.850061, 2008. a
Kovács, T., Feng, W., Totterdill, A., Plane, J. M. C., Dhomse, S., Gómez-Martín, J. C., Stiller, G. P., Haenel, F. J., Smith, C., Forster, P. M., García, R. R., Marsh, D. R., and Chipperfield, M. P.: Determination of the atmospheric lifetime and global warming potential of sulfur hexafluoride using a three-dimensional model, Atmos. Chem. Phys., 17, 883–898, https://doi.org/10.5194/acp-17-883-2017, 2017. a
Lan, X., Mund, J., Crotwell, A., Crotwell, M., Moglia, E., Madronich, M., Neff, D., and Thoning, K.: Atmospheric Sulfur Hexafluoride Dry Air Mole Fractions from the NOAA GML Carbon Cycle Cooperative Global Air Sampling Network, 1997–2022, Version 2023-08-28, NOAA [data set], https://doi.org/10.15138/p646-pa37, 2023. a
Lan, X., Thoning, K., and Dlugokencky, E.: Trends in globally-averaged CH4, N2O, and SF6 determined from NOAA Global Monitoring Laboratory measurements, Version 2024-02, NOAA, https://doi.org/10.15138/P8XG-AA10, 2024. a, b, c
Laube, J. C., Tegtmeier, S., Fernandez, R. P., Harrison, J., Hu, L., Krummel, P., Mahieu, E., Park, S., and Western, L.: Update on Ozone-Depleting Substances (ODSs) and Other Gases of Interest to the Montreal Protocol, 978-9914-733-97-6, https://orbi.uliege.be/bitstream/2268/299913/1/Chapter_1_from Scientific-Assessment-of-Ozone-Depletion-2022.pdf (last access: 15 February 2024), 2023. a, b
Lee, H. J., Yoon, T.-J., and Yoon, Y. I.: Synthesis of ultrasound contrast agents: characteristics and size distribution analysis (secondary publication), Ultrasonography, 36, 378, https://doi.org/10.14366/usg.17014, 2017. a
Lee, H. M., Chang, M. B., and Wu, K. Y.: Abatement of sulfur hexafluoride emissions from the semiconductor manufacturing process by atmospheric-pressure plasmas, J. Ar Waste Manage. Assoc., 54, 960–970, https://doi.org/10.1080/10473289.2004.10470963, 2004. a
Levin, I., Naegler, T., Heinz, R., Osusko, D., Cuevas, E., Engel, A., Ilmberger, J., Langenfelds, R. L., Neininger, B., Rohden, C. v., Steele, L. P., Weller, R., Worthy, D. E., and Zimov, S. A.: The global SF6 source inferred from long-term high precision atmospheric measurements and its comparison with emission inventories, Atmos. Chem. Phys., 10, 2655–2662, https://doi.org/10.5194/acp-10-2655-2010, 2010. a
Li, S., Park, S., Lee, J.-Y., Ha, K.-J., Park, M.-K., Jo, C., Oh, H., Mühle, J., Kim, K.-R., Montzka, S., O'Doherty, S., Krummel, P. B., Atlas, E., Miller, B. R., Moore, F., Weiss, R. F., and Wofsy, S. C.: Chemical evidence of inter-hemispheric air mass intrusion into the Northern Hemisphere mid-latitudes, Sci. Rep., 8, 4669, https://doi.org/10.1038/s41598-018-22266-0, 2018. a
Lichter, K. E., Bloom, J. R., Sheu, R.-D., Zalavari, L. T., Leung, K., Collins, A., Witztum, A., and Chuter, R.: Tracking and Reducing SF6 Usage in Radiation Oncology: A Step Toward Net-Zero Health Care Emissions, Pract. Radiat. Oncol., 13, e471–e474, https://doi.org/10.1016/j.prro.2023.06.003, 2023. a
Maiss, M. and Brenninkmeijer, C. A.: Atmospheric SF6: trends, sources, and prospects, Environ. Sci. Technol., 32, 3077–3086, https://doi.org/10.1021/es9802807, 1998. a
Manning, A., Redington, A., O'Doherty, S., Say, D., Young, D., Arnold, T., Rennick, C., Rigby, M., Wisher, A., and Simmonds, P.: Long-Term Atmospheric Measurement and Interpretation of Radiatively Active Trace Gases–Detailed Report (September 2019 to August 2020), Tech. rep., Department for Business, Energy & Industrial Strategy, https://assets.publishing.service.gov.uk/media/62d7b9bee90e071 (last access: 10 November 2023), 2022. a, b, c, d, e
Martin, D., Petersson, K., and Shallcross, D.: The use of cyclic perfluoroalkanes and SF6 in atmospheric dispersion experiments, Q. J. Roy. Meteorol. Soc., 137, 2047–2063, https://doi.org/10.1002/qj.881, 2011. a
McKain, K., Sweeney, C., Baier, B., Crotwell, A., Crotwell, M., Handley, P., Higgs, J., Legard, T.and Madronich, M., Miller, J. B., Moglia, E.and Mund, J. N. D., Newberger, T., Wolter, S., and Laboratory, N. G. M.: NOAA Global Greenhouse Gas Reference Network Flask-Air PFP Sample Measurements of CO2, CH4, CO, N2O, H2, SF6 and isotopic ratios collected from aircraft vertical profiles [Data set], Version 2022-12-01, NOAA [data set], https://doi.org/10.15138/39HR-9N34, 2022. a
Ni, J., Liu, S.-S., Lang, X.-P., He, Z., and Yang, G.-P.: Sulfur hexafluoride in the marine atmosphere and surface seawater of the Western Pacific and Eastern Indian Ocean, Environ. Pollut., 335, 122266, https://doi.org/10.1016/j.envpol.2023.122266, 2023. a, b, c
NOAA Carbon Cycle Group ObsPack Team: Multi-laboratory compilation of atmospheric sulfure hexafluoride data for the period 1983–2017, obspack_sf6_1_v2.1.1_2018-08-17, NOAA Earth System Research Laboratory, Global Monitoring Division [data set], https://doi.org/10.15138/g3ks7p, 2018. a
O'Doherty, S., Say, D., Stanley, K., Young, D., Pitt, J., and Wenger, A.: Deriving Emissions related to Climate Change Network: CO2, CH4, N2O, SF6 and CO measurements from Bilsdale Tall Tower, North York Moors National Park, Centre for Environmental Data Analysis [data set], https://catalogue.ceda.ac.uk/uuid/d2090552c8fe4c16a2fd7d616adc2d9f (last access: 1 February 2024), 2019. a
Okofo, L. B., Adonadaga, M.-G., and Martienssen, M.: Groundwater age dating using multi-environmental tracers (SF6, CFC-11, CFC-12, δ18O, and δD) to investigate groundwater residence times and recharge processes in Northeastern Ghana, J. Hydrol., 610, 127821, https://doi.org/10.1016/j.jhydrol.2022.127821, 2022. a
Patra, P. K., Lal, S., Subbaraya, B., Jackman, C. H., and Rajaratnam, P.: Observed vertical profile of sulphur hexafluoride (SF6) and its atmospheric applications, J. Geophys. Res.-Atmos., 102, 8855–8859, https://doi.org/10.1029/96JD03503, 1997. a
Pedersen, P. H.: Ways of reducing consumption and emission of potent greenhouse gases (HFCs, PFCs and SF6), Nordic Council of Ministers, http://norden.diva-portal.org/smash/get/diva2:702766/FULLTEXT01.pdf (last access: 12 March 2024), 2000. a
Pisso, I., Sollum, E., Grythe, H., Kristiansen, N. I., Cassiani, M., Eckhardt, S., Arnold, D., Morton, D., Thompson, R. L., Groot Zwaaftink, C. D., Evangeliou, N., Sodemann, H., Haimberger, L., Henne, S., Brunner, D., Burkhart, J. F., Fouilloux, A., Brioude, J., Philipp, A., Seibert, P., and Stohl, A.: The Lagrangian particle dispersion model FLEXPART version 10.4, Geosci. Model Dev., 12, 4955–4997, https://doi.org/10.5194/gmd-12-4955-2019, 2019a. a, b
Pisso, I., Sollum, E., Grythe, H., Kristiansen, N. I., Cassiani, M., Eckhardt, S., Arnold, D., Morton, D., Thompson, R. L., Groot Zwaaftink, C. D., Evangeliou, N., Sodemann, H., Haimberger, L., Henne, S., Brunner, D., Burkhart, J. F., Fouilloux, A., Brioude, J., Philipp, A., Seibert, P., and Stohl, A.: FLEXPART 10.4. In Geosci. Model Dev. Discuss. (10.4), Zenodo [code], https://doi.org/10.5281/zenodo.3542278, 2019b. a
Popa, M., Gloor, M., Manning, A., Jordan, A., Schultz, U., Haensel, F., Seifert, T., and Heimann, M.: Measurements of greenhouse gases and related tracers at Bialystok tall tower station in Poland, Atmos. Meas. Tech., 3, 407–427, https://doi.org/10.5194/amt-3-407-2010, 2010. a
Prinn, R. G., Weiss, R. F., Arduini, J., Arnold, T., DeWitt, H. L., Fraser, P. J., Ganesan, A. L., Gasore, J., Harth, C. M., Hermansen, O., Kim, J., Krummel, P. B., Li, S., Loh, Z. M., Lunder, C. R., Maione, M., Manning, A. J., Miller, B. R., Mitrevski, B., Mühle, J., O'Doherty, S., Park, S., Reimann, S., Rigby, M., Saito, T., Salameh, P. K., Schmidt, R., Simmonds, P. G., Steele, L. P., Vollmer, M. K., Wang, R. H., Yao, B., Yokouchi, Y., Young, D., and Zhou, L.: History of chemically and radiatively important atmospheric gases from the Advanced Global Atmospheric Gases Experiment (AGAGE), Earth Syst. Sci. Data, 10, 985–1018, https://doi.org/10.5194/essd-10-985-2018, 2018. a
Purohit, P. and Höglund-Isaksson, L.: Global emissions of fluorinated greenhouse gases 2005–2050 with abatement potentials and costs, Atmos. Chem. Phys., 17, 2795–2816, https://doi.org/10.5194/acp-17-2795-2017, 2017. a
Ravishankara, A. R., Solomon, S., Turnipseed, A. A., and Warren, R. F.: Atmospheric lifetimes of long-lived halogenated species, Science, 259, 194–199, https://doi.org/10.1126/science.259.5092.194, 1993. a, b
Ray, E. A., Moore, F. L., Elkins, J. W., Rosenlof, K. H., Laube, J. C., Röckmann, T., Marsh, D. R., and Andrews, A. E.: Quantification of the SF6 lifetime based on mesospheric loss measured in the stratospheric polar vortex, J. Geophys. Res.-Atmos., 122, 4626–4638, https://doi.org/10.1002/2016JD026198, 2017. a
Redington, A. L., Manning, A. J., O’Doherty, S. J., Say, D., Rigby, M., Hoare, D., Wisher, A., Rennick, C., Arnold, T., Young, D., and Simmonds, P. G.: Long-Term Atmospheric Measurement and Interpretation of Radiatively Active Trace Gases, Annual Report, Sept 2018–Sept 2019, Department for Business, Energy and Industrial Strategy, London, UK, https://assets.publishing.service.gov.uk/media/5eddf868d3bf7f (last access: 1 November 2024), 2019. a
Rigby, M., Mühle, J., Miller, B. R., Prinn, R. G., Krummel, P. B., Steele, L. P., Fraser, P. J., Salameh, P. K., Harth, C. M., Weiss, R. F., Greally, B. R., O'Doherty, S., Simmonds, P. G., Vollmer, M. K., Reimann, S., Kim, J., Kim, K.-R., Wang, H. J., Olivier, J. G. J., Dlugokencky, E. J., Dutton, G. S., Hall, B. D., and Elkins, J. W.: History of atmospheric SF6; from 1973 to 2008, Atmos. Chem. Phys., 10, 10305–10320, https://doi.org/10.5194/acp-10-10305-2010, 2010. a, b, c
Rigby, M., Manning, A., and Prinn, R.: Inversion of long-lived trace gas emissions using combined Eulerian and Lagrangian chemical transport models, Atmos. Chem. Physics, 11, 9887–9898, https://doi.org/10.5194/acp-11-9887-2011, 2011. a, b, c
Rigby, M., Prinn, R. G., O'Doherty, S., Montzka, S. A., McCulloch, A., Harth, C. M., Mühle, J., Salameh, P. K., Weiss, R. F., Young, D., Simmonds, P. G., Hall, B. D., Dutton, G. S., Nance, D., Mondeel, D. J., Elkins, J. W., Krummel, P. B., Steele, L. P., and Fraser, P. J.: Re-evaluation of the lifetimes of the major CFCs and CH3CCl3 using atmospheric trends, Atmos. Chem. Phys., 13, 2691–2702, https://doi.org/10.5194/acp-13-2691-2013, 2013. a, b
Rust, D., Katharopoulos, I., Vollmer, M. K., Henne, S., O'Doherty, S., Say, D., Emmenegger, L., Zenobi, R., and Reimann, S.: Swiss halocarbon emissions for 2019 to 2020 assessed from regional atmospheric observations, Atmos. Chem. Phys., 22, 2447–2466, https://doi.org/10.5194/acp-22-2447-2022, 2022. a
Saikawa, E., Rigby, M., Prinn, R. G., Montzka, S. A., Miller, B. R., Kuijpers, L. J. M., Fraser, P. J. B., Vollmer, M. K., Saito, T., Yokouchi, Y., Harth, C. M., Mühle, J., Weiss, R. F., Salameh, P. K., Kim, J., Li, S., Park, S., Kim, K.-R., Young, D., O'Doherty, S., Simmonds, P. G., McCulloch, A., Krummel, P. B., Steele, L. P., Lunder, C., Hermansen, O., Maione, M., Arduini, J., Yao, B., Zhou, L. X., Wang, H. J., Elkins, J. W., and Hall, B.: Global and regional emission estimates for HCFC-22, Atmos. Chem. Phys., 12, 10033–10050, https://doi.org/10.5194/acp-12-10033-2012, 2012. a
Schuck, T. and Obersteiner, F.: IAGOS-CARIBIC whole air sampler data (v2024.01.12) [Data set], Zenodo [data set], https://doi.org/10.5281/zenodo.10495039, 2024. a
Schwaab, K.: Emissions Reduction Potentials for SF6 in Germany, in: Conference Paper (EPA): SF6 and the environment: Emission reduction strategies, Citeseer, https://citeseerx.ist.psu.edu/document?repid=rep1&type=pdf&doi=d885668be934608b9a54db7ac2dc9ecdcda6b26a (last access: 15 February 2024), 2000. a
Schwarz, W.: Emissions, activity data, and emission factors of fluorinated greenhouse gases (F-Gases) in Germany 1995-2002, Research Report 201 41 261/01, UBA-FB 000811/e, Umweltbundesamt, Berlin, https://www.osti.gov/etdeweb/biblio/21154958 (last access: 15 Feebruary 2024), 2005. a
Simmonds, P. G., Rigby, M., Manning, A. J., Park, S., Stanley, K. M., McCulloch, A., Henne, S., Graziosi, F., Maione, M., Arduini, J., Reimann, S., Vollmer, M. K., Mühle, J., O'Doherty, S., Young, D., Krummel, P. B., Fraser, P. J., Weiss, R. F., Salameh, P. K., Harth, C. M., Park, M.-K., Park, H., Arnold, T., Rennick, C., Steele, L. P., Mitrevski, B., Wang, R. H. J., and Prinn, R. G.: The increasing atmospheric burden of the greenhouse gas sulfur hexafluoride (SF6), Atmos. Chem. Phys., 20, 7271–7290, https://doi.org/10.5194/acp-20-7271-2020, 2020. a, b, c, d, e, f, g, h, i, j, k, l, m, n
Smith, C., Nicholls, Z., Armour, K., Collins, W., Forster, P., Meinshausen, M., Palmer, M., and Watanabe, M.: The Earth’s Energy Budget, Climate Feedbacks, and Climate Sensitivity Supplementary Material, in: Climate Change 2021: The Physical Science Basis, Contribution of Working Group I to the Sixth Assessment Report of the Intergovernmental Panel on Climate Change, edited by: Masson-Delmotte, V., Zhai, P., Pirani, A., Connors, S. L., Péan, C., Berger, S., Caud, N., Chen, Y., Goldfarb, L., Gomis, M. I., Huang, M., Leitzell, K., Lonnoy, E., Matthews, J. B. R., Maycock, T. K., Waterfield, T., Yelekçi, O., Yu, R., and Zhou, B., IPCC, https://www.ipcc.ch (last access: 30 August 2024), 2021. a
Stiller, G., Harrison, J. J., Haenel, F., Glatthor, N., and Kellmann, S.: MIPAS monthly zonal mean Age of Air data, based on MIPAS SF6 retrievals, processed at KIT-IMK, Karlsruhe, https://doi.org/10.5445/IR/1000139453, 2021. a
Stohl, A., Seibert, P., Arduini, J., Eckhardt, S., Fraser, P., Greally, B. R., Lunder, C., Maione, M., Mühle, J., O'Doherty, S., Prinn, R. G., Reimann, S., Saito, T., Schmidbauer, N., Simmonds, P. G., Vollmer, M. K., Weiss, R. F., and Yokouchi, Y.: An analytical inversion method for determining regional and global emissions of greenhouse gases: Sensitivity studies and application to halocarbons, Atmos. Chem. Phys., 9, 1597–1620, https://doi.org/10.5194/acp-9-1597-2009, 2009. a, b
Tanhua, T., Olsson, K. A., and Fogelqvist, E.: A first study of SF6 as a transient tracer in the Southern Ocean, Deep-Sea Res. Pt. II, 51, 2683–2699, https://doi.org/10.1016/j.dsr2.2001.02.001, 2004. a
Tarantola, A.: Inverse Problem Theory and Methods for Model Parameter Estimation, Society for Industrial and Applied Mathematics, 1–67, ISBN 978-0-89871-572-9 978-0-89871-792-1, https://doi.org/10.1137/1.9780898717921, 2005. a
Thacker, W. C.: Data assimilation with inequality constraints, Ocean Model., 16, 264–276, https://doi.org/10.1016/j.ocemod.2006.11.001, 2007. a
Thompson, R. L. and Stohl, A.: FLEXINVERT: an atmospheric Bayesian inversion framework for determining surface fluxes of trace species using an optimized grid, Geosci. Model Dev., 7, 2223–2242, https://doi.org/10.5194/gmd-7-2223-2014, 2014. a, b, c, d, e
Tørseth, K., Aas, W., Breivik, K., Fjæraa, A. M., Fiebig, M., Hjellbrekke, A.-G., Lund Myhre, C., Solberg, S., and Yttri, K. E.: Introduction to the European Monitoring and Evaluation Programme (EMEP) and observed atmospheric composition change during 1972–2009, Atmos. Chem. Phys., 12, 5447–5481, https://doi.org/10.5194/acp-12-5447-2012, 2012. a
UNFCCC: United Nations Framework Convention on Climate Change, https://di.unfccc.int/time_series (last access: 10 March 2023), 2021. a
Vojta, M.: Daily-resolved global SF6 mole fraction fields between 2005 and 2021, Universität Wien [data set], https://doi.org/10.25365/phaidra.489, 2024. a, b, c
Vojta, M., Plach, A., Thompson, R. L., and Stohl, A.: A comprehensive evaluation of the use of Lagrangian particle dispersion models for inverse modeling of greenhouse gas emissions, Geosci. Model Dev., 15, 8295–8323, https://doi.org/10.5194/gmd-15-8295-2022, 2022. a, b, c, d, e, f, g, h, i
Zhou, S., Teng, F., and Tong, Q.: Mitigating sulfur hexafluoride (SF6) emission from electrical equipment in China, Sustainability, 10, 2402, https://doi.org/10.3390/su10072402, 2018. a
Austria, Belgium, Bulgaria, Croatia, Cyprus, Czechia, Denmark, Estonia, Finland, France, Germany, Greece, Hungary, Ireland, Italy, Latvia, Lithuania, Luxembourg, Malta, the Netherlands, Poland, Portugal, Romania, Slovakia, Slovenia, Spain, and Sweden.
Ireland, the United Kingdom, France, Belgium, the Netherlands, Luxembourg, and Germany.
The United Kingdom, Ireland, Benelux, Germany, France, Denmark, Switzerland, Austria, Spain, Italy, and Portugal.


