the Creative Commons Attribution 4.0 License.
the Creative Commons Attribution 4.0 License.
 | 23 Oct 2024
Aerosol size distribution properties associated with cold-air outbreaks in the Norwegian Arctic
Abigail S. Williams
Jeramy L. Dedrick
Florian Tornow
Israel Silber
Ann M. Fridlind
Benjamin Swanson
Paul J. DeMott
Paul Zieger
Radovan Krejci
The aerosol particles serving as cloud condensation and ice nuclei contribute to key cloud processes associated with cold-air outbreak (CAO) events but are poorly constrained in climate models due to sparse observations. Here we retrieve aerosol number size distribution modes from measurements at Andenes, Norway, during the Cold-Air Outbreaks in the Marine Boundary Layer Experiment (COMBLE) and at Zeppelin Observatory, approximately 1000 km upwind from Andenes at Svalbard. During CAO events at Andenes, the sea-spray-mode number concentration is correlated with strong over-ocean winds with a mean of 8±4 cm−3 that is 71 % higher than during non-CAO conditions. Additionally, during CAO events at Andenes, the mean Hoppel minimum diameter is 6 nm smaller than during non-CAO conditions, though the estimated supersaturation is lower, and the mean number concentration of particles that likely activated in-cloud is 109±61 cm−3 with no statistically significant difference from the non-CAO mean of 99±66 cm−3. For CAO trajectories between Zeppelin Observatory and Andenes, the upwind-to-downwind change in number concentration is the largest for the accumulation mode with a mean decrease of 93±95 cm−3, likely attributable primarily to precipitation scavenging. These characteristic properties of aerosol number size distributions during CAO events provide guidance for evaluating CAO aerosol–cloud interaction processes in models.
- Article
(1561 KB) - Full-text XML
-
Supplement
(932 KB) - BibTeX
- EndNote


The equatorward transport of polar air masses brings cold air over a relatively warmer open ocean, spurring large turbulent surface fluxes of heat and moisture and creating so-called marine cold-air outbreak (CAO) events. The forming clouds often appear first in the shape of rolls (Brümmer, 1999) before filling in towards a near-overcast deck and then transitioning into a more broken, open-cellular state further downwind (Abel et al., 2017; Lloyd et al., 2018; McCoy et al., 2017; Geerts et al., 2022). Such a cloud regime transition during CAO events is often seen in satellite imagery (e.g., Fig. 1 of Geerts et al., 2022) and has important implications for the regional radiation budget (McCoy et al., 2017). Climate and numerical weather prediction models struggle to accurately capture the clouds associated with CAO events. Such model limitations emerge since important dynamical aspects are unresolved (Field et al., 2017). In addition, there is evidence of strong cloud and aerosol microphysical processes that may modulate the macrophysical structure of clouds. For example, Tornow et al. (2021) found that mid-latitude CAO cloud transitions, which resembled observations, could only be simulated when the number concentration of aerosols serving as cloud condensation nuclei (CCN) was allowed to evolve with time, as aerosol can control the onset of transition-driving precipitation (Abel et al., 2017; Tornow et al., 2021). For polar CAOs of lower temperature, aerosol may additionally provide a reservoir for ice nuclei (e.g., Bigg, 1996). Previous modeling of cold-air outbreaks has typically relied on sparse observational constraints (e.g., Field et al., 2014; Abel et al., 2017; Tornow et al., 2023), illustrating a need for observations of aerosol properties associated with CAO events in order to inform, constrain, and improve model simulations and forecasts.
Aerosol number concentrations in the Arctic are typically very low, with median concentrations consistently less than 400 cm−3 (Croft et al., 2016; Pernov et al., 2022; Freud et al., 2017; Tunved et al., 2013). The annual maximum in number concentration at Zeppelin Observatory in Svalbard is during spring due to an increase in accumulation-mode particles (termed Arctic haze), with a maximum in Aitken-mode particles during summer and an annual minimum during fall (Croft et al., 2016; Pernov et al., 2022; Freud et al., 2017; Tunved et al., 2013; Schmale et al., 2022). Aerosols in this region typically have chemical compositions that largely consist of sulfates, sea salt, and organic components (Willis et al., 2018; Moore et al., 2011; Adachi et al., 2022; Schmale et al., 2022; Moschos et al., 2022). The variability of aerosol properties is often associated with differences in the meteorological conditions and transport patterns the aerosol experienced, referred to as the air mass history (Schmale et al., 2022; Pernov et al., 2022; Freud et al., 2017; Tunved et al., 2013). Since CAO events generally have air mass histories that are similar to each other, we could expect that their aerosol properties represent only a subset of properties observed in Arctic conditions. Previous studies have reported the accumulation-mode number concentration of particles as approximately 100 cm−3 upwind and approximately 25 cm−3 downwind of the transition in cloud structure during CAO events (Abel et al., 2017; Lloyd et al., 2018; Sanchez et al., 2022). These results, however, are limited to only four case studies and provide no information on the aerosol number size distribution associated with CAO events.
CCN consist primarily of accumulation-mode particles, with smaller particles serving as CCN when accumulation-mode number concentrations are very low or supersaturations are high (Jung et al., 2018; Karlsson et al., 2022; Koike et al., 2019; Bulatovic et al., 2021; Zábori et al., 2015). Known as cloud processing, an addition of aerosol mass can result from the aqueous production of a component from the vapor phase, such as sulfate from SO2 (Isokääntä et al., 2022), resulting in particles that are larger after the cloud has evaporated than before it formed (Freud et al., 2017; Croft et al., 2016; Zheng et al., 2018). Precipitation acts as a primary sink for accumulation-mode particles (Isokääntä et al., 2022; Croft et al., 2016; Zheng et al., 2018; Freud et al., 2017; Tunved et al., 2013), and this scavenging has been observed in association with CAO events, although it is limited to three case studies and aerosols of diameters between 0.1 and 3.0 µm (Abel et al., 2017; Lloyd et al., 2018). In mid-latitude clouds off the eastern seaboard, dilution of accumulation-mode particles by rapid boundary layer growth has also been shown to contribute to lowering droplet number concentrations with increasing fetch offshore (Tornow et al., 2022).
In order to better understand the interactions between aerosols and CAO events, we studied aerosol number size distributions measured in Andenes, Norway (69.30° N, 16.15° E), during the Cold-Air Outbreaks in the Marine Boundary Layer Experiment (COMBLE; Geerts et al., 2022). We additionally examined aerosol measurements from Zeppelin Observatory in Svalbard (78.90° N, 11.88° E), located approximately 1000 km upwind of Andenes (Fig. 1), during time periods when CAO air mass trajectories passed near Zeppelin Observatory before arriving at Andenes. This allowed for an evaluation of the consistencies and variability of the cloud-processed aerosol number size distribution during CAO events versus non-CAO conditions at Andenes and between upwind (Zeppelin Observatory) and downwind (Andenes) conditions for certain CAO events. We investigate the aerosol properties associated with CAO events, including the sea spray aerosol concentration (Sect. 3), the fraction of particles that can activate to cloud droplets (Sect. 4), and the variation in modal number concentration with precipitation (Sect. 5).
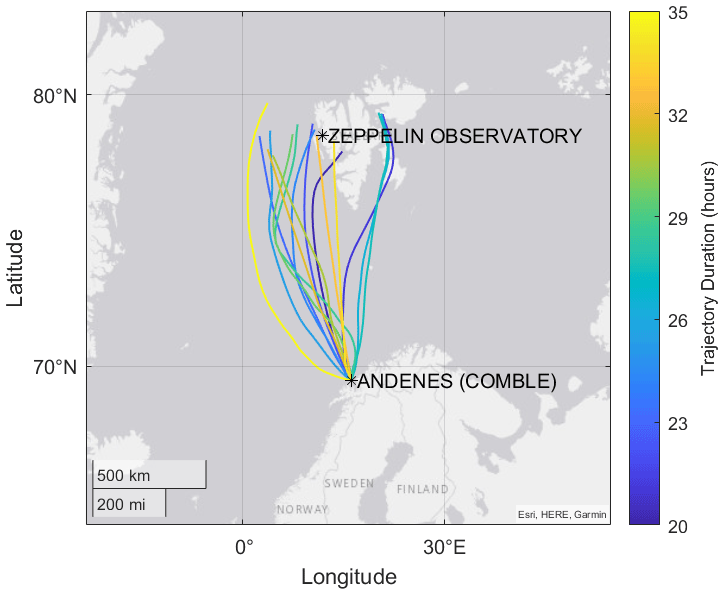
Figure 1Map illustrating the locations (black asterisks) of Andenes in Norway and Zeppelin Observatory in Svalbard. Overlaid are 15 trajectories that occur during 8 CAO events at Andenes (Table S1). Trajectories are colored by the amount of time between the closest passage by Zeppelin Observatory and arrival at Andenes.
Section 2.1 describes the selection of CAO air masses that passed in close proximity to Zeppelin Observatory in Svalbard and traversed ∼ 1000 km downwind to Andenes, Norway. Section 2.2 discusses the retrieval of the aerosol-mode properties associated with the measured size distributions at Andenes and Zeppelin Observatory. Lastly, Sect. 2.3 describes the measurements of the trace gases and meteorological properties used in this work.
2.1 CAO events
As identified in Geerts et al. (2022), 49 CAO events occur at Andenes during COMBLE between 1 December 2019 and 31 May 2020. The 49 CAO events account for 18.6 % of the entire COMBLE duration, and the remaining 81.4 % are referred to as non-CAO conditions. Sections 3 and 4 utilize these CAO and non-CAO time periods. Back trajectories of 120 h were calculated every 3 h between 1 December 2019 and 31 May 2020, initiated at Andenes (surface level; 2 m a.m.s.l.; 69.30° N, 16.15° E), using the Hybrid Single-Particle Lagrangian Integrated Trajectory (HYSPLIT; Stein et al., 2015) with the fifth-generation European Centre for Medium-Range Weather Forecasts (ECMWF) atmospheric reanalysis (ERA5; Hersbach et al., 2020) at 1° and 1 h spatial and temporal resolutions. An ensemble is run for each trajectory, in which each member of the ensemble is calculated by offsetting the meteorological data by 7.5 km in the horizontal directions (a total of nine ensemble members).
A total of 23 (47 %) of the CAO events during COMBLE have trajectories that pass within 200 km of Zeppelin Observatory in Svalbard (78.90° N, 11.88° E). Section 5 focuses on eight (16 %) of the CAO events during COMBLE that have complete aerosol number size distribution measurements available at both Zeppelin Observatory and Andenes. These 8 CAO events include 15 of the calculated 3-hourly back trajectories shown in Fig. 1. Since a few of these 15 selected back trajectories remain at surface level between Andenes and Zeppelin Observatory, all trajectories were initiated at multiple vertical levels in 50 m increments above the surface. For the 15 selected back trajectories, all still pass within 200 km of Zeppelin Observatory when initiated at a height above the surface that never intersects the surface at any point between Andenes and Zeppelin Observatory (Fig. S1 in the Supplement). Moreover, the trajectories identified as not meeting the criterion of passing within 200 km of Zeppelin Observatory are unchanged for surface or higher initial heights.
2.2 In situ aerosol measurements
Aerosol properties were measured at Andenes during COMBLE by the Aerosol Observing System (AOS) operated by the US Department of Energy (DOE) Atmospheric Radiation Measurement (ARM) facility. More details on the general set-up of the AOS can be found in Uin et al. (2019). Particle number size distributions were provided by an ultra-high-sensitivity aerosol spectrometer (UHSAS; Droplet Measurement Technologies Inc.; Uin, 2016a; Uin et al., 2019b) and a scanning mobility particle sizer (SMPS; TSI Inc., model 3936; Kuang, 2016a, 2019). The UHSAS utilizes optical scattering to size and count particles between 60 and 1000 nm every 10 s, while the SMPS uses electrical mobility to size particles between 10 and 500 nm every 5 min. The particle sizing uncertainty for both the UHSAS and the SMPS is within ± 2.5 % (Uin, 2016a; Kuang, 2016a; Koontz et al., 2019a). A condensation particle counter (CPC; TSI Inc., model 3772; Kuang, 2016b) recorded the total number concentration of submicron particles greater than 10 nm in diameter. The sample flows of the UHSAS, SMPS, and CPC were dried using Nafion dryers (Uin et al., 2019), and the aerosol inlet had a particle transmission efficiency of 100 % between 10 and 1000 nm (Bullard et al., 2017).
At Zeppelin Observatory, particle number size distributions in the mobility diameter range of 5–809 nm were collected approximately every 15 min by a custom closed-loop differential mobility particle sizer (DMPS; Platt et al., 2022; Karlsson et al., 2021; Tunved et al., 2013). An optical particle size spectrometer (OPSS; Fidas 200 S, Palas GmbH, Germany) measured the size distribution of larger particles in the optical diameter range of 0.2–18 µm every 3 min under dry conditions. The COMBLE campaign coincided with the Ny-Ålesund Aerosol Cloud Experiment (NASCENT) 2019–2020 campaign at Ny-Ålesund, Svalbard (Pasquier et al., 2022). More details on the long-term measurements and the general set-up at Zeppelin Observatory can be found in Platt et al. (2022).
Aerosol mass was collected at Zeppelin Observatory using a three-stage filter pack (with a Teflon Zefluor 2 µm pore, 47 mm diameter filter, and a cellulose Whatman 40 filter) every 24 h (Lee et al., 2020; Platt et al., 2022). Due to the absence of a cyclone or impactor in front of the filter pack, there was no calibrated upper-size cutoff (Lee et al., 2020; Ahn et al., 2021), although contributions from supermicron particles were expected to be small at this location. Following collection, filters were analyzed in the laboratory using ion chromatography to determine the mass of SO, NO, Cl−, NH, Ca2+, Mg2+, K+, and Na+ (Platt et al., 2022; Lee et al., 2020; Ahn et al., 2021). The mass concentration of sea salt was calculated as 1.47[Na+] + [Cl−] as in Lewis et al. (2023) and Frossard et al. (2014).
During COMBLE at Andenes, a humidified tandem differential mobility analyzer (HTDMA; Brechtel Manufacturing Inc.; model 3002; Uin, 2016b, 2020) recorded size distributions of humidified (RH = 80 %) particles at five different initial dry (RH < 2 %) sizes at 10 min intervals, from which the growth factors (GFs; ratio of wet to dry diameter) for each of the five initial dry diameters were calculated. The HTDMA was calibrated at the beginning and end of the 6-month COMBLE campaign by ARM instrument mentors, including verifying flow rates, particle sizing, and GF values of ammonium nitrate or ammonium sulfate particles against Köhler theoretical values (Uin, 2016b; Uin et al., 2019). The hygroscopicity parameter (κ) was calculated using the median GF of each distribution for the five initial dry diameters using Eq. (11) of Petters and Kreidenweis (2007). Taking into account that the HTDMA has a particle sizing uncertainty of ±1 % and an RH uncertainty of ±4 % (Uin, 2016b), a Monte Carlo approach provided an estimate of the associated uncertainty in our calculated κ values, with an approach similar to that of Schulze et al. (2020) and Massling et al. (2023). For each HTDMA measurement, 1000 iterations of κ calculations were performed using input parameter values that were randomly selected from a normal distribution centered at the measured input parameter value with a standard deviation of its instrument-based uncertainty. The uncertainty in κ is ±24 %, which is the standard deviation of the κ distribution that results from the 1000 iterations.
During COMBLE at Andenes, a cloud condensation nuclei (CCN) counter (Droplet Measurement Technologies model CCN-200; Uin, 2016c, Koontz et al., 2019b) provided measurements of CCN number concentration at 0.4 % supersaturation every 15 min throughout the campaign. The CCN counter was calibrated at the beginning and end of the 6-month COMBLE campaign by ARM instrument mentors, including applying calibration coefficients determined from counting size-selected ammonium sulfate particles before and after activation at various instrument temperatures (Uin, 2016c). The associated particle sizing uncertainty for the CCN counter is ±0.25 µm (Uin, 2016c).
Particle number size distribution measurements were averaged to 1 and 2 h intervals and merged from the UHSAS and SMPS during COMBLE and the DMPS and OPSS at Zeppelin Observatory following the methods of Dedrick et al. (2022a), Modini et al. (2015), and Khlystov et al. (2004). There is a strong correlation between the measured CN concentration and total particle number concentration integrated from the merged particle number size distributions at Andenes (r=0.80, Fig. S2) and at Zeppelin Observatory (r=0.95, Fig. S2).
Three lognormal modes were fit to the merged number size distributions at both sites using an automated algorithm that calculates the modal number concentration (N), geometric mean diameter (Dg), and geometric standard deviation (σg) as parameters of the fitted distribution (Dedrick et al., 2022a; Modini et al., 2015; Saliba et al., 2019). The fitting algorithm, as described in Dedrick et al. (2022a), is informed and constrained by supermicron scattering measurements taken by a three-wavelength integrating nephelometer during COMBLE (Uin, 2016d). A chi-square test was utilized to evaluate the quality of the calculated mode fits to the merged number size distributions, similar to Dedrick et al. (2022a). Approximately 20 % of fits had a chi-square value that exceeded the critical value at the 95 % confidence interval, and these fits were manually adjusted by visual inspection or excluded.
The choice of three lognormal modes has also been used in prior studies in this region (e.g., Freud et al., 2017; Tunved et al., 2013). We designate the three modes as the Aitken mode (0.02 µm µm), accumulation mode (0.1 µm < Dg<0.3 µm), and sea spray mode (0.3 µm 0.8 µm). This sea spray mode centered at diameters between 0.3 and 0.8 µm is consistent with previous reports of sea-spray-mode mean diameters ranging between 0.14 and 0.6 µm in field measurements (Russell et al., 2023; Modini et al., 2015; Dedrick et al., 2022a) and often appears as a “shoulder” in the distribution (Zheng et al., 2018; Dedrick et al., 2022a; Modini et al., 2015). The sea-spray-mode mass is calculated from the fitted sea-spray-mode number assuming spherical particle homogeneity and a constant sea spray density of 2.0 g cm−3 for dry conditions (Zieger et al., 2017). The Pearson correlation coefficient, r, indicates a strong correlation (r=0.92) of the fitted sea-spray-mode mass with the measured sea salt mass concentration at Zeppelin Observatory (Fig. 2). There is also a strong correlation between the fitted sea-spray-mode mass and measured sodium ion mass concentration (r=0.90) and between the fitted sea-spray-mode mass and measured chloride ion mass concentration (r=0.94).
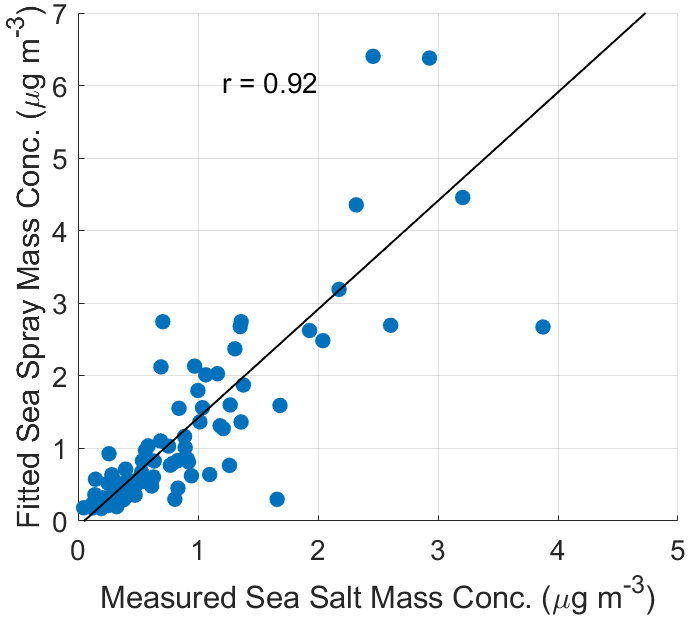
Figure 2Scatter plot of the mass concentration of the fitted sea spray mode against the measured sea salt mass concentration at Zeppelin Observatory. The linear regression line is shown in solid black.
The Hoppel minimum diameter (DHM; local minimum in concentration located between the peaks of the Aitken and accumulation modes, Hoppel et al., 1986) is retrieved for all measured aerosol particle number size distributions at Andenes following the methods presented by Dedrick et al. (2024). Using the Dg of the fitted Aitken and accumulation modes as upper and lower diameter bounds, DHM is taken as the diameter bin of the merged measured number size distribution that has the lowest particle number concentration within these diameter bounds. The instrument-based sizing uncertainty of ±2.5 % is estimated for the uncertainty in retrieved DHM values.
The effective supersaturation for cloud processing is estimated using measurements of DHM and κ at Andenes in Eq. (10) of Petters and Kreidenweis (2007). κ is interpolated to the diameter range of DHM using the HTDMA-derived κ measurements at the five initial dry particle diameters of 50, 100, 150, 200, and 250 nm. Due to this limited size range of κ, effective supersaturation is only calculated for points where 50 nm < DHM < 250 nm. Given the uncertainties in DHM (±2.5 %) and κ (±24 %), a Monte Carlo approach (described above for the κ uncertainty calculation) is used to estimate the uncertainty in the effective supersaturation to give an uncertainty of less than ±15 % for the calculated effective supersaturation values.
2.3 Ancillary variables
Carbon monoxide (CO) concentrations were measured at Andenes during COMBLE with a Los Gatos Research CO analyzer at 1 s resolution (Springston, 2015; Koontz et al., 2019c) and at Zeppelin Observatory with a Picarro G2401 cavity ring-down spectroscope at 1 min resolution (Platt et al., 2022). Wind direction and speed were measured every second by a Vaisala weather transmitter (WXT520) mounted on the aerosol inlet at Andenes during COMBLE (Kyrouac, 2019; Kyrouac et al., 2019). For direct comparison with aerosol measurements, wind and CO measurements were averaged to 1 and 2 h intervals.
Mean surface precipitation rates with a resolution of 4 min at Andenes were obtained from the precip_mean variable of the Ka-band ARM Zenith Radar Active Remote Sensing of CLouds (KAZRARSCL; Johnson et al., 2023) value-added product (VAP) produced by the Department of Energy (DOE) Atmospheric Radiation Measurement (ARM) user facility. This variable is informed by measurements of the tipping-bucket rain gauge that is part of the surface meteorological instrumentation (MET; Ritsche, 2011). Based on the mean precipitation rate, the amount of precipitation (the liquid equivalent of all hydrometeors) accumulated at Andenes within the previous 24 h at 1 and 2 h intervals was calculated during COMBLE.
The median aerosol particle number size distribution at Andenes is described by three lognormal modes (Aitken, accumulation, and sea spray) centered at approximately 0.035, 0.14, and 0.45 µm (Fig. 3a). The mean Aitken-mode number concentration is 52±54 cm−3 during CAO events, which is 14 % lower than during non-CAO conditions (Table 1). Conversely, the mean accumulation-mode number concentration is 109±75 cm−3, with 10 % higher concentrations during CAO events compared to non-CAO conditions. These differences, however, are not statistically significant (hereafter, statistically significant implies p<0.05 by two-sample t test) and suggest that the number concentrations of the two modes are controlled by independent factors rather than the aerosol co-varying with CAO events.
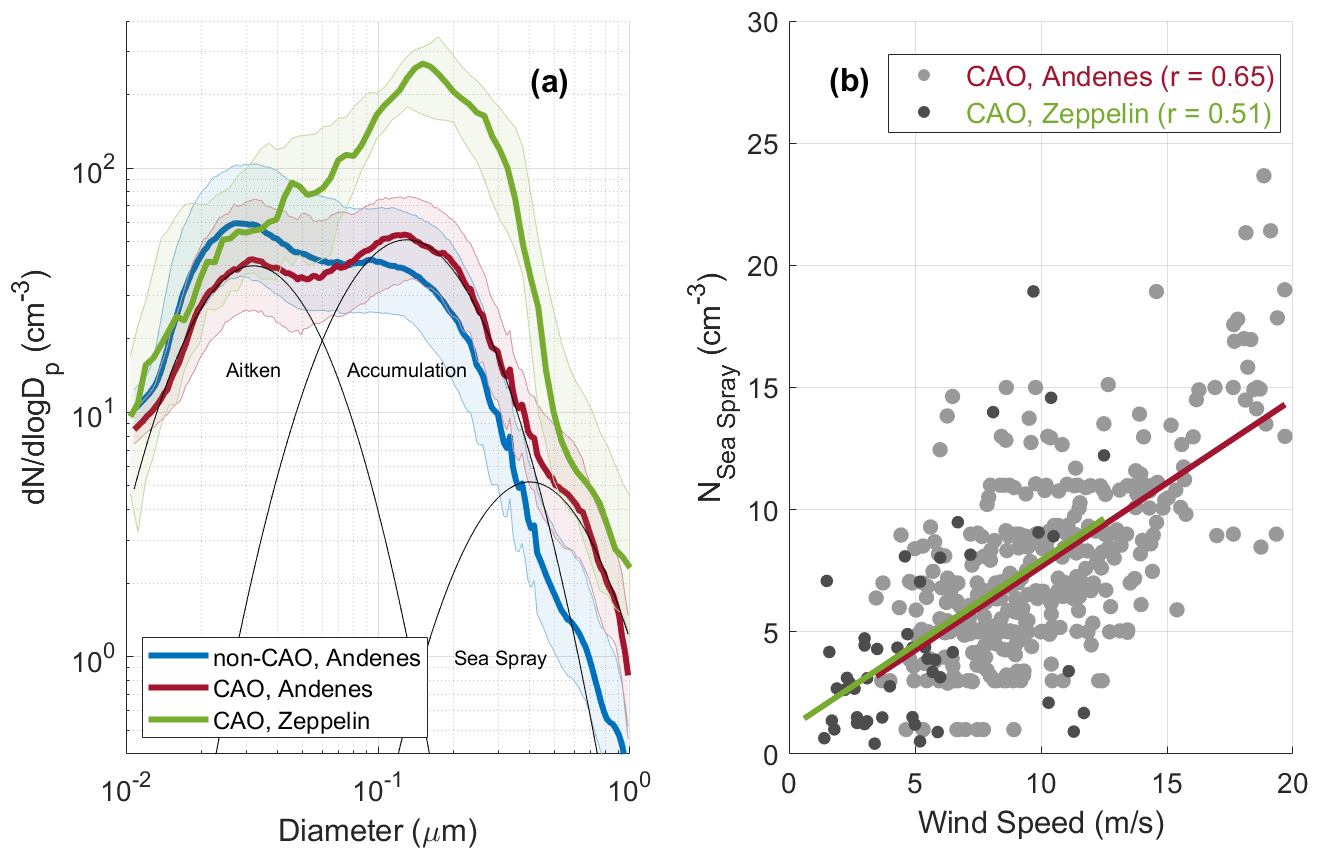
Figure 3(a) Median particle number size distributions (thick solid lines) with 25th and 75th percentiles (shaded regions) for non-CAO conditions at Andenes (blue), CAO events at Andenes (red), and CAO event back trajectories at Zeppelin Observatory (green). The median CAO distribution at Andenes is overlaid with the Aitken, accumulation, and sea spray modes (thin black lines). (b) Scatter plots of the sea-spray-mode number concentration against measured wind speed. Points are 2 h means during CAO events at Andenes (light gray points) or when CAO event back trajectories pass near Zeppelin Observatory (dark gray points) and are overlaid with the corresponding regression line for Andenes and Zeppelin Observatory (red and green lines, respectively).
Table 1Summary of non-CAO versus CAO values for modal number concentration (N), wind direction, and wind speed. The modal number concentration values are the mean ± SD. The wind direction values are the range of measurements, and the wind speed values are the percentage of time that hourly mean wind speed exceeds 10 m s−1. Additionally, reported for each variable is if the non-CAO and CAO values have a statistically significant difference by a t test.
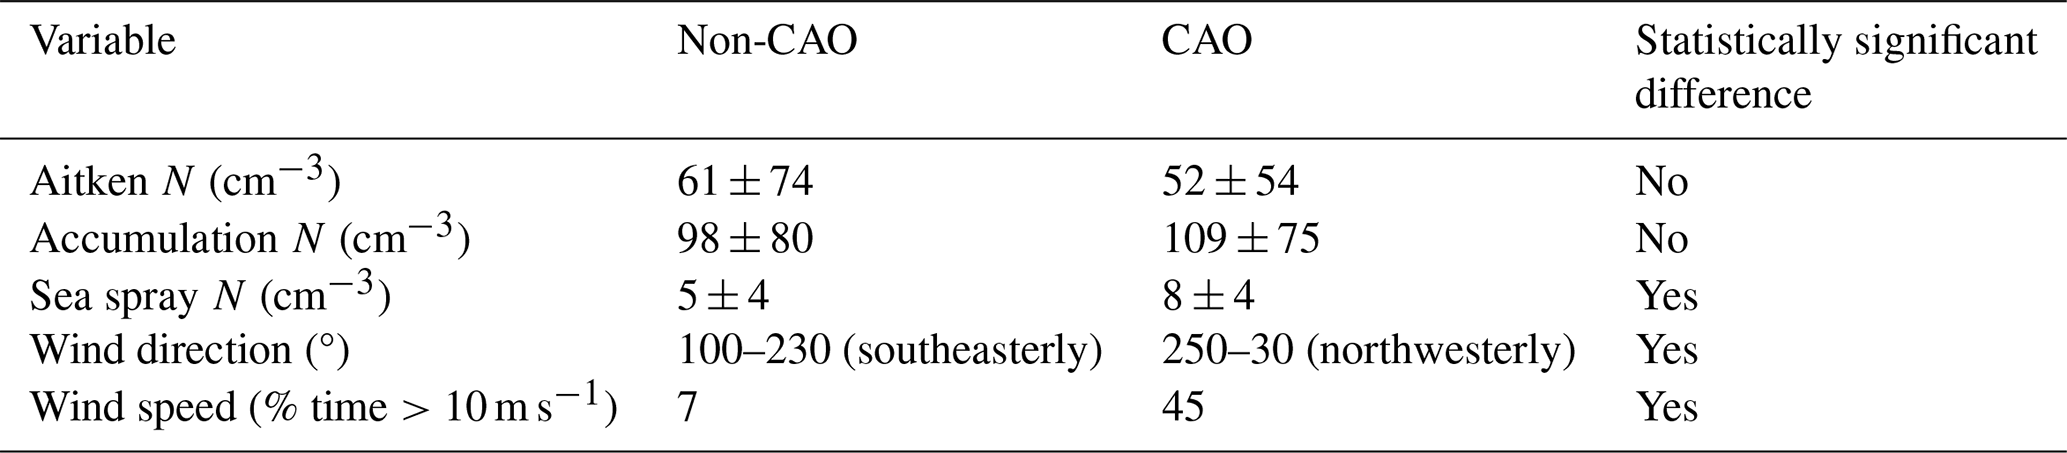
In contrast, the sea spray mode has a statistically significant 71 % higher mean number concentration of 8 ± 4 cm−3 during CAO events compared to non-CAO conditions (Table 1). This is likely associated with stronger over-ocean winds that are typical of CAO events (Kolstad, 2017). During COMBLE, CAO trajectories have generally spent the most recent 15–40 h over the open ocean and arrive at Andenes with sustained winds from the northwest (250–30° defined in Geerts et al., 2022; Fig. 4b, d). Such CAO winds are from nearly the opposite direction of winds typical during non-CAO conditions, which come from over Scandinavia to the south and southeast (100–230°) approximately 70 % of the time (Fig. 4c). Binning the sea-spray-mode number concentration by wind direction (wdir) as either marine (250° 30°, northwesterly) or continental (100° 230°, southeasterly) reveals a mean number concentration of 8±4 cm−3 for marine wind directions and 5±2 cm−3 for continental wind directions. This statistically significant difference associated with wind direction suggests that the observed 71 % increase in the sea-spray-mode number concentration during CAO events is associated with the north-to-westerly direction of the winds.
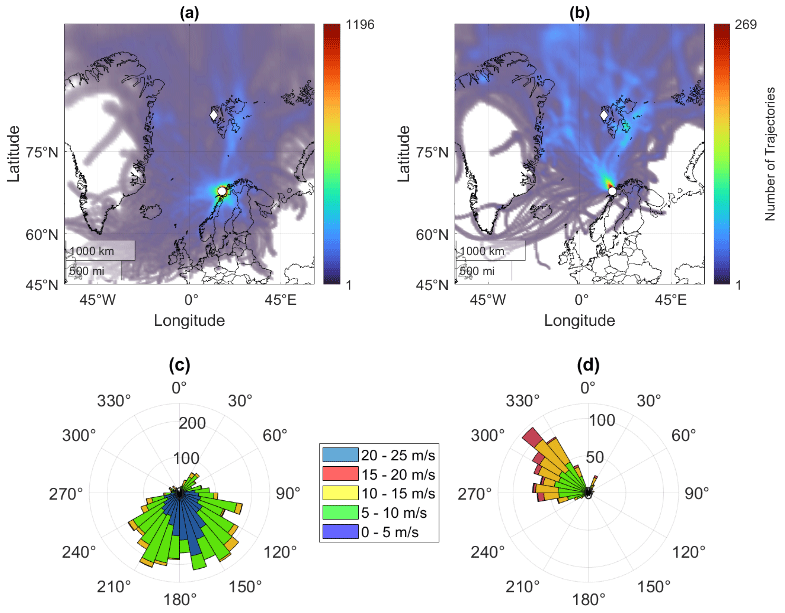
Figure 4(a–b) Density plots of back trajectories in 1° latitude and longitude bins originating at Andenes, Norway, during (a) non-CAO conditions and (b) CAO events. Andenes is marked with a white circle; Zeppelin Observatory is marked with a white diamond. (c–d) Rose histogram plots of wind direction in 10° bins with stacked 5 m s−1 bins of wind speed during (c) non-CAO conditions and (d) CAO events.
More specifically, the higher sea-spray-mode number concentration is likely related to the wind speed, as the sea-spray-mode mass concentration has previously been correlated with wind speed (Monahan, 1968; Russell et al., 2023). Hourly mean wind speed exceeds 10 m s−1 for more than 45 % of the time during CAO events, compared to only 7 % during non-CAO periods (Fig. 4c–d). For CAO events, sea spray number concentration is positively correlated with local wind speed at Andenes (Pearson correlation coefficient ) and at Zeppelin Observatory (; Fig. 3b). The mass concentration of the sea spray mode is also correlated with wind speed at Andenes and at Zeppelin Observatory (r=0.62 and r=0.50, respectively; not shown). For non-CAO conditions at Andenes, the correlations between the sea spray number concentration and wind speed and between the sea spray mass concentration and wind speed are weaker than during CAO events (r=0.38 and r=0.24, respectively; not shown). These relationships show that the higher sea-spray-mode concentration during CAO events co-varies with the higher over-ocean wind speed associated with CAO events.
In regions where the aerosol particle number size distribution has been processed by low clouds, the Hoppel minimum diameter (DHM) provides an indicator of the size of the smallest particles that were activated to and grown by processing as cloud droplets (Hoppel et al., 1986; Krüger et al., 2014; this interpretation of DHM as the minimum diameter activated does not account for cloud processing that is too short to result in particle growth from the Aitken mode). Median DHM during non-CAO conditions is 59 nm (Fig. 5), which falls within the reported range of approximately 50–80 nm for Arctic and marine-influenced aerosol number size distributions (Hoppel et al., 1986; Pernov et al., 2022; Freud et al., 2017; Tunved et al., 2013). During CAO events, the median DHM is 53 nm, which is 6 nm smaller than during non-CAO conditions. This difference is statistically significant and may be attributed to differences in supersaturation driven by meteorological or aerosol microphysical properties (Reutter et al., 2009; Ghan et al., 1998; Chen et al., 2016; Text S1).
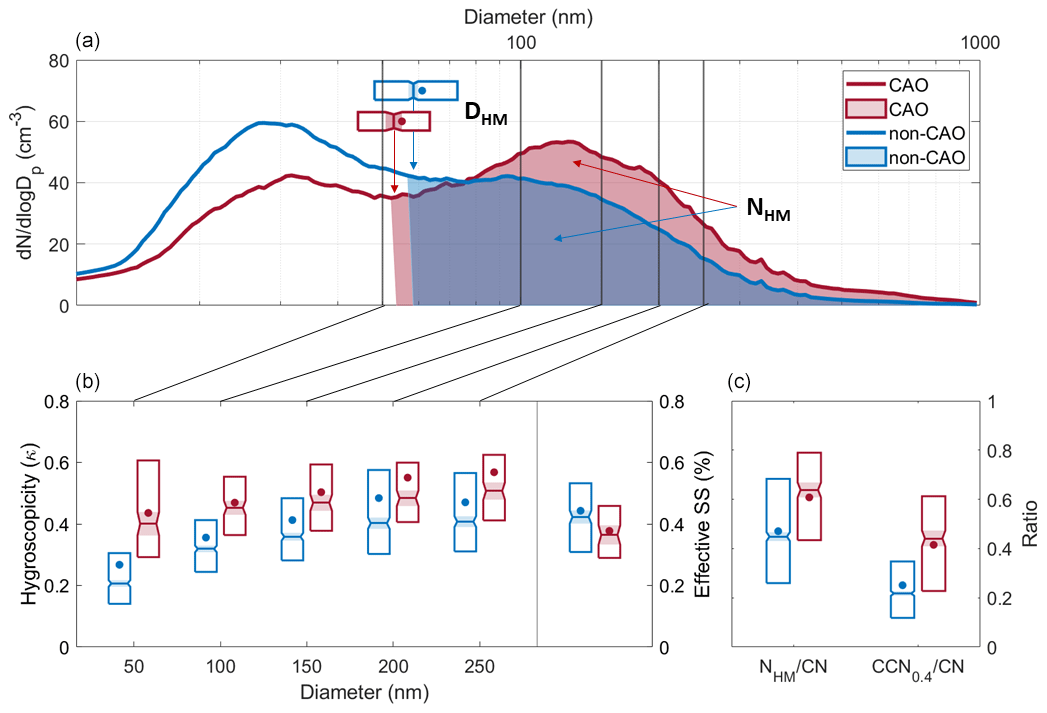
Figure 5(a) The median number size distributions for non-CAO conditions (blue) and CAO events (red), with shaded regions indicating the integrated number concentration above the Hoppel minimum (NHM), with horizontal boxplots of the Hoppel minimum diameter, DHM. Overlaid are (b) boxplots of HTDMA-derived κ at dry particle diameters of 50, 100, 150, 200, and 250 nm and effective supersaturation calculated from DHM and HTDMA-derived κ and (c) boxplots of the ratio of NHM to CN and CCN0.4 to CN. For all boxplots, the notched center line is the median, the lower and upper edges extend to the 75th and 25th percentiles, and the circle marker is the mean.
The median hygroscopicity parameter (κ) at particle diameters between 100 and 250 nm is 0.11±0.02 higher during CAO events compared to non-CAO conditions (Fig. 5). At 50 nm, however, the median κ is 0.2 higher during CAO events with a value of 0.4. A diameter of 50 nm falls at the 43rd percentile of DHM during CAO events and at the 31st percentile of DHM during non-CAO conditions, implying that more particles at 50 nm may be cloud processed during CAO events. The enhanced hygroscopicity at this diameter could indicate a contribution from sulfate (κ=0.84, Sanchez et al., 2018) added to activated particles during cloud processing (Crumeyrolle et al., 2008) or from differences in particle sources and transport patterns.
The diameter of the smallest particle activated is determined by the highest critical supersaturation for a given aerosol composition, making DHM an indicator of the effective supersaturation in clouds that persisted long enough for processing to cause growth. If the aerosol chemical composition and by consequence its hygroscopicity, represented by κ, were the same between CAO events and non-CAO conditions, then the smaller DHM observed during CAO events would imply a higher effective supersaturation during CAO events (Fig. 6). However, if DHM was the same between CAO events and non-CAO conditions, then the higher κ observed during CAO events would imply a lower effective supersaturation during CAO events (Fig. 6). There is a statistically significant lower median effective supersaturation of 0.37 % during CAO events compared to a median of 0.41 % during non-CAO conditions (Fig. 5). Interestingly, this suggests that for the range of DHM and κ observed during the CAO events, the higher hygroscopicity (κ) has a larger effect on supersaturation than the smaller particle size (DHM), resulting in the observed lower effective supersaturation during CAO events compared to during non-CAO conditions (Text S2).
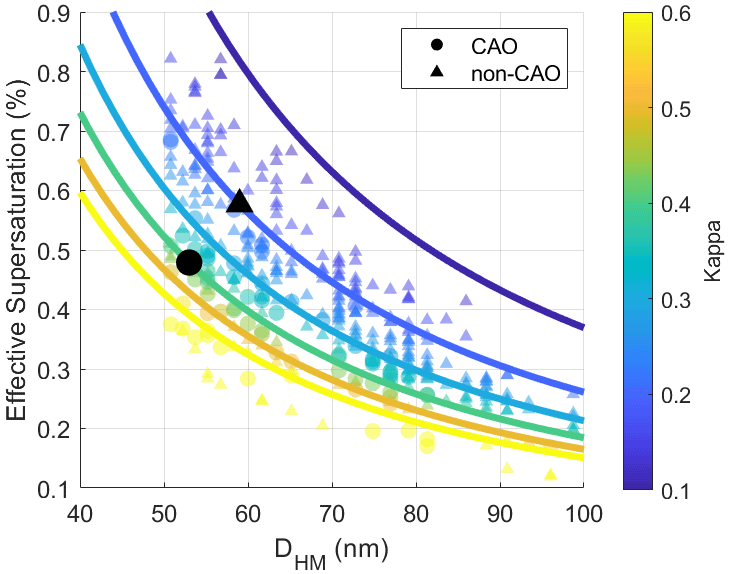
Figure 6Scatter plot of effective supersaturation against DHM colored by hygroscopicity (κ). Measurements during CAO events are represented by the circles, and measurements during non-CAO conditions are represented by the triangles. Overlaid are lines of constant hygroscopicity (κ) at intervals of 0.1 between 0.1 and 0.6, as described by the relationship between supersaturation, diameter, and κ given in Petters and Kreidenweis (2007). In black are the points corresponding to the median DHM and median hygroscopicity (κ) at 50 nm for CAO events and non-CAO conditions. Measurements for DHM < 50 nm are omitted since there are no HTDMA-derived κ measurements below this size.
The mean number of particles that were activated and processed by clouds, represented by the integrated number concentration above DHM (designated as NHM), is 109 ± 61 cm−3 during CAO events with no statistically significant difference from its mean of 99±66 cm−3 during non-CAO conditions. There is a strong and significant positive correlation (r=0.83; p<0.05) between NHM and CCN at 0.4 % supersaturation (CCN0.4) during COMBLE (Fig. 7a). This is in agreement with the calculated effective supersaturation mean of 0.42 % during COMBLE. The effective supersaturation is correlated (r=0.6) with NHM−CCN0.4, where positive values of NHM−CCN0.4 represent effective supersaturations above 0.4 %, and negative values represent effective supersaturations below 0.4 % (Fig. 7b). The mean CCN0.4 is 90±50 cm−3 during CAO events, which is within the reported range of approximately 35–176 cm−3 for mean CCN concentrations measured in the Arctic at 0.3 %–0.5 % supersaturation (Table S2; Jung et al., 2018; Paramonov et al., 2015; Moore et al., 2011, 2018; Lathem et al., 2013; Zábori et al., 2015; Martin et al., 2011; Massling et al., 2023; Duplessis et al., 2024).
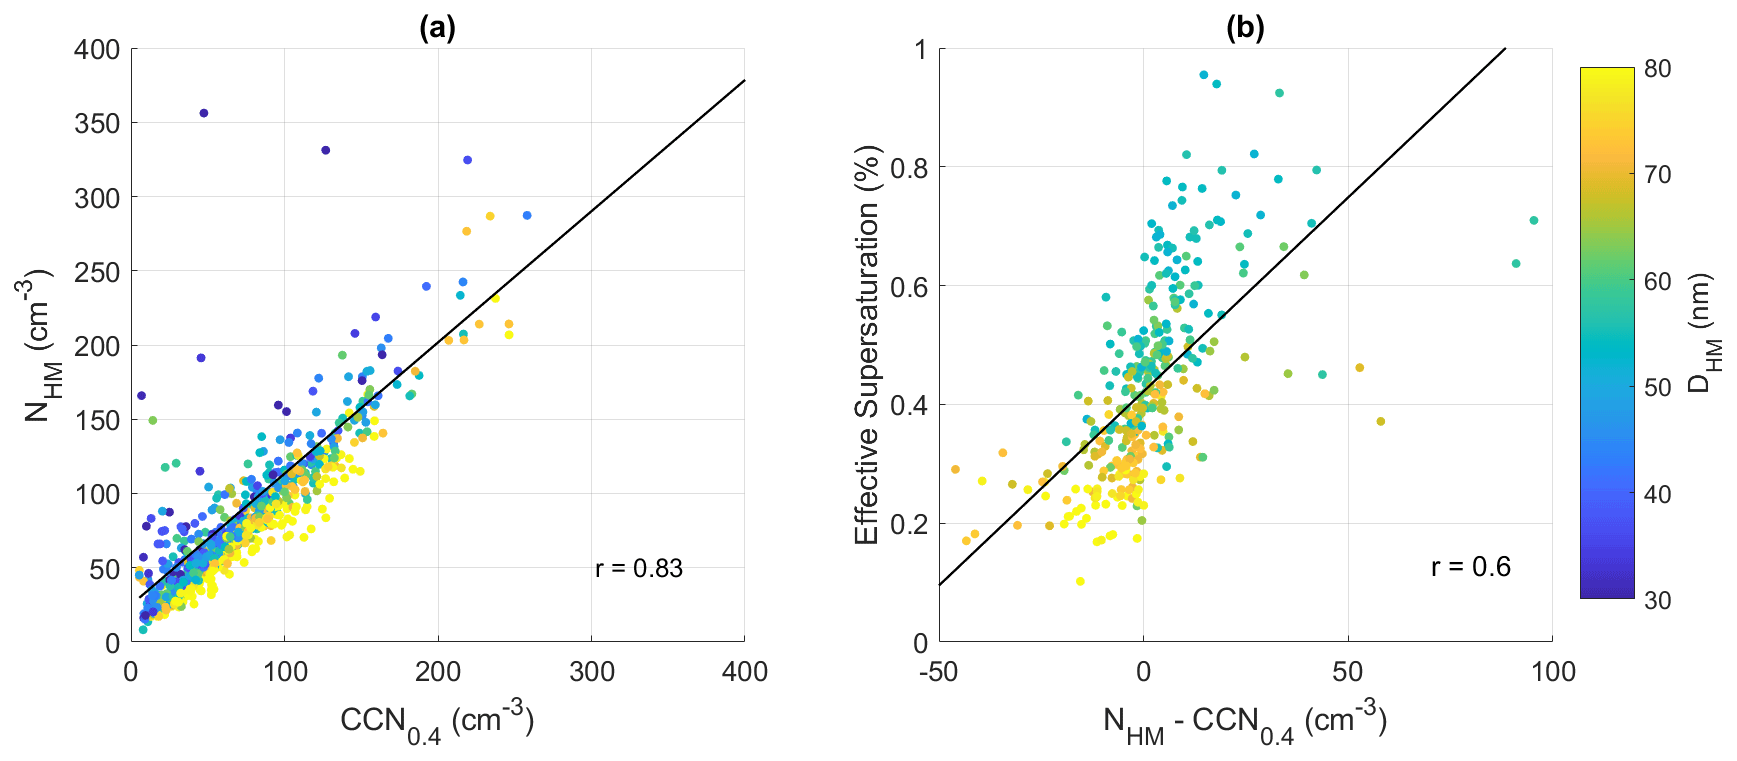
Figure 7(a) Scatter plot of NHM against CCN0.4. (b) Scatter plot of effective supersaturation (calculated with DHM and HTDMA-derived κ for points with DHM > 50 nm) against the difference between NHM and CCN at 0.4 % supersaturation and colored by DHM. For both plots, the corresponding linear regression lines are shown in solid black.
CAO events are associated with cleaner condensation nuclei (CN) concentrations, with a mean of 218±134 cm−3, which is lower with statistical significance than the mean of 311±234 cm−3 during non-CAO conditions. As a consequence of similar NHM concentrations between CAO events and non-CAO conditions and lower CN concentrations during CAO events, the mean ratio is 0.61±0.25 during CAO events, which is greater with statistical significance than the mean of 0.47±0.26 during non-CAO conditions (Fig. 5). Given the assumption that all NHM values are activated to cloud droplets, an approximately 15 % higher fraction of ambient CN activates during CAO conditions. The range of shown in Fig. 5 falls within reported ratios of , which varied between approximately 0.1 and 0.9 for CCN at 0.3 %–0.5 % supersaturation at high latitudes (Jung et al., 2018; Moore et al., 2011; Paramonov et al., 2015; Zábori et al., 2015; Lathem et al., 2013).
To characterize aerosol changes along CAO trajectories, we compared pairs of particle number size distributions measured upwind at Zeppelin Observatory and downwind at Andenes for 15 CAO trajectories that passed within 200 km of Zeppelin Observatory during eight CAO events at Andenes (Fig. 1; Table S1). The mean and standard deviation of the change in the aerosol particle number size distribution from upwind to downwind sites are shown in Fig. 8. The largest change in d occurs within the accumulation-mode size range, with a mean decrease of 203 cm−3 at a diameter of 142 nm. The number concentrations retrieved from the fitted accumulation modes of the upwind and downwind size distributions are used to show a mean accumulation-mode total number concentration decrease of 93±95 cm−3. This change is larger than previous reports of total aerosol number concentration decreases observed in three CAO cases (Abel et al., 2017; Lloyd et al., 2018; Sanchez et al., 2022).
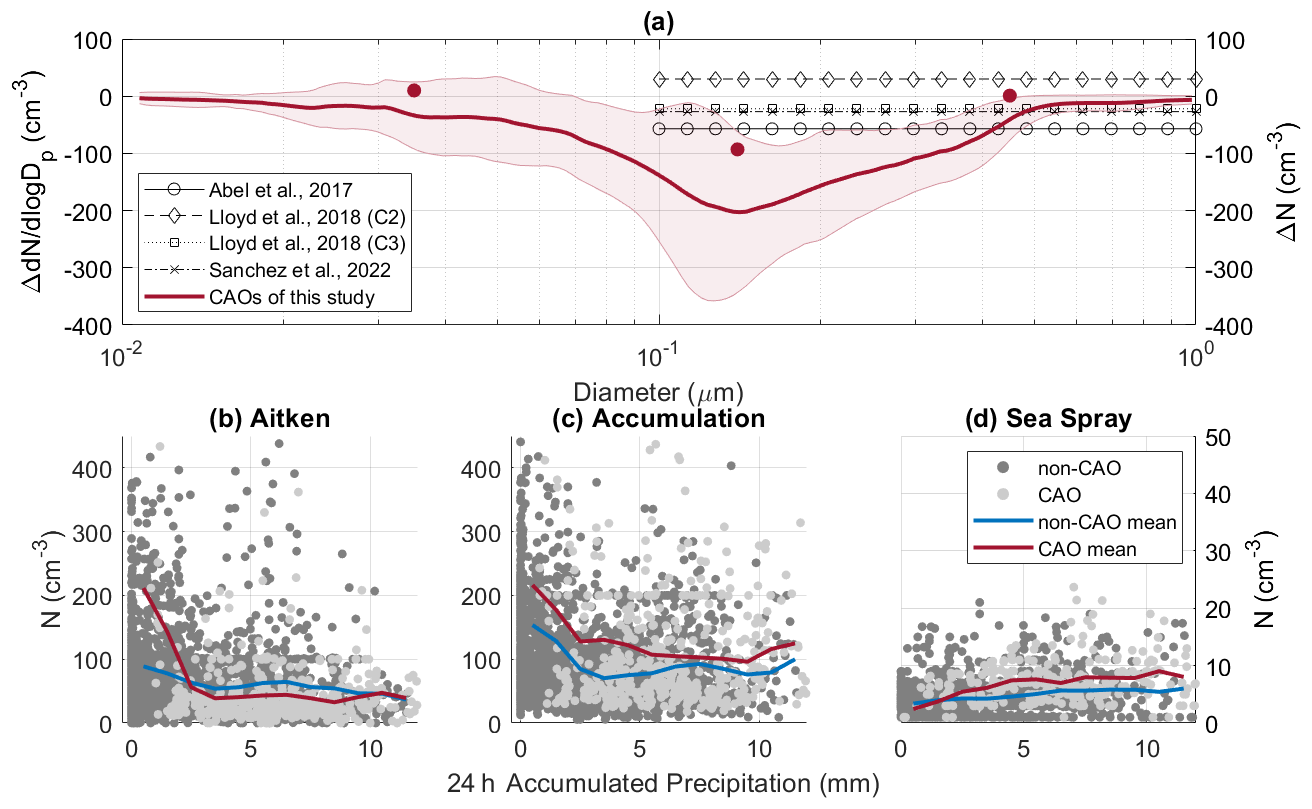
Figure 8(a) Left axis: the solid red line represents the mean, and the red-shaded area represents the standard deviation of the change in the aerosol particle number size distribution from the upwind Zeppelin Observatory site to the downwind Andenes site for the 15 CAO trajectories of this study (Fig. S3, Table S1). Right axis: the red dots represent the mean change in total aerosol number concentration for each fitted mode, the Aitken, accumulation, and sea spray modes from left to right, for the 15 CAO trajectories of this study. Overlaid in black lines with markers are the mean changes in total aerosol number concentration reported for the case of Abel et al. (2017), cases two and three of Lloyd et al. (2018), and the closed- to open-cell case of Sanchez et al. (2022). These studies measured the total number concentration of aerosol particles with diameters between 0.1 and 3.0 µm and reported the change in total aerosol number concentration from upwind to downwind sites along CAO trajectories. (b–d) Scatter plots of Aitken-, accumulation-, and sea-spray-mode number concentration against precipitation accumulated within the previous 24 h at Andenes (with values above 12 mm h−1, representing 1 % of measurements, not shown). The mean number concentration in 1 mm precipitation bins is overlaid for both non-CAO (blue) and CAO (red) periods. Panels (b–c) are plotted on the left-axis scale, and (d) is plotted on the right-axis scale.
We attribute the majority of the observed decrease in accumulation-mode particles during the CAO events to precipitation scavenging, since carbon monoxide (CO) concentration along trajectories decreased by only 7.3 % at the 75th percentile compared to an accumulation number decrease of 71.8 % at the 75th percentile. The larger decrease in accumulation-mode particles than in CO concentrations supports the attribution of losses in aerosol number to precipitation since CO is typically conserved during precipitation (e.g., Garrett et al., 2010; Dadashazar et al., 2021). However, boundary layer growth in CAO cases can introduce uncertainty in this estimation. Of the 15 CAO trajectories identified here, one case shows an increase in accumulation-mode number, similar to the second case of Lloyd et al. (2018), which could result from higher concentrations entrained from aloft, from changes in wind direction, or from differences in upwind sources.
Since the removal of aerosol particles has been linked to precipitation that occurs locally at a specific site in addition to along a calculated trajectory (Khadir et al., 2023; Tunved et al., 2013), we also examined the relationship of aerosol number concentration to local precipitation accumulated within the previous 24 h at Andenes during CAO events (Fig. 8b–d). Mean accumulation-mode number concentration during CAO events is 117±70 cm−3 for accumulated precipitation above 10 mm, which is 46 % lower than the mean of 216±23 cm−3 for accumulated precipitation below 1 mm. This decreasing trend with precipitation is consistent with the decrease in number concentration seen along trajectories, although it cannot account for potential influences from precipitation phase, intensity, duration, or spatial heterogeneity.
The mean number change along trajectories for particle sizes within the Aitken mode is relatively small (10±26 cm−3), with the standard deviation indicating cases of both increases and decreases in number concentration (Fig. 8a). At Andenes, the mean Aitken-mode number concentration during CAO events is 211±93 cm−3 for accumulated precipitation below 1 mm and 43±29 cm−3 for accumulated precipitation above 10 mm (Fig. 8b). Prior studies have observed both an increase and a decrease in the number concentration of Aitken-mode particles with precipitation accumulated along air mass trajectories (Khadir et al., 2023; Tunved et al., 2013). During rapid boundary layer growth under CAO conditions, entrainment is also likely to play a role (Tornow et al., 2022).
For the sea spray mode, there is a small mean number increase of 1±6 cm−3 along CAO trajectories from Zeppelin Observatory to Andenes (Fig. 8a). At Andenes, the mean sea-spray-mode number concentration during CAO events is 3±2 cm−3 for accumulated precipitation below 1 mm and 8±3 cm−3 for accumulated precipitation above 10 mm (Fig. 8d). Such observed increases, both locally and along trajectories, likely result from the co-occurrence of higher winds and higher probability of precipitation, leading to the counteracting effects of sea spray particle production from over-ocean winds and their removal by precipitation. Local wind speed at Andenes is positively correlated with 24 h accumulated precipitation (r=0.37, p<0.05; not shown), supporting the explanation that time periods with greater accumulated precipitation are associated with higher wind speeds and thus higher sea spray aerosol production.
The findings of this study show distinct aerosol number size distributions associated with CAO events in the Norwegian Arctic based on observations at Andenes, Norway, and Zeppelin Observatory in Svalbard for 49 CAO events that occur at Andenes and 8 CAO events that have air mass trajectories between Andenes and Zeppelin Observatory. During CAO events, aerosol number size distributions are characterized by three modes and have a statistically significant 71 % higher sea-spray-mode number concentration than during non-CAO conditions that is strongly correlated with the occurrence of higher over-ocean wind speeds. The mean Hoppel minimum diameter (DHM) is 6 nm smaller during CAO events, but the higher hygroscopicity implies a lower supersaturation than during non-CAO conditions. While the integrated particle number concentration above the Hoppel minimum (NHM) and CCN are similar between CAO events and non-CAO conditions, the ratio of is approximately 15 % higher with a mean of 0.61±0.25 during CAO events due to lower CN concentrations. Along CAO trajectories, particles in the accumulation mode experience the largest change in number concentration with a mean decrease of 93 ± 95 cm−3, likely associated with precipitation scavenging.
Observations of Arctic aerosol associated with CAO events are extremely limited (e.g., Abel et al., 2017; Lloyd et al., 2018; Sanchez et al., 2022). The analysis presented here demonstrates clear differences in the aerosol properties associated with CAO events compared to non-CAO conditions and adds eight CAO events for which upwind and downwind size-resolved aerosol concentrations have been evaluated against the four CAO events previously reported (Abel et al., 2017; Lloyd et al., 2018; Sanchez et al., 2022). These results provide modeling studies with representative aerosol properties that are relevant for prescribing cloud droplet number concentrations in models, to which CAO simulations are particularly sensitive (de Roode et al., 2019). Incorporating the observation-based aerosol properties of this study into future modeling work (e.g., Tornow et al., 2021) provides an important step towards simulating CAO processes more accurately.
COMBLE measurements are publicly available from the ARM data discovery at https://doi.org/10.5439/1409033 (Uin et al., 2019b), https://doi.org/10.5439/1476898 (Kuang et al., 2019), https://doi.org/10.5439/1352536 (Koontz et al., 2019a), https://doi.org/10.5439/1095581 (Uin et al., 2020), https://doi.org/10.5439/1323892 (Koontz et al., 2019b), https://doi.org/10.5439/1250819 (Koontz et al., 2019c), https://doi.org/10.5439/1984920 (Kyrouac et al., 2019b), and https://doi.org/10.5439/1393437 (Johnson et al., 2023), and Zeppelin Observatory measurements are publicly available from the EBAS data portal at https://doi.org/10.17616/R39W8K (Norwegian Institute for Air Research (NILU), 2024). Codes for the lognormal mode and Hoppel minimum retrievals used here are available from the UCSD digital archives (https://doi.org/10.6075/J0CN7432, Dedrick et al., 2023; https://doi.org/10.6075/J0GT5NCR, Dedrick et al., 2022b).
The supplement related to this article is available online at: https://doi.org/10.5194/acp-24-11791-2024-supplement.
ASW performed the formal analysis and wrote the original draft of the manuscript. JLD, FT, IS, BS, PD, PZ, and RK contributed to the data collection, processing, and/or analysis. LMR and AF developed the conceptualization of this work in addition to providing supervision and funding acquisition. All authors contributed to the review and editing of the paper.
At least one of the (co-)authors is a member of the editorial board of Atmospheric Chemistry and Physics. The peer-review process was guided by an independent editor, and the authors also have no other competing interests to declare.
Publisher’s note: Copernicus Publications remains neutral with regard to jurisdictional claims made in the text, published maps, institutional affiliations, or any other geographical representation in this paper. While Copernicus Publications makes every effort to include appropriate place names, the final responsibility lies with the authors.
We thank Bart Geerts and Christian Lackner for their contributions through their work on the identification of CAO events at Andenes during COMBLE. We thank the staff from the Norwegian Polar Institute (NPI) for their on-site support and substantial long-term support in maintaining the measurements at Zeppelin Observatory.
This work was supported by the Department of Energy Atmospheric System Research (grant no. DE-SC0021983). The aerosol observations at the Zeppelin station have been supported by the KAW Stiftelse (grant no. 2016.0024), the Swedish Environmental Protection agency (Naturvårdsverket), and the ACTRIS Sweden project supported by the Swedish Research Council and the European Union's Horizon 2020 research and innovation program under grant no. 821205 (FORCeS).
This paper was edited by Birgit Wehner and reviewed by two anonymous referees.
Abel, S. J., Boutle, I. A., Waite, K., Fox, S., Brown, P. R., Cotton, R., Lloyd, G., Choularton, T. W., and Bower, K. N.: The Role of Precipitation in Controlling the Transition from Stratocumulus to Cumulus Clouds in a Northern Hemisphere Cold-Air Outbreak, J. Atmos. Sci., 74, 2293–2314, https://doi.org/10.1175/JAS-D-16-0362.1, 2017. a, b, c, d, e, f, g, h
Adachi, K., Tobo, Y., Koike, M., Freitas, G., Zieger, P., and Krejci, R.: Composition and mixing state of Arctic aerosol and cloud residual particles from long-term single-particle observations at Zeppelin Observatory, Svalbard, Atmos. Chem. Phys., 22, 14421–14439, https://doi.org/10.5194/acp-22-14421-2022, 2022. a
Ahn, S. H., Yoon, Y., Choi, T., Lee, J., Kim, Y., Lee, B., Ritter, C., Aas, W., Krejci, R., Ström, J., Tunved, P., and Jung, C. H.: Relationship between cloud condensation nuclei (CCN) concentration and aerosol optical depth in the Arctic region, Atmos. Environ., 267, 118748, https://doi.org/10.1016/j.atmosenv.2021.118748, 2021. a, b
Bigg, E. K.: Ice forming nuclei in the high Arctic, Tellus B, 48, 223–233, https://doi.org/10.3402/tellusb.v48i2.15888, 1996. a
Brümmer, B.: Roll and Cell Convection in Wintertime Arctic Cold-Air Outbreaks, J. Atmos. Sci., 56, 2613–2636, https://doi.org/10.1175/1520-0469(1999)056<2613:RACCIW>2.0.CO;2, 1999. a
Bulatovic, I., Igel, A. L., Leck, C., Heintzenberg, J., Riipinen, I., and Ekman, A. M. L.: The importance of Aitken mode aerosol particles for cloud sustenance in the summertime high Arctic – a simulation study supported by observational data, Atmos. Chem. Phys., 21, 3871–3897, https://doi.org/10.5194/acp-21-3871-2021, 2021. a
Bullard, R. L., Kuang, C., Uin, J., Smith, S., and Springston, S. R.: Aerosol Inlet Characterization Experiment Report, U.S. Department of Energy Office of Scientific and Technical Information, https://doi.org/10.2172/1355300, 2017. a
Chen, J., Liu, Y., Zhang, M., and Peng, Y.: New understanding and quantification of the regime dependence of aerosol-cloud interaction for studying aerosol indirect effects, Geophys. Res. Lett., 43, 1780–1787, https://doi.org/10.1002/2016GL067683, 2016. a
Croft, B., Martin, R. V., Leaitch, W. R., Tunved, P., Breider, T. J., D'Andrea, S. D., and Pierce, J. R.: Processes controlling the annual cycle of Arctic aerosol number and size distributions, Atmos. Chem. Phys., 16, 3665–3682, https://doi.org/10.5194/acp-16-3665-2016, 2016. a, b, c, d
Crumeyrolle, S., Gomes, L., Tulet, P., Matsuki, A., Schwarzenboeck, A., and Crahan, K.: Increase of the aerosol hygroscopicity by cloud processing in a mesoscale convective system: a case study from the AMMA campaign, Atmos. Chem. Phys., 8, 6907–6924, https://doi.org/10.5194/acp-8-6907-2008, 2008. a
Dadashazar, H., Alipanah, M., Hilario, M. R. A., Crosbie, E., Kirschler, S., Liu, H., Moore, R. H., Peters, A. J., Scarino, A. J., Shook, M., Thornhill, K. L., Voigt, C., Wang, H., Winstead, E., Zhang, B., Ziemba, L., and Sorooshian, A.: Aerosol responses to precipitation along North American air trajectories arriving at Bermuda, Atmos. Chem. Phys., 21, 16121–16141, https://doi.org/10.5194/acp-21-16121-2021, 2021. a
Dall´osto, M., Beddows, D. C. S., Tunved, P., Krejci, R., Ström, J., Hansson, H.-C., Yoon, Y. J., Park, K.-T., Becagli, S., Udisti, R., Onasch, T., O'Dowd, C. D., Simó, R., and Harrison, R. M.: Arctic sea ice melt leads to atmospheric new particle formation, Sci. Rep., 7, 3318, https://doi.org/10.1038/s41598-017-03328-1. a
de Roode, S. R., Frederikse, T., Siebesma, A. P., Ackerman, A. S., Chylik, J., Field, P. R., Fricke, J., Gryschka, M., Hill, A., Honnert, R., Krueger, S. K., Lac, C., Lesage, A. T., and Tomassini, L.: Turbulent Transport in the Gray Zone: A Large Eddy Model Intercomparison Study of the CONSTRAIN Cold Air Outbreak Case, J. Adv. Model. Earth Sy., 11, 597–623, https://doi.org/10.1029/2018MS001443, 2019. a
Dedrick, J. L., Saliba, G., Williams, A. S., Russell, L. M., and Lubin, D.: Retrieval of the sea spray aerosol mode from submicron particle size distributions and supermicron scattering during LASIC, Atmos. Meas. Tech., 15, 4171–4194, https://doi.org/10.5194/amt-15-4171-2022, 2022a. a, b, c, d, e, f
Dedrick, J. L., Saliba, G., Williams, A. S., Russell, L. M., and Lubin, D.: Data from: Retrival of the Sea Spray Aerosol MOde from Submicron Particle Size Distributions and Supermicron Scattering during LASIC, Library Digital Collections [code], https://doi.org/10.6075/J0GT5NCR, 2022b. a
Dedrick, J. L., Russell, L. M., III, A. J. S., Kuang, C., Zawadowicz, M. A., and Lubin, D.: Data from: Aerosol-Limited Effects on Cloud Condensation Nuclei in Clean Conditions in the Tropical South Atlantic Boundary Layer during LASIC, Library Digital Collections [code], https://doi.org/10.6075/J0CN7432, 2023. a
Dedrick, J. L., Russell, L. M., Sedlacek III, A. J., Kuang, C., Zawadowicz, M. A., and Lubin, D.: Aerosol-Correlated Cloud Activation for Clean Conditions in the Tropical Atlantic Boundary Layer During LASIC, Geophys. Res. Lett., 51, e2023GL105798, https://doi.org/10.1029/2023GL105798, 2024. a
Duplessis, P., Karlsson, L., Baccarini, A., Wheeler, M., Leaitch, W. R., Svenningsson, B., Leck, C., Schmale, J., Zieger, P., and Chang, R. Y.-W.: Highly Hygroscopic Aerosols Facilitate Summer and Early-Autumn Cloud Formation at Extremely Low Concentrations Over the Central Arctic Ocean, J. Geophys. Res.-Atmos., 129, e2023JD039159, https://doi.org/10.1029/2023JD039159, 2024. a
Field, P. R., Cotton, R. J., Mcbeath, K., Lock, A. P., Webster, S., and Allan, R. P.: Improving a convection-permitting model simulation of a cold air outbreak, Q. J. Roy. Meteor. Soc., 140, 124–138, https://doi.org/10.1002/QJ.2116, 2014. a
Field, P. R., Broz̆ková, R., Chen, M., Dudhia, J., Lac, C., Hara, T., Honnert, R., Olson, J., Siebesma, P., de Roode, S., Tomassini, L., Hill, A., and McTaggart-Cowan, R.: Exploring the convective grey zone with regional simulations of a cold air outbreak, Q. J. Roy. Meteor. Soc., 143, 2537–2555, https://doi.org/10.1002/qj.3105, 2017. a
Freud, E., Krejci, R., Tunved, P., Leaitch, R., Nguyen, Q. T., Massling, A., Skov, H., and Barrie, L.: Pan-Arctic aerosol number size distributions: seasonality and transport patterns, Atmos. Chem. Phys., 17, 8101–8128, https://doi.org/10.5194/acp-17-8101-2017, 2017. a, b, c, d, e, f, g
Frossard, A. A., Russell, L. M., Burrows, S. M., Elliott, S. M., Bates, T. S., and Quinn, P. K.: Sources and composition of submicron organic mass in marine aerosol particles, J. Geophys. Res.-Atmos., 119, 12977–13003, https://doi.org/10.1002/2014JD021913, 2014. a
Garrett, T. J., Zhao, C., and Novelli, P. C.: Assessing the relative contributions of transport efficiency and scavenging to seasonal variability in Arctic aerosol, Tellus B, 62, 190–196, https://doi.org/10.1111/J.1600-0889.2010.00453.X, 2010. a
Geerts, B., Giangrande, S. E., McFarquhar, G. M., Xue, L., Abel, S. J., Comstock, J. M., Crewell, S., DeMott, P. J., Ebell, K., Field, P., Hill, T. C. J., Hunzinger, A., Jensen, M. P., Johnson, K. L., Juliano, T. W., Kollias, P., Kosovic, B., Lackner, C., Luke, E., Lüpkes, C., Matthews, A. A., Neggers, R., Ovchinnikov, M., Powers, H., Shupe, M. D., Spengler, T., Swanson, B. E., Tjernström, M., Theisen, A. K., Wales, N. A., Wang, Y., Wendisch, M., and Wu, P.: The COMBLE Campaign: A Study of Marine Boundary Layer Clouds in Arctic Cold-Air Outbreaks, B. Am. Meteorol. Soc., 103, E1371–E1389, https://doi.org/10.1175/BAMS-D-21-0044.1, 2022. a, b, c, d, e
Ghan, S. J., Guzman, G., and Abdul-Razzak, H.: Competition between Sea Salt and Sulfate Particles as Cloud Condensation Nuclei, J. Atmos. Sci., 55, 3340–3347, https://doi.org/10.1175/1520-0469(1998)055<3340:CBSSAS>2.0.CO;2, 1998. a
Herenz, P., Wex, H., Henning, S., Kristensen, T. B., Rubach, F., Roth, A., Borrmann, S., Bozem, H., Schulz, H., and Stratmann, F.: Measurements of aerosol and CCN properties in the Mackenzie River delta (Canadian Arctic) during spring–summer transition in May 2014, Atmos. Chem. Phys., 18, 4477–4496, https://doi.org/10.5194/acp-18-4477-2018, 2018. a
Hersbach, H., Bell, B., Berrisford, P., Hirahara, S., Horányi, A., Muñoz-Sabater, J., Nicolas, J., Peubey, C., Radu, R., Schepers, D., Simmons, A., Soci, C., Abdalla, S., Abellan, X., Balsamo, G., Bechtold, P., Biavati, G., Bidlot, J., Bonavita, M., De Chiara, G., Dahlgren, P., Dee, D., Diamantakis, M., Dragani, R., Flemming, J., Forbes, R., Fuentes, M., Geer, A., Haimberger, L., Healy, S., Hogan, R. J., Hólm, E., Janisková, M., Keeley, S., Laloyaux, P., Lopez, P., Lupu, C., Radnoti, G., de Rosnay, P., Rozum, I., Vamborg, F., Villaume, S., and Thépaut, J.-N.: The ERA5 global reanalysis, Q. J. Roy. Meteor. Soc., 146, 1999–2049, https://doi.org/10.1002/qj.3803, 2020. a
Hoppel, W. A., Frick, G. M., and Larson, R. E.: Effect of nonprecipitating clouds on the aerosol size distribution in the marine boundary layer, Geophys. Res. Lett., 13, 125–128, https://doi.org/10.1029/GL013i002p00125, 1986. a, b, c
Isokääntä, S., Kim, P., Mikkonen, S., Kühn, T., Kokkola, H., Yli-Juuti, T., Heikkinen, L., Luoma, K., Petäjä, T., Kipling, Z., Partridge, D., and Virtanen, A.: The effect of clouds and precipitation on the aerosol concentrations and composition in a boreal forest environment, Atmos. Chem. Phys., 22, 11823–11843, https://doi.org/10.5194/acp-22-11823-2022, 2022. a, b
Johnson, K., Giangrande, S., and Toto, T.: Active Remote Sensing of CLouds (ARSCL) product using Ka-band ARM Zenith Radars (ARSCLKAZR1KOLLIAS), ARM [data set], https://doi.org/10.5439/1393437, 2023. a
Jung, C. H., Yoon, Y. J., Kang, H. J., Gim, Y., Lee, B. Y., Ström, J., Krejci, R., and Tunved, P.: The seasonal characteristics of cloud condensation nuclei (CCN) in the arctic lower troposphere, Tellus B, 70, 1–13, https://doi.org/10.1080/16000889.2018.1513291, 2018. a, b, c
Karlsson, L., Krejci, R., Koike, M., Ebell, K., and Zieger, P.: A long-term study of cloud residuals from low-level Arctic clouds, Atmos. Chem. Phys., 21, 8933–8959, https://doi.org/10.5194/acp-21-8933-2021, 2021. a
Karlsson, L., Baccarini, A., Duplessis, P., Baumgardner, D., Brooks, I. M., Chang, R. Y.-W., Dada, L., Dällenbach, K. R., Heikkinen, L., Krejci, R., Leaitch, W. R., Leck, C., Partridge, D. G., Salter, M. E., Wernli, H., Wheeler, M. J., Schmale, J., and Zieger, P.: Physical and Chemical Properties of Cloud Droplet Residuals and Aerosol Particles During the Arctic Ocean 2018 Expedition, J. Geophys. Res.-Atmos., 127, e2021JD036383, https://doi.org/10.1029/2021JD036383, 2022. a
Khadir, T., Riipinen, I., Talvinen, S., Heslin-Rees, D., Pöhlker, C., Rizzo, L., Machado, L. A. T., Franco, M. A., Kremper, L. A., Artaxo, P., Petäjä, T., Kulmala, M., Tunved, P., Ekman, A. M. L., Krejci, R., and Virtanen, A.: Sink, Source or Something In-Between? Net Effects of Precipitation on Aerosol Particle Populations, Geophys. Res. Lett., 50, e2023GL104325, https://doi.org/10.1029/2023GL104325, 2023. a, b
Khlystov, A., Stanier, C., and Pandis, S. N.: An Algorithm for Combining Electrical Mobility and Aerodynamic Size Distributions Data when Measuring Ambient Aerosol Special Issue of Aerosol Science and Technology on Findings from the Fine Particulate Matter Supersites Program, Aerosol Sci. Tech., 38, 229–238, https://doi.org/10.1080/02786820390229543, 2004. a
Koike, M., Ukita, J., Ström, J., Tunved, P., Shiobara, M., Vitale, V., Lupi, A., Baumgardner, D., Ritter, C., Hermansen, O., Yamada, K., and Pedersen, C. A.: Year-Round In Situ Measurements of Arctic Low-Level Clouds: Microphysical Properties and Their Relationships With Aerosols, J. Geophys. Res.-Atmos., 124, 1798–1822, https://doi.org/10.1029/2018JD029802, 2019. a
Kolstad, E. W.: Higher ocean wind speeds during marine cold air outbreaks, Q. J. Roy. Meteor. Soc., 143, 2084–2092, https://doi.org/10.1002/QJ.3068, 2017. a
Koontz, A., Kuang, C., Andrews, E., Hayes, C., Singh, A., and Salwen., C.: Condensation Particle Counter, ARM Mobile Facility (ANX) Andenes, Norway, ARM Data Center [dataset], https://doi.org/10.5439/1352536, 2019a.
Koontz, A., Uin, J., Andrews, E., Enekwizu, O., Hayes, C., and Salwen, C.: Cloud Condensation Nuclei Particle Counter, ARM Mobile Facility (ANX) Andenes, Norway, ARM Data Center [data set], https://doi.org/10.5439/1323892, 2019b.
Koontz, A., Springston, S., and Trojanowski, R.: Carbon Monoxide Analyzer, ARM Mobile Facility (ANX) Andenes, Norway, ARM Data Center [data set], https://doi.org/10.5439/1250819, 2019c.
Krüger, M. L., Mertes, S., Klimach, T., Cheng, Y. F., Su, H., Schneider, J., Andreae, M. O., Pöschl, U., and Rose, D.: Assessment of cloud supersaturation by size-resolved aerosol particle and cloud condensation nuclei (CCN) measurements, Atmos. Meas. Tech., 7, 2615–2629, https://doi.org/10.5194/amt-7-2615-2014, 2014. a
Kuang, C.: Scanning Mobility Particle Spectrometer Instrument Handbook, U.S. Department of Energy Office of Scientific and Technical Information, https://doi.org/10.2172/1245993, 2016a. a, b
Kuang, C.: Condensation Particle Counter (CPC) Instrument Handbook, U.S. Department of Energy Office of Scientific and Technical Information, https://doi.org/10.2172/1245983, 2016b. a
Kuang, C., Singh, A., Howie, J., Salwen, C., and Hayes, C.: Scanning mobility particle sizer, ARM Mobile Facility (ANX) Andenes, Norway, ARM Data Center [data set], https://doi.org/10.5439/1476898, 2019.
Kyrouac, J.: Aerosol Observing System Surface Meteorology (AOSMET) Instrument Handbook, U.S. Department of Energy Office of Scientific and Technical Information, https://doi.org/10.2172/1573797, 2019. a
Kyrouac, J., Springston, S., and Tuftedal, M.: Meteorological Measurements associated with the Aerosol Observing System, ARM Mobile Facility (ANX) Andenes, Norway, ARM Data Center [data set], https://doi.org/10.5439/1984920, 2019.
Lathem, T. L., Beyersdorf, A. J., Thornhill, K. L., Winstead, E. L., Cubison, M. J., Hecobian, A., Jimenez, J. L., Weber, R. J., Anderson, B. E., and Nenes, A.: Analysis of CCN activity of Arctic aerosol and Canadian biomass burning during summer 2008, Atmos. Chem. Phys., 13, 2735–2756, https://doi.org/10.5194/acp-13-2735-2013, 2013. a, b
Lee, H., Lee, K., Lunder, C. R., Krejci, R., Aas, W., Park, J., Park, K.-T., Lee, B. Y., Yoon, Y. J., and Park, K.: Atmospheric new particle formation characteristics in the Arctic as measured at Mount Zeppelin, Svalbard, from 2016 to 2018, Atmos. Chem. Phys., 20, 13425–13441, https://doi.org/10.5194/acp-20-13425-2020, 2020. a, b, c
Lewis, S. L., Russell, L. M., McKinsey, J. A., and Harris, W. J.: Small contributions of dust to PM2.5 and PM10 concentrations measured downwind of Oceano Dunes, Atmos. Environ., 294, 119515, https://doi.org/10.1016/j.atmosenv.2022.119515, 2023. a
Lloyd, G., Choularton, T. W., Bower, K. N., Gallagher, M. W., Crosier, J., O'Shea, S., Abel, S. J., Fox, S., Cotton, R., and Boutle, I. A.: In situ measurements of cloud microphysical and aerosol properties during the break-up of stratocumulus cloud layers in cold air outbreaks over the North Atlantic, Atmos. Chem. Phys., 18, 17191–17206, https://doi.org/10.5194/acp-18-17191-2018, 2018. a, b, c, d, e, f, g
Martin, M., Chang, R. Y.-W., Sierau, B., Sjogren, S., Swietlicki, E., Abbatt, J. P. D., Leck, C., and Lohmann, U.: Cloud condensation nuclei closure study on summer arctic aerosol, Atmos. Chem. Phys., 11, 11335–11350, https://doi.org/10.5194/acp-11-11335-2011, 2011. a
Massling, A., Lange, R., Pernov, J. B., Gosewinkel, U., Sørensen, L.-L., and Skov, H.: Measurement report: High Arctic aerosol hygroscopicity at sub- and supersaturated conditions during spring and summer, Atmos. Chem. Phys., 23, 4931–4953, https://doi.org/10.5194/acp-23-4931-2023, 2023. a, b
McCoy, I. L., Wood, R., and Fletcher, J. K.: Identifying Meteorological Controls on Open and Closed Mesoscale Cellular Convection Associated with Marine Cold Air Outbreaks, J. Geophys. Res.-Atmos., 122, 11678–11702, https://doi.org/10.1002/2017JD027031, 2017. a, b
Modini, R. L., Frossard, A. A., Ahlm, L., Russell, L. M., Corrigan, C. E., Roberts, G. C., Hawkins, L. N., Schroder, J. C., Bertram, A. K., Zhao, R., Lee, A. K. Y., Abbatt, J. P. D., Lin, J., Nenes, A., Wang, Z., Wonaschütz, A., Sorooshian, A., Noone, K. J., Jonsson, H., Seinfeld, J. H., Toom-Sauntry, D., Macdonald, A. M., and Leaitch, W. R.: Primary marine aerosol-cloud interactions off the coast of California, J. Geophys. Res.-Atmos., 120, 4282–4303, https://doi.org/10.1002/2014JD022963, 2015. a, b, c, d
Monahan, E. C.: Sea spray as a function of low elevation wind speed, J. Geophys. Res., 73, 1127–1137, https://doi.org/10.1029/JB073I004P01127, 1968. a
Moore, R. H., Bahreini, R., Brock, C. A., Froyd, K. D., Cozic, J., Holloway, J. S., Middlebrook, A. M., Murphy, D. M., and Nenes, A.: Hygroscopicity and composition of Alaskan Arctic CCN during April 2008, Atmos. Chem. Phys., 11, 11807–11825, https://doi.org/10.5194/acp-11-11807-2011, 2011. a, b, c
Moschos, V., Schmale, J., Aas, W., Becagli, S., Calzolai, G., Eleftheriadis, K., Moffett, C. E., Schnelle-Kreis, J., Severi, M., Sharma, S., Skov, H., Vestenius, M., Zhang, W., Hakola, H., Hellén, H., Huang, L., Jaffrezo, J.-L., Massling, A., Nøjgaard, J. K., Petäjä, T., Popovicheva, O., Sheesley, R. J., Traversi, R., Yttri, K. E., Prévôt, A. S. H., Baltensperger, U., and Haddad, I. E.: Elucidating the present-day chemical composition, seasonality and source regions of climate-relevant aerosols across the Arctic land surface, Environ. Res. Lett., 17, 034032, https://doi.org/10.1088/1748-9326/ac444b, 2022. a
Norwegian Institute for Air Research (NILU): EBAS, re3data.org, [data set], https://doi.org/10.17616/R39W8K, 2024.
Paramonov, M., Kerminen, V.-M., Gysel, M., Aalto, P. P., Andreae, M. O., Asmi, E., Baltensperger, U., Bougiatioti, A., Brus, D., Frank, G. P., Good, N., Gunthe, S. S., Hao, L., Irwin, M., Jaatinen, A., Jurányi, Z., King, S. M., Kortelainen, A., Kristensson, A., Lihavainen, H., Kulmala, M., Lohmann, U., Martin, S. T., McFiggans, G., Mihalopoulos, N., Nenes, A., O'Dowd, C. D., Ovadnevaite, J., Petäjä, T., Pöschl, U., Roberts, G. C., Rose, D., Svenningsson, B., Swietlicki, E., Weingartner, E., Whitehead, J., Wiedensohler, A., Wittbom, C., and Sierau, B.: A synthesis of cloud condensation nuclei counter (CCNC) measurements within the EUCAARI network, Atmos. Chem. Phys., 15, 12211–12229, https://doi.org/10.5194/acp-15-12211-2015, 2015. a, b
Pasquier, J. T., David, R. O., Freitas, G., Gierens, R., Gramlich, Y., Haslett, S., Li, G., Schäfer, B., Siegel, K., Wieder, J., Adachi, K., Belosi, F., Carlsen, T., Decesari, S., Ebell, K., Gilardoni, S., Gysel-Beer, M., Henneberger, J., Inoue, J., Kanji, Z. A., Koike, M., Kondo, Y., Krejci, R., Lohmann, U., Maturilli, M., Mazzolla, M., Modini, R., Mohr, C., Motos, G., Nenes, A., Nicosia, A., Ohata, S., Paglione, M., Park, S., Pileci, R. E., Ramelli, F., Rinaldi, M., Ritter, C., Sato, K., Storelvmo, T., Tobo, Y., Traversi, R., Viola, A., and Zieger, P.: The Ny-Ålesund Aerosol Cloud Experiment (NASCENT): Overview and First Results, B. Am. Meteorol. Soc., 103, E2533–E2558, https://doi.org/10.1175/BAMS-D-21-0034.1, 2022. a
Pernov, J. B., Beddows, D., Thomas, D. C., Dall´Osto, M., Harrison, R. M., Schmale, J., Skov, H., and Massling, A.: Increased aerosol concentrations in the High Arctic attributable to changing atmospheric transport patterns, npj Climate and Atmospheric Science, 5, 1–13, https://doi.org/10.1038/s41612-022-00286-y, 2022. a, b, c, d
Petters, M. D. and Kreidenweis, S. M.: A single parameter representation of hygroscopic growth and cloud condensation nucleus activity, Atmos. Chem. Phys., 7, 1961–1971, https://doi.org/10.5194/acp-7-1961-2007, 2007. a, b, c
Platt, S. M., Hov, Ø., Berg, T., Breivik, K., Eckhardt, S., Eleftheriadis, K., Evangeliou, N., Fiebig, M., Fisher, R., Hansen, G., Hansson, H.-C., Heintzenberg, J., Hermansen, O., Heslin-Rees, D., Holmén, K., Hudson, S., Kallenborn, R., Krejci, R., Krognes, T., Larssen, S., Lowry, D., Lund Myhre, C., Lunder, C., Nisbet, E., Nizzetto, P. B., Park, K.-T., Pedersen, C. A., Aspmo Pfaffhuber, K., Röckmann, T., Schmidbauer, N., Solberg, S., Stohl, A., Ström, J., Svendby, T., Tunved, P., Tørnkvist, K., van der Veen, C., Vratolis, S., Yoon, Y. J., Yttri, K. E., Zieger, P., Aas, W., and Tørseth, K.: Atmospheric composition in the European Arctic and 30 years of the Zeppelin Observatory, Ny-Ålesund, Atmos. Chem. Phys., 22, 3321–3369, https://doi.org/10.5194/acp-22-3321-2022, 2022. a, b, c, d, e
Reutter, P., Su, H., Trentmann, J., Simmel, M., Rose, D., Gunthe, S. S., Wernli, H., Andreae, M. O., and Pöschl, U.: Aerosol- and updraft-limited regimes of cloud droplet formation: influence of particle number, size and hygroscopicity on the activation of cloud condensation nuclei (CCN), Atmos. Chem. Phys., 9, 7067–7080, https://doi.org/10.5194/acp-9-7067-2009, 2009. a
Ritsche, M.: ARM Surface Meteorology Systems Handbook, U.S. Department of Energy Office of Scientific and Technical Information, https://doi.org/10.2172/1007926, 2011. a
Russell, L. M., Moore, R. H., Burrows, S. M., and Quinn, P. K.: Ocean flux of salt, sulfate, and organic components to atmospheric aerosol, Earth-Sci. Rev., 239, 104364, https://doi.org/10.1016/J.EARSCIREV.2023.104364, 2023. a, b
Saliba, G., Chen, C.-L., Lewis, S., Russell, L. M., Rivellini, L.-H., Lee, A. K. Y., Quinn, P. K., Bates, T. S., Haëntjens, N., Boss, E. S., Karp-Boss, L., Baetge, N., Carlson, C. A., and Behrenfeld, M. J.: Factors driving the seasonal and hourly variability of sea-spray aerosol number in the North Atlantic, P. Natl. Acad. Sci. USA, 116, 20309–20314, https://doi.org/10.1073/pnas.1907574116, 2019. a
Sanchez, K. J., Chen, C. L., Russell, L. M., Betha, R., Liu, J., Price, D. J., Massoli, P., Ziemba, L. D., Crosbie, E. C., Moore, R. H., Müller, M., Schiller, S. A., Wisthaler, A., Lee, A. K., Quinn, P. K., Bates, T. S., Porter, J., Bell, T. G., Saltzman, E. S., Vaillancourt, R. D., and Behrenfeld, M. J.: Substantial Seasonal Contribution of Observed Biogenic Sulfate Particles to Cloud Condensation Nuclei, Sci. Rep., 8, 1–14, https://doi.org/10.1038/s41598-018-21590-9, 2018. a
Sanchez, K. J., Zhang, B., Liu, H., Brown, M. D., Crosbie, E. C., Gallo, F., Hair, J. W., Hostetler, C. A., Jordan, C. E., Robinson, C. E., Scarino, A. J., Shingler, T. J., Shook, M. A., Thornhill, K. L., Wiggins, E. B., Winstead, E. L., Ziemba, L. D., Saliba, G., Lewis, S. L., Russell, L. M., Quinn, P. K., Bates, T. S., Porter, J., Bell, T. G., Gaube, P., Saltzman, E. S., Behrenfeld, M. J., and Moore, R. H.: North Atlantic Ocean SST-gradient-driven variations in aerosol and cloud evolution along Lagrangian cold-air outbreak trajectories, Atmos. Chem. Phys., 22, 2795–2815, https://doi.org/10.5194/acp-22-2795-2022, 2022. a, b, c, d
Schmale, J., Sharma, S., Decesari, S., Pernov, J., Massling, A., Hansson, H.-C., von Salzen, K., Skov, H., Andrews, E., Quinn, P. K., Upchurch, L. M., Eleftheriadis, K., Traversi, R., Gilardoni, S., Mazzola, M., Laing, J., and Hopke, P.: Pan-Arctic seasonal cycles and long-term trends of aerosol properties from 10 observatories, Atmos. Chem. Phys., 22, 3067–3096, https://doi.org/10.5194/acp-22-3067-2022, 2022. a, b, c
Schulze, B. C., Charan, S. M., Kenseth, C. M., Kong, W., Bates, K. H., Williams, W., Metcalf, A. R., Jonsson, H. H., Woods, R., Sorooshian, A., Flagan, R. C., and Seinfeld, J. H.: Characterization of Aerosol Hygroscopicity Over the Northeast Pacific Ocean: Impacts on Prediction of CCN and Stratocumulus Cloud Droplet Number Concentrations, Earth and Space Science, 7, e2020EA001098, https://doi.org/10.1029/2020EA001098, 2020. a
Springston, S.: Carbon Monoxide Analyzer (CO-ANALYZER) Instrument Handbook, U.S. Department of Energy Office of Scientific and Technical Information, https://doi.org/10.2172/1495422, 2015. a
Stein, A. F., Draxler, R. R., Rolph, G. D., Stunder, B. J. B., Cohen, M. D., and Ngan, F.: NOAA’s HYSPLIT Atmospheric Transport and Dispersion Modeling System, B. Am. Meteorol. Soc., 96, 2059–2077, https://doi.org/10.1175/BAMS-D-14-00110.1, 2015. a
Tornow, F., Ackerman, A. S., and Fridlind, A. M.: Preconditioning of overcast-to-broken cloud transitions by riming in marine cold air outbreaks, Atmos. Chem. Phys., 21, 12049–12067, https://doi.org/10.5194/acp-21-12049-2021, 2021. a, b, c
Tornow, F., Ackerman, A. S., Fridlind, A. M., Cairns, B., Crosbie, E. C., Kirschler, S., Moore, R. H., Painemal, D., Robinson, C. E., Seethala, C., Shook, M. A., Voigt, C., Winstead, E. L., Ziemba, L. D., Zuidema, P., and Sorooshian, A.: Dilution of Boundary Layer Cloud Condensation Nucleus Concentrations by Free Tropospheric Entrainment During Marine Cold Air Outbreaks, Geophys. Res. Lett., 49, e2022GL098444, https://doi.org/10.1029/2022GL098444, 2022. a, b
Tornow, F., Ackerman, A. S., Fridlind, A. M., Tselioudis, G., Cairns, B., Painemal, D., and Elsaesser, G.: On the Impact of a Dry Intrusion Driving Cloud-Regime Transitions in a Midlatitude Cold-Air Outbreak, J. Atmos. Sci., 80, 2881–2896, https://doi.org/10.1175/JAS-D-23-0040.1, 2023. a
Tunved, P., Ström, J., and Krejci, R.: Arctic aerosol life cycle: linking aerosol size distributions observed between 2000 and 2010 with air mass transport and precipitation at Zeppelin station, Ny-Ålesund, Svalbard, Atmos. Chem. Phys., 13, 3643–3660, https://doi.org/10.5194/acp-13-3643-2013, 2013. a, b, c, d, e, f, g, h, i
Uin, J.: Ultra-High-Sensitivity Aerosol Spectrometer (UHSAS) Instrument Handbook, U.S. Department of Energy Office of Scientific and Technical Information, https://doi.org/10.2172/1251410, 2016a. a, b
Uin, J.: Humidified Tandem Differential Mobility Analyzer Instrument Handbook, U.S. Department of Energy Office of Scientific and Technical Information, https://doi.org/10.2172/1251403, 2016b. a, b, c
Uin, J.: Cloud Condensation Nuclei Particle Counter Instrument Handbook, U.S. Department of Energy Office of Scientific and Technical Information, https://doi.org/10.2172/1251411, 2016c. a, b, c
Uin, J.: Nephelometer Handbook, U.S. Department of Energy Office of Scientific and Technical Information, https://doi.org/10.2172/1246075, 2016d. a
Uin, J., Aiken, A. C., Dubey, M. K., Kuang, C., Pekour, M., Salwen, C., Sedlacek, A. J., Senum, G., Smith, S., Wang, J., Watson, T. B., and Springston, S. R.: Atmospheric Radiation Measurement (ARM) Aerosol Observing Systems (AOS) for Surface-Based In Situ Atmospheric Aerosol and Trace Gas Measurements, J. Atmos. Ocean. Tech., 36, 2429–2447, https://doi.org/10.1175/JTECH-D-19-0077.1, 2019a. a, b, c
Uin, J., Senum, G., Koontz, A., Flynn, C., Salwen, C., and Hayes, C. Ultra-High Sensitivity Aerosol Spectrometer, ARM Mobile Facility (ANX) Andenes, Norway, ARM Data Center [data set], https://doi.org/10.5439/1409033, 2019b.
Uin, J., Cromwel, E., Hayes, C., and Salwen, C.: Humidified Tandem Differential Mobility Analyzer, ARM Mobile Facility (ANX) Andenes, Norway, ARM Data Center [data set], https://doi.org/10.5439/1095581, 2020.
Willis, M. D., Leaitch, W. R., and Abbatt, J. P.: Processes Controlling the Composition and Abundance of Arctic Aerosol, Rev. Geophys., 56, 621–671, https://doi.org/10.1029/2018RG000602, 2018. a
Zábori, J., Rastak, N., Yoon, Y. J., Riipinen, I., and Ström, J.: Size-resolved cloud condensation nuclei concentration measurements in the Arctic: two case studies from the summer of 2008, Atmos. Chem. Phys., 15, 13803–13817, https://doi.org/10.5194/acp-15-13803-2015, 2015. a, b, c
Zheng, G., Wang, Y., Aiken, A. C., Gallo, F., Jensen, M. P., Kollias, P., Kuang, C., Luke, E., Springston, S., Uin, J., Wood, R., and Wang, J.: Marine boundary layer aerosol in the eastern North Atlantic: seasonal variations and key controlling processes, Atmos. Chem. Phys., 18, 17615–17635, https://doi.org/10.5194/acp-18-17615-2018, 2018. a, b, c
Zieger, P., Väisänen, O., Corbin, J., Partridge, D., Bastelberger, S., Mousavi-Fard, M., Rosati, B., Gysel, M., Krieger, U., Leck, C., Nenes, A., Riipinen, I., Virtanen, A., and Salter, M.: Revising the hygroscopicity of inorganic sea salt particles, Nat. Commun., 8, 15883, https://doi.org/10.1038/ncomms15883, 2017. a
- Abstract
- Introduction
- Methods
- Greater sea spray particle number concentration
- Activation of particles to cloud drops
- Scavenging by precipitation
- Conclusions
- Code and data availability
- Author contributions
- Competing interests
- Disclaimer
- Acknowledgements
- Financial support
- Review statement
- References
- Supplement