the Creative Commons Attribution 4.0 License.
the Creative Commons Attribution 4.0 License.
 | 18 Oct 2024
Evolution of cloud droplet temperature and lifetime in spatiotemporally varying subsaturated environments with implications for ice nucleation at cloud edges
Robert M. Rauber
Larry Di Girolamo
Ice formation mechanisms in generating cells near stratiform cloud tops, where mixing and entrainment occurs in the presence of supercooled water droplets, remain poorly understood. Supercooled cloud droplet temperature and lifetime may impact heterogeneous ice nucleation through contact and immersion freezing; however, modeling studies normally assume the droplet temperature to be spatially uniform and equal to the ambient temperature. Here, we present a first-of-its-kind quantitative investigation of the temperature and lifetime of evaporating droplets, considering internal thermal gradients within the droplet, as well as thermal and vapor density gradients in the surrounding air. Our approach employs solving Navier–Stokes and continuity equations, coupled with heat and vapor transport, using an advanced numerical model. For typical ranges of cloud droplet sizes and environmental conditions, the droplet internal thermal gradients dissipate quickly (≤ 0.3 s) when droplets are introduced to new subsaturated environments. However, the magnitude of droplet cooling is much greater than estimated from past studies of droplet evaporation, especially for drier environments. For example, for an environment with 500 hPa pressure, and ambient temperature far from the droplet of −5 °C, the droplet temperature reduction can be as high as 24, 11, and 5 °C for initial ambient relative humidities of 10 %, 40 %, and 70 %, respectively. Droplet lifetimes are found to be tens of seconds longer compared to previous estimates, due to weaker evaporation rates because of lower droplet surface temperatures. Using these new end-of-lifetime droplet temperatures, the enhancement in the activation of ice-nucleating particles predicted by current ice nucleation parameterization schemes is discussed.
- Article
(12455 KB) - Full-text XML
- BibTeX
- EndNote


Ice formation often occurs near the cloud tops of stratiform clouds where ice-generating cells (AMS, 2024) are frequently found in a variety of cold cloudy environments (Plummer et al., 2014; Ramelli et al., 2021). These cells play a crucial role in primary ice nucleation and growth (Tessendorf et al., 2015). Evidence of mixing and entrainment and the presence of supercooled liquid water within and between the highly turbulent cells has been observed (Plummer et al., 2014; Wang et al., 2020; Zaremba et al., 2024). Within regions of entrainment and mixing at cloud boundaries, cloud droplets are exposed to subsaturated environments and undergo evaporation that leads to droplet temperatures that could be several degrees lower than that of the ambient environment (Kinzer and Gunn, 1951; Watts, 1971; Roy et al., 2023). However, in modeling cloud microphysical processes, the difference in temperature between the cloud droplets and their environment is generally assumed to be negligible (Pruppacher and Klett, 1997); i.e., the droplets' temperatures are approximated to be the same as that of their ambient environment. This assumption is reasonable for cloud droplets inside the cloud but breaks down within entrainment and mixing zones at cloud boundaries and may lead to uncertainties in the numerical simulations of microphysical processes. Cloud droplet temperatures affect the calculated droplet diffusional growth or evaporation rates (Roach, 1976; Srivastava and Coen, 1992; Marquis and Harrington, 2005; Roy et al., 2023), and droplet lifetimes (Roy et al., 2023), radiative effects via temperature-dependent refractive indices (Rowe et al., 2020), and ice formation via pathways that require supercooled liquid water droplets, such as contact nucleation (Young, 1974), immersion freezing (Szakáll et al., 2021), and homogeneous nucleation (Khvorostyanov and Sassen, 1998; Khain and Pinsky, 2018). These uncertainties can propagate into microphysical parameterization schemes, leading to possible inadequate representation of mixed-phase cloud properties across various scales (e.g., large eddy simulations (LESs), cloud-resolving models (CRMs), and climate models), impacting predictions of precipitation or climate change.
Several studies have highlighted the special importance of the air–water interface of the water droplet during ice nucleation. Many experimental and theoretical studies have suggested that ice initiation occurs at the droplet surface (Tabazadeh et al., 2002a, b; Djikaev et al., 2002; Satoh et al., 2002; Shaw et al., 2005), and the interface thermodynamically favors the contact mode over the immersion freezing mode (Djikaev and Ruckenstein, 2008). Based on their laboratory observations, Tabazadeh et al. (2002a) suggested that homogeneous nucleation of nitric acid dihydrate (NAD) and nitric acid trihydrate (NAT) particles within aqueous nitric acid droplets primarily occurs at the droplet surface. This leads to the hypothesis that phase transformations in atmospheric aerosols may predominantly be surface-based (Tabazadeh et al., 2002b), challenging the traditional theory of homogeneous crystallization, where freezing begins inside the volume of the droplet (Volmer, 1939). Satoh et al. (2002) studied cooling and freezing in water droplets due to evaporation in an evacuated chamber and found that droplets rapidly froze with significant supercooling, with the freezing initiated from the droplet surface. Studies employing molecular dynamics simulations (Chushak and Bartell, 1999, 2000) and thermodynamic calculations. Djikaev et al. (2002) additionally corroborate that a crystalline nucleus preferentially forms at the droplet surface rather than within the bulk droplet volume. Laboratory observations from Shaw et al. (2005) reveal that freezing temperatures are 4–5 K higher when an ice-forming nucleus is closer to the surface of a supercooled water droplet compared to when it is immersed within the droplet. They found that the nucleation rate at the water surface is significantly higher (by a factor of 1010) than in the bulk droplet, indicating that the free energy required for critical ice germ formation decreases when near to the air–water interface, and the jump frequency of molecules from the liquid to the solid phase may be significantly enhanced at the interface. Lü et al. (2005) conducted ice nucleation experiments with acoustically levitated supercooled water droplets. Using statistical analyses of nucleation rates, they found that ice nucleation predominantly initiates in the vicinity of the droplet surface. Therefore, given the importance of the droplet surface in ice nucleation, and since evaporation is a surface phenomenon, in the quest to better understand the physical mechanisms responsible for primary ice nucleation, it is important to accurately investigate the thermal evolution of the evaporating droplet surface, as well as the internal thermal gradients within the supercooled droplet, as ice nucleation is highly temperature-dependent.
Droplet condensation or evaporation results from vapor density gradients between the surface of the droplet and the ambient environment. The solution to determine the rate of droplet growth or decay was first derived by Maxwell (1890), with an alternative approximate solution presented by Mason (1971), which has since appeared in several textbooks (e.g., Eq. (7.18) in Rogers and Yau, 1989; Eqs. (13.28) in Pruppacher and Klett, 1997). The vapor density at the droplet surface is a sensitive function of the temperature at the drop surface. For simplicity, cloud models, while computing the growth/decay rates of cloud droplets, eliminate the use of droplet temperature from the equations by assuming the saturation vapor density difference as a linear function of temperature difference between the droplet and ambient environment (e.g., Vaillancourt et al., 2001; Chen et al., 2020). This quasi-steady approximation is applicable for droplet growth where the supersaturation is typically less than 1 % and the difference between the droplet temperature and ambient air is negligible. For evaporation, where vapor deficits can occur over a wide range of relative humidities, the approximation breaks down as the droplet temperature can deviate significantly from that of the ambient environment (Srivastava and Coen, 1992; Roy et al., 2023).
Few studies in the cloud microphysics literature have carried out explicit numerical estimations and evolutions of supercooled evaporating cloud droplet temperatures and lifetimes for a wide range of environmental conditions. Roy et al. (2023) provides a comprehensive review of past theoretical, numerical, or experimental studies of droplet evaporation. Most of these studies examined the evaporation of raindrops for temperatures above 0 °C (Kinzer and Gunn, 1951; Watts, 1971; Watts and Farhi, 1975), either by assuming steady-state expressions (Beard and Pruppacher, 1971) or by simplifying assumptions of linear dependence of saturation vapor density on temperature (Kinzer and Gunn, 1951; Watts, 1971; Watts and Farhi, 1975). Srivastava and Coen (1992) assumed the heat storage term in the droplet heat budget to be negligible and investigated the evaporation of isolated stationary hydrometeors by iteratively solving the steady-state solutions, using saturation vapor pressure relations from Wexler (1976) to calculate the saturation vapor density. Roy et al. (2023), by including the heat storage term and solving for time-dependent heat and mass transfer between single stationary cloud droplets evaporating in infinitely large prescribed ambient environments, demonstrated that the temperatures of the cloud droplets (initial radii between 30–50 µm) reach a steady state quite quickly (within < 0.5 s). They considered a wide range of environmental conditions and found that evaporating droplet temperatures can typically be 1–5 K colder than that of the environment, with values as low as ∼ 10 K for low relative humidity and low-pressure conditions with approximately 0 °C environments. Their steady-state droplet temperatures agreed well with those of Srivastava and Coen (1992). They showed that the droplet temperature during evaporation can be approximated by the thermodynamic wet-bulb temperature of the ambient environment. For most subsaturated conditions, radiative cooling in cloud-top environments was found to play a negligible role in altering the evaporating droplet temperatures, except for larger droplets in environments close to saturation.
However, two main issues have not yet been accounted for in the aforementioned studies. First, water droplets were considered to have a uniform bulk droplet temperature, based on the assumption of infinite thermal heat conductivity of water, thus ignoring the added complexity of simulating the internal thermal gradients within the droplet (Kinzer and Gunn, 1951; Watts, 1971; Srivastava and Coen, 1992; Roy et al., 2023). As several studies suggest that the droplet surface plays a special role in nucleating ice and that evaporation is a surface phenomenon, accurate modeling of the evolution of droplet surface temperature and internal thermal gradients within the droplet volume is required to correctly predict the ice nucleation rates. Second, to date, none of these studies considered the spatiotemporally evolving effects of thermal and moisture feedback between the droplet and its immediate environment. The rationale for justifying the usage of constant ambient conditions far away from the droplet was mostly based on studies where ambient conditions were defined by prescribed temperature and moisture fields far away from a droplet (Sedunov, 1974; Eq. (7.7) in Rogers and Yau, 1989; Srivastava and Coen, 1992). A correction to the ambient conditions at a radius similar to the mean distance between droplets (∼ 1 mm) was shown to lead to minimal modifications for typical cloud conditions (Fukuta, 1992). Thus, this assumption holds for droplets distributed homogeneously in space. Concerning numerically simulating the growth and decay of a droplet population, Grabowski and Wang (2013) stated the following:
Cloud droplets grow or evaporate because of the presence of moisture and temperature gradients in their immediate vicinity, and these gradients are responsible for the molecular transport of moisture and energy between the droplet and its immediate environment. One may argue that these gradients need to be resolved to represent the growth accurately. Elementary considerations demonstrate that the moisture and temperature gradients in the droplet vicinity are established rapidly [i.e., with a characteristic timescale of milliseconds or smaller (e.g., Vaillancourt et al., 2001, and references therein)]; thus, the steady-state droplet growth equation is accurate enough. More importantly, the volume affected by these gradients has a radius of approximately 10 to 20 droplet radii. … One can simply neglect molecular transport processes in the immediate droplet vicinity and simulate droplet growth using the Maxwellian approach, that is, by applying the supersaturation predicted by the mean (over the volume occupied by the droplet) temperature and moisture fields … (see Vaillancourt et al., 2001, appendix).
Here, we quantitatively revisit these arguments within the context of an evaporating supercooled cloud droplet. We use high-resolution modeling to resolve the spatiotemporally evolving unsteady thermal and vapor density gradients in the vicinity of the droplet, as well as include internal heat transfer within the droplet, relaxing the assumption of the infinite thermal heat conductivity of water. Using an advanced numerical model, our framework employs the finite-element method to solve the Navier–Stokes and continuity equations, coupled with heat and vapor diffusion, with appropriate boundary conditions. The results from this study extend the findings from Roy et al. (2023) in that an evaporating droplet can exist at a temperature lower than that of the ambient environment and that the temperature deviation increases from the steady-state value under certain environmental conditions. This may lead to significant enhancement in ice nucleation by increasing the predicted number concentrations of activated ice-nucleating particles (INPs) either immersed within or externally contacting the supercooled droplet. The current study advances the numerical approach presented in Roy et al. (2023) by including the impact of internal heat gradients within the droplet and spatiotemporally varying heat and mass transfer between the droplet and its immediate environment. We also provide droplet lifetime comparisons with estimates from Roy et al. (2023) and pure diffusion-limited evaporation calculations. The implications of the evaporating supercooled cloud droplet temperatures and lifetimes on ice nucleation at cloud boundaries are discussed.
2.1 Description of COMSOL
The simulation of the spatiotemporally varying droplet temperature and radius of an evaporating cloud droplet embedded in a gaseous domain is difficult to solve analytically because of the moving and shrinking boundary at the surface of the evaporating droplet. These kinds of moving boundary problems are known as Stefan problems. To model this process, we have used an advanced numerical solver, COMSOL (version 6.0), which employs a finite-element method to solve partial differential equations (PDEs). The COMSOL Multiphysics software simultaneously uses spatial, material, and mesh coordinate systems described as the spatial frame, material frame, and mesh frame, respectively. The spatial frame is a fixed, global, and Euclidean coordinate system which, in 2D, has spatial Cartesian coordinates (r,z) with the center of the droplet at (r,z) = (0,0) (Fig. 1). The material frame specifies the material substance which, in this case, is water or air. The mesh frame is a coordinate system used internally by the finite-element method.
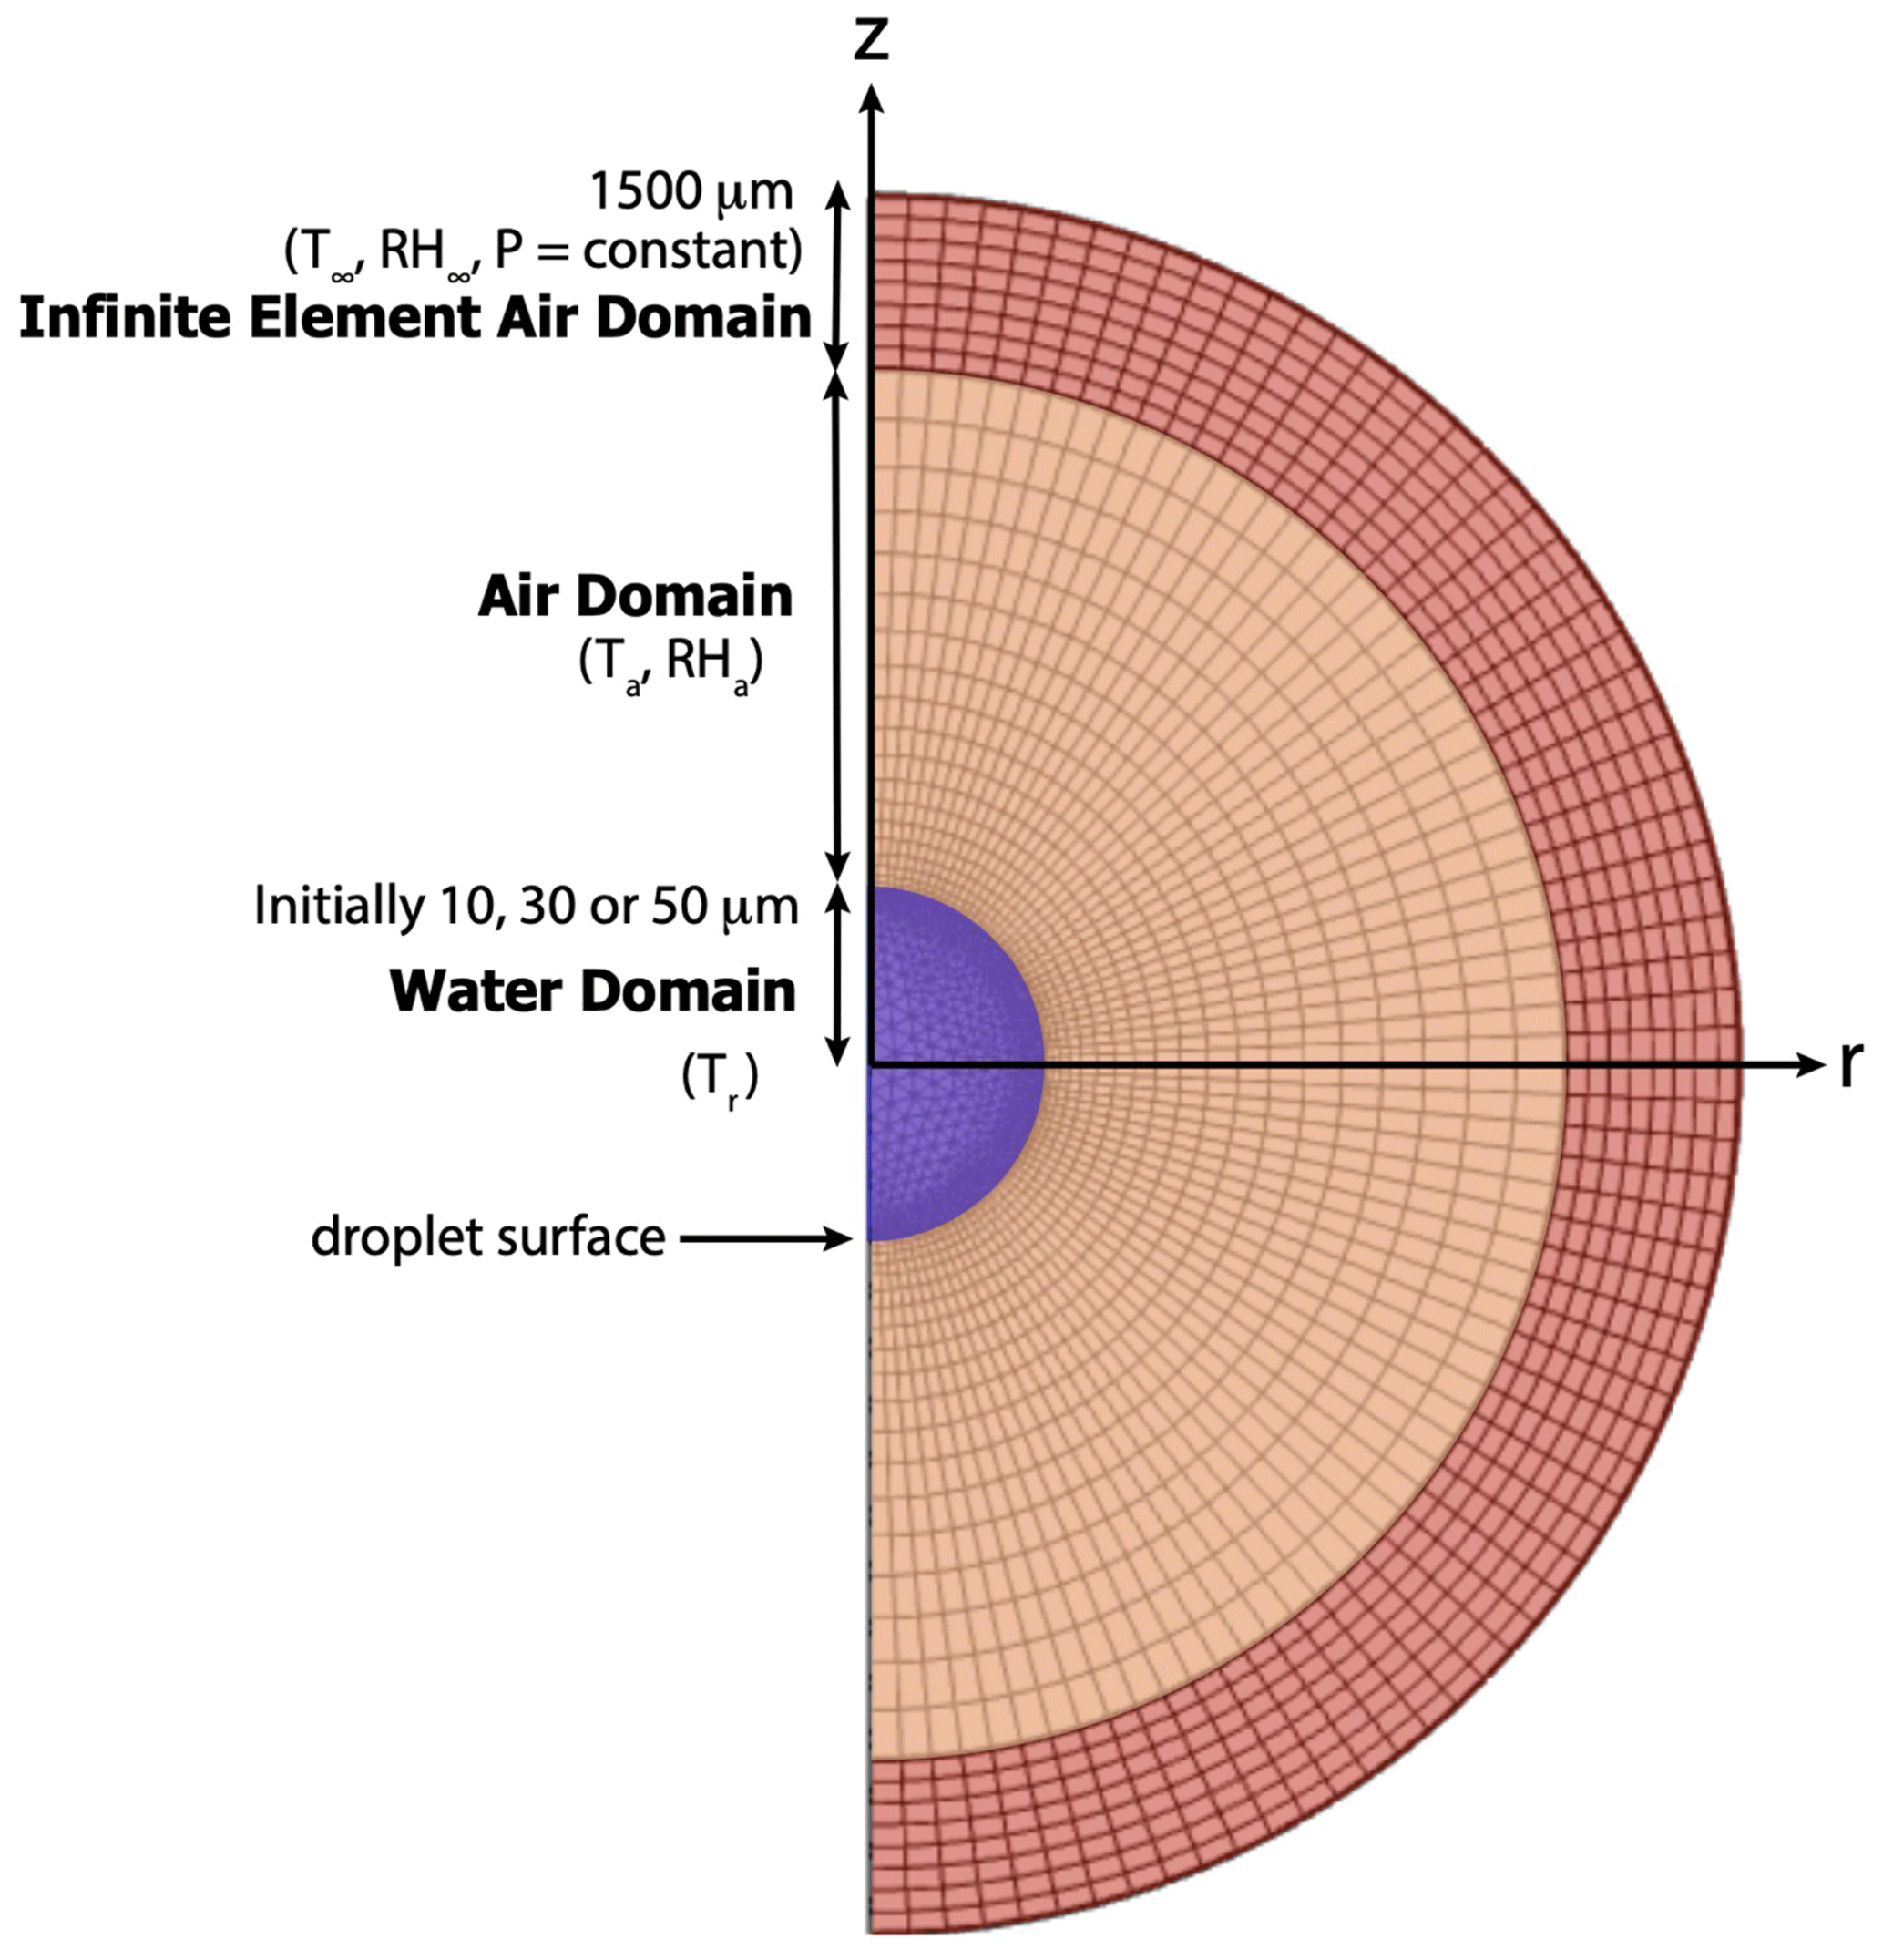
Figure 1Schematic depicting the evaporating droplet embedded in the air domain. The spatial frame (r,z) and the initial mesh frame (triangular elements within the droplet and quadrilateral elements outside the droplet) are shown (not to scale).
The Navier–Stokes equation and Fick's second law of diffusion equation, which follows from the continuity equation, along with appropriate boundary conditions (see Sect. 3), are solved to conserve mass and momentum in the whole system. The following physics interfaces in COMSOL were used to simulate droplet evaporation: (1) two-phase laminar fluid flow, which includes a moving mesh to track the shrinking water–air interface of the evaporating water droplet and fluid–fluid interface that incorporates evaporative mass flux; (2) transport of diluted species, which tracks water vapor diffusion through the air domain and predict the evaporation rate at the droplet surface; and (3) heat transfer in fluids, which accounts for the non-isothermal flow within the computational domain, temperature-dependent saturation vapor density at the droplet interface, and a boundary heat source to account for the latent heat of evaporation. The computational domain also includes an infinite-element air domain (COMSOL, 2023a, b) to specify and maintain boundary conditions far away from the droplet. The physics modules are coupled through non-isothermal flow between heat transfer and fluid flow, and mass transport at the fluid–fluid interface between fluid flow and species transport.
A non-uniform moving mesh was created by breaking down the computational domain into numerous fine elements of variable sizes and by using the arbitrary Lagrangian–Eulerian (ALE) technique (Yang et al., 2014) to accurately track the moving air–water interface at the droplet surface. In the ALE technique, the spatial Cartesian coordinate system (r,z) is fixed, while the coordinates of the material (R,Z) and the mesh (Rm,Zm) nodes are functions of time as the droplet evaporates. However, the material and mesh node coordinates are always fixed in their respective frames. Initially, the spatial, material, and mesh frames are all identical. As the simulation starts, the material and mesh frames deform as the moving boundary of the droplet shrinks during evaporation. After each time step, the deformed nodes are mapped to the spatial frame, which is where calculations are performed. In this study, we have used triangular mesh elements (COMSOL, 2023b) within the droplet and quadrilateral mesh elements (COMSOL, 2023c) for the rest of the domain, as shown in Fig. 1. The triangular mesh allows a higher resolution at the droplet surface, and both meshes adjust continually as the droplet surface shrinks during evaporation. Finally, to simulate the water droplet evaporating in the ambient-air system, with appropriate initial and boundary conditions, the discretized PDEs are numerically solved with adaptive time steps (≤ 0.01 s) to maintain numerical stability and obtain the solution (the temporal evolution of droplet temperature and radius) for a range of conditions.
Table 1Comparison between thermodynamic wet-bulb temperatures in the environment far away from the droplet (WB∞); simulated droplet steady-state temperatures from Roy et al. (2023) (TRRD); slope transition point temperatures (Ti); and droplet temperatures at the end of their lifetimes from this study (TL) (in K) for initial droplet radii (r0 = 10, 30 and 50 µm), relative humidities (RH∞ = 10 %, 40 %, and 70 %), pressures (P = 500 and 850 hPa), and ambient temperature (T∞ = 273.15 K (0 °C), 268.15 K (−5 °C), and 263.15 K (−10 °C)).
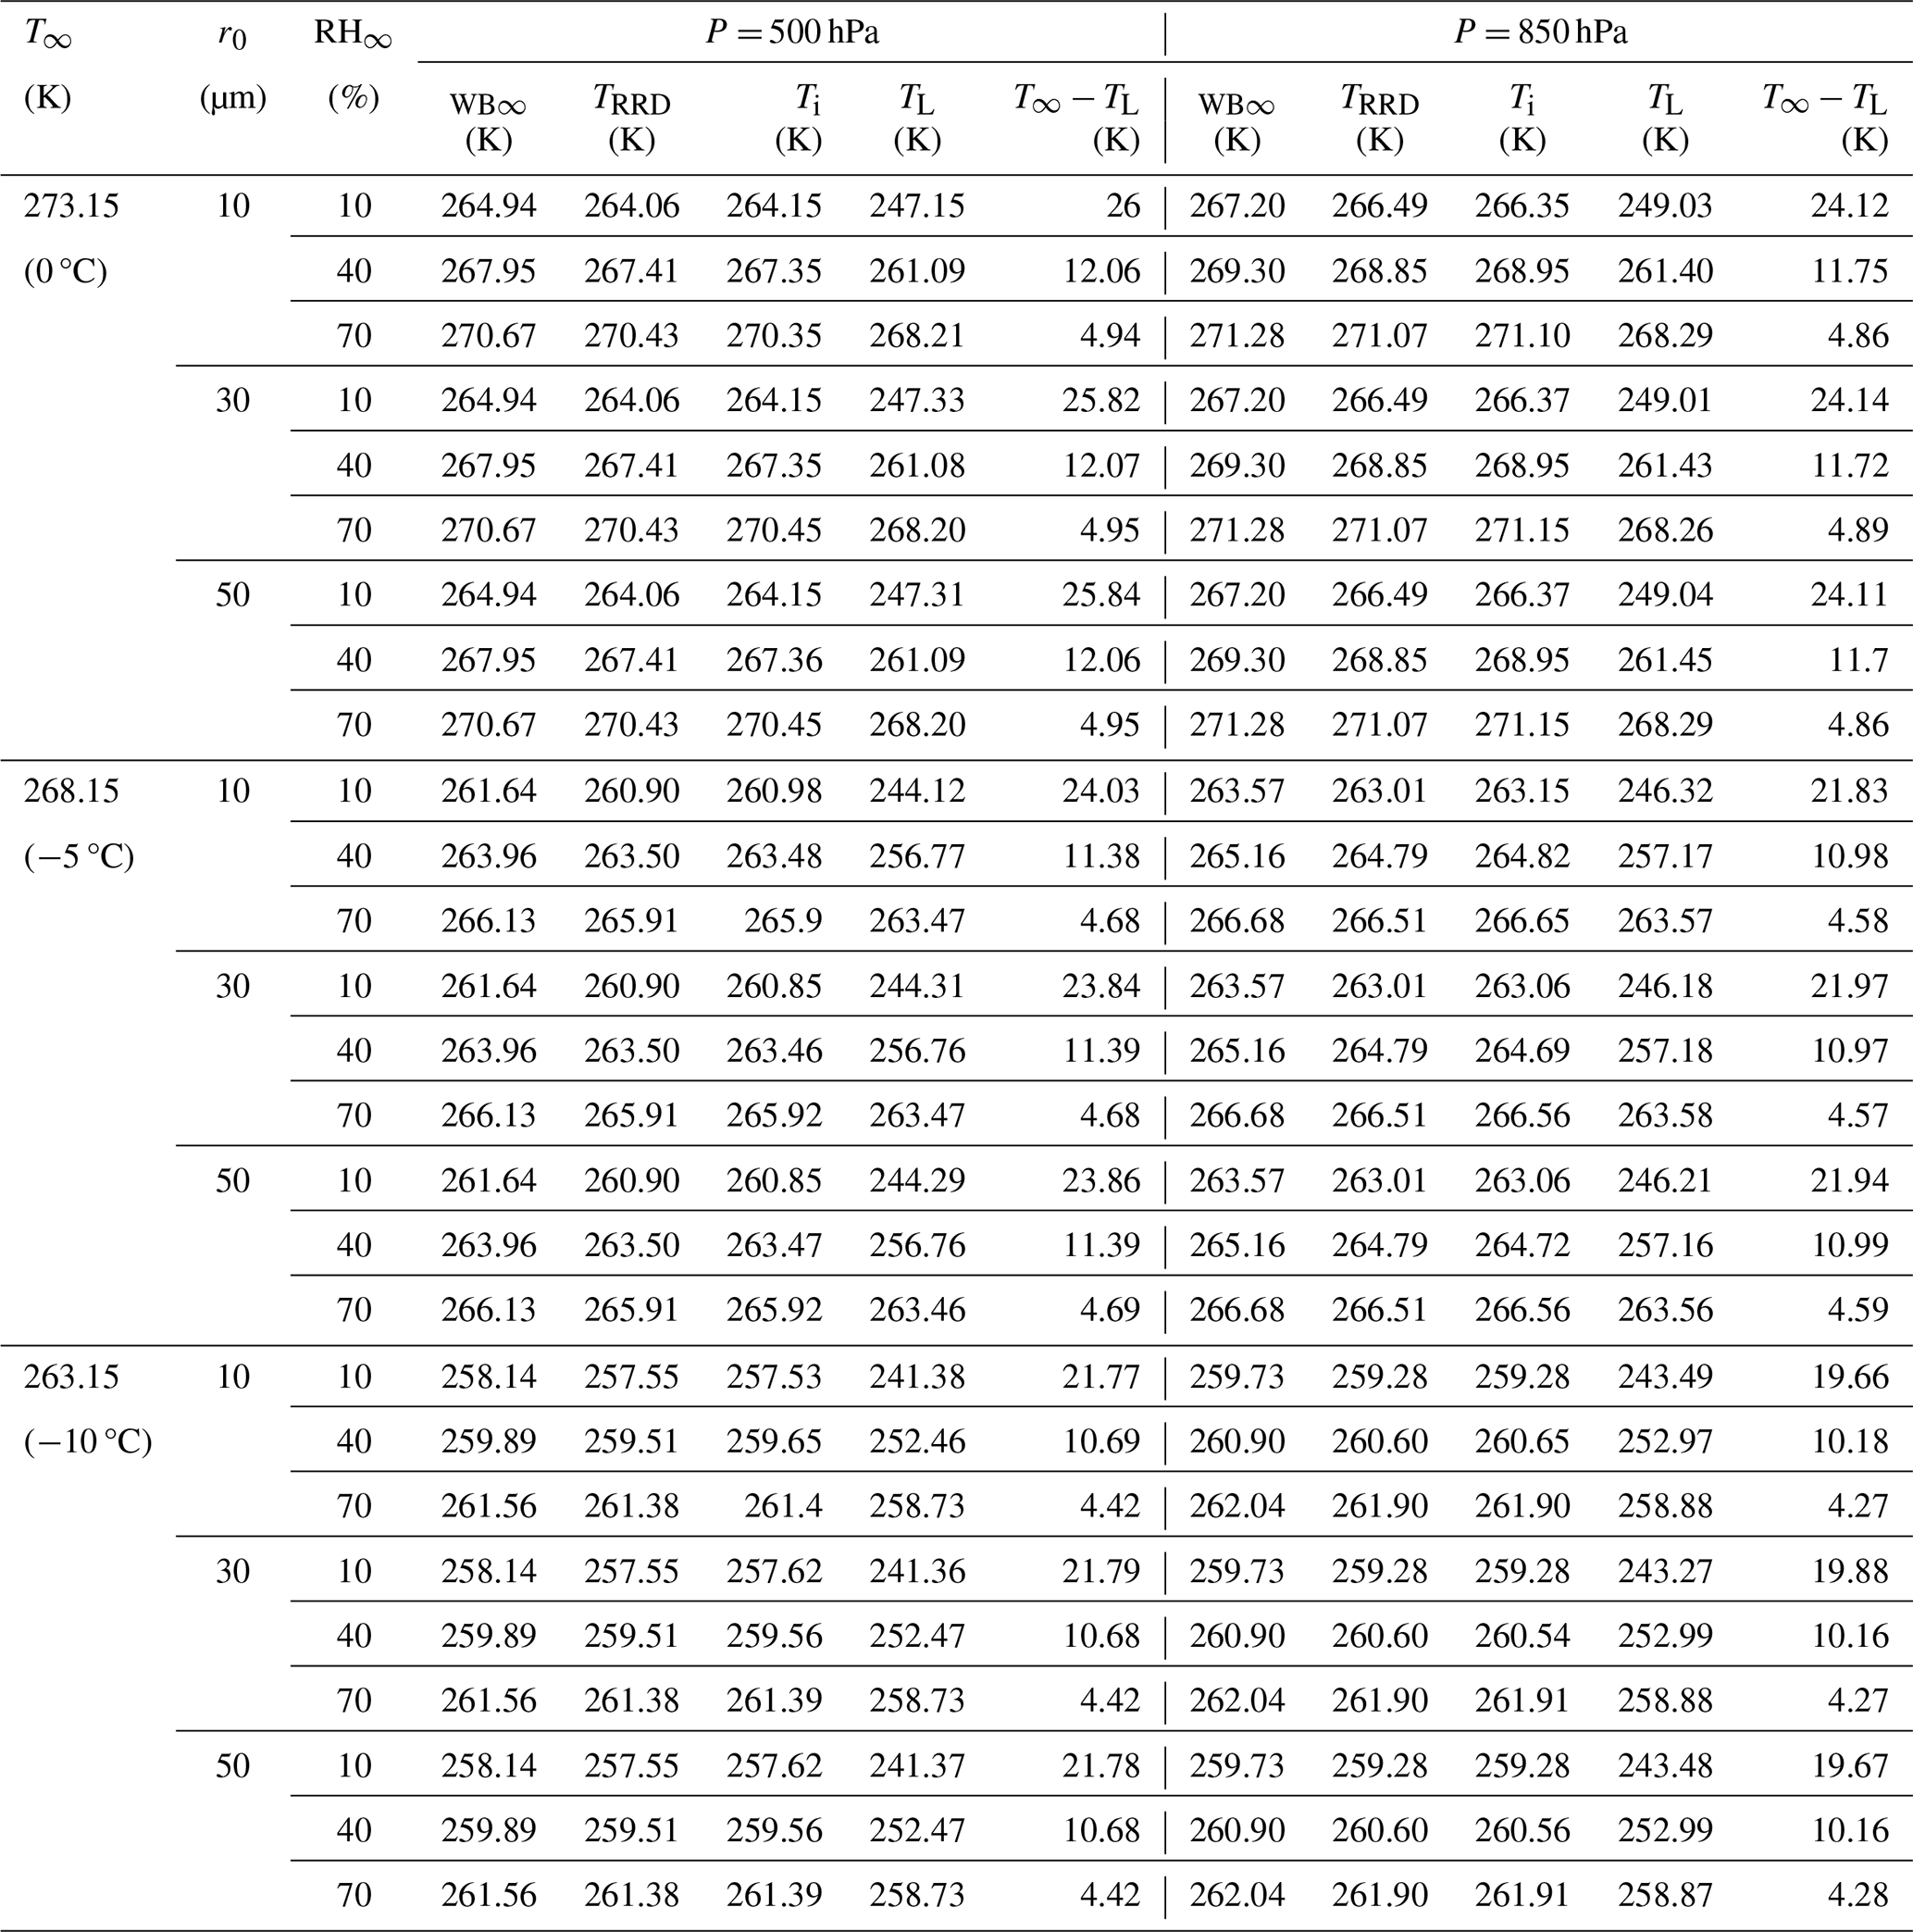
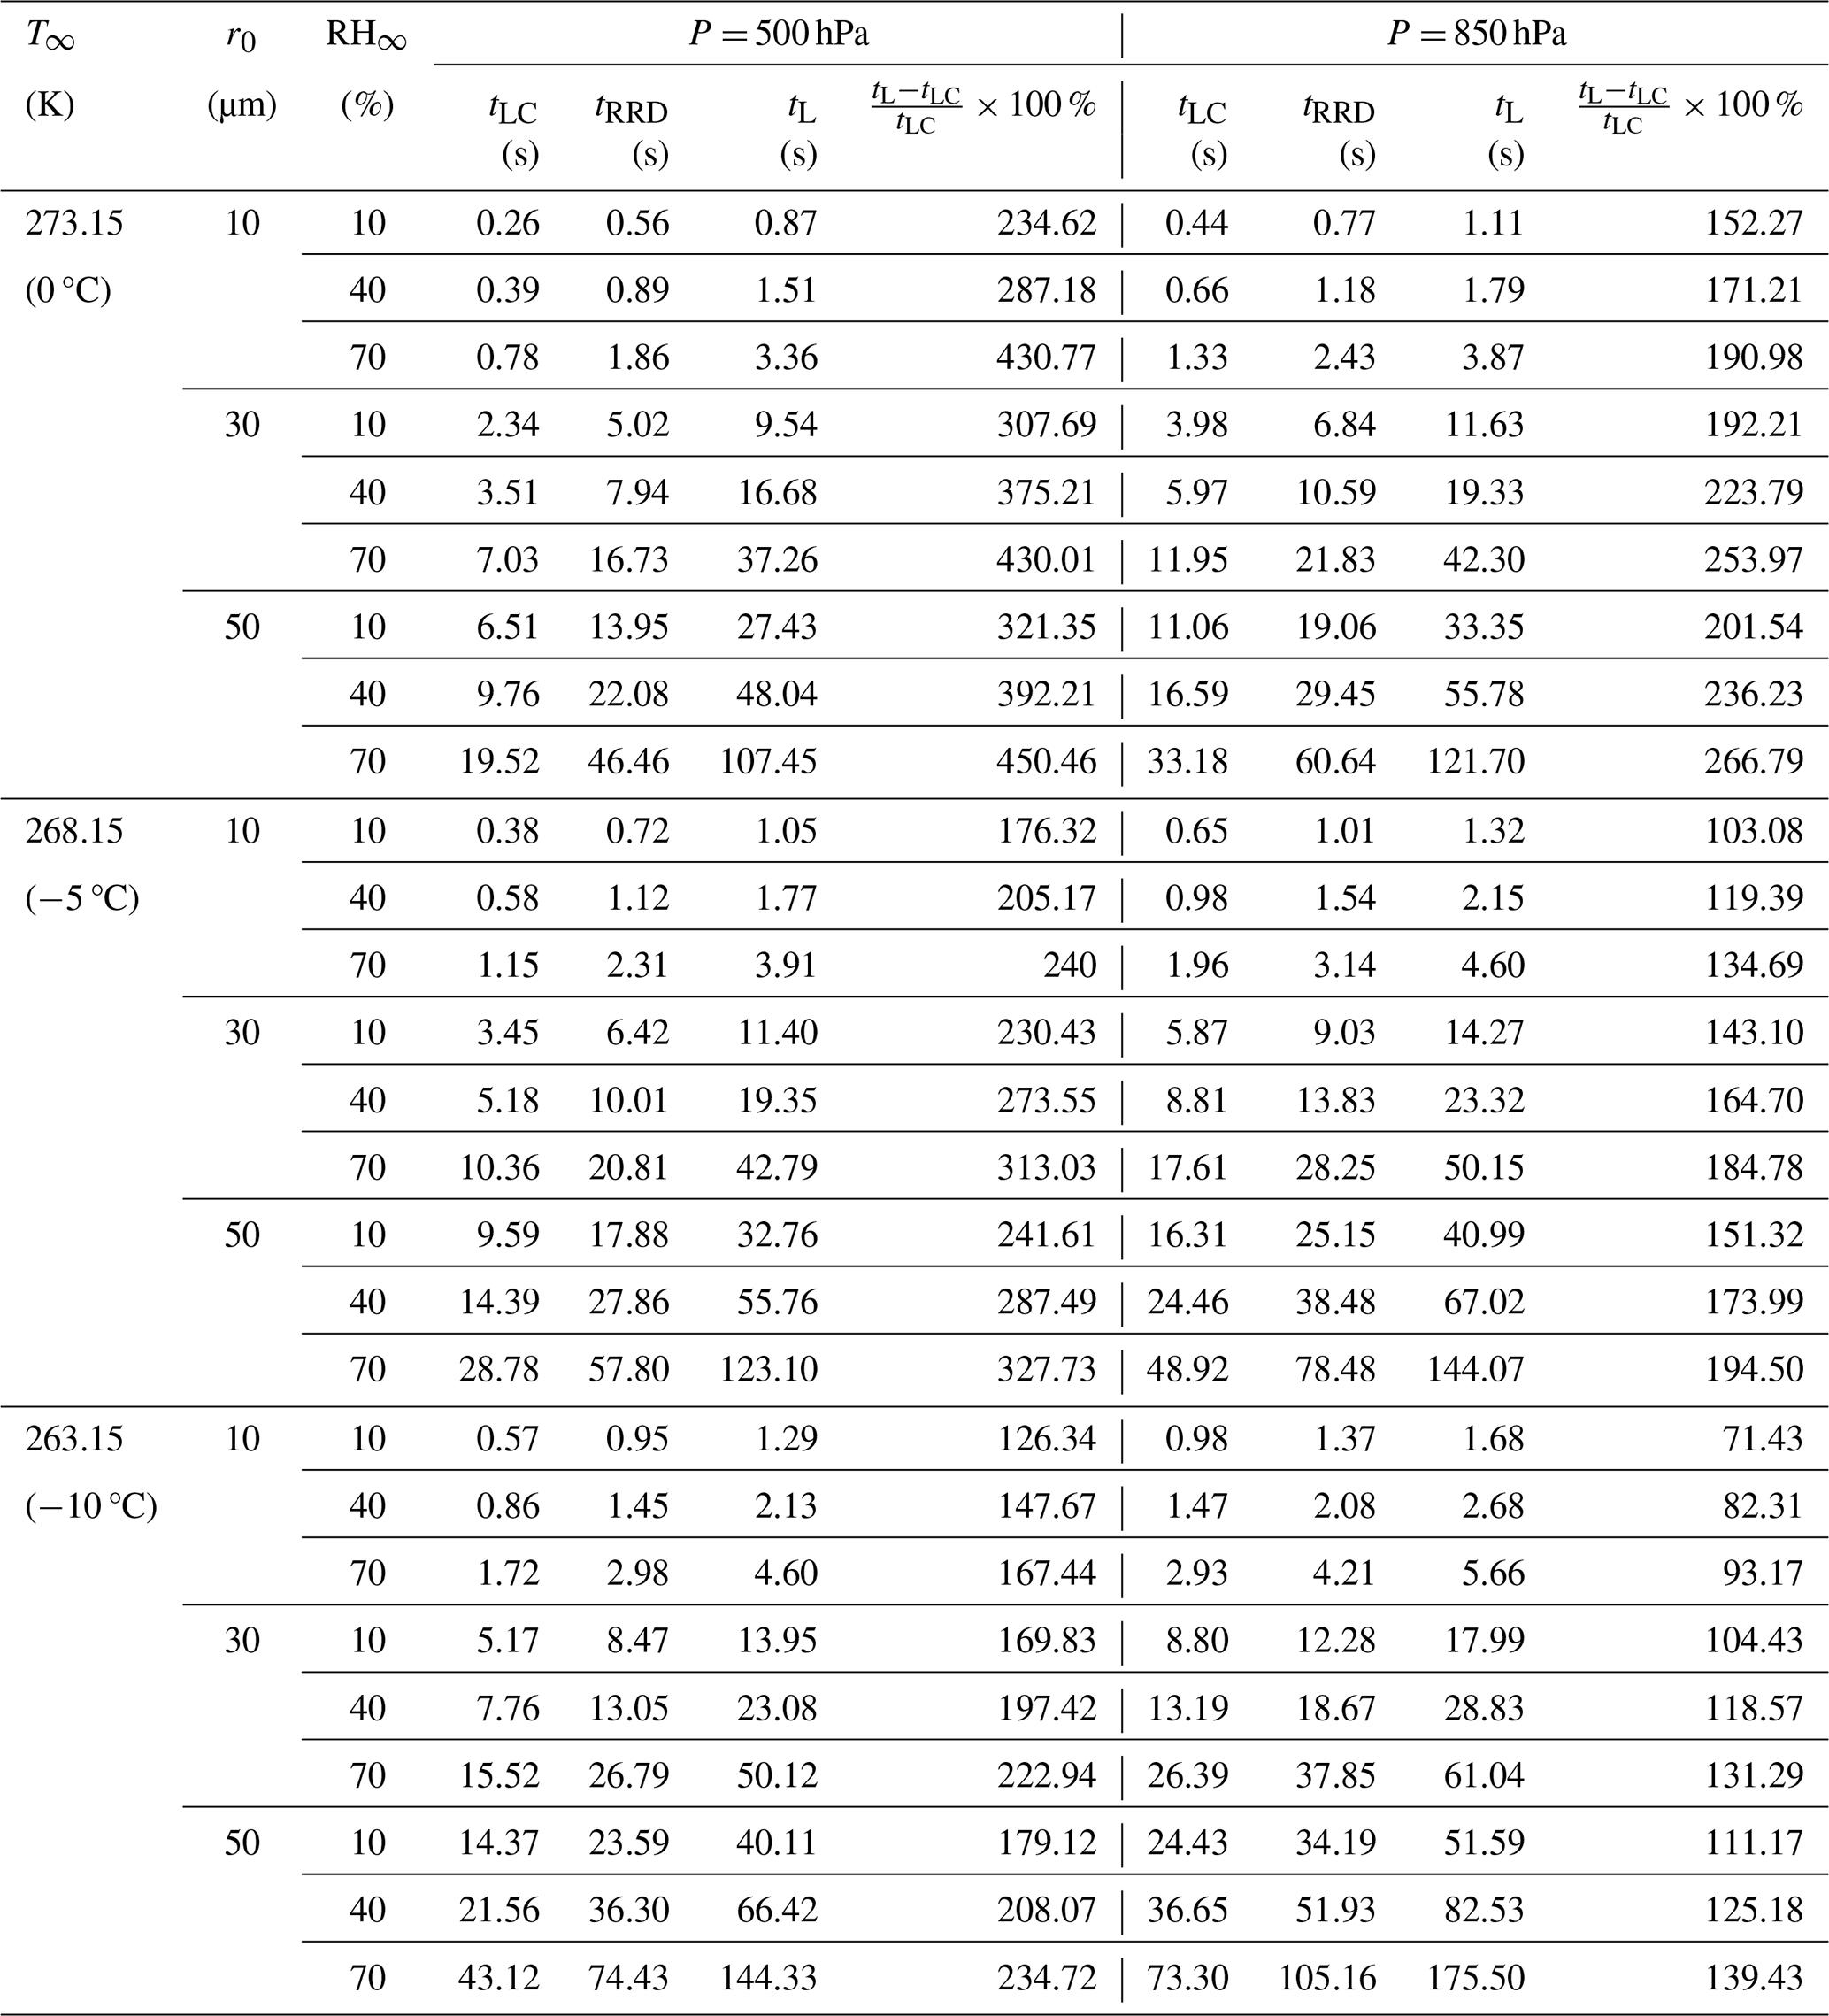
Table 2Comparison between different timescales (in seconds), in this study and other studies, for all of the cut-off radii used in this study. These include droplet lifetimes using the Maxwellian diffusion-limited evaporation approach (tLC), the bulk droplet approach in Roy et al. (2023) (tRRD), and the approach calculated from this study (tL), for initial droplet radii (r0 = 10, 30 and 50 µm), relative humidities (RH∞ = 10 %, 40 %, and 70 %), pressures (P = 500 and 850 hPa), and ambient temperature (T∞ = 273.15 K (0 °C), 268.15 K (−5 °C), and 263.15 K (−10 °C)).
2.2 Justification for choice of environmental parameters in the simulations
Probing the evolution of the droplet and its immediate environment under a wide swath of conditions was computationally too expensive; thus, certain choices regarding the parameter selection were made. The assumption behind the computational setup is that the supercooled droplet is suddenly introduced to a subsaturated environment with ambient temperature, T∞ = 273.15, 268.15, or 263.15 K, as might happen when the droplets are near cloud boundaries, such as those occurring in cloud-top-generating cells. These temperatures are the ones where the activation of INPs is thought to be least effective. Calculations presented in Sect. 4 consider three different environments having ambient relative humidity (RH∞ = 10 %, 40 %, and 70 %), two different ambient pressures (P = 500 and 850 hPa), and initial cloud droplet radii (r0=10, 30, and 50 µm). The pressure levels were chosen based on the occurrence of 273.15, 268.15, and 263.15 K in standard atmospheric profiles for tropical latitudes and middle latitudes under warm- and cool-season conditions (Standard Atmosphere, 2021). Overall, 90 numerical experiments were performed using various combinations of initial RH∞, T∞, P, and r0 to obtain a better understanding of the relationships between the evolution of droplet temperatures and radii and environmental variables. Of these, the results of 54 experiments are reported in detail herein. The results of these experiments are later summarized in Figs. 3–10 and Tables 1 and 2. The specific combinations of environmental parameters and initial droplet radii used in this study were also selected to enable easy comparison with results from a previous study of droplet evaporation (Roy et al., 2023). Also note that the effect of radiation in this study was neglected, based on Roy et al. (2023), which demonstrated the negligible role played by radiation in modifying evaporating droplet temperatures under most subsaturated conditions (RH < 80 %).
2.3 Justification for choice of droplet lifetime cut-off
For each experiment, the computational time rose exponentially to maintain numerical stability as the droplet radius decreased during evaporation and as the grid sizes needed to be smaller. To avoid an exceptionally long computation time, the cut-off radius for the simulations was set to be when the volume of the droplets decreased by 99.5 % to reach 0.5 % of the initial droplet volume. For r0 = 10, 20, 30, 40, and 50 µm, the cut-off radii of the droplets are 1.71, 3.42, 5.13, 6.84, and 8.55 µm, respectively. Note that, due to the Raoult effect, for a solution droplet with a mass of dissolved and ionized NaCl = 10−13 g, the reduction in the evaporation rate () from that of a pure water droplet is about 1 % for a 1 µm radius droplet and 4 % for a 0.7 µm droplet. As all cut-off radii considered here are > 1 µm, the solute effect can be neglected. From the Kelvin equation, the equilibrium vapor pressure over a curved surface of pure water approaches the value of the equilibrium vapor pressure over a flat surface of pure water for a radius > 0.01 µm. Thus, curvature effects were also neglected. For simplicity, we will refer to the cut-off time as the droplet lifetime, although the droplets will survive for a longer time before complete evaporation. The droplet lifetime increases with the initial droplet radius, higher atmospheric pressure, and higher RH∞ (Fig. 2).
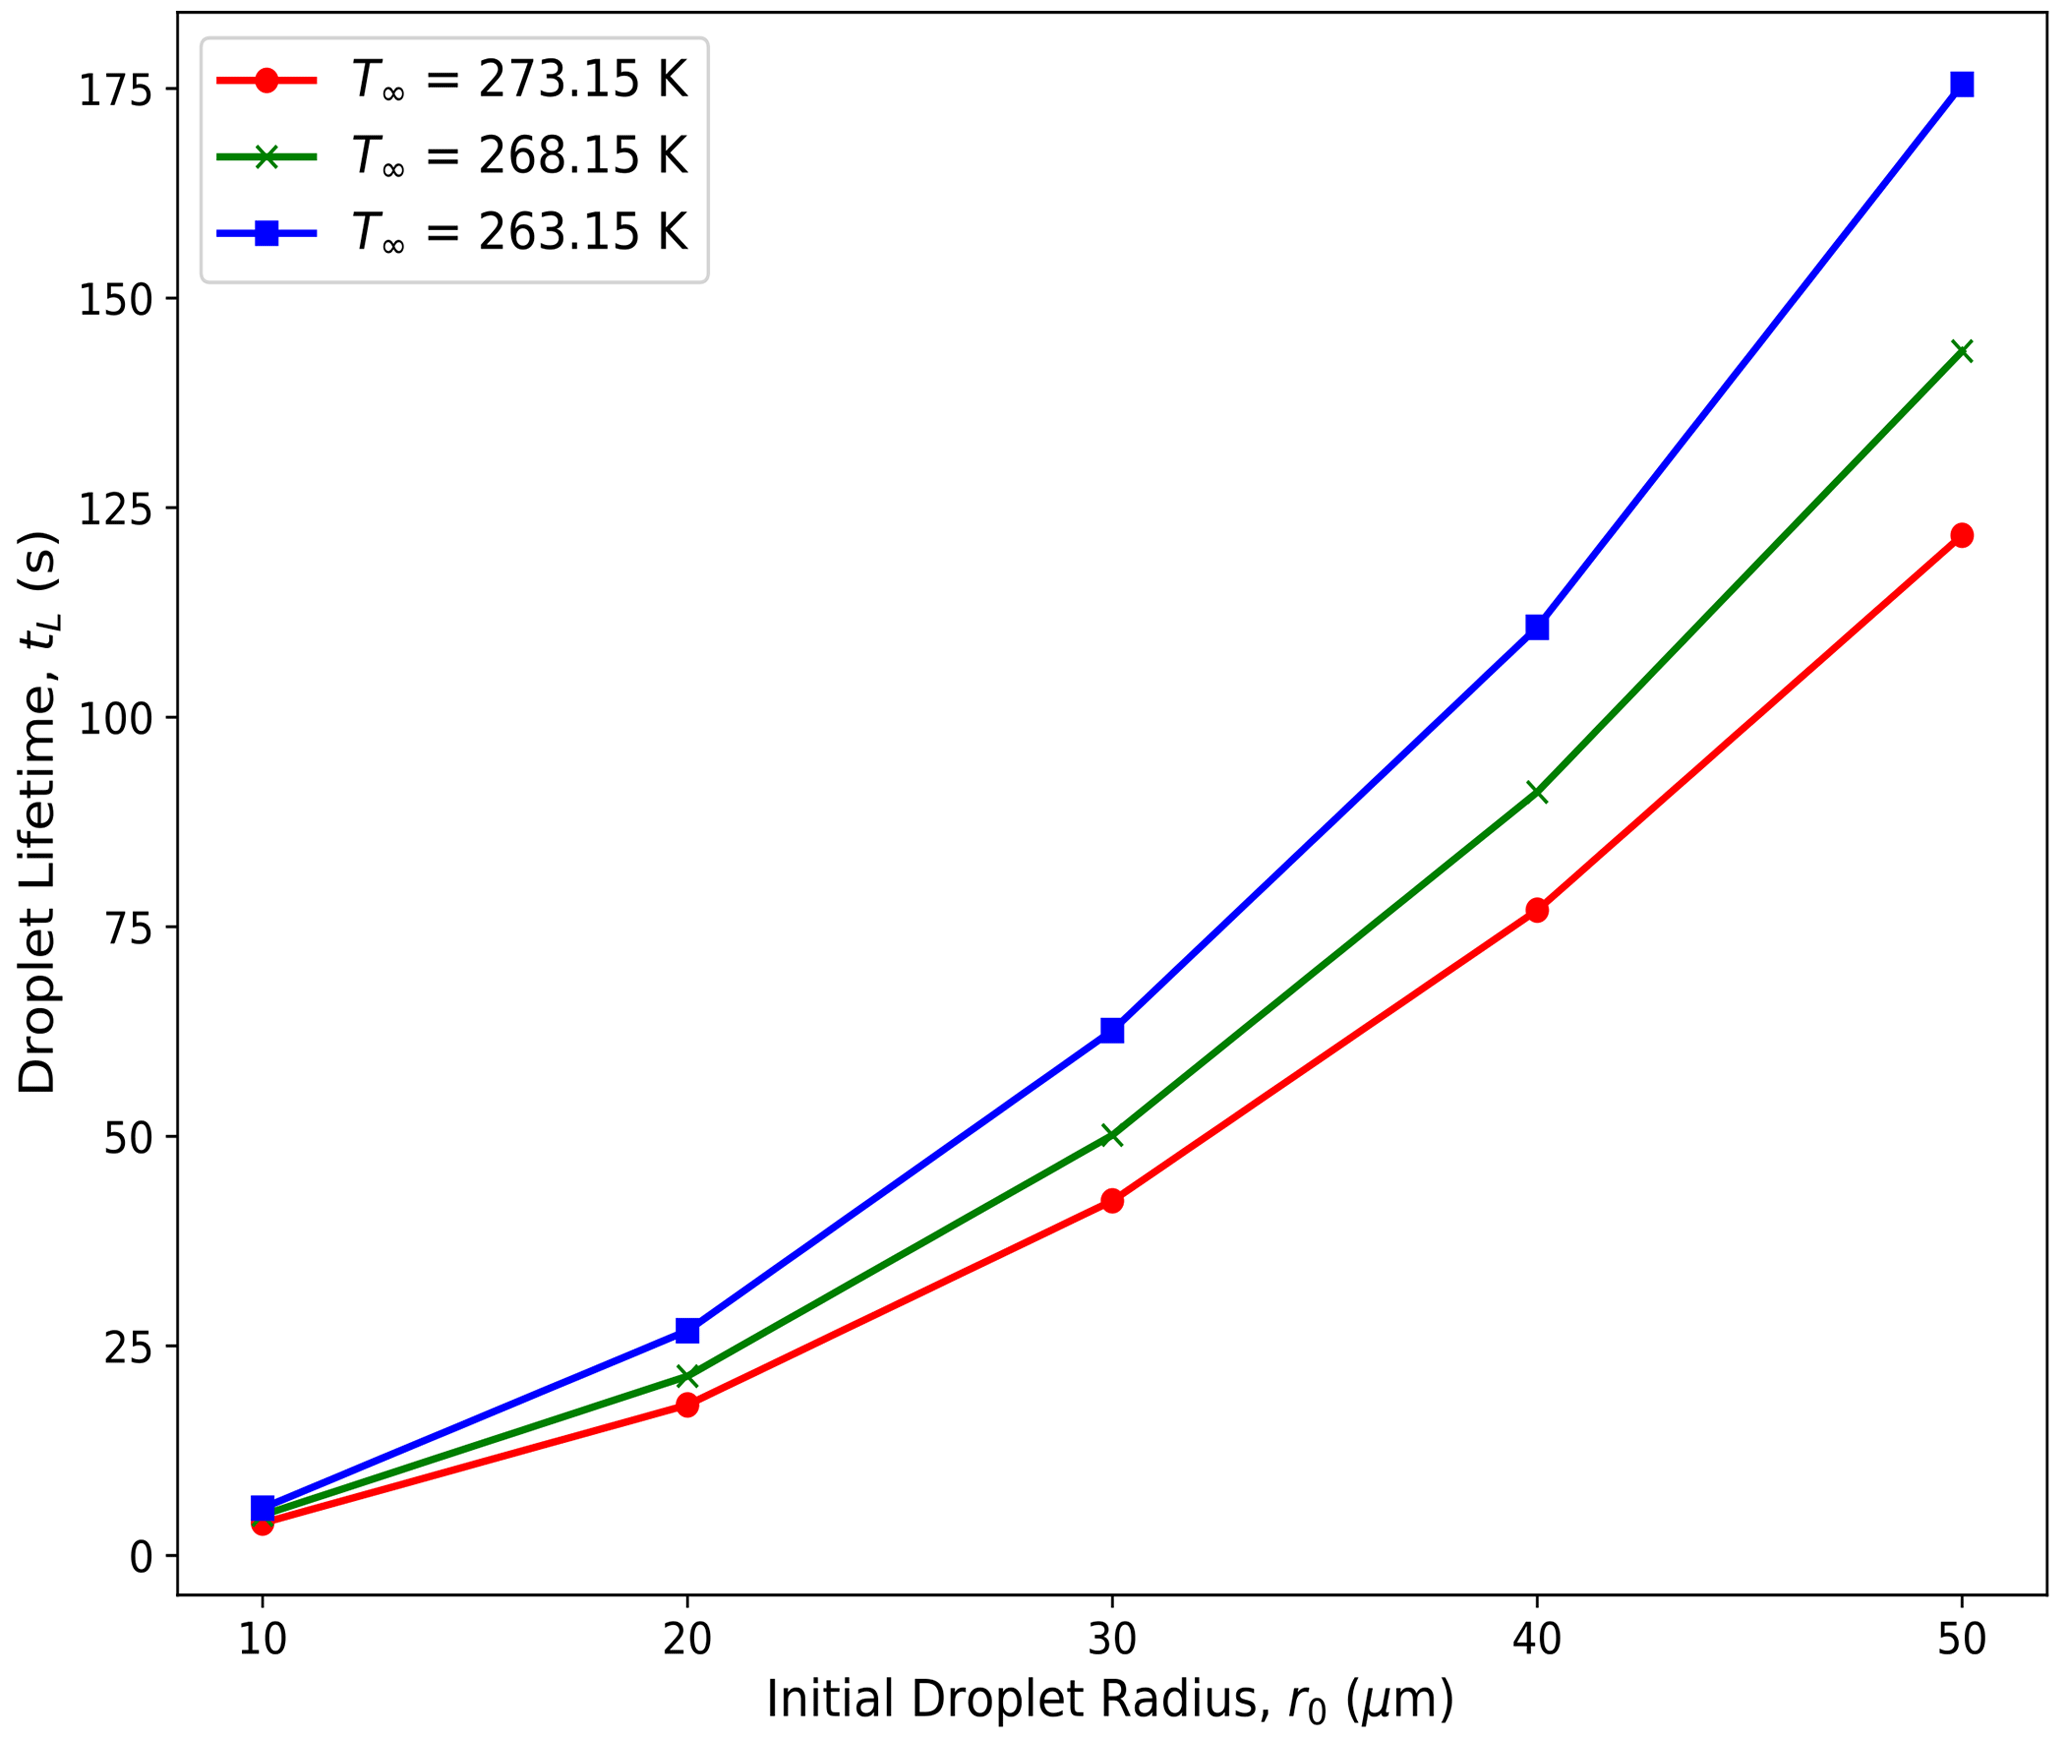
Figure 2Droplet lifetimes (tL; in seconds) for droplets with varying initial droplet radii (r0 = 10, 20, 30, 40, and 50 µm) evaporating in an initial ambient environment with three different ambient temperatures (T∞ = 273.15 (0 °C), 268.15 (−5 °C), and 263.15 (−10 °C) K), with relative humidity (RH∞ = 70 %), and with pressure (P = 850 hPa).
2.4 Sensitivity to domain size
It was important to ensure that the spatiotemporally varying thermal and vapor density gradients in the ambient air in the vicinity of the evaporating droplet do not interfere with the constant ambient conditions (RH∞ and T∞) at the external boundary of the computational domain. Sensitivity tests with different air domain sizes of 10, 30, and 50 times the initial droplet radius were carried out to determine the droplet temperature and radial dependence on domain size. It was found that the evolution of droplet temperature and radius was not sensitive to domain sizes larger than 10 times the droplet radius considered. Based on the sensitivity analysis, the maximum size of the computational domain for all experiments was fixed at 1500 µm, which is 30 times the largest droplet considered.
3.1 Assumptions
The framework of the numerical model assumes that an isolated, stationary, spherical, and pure-water droplet is suspended within a 2D axisymmetric ambient-air domain with constant ambient temperature (≤ 0 °C) and relative humidity (< 100 %) at a sufficiently far distance away from the droplet that the droplet evaporation does not influence the far environment. The water droplet and air are considered to be Newtonian fluids, with the assumption that no internal circulation occurs within the droplet, and there is no ventilation, radiative heat transfer, or buoyancy effects due to gravity. This computational approach is an advanced form of the one described in Roy et al. (2023) but also includes the effect of internal droplet heat transfer and spatiotemporal gradients in temperature and vapor density between the droplet and the environment (see the discussion in Sect. 5).
3.2 Governing equations
Based on the above assumptions, the following are the equations governing the system during droplet evaporation in the ambient air.
-
Fluid flow. The “laminar flow” interface models the weakly compressible form of the Navier–Stokes equation, along with the continuity equation in the water and air domains, as
where t is time; ρ is the fluid density (kg m−3); u is the fluid velocity vector (m s−1); p is pressure (Pa); TR is the transpose; I is the identity tensor; τ is the viscous stress tensor (Pa); F is the external volume force vector (N m−3), which is assumed to be negligible here; and μ is the fluid dynamic viscosity. For water below 273.15 K, the dynamic viscosity can be approximated as 1.79 mPa s. For air, COMSOL uses an empirical equation that produces values equivalent to Sutherland's law (White, 2006); i.e., μ = , where μ0 = 1.716 × 10⁻⁵ N s m−2, T0 = 273 K, and Sμ = 111 K for air. The empirical equation is given as follows:
-
Heat transport. The “heat transfer in fluid” interface models heat transfer in all domains (air, water, and infinite-element domain) using the following version of the heat equation:
where ρ (kg m−3) is the fluid density, Cp (J (kg K)−1) is the fluid heat capacity at constant pressure, T is the temperature, k (W (m K)−1) is the fluid thermal conductivity, u (m s−1) is the fluid velocity field from the laminar flow interface, and q (W m−2) is the heat flux by conduction. We chose the value of k for supercooled water at 0.56 , based on Fig. 3 in Biddle et al. (2013), where the thermal conductivity of supercooled water is very close to 0.56 W (m K)−1 for the range of temperatures used in this study. Based on Beard and Pruppacher (1971), the thermal conductivity of air, given by ka = (), has a very weak dependence on the temperature over the temperature range used in this study. For both T = 273.15 and 253.15 K, the value of ka is 0.02 . Hence, we have used a constant value of 0.02 .
-
Mass transport. The “transport of diluted species” interface models water vapor transport through Fick's laws of diffusion, solving the mass conservation equation for vapor transfer in all domains, except within the cloud droplet, as follows:
where c is the concentration of water vapor (mol m−3), D denotes the diffusion coefficient (m2 s−1), and J is the mass diffusive flux vector (mol (m2 s)−1). D is calculated following Hall and Pruppacher (1976) and defined as follows: (m2 s−1), with reference pressure (P0 = 1013.25 hPa), reference temperature (T0 = 273.15 K), atmospheric temperature (T), and pressure (P). In this study, values of P are either fixed at 500 or 850 hPa to determine the effect of ambient-air pressure on droplet evaporation. J is obtained from the laminar flow interface through coupling between these interfaces.
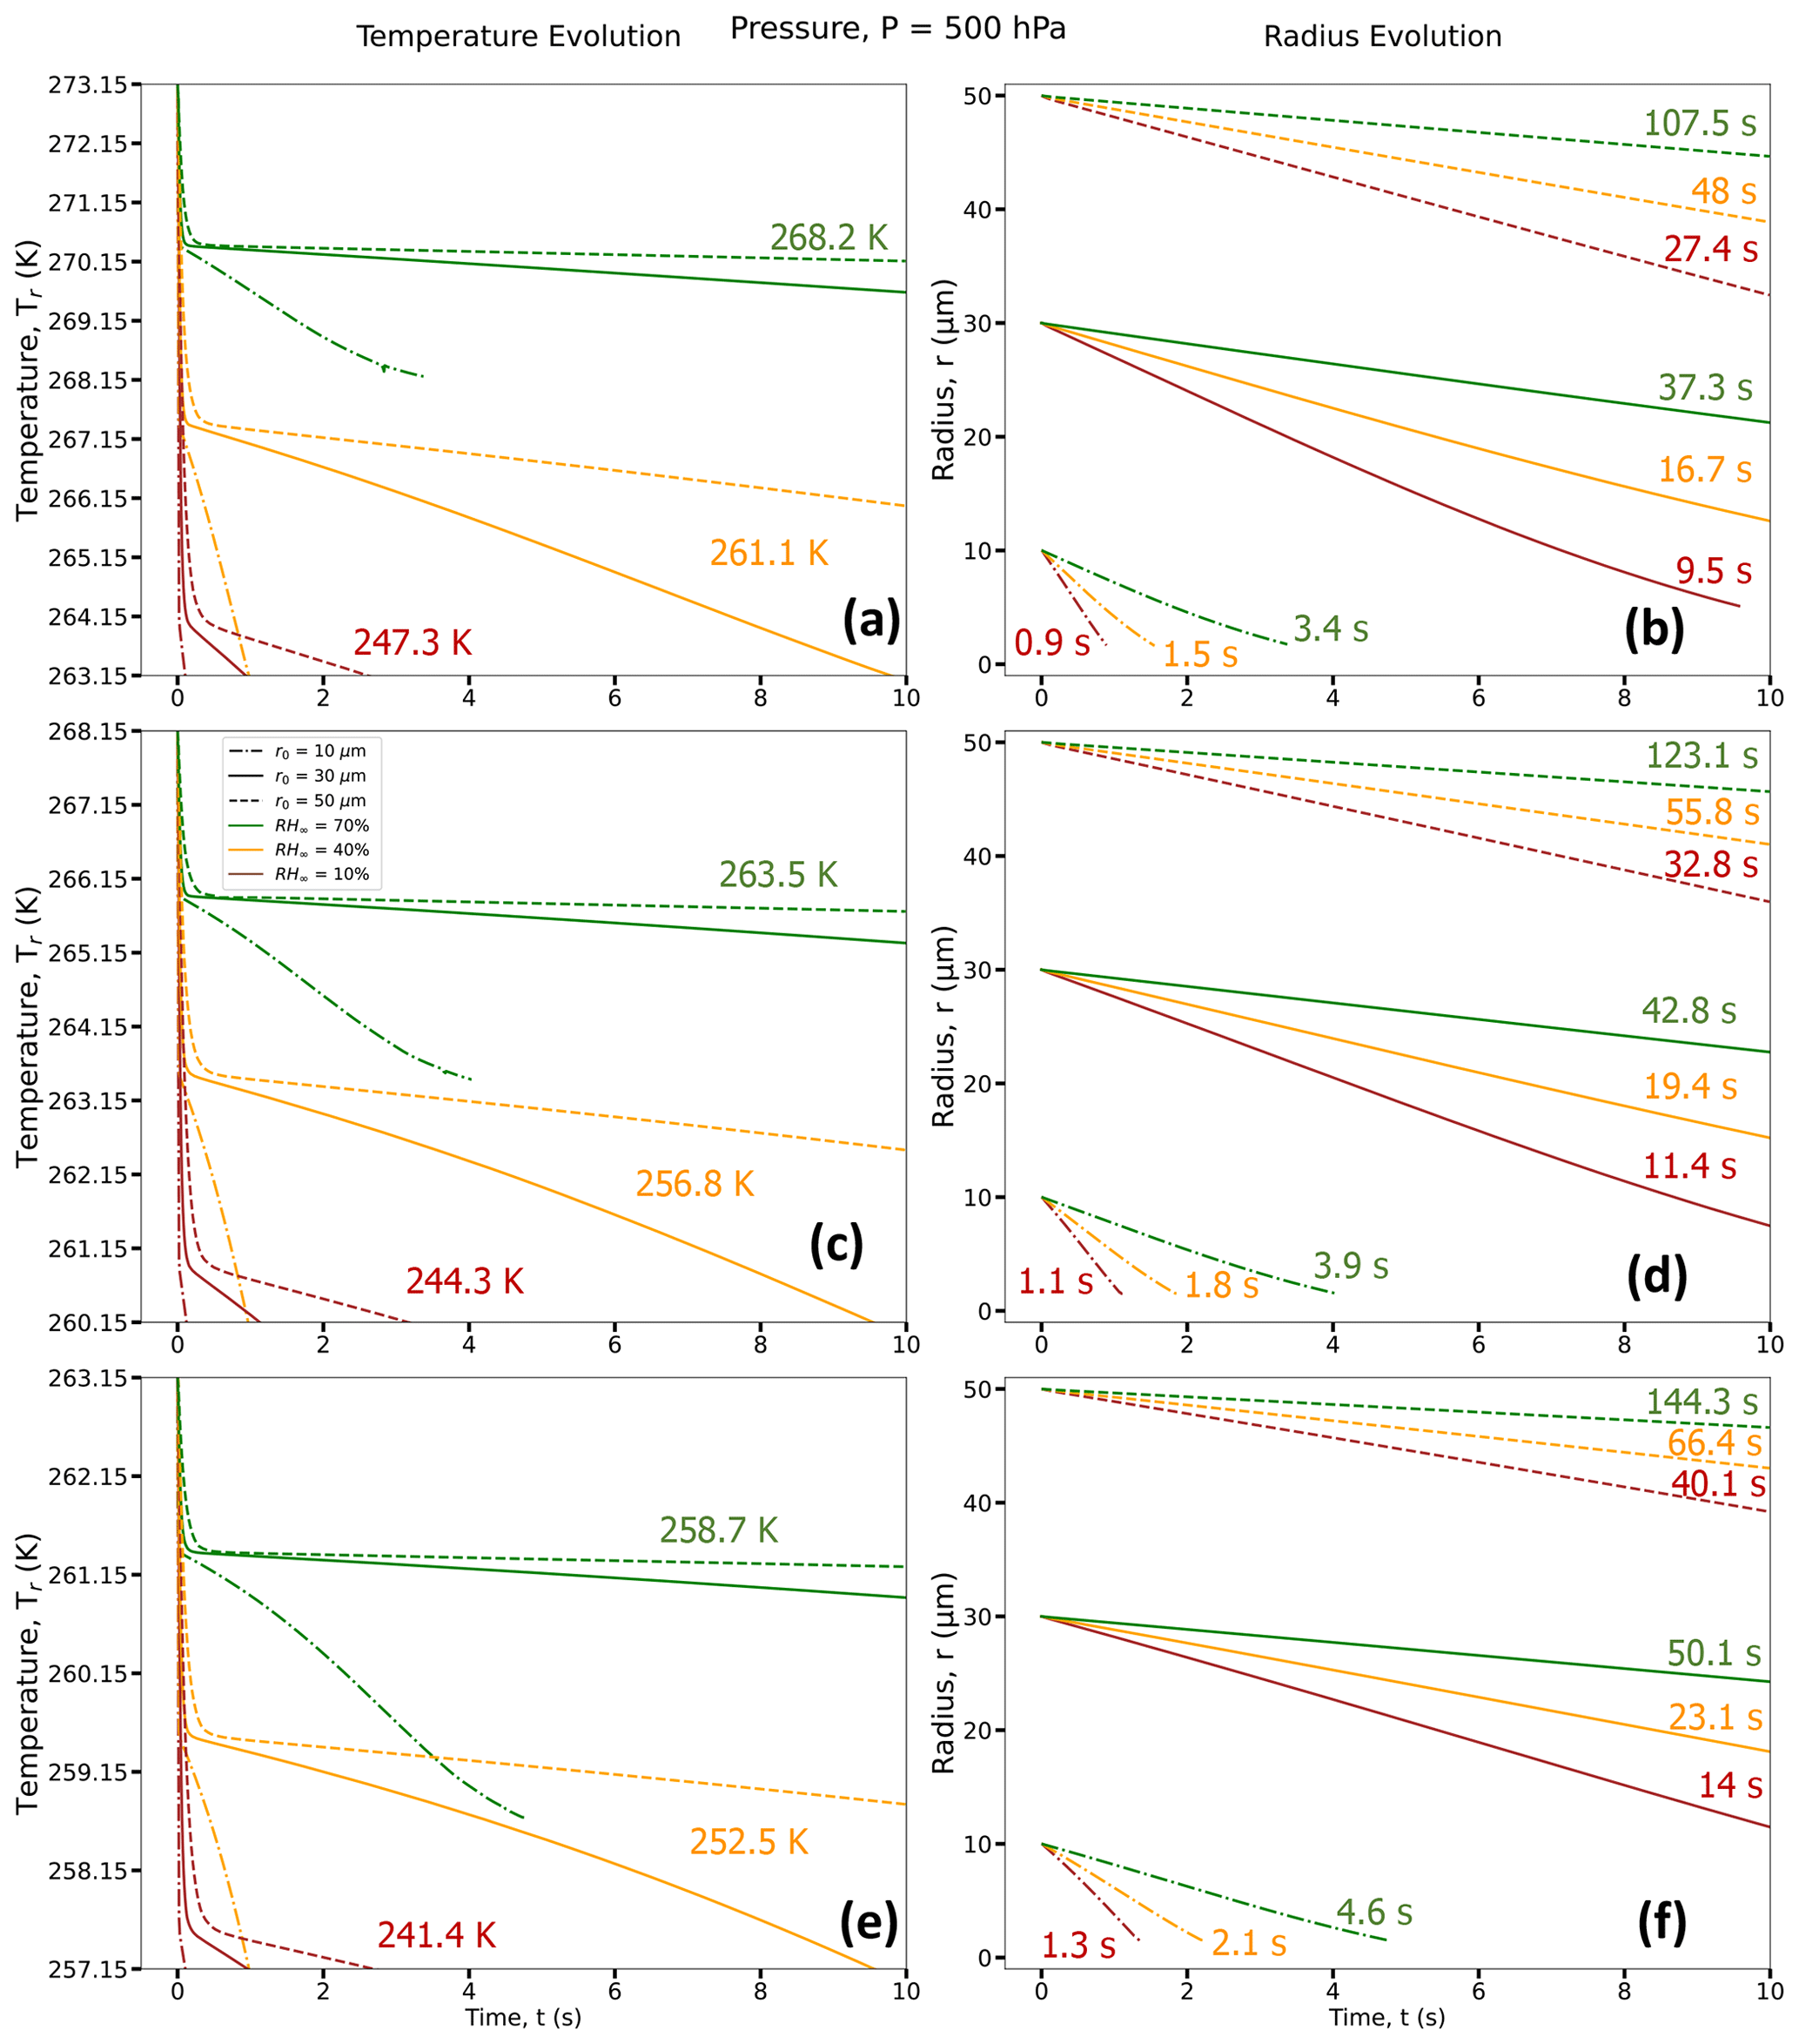
Figure 3Droplet temperature evolution (a, c, and e) and radius evolution (b, d, and f) for three different RH∞ (RH∞ = 10 % (brown curves), 40 % (orange curves), and 70 % (green curves)); three different r0 (r0 = 10 µm (dotted–dashed lines), 30 µm (solid lines), and 50 µm (dashed lines)); and three different T∞ = 273.15 K (0 °C) (a, b), 268.15 K (−5 °C) (c, d), and 263.15 K (−10 °C) (e, f); and for P = 500 hPa. For each RH∞, the average droplet temperature at the end of the lifetimes of the three droplets with different r0 (TL, in K) is given in panels (a, c, and e) and the time taken to reach the end of its lifetime (tL; in s) is given in panels (b, d, and f). Exact values of final temperature for each r0 are given in Table 1.
3.3 Initial conditions
The initial velocity components in the r and z directions are assumed to be 0 m s−1 in both air and water domains. The initial fluid pressure is p = P0,air (Pa), specified either at 500 or 850 hPa in the air domain, and in the water domain it is p = Pa, where surface tension is σ = 70 × 10−3 (N m−1). For the heat transfer module, all domains are assumed to be at a prescribed initial ambient temperature, T0, which is the same as that of a point at a far distance from the droplet, T∞.
For the vapor transfer interface, except within the droplet, all domains are at an initial vapor concentration of c0,air, which is again assumed to be the same as that of the constant ambient concentration value far from the droplet, c∞, and calculated as follows: c∞ = , where RH∞ is set at a constant ambient relative humidity far from the droplet, Runiv = 8.3145 (), and T∞ is in K. The saturation vapor pressure is calculated as = (in Pa; with T∞ in °C), following Alduchov and Eskridge (1996).
3.4 Model constraints and boundary conditions
-
Within the droplet and throughout the domain, the following conditions are applicable:
where n is the normal to an outward-pointing vector from the center of the droplet. This constraint limits water mass, water vapor, and heat flow to the direction normal to the droplet surface.
-
At the fluid–fluid interface, i.e., droplet–air boundary, the droplet surface is assumed to be at vapor saturation throughout its lifetime. Hence, saturated vapor concentration at the shrinking droplet boundary, using the ideal gas law, is given by , where Tsf is the surface temperature (in K). The saturation vapor pressure es(Tsf) is estimated as es(Tsf) = (in Pa; with Tsf in °C), again following Alduchov and Eskridge (1996).
The local evaporative mass flux at the interface is given by diffusion of water vapor across the water–air interface, MJ (), is as follows:
where the molecular weight of water is Mw = 0.018 (kg mol−1). Although the temperature is continuous across the droplet–air boundary, there is a discontinuity in the heat flux across the interface due to the evaporation of water. Thus, the latent heat of evaporation L, defined as L = [2501−2.44Tr] kJ kg−1, with a droplet surface temperature, Tr (in °C), is incorporated as a boundary heat sink, −MJL (W m−2).
The mass balance at the water–vapor boundary at the droplet surface and the velocity of the moving mesh, umesh, at the shrinking water–air interface are expressed by the following equations, based on Scardovelli and Zaleski (1999):
where the subscripts w and v represent water and vapor, respectively.
The stresses are balanced at the water–vapor interface by the following conditions, based on Yang et al. (2014):
where S is the total stress tensor, and ∇σ is the surface gradient operator defined by
In the normal direction of the boundary, the force is balanced by
where rc is the curvature radius.
-
The external air domain boundary is open with the following condition:
where normal stress is f0 = 0 N m−2.
-
The infinite-element domain consists of air and is considered to be an ideal gas. The temperature, relative humidity, and concentration far from the droplet, i.e., at the inner boundary of the infinite-element domain, are fixed at T∞ and c∞, respectively.
3.5 Coupling between COMSOL interfaces
To numerically model the evaporating droplet embedded in the air domain, intercoupling between the three physics interfaces – laminar two-phase flow (formulated within the arbitrary Lagrangian–Eulerian framework), the heat transfer in fluids, and the transport of diluted species within the air medium – are established through the following mechanisms: (i) the local evaporative mass flux at the droplet–air interface, which is related to the mesh velocity for the laminar flow, is determined from the diffusion of water vapor in the air domain; (ii) saturated vapor concentration at the droplet–air interface, which serves as a boundary condition for the vapor diffusion, is calculated using the local temperature at the droplet interface; and (iii) the evaporative heat flux at the droplet–air interface acts as a heat sink boundary condition for the heat transfer in fluids module.
Since evaporation is a surface phenomenon, with the evaporative cooling at the droplet surface acting as a heat sink, the temperature of the evaporating droplet surface should be lower than the center of the droplet. In all simulations, the center to surface temperature gradient within the droplet forms almost instantaneously as evaporative cooling at the droplet surface occurs extremely fast. The time required for the droplet to reach internal thermal equilibrium depended slightly on the initial size of the droplet and the ambient RH∞, with larger droplets and drier environments leading to more time required by the droplets to reach equilibrium. However, generally, for typical cloud droplet sizes and environmental conditions considered here (r0 = 10, 30, 50 µm), the internal thermal gradients dissipate, and the temperatures throughout the droplets become uniform in ≤ 0.3 s, consistent with Fick's laws of diffusion with a diffusive timescale of , where r is the length scale, and D is the thermal diffusivity of water. For this study, we have simulated an internal droplet heat transfer for the entirety of the droplet lifetime and will be reporting the average droplet temperatures as “droplet temperatures” in the results, unless noted otherwise.
4.1 Droplet thermal and radial evolution: influence of initial droplet size and environmental factors
Figures 3 and 4 depict the early evolution of the droplet average temperatures and radii (r0 = 10, 30, and 50 µm) for the first few seconds of their lifetimes (as defined in Sect. 2.3) and for different environments with constant ambient conditions (T∞, RH∞, and P) far from the droplet. Tables 1 and 2 provide the final temperature values and total lifetimes of the droplets. Figures 3 and 4 also state the droplet temperatures at the end of their lifetimes (TL) and the total lifetimes of the droplets (tL). For all numerical experiments, the evaporating droplet temperature decreases sharply, within < 0.5 s, to a certain temperature defined here as the transition point, Ti, where the slope of the curve changes. After reaching Ti, the decrease in droplet temperature is relatively more gradual, as can be seen from Figs. 3 and 4. For example, in Fig. 3c, for P = 500 hPa, T∞ = 268.15 K (−5 °C), and RH∞ = 10 %, a droplet with r0 = 10 µm takes about 0.03 s to reach Ti at 260.98 K (a decrease of 7.17 K from initial temperature). In contrast, a 30 µm droplet takes about 0.12 s to reach Ti at 260.85 K (a decrease of 7.3 K from initial temperature), and a 50 µm droplet takes about 0.33 s to reach Ti. Finally, the 10 µm droplet reaches the end of its lifetime in 1.05 s, i.e., tL = 1.05 s with temperature TL = 244.12 K after reaching Ti, while for the 30 µm droplet, tL = 11.4 s with TL = 244.31 K, and tL = 32.76 s for the 50 µm droplet with TL = 244.29 K after reaching Ti.
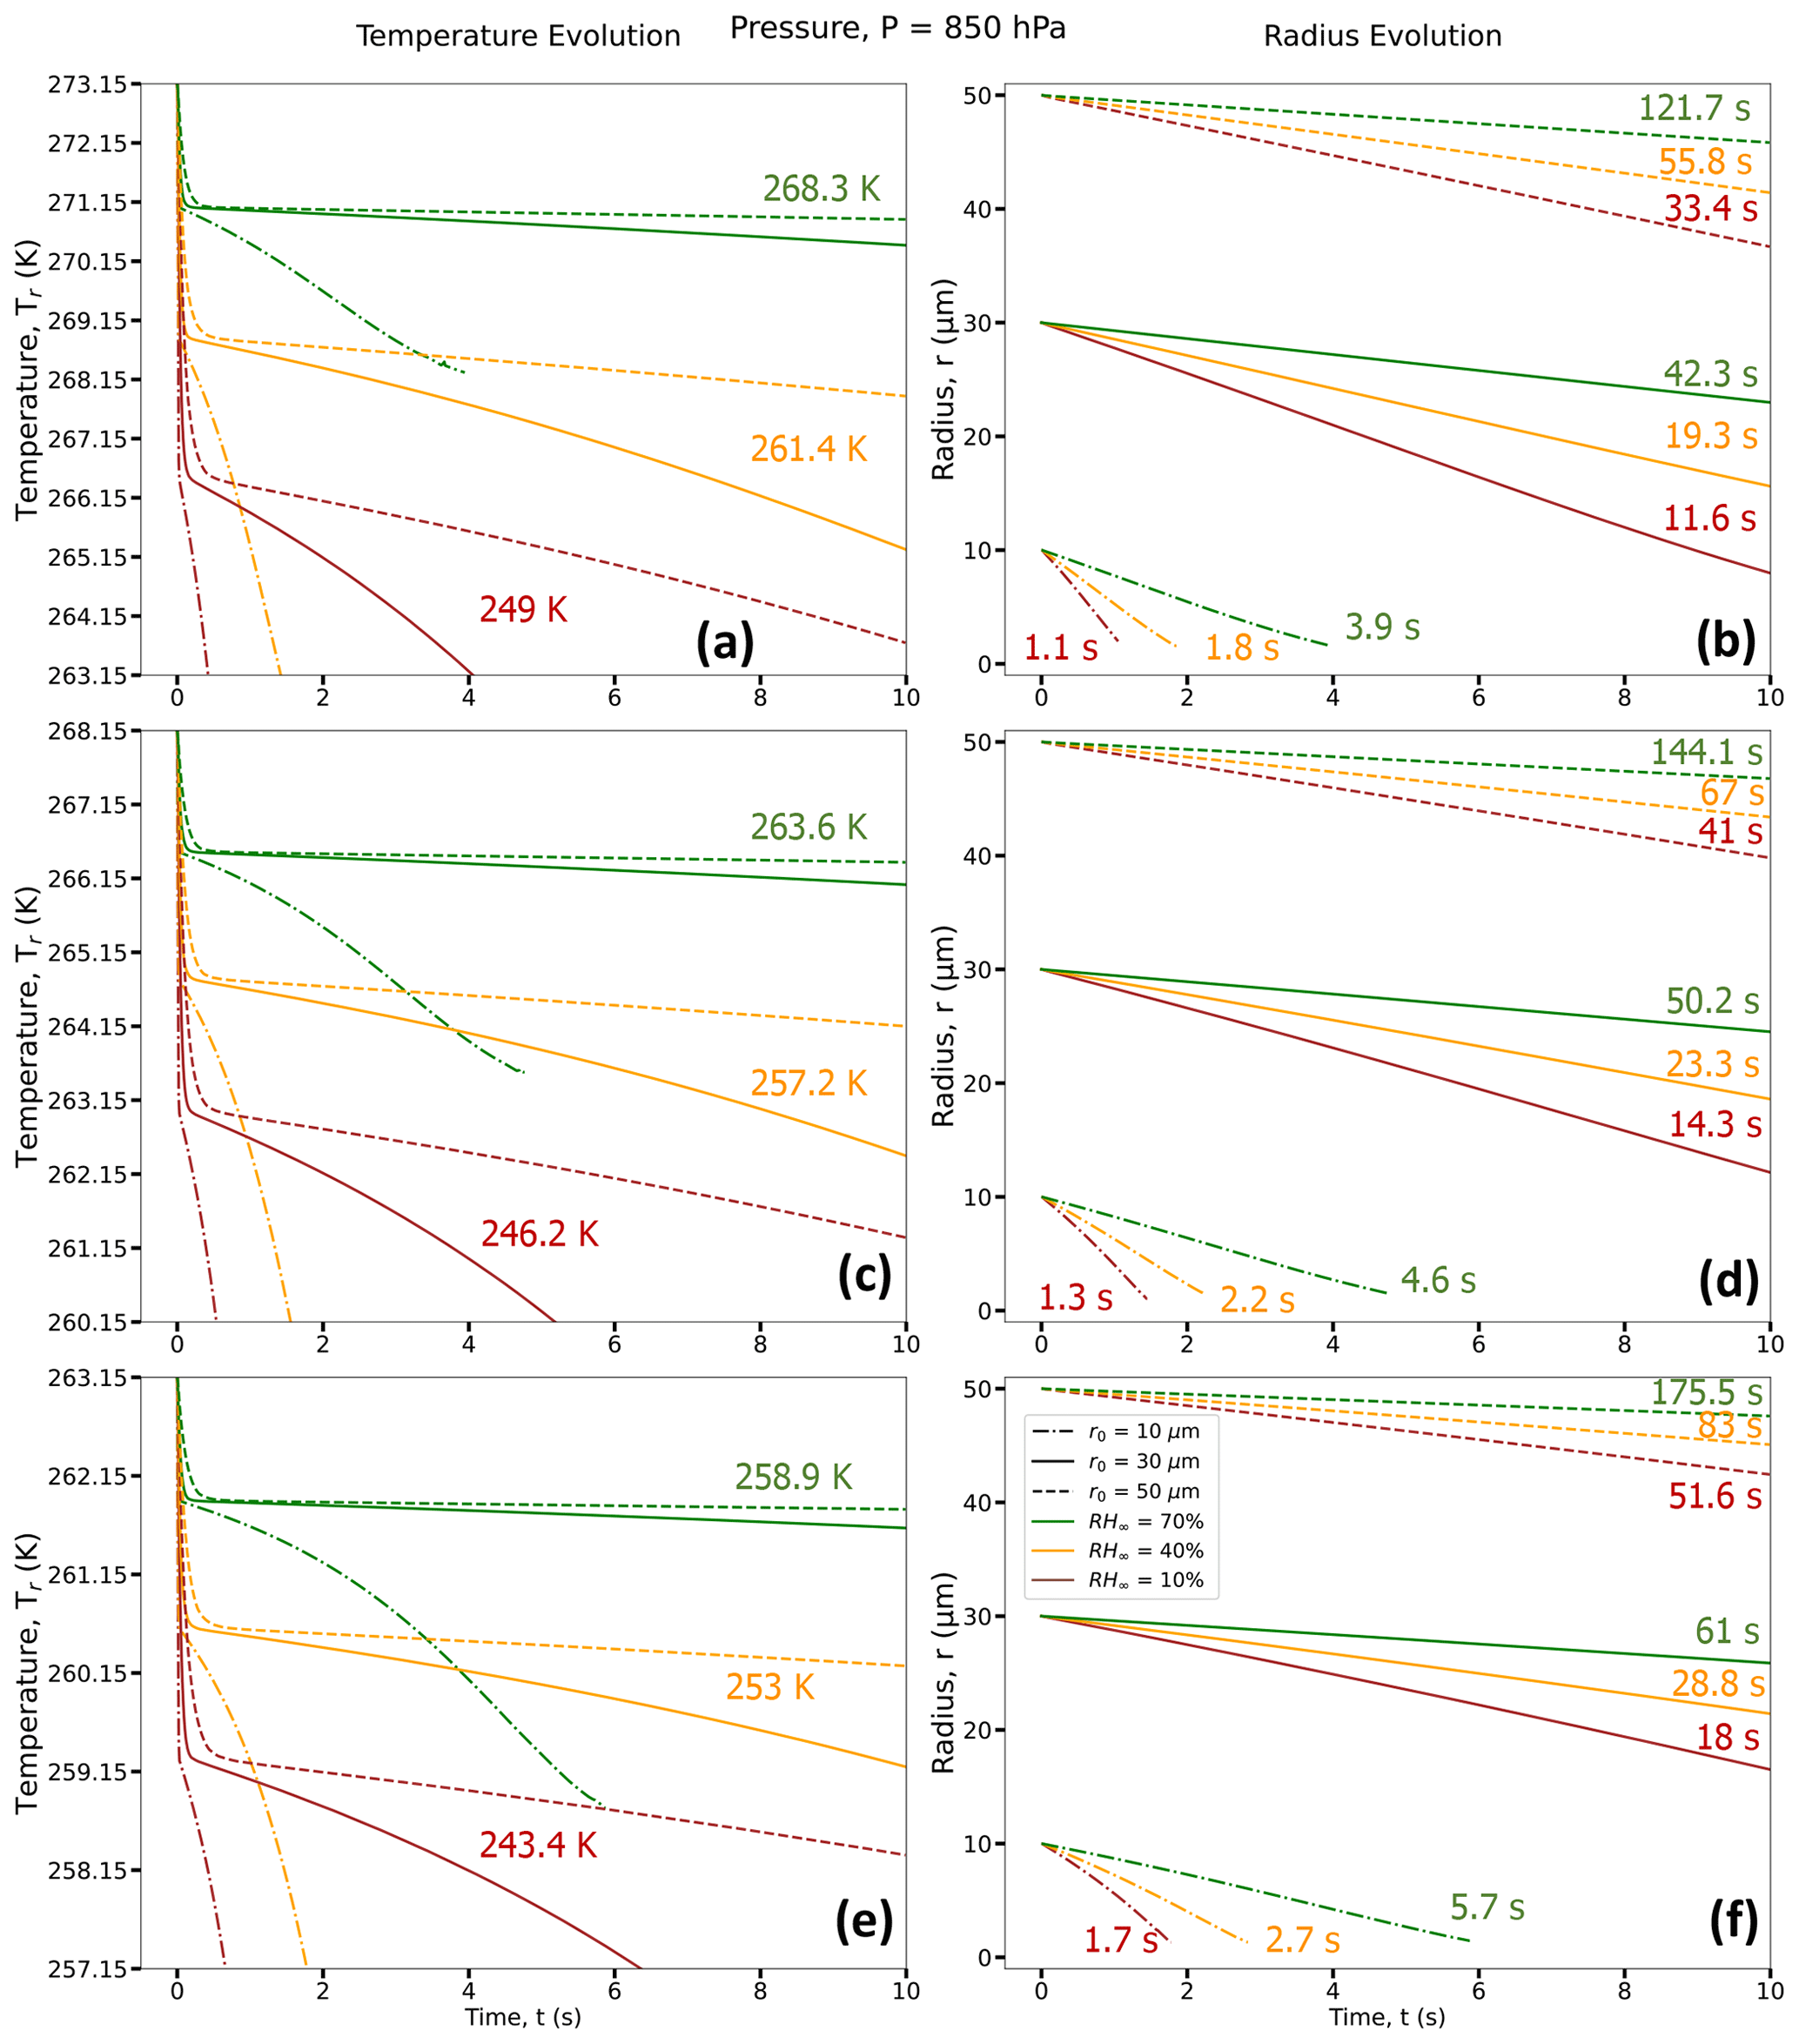
The evaporation process in these experiments starts with a condition that is far from equilibrium. The coupled air droplet system attempts to evolve towards a steady state, where the thermal energy towards the droplet compensates for evaporative cooling at the droplet surface. In this process, the droplet initially rapidly cools to the thermodynamic wet-bulb temperature of the initial environment similar to what has been shown in Roy et al. (2023). However, under low relative humidity conditions, the thermal and vapor diffusion are not yet near equilibrium. As the system attempts to achieve a steady state, the imbalance in the heat fluxes associated with vapor and thermal diffusion in the immediate vicinity of the drop leads to a gradual reduction in the wet-bulb temperature of the immediate droplet environment, leading to a continued slow decrease in the droplet temperature as the droplet continues to evaporate.
In general, we can see that a higher ambient T∞ and lower RH∞ and P leads to a larger reduction in droplet temperature from its initial temperature. Therefore, drier, relatively warmer (closer to 0 °C), and lower-pressure environments lead to the strongest evaporative cooling of the droplets. Also, due to evaporative cooling, the droplets survive longer as compared to the pure diffusion-limited evaporation approach, where the decreases in evaporating droplet temperature have not been considered (see Sect. 5). However, drier, relatively warmer (close to 0 °C), and lower-pressure environments lead to smaller droplet lifetimes compared to more humid environments with lower ambient temperatures and higher pressures.
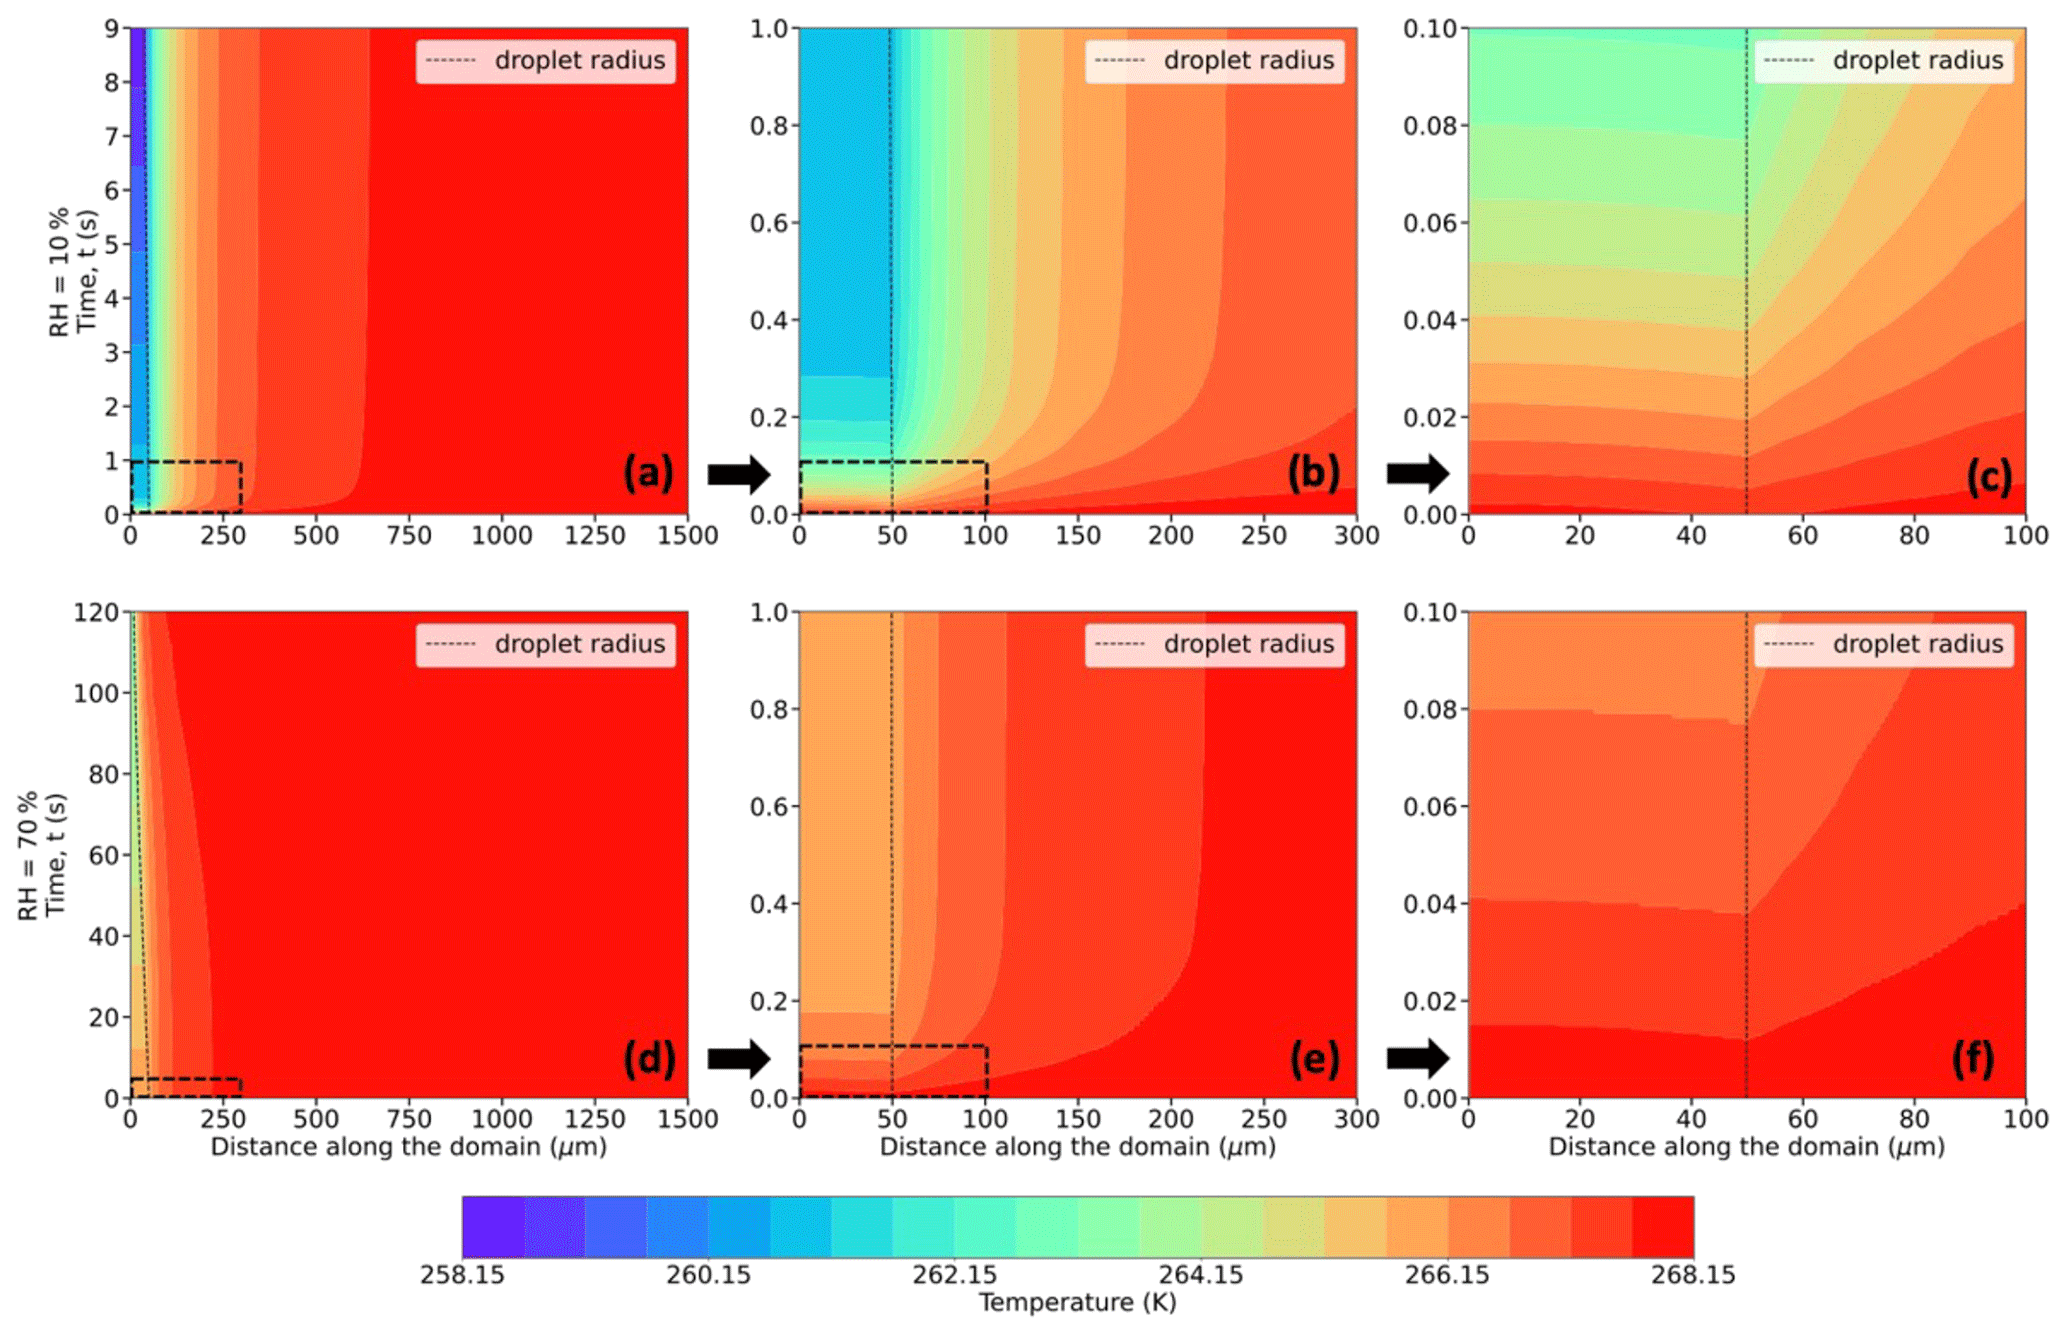
Figure 5Evolution of temperature (in K; shaded contours) and droplet radius (in µm; dashed black trace) for a 50 µm droplet immersed in an environment with T∞ = 268.15 K (−5 °C), P = 500 hPa, and RH∞ = 10 % (a–c) and 70 % (d–f). The bottom-left corner of each plot refers to the center of the droplet at (r,z) = (0,0). The distance along the domain refers to the radial distance from the center of the droplet. Panels (b) and (e) and (c) and (f) present zoomed-in plot areas marked by the dashed boxes in panels (a) and (d) and (b) and (e), respectively.
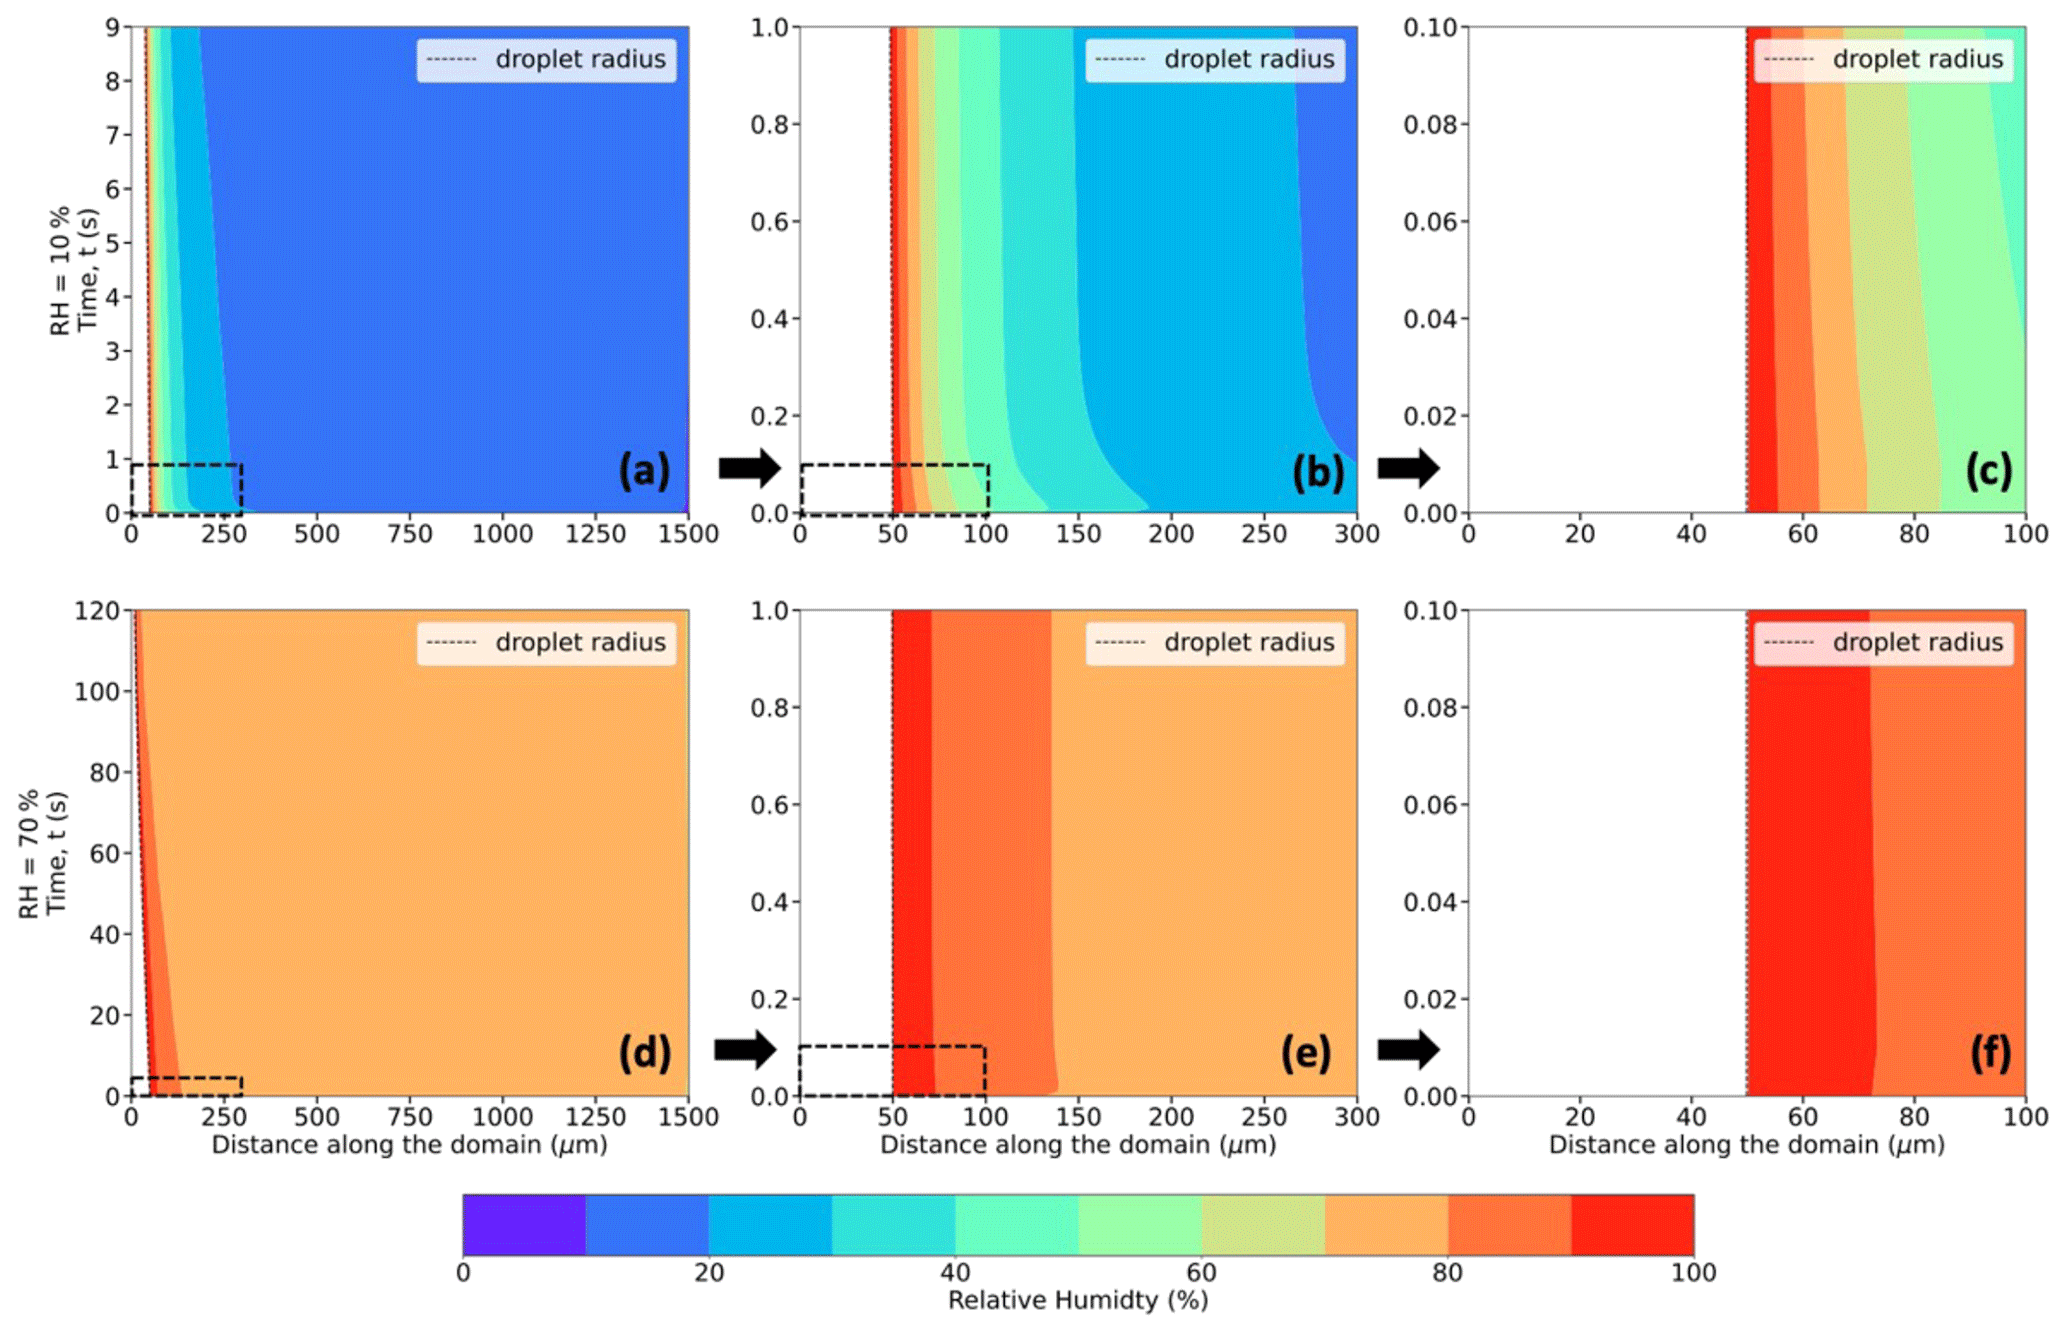
Figure 6Same as Fig. 5 but for relative humidity (in %; shaded contours) instead of temperature.
4.2 Environmental evolution: evolution of temperature, relative humidity, and wet-bulb temperature in the air domain near the droplet
Figures 5–7 (panels a and d) show radial cross sections of the computational domain, starting from the center of the droplet at (r,z) = (0,0), along the r axis, and to the edge of the domain at r = 1500 µm, while Figs. 5–7 (panels b and e) expand the dashed-box regions of Figs. 5–7 (panels a and d), and Figs. 5–7 (panels c and f) further expand the dashed-box regions of Figs. 5–7 (panels b and e). All panels show the spatiotemporal evolution of temperature (Fig. 5), relative humidity (Fig. 6), thermodynamic wet-bulb temperature (Fig. 7), and droplet radius for a droplet with the initial radius (r0 = 50 µm) introduced to an initial environment with pressure (P = 500 hPa), with ambient temperature (T∞ = 268.15 K) (−5 °C), and with two different relative humidities (RH∞ = 10 % and 70 %). The evolution of temperature within the droplet is left of the dashed black line, which denotes the droplet radius.
As the droplet evaporates in the subsaturated domain, evaporative cooling occurs at the droplet surface, leading to heat transfer both from within the warmer droplet and the surrounding air to balance the cooling at the droplet surface. Since the droplet has no constant internal heat source, the internal thermal gradients dissipate quite fast (within 0.3 s), and the average droplet temperatures continue to decrease as the droplet evaporates. Due to heat exchange between the droplet surface and the ambient air in its vicinity, transient thermal gradients in the ambient air develop and lead to a decrease in the air temperature near the droplet. As the droplet shrinks in size along with cooling further, the colder envelope of air surrounding the droplet shrinks as well, and the ambient air far from the droplet, at a constant temperature, acts as a heat source and supplies heat to the rest of the domain to attempt to equilibrate the air temperature. Comparing Fig. 5a and d, at the lower RH∞, the magnitude of evaporative cooling is much higher. For example, the average temperature of the 50 µm droplet decreases by ∼ 10 K in 9 s when RH∞ = 10 %, while the decrease is ∼ 5 K in 120 s when RH∞ = 70 %.
In these simulations, the air in contact with the droplet surface is saturated with respect to water, i.e., RH = 100 % (Fig. 6a–f), consistent with assumptions of isolated stationary evaporating droplets (Kinzer and Gunn, 1951; Srivastava and Coen, 1992). As the water vapor from the evaporating droplet surface diffuses into the surrounding environment, with an initial RH (same as RH∞) of say 10 %, vapor density gradients, similar to the thermal gradients, appear and impact the immediate environment of the droplet. These spatiotemporally varying thermal and vapor density gradients play an important role in affecting the droplet temperatures, evaporation rates, and, in turn, droplet lifetimes.
Roy et al. (2023) have shown that an evaporating cloud droplet temperature can be well approximated by the thermodynamic wet-bulb temperature of the environment, especially at higher relative humidities and pressures and lower ambient temperatures. Following the iterative procedure used in Roy et al. (2023) to calculate the thermodynamic wet-bulb temperature (TWB), Fig. 7a–f depict the evolution of TWB of the surrounding environment. Unlike previous studies (Srivastava and Coen, 1992; Roy et al., 2023), the ambient environment in this study is not assumed to be spatiotemporally invariant. Hence, as the thermal and vapor density gradients evolve in the ambient air, the TWB of the environment evolves as well, depending on the temperature, relative humidity, and pressure, with the droplet surface temperature being the same as that of the TWB of its immediate environment at all times. It is of interest that the droplet temperature decreases very quickly to Ti within < 0.5 s (Figs. 3 and 4), which agrees very well with the initial TWB of the surrounding environment and the constant value of the thermodynamic wet-bulb temperature far from the droplet (TWB∞). For example, in Fig. 7a–c, T∞ = 268.15 K, P = 500 hPa, RH∞ = 10 %, and TWB∞ = 261.64 K, and in Fig. 7d–f, RH∞ = 70 %, and TWB∞ = 266.13 K. Figure 7 shows the two phases of the evolution of TWB of the immediate environment for two RH∞ environments – initially, there is a very fast decrease in the air temperature at the droplet surface to TWB∞, typically within < 0.3 s, and then a more gradual decrease in TWB at the droplet surface as the thermal and vapor density gradients in the ambient air become relatively steadier and more established for a period of time and as their spheres of influence start shrinking as the droplet starts getting smaller in size.
4.3 Influence of initial droplet size and ambient environmental factors on the thermal evolution of the droplet and its surrounding environment
The overall results spanning the parameter space of the simulations are summarized in Tables 1 and 2 for the 54 numerical experiments using various combinations of ambient conditions (RH∞, T∞, P, and r0) specified at a distance far away from the droplet.
Figure 8Evolution of the decrease in temperature (in K; shaded contours) from the initial temperature of the domain = 273.15 K (0 °C) and of the droplet radius (in µm; dashed black trace) for 10 (a–c), 30 (d–f), and 50 (g–i) µm droplets immersed in an environment with T∞ = 273.15 K (0 °C), P = 500 hPa, and RH∞ = 10 %, 40 %, and 70 %.
4.3.1 Effect of ambient relative humidity, RH∞
The decrease in droplet temperature is larger when the RH∞ is lower due to higher evaporation rates and stronger evaporative cooling under drier conditions. For instance, as shown in Table 1 and Fig. 8a–c, 30 µm droplets reach ∼ 247.3 K (a decrease of 25.8 K from the initial temperature of 273.15 K) for RH∞ = 10 %, ∼ 261.1 K (a decrease of 12.1 K) for RH∞ = 40 %, and ∼ 268.2 K (a decrease of ∼ 5 K) for RH∞ = 70 %. The droplet lifetimes vary, depending on RH∞, with lifetimes increasing with an increase in humidity. For example, the droplet lifetimes for the 30 µm droplet are ∼ 9.5, 16.7, and 37.3 s for environments with RH∞ = 10 %, 40 %, and 70 %, respectively (Table 2). The decrease in droplet temperature and increase in droplet lifetime show similar dependence with increasing RH∞ for 10 and 50 µm droplets as well.
4.3.2 Effect of initial droplet size, r0
From Figs. 8–10, for a given initial environmental condition (RH∞ and T∞), the droplet temperatures at the end of their lifetimes are independent of the initial droplet sizes. For example, from Table 1 and Fig. 9a–i at P = 500 hPa, 10, 30, and 50 µm droplets reach ∼ 244 K (a decrease of ∼ 24 K from the initial temperature of 268.15 K) for RH∞ = 10 %, ∼ 256.8 K for RH∞ = 40 %, and ∼ 263.5 K for RH∞ = 70 %. On the other hand, the droplet lifetime strongly depends on the initial droplet size, as the larger droplets take more time to evaporate compared to the smaller ones. For environments with RH∞ = 10 %, 40 %, and 70 %, the droplet lifetimes for the 10 µm droplet are ∼ 1.1, 1.8, and 3.9 s, while for the 30 µm droplet they are ∼ 11.4, 19.4, and 42.8 s and for the 50 µm droplet they are ∼ 32.8, 55.8, and 123.1 s, respectively (Table 2). For a higher pressure of P = 850 hPa (Table 1), at the same T∞ and irrespective of r0, the decrease in droplet temperatures is slightly smaller compared to P = 500 hPa, with values of 22, 11, and 4.6 K. The radial dependence of the thermal gradients in the ambient air also depends on the initial droplet size, which is decreasing with a decrease in r0.
4.3.3 Effect of ambient temperature, T∞
To determine the effect of a lower ambient temperature on droplet temperatures and lifetimes, Figs. 9 and 10 demonstrate similar plots to those shown in Fig. 8 but for T∞ = 268.15 K (−5 °C) and 263.15 K (−10 °C), respectively. The decrease in droplet temperatures and increase in droplet lifetimes depict similar relationships with RH∞ and r0. Droplets, irrespective of their initial size, cool to a lower temperature, depending on the ambient RH∞, with the magnitude of the cooling being inversely proportional to the subsaturation of the ambient environment. For instance, for 10, 30, and 50 µm droplets, from an initial temperature of 268.15 K, the droplet temperatures approximately decrease by 24, 11.4, and 4.7 K for environments with RH∞ = 10 %, 40 %, and 70 %, respectively (Table 1). The droplet lifetimes for the 10 µm droplet are ∼ 1.1, 1.8, and 3.9 s, while for the 30 µm droplet they are ∼ 11.4, 19.4, and 42.8 s and for the 50 µm droplet they are ∼ 32.8, 55.8, and 123.1 s, for RH∞ = 10 %, 40 %, and 70 %, respectively (Table 2). When comparing these values with those of T∞ = 273.15 K (0 °C), it can be noted that a lower ambient temperature leads to a smaller decrease in droplet temperatures and a slight increase in droplet lifetimes in a spatiotemporally evolving environment for the same RH∞, r0, and P. Figure 10 and Table 1 depict that for T∞ = 263.15 K (−10 °C), the reduction in droplet temperatures is slightly smaller at ∼ 21.8, 10.7, and 4.5 K for environments with RH∞ = 10 %, 40 %, and 70 %, respectively, and droplet lifetimes are longer relative to the higher ambient temperatures of 273.15 and 268.15 K (Table 2). This is because, at a lower ambient temperature, the vapor diffusivity into the ambient air is lower, leading to a weaker evaporation rate with slightly reduced cooling and an extended droplet lifetime, relative to those in an environment with a higher ambient temperature.
4.3.4 Effect of ambient pressure, P
The spatiotemporal evolution of the temperature and droplet radius of an evaporating droplet were also investigated for a higher ambient pressure, P = 850 hPa. For a higher pressure, the corresponding decreases in droplet temperatures are smaller, and droplet lifetimes are longer. Under the same environmental conditions but with an increase in ambient pressure, water vapor diffusivity decreases, leading to a decreased evaporation rate, reduced cooling, and extended droplet lifetimes. For example, for an environment with T∞ = 273.15 K (0 °C) and P = 850 hPa, 10, 30, and 50 µm droplets reach 249.0, 261.4, and 268.3 K for RH∞ = 10 %, 40 %, and 70 %, respectively, and slightly higher compared to the corresponding droplet temperatures (247.3, 261.1, and 268.2 K) for P = 500 hPa (Table 1). For higher ambient pressures, droplet lifetimes are also increased due to reduced evaporation rate, with 50 µm droplets now surviving for 33.4, 55.8, and 121.7 s at P = 850 hPa instead of 27.4, 48.0, and 107.5 s for P = 500 hPa for RH∞ = 10 %, 40 %, and 70 %, respectively (Table 2). Similar trends can also be observed for lower ambient temperatures, 268.15 and 263.15 K, as shown in Table 2.
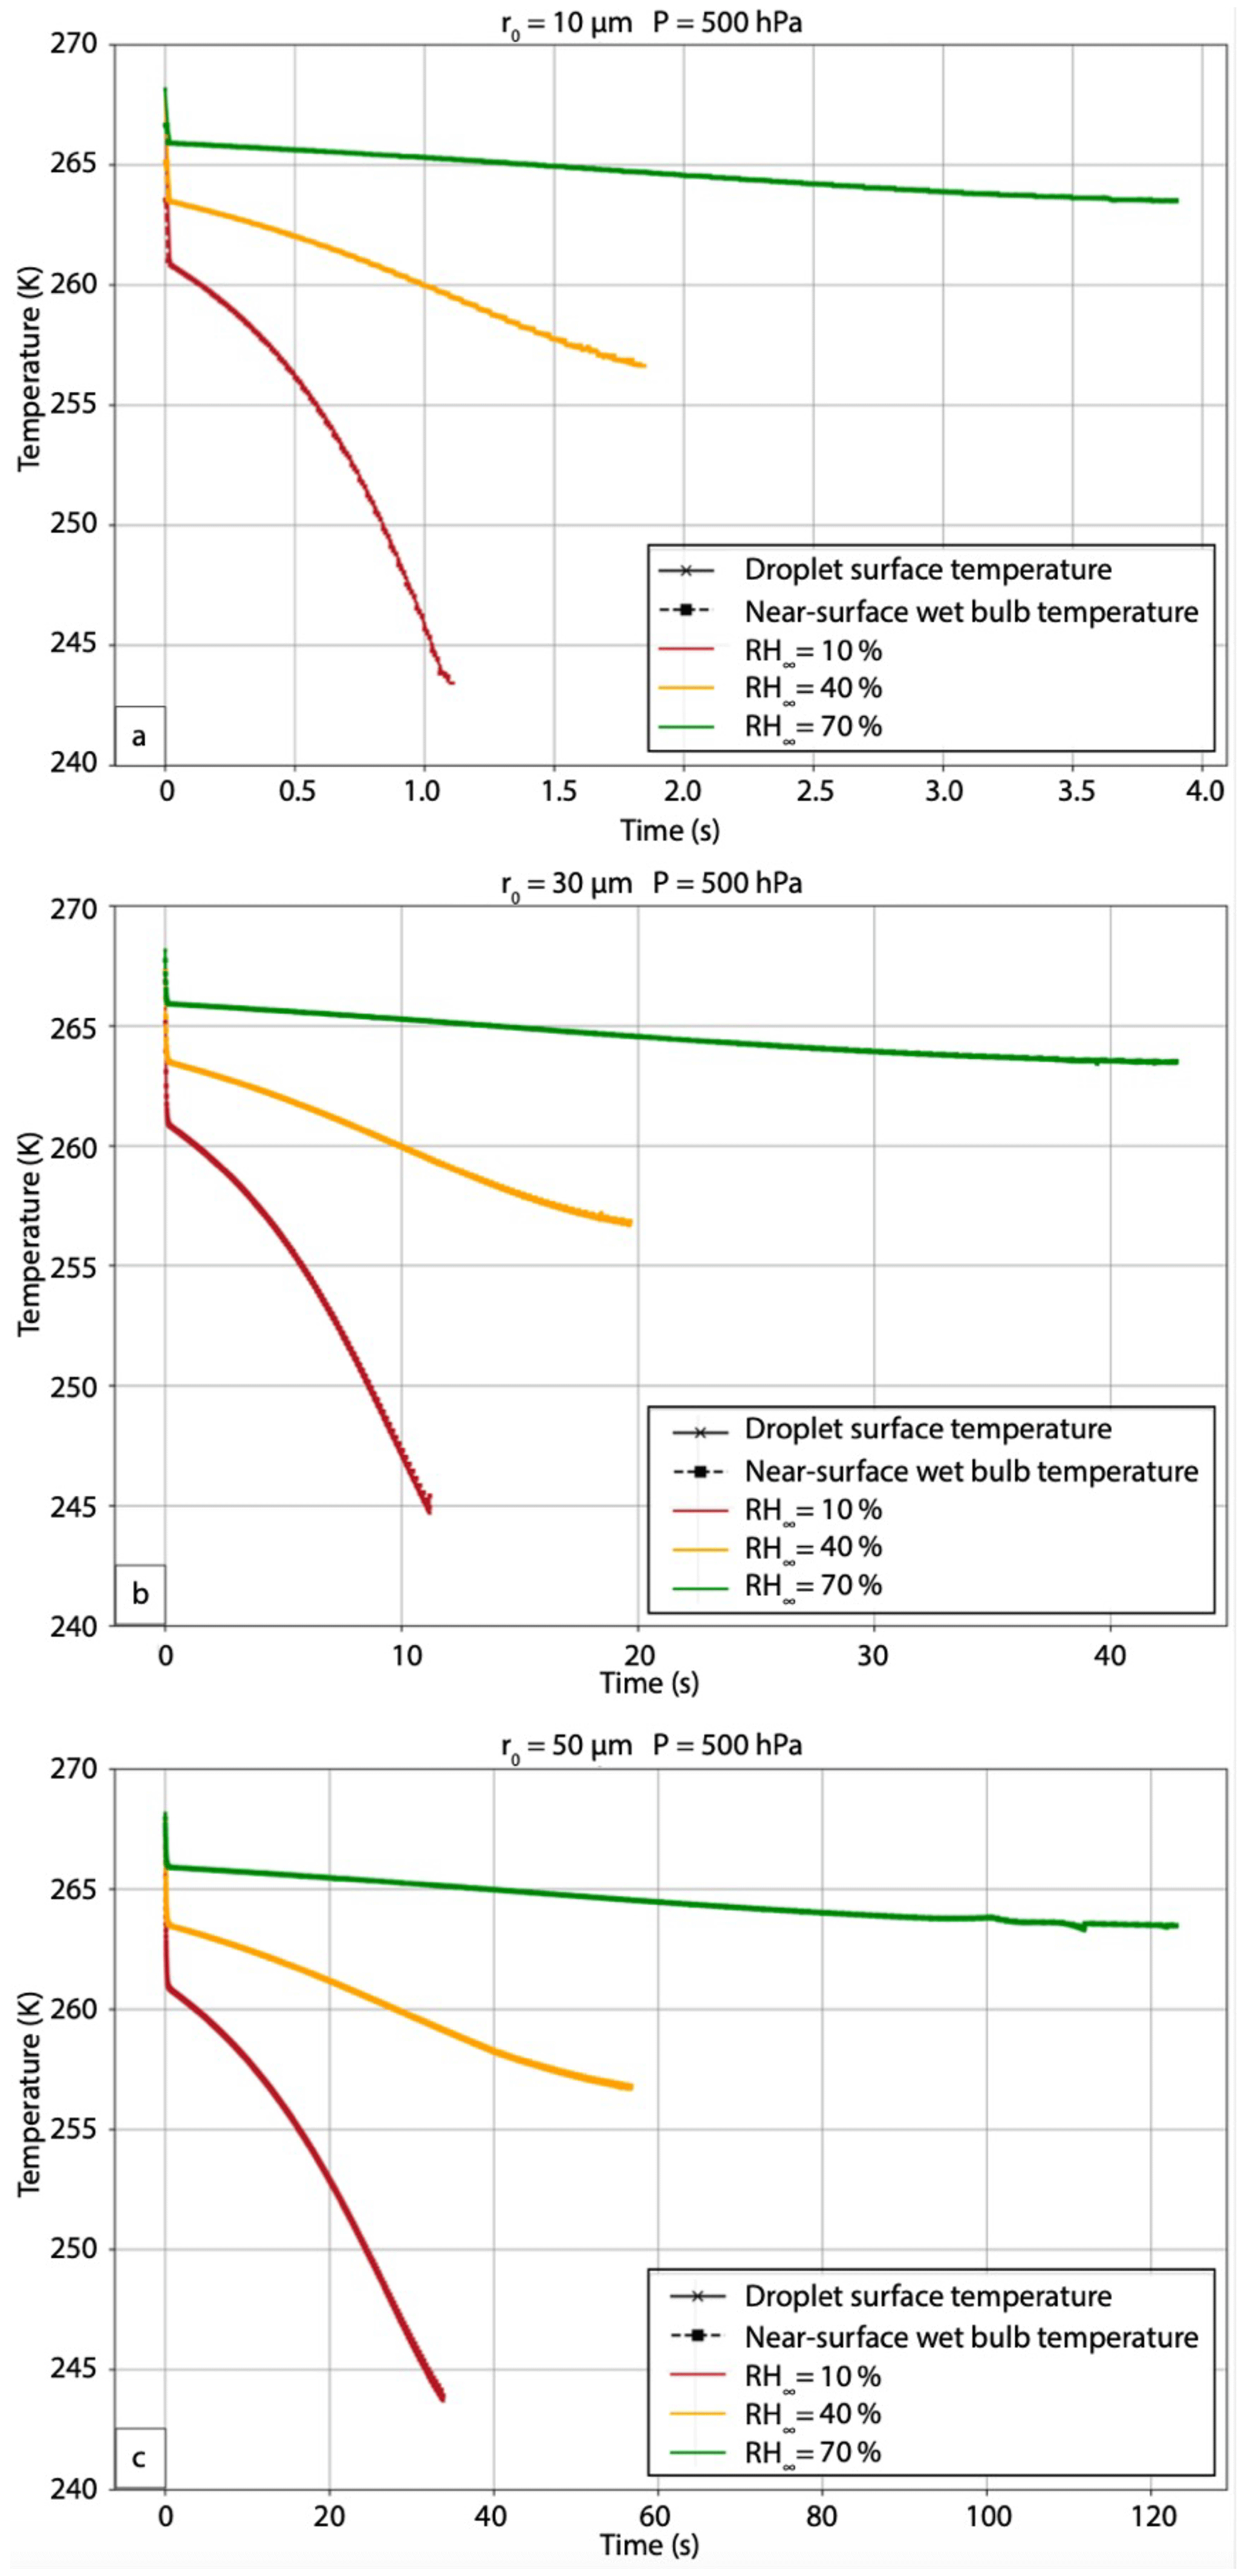
Figure 11Evolution of droplet surface temperature (in K; solid lines with cross symbols), and near-surface thermodynamic wet-bulb temperature (in K; dashed lines with square symbols) for (a) 10, (b) 30, and (c) 50 µm droplets immersed in an environment with T∞ = 268.15 K (−5 °C), P = 500 hPa, and three different RH∞. The lines representing droplet surface temperature and near-surface thermodynamic wet-bulb temperature essentially overlap.
5.1 Droplet temperature sensitivities and relationship to thermodynamic wet-bulb temperature
In these experiments, the droplet temperature initially rapidly decreases to the thermodynamic wet-bulb temperature of the far environment. The novel finding from this study is that the droplet temperature continues to decrease beyond the thermodynamic wet-bulb temperature of the far environment because of the non-equilibrium condition of the thermal and vapor fields during the evaporation process (Fig. 11). The droplet temperature continues to conform to the wet-bulb temperature directly adjacent to the droplet surface, which is lower than the wet-bulb temperature of the far environment. Note that the dependence on T∞ and P is much smaller than that on RH∞. The strong dependence on RH∞ compared to temperature results from the initial conditions. The droplet temperature initially is in thermal equilibrium with its environment (the droplet has the same temperature as that of the far environment), but the vapor field is far from equilibrium, especially for low relative humidity environments. As a result, the vapor diffusion rate (which depends on the vapor density gradient) far exceeds the thermal diffusion rate (which depends on the temperature gradient). Because the cloud droplets are small, and the relative humidity gradients are large, the droplets never come to an equilibrium state before evaporating completely into the subsaturated air. The water vapor flux into the larger subsaturated environment maintains a vapor density near the droplet surface that approaches but never reaches saturation. As a result, the wet-bulb temperature near the droplet surface continues to fall but at a slower rate that depends on RH∞ (Fig. 11). The pressure affects both the moisture and temperature diffusion fluxes, so these scale with each other, resulting in pressure not having a strong effect compared to that of the moisture gradient.
5.2 Droplet temperature and lifetime comparison with previous studies
As noted in the introduction, not many studies in the cloud microphysics literature have taken a close look at the explicit numerical estimation of supercooled evaporating cloud droplet temperatures for a wide range of environmental conditions. Previously, a study by Srivastava and Coen (1992) investigated the evaporation of isolated stationary droplets by iteratively solving the steady-state solutions, using saturation vapor pressure relations from Wexler (1976) to calculate saturation vapor density, and assumed the heat storage terms in the droplet heat budget to be negligible. Roy et al. (2023), solving for time-dependent heat and mass transfer between single stationary cloud droplets evaporating in infinitely large prescribed ambient environments, demonstrated that the temperatures of the cloud droplets reach steady state quite quickly (< 0.3 s). Their steady-state droplet temperatures agreed well with those of Srivastava and Coen (1992) and could be approximated by the thermodynamic wet-bulb temperature of the ambient environment. The current study advances the idealized framework of droplet evaporation, as described in Roy et al. (2023), by including the impact of internal heat gradients within the droplet and resolving the spatiotemporally evolving thermal and vapor density gradients between the droplet and its immediate environment to estimate the evaporating droplet temperature and lifetime with higher accuracy.
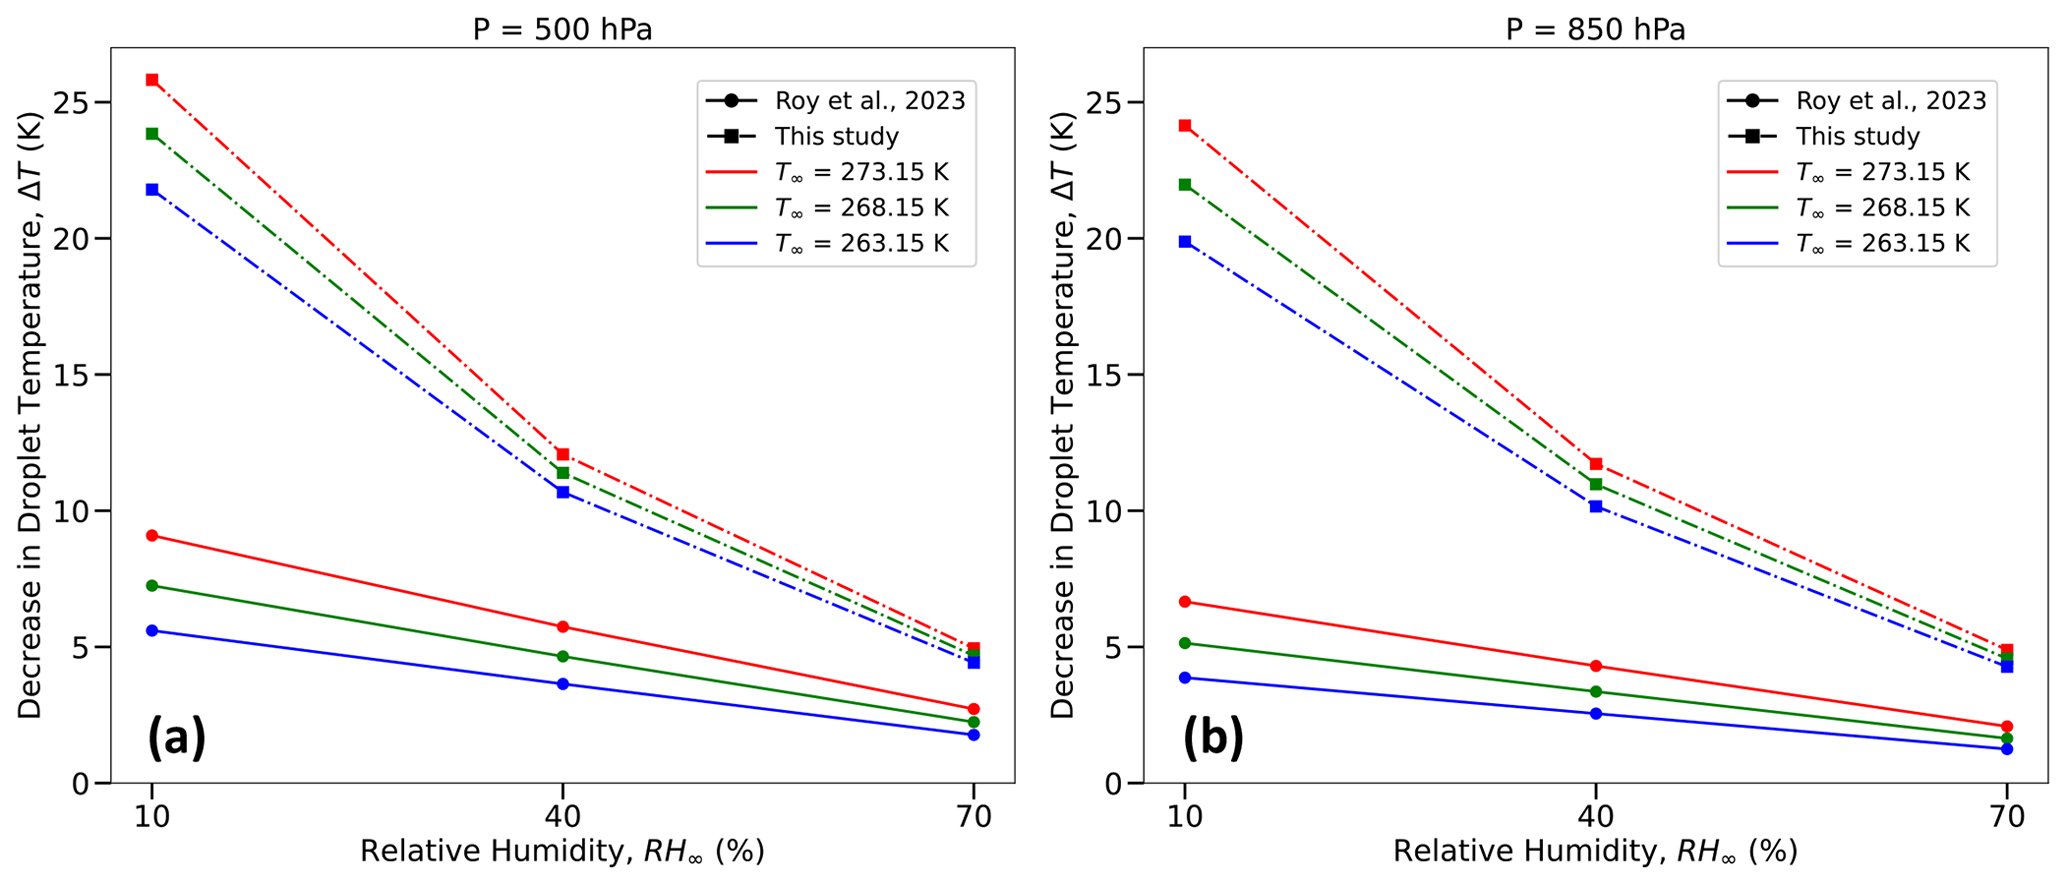
Figure 12Comparison between the decrease in droplet temperatures (in K) from an initial temperature that is the same as T∞ and calculated using the bulk droplet model from Roy et al. (2023) (dashed lines) and this study (dashed–dotted lines) for initial droplet radii (r0 = 10, 30, or 50 µm); relative humidities (RH∞ = 10 %, 40 %, and 70 %); pressures (P = 500 hPa (left column) and 850 hPa (right column)); and T∞ = 273.15 K (0 °C; red), 268.15 K (−5 °C; green), and 263.15 K (−10 °C; blue).
Table 1 provides a comparison between thermodynamic wet-bulb temperatures of the initial environment (TWB∞), simulated droplet steady-state temperatures from Roy et al. (2023) (TRRD), and droplet temperatures at the end of their lifetimes from this study (TL) (in K) for several environments. Interestingly, the temperatures at the slope transition point, Ti, as defined in Sect.4.1, are in excellent agreement with TWB∞ and TRRD. In the current study, the droplet temperature continues to decrease almost steadily as the immediate environment in the vicinity of the droplet cools, finally reaching TL, unlike the evaporating droplet achieving a steady-state temperature in a prescribed ambient environment far away from the droplet in Roy et al. (2023). The evaporating droplet temperature essentially keeps adjusting to the thermodynamic wet-bulb temperature of its immediate changing environment. Therefore, the more realistic simulations of evaporating cloud droplets that include the effect of spatiotemporally varying ambient-air thermal and vapor density gradients, as shown in this study, reveal that droplets can potentially achieve even lower temperatures than previously known or estimated from past studies (Srivastava and Coen, 1992; Roy et al., 2023). The decrease in droplet temperatures from their initial temperatures can be much larger, especially for drier environments, by as much as 25.8 K for RH∞ = 10 % and by as much as 5.0 K for RH∞ = 70 % for an environment with P = 500 hPa and T∞ = 273.15 K (Table 1 and Fig. 12a). As shown in Fig. 12, the magnitude of the reduction in droplet temperatures decreases with higher ambient RH∞ and P and lower T∞, similar to previous studies (Srivastava and Coen, 1992; Roy et al., 2023).
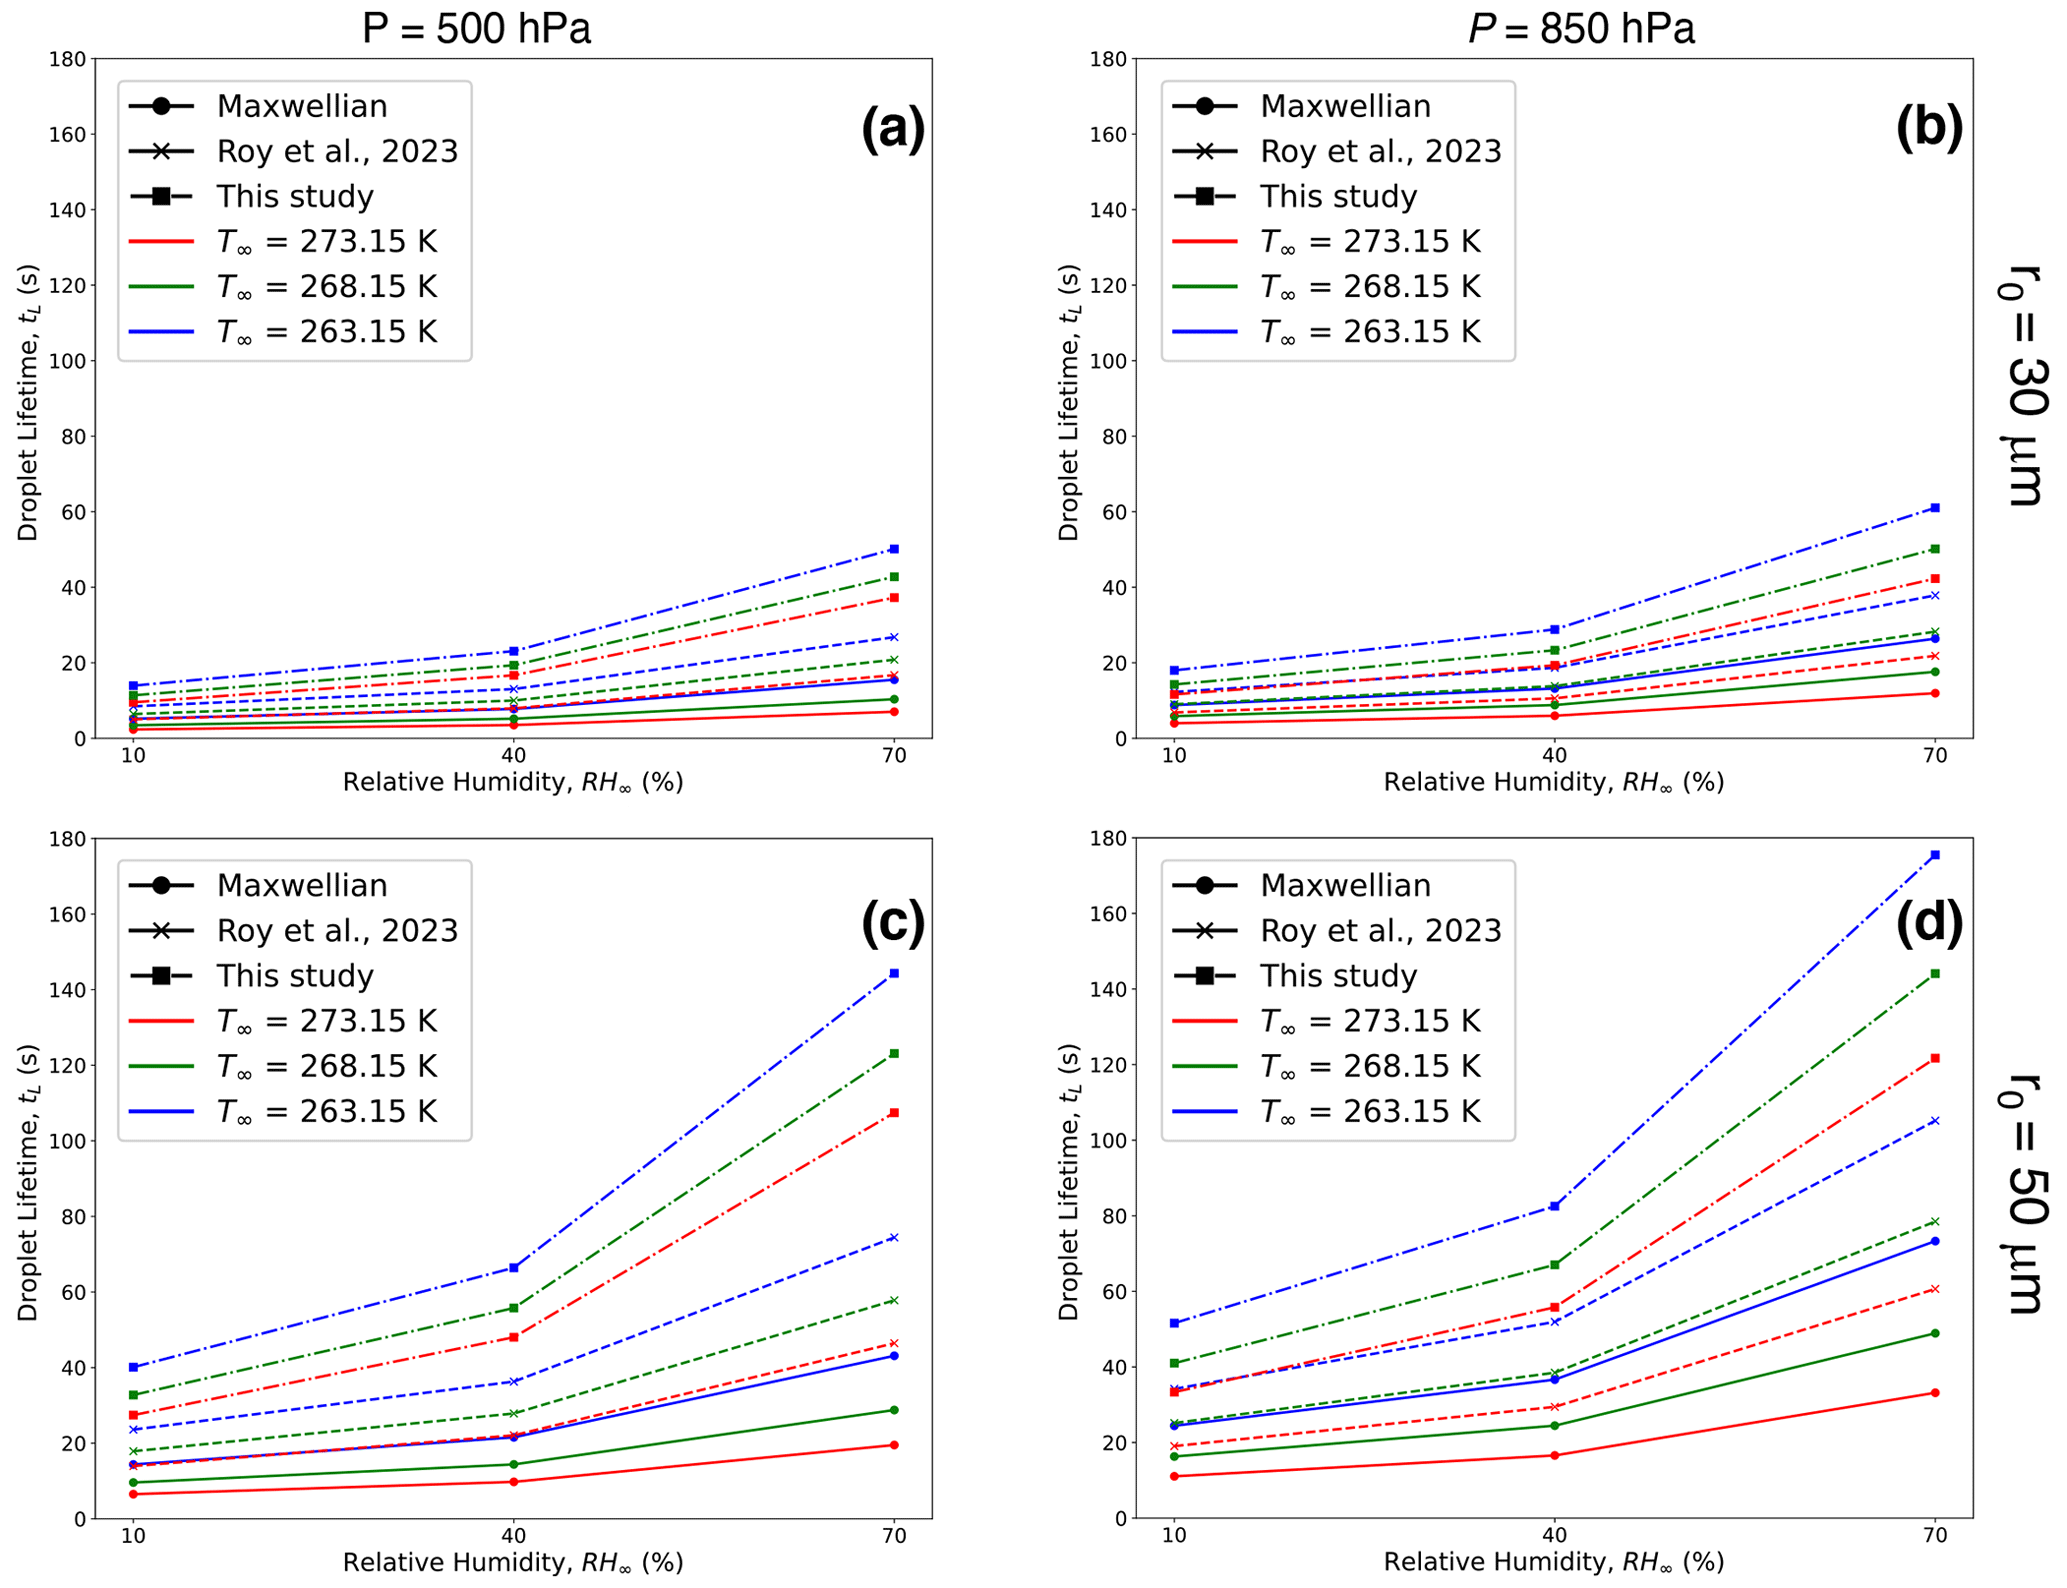
Figure 13Comparison between droplet lifetimes (as defined in this study) calculated using the Maxwellian diffusion-limited evaporation approach (solid lines), bulk droplet model from Roy et al. (2023) (dashed lines), and this study (dashed–dotted lines) for initial droplet radii (r0 = 30 µm) (a, b) and 50 µm (c, d), relative humidities (RH∞ = 10 %, 40 %, and 70 %) and pressures (P = 500 hPa (a, c) and 850 hPa (b, d)), and ambient temperature (T∞ = 273.15 K (0 °C; red), 268.15 K (−5 °C; green) and 263.15 K (−10 °C; blue)). The 10 µm droplets (not shown here) have much smaller lifetimes compared to 30 and 50 µm droplets.
Table 2 and Fig. 13 provide comparisons between 10, 30, and 50 µm droplet lifetimes, using the Maxwellian pure-diffusion-limited evaporation approach (tLC), which ignores evaporative cooling at the droplet surface (Maxwell, 1890; Eq. (13.10) in Pruppacher and Klett, 1997); the “bulk” droplet approach, as described in Roy et al. (2023) (tRRD), which ignores internal droplet heat transfer and spatiotemporally varying thermal and moisture gradients in the ambient air; and results from this study (tL). The magnitude of tL is greater than the corresponding values of tLC and tRRD. This is because the droplet temperatures in this study never reach steady state and are much lower than the corresponding droplet temperatures from the diffusion-limited approach (∼ T∞) and Roy et al. (2023) (∼ TRRD). The greater decrease in evaporating droplet temperature leads to a greater reduction in saturation vapor pressure at the droplet surface. This results in a slower droplet evaporation rate, therefore increasing the droplet lifetime. As shown in Fig. 13, the increase in droplet lifetime depends on the environmental subsaturation, ambient temperatures, and pressures, with a greater increase for more humid, higher pressure, and lower ambient-temperature environments. The increase in droplet lifetimes can potentially enhance ice nucleation by increasing the chances of activation of ice-nucleating particles (INPs) within the supercooled cloud droplets (see Sect. 5.3).
5.3 Implications for ice nucleation
Ice nucleation rates are influenced by temperature (Wright and Petters, 2013; Kanji et al., 2017) and time (Vali, 1994). There are two theories in ice nucleation modeling, namely the time-independent “singular hypothesis”, which suggests instantaneous ice formation, and the time-dependent “stochastic hypothesis”, which proposes that ice clusters in embryos form and vanish continually with a frequency that depends on temperature. Supercooled cloud droplet temperatures and their lifetimes are potential contributing factors for the enhancement of ice formation within evaporating regions of clouds such as cloud tops and edges. As discussed in Roy et al. (2023), the evaporative cooling of supercooled cloud droplets in subsaturated environments can enhance ice nucleation near cloud boundaries in the following two ways: by instantly increasing ice-nucleating particle activation due to lower droplet temperatures (consistent with the singular hypothesis) and/or by extending supercooled droplet lifetimes and allowing more time for nucleation events (consistent with the stochastic hypothesis). Based on limited laboratory investigations available on the time dependency of heterogeneous ice nucleation conducted between temperatures −14 and −30 °C, varying fractions of the droplets were reported to freeze within a range of 1 to 500 s (Welti et al., 2012; Broadley et al., 2012; Murray et al., 2012; Jakobsson et al., 2022).
Droplet freezing events can potentially occur within the time frame when the evaporating cloud droplets reach lower temperatures due to evaporative cooling before they completely dissipate into the subsaturated air. This can be seen by comparing the values in Table 2 and Fig. 13 with reported droplet freezing timescales available from experimental studies. Droplet lifetimes as estimated from both approaches (tRRD and tL), which include droplet evaporative cooling, are longer compared to the Maxwellian diffusion-limited evaporation approach (tLC), allowing more time for potential occurrence of an ice nucleation event. For temperatures between −5 and −10 °C for the three different subsaturated environments (RH∞ = 10 %, 40 %, and 70 %) examined in this analysis, tRRD typically ranged from 0.7–4.2 s for 10 µm, 6–38 s for 30 µm, and 18–105 s for 50 µm initial radius of droplets, respectively. For similar environments, tL > tRRD > tLC, with tL typically ranging from 1.1–5.7 s for 10 µm, 11–61 s for 30 µm, and 33–176 s for 50 µm initial radii droplets, respectively. For larger droplets, say 30 and 50 µm, the droplets survive much longer compared to the 10 µm droplets, likely enhancing the chances of an ice nucleation event.
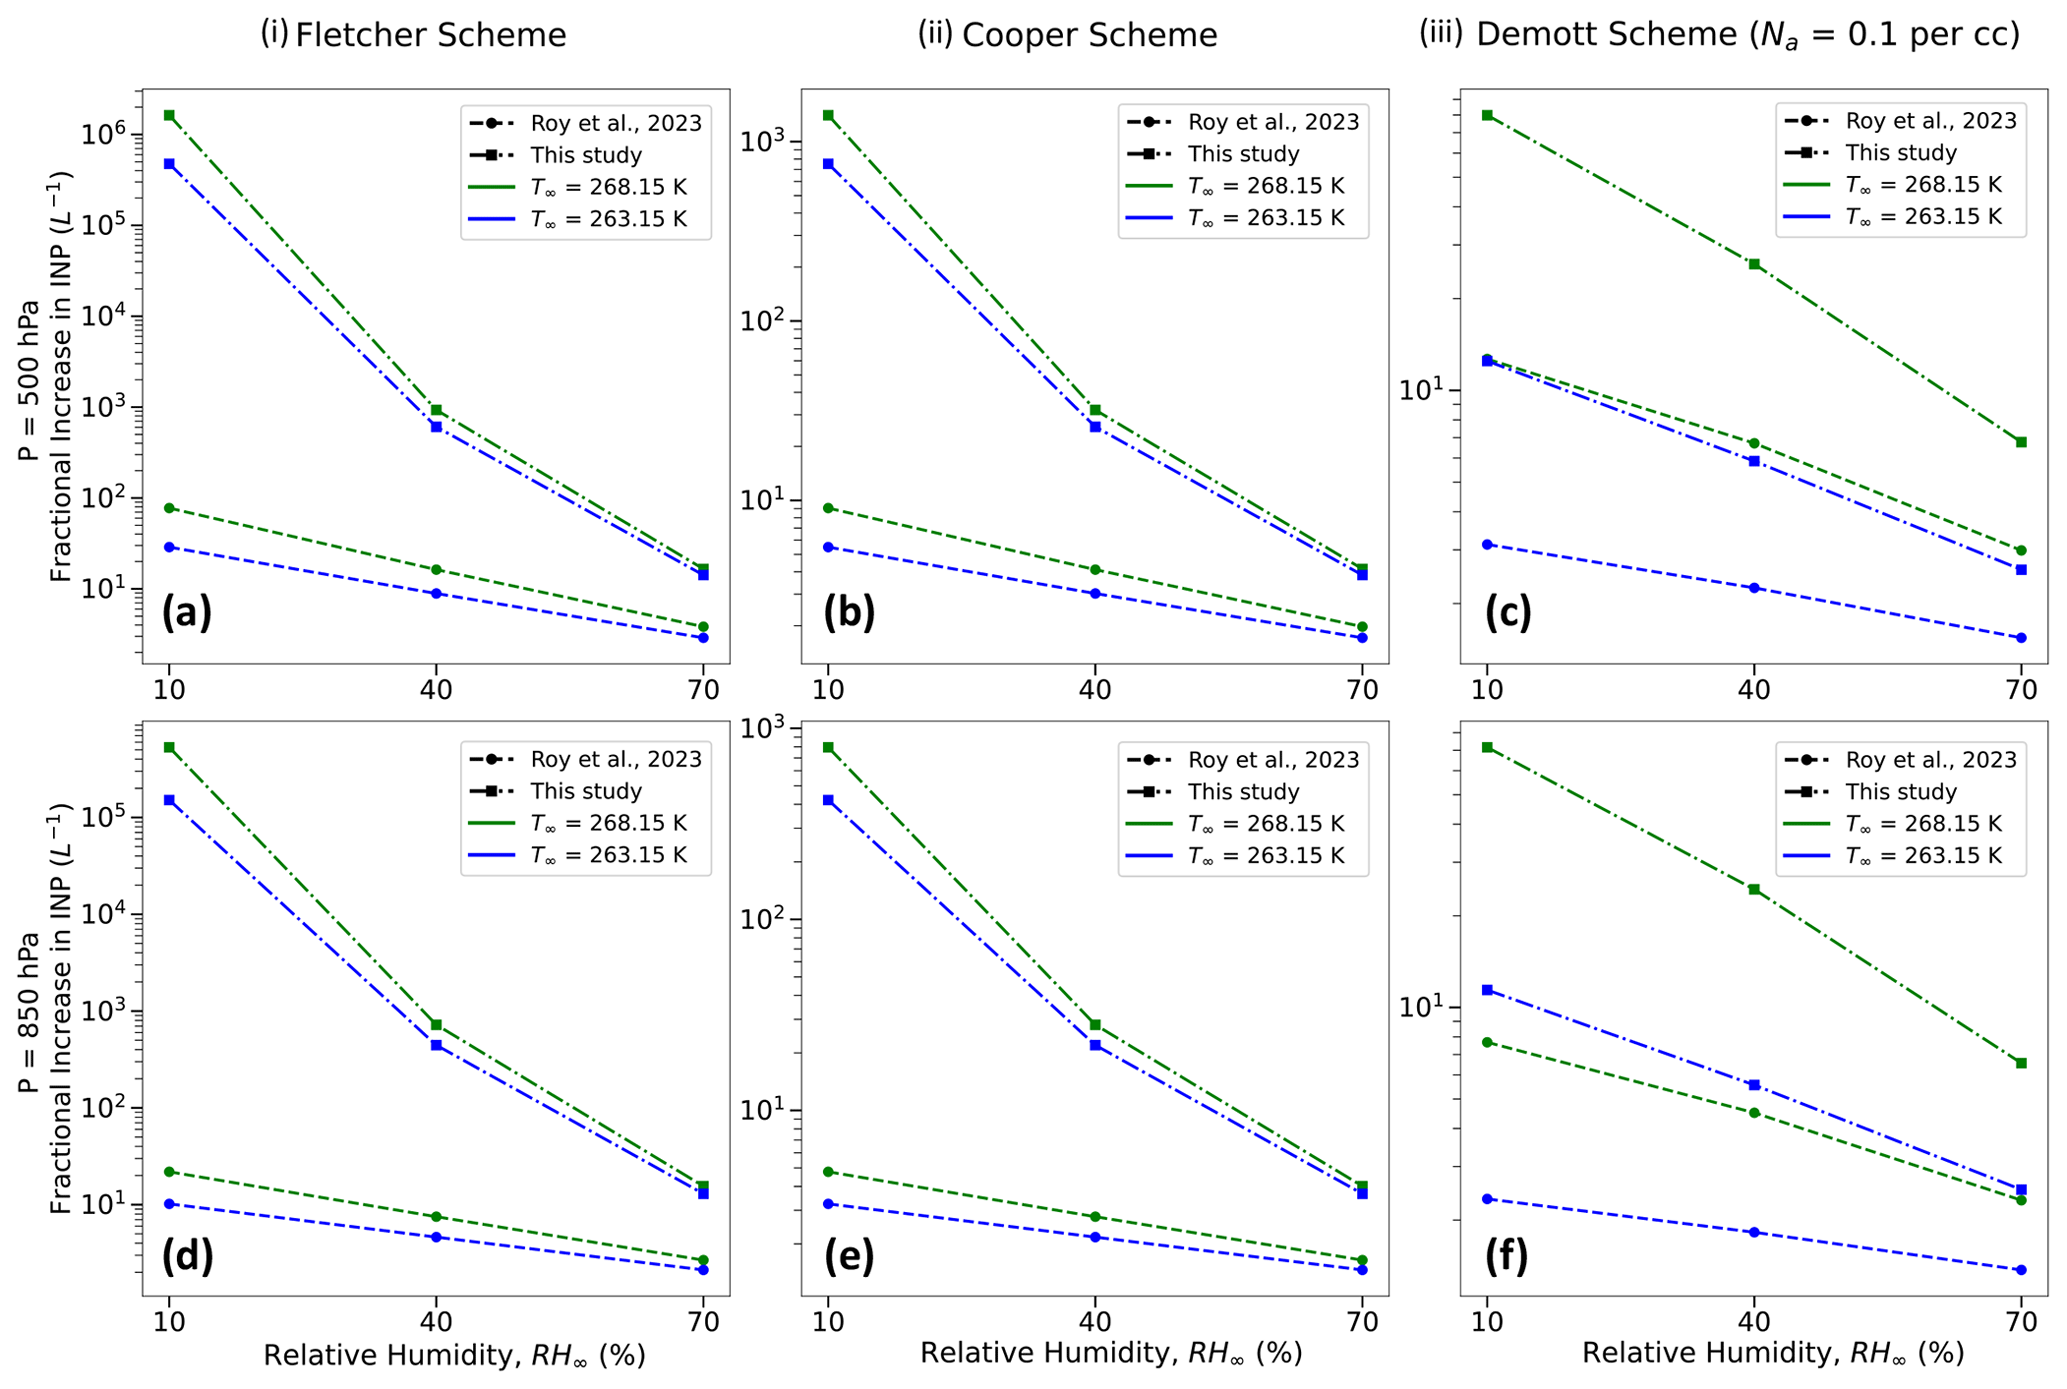
Figure 14Comparison between the maximum fractional increase in INPs as estimated by Roy et al. (2023) and this study for three different parameterization schemes, namely (i) Fletcher (1962), (ii) Cooper (1986), and (iii) Demott et al. (2010), for three different environmental relative humidities (RH∞ = 10 %, 40 %, and 70 %), two ambient temperatures (T∞ = 268.15 K (−5 °C) and 263.15 K (−10 °C)), and two different pressures (P = 500 and 850 hPa).
Results from this study further strengthen the evidence of the hypothesized mechanism of the enhancement of ice nucleation via droplet evaporation. Together with the consistent observation of supercooled water in cloud-top-generating cells (Plummer et al., 2014; Zaremba et al., 2024), these results contribute to explaining the observations of the prodigious production of ice particles produced in generating cells at the cloud tops of winter storms and other clouds (e.g., Plummer et al., 2015; Wang et al., 2020). Rauber and Grant (1986), Plummer et al. (2015), and Tessendorf et al. (2024) have shown that cloud droplet concentrations at the generating cell level near cloud tops are of the order of 30–50 cm−3, while ice particle concentrations in the plumes of ice particles falling beneath generating cells are of the order of 0.01 cm−3. Based on these values, if fewer than 1 frozen cloud droplet in 1000 survives sublimation after freezing and falls back into the cloud then that would be sufficient to create the ice particles observed falling from a generating cell.
Due to the observational evidence of a higher dependency of ice nucleation on temperature than time (Wright and Petters, 2013) and the increased difficulty of representing time-dependent stochastic nucleation in numerical models, the simpler and more widely used approach is to use the time-independent singular hypothesis framework to simulate ice initiation processes. Drawing from theoretical insights, laboratory experiments, and field campaigns, numerous parameterization methods for modeling heterogeneous ice nucleation in cloud and climate models have been created over the years (Fletcher, 1962; Cooper, 1986; Meyers et al., 1992; DeMott et al., 1998; Khvorostyanov and Curry, 2000; Phillips et al., 2008). Most of the conventionally used schemes (Fletcher, 1962; Cooper, 1986; Demott et al., 2010) share a common feature, which is the utilization of the ambient-air temperature for estimating activated INPs, as opposed to relying on the droplet temperature, even for primary ice nucleation modes such as immersion freezing and contact nucleation.
Similar to Roy et al. (2023), we investigate the maximum enhancement in activated INP concentrations that can occur due to evaporative cooling of supercooled water droplets in a spatiotemporally varying environment, assuming that the activation in the parameterization schemes (Fletcher, 1962; Cooper, 1986; Demott et al., 2010) is related to the droplet temperatures towards the end of their lifetimes (TL) rather than the ambient temperature. Figure 14 presents a comparison between Roy et al. (2023) and the current study in terms of the highest fractional increase in activated ice-nucleating particles (INPs), as projected through the Fletcher, Cooper, and Demott schemes cited above (considering ambient-aerosol concentration, Na, with diameters greater than 0.5 µm for the Demott scheme). Owing to even lower droplet temperatures during evaporation, the fractional increase in activated INPs is higher, as calculated from this study, with an increase of several orders of magnitude for drier environments. For example, the Fletcher scheme predicts an enhancement in activated INPs by a factor of ∼ 106 for RH∞ = 10 %, T∞ = 268.15 K, and P = 500 hPa based on droplet temperatures from this study, while the corresponding number from Roy et al. (2023) is ∼ 100 (Fig. 14a). The fractional increases are slightly smaller for higher-pressure environments due to lower evaporative cooling of the droplets under such conditions (compare Fig. 14a, d, b, e, and c, f). Consistent with previous results from Roy et al. (2023), compared to the Fletcher scheme, the Cooper and Demott schemes demonstrate relatively lower enhancement in activated INPs. For the same environment stated earlier, the corresponding activated INP enhancement factor values for Cooper and Demott schemes are ∼ 103 and 80, respectively (Fig. 14b and c).
Therefore, results from the current study further corroborate the hypothesized ice nucleation enhancement mechanism through evaporative cooling of supercooled droplets (Mossop et al., 1968; Young, 1974; Beard, 1992; Roy et al., 2023), providing much higher estimates of activated INP concentrations from previous analyses (Roy et al., 2023). This potential increase in INP concentrations in subsaturated environments near cloud tops and edges, particularly at higher sub-freezing temperatures, may partially help resolve the discrepancy that is several orders of magnitude between the predicted INP and observed ice particle concentrations in such regions of the cloud. To evaluate the effectiveness of the potential ice nucleation enhancement mechanism through evaporation, future modeling experiments within a robust dynamical model setup, considering a population of both freezing and evaporating droplets, along with their lifetimes, droplet–droplet interaction, different species of INPs, and the impact of turbulence and other feedbacks, are required.
In this study, we presented a quantitative investigation of the temperature and lifetime of an evaporating droplet, considering internal thermal gradients within the droplet, as well as resolving spatiotemporally varying unsteady thermal and vapor density gradients in the surrounding ambient air. The computational approach involved solving the Navier–Stokes and continuity equations, coupled with heat and vapor diffusion equations, using an advanced numerical model that employs the finite-element method. This is the first simulation of the spatiotemporal evolution of droplet temperature, radius, and its environment for an isolated, stationary, and supercooled cloud droplet evaporating in various subsaturated environmental conditions. Various ambient pressure (P), temperature (T∞), relative humidity (RH∞), and initial droplet radii (r0) were considered. The motivation behind this study was to provide more exacting calculations to support the hypothesized ice nucleation enhancement mechanism due to the evaporation of supercooled cloud droplets at cloud boundaries, such as cloud-top ice-generating cells and for ambient temperatures between 0 and −10 °C where ice nucleation is least effective.
The numerical simulations show, for the typical cloud droplet sizes (r0 = 10, 30, 50 µm) and environmental conditions considered here, that the internal thermal gradients dissipate quite quickly (≤ 0.3 s) when the droplet is introduced to a new subsaturated environment. Thus, spatial thermal gradients within the droplet can be reasonably ignored. Hence, one can potentially ignore the extra computational expense of simulating conductive heat transfer within the droplet for timescales > 1 s.
The results from this study are similar to findings from the literature that an evaporating supercooled cloud droplet can exist at a temperature lower than that of the ambient atmosphere (Srivastava and Coen, 1992; Roy et al., 2023). The novelty of this study lies in demonstrating that the magnitude of droplet cooling can be much higher than estimated from past studies of droplet evaporation, especially for drier environments. For example, for a droplet evaporating in an environment with P = 500 hPa, T∞ = 268.15 K (−5 °C), and RH∞ = 10 %, Roy et al. (2023) estimated a 7.3 K decrease in droplet temperature, while this study shows that there can be as much as a 23.8 K decrease in droplet temperature. This is because previous studies assumed prescribed ambient environments at all distances from the droplet, while this analysis shows that as a droplet evaporates and cools, the air in the vicinity of the droplet cools as well, giving rise to spatiotemporally varying thermal and vapor density fields in the immediate environment surrounding the droplet. Here, the net conductive warming from the environmental air enveloping the droplet is lower compared to Roy et al. (2023), effectively leading to a much lower droplet temperature. At a particular time, the strength and radial dependence of these gradients depend on the subsaturation of the air medium and the magnitude of droplet cooling due to evaporation, with the largest cooling at lower RH∞. In this study, the temperature and vapor density in the ambient air continually evolve, thus affecting the transfer of heat and vapor between the droplet surface and the environment far away from the droplet. This affects the temperature evolution and decay rates of the evaporating droplet to a greater degree than shown in previous studies for a similar environment (Srivastava and Coen, 1992; Roy et al., 2023).
This study also demonstrated that the lifetimes of the evaporating droplets are longer compared to Roy et al. (2023) because as the droplet temperature gets lower, the saturation vapor pressure at the droplet surface reduces, leading to a weaker evaporation rate. For an environment with P = 500 hPa, T∞ = 268.15 K (−5 °C), and RH∞ = 10 %, a 50 µm droplet reaches the end of its lifetime, as defined in this study, in 32.8 s, while the corresponding values for the diffusion-limited evaporation approach as estimated from Roy et al. (2023) are 9.6 and 17.9 s, respectively. The rates of evaporation tend to be slower in this study due to even lower droplet temperatures, as well as spatiotemporally varying vapor density gradients around the droplets. As the droplet evaporates, the envelope of air surrounding the droplet is colder, it has lower values of diffusivity, leading to slower evaporation rates, and it has higher vapor concentration than the ambient air, thus decreasing the evaporation rates.
To summarize, if one considers the more realistic case of droplet evaporation, including the spatiotemporally varying thermal and vapor density gradients in the vicinity of the water droplet, the evaporating droplet can experience a substantial reduction in temperatures by several degrees, which is strongly dependent on the ambient relative humidity and weakly dependent on ambient pressure and temperature. Similar to the case of an isolated stationary droplet evaporating in a prescribed ambient environment, the droplet almost immediately reaches its slope transition point temperature, which can be well approximated by the thermodynamic wet-bulb temperature of the initial ambient environment around the droplet. Droplet temperatures then continue to steadily decrease as they adjust to the evolving thermodynamic wet-bulb temperature of the surrounding air. In more humid environments, the droplets may not experience a larger droplet cooling, but their lifetimes, as defined in this study, get extended by tens of seconds compared to the Maxwellian estimation, which neglects droplet cooling.
The current analysis also demonstrates that lower evaporating droplet temperatures would lead to an enhancement of activated INPs from three widely used INP parameterization schemes, further corroborating the hypothesized ice nucleation enhancement mechanism through evaporative cooling of supercooled droplets. Notably, the estimates of activated INP concentrations from this study are higher than previous analyses, as the droplet temperatures are much lower towards the end of their lifetimes, with several orders of magnitude increase in activated INPs for drier environments. The Fletcher scheme predicts the greatest enhancement in activated INPs by a factor of ∼ 106 for RH∞ = 10 %, T∞ = 268.15 K, and P = 500 hPa, while the corresponding enhancement factor values for the Cooper and Demott schemes are ∼ 103 and 80, respectively.
This study suggests a need for a more in-depth examination of supercooled cloud droplet temperatures and their lifetimes in subsaturated environments, especially when simulating heterogeneous ice nucleation processes that require the presence of supercooled water droplets. This is crucial because the concentration of activated ice-nucleating particles (INPs) is influenced by both droplet temperature and how long evaporating droplets persist. Additionally, the findings from this investigation may also partially help understand disparities between observed ice particle concentrations and activated INPs, especially at relatively higher sub-zero temperatures. Including the effect of droplet evaporative cooling on droplet temperatures and lifetimes, while modeling cloud microphysical processes in subsaturated environments, will also lead to improved accuracy of the evolution of the droplet size distribution, as well as primary ice nucleation mechanisms.
This modeling analysis used the proprietary COMSOL Multiphysics version 6.0 software package, which can be licensed through https://www.comsol.com/ (COMSOL, 2023d).
PR, RMR, and LDG conceptualized the problem and numerical experiments. PR designed and performed the simulations, analyzed the data, and prepared the first draft of the paper. PR, RMR, and LDG reviewed and edited the paper. RMR and LDG acquired required funding for the project.
The contact author has declared that none of the authors has any competing interests.
Publisher's note: Copernicus Publications remains neutral with regard to jurisdictional claims made in the text, published maps, institutional affiliations, or any other geographical representation in this paper. While Copernicus Publications makes every effort to include appropriate place names, the final responsibility lies with the authors.
This article is part of the special issue “Cloud, Aerosol and Monsoon Processes Philippines Experiment (CAMP2Ex) (ACP/AMT inter-journal SI)”. It is not associated with a conference.
The authors gratefully acknowledge the comments from the two anonymous referees and the editor that helped clarify and improve the paper.
This research has been supported by the National Aeronautics and Space Administration (grant no. 80NSSC19K0355), the National Aeronautics and Space Administration (grant no. 80NSSC18K0144), and the National Science Foundation (grant no. AGS-2016106).
This paper was edited by Thijs Heus and reviewed by two anonymous referees.
Alduchov, O. A. and Eskridge, R. E.: Improved Magnus form approximation of saturation vapor pressure, J. Appl. Meteorol. Clim., 35, 601–609, https://doi.org/10.1175/1520-0450(1996)035<0601:IMFAOS>2.0.CO;2, 1996.
AMS: Generating cell, American Meteorological Society, https://glossary.ametsoc.org/wiki/Generating_cell (last access: 10 May 2024), 2024.
Beard, K.: Ice Initiation in warm-base convective clouds: An assessment of microphysical mechanisms, Atmos. Res., 28, 125–152, https://doi.org/10.1016/0169-8095(92)90024-5, 1992.
Beard, K. and Pruppacher, H. R.: A wind tunnel investigation of the rate of evaporation of small water drops falling at terminal velocity in air, J. Atmos. Sci., 28, 1455–1464, https://doi.org/10.1175/1520-0469(1971)028,1455:AWTIOT.2.0.CO;2, 1971.
Biddle, J. W., Holten, V., Sengers, J. V., and Anisimov, M. A.: Thermal conductivity of supercooled water, Phys. Rev. E, 87, 042302, https://doi.org/10.1103/PhysRevE.87.042302, 2013.
Broadley, S. L., Murray, B. J., Herbert, R. J., Atkinson, J. D., Dobbie, S., Malkin, T. L., Condliffe, E., and Neve, L.: Immersion mode heterogeneous ice nucleation by an illite rich powder representative of atmospheric mineral dust, Atmos. Chem. Phys., 12, 287–307, https://doi.org/10.5194/acp-12-287-2012, 2012.
Chen, S., Xue, L., and Yau, M.-K.: Impact of aerosols and turbulence on cloud droplet growth: an in-cloud seeding case study using a parcel–DNS (direct numerical simulation) approach, Atmos. Chem. Phys., 20, 10111–10124, https://doi.org/10.5194/acp-20-10111-2020, 2020.
Chushak, Y. and Bartell, L. S.: Crystal nucleation and growth in large clusters of SeF6 from molecular dynamics simulations, J. Phys. Chem. A, 104, 9328–9336, https://doi.org/10.1021/jp002107e, 2000.
Chushak, Y. G. and Bartell, L. S.: Simulations of spontaneous phase transitions in large, deeply supercooled clusters of SeF6, J. Phys. Chem. B, 103, 11196–11204, https://doi.org/10.1021/jp992818g, 1999.
COMSOL: Infinite Element Domain Documentation, https://doc.comsol.com/5.5/doc/com.comsol.help.comsol/comsol_ref_definitions.12.116.html (last access: 15 September 2023), 2023a.
COMSOL: Free Triangular Documentation, https://doc.comsol.com/5.5/doc/com.comsol.help.comsol/comsol_ref_mesh.15.38.html (last access: 15 September 2023), 2023b.
COMSOL: Mapped Documentation, https://doc.comsol.com/5.6/doc/com.comsol.help.comsol/comsol_ref_mesh.20.40.html (last access: 15 September 2023), 2023c.
COMSOL: COMSOL Multiphysics Software, COMSOL Inc., https://www.comsol.com/ (last access: 15 September 2023), 2023d.
Cooper, W. A.: Ice initiation in natural clouds, in: Precipitation enhancement – A scientific challenge, American Meteorological Society, Boston, MA, 29–32, https://doi.org/10.1175/0065-9401-21.43.29, 1986.
DeMott, P. J., Rogers, D. C., Kreidenweis, S. M., Chen, Y., Twohy, C. H., Baumgardner, D., Heymsfield, A. J., and Chan, K. R.: The role of heterogeneous freezing nucleation in upper tropospheric clouds: Inferences from SUCCESS, Geophys. Res. Lett., 25, 1387–1390, https://doi.org/10.1029/97GL03779, 1998.
DeMott, P. J., Prenni, A. J., Liu, X., Kreidenweis, S. M., Petters, M. D., Twohy, C. H., Richardson, M. S., Eidhammer, T., and Rogers, D.: Predicting global atmospheric ice nuclei distributions and their impacts on climate, P. Natl. Acad. Sci. USA, 107, 11217–11222, https://doi.org/10.1073/pnas.0910818107, 2010.
Djikaev, Y. S. and Ruckenstein, E.: Thermodynamics of heterogeneous crystal nucleation in contact and immersion modes, J. Phys. Chem. A, 112, 11677–11687, https://doi.org/10.1021/jp803155f , 2008.
Djikaev, Y. S., Tabazadeh, A., Hamill, P., and Reiss, H.: Thermodynamic conditions for the surface-stimulated crystallization of atmospheric droplets, J. Phys. Chem. A, 106, 10247–10253, https://doi.org/10.1021/jp021044s, 2002.
Fletcher, N. H.: The physics of rainclouds, with an introductory chapter by: Squires, P. and a foreword by: Bowen, E. G., Cambridge University Press, ISBN 13:978-0521154796, 1962.
Fukuta, N.: Theories of competitive cloud droplet growth and their application to cloud physics studies, J. Atmos. Sci., 49, 1107–1114, https://doi.org/10.1175/1520-0469(1992)049<1107:TOCCDG>2.0.CO;2, 1992.
Grabowski, W. W. and Wang, L. P.: Growth of cloud droplets in a turbulent environment, Annu. Rev. Fluid Mech., 45, 293–324, https://doi.org/10.1146/annurev-fluid-011212-140750, 2013.
Hall, W. D. and Pruppacher, H. R.: The survival of ice particles falling from cirrus clouds in subsaturated air, J. Atmos. Sci., 33, 1995–2006, https://doi.org/10.1175/1520-0469(1976)033<1995:TSOIPF>2.0.CO;2, 1976.
Jakobsson, J. K. F., Waman, D. B., Phillips, V. T. J., and Bjerring Kristensen, T.: Time dependence of heterogeneous ice nucleation by ambient aerosols: laboratory observations and a formulation for models, Atmos. Chem. Phys., 22, 6717–6748, https://doi.org/10.5194/acp-22-6717-2022, 2022.
Kanji, Z. A., Ladino, L. A., Wex H., Boose, Y., Burkert-Kohn, M., Cziczo, D. J., and Krämer, M.: Overview of Ice Nucleating Particles, Meteor. Mon., 58, 1.1–1.33, https://doi.org/10.1175/AMSMONOGRAPHS-D-16-0006.1, 2017.
Khain, A. P. and Pinsky, M.: Physical processes in clouds and cloud modeling, Cambridge University Press, ISBN 978-0-521-76743-9, 2018.
Khvorostyanov, V. and Sassen, K.: Toward the theory of homogeneous nucleation and its parameterization for cloud models, Geophys. Res. Lett., 25, 3155–3158, https://doi.org/10.1029/98GL02332, 1998.
Khvorostyanov, V. I. and Curry, J. A.: A new theory of heterogeneous ice nucleation for application in cloud and climate models, Geophys. Res. Lett., 27, 4081–4084, https://doi.org/10.1029/1999GL011211, 2000.
Kinzer, G. D. and Gunn, R.: The evaporation, temperature and thermal relaxation-time of freely falling waterdrops, J. Atmos. Sci., 8, 71–83, https://doi.org/10.1175/1520-0469(1951)008<0071:TETATR>2.0.CO;2, 1951.
Lü, Y. J., Xie, W. J., and Wei, B.: Observation of ice nucleation in acoustically levitated water drops, Appl. Phys. Lett., 87, 184107, https://doi.org/10.1063/1.2126801, 2005.
Marquis, J. and Harrington, J. Y.: Radiative influences on drop and cloud condensation nuclei equilibrium in stratocumulus, J. Geophys. Res.-Atmos., 110, D10205, https://doi.org/10.1029/2004JD005401, 2005.
Mason, B. J.: The Physics of Clouds, Clarendon Press, Oxford, 671 pp., ISBN 13 978-0199588046, 1971.
Maxwell, J. C.: Theory of the wet bulb thermometer, Scientific Papers of James Clerk Maxwell, 2, Cambridge University Press, 636–640, ISBN 978-1-108-01538-7, 1890.
Meyers, M. P., DeMott, P. J., and Cotton, W. R.: New primary ice-nucleation parameterizations in an explicit cloud model, J. Appl. Meteorol. Clim., 31, 708–721, https://doi.org/10.1175/1520-0450(1992)031<0708:NPINPI>2.0.CO;2, 1992.
Mossop, S. C., Ruskin, R. E., and Heffernan, K. J.: Glaciation of a Cumulus at Approximately −4C, J. Atmos. Sci., 25, 889–899, https://doi.org/10.1175/1520-0469(1968)025<0889:GOACAA>2.0.CO;2, 1968.
Murray, B. J., O'sullivan, D., Atkinson, J. D., and Webb, M. E.: Ice nucleation by particles immersed in supercooled cloud droplets, Chem. Soc. Rev., 41, 6519–6554, https://doi.org/10.1039/c2cs35200a., 2012.
Phillips, V. T., DeMott, P. J., and Andronache, C.: An empirical parameterization of heterogeneous ice nucleation for multiple chemical species of aerosol, J. Atmos. Sci., 65, 2757–2783, https://doi.org/10.1175/2007JAS2546.1, 2008.
Plummer, D. M., McFarquhar, G. M., Rauber, R. M., Jewett, B. F., and Leon, D. C.: Structure and statistical analysis of the microphysical properties of generating cells in the comma head region of continental winter cyclones, J. Atmos. Sci., 71, 4181–4203, https://doi.org/10.1175/JAS-D-14-0100.1, 2014.
Plummer, D. M., McFarquhar, G. M., Rauber, R. M., Jewett, B. F., and Leon, D. C.: Microphysical properties of convectively generated fall streaks in the comma head region of continental winter cyclones, J. Atmos. Sci., 72, 2465–2483, https://doi.org/10.1175/JAS-D-14-0354.1, 2015.
Pruppacher, H. R. and Klett, J. D.: Microphysics of Clouds and Precipitation, 2nd Edn., Kluwer Academic, 954 pp., ISBN 0-7923-4211-9, 1997.
Ramelli, F., Henneberger, J., David, R. O., Bühl, J., Radenz, M., Seifert, P., Wieder, J., Lauber, A., Pasquier, J. T., Engelmann, R., Mignani, C., Hervo, M., and Lohmann, U.: Microphysical investigation of the seeder and feeder region of an Alpine mixed-phase cloud, Atmos. Chem. Phys., 21, 6681–6706, https://doi.org/10.5194/acp-21-6681-2021, 2021.
Rauber, R. M. and Grant, L. O.: The characteristics and distribution of cloud water over the mountains of northern Colorado during winter-time storms. Part II: Spatial distribution and microphysical characteristics. J. Climate Appl. Meteor., 25, 489–504, https://doi.org/10.1175/1520-0450(1986)025<0489:TCADOC>2.0.CO;2, 1986.
Roach, W. T.: On the effect of radiative exchange on the growth by condensation of a cloud or fog droplet, Q. J. Roy. Meteor. Soc., 102, 361–372, https://doi.org/10.1002/qj.49710243207, 1976.
Rogers, R. R. and Yau, M. K.: A Short Course in Cloud Physics, Pergamon Press, 294 pp., ISBN 0-7506-3215-1, 1989.
Rowe, P. M., Fergoda, M., and Neshyba, S.: Temperature-dependent optical properties of liquid water from 240 to 298 K. J. Geophys. Res.-Atmos., 125, e2020JD032624, https://doi.org/10.1029/2020JD032624, 2020.
Roy, P., Rauber, R. M., and Girolamo, L. D.: A closer look at the evolution of supercooled cloud droplet temperature and lifetime in different environmental conditions with implications for ice nucleation in the evaporating regions of clouds, J. Atmos. Sci., 80, 2481–2501, https://doi.org/10.1175/JAS-D-22-0239.1, 2023.
Satoh, I., Fushinobu, K., and Hashimoto, Y.: Freezing of a water droplet due to evaporation–heat transfer dominating the evaporation–freezing phenomena and the effect of boiling on freezing characteristics, Int. J. Refrig., 25, 226–234, https://doi.org/10.1016/S0140-7007(01)00083-4, 2002.
Scardovelli, R. and Zaleski, S.: Direct numerical simulation of free-surface and interfacial flow, Annu. Rev. Fluid Mech., 31, 567–603. https://doi.org/10.1146/annurev.fluid.31.1.567, 1999.
Sedunov, Y. S.: Physics of the Drop Formation in the Atmosphere, John Wiley and Sons, 234 pp., ISBN 13:978-0706513837, 1974.
Shaw, R. A., Durant, A. J., and Mi, Y.: Heterogeneous surface crystallization observed in undercooled water, J. Phys. Chem. B, 109, 9865–9868, https://doi.org/10.1021/jp0506336, 2005.
Srivastava, R. C. and Coen, J. L.: New explicit equations for the accurate calculation of the growth and evaporation of hydrometeors by the diffusion of water vapor, J. Atmos. Sci., 49, 1643–1651, https://doi.org/10.1175/1520-0469(1992)049<1643:NEEFTA>2.0.CO;2, 1992.
Standard Atmosphere: ISO 2533:1975, updated 2021, https://www.iso.org/standard/7472.html (last access: 26 September 2022), 2021.
Szakáll, M., Debertshäuser, M., Lackner, C. P., Mayer, A., Eppers, O., Diehl, K., Theis, A., Mitra, S. K., and Borrmann, S.: Comparative study on immersion freezing utilizing single-droplet levitation methods, Atmos. Chem. Phys., 21, 3289–3316, https://doi.org/10.5194/acp-21-3289-2021, 2021.
Tabazadeh, A., Djikaev, Y. S., Hamill, P., and Reiss, H.: Laboratory evidence for surface nucleation of solid polar stratospheric cloud particles, J. Phys. Chem. A, 106, 10238–10246, https://doi.org/10.1021/jp021045k, 2002a.
Tabazadeh, A., Djikaev, Y. S., and Reiss, H.: Surface crystallization of supercooled water in clouds, P. Natl. Acad. Sci. USA, 99, 15873–15878, https://doi.org/10.1073/pnas.252640699, 2002b.
Tessendorf, S. A., Boe, B., Geerts, B., Manton, M. J., Parkinson, S., and Rasmussen, R.: The future of winter orographic cloud seeding: A view from scientists and stakeholders, B. Am. Meteorol. Soc., 96, 2195–2198, https://doi.org/10.1175/BAMS-D-15-00146.1, 2015.
Tessendorf, S., Ikeda, K., Rasmussen, R., French, J., Rauber, R., Korolev, A., Xue, L., Blestrud, D., Dawson, N., Meadows, M., Kunkel, M., and Parkinson, S.: Characteristics of Generating Cells in Wintertime Orographic Clouds. J. Atmos. Sci., 81, 649–673, https://doi.org/10.1175/JAS-D-23-0029.1, 2024.
Vaillancourt, P. A., Yau, M. K., and Grabowski, W. W.: Microscopic approach to cloud droplet growth by condensation. Part I: Model description and results without turbulence, J. Atmos. Sci., 58, 1945–1964, https://doi.org/10.1175/1520-0469(2001)058<1945:MATCDG>2.0.CO;2, 2001.
Vali, G.: Freezing Rate Due to Heterogeneous Nucleation, J. Atmos. Sci., 51, 1843–1856, https://doi.org/10.1175/1520-0469(1994)051<1843:FRDTHN>2.0.CO;2, 1994.
Volmer, M.: Kinetic der Phasenbildung, Steinkopff, Dresden, Leipzig, https://doi.org/10.1002/bbpc.19400460512, 1939.
Wang, Y., McFarquhar, G. M., Rauber, R. M., Zhao, C., Wu, W., Finlon, J. A., Stechman, D. M., Stith, J., Jensen, J. B., Schnaiter, M., and Järvinen, E.: Microphysical properties of generating cells over the Southern Ocean: Results from SOCRATES, J. Geophys. Res.-Atmos., 125, e2019JD032237, https://doi.org/10.1029/2019JD032237, 2020.
Watts, R. G.: Relaxation time and steady evaporation rate of freely falling raindrops, J. Atmos. Sci., 28, 219–225, https://doi.org/10.1175/1520-0469(1971)028<0219:RTASER>2.0.CO;2, 1971.
Watts, R. G. and Farhi, I.: Relaxation times for stationary evaporating liquid droplets, J. Atmos. Sci., 32, 1864–1867, https://doi.org/10.1175/1520-0469(1975)032<1864:RTFSEL>2.0.CO;2, 1975.
Welti, A., Lüönd, F., Kanji, Z. A., Stetzer, O., and Lohmann, U.: Time dependence of immersion freezing: an experimental study on size selected kaolinite particles, Atmos. Chem. Phys., 12, 9893–9907, https://doi.org/10.5194/acp-12-9893-2012, 2012.
Wexler, A.: Vapor pressure formulation for water in range 0 to 100 °C. A revision, J. Res. Natl. Bur. Stand., 80A, 775–785, https://doi.org/10.6028/jres.080A.071, 1976.
White, F. M.: Viscous Fluid Flow, 3rd Edn., McGraw-Hill, 656 pp., ISBN 13 978-0072402315, 2006.
Wright, T. P. and Petters, M. D.: The role of time in heterogeneous freezing nucleation, J. Geophys. Res., 118, 3731–3743, https://doi.org/10.1002/jgrd.50365, 2013.
Yang, K., Hong, F., and Cheng, P.: A fully coupled numerical simulation of sessile droplet evaporation using Arbitrary Lagrangian–Eulerian formulation, Int. J. Heat Mass Tran., 70, 409–420, https://doi.org/10.1016/j.ijheatmasstransfer.2013.11.017, 2014.
Young, K. C.: The Role of Contact Nucleation in Ice Phase Initiation in Clouds, J. Atmos. Sci., 31, 768–776, https://doi.org/10.1175/1520-0469(1974)031<0768:TROCNI>2.0.CO;2, 1974.
Zaremba, T. J., Rauber, R. M., Heimes, K., Yorks, J. E., Finlon, J. A., Nicholls, S. D., Selmer, P., McMurdie, L. A., and McFarquhar, G. M.: Cloud-Top Phase Characterization of Extratropical Cyclones over the Northeast and Midwest United States: Results from IMPACTS, J. Atmos. Sci., 81, 341–361, https://doi.org/10.1175/JAMC-D-22-0154.1, 2024.