the Creative Commons Attribution 4.0 License.
the Creative Commons Attribution 4.0 License.
 | 17 Oct 2024
Technical note: On the ice microphysics of isolated thunderstorms and non-thunderstorms in southern China – a radar polarimetric perspective
Yijun Zhang
Dong Zheng
Haoran Li
Sai Du
Xueyan Peng
Xiantong Liu
Pengguo Zhao
Jiafeng Zheng
Juan Shi
Determining whether a cloud will evolve into a thunderstorm is beneficial for understanding thunderstorm formation and also important for ensuring the safety of society. However, a clear understanding of the microphysics of clouds in terms of the occurrence of lightning activity has not been attained. Vast field observations and laboratory experiments indicate that graupel, which is rimed ice, is a vital hydrometeor for lightning generation and is the foundation of riming electrification. In this study, polarimetric radar and lightning observations are used to compare the ice microphysics associated with graupel between 57 isolated thunderstorms and 39 isolated non-thunderstorms, and the differences in radar parameters are quantified. Our results for the occurrence of lightning activity in clouds revealed the following results: (1) the maximum difference in graupel volume at the −10 °C isotherm height between thunderstorms and non-thunderstorms reached approximately 7.6 km3; (2) the graupel particles approached spherical shapes, with a mean differential reflectivity (ZDR) value of 0.3 dB, which likely indicated that heavily rimed graupel was present; (3) the median values of horizontal reflectivity (ZH) or ZDR at positions where the source initiation and channel of the first lightning flashes were nearly 31 dBZ or 0 dB; and (4) 98.2 % of the thunderstorms were equipped with a ZDR column, and the mean depth was ∼ 2.5 km. Our study deepens our understanding of lighting physics and thunderstorm formation.
- Article
(5892 KB) - Full-text XML
- BibTeX
- EndNote


Thunderstorms are typically severe convection clouds. Lightning is not only a severe weather hazard produced by thunderstorms but also a clear signature of thunderstorm formation (MacGorman and Rust, 1998). Understanding lightning activity (especially for the first lightning flash, which indicates the start of lightning activity in a cloud) is important for understanding meteorological processes and the formation of thunderstorms (Uman and Krider, 1989; Rosenfeld et al., 2008; J. W. Fan et al., 2018) and for investigating related atmospheric chemistry, such as the formation of ozone and the primary oxidant in the troposphere, the hydroxyl radical (Pickering et al., 2016; Brune et al., 2021).
The determination of whether a cloud will evolve into a thunderstorm is very difficult. The occurrence of lightning activity in clouds is a complex process involving dynamics, microphysics and electrical processes (e.g. Krehbiel et al., 1979; MacGorman and Rust, 1998; Carey and Rutledge, 2000; Stolzenburg et al., 2001; Saunders, 2008; Zhang et al., 2009; Lang and Rutledge, 2011; Zhang et al., 2016; Stough and Carey, 2020; Lyu et al., 2023). Moreover, natural lightning flashes can be categorized as intracloud lightning and cloud-to-ground lightning (Uman and Krider, 1989). Some studies have indicated that the majority of the first lightning flashes are intracloud lightning, which was concluded from the statistical results observed by polarimetric radar and lightning location systems (e.g. Mattos et al., 2017; Zhao et al., 2021a). In addition, there is a generally accepted electrification cause, especially for clarifying the first lightning flash occurrence correctly, namely noninductive charging (NIC) of two ice particles of different sizes during rebounding collisions in the presence of supercooled droplets, with the smaller ice particle being the ice crystal, and the larger ice particle being the graupel (Takahashi, 1978; Latham, 1981; Saunders et al., 1991; MacGorman and Rust, 1998; Carey and Rutledge, 2000; Zhang et al., 2009; Takahashi et al., 2017, 2019; Qie et al., 2021; Lyu et al., 2023).
The NIC was proposed on the basis of cold-chamber laboratory experiments (Reynolds et al., 1957; Takahashi, 1978). Subsequently, field observations demonstrated that lightning production is critically linked to ice processes (i.e. graupel signatures) (Dye et al., 1986; Takahashi et al., 1999; Carey and Rutledge, 2000; Basarab et al., 2015; Stolzenburg et al., 2015; Mattos et al., 2016, 2017; Takahashi et al., 2017, 2019; Hayashi et al., 2021; Zhao et al., 2022). Numerical simulation studies also support the NIC mechanism as the main contributor to charge separation conducive to lightning flash triggering at timescales relevant to storm duration (e.g. Helsdon et al., 2001; Mansell et al., 2005; Barthe and Pinty, 2007). Therefore, graupel is a vital precipitation particle for riming electrification mechanism.
Graupel is rimed precipitation ice. However, the mechanisms for graupel formation vary with cloud type. One pathway to graupel that is very common in warm-based clouds worldwide is the development of raindrops in warm rain collision–coalescence processes (e.g. Braham, 1986; Beard, 1992; Herzegh and Jameson, 1992; Bringi et al., 1997; Carey and Rutledge, 2000), followed by lofting of the raindrop in the updraft to subfreezing temperatures (which is frequently observed by polarimetric radar and called the differential reflectivity (ZDR) column), and then by drop freezing and finally riming into graupel or small hail. This coalescence–freezing mechanism is often the most important pathway to the first graupel/hail, the first significant electrification, and the first lightning flash in warm-based clouds (e.g. Braham, 1986; Beard, 1992; Herzegh and Jameson, 1992; Bringi et al., 1997; Smith et al., 1999; Carey and Rutledge, 2000; Stolzenburg et al., 2015; Mattos et al., 2017). Another pathway to graupel or small hail production is initiated via the aggregation of ice crystals into snow aggregates, followed by the riming of the snow aggregate into graupel and possibly even small hail as the rime density increases (Heymsfield, 1982; Li et al., 2018).
It should also be emphasized that the formation of graupel is closely related not only to lightning activity but also to the strength of updrafts in clouds, and the latent heat of freezing enhances updrafts, promoting severe storm formation (Rosenfeld, 1999; Zhang et al., 2004; Rosenfeld et al., 2008). More droplets freeze aloft and release more latent heat for nucleation, thereby invigorating convective updrafts and producing lightning and deep-convective clouds form (Rosenfeld, 1999; Zhang et al., 2004; Rosenfeld et al., 2008). Therefore, investigating the ice microphysics associated with graupel is essential for understanding thunderstorm formation.
Polarimetric radar is the best observation system for tracking the specific location and timing of a cloud and inferring the microphysical characteristics within clouds (e.g. Seliga and Bringi, 1976; Zrnic and Ryzhkov, 1999; Kumjian, 2013; Hu et al., 2019; Huang et al., 2023). Many studies (e.g. Laksen and Stansbury, 1974; Marshall and Radhakant, 1978; Dye et al., 1986; Vincent et al., 2003; Latham et al., 2007; Woodard et al., 2012; Mattos et al., 2016, 2017; Hayashi et al., 2021; Zhao et al., 2022) have investigated the relationship between ice microphysics and lightning activity and provided methods for predicting the first lightning flash occurrence based on the riming electrification mechanism; specifically, graupel-related reflectivity at −10 °C or colder is a commonly supported leading reflectivity parameter for forecasting the first lightning flash (e.g. Laksen and Stansbury, 1974; Marshall and Radhakant, 1978; Vincent et al., 2003; Woodard et al., 2012; Hayashi et al., 2021). However, the performances of these methods vary with season, geography, or other atmospheric variables; more directly, different ice microphysics within different clouds dominate. There is no doubt that the graupel signatures inferred by polarimetric radar are universally present in convective clouds, whereas some clouds involve no lightning (e.g. Woodard et al., 2012; Hayashi et al., 2021; Cui et al., 2022; Zhao et al., 2022). Specifically, the graupel signature inferred by the polarimetric radar needs to be partitioned into more details according to the radar parameters. Therefore, we conducted this study to better understand the ice microphysics associated with graupel within thunderstorms.
We accomplished this goal by comparing the ice microphysics associated with graupel between isolated thunderstorms and non-thunderstorms during the warm season over southern China and quantifying differences in graupel magnitude and shape (implying the riming efficiency) in radar parameters, instead of studying the evolution variation within the same thunderstorm (the role of some polarimetric signatures would be covered in the same cloud evolution). Furthermore, we discussed the possible microphysics associated with the source initiation and channel of the first lightning flash via 3D lightning mapping. To our knowledge, no other study addressing this topic has been published. In addition, we explored the role of the coalescence–freezing mechanism in the production of lightning based on the information provided by the ZDR column, a narrow vertical extension of positive ZDR values above the 0 °C isothermal height associated with updrafts and supercooled liquid water in deep- and moist-convective storms (e.g. Hall et al., 1980; Ryzhkov et al., 1994; Kumjian and Ryzhkov, 2008; Kumjian, 2013; Kumjian et al., 2014; Snyder et al., 2015; Zhao et al., 2020; Chen et al., 2023). Isolated thunderstorms are common in southern China during the warm season (Mai and Du, 2022). From the perspective of isolated storms in the warm season, the physical processes within clouds are easier to explain, and the characteristics of graupel microphysics can be compared with those of cold-based clouds (Li et al., 2018).
The dataset used in this study was the same as that used in Zhao et al. (2021a, 2022). In Zhao et al. (2021a), the dataset was first shown to the public. They obtained observations of 57 (39) isolated thunderstorms (non-thunderstorms) that occurred over South China in the warm season (from late May to early September) during 2016 and 2017 from the S-band polarimetric radar and three independent lightning location systems. The role of turbulence characteristics in producing the first lightning flashes was evaluated on the basis of the dataset, and the results indicated that the eddy dissipation rate of non-thunderstorms was clearly lower than that of thunderstorms (Zhao et al., 2021a). Moreover, the polarimetric radar parameters of the first radar echoes (the first radar volume scan when clouds are detected by radar) were compared to determine the early difference between thunderstorms and non-thunderstorms on the basis of this dataset (Zhao et al., 2022). The greater echo intensity occurred in non-thunderstorms below the −10 °C isotherm height, and the cause for this feature and effect on subsequent cloud development was simply discussed by integrating comprehensive observations (e.g. the ERA-Interim reanalysis data, surface aerosol concentration, and graupel and rainwater contents derived from radar observations).
The error in the graupel content estimated in Zhao et al. (2022) is uncertain, and the efficiency of the microphysical process (i.e. riming) associated with graupel is unknown; this represents a gap in understanding the role of graupel in the first lightning flash occurrence based on field observations. Naturally, we aimed to identify a method to quantify differences in graupel magnitude and riming efficiency in this study to minimize the error as much as possible. The radar sample volume, which corresponds to graupel identification, was used to indicate the graupel magnitude instead of the derived graupel content, as in Carey and Rutledge (2000) and Zhao et al. (2022). The variety of ZDR shapes was used to determine the riming efficiency. Thus, the goal and method of this study were substantially different from those of the two previous studies noted above, although they are based on the same dataset.
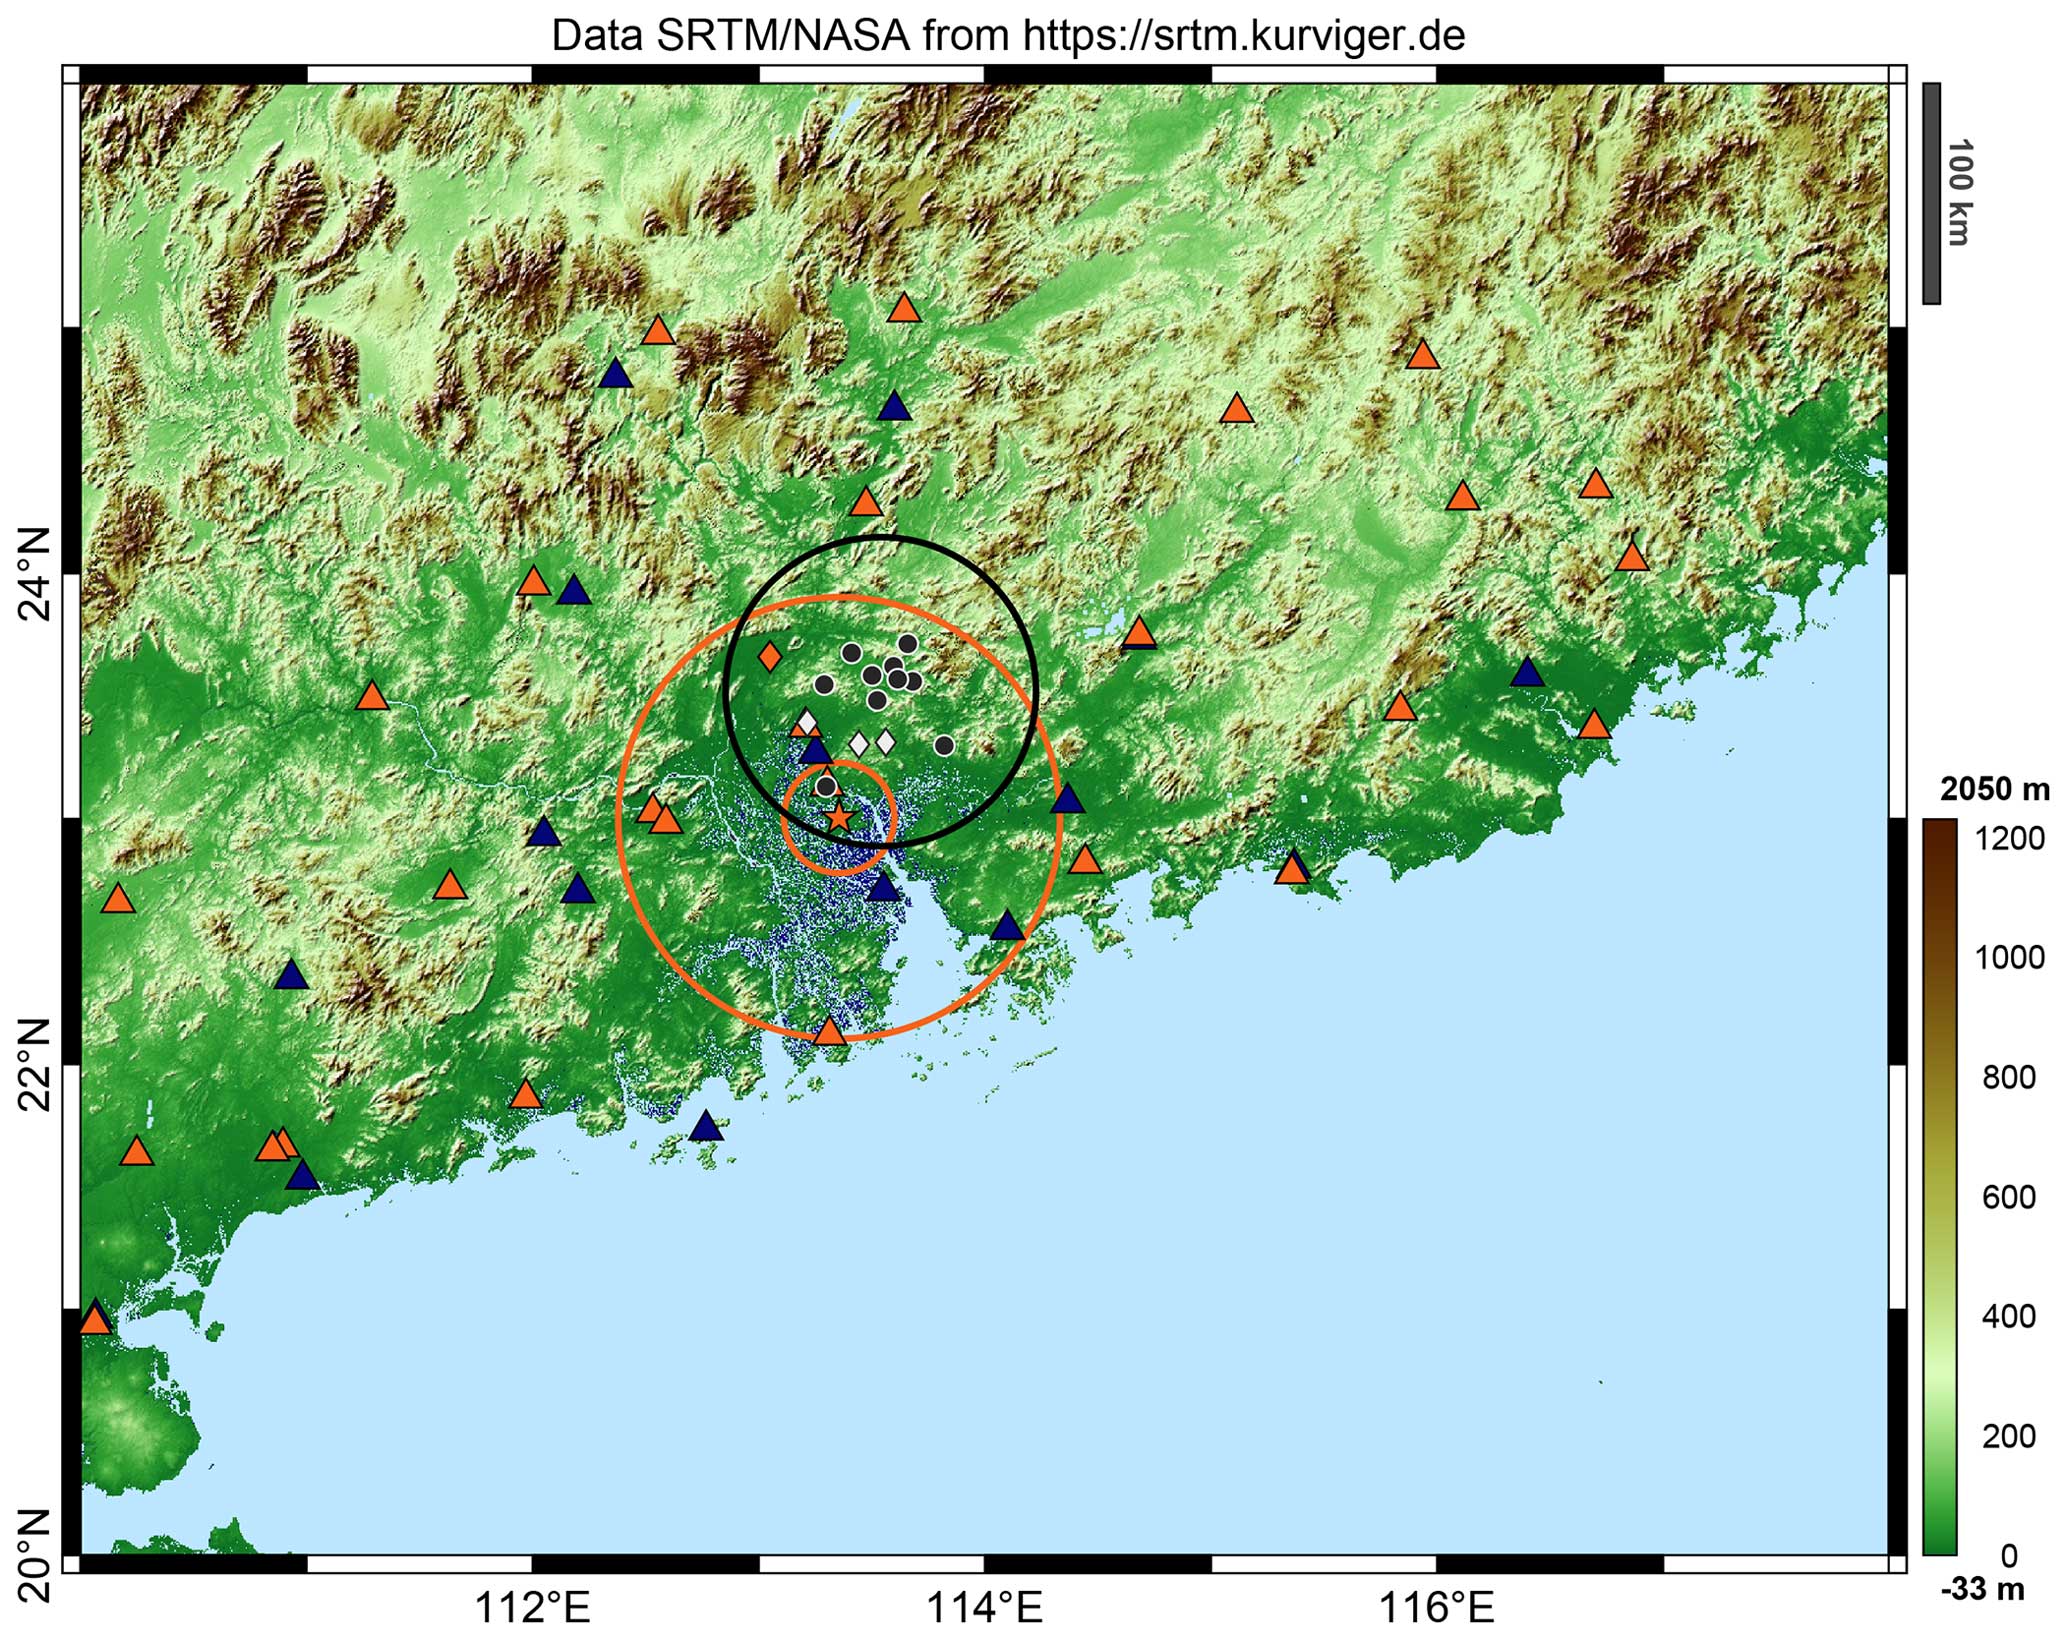
Figure 1The locations of the detection systems and the analysed area. The orange star indicates the Guangzhou S-band polarimetric radar (GZ radar); the orange circles represent distances from the GZ radar site of 25 and 100 km. The black dots indicate the 10 sensors of the Low-frequency E-field Detection Array (LFEDA); the black circle indicates a distance of 70 km from the centre of the LFEDA network. The blue triangles indicate the 16 sensors of the Earth Networks Lightning Location System (ENLLS), and the orange triangles indicate the 27 sensors of the Guangdong lightning location system (GDLLS). The white diamonds indicate the three ground sites of aerosol concentration measurements. The orange diamond indicates the Qingyuan meteorological observatory. The analysed area is restricted to the regions of overlapping coverage between the GZ radar radius of 25–100 km and the LFEDA station network centre radius of 70 km.
The Guangzhou S-band polarimetric radar (GZ radar) provided the radar data, as marked by the orange star in Fig. 1. The beam width of the GZ radar was ≤ 1°, and a full radar volume scan lasted 6 min; this consisted of nine elevation angles with a radial resolution of 250 m. A procedure for quality control was carried out to remove ground clutter, anomalous propagation, and biological scatter, and the ZDR offset of the raw data was corrected (Zhao et al., 2022). The quality-controlled radar data were interpolated onto a Cartesian grid at a horizontal resolution of 250 m and a vertical resolution of 500 m from 0.5 to 20 km above the mean sea level via the nearest neighbour and vertical linear interpolation.
A hydrometeor identification method, which is based on the fuzzy logic algorithm, was carried out to discriminate the graupel particles, as in Zhao et al. (2021b). The algorithm and approximate ranges of the S-band values of each polarimetric variable essentially followed Park et al. (2009) and Kumjian (2013), with an improvement in the parameters of the membership functions of the fuzzy logic algorithm for the performance of the GZ radar, especially for dry/wet snow particles (Wu et al., 2018). In addition, temperature information was one of the few factors added to the hydrometeor identification method because it can separate liquid precipitation from solid hydrometeors to avoid visible identification errors (e.g. Bechini and Chandrasekar, 2015; Kouketsu et al., 2015; Zhao et al., 2020).
Three independent lightning location systems provided lightning observations. The Low-frequency E-field Detection Array (LFEDA; as marked by black dots in Fig. 1) can detect three-dimensional structures of intracloud lightning and/or cloud-to-ground lightning. The detection efficiency and mean location error in LFEDA for triggered lightning were approximately 100 % and 102 m, respectively (Shi et al., 2017; X. Fan et al., 2018). The Earth Networks Lightning Location System (ENLLS; as marked by blue triangles in Fig. 1) can detect two-dimensional locations for intracloud lightning and/or cloud-to-ground lightning. The detection efficiency and mean location error in ENLLS for triggered lightning and the natural strike of tall structure lightning were approximately 77 % and 685 m, respectively (Zhao et al., 2021a). The Guangdong lightning location system (GDLLS; as marked by orange triangles in Fig. 1) can locate cloud-to-ground lightning. The detection efficiency and mean location error in the GDLLS for triggered lightning and the natural strike of tall structure lightning were approximately 94 % and 741 m, respectively (Chen et al., 2012).
The lightning flash was assigned to its corresponding cell using the boundary of the cell as a constraint every 6 min. The first lightning flash of a thunderstorm was defined by its first detection from one of three lightning location systems. An isolated non-thunderstorm cell was selected when no flash in the cell was detected by any of the three lightning location systems. To ensure detection data quality, the analysis area was restricted to the regions of overlapping coverage between the GZ radar radius of 25–100 km and the LFEDA station network centre radius of 70 km (Fig. 1), as in Zhao et al. (2021a, 2022). Any isolated cell storm generated within the analysis area that moved completely outside the analysis area or merged with other precipitation cells was excluded. The intersection of the 20 dBZ contours of the two intersecting cells is referred to as merging. For thunderstorms, we ensure that the first lightning flash of the cell must occur before merging or when there is no merging. For storm cell development, if no merging process occurs, and the maximum reflectivity of this cell starts to fade with a value of less than 30 dBZ later, then the evolutionary process of a cell will mark the cessation stage. Our objective was to focus on isolated storm cells; therefore, if the merging process occurs before the fading of the maximum reflectivity of this cell, the evolutionary process of the cell will also signal the cessation stage.
In the dataset, six merging events occurred in non-thunderstorms, and the values of maximum reflectivity for these non-thunderstorms did not increase after merging occurred. In addition, the maximum reflectivity within any non-thunderstorm cell from initiation to cessation must exceed 45 dBZ to avoid the statistics of weak precipitation cells. Non-thunderstorms are characterized by no flash occurrence from initiation to cessation. The sounding data were obtained from the Qingyuan meteorological observatory, as marked by the orange diamond in Fig. 1, which also provided the environmental temperature. Isolated thunderstorm/non-thunderstorm cells were identified and tracked manually, based on the observations from the GZ radar and lightning location systems. The average distances between these storms and the radar/sounding site were approximately 70 and 56 km, respectively. More details related to these data and the selection methods for isolated thunderstorm and non-thunderstorm cells are available in Zhao et al. (2021a, 2022).
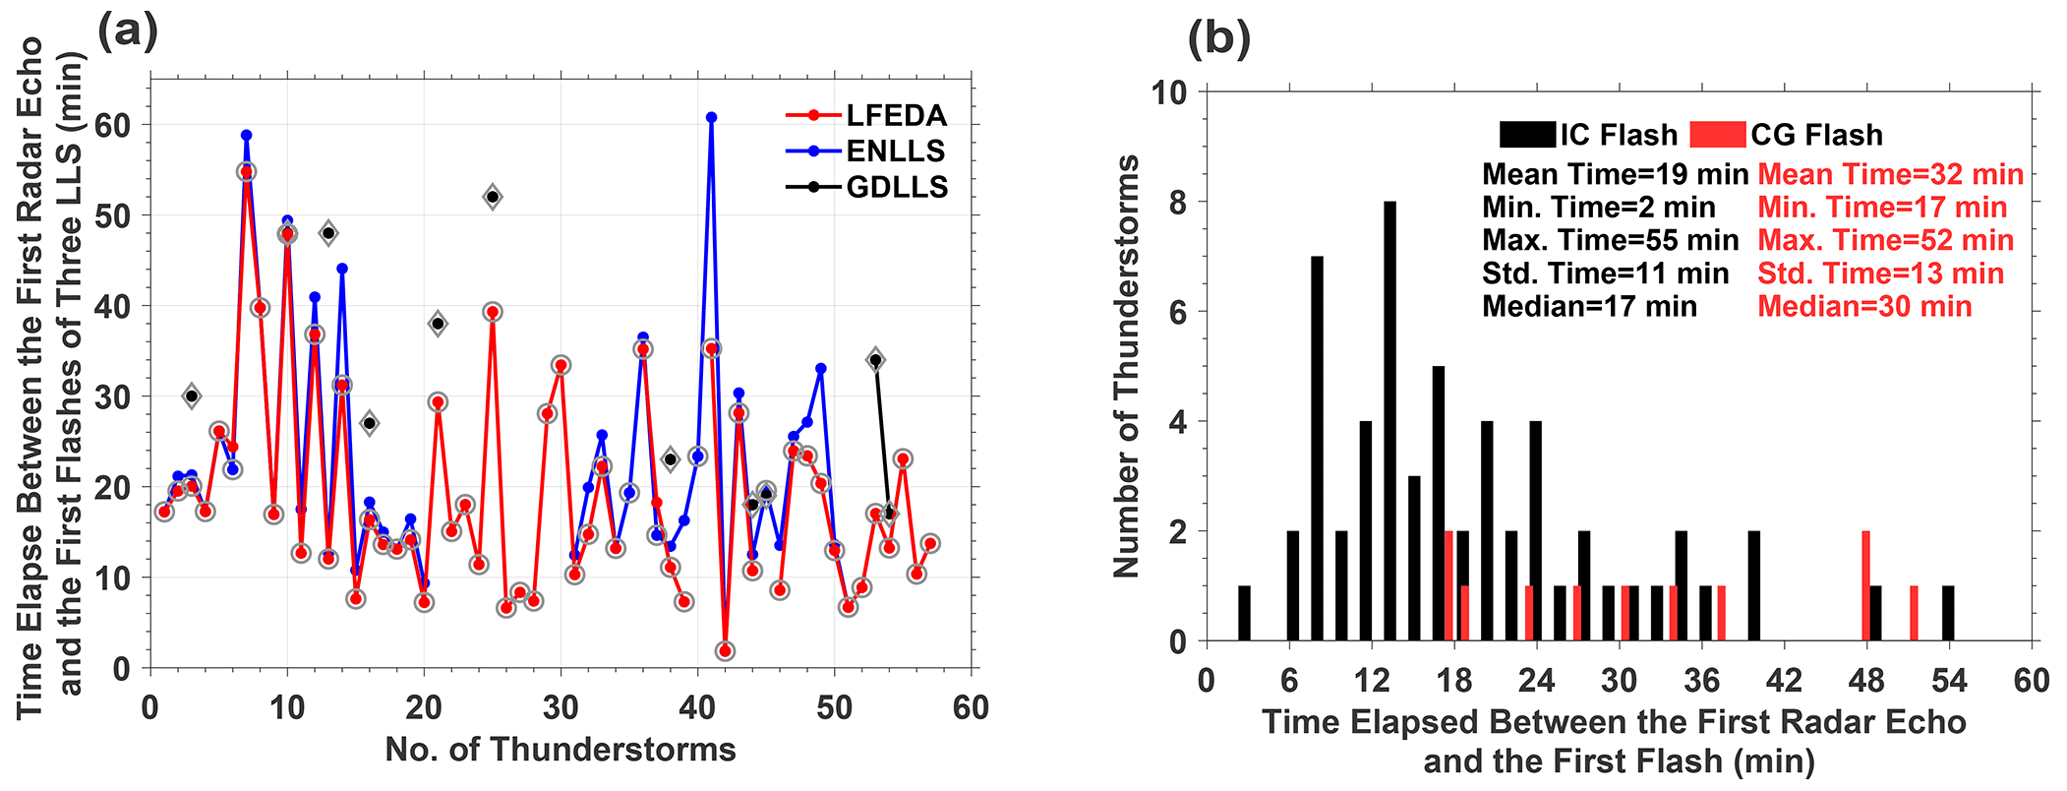
Figure 2Lightning observations. Elapsed time between the first radar volume scan and (a) the first flashes of three lightning location systems, LFEDA (red line), ENLLS (blue line), and GDLLS (black line), where the grey circles indicate the first IC flashes and the grey diamonds indicate the first CG flashes. (b) The elapsed time between the first radar volume scan and the first flashes of thunderstorms, the first IC flashes (black columns), and the first CG flashes (red columns).
In this study, the evolution cycle of a thunderstorm consists of three stages: (i) the first radar volume scanning in cases where the horizontal reflectivity (ZH) ≥ 5 dBZ is called the first stage (hereafter referred to as the no. 1 stage), (ii) the intermediate radar volume scanning between the first stage and the third stage is called the second stage (hereafter referred to as the no. 2 stage), and (iii) the radar volume scanning in cases where the first lightning flash occurs is called the third stage (hereafter referred to as the no. 3 stage). Similarly, the evolution cycle of a non-thunderstorm also contains three stages, but radar volume scanning in cases where the most intense echo occurs is called the third stage; here, the most intense echo is used to indicate the strongest convection development stage of non-thunderstorms for comparison with the first lightning flash stage of thunderstorms. The average durations from the first stage to the third stage for thunderstorms and non-thunderstorms were 19 and 24 min, respectively.
The majority of first lightning flash events (∼ 98 %) were considered intracloud flashes (IC flashes), and only one was considered a cloud-to-ground flash (CG flash) (Fig. 2a). The majority of first lightning flashes (∼ 91 %) was determined by the LFEDA because of its superior detection efficiency and accuracy for detecting lightning flashes in this analysis area (Fig. 2a). The elapsed time between the first radar volume scan and the first IC or CG flash (indicated by the first IC or CG return stroke) is shown in Fig. 2b. The results show that the average elapsed time between the first radar volume scan and the first IC flash was approximately 19 min, and the first CG flash was approximately 32 min (Fig. 2b). A recent study (Mattos et al., 2017) also revealed that in ∼ 98 % of thunderstorms, the first IC flash preceded the first CG flash, and the IC flashes occurred approximately 29 min after the first radar echo, while CG flashes were most frequently delayed by approximately 36 min. The definition of the first radar echo may be the possible reason that the first flashes occurring after the first radar echo in Mattos et al. (2017) occurred later than those in our study.
In addition, the average 1 h surface concentration observations of particulate matter () were provided by three ground sites (Fig. 1; white diamonds) within the analysed area. The concentration data suggest that the environment prior to these isolated thunderstorms or non-thunderstorms was clean and that the difference in the environmental aerosol concentration between thunderstorms and non-thunderstorms may be small (the mean values of concentrations prior to thunderstorms and non-thunderstorms were 22.9/42 and 20.5/38.8 µg m−3, respectively).

Figure 3Characteristics of radar echoes with cloud development. (a) Echo-top heights of 0 dBZ and echo-base heights of 0 dBZ for 57 thunderstorm and 39 non-thunderstorm cells from the first stage to the third stage of cloud development are indicated by scatter points and triangles, respectively, together with error bars. Error bars are computed as 95 % confidence intervals. Box plots for the 57 thunderstorms (orange) and 39 non-thunderstorms (blue) for echo depths are shown (all units are in km). The dashed grey lines indicate the −38 and −30 °C isotherm heights. (b) The mean (maximum) value of the ZH in a thunderstorm or a non-thunderstorm during every stage is shown in notched box plots (non-notched box plots) (all units are in dBZ). The median values in the box plots are shown as continuous horizontal black lines. The temperature data were obtained from the sounding data of the Qingyuan meteorological observatory.
3.1 Morphology and intensity of the echoes in and/or before the first lightning flash occurrence
The scatters and triangles with error bars in Fig. 3a depict the echo-top heights and echo-base heights of the 57 thunderstorms and 39 non-thunderstorms from the first stage to the third stage of cloud development via the reflectivity threshold (0 dBZ), and the echo depths are shown in the box plots. The echo-top heights of thunderstorms and non-thunderstorms increase as clouds develop. For the echo-top height data, approximately 95 % of the thunderstorms exceeded the −30 °C isotherm height, and 85 % exceeded the −38 °C isotherm height of the glaciated layer during the third stage of cloud development; however, only 26 % and 23 % of the non-thunderstorms exceeded the −30 °C and the −38 °C isotherm heights, respectively, during the third stage of cloud development. However, the echo-base heights mildly decreased with the development of clouds; slight differences in the echo-base heights occurred between thunderstorms and non-thunderstorms.
When the first lightning flashes occurred, approximately 84 % of the thunderstorms and only 23 % of the non-thunderstorms achieved an echo depth of 10 km. Lightning is the product of the severe storms, and scientists often equate storm intensity with lightning flashes (e.g. Zipser et al., 2006; J. W. Fan et al., 2018), but defining convective intensity is not as easy as it may seem (Zipser et al., 2006); this could provide supplementary quantitative evidence for assisting scientists in equating storm intensity with lightning flashes and determining the cloud depth corresponding to the first lightning flash occurrence.
Figure 3b shows that the differences in the mean (maximum) values of the ZH between the thunderstorm and non-thunderstorm periods during each stage are slight; specifically, the median differences in the mean values are −2, 2, and 3 dBZ, respectively. The median differences in the maximum values are −4, 5, and 5 dBZ, respectively. Thunderstorms exhibit greater ZH intensities than non-thunderstorms do, except for those in the first stage of cloud development. The signature of larger mean or maximum values of ZH in non-thunderstorms during the first stage than in thunderstorms has been discussed by Zhao et al. (2022), and this aspect is not the focus of this study. The mean or maximum values of ZH in thunderstorms increase and exceed those in non-thunderstorms when the first lightning flashes occur; however, the box plots show that we cannot effectively differentiate thunderstorms from non-thunderstorms with respect to the ZH intensity.
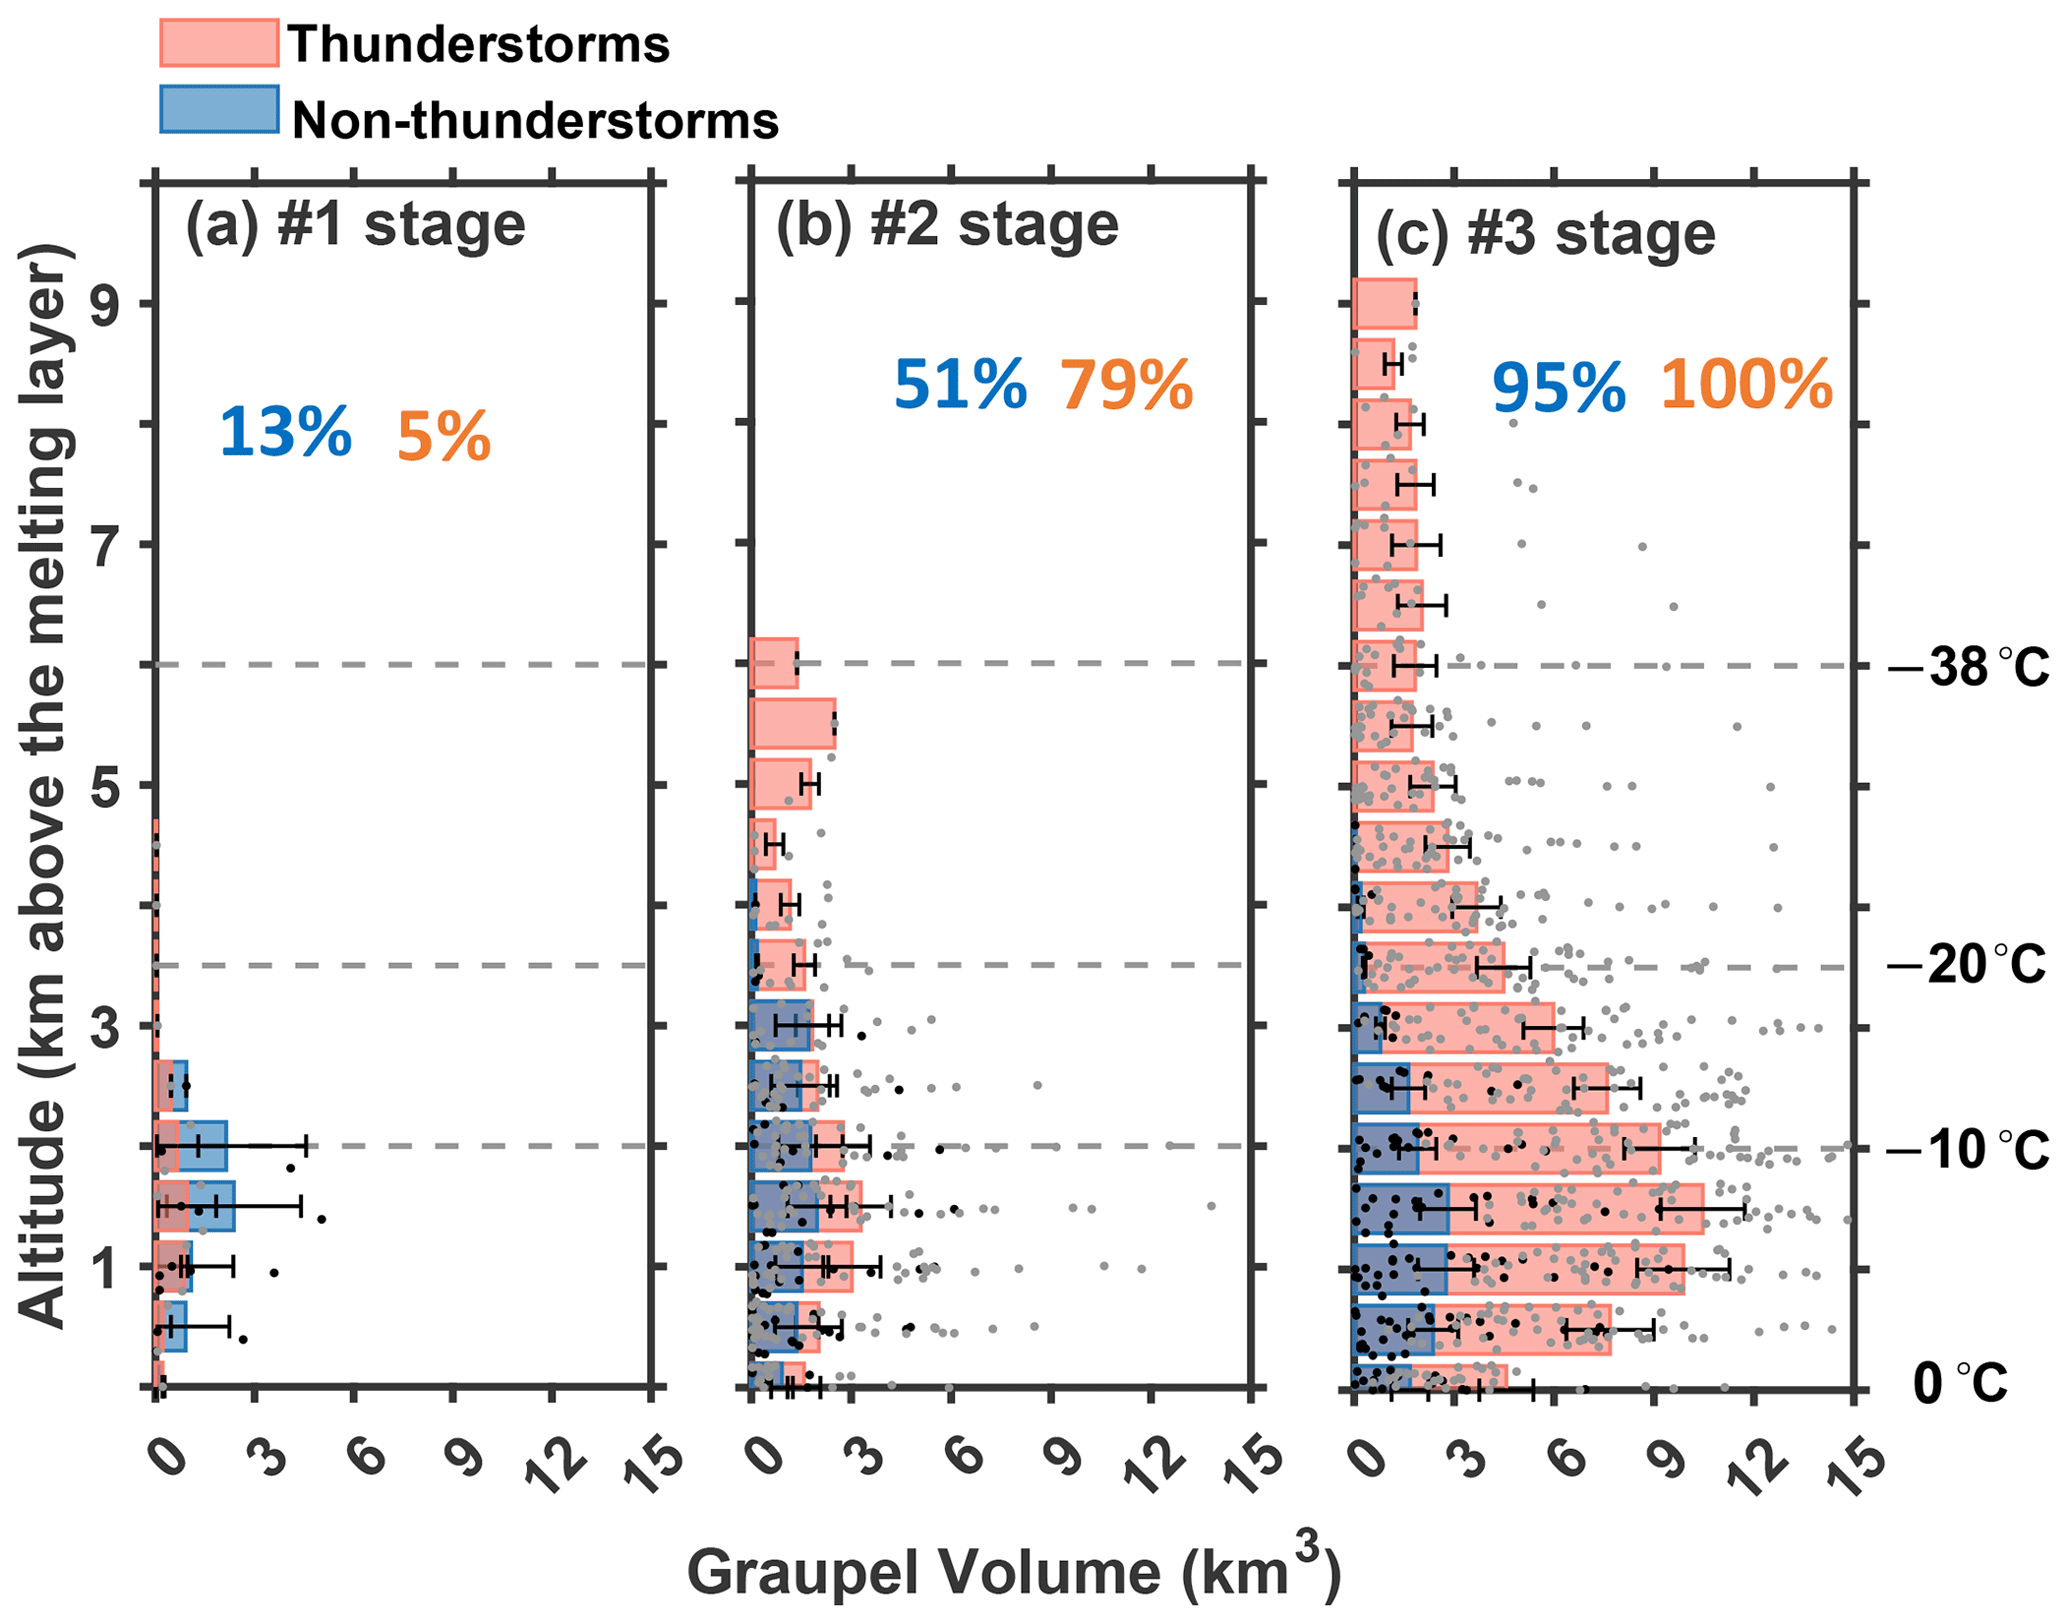
Figure 4Distribution of graupel signals and volume with cloud development. Histogram plots with error bars for the distribution of the graupel volume above the melting layer for thunderstorm and non-thunderstorm cells during each stage of cloud development. Each grey dot indicates the total graupel volume on a height layer (the definition of the height layer is a vertical resolution of 500 m over 0.5 to 20 km above the mean sea level, with 40 height layers in total) of a thunderstorm; the black dots indicate non-thunderstorms (units in km3). The mean graupel volume in a height layer for the 57 thunderstorms is displayed as an orange histogram, and a blue histogram shows the graupel volume for non-thunderstorms (in km3). Error bars are computed as 95 % confidence intervals. The numerical values in orange and blue are the percentages of thunderstorms and non-thunderstorms that show graupel signals, respectively. Panel (a) represents the first stage of cloud development, and panels (b) and (c) represent the third and second stages of cloud development, respectively. The −10, −20, and −38 °C isotherm heights are displayed in the histogram plots.
3.2 Variations in graupel magnitude with cloud development
Graupel is a vital precipitation particle for the riming electrification mechanism, and its radar signature is not obscured by small ice particles. Thus, to investigate the microphysical characteristics related to the first lightning flash occurrence during storms, we obtained inferred “graupel”, which was derived from the fuzzy logic method based on the GZ radar (Park et al., 2009; Kumjian, 2013; Zhao et al., 2021b, 2022).
Each bar in Fig. 4 indicates the mean value of the graupel volume in a height layer (the definition of the height layer is a vertical resolution of 500 m over 0.5 to 20 km above the mean sea level, with 40 height layers in total) for 57 thunderstorms or 39 non-thunderstorms during each stage of cloud development. Specifically, the volume is computed by accumulating the radar sample grids; each radar sample grid is 0.03125 km3 and 0.25 km × 0.25 km × 0.5 km.
Graupel is rare in thunderstorms or non-thunderstorms during the first stage of cloud development (e.g. Dye et al., 1986; Mattos et al., 2017), and only 5 % (13 %) of thunderstorms (non-thunderstorms) show graupel signals (Fig. 4). This finding is consistent with the results of Lang and Rutledge (2011), who indicated that the existence of a 30 dBZ echo above the freezing altitude is a necessary condition (in ∼ 90 % of cases) for lightning occurrence. This value is well above the 5 dBZ threshold used in this study to detect the first stage of a storm and can explain why graupel is rare in this stage. Moreover, in a modelling study of an isolated thunderstorm, Barthe and Pinty (2007) reported a delay of ∼ 20 min between the first occurrence of graupel and the first lightning flash. In this case study, this delay was attributed to the time for graupel and vapour-grown ice to locally gain charge through the NIC mechanism and to the sedimentation of the different particles leading to macroscopic charge separation.
We proposed a mechanism for explaining the larger graupel volume in non-thunderstorms during the first stage of cloud development; more warm precipitation growth in non-thunderstorms due to cyclic drop growth resulting from coalescence under weaker updrafts may promote greater drop formation (Kumjian et al., 2014; Mather et al., 1986; Stough et al., 2021). These larger drops are lifted above the 0 °C isothermal height and freeze to graupel-sized particles via a coalescence–freezing mechanism (e.g. Bringi et al., 1997; Carey and Rutledge, 2000). With the development of clouds, the proportion of thunderstorms (non-thunderstorms) that produced graupel reaches 79 % (51 %) and 100 % (95 %) during the second and third stages of cloud development, respectively.
The greatest difference in graupel magnitude between thunderstorms and non-thunderstorms is found during the third stage of cloud development; the maximum difference in graupel volume in a height layer reaches approximately 7.6 km3, and the height of the maximum difference is near the −10 °C isotherm height. This information is consistent with the NIC electrification mechanism, namely more graupel leads to more cloud electrification. In addition, more graupel corresponds to more latent heat being released for convection invigoration. Interestingly that the height corresponding to maximum difference in graupel volume is consistent with the main negative charge layer in thunderstorms over Guangzhou (Liu et al., 2020). Thus, the results suggested that the location of the negative charge layer may depend on the height of the maximum graupel magnitude. Notably, the graupel volume should be more accurately phrased as the presence of graupel in this volume. These characteristics indicate that graupel signals are universally present in thunderstorms and non-thunderstorms and that the difference in the magnitude of the graupel volume is the key for the first lightning flash occurrence.
3.3 More microphysical information based on radar variables
As the graupel volume increases from the first radar track to the occurrence of the first lightning flash, the graupel volume in thunderstorms is clearly greater than that in non-thunderstorms during the third stage of cloud development. However, the understanding of the details of the increase in graupel volume is limited (e.g. the variation in the maximum dimension or number concentration and precursor signature). In addition, although the coalescence–freezing mechanism dominating the formation of graupel within warm-season thunderstorms is generally accepted (e.g. Braham, 1986; Beard, 1992; Herzegh and Jameson, 1992; Bringi et al., 1997; Smith et al., 1999; Carey and Rutledge, 2000; Stolzenburg et al., 2015; Mattos et al., 2017), more studies are needed to support this mechanism.
The ZDR parameter could provide more information on graupel (e.g. shape) (e.g. Mattos et al., 2017; Li et al., 2018) and supercooled liquid water (e.g. ZDR column) (e.g. Kumjian, 2013; Kumjian et al., 2014). The variance in the shape of the graupel indicates the riming efficiency; specifically, the heavily rimed ice particles approach a spherical shape (Kumjian, 2013; Li et al., 2018). Although the shape cannot directly indicate the variation in the maximum dimension, the speculated riming efficiency from the variation in the graupel shape could provide related information on the maximum dimension of graupel particles; typically, a more spherical shape (a decrease in ZDR) and more riming result in a stronger ZH corresponding to a larger maximum dimension (Li et al., 2018). The supercooled liquid water indicated by positive ZDR values above the 0 °C isothermal height is the precursor for freezing particles, followed by the embryo of graupel particles (e.g. Carey and Rutledge, 2000). Thus, the existence and/or variance of the ZDR column before the occurrence of the first lighting flash could support the coalescence–freezing mechanism. Moreover, we can obtain the quantitative difference in the ZDR between thunderstorms and non-thunderstorms, especially for the occurrence of the first lightning flash.
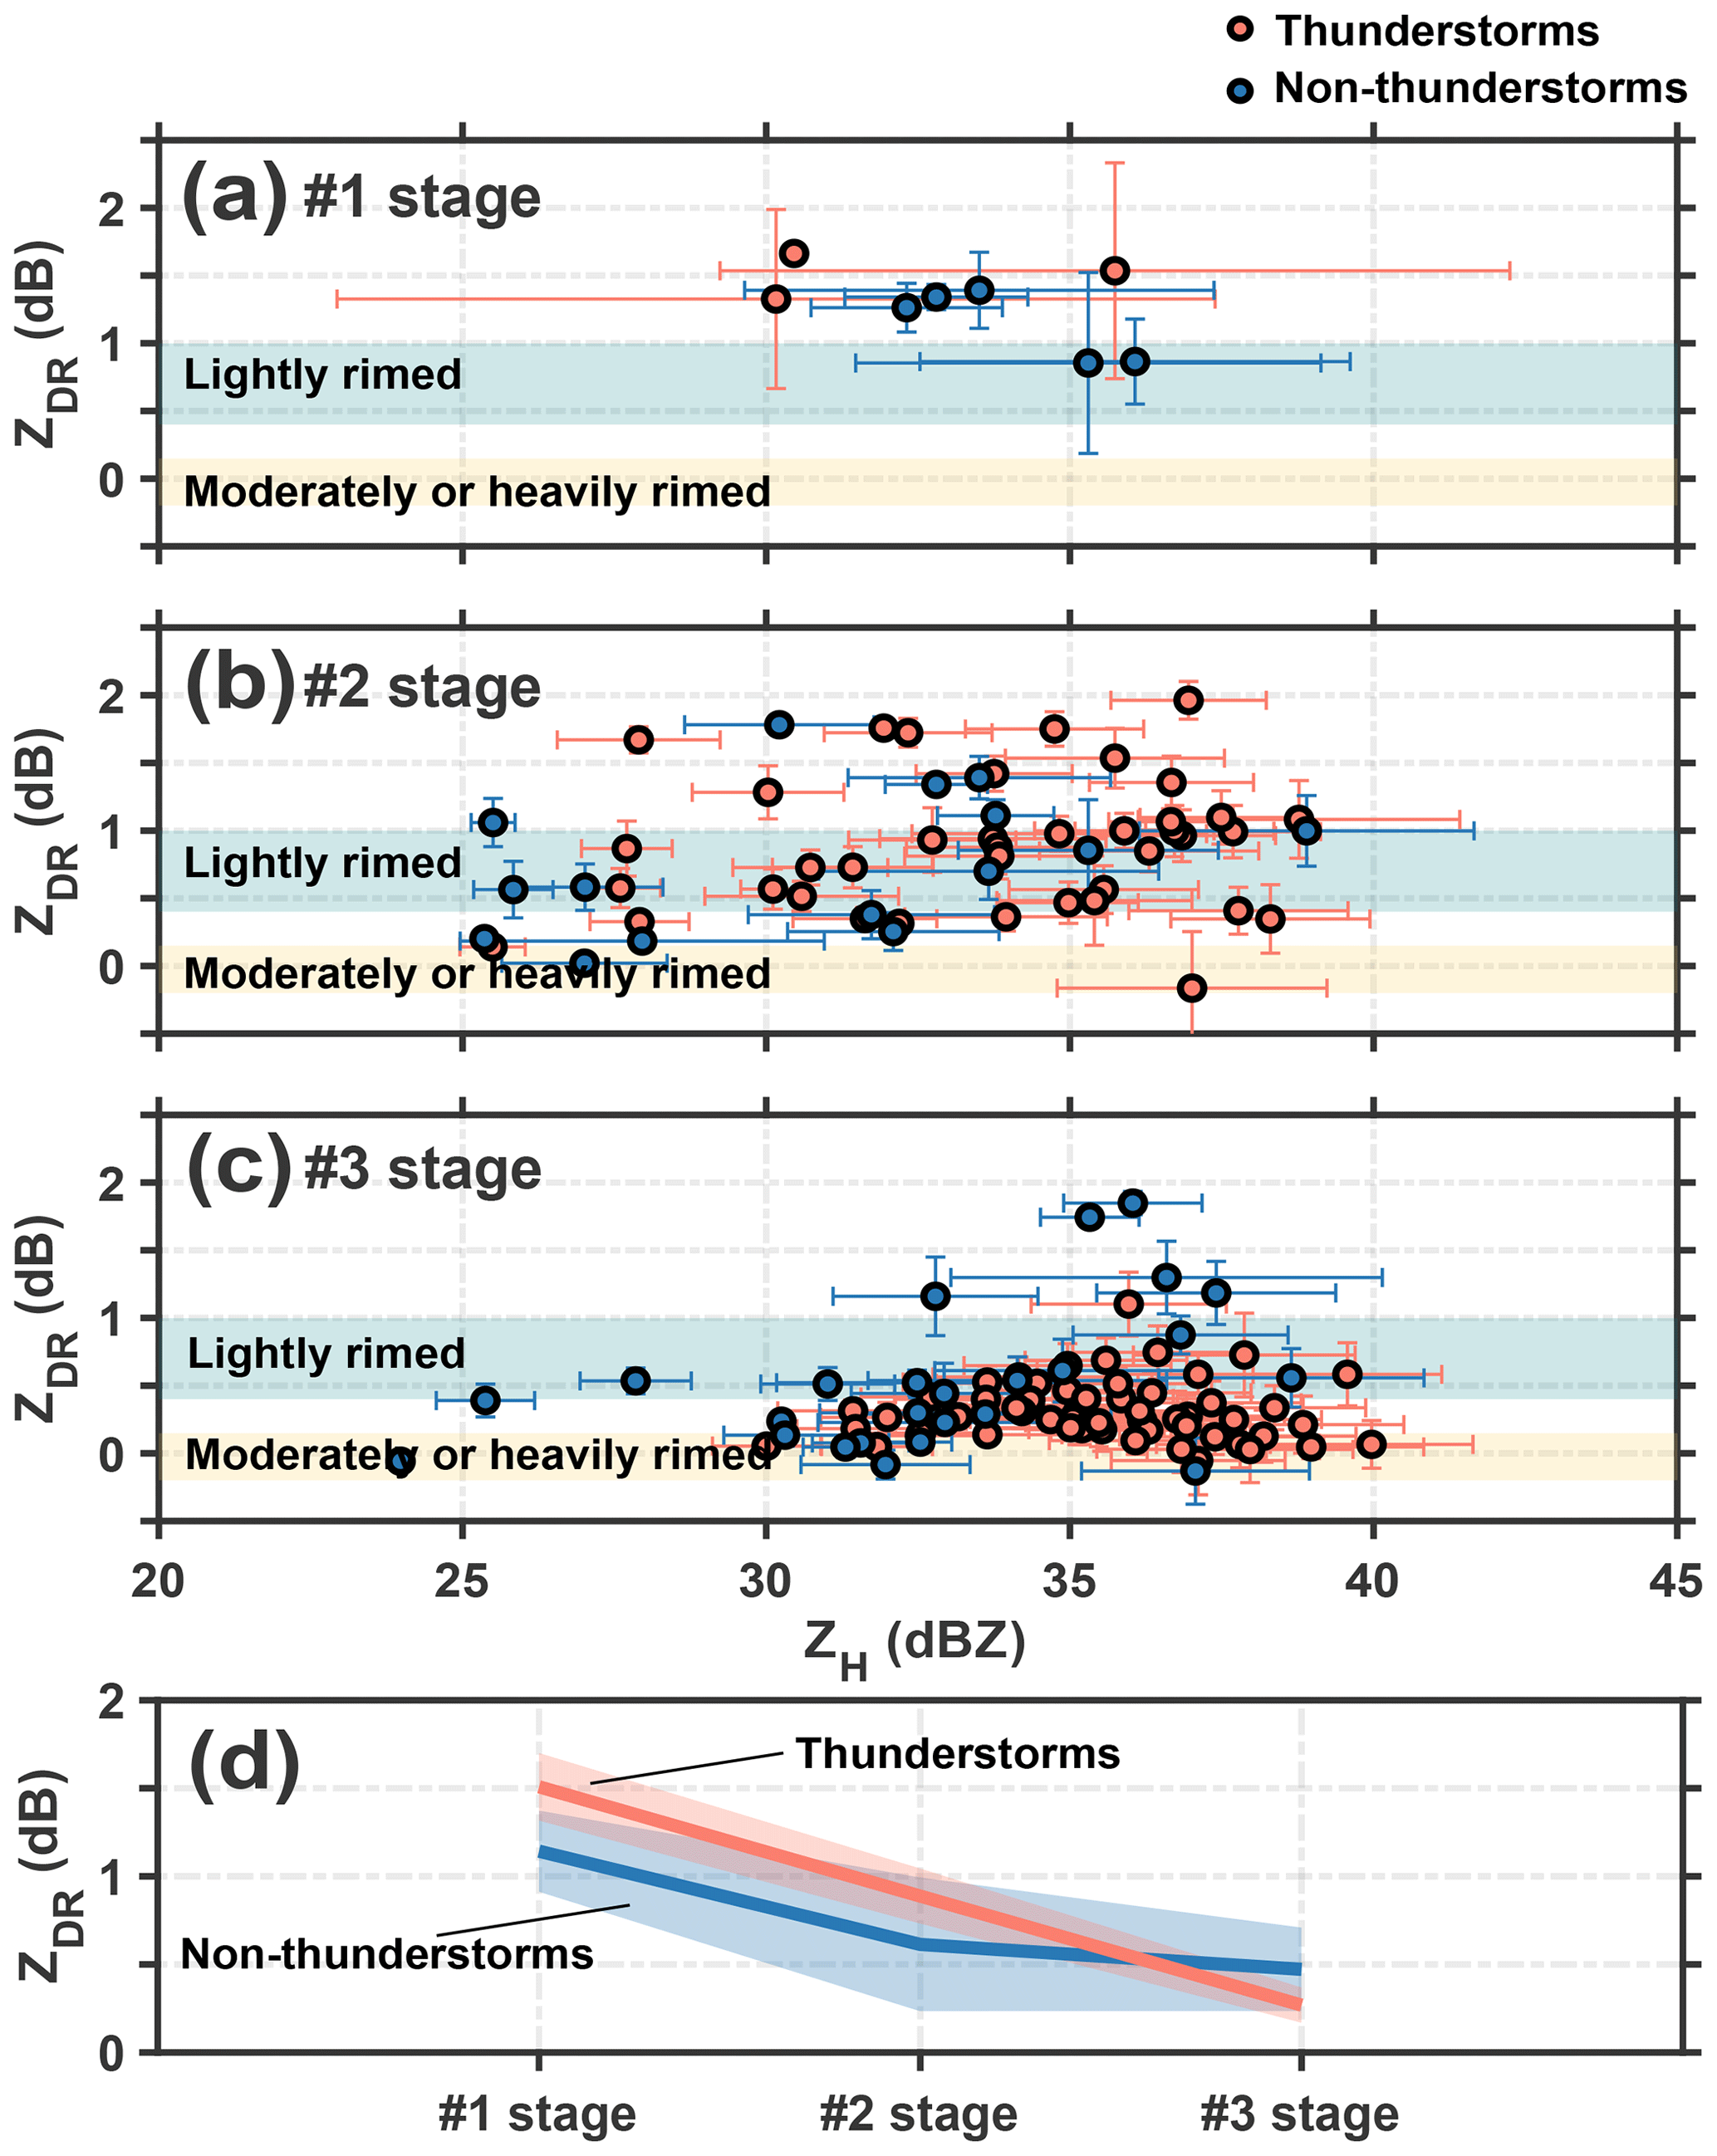
Figure 5Graupel shape in and/or before the first lightning flash occurrence. Scatter plots with error bars for the mean values of ZH and ZDR corresponding to graupel particles above the ∼ −3 °C isotherm height in thunderstorm (orange) and non-thunderstorm (blue) cells during each stage of cloud development. Error bars are computed as 95 % confidence intervals. The inferred differences in the efficiency of the riming process are shown by the threshold values of ZH and ZDR; the shaded area in blue indicates the high possibility that graupel particles are lightly rimed, and comparatively, the shaded area in yellow indicates that graupel particles are moderately or heavily rimed. (a) First stage, (b) second stage, and (c) third stage of cloud development. In addition, the statistical mean values are given in panel (d), and the orange (blue) line indicates the mean value of the ZDR corresponding to the above scatters in thunderstorms (non-thunderstorms) during each stage of cloud development. The shaded area indicates the 95 % confidence interval.
3.3.1 Differences in the shapes of graupel particles between thunderstorms and non-thunderstorms
The mean values of ZH and ZDR corresponding to graupel particles (the radar sample grids are identified as graupel) above the ∼ −3 °C isotherm height (avoiding melting effects) in thunderstorms and non-thunderstorms during each stage of cloud development are displayed in Fig. 5. Each orange dot indicates the mean values of ZH and ZDR corresponding to graupel above the ∼ −3 °C isotherm height in a thunderstorm; each blue dot indicates that in a non-thunderstorm. On the basis of these results, the average intensity of the ZDR corresponding to the graupel particles decreases with cloud development, which indicates that the graupel particles gradually approach a spherical shape (Fig. 5d). The most remarkable indicator is that the graupel particles in the majority of the thunderstorms have lower ZDR values with a mean value of ∼ 0.3 dB when the first lightning flashes occur; however, this lower ZDR value is not evident in non-thunderstorms, even during the most intense echo stage of cloud development, with a mean value of ∼ 0.5 dB. Moreover, the ZDR values approach 0 dB, corresponding to stronger ZH values when the average intensity of the ZH exceeds 35 dBZ. Thus, we speculated that heavily rimed graupel was present, that the size increased, and that the shape tended to be spherical.
Li et al. (2018) presented a quantitative relationship between the riming and shape of snow aggregates in only winter snowstorms; however, we examined the relationship in deep convection or thunderstorms in the present study. In Li et al. (2018), particles with ZH > 15 dBZ, ZDR > 0.4 dB, and above the ∼ −3 °C isotherm height are likely to be lightly rimed (rime mass fraction ∼ < 0.2), and particles with ZH > 15 dBZ, −0.2 < ZDR < 0.15 dB, and above the ∼ −3 °C isotherm height are likely to be moderately or heavily rimed (rime mass fraction ∼ > 0.4). The rime mass fraction is defined as the ratio of the accreted ice mass to the total ice particle mass; more details on the rime mass fraction can be found in Li et al. (2018). In Fig. 5a–c, the shaded area in blue indicates the high possibility that graupel particles are lightly rimed; in contrast, the shaded area in yellow indicates that the graupel particles are moderately or heavily rimed, as in Li et al. (2018). The results from Li et al. (2018) are limited to only winter snowstorms; the mechanism for producing graupel in winter snowstorms is initiated via the aggregation of ice crystals into snow aggregates, followed by riming of the snow aggregate into graupel and possibly even small hail as the rime density increases (Heymsfield, 1982; Li et al., 2018). This process is different from the coalescence–freezing mechanism in warm-season thunderstorms, but the final shape of the graupel particles when first lightning flashes occurred in this study approached the shape of moderately or heavily rimed ice particles in Li et al. (2018).
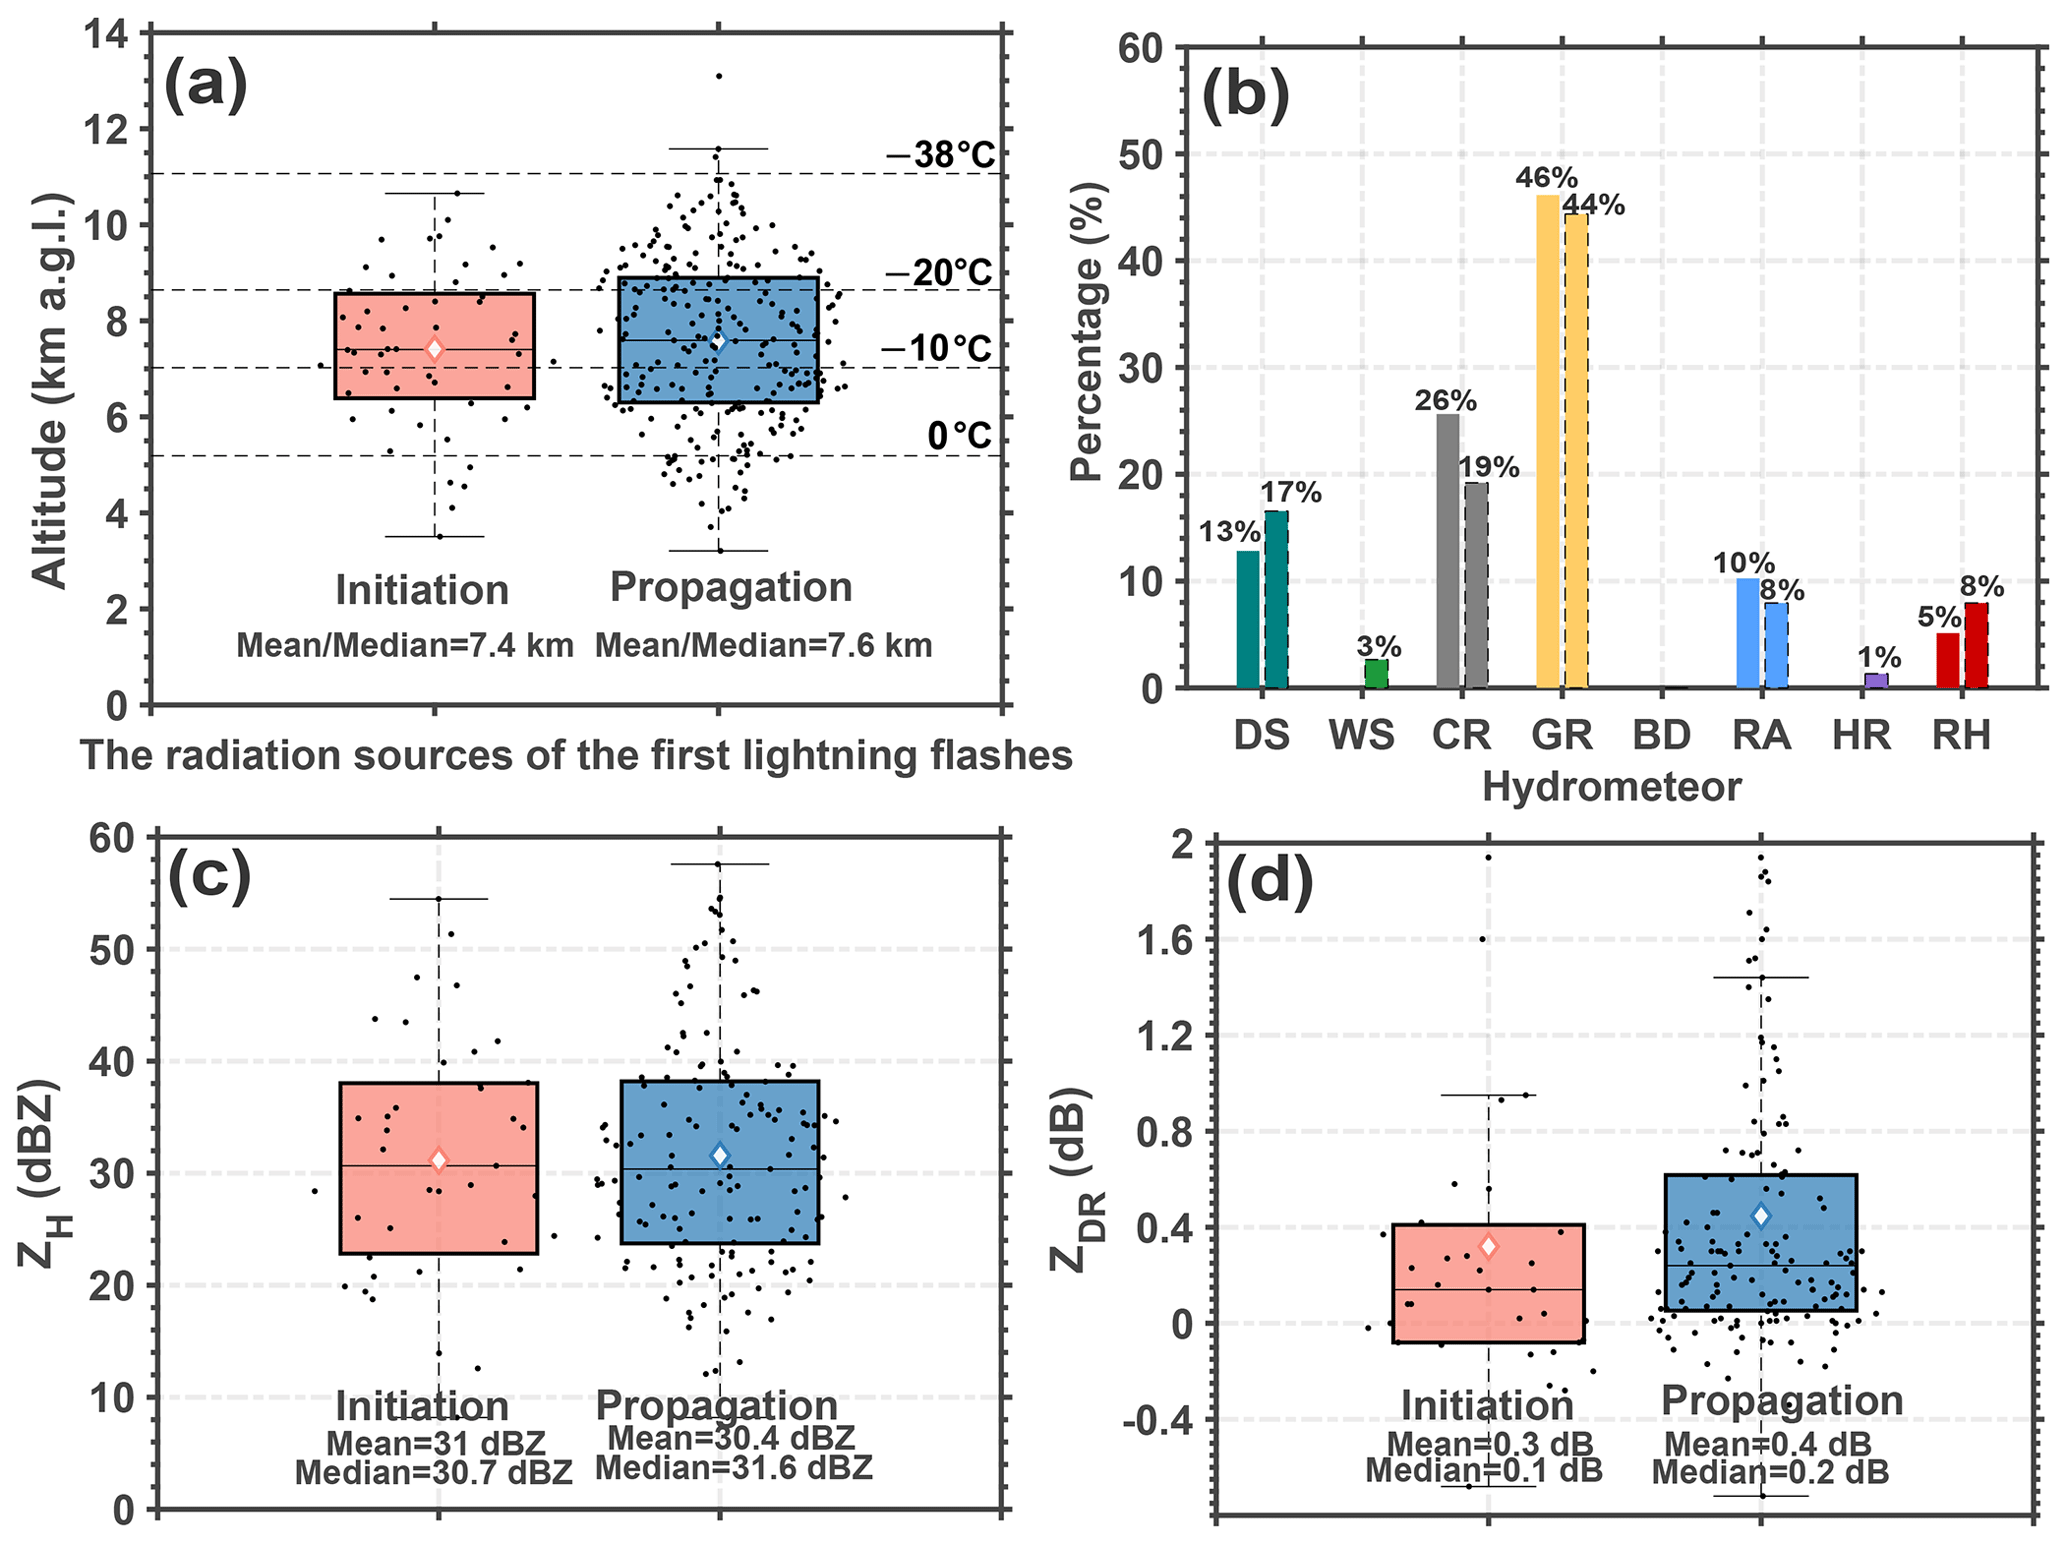
Figure 6The characteristics at positions with source initiation and the channel of the first lightning flash. (a) Height distribution of the locations at the initial sources (orange box) or propagation sources (blue box) of the first lightning flashes. The 0, −10, −20, and −38 °C isotherm heights are displayed. (b) The histogram indicates the percentage of various hydrometeors of the locations at the initial sources or propagation sources (histogram with dashed line) of the first lightning flashes. The numerical value is the percentage of various hydrometeors, such as dry snow (DS; dark green), wet snow (WS; green), crystals (CR; grey), graupel (GR; yellow), big drops (BD), raindrops (RA; blue), heavy rain (HR; purple), and rain and hail mixtures (RH; red). Radar parameters of the locations at the initial sources (orange box) or propagation sources (blue box) of the first lightning flashes include (c) horizontal reflectivity (ZH) and (d) differential reflectivity (ZDR). Each black dot indicates an individual source. The diamonds indicate the mean values.
3.3.2 Observational characteristics associated with the source initiation and channel of the first lightning flash
The characteristics at positions with source initiation and channel characteristics of the first lightning flash are shown in Fig. 6, including the height distribution, associated hydrometeor type, and values of ZH and ZDR. The heights of the initiation sources and propagation sources of the first lightning flashes determined via LFEDA are concentrated at an approximate −10 °C isotherm height (Fig. 6a), which is consistent with the results (i.e. the negative charge layer is located at 6 to 8 km height in thunderstorms over Guangzhou) reported by Liu et al. (2020). The hydrometeor types associated with the initiation and propagation sources are similar, and the majority of these particles are graupel and ice crystals (Fig. 6b), which is understandable on the basis of the NIC electrification mechanism.
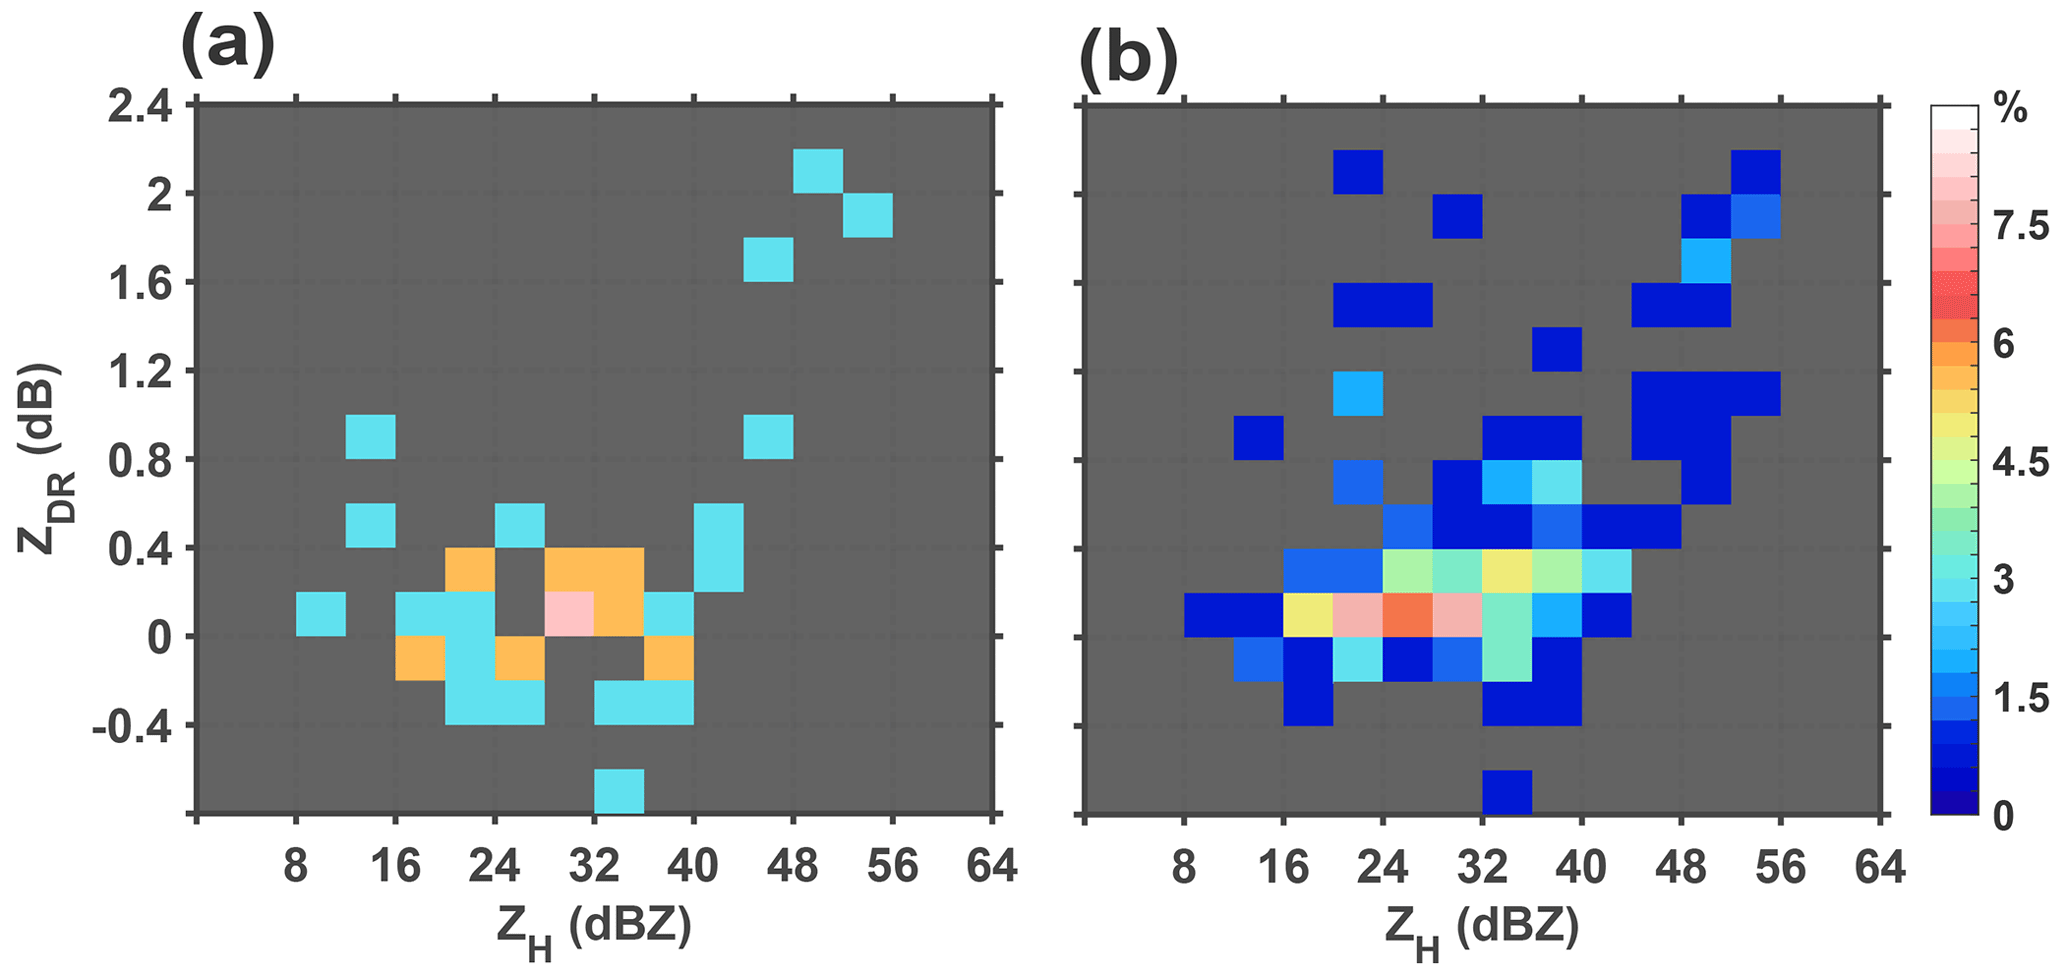
Figure 7The frequency of radiation sources corresponding to the value intervals of ZH and ZDR. (a) Initial sources. (b) Propagation sources.
The median values of ZH are near 31 dBZ, and the ZDR values are near 0 dB (Fig. 6c and d). Furthermore, Fig. 7 displays the frequency of initiation and propagation sources corresponding to value intervals of ZH (4 dBZ) and ZDR (0.2 dB). The results indicate that the initiation sources of the first lightning flashes likely correspond to 20 = 40 dBZ and −0.2 = 0.4 dB (Fig. 7a), and the values are likely 16 = 44 dBZ and −0.2 = 0.8 dB from propagation sources, respectively (Fig. 7b).
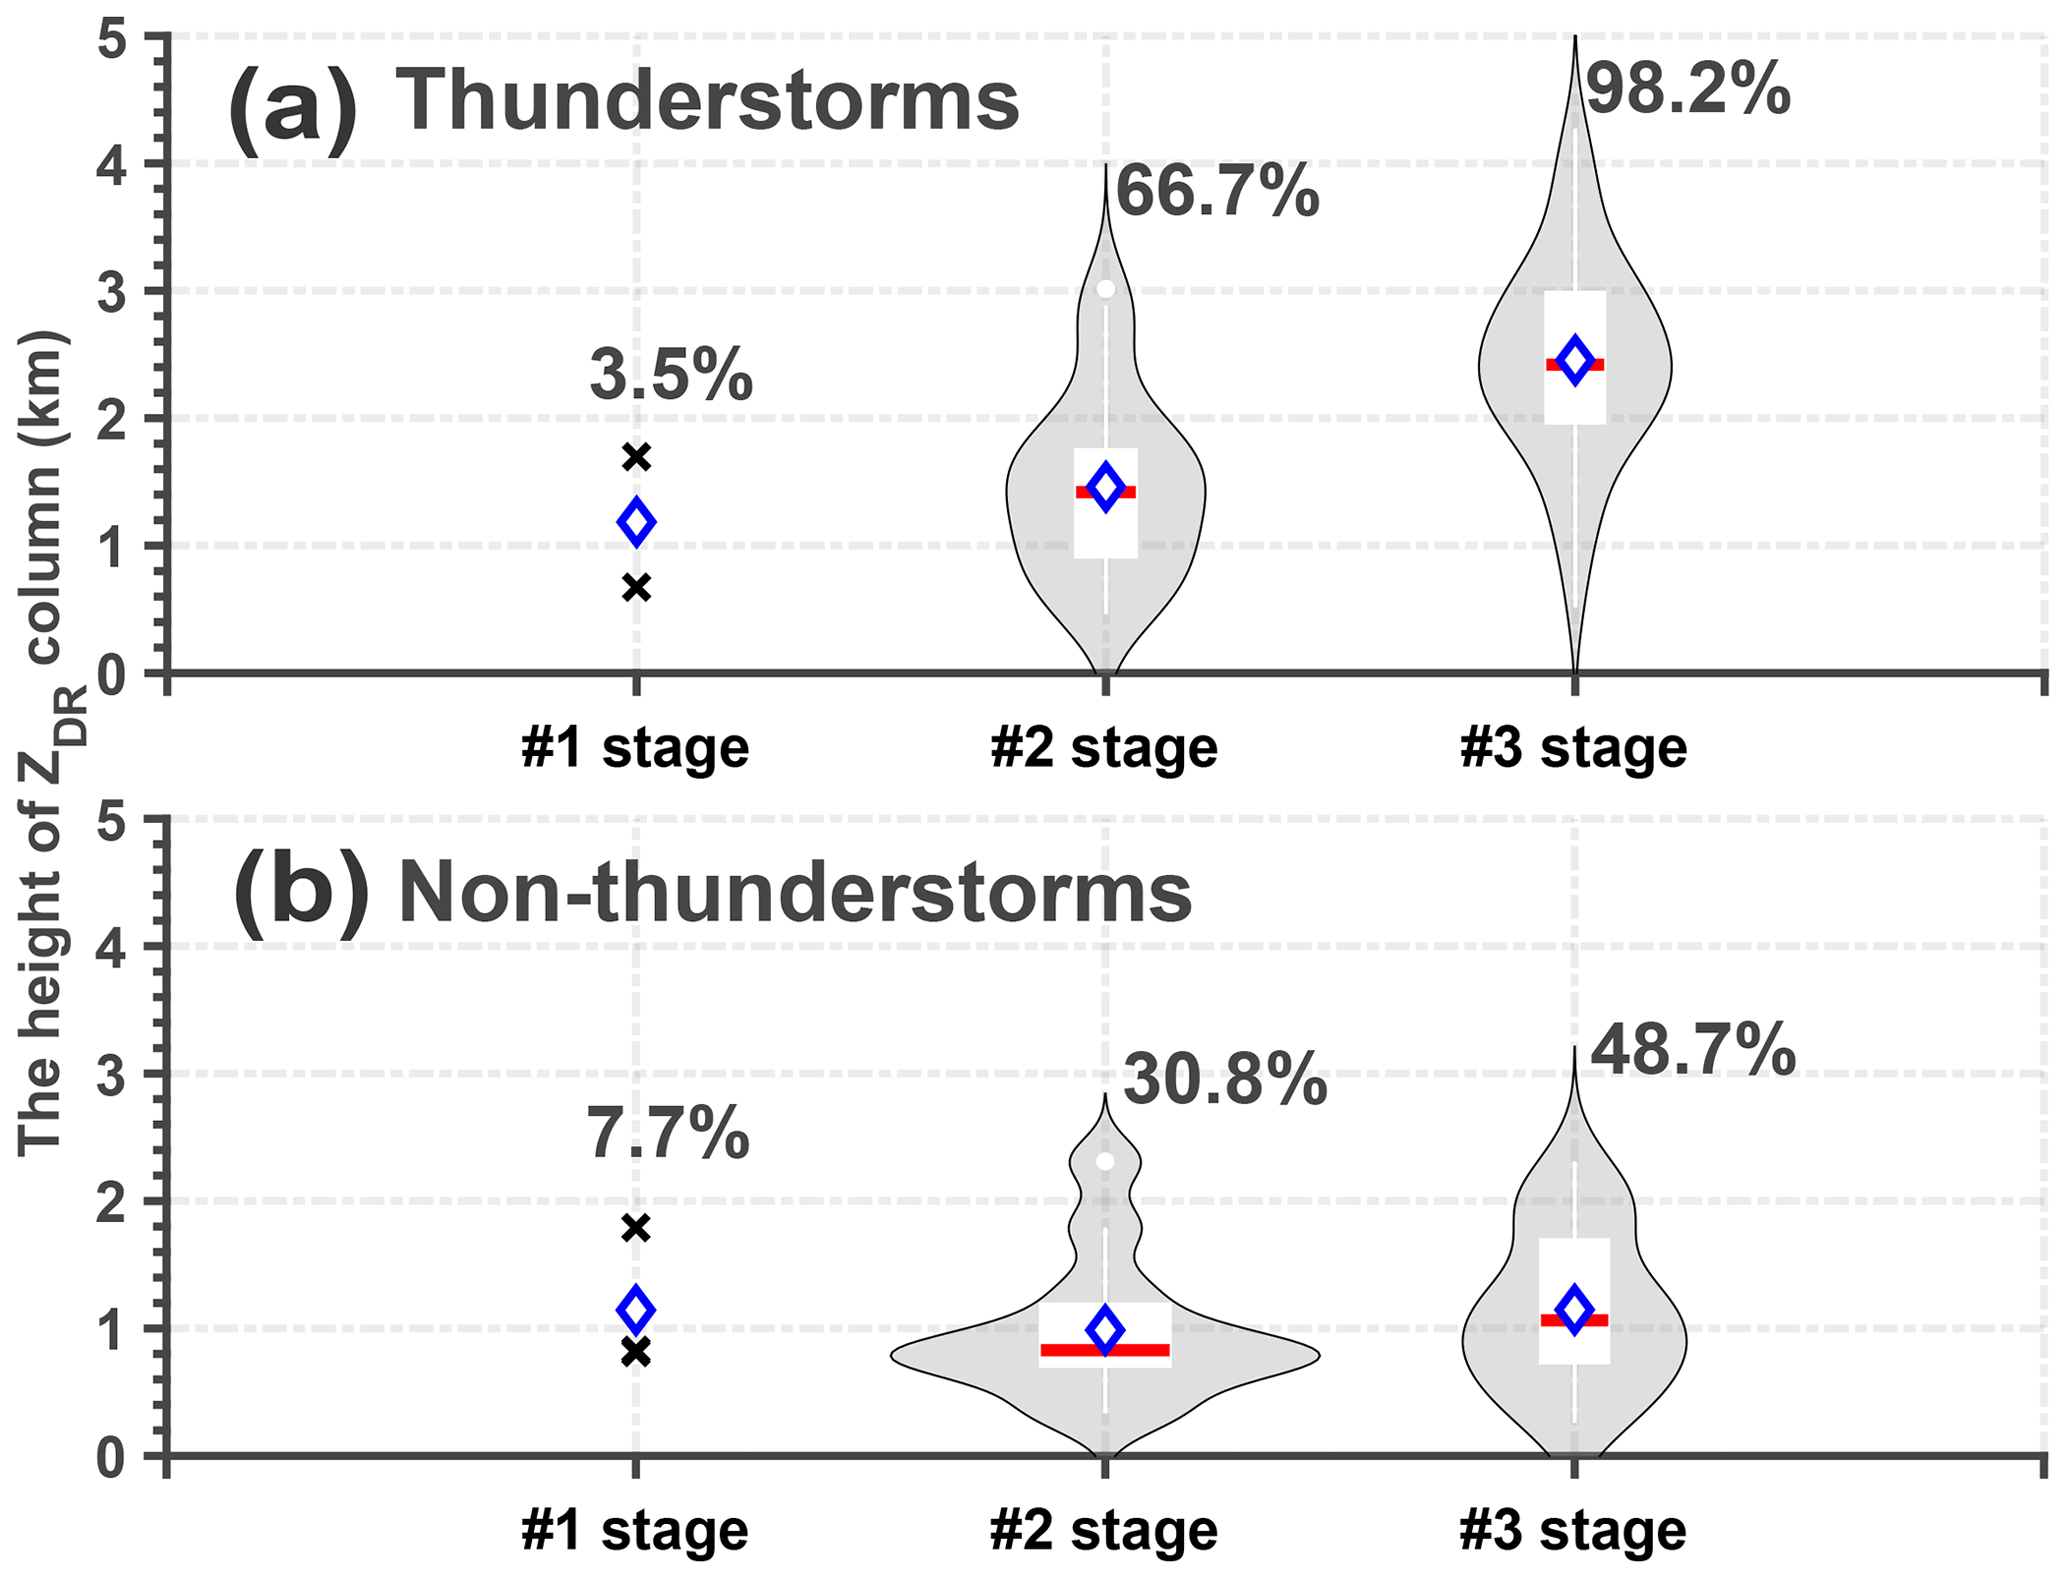
Figure 8ZDR column information in and/or before the first lightning flash occurrence. Violin plots of the ZDR column depth of thunderstorm or non-thunderstorm cells during each stage of cloud development show the average (blue diamond), interquartile range (rectangle), 10th and 90th percentiles (whiskers), and kernel density estimation (grey shading). (a) Thunderstorms. (b) Non-thunderstorms. The numerical value is the percentage of thunderstorms that show the ZDR column signature.
The heights of the initiation sources and propagation sources of the first lightning flashes within isolated thunderstorms over Guangzhou are concentrated at an approximate −10 °C isotherm height, which provides supplementary evidence that the main negative charge layer is located at −10 to −20 °C isotherm height on Earth, as reported by Krehbiel (1986). The values of ZH (ZDR) corresponding to the initiation sources and propagation sources of the first lightning flashes suggest that are differences in particle shape and/or size between initiation sources and propagation sources, although the differences are too subtle to quantify in this study.
3.3.3 Signature of the ZDR column
Previous studies utilized ZDR values ranging from 0.5–5 dB within the strong reflectivity range (35–50 dBZ) above the melting layer to describe the area of the ZDR column (e.g. Illingworth et al., 1987; Tuttle et al., 1989; Ryzhkov et al., 1994; Scharfenberg et al., 2005; Woodard et al., 2012; Kumjian et al., 2014; Snyder et al., 2015; Zhao et al., 2020). Since the development of these clouds in this study occurred during the early stage of the full evolution cycle of thunderstorms, the size of the supercooled liquid water drop would not be large. Thus, we used ZDR values of 0.5 dB within a reflectivity range of 30 dBZ above the melting layer to investigate the characteristics of the ZDR column.
Figure 8 shows the height of the ZDR column within thunderstorms or non-thunderstorms during each stage of cloud development. The computation of the ZDR column height is similar to that in Snyder et al. (2015), and this height is the vertically continuous maximum depth of the ZDR column. The signature of the ZDR column clearly coincides with the development of clouds (Fig. 8). Most thunderstorms (98.2 %) displayed a deep ZDR column with a mean depth of the ZDR column of ∼ 2.5 km when the first lightning flash occurred; however, only 48.7 % of non-thunderstorms corresponded to a shallow ZDR column with a mean value of ∼ 1.1 km (Fig. 8a and b). Moreover, 66.7 % of the thunderstorms presented a deeper ZDR column with a mean value of ∼ 1.5 km during the second stage of cloud development, and 30.8 % of the non-thunderstorms presented a shallower ZDR column with a mean value of ∼ 0.99 km during the second stage of cloud development (Fig. 8a and b).
The results indicate that strong relationship between the ZDR column and the occurrence of the first lightning flash is persistent. A deeper ZDR column suggests a greater graupel volume. However, the occurrence frequency of the ZDR column for non-thunderstorms is slightly greater than that for thunderstorms during the first stage of cloud development (Fig. 8a and b). This phenomenon may be related to the results of Zhao et al. (2022); specifically, the ZDR values below the −10 °C isotherm height of non-thunderstorms were greater than those of thunderstorms within the first radar echo.
In this study, a combination of lightning location systems and dual-polarization radar measurements was employed to study the ice microphysics of isolated thunderstorms and non-thunderstorms in southern China during the warm season. From the unique perspective of comparing radar signatures and inferred graupel information between isolated thunderstorm and non-thunderstorm cells during each stage of cloud development, lightning generation in clouds was found to be a good indicator of the formation of deep-convective clouds. The echo intensities, echo-top heights and echo depths were greater in clouds when the first lightning flash occurred, which indicated more severe updrafts in thunderstorms than in non-thunderstorms. Moreover, a greater graupel volume was clearly observed in clouds when the first lightning flash occurred, and the maximum difference in graupel volume in the height layer between thunderstorms and non-thunderstorms reached approximately 7.6 km3, corresponding to an approximate −10 °C isotherm height.
The variation in the average ZDR intensity corresponding to the graupel particles above the ∼ −3 °C isotherm height during the three stages of cloud development indicated that graupel particles were more spherical (the mean ZDR value was ∼ 0.3 dB) and were more likely to generate lightning. The ZDR values approached 0 dB, corresponding to stronger ZH values; the average intensity of the ZH exceeded 35 dBZ. When the first lightning flashes occurred in clouds, a decrease in the ZDR value and an increase in the ZH value of graupel were observed; these results indicate that heavily rimed ice particles were present and that the shape of these particles was similar to that of moderately or heavily rimed ice particles within winter snowstorms.
Furthermore, observational characteristics associated with the source initiation and channel of the first lightning flash were investigated. The results revealed that these sources were concentrated at an isotherm height of approximately −10 °C and mainly corresponded to graupel and ice crystals. The median values of ZH or ZDR at the positions of source initiation and the channel of the first lightning flashes were nearly 31 dBZ or 0 dB. In addition, we suggest that the differences in particle shape and/or size between the initiation sources and propagation sources of the first lightning flashes persist.
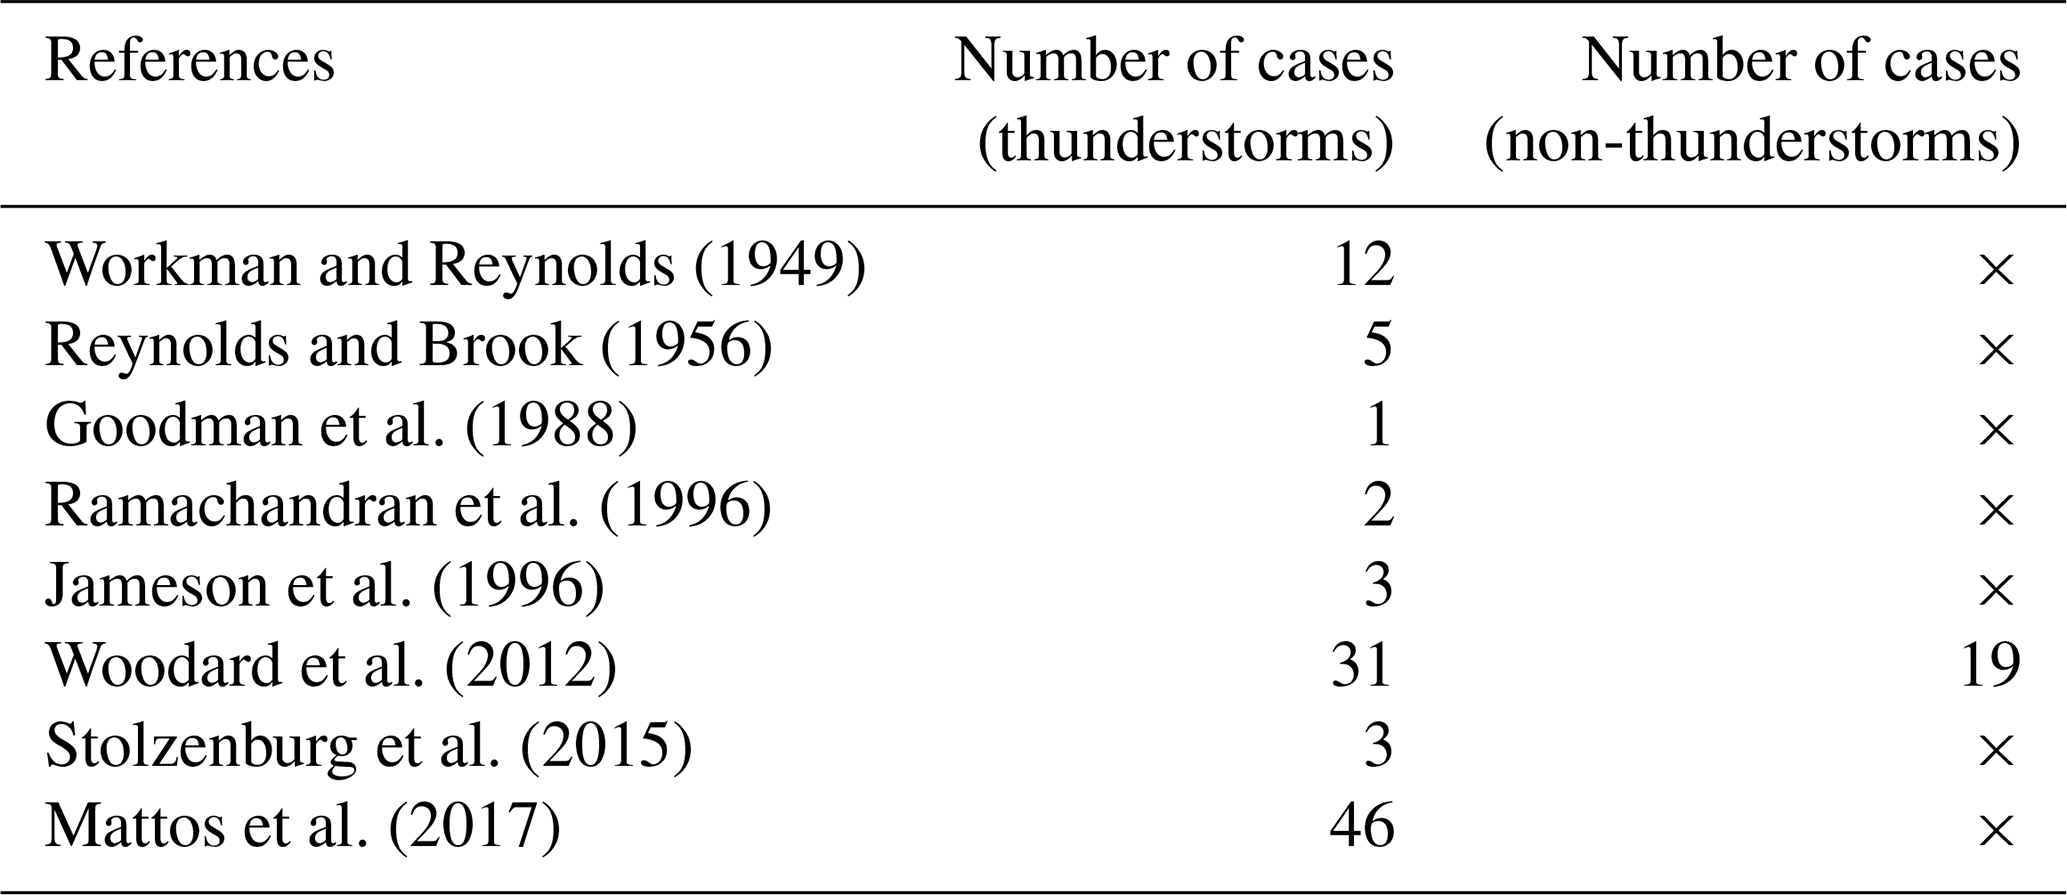
Moreover, the results indicated a strong relationship between the ZDR column and the occurrence of the first lightning flash; 98.2 % of the clouds were equipped with a ZDR column with a mean depth of ∼ 2.5 km when the first lightning flash occurred. In addition, a deeper ZDR column corresponded to a greater graupel volume. Thus, the coalescence–freezing mechanism dominated the formation of graupel within warm-season isolated thunderstorms over southern China, and the results were consistent with those of previous studies (e.g. Braham, 1986; Beard, 1992; Herzegh and Jameson, 1992; Bringi et al., 1997; Smith et al., 1999; Carey and Rutledge, 2000; Stolzenburg et al., 2015; Mattos et al., 2017) but increased the knowledge of the quantified characteristics of the ZDR column for the first lightning flash occurrence in warm-season isolated thunderstorms on the basis of relatively large sample statistics (Table 1 shows details of cases in related investigations for isolated thunderstorms).
However, our results were obtained by comparing the characteristics of the polarimetric parameters according to the graupel particles inferred via a hydrometeor identification method. The inferred graupel volume was an indication that graupel could be present among other hydrometeors in that volume. From the perspective of radar, the dominant particle in this volume was graupel. Fortunately, we focused on comparing the graupel volume between thunderstorms and non-thunderstorms; therefore, we believe that the errors in this volume resulting from other secondary hydrometeors could be neutralized by comparisons with the same detected data and methods.
In addition, unlike previous similar studies (e.g. Mattos et al., 2016, 2017), we studied the microphysical differences between isolated thunderstorms and non-thunderstorms during the warm season over southern China on the basis of polarimetric radar and lightning mapping array instead of studying the evolution variation within the same thunderstorm (Mattos et al., 2017) or studying the differences between storm vertical profiles in three-dimensional Cartesian boxes with lightning and without lightning (Mattos et al., 2016).
Although the results from this study could provide a possible index or method based on polarimetric radar for warning of the first lightning flash occurrence within warm-season cell storms, understanding the microphysical characteristics and applying that in the numerical simulations would be the optimal method for providing lightning flash warnings in the future.
The data in this study can be obtained from Figshare (https://doi.org/10.6084/m9.figshare.22718437.v6, Zhao, 2024).
Conceptualization: CZ and YZ. Data curation: CZ, YZ, DZ, SD, and XL. Formal analysis: CZ, YZ, HL, XP, PZ, JZ, and JS. Funding acquisition: YZ and CZ. Investigation: CZ and YZ. Methodology: CZ, YZ, and HL. Project Administration: YZ. Resources: CZ and YZ. Software: CZ and DZ. Supervision: YZ. Validation: CZ and YZ. Visualization: CZ, YZ, and HL. Writing (original draft): CZ, YZ, XP, and HL.
The contact author has declared that none of the authors has any competing interests.
Publisher's note: Copernicus Publications remains neutral with regard to jurisdictional claims made in the text, published maps, institutional affiliations, or any other geographical representation in this paper. While Copernicus Publications makes every effort to include appropriate place names, the final responsibility lies with the authors.
The authors acknowledge the Guangzhou Institute of Tropical and Marine Meteorology for collecting and archiving the radar, the surface, and the lightning observations. The authors also acknowledge the State Key Laboratory of Severe Weather, the Chinese Academy of Meteorological Sciences, and the Laboratory of Lightning Physics and Protection Engineering for three-dimensional lightning location data.
This research has been supported by the National Natural Science Foundation of China (grant nos. 42175090, 42305079, and 42305087), the China Postdoctoral Science Foundation (grant no. 2023M730619), the Natural Science Foundation of Sichuan Province (grant no. 2024NSFSC0771), the Scientific Research Fund of Chengdu University of Information Technology (grant nos. KYTZ202213, KYQN202301, and KYQN202307), the Scientific Research Fund of the CAMS State Key Laboratory of Severe Weather (grant no. 2021LASW-B02), and the Basic Research Fund of CAMS (grant nos. 451490 and 2023Z008).
This paper was edited by Hinrich Grothe and reviewed by two anonymous referees.
Barthe, C. and Pinty, J.-P.: Simulation of electrified storms with comparison of the charge structure and lightning efficiency, J. Geophys. Res., 112, D19204, https://doi.org/10.1029/2006JD008241, 2007.
Basarab, B. M., Rutledge, S. A., and Fuchs, B. R.: An improved lightning flash rate parameterization developed from Colorado DC3 thunderstorm data for use in cloud-resolving chemical transport models, J. Geophys. Res.-Atmos., 120, 9481–9499, https://doi.org/10.1002/2015JD023470, 2015.
Beard, K. V.: Ice initiation in warm-base convective clouds: An assessment of microphysical mechanisms, Atmos. Res., 28, 125–152, https://doi.org/10.1016/0169-8095(92)90024-5, 1992.
Bechini, R. and Chandrasekar, V.: A Semisupervised Robust Hydrometeor Classification Method for Dual-Polarization Radar Applications, J. Atmos. Ocean. Tech., 32, 22–47, https://doi.org/10.1175/JTECH-D-14-00097.1, 2015.
Braham Jr., R. R.: The cloud physics of weather modification. Part 1: Scientific basis, WMO Bulletin, 35, 215–221, 1986.
Bringi, V. N., Knupp, K., Detwiler, A., Liu, L., Caylor, I. J., and Black, R. A.: Evolution of a Florida Thunderstorm during the Convection and Precipitation/Electrification Experiment: The Case of 9 August 1991, Mon. Weather Rev., 125, 2131–2160, https://doi.org/10.1175/1520-0493(1997)125<2131:EOAFTD>2.0.CO;2,1997.
Brune, W. H., McFarland, P. J., Bruning, E., Waugh, S., MacGorman, D., Miller, D. O., Jenkins, J. M., Ren, X., Mao, J., and Peischl, J.: Extreme oxidant amounts produced by lightning in storm clouds, Science, 372, 711–715, https://doi.org/10.1126/science.abg0492, 2021.
Carey, L. D. and Rutledge, S. A.: The Relationship between precipitation and lightning in tropical island convection: A C-Band polarimetric radar study, Mon. Weather Rev., 128, 2687–2710, https://doi.org/10.1175/1520-0493(2000)128<2687:TRBPAL>2.0.CO;2, 2000.
Chen, G., Zhao, K., Wen, L., Yang, J., Zheng, Y., Xu, F., Lyu, F., Sun, K., and Sun, L.: Linking ice-phase microphysics to raindrop characteristics in deep convection: A warm-sector extreme rainfall case study in Eastern China, Earth Space Sci., 10, e2022EA002697, https://doi.org/10.1029/2022EA002697, 2023.
Chen, L., Zhang, Y. J., Lyu, W., Zheng, D., Zhang, Y., Chen, S., and Huang, Z.: Performance evaluation for a lightning location system based on observations of artificially triggered lightning and natural lightning flashes, J. Atmos. Ocean. Tech., 29, 1835–1844, https://doi.org/10.1175/JTECH-D-12-00028.1, 2012.
Cui, Y., Zheng, D., Zhang, Y. J., Ruan, Z., Li, F., Yao, W., Meng, Q., and Zhao, C.: Association of lightning occurrence with precipitation cloud column structure at a fixed position, Atmos. Res., 267, 105989, https://doi.org/10.1016/j.atmosres.2021.105989, 2022.
Dye, J. E., Jones, J. J., Winn, W. P., Cerni, T. A., Gardiner, B., Lamb, D., Pitter, R. L., Hallett, J., and Saunders, C. P. R.: Early electrification and precipitation development in a small, isolated Montana cumulonimbus, J. Geophys. Res.-Atmos., 91, 1231–1247, https://doi.org/10.1029/JD091iD01p01231, 1986.
Fan, J. W., Rosenfeld, D., Zhang, Y., Giangrande, S. E., Li, Z., Machado, L. A. T., Martin, S. T., Yang, Y., Wang, J., Artaxo, P., Barbosa, H. M. J., Braga, R. C., Comstock, J. M., Feng, Z., Gao, W., Gomes, H. B., Mei, F., Pöhlker, C., Pöhlker, M. L., Pöschl, U., and de Souza, R. A. F.: Substantial convection and precipitation enhancements by ultrafine aerosol particles, Science, 359, 411–418, https://doi.org/10.1126/science.aan8461, 2018.
Fan, X., Zhang, Y. J., Zheng, D., Zhang, Y., Lyu, W., Liu, H., and Xu, L.: A new method of three-dimensional location for low-frequency electric field detection array, J. Geophys. Res.-Atmos., 123, 8792–8812, https://doi.org/10.1029/2017JD028249, 2018.
Goodman, S. J., Buechler, D. E., Wright, P. D., and Rust, W. D.: Lightning and precipitation history of a microburst-producing storm, Geophys. Res. Lett., 15, 1185–1188, https://doi.org/10.1029/GL015i011p01185, 1988.
Hall, M. P. M., Cherry, S. M., Goddard, J. W. F., and Kennedy, G. R.: Rain drop sizes and rainfall rate measured by dual-polarization radar, Nature, 285, 195–198, https://doi.org/10.1038/285195a0, 1980.
Hayashi, S., Umehara, A., Nagumo, N., and Ushio, T.: The relationship between lightning flash rate and ice-related volume derived from dual-polarization radar, Atmos. Res., 248, 105166, https://doi.org/10.1016/j.atmosres.2020.105166, 2021.
Helsdon Jr., J. H., Wojcik, W. A., and Farley, R. D.: An examination of thunderstorm-charging mechanisms using a two-dimensional storm electrification model, J. Geophys. Res.-Atmos., 106, 1165–1192, https://doi.org/10.1029/2000JD900532, 2001.
Herzegh, P. H. and Jameson, A. R.: Observing Precipitation through Dual-Polarization Radar Measurements, B. Am. Meteorol. Soc., 73, 1365–1376, https://doi.org/10.1175/1520-0477(1992)073<1365:OPTDPR>2.0.CO;2, 1992.
Heymsfield, A. J.: A Comparative Study of the Rates of Development of Potential Graupel and Hail Embryos in High Plains Storms, J. Atmos. Sci., 39, 2867–2897, https://doi.org/10.1175/1520-0469(1982)039<2867:ACSOTR>2.0.CO;2, 1982.
Hu, J., Rosenfeld, D., Ryzhkov, A., Zrnic, D., Williams, E., Zhang, P., Snyder, J. C., Zhang, R., and Weitz, R.: Polarimetric radar convective cell tracking reveals large sensitivity of cloud precipitation and electrification properties to CCN, J. Geophys. Res.-Atmos., 124, 12194–12205, https://doi.org/10.1029/2019JD030857, 2019.
Huang, H., Zhao, K., Chan, J. C. L., and Hu, D.: Microphysical Characteristics of Extreme-Rainfall Convection over the Pearl River Delta Region, South China from Polarimetric Radar Data during the Pre-summer Rainy Season, Adv. Atmos. Sci., 40, 874–886, https://doi.org/10.1007/s00376-022-1319-8, 2023.
Illingworth, A. J., Goddard, J. W. F., and Cherry, S. M.: Polarization radar studies of precipitation development in convective storms, Q. J. Roy. Meteorol. Soc., 113, 469–489, https://doi.org/10.1002/qj.49711347604, 1987.
Jameson, A. R., Murphy, M. J., and Krider, E. P.: Multiple-parameter radar observations of isolated Florida thunderstorms during the onset of electrification, J. Appl. Meteorol. Clim., 35, 343–354, https://doi.org/10.1175/1520-0450(1996)035<0343:MPROOI>2.0.CO;2, 1996.
Kouketsu, T., Uyeda, H., Ohigashi, T., Oue, M., Takeuchi, H., Shinoda, T., Tsuboki, K., Kubo, M., and Muramoto, K.: A Hydrometeor Classification Method for X-Band Polarimetric Radar: Construction and Validation Focusing on Solid Hydrometeors under Moist Environments, J. Atmos. Ocean. Tech., 32, 2052–2074, https://doi.org/10.1175/JTECH-D-14-00124.1, 2015.
Krehbiel, P. R.: The electrical structure of thunderstorms, The National Academies Press, Washington, DC, 900 pp., 1986.
Krehbiel, P. R., Brook, M., and McCrory, R. A.: An Analysis of the Charge Structure of Lightning Discharges to Ground, J. Geophys. Res., 84, 2432–2456, https://doi.org/10.1029/JC084iC05p02432, 1979.
Kumjian, M. R.: Principles and applications of dual-polarization weather radar. Part I: Description of the polarimetric radar variables, J. Oper. Meteorol., 1, 226–242, https://doi.org/10.15191/nwajom.2013.0119, 2013.
Kumjian, M. R. and Ryzhkov, A. V.: Polarimetric signatures in supercell thunderstorms, J. Appl. Meteorol. Clim., 47, 1940–1961, https://doi.org/10.1175/2007JAMC1874.1, 2008.
Kumjian, M. R., Khain, A. P., Benmoshe, N., Ilotoviz, E., Ryzhkov, A. V., and Phillips, V. T. J.: The anatomy and physics of ZDR columns: Investigating a polarimetric radar signature with a spectral bin microphysical model, J. Appl. Meteorol. Clim., 53, 1820–1843, https://doi.org/10.1175/JAMC-D-13-0354.1, 2014.
Laksen, H. R. and Stansbury, E. J.: Association of lightning flashes with precipitation cores extending to height 7 km, J. Atmos. Terr. Phys., 36, 1547–1548, https://doi.org/10.1016/0021-9169(74)90232-3, 1974.
Lang, T. J. and Rutledge, S. A.: A Framework for the Statistical Analysis of Large Radar and Lightning Datasets: Results from STEPS 2000, Mon. Weather Rev., 139, 2536–2551, https://doi.org/10.1175/MWR-D-10-05000.1, 2011.
Latham, J.: The electrification of thunderstorms, Q. J. Roy. Meteorol. Soc., 107, 277–298, https://doi.org/10.1002/qj.49710745202, 1981.
Latham, J., Petersen, W. A., Deierling, W., and Christian, H. J.: Field identification of a unique globally dominant mechanism of thunderstorm electrification, Q. J. Roy. Meteorol. Soc., 133, 1453–1457, https://doi.org/10.1002/qj.133, 2007.
Li, H., Moisseev, D., and von Lerber, A.: How does riming affect dual-polarization radar observations and snowflake shape?, J. Geophys. Res.-Atmos., 123, 6070–6081, https://doi.org/10.1029/2017JD028186, 2018.
Liu, Z., Zheng, D., Guo, F., Zhang, Y., Zhang, Y. J., Wu, C., Chen, H., Han, S.: Lightning activity and its associations with cloud structures in a rainstorm dominated by warm precipitation, Atmos. Res., 246, 105120, https://doi.org/10.1016/j.atmosres.2020.105120, 2020.
Lyu, W., Zheng, D., Zhang, Y., Yao, W., Jiang, R., Yuan, S., Liu, D., Lyu, F., Zhu, B., Lu, G., Zhang, Q., Tan, Y., Wang, X., Liu, Y., Chen, S., Chen, L., Li, Q., and Zhang, Y. J.: A Review of Atmospheric Electricity Research in China from 2019 to 2022, Adv. Atmos. Sci., 40, 1457–1484, https://doi.org/10.1007/s00376-023-2280-x, 2023.
MacGorman, D. R. and Rust, W. D.: The electrical nature of storms, Oxford University Press, Oxford, N.Y., 422 pp., 1998.
Mai, C. and Du, Y.: Mesoscale moisture transport in determining the location of daytime convection initiations clustered in time and space over southern China, J. Geophys. Res.-Atmos., 127, e2021JD036098, https://doi.org/10.1029/2021JD036098, 2022.
Mansell, E. R., MacGorman, D. R., Ziegler, C. L., and Straka, J. M.: Charge structure and lightning sensitivity in a simulated multicell thunderstorm, J. Geophys. Res.-Atmos., 110, D12101, https://doi.org/10.1029/2004JD005287, 2005.
Marshall, J. S. and Radhakant, S.: Radar Precipitation Maps as Lightning Indicators, J. Appl. Meteorol. Clim., 17, 206–212, https://doi.org/10.1175/1520-0450(1978)017<0206:RPMALI>2.0.CO;2, 1978.
Mather, G. K., Morrison, B. J., and Morgan, G. M.: A Preliminary Assessment of the Importance of Coalescence in Convective Clouds of the Eastern Transvaal, J. Appl. Meteorol. Clim., 25, 1780–1784, https://doi.org/10.1175/1520-0450(1986)025<1780:APAOTI>2.0.CO;2, 1986.
Mattos, E. V., Machado, L. A. T., Williams, E. R., and Albrecht, R. I.: Polarimetric radar characteristics of storms with and without lightning activity, J. Geophys. Res.-Atmos., 121, 14201–14220, https://doi.org/10.1002/2016JD025142, 2016.
Mattos, E. V., Machado, L. A. T., Williams, E. R., Goodman, S. J., Blakeslee, R. J., and Bailey, J. C.: Electrification life cycle of incipient thunderstorms, J. Geophys. Res.-Atmos., 122, 4670–4697, https://doi.org/10.1002/2016JD025772, 2017.
Park, H. S., Ryzhkov, A. V., Zrnić, D. S., and Kim, K.: The Hydrometeor Classification Algorithm for the Polarimetric WSR-88D: Description and Application to an MCS, Weather Forecast., 24, 730–748, https://doi.org/10.1175/2008WAF2222205.1, 2009.
Pickering, K. E., Bucsela, E., Allen, D., Ring, A., Holzworth, R., and Krotkov, N.: Estimates of lightning NOx production based on OMI NO2 observations over the Gulf of Mexico, J. Geophys. Res.-Atmos., 121, 8668–8691, https://doi.org/10.1002/2015JD024179, 2016.
Qie, X., Yuan, S., Chen, Z., Wang, D., Liu D., Sun, M., Sun, Z., Srivastava, A., Zhang, H., Lu, J., Xiao, H., Bi, Y., Feng, L., Tian, Y., Xu, Y., Jiang, R., Liu, M., Xiao, X., Duan, S., Su, D., Sun, C., Xu, W., Zhang, Y., Lu, G., Zhang, D., Yin, Y., and Yu, Y.: Understanding the dynamical–microphysical–electrical processes associated with severe thunderstorms over the Beijing metropolitan region, Sci. China Earth Sci., 64, 10–26. https://doi.org/10.1007/s11430-020-9656-8, 2021.
Ramachandran, R., Detwiler, A., Helsdon, J., Smith, P. L., and Bringi, V. N.: Precipitation development and electrification in Florida thunderstorm cells during Convection and Precipitation/Electrification Project, J. Geophys. Res.-Atmos., 101, 1599–1619, https://doi.org/10.1029/95JD02931, 1996.
Reynolds, S. E. and Brook, M.: CORRELATION OF THE INITIAL ELECTRIC FIELD AND THE RADAR ECHO IN THUNDERSTORMS, J. Atmos. Sci., 13, 376–380, https://doi.org/10.1175/1520-0469(1956)013<0376:COTIEF>2.0.CO;2, 1956.
Reynolds, S. E., Brook, M., and Gourley, M. F.: Thunderstorm charge separation, J. Atmos. Sci., 14, 426–436, https://doi.org/10.1175/1520-0469(1957)014<0426:TCS>2.0.CO;2, 1957.
Rosenfeld, D.: TRMM observed first direct evidence of smoke from forest fires inhibiting rainfall, Geophys. Res. Lett., 26, 3105–3108, https://doi.org/10.1029/1999GL006066, 1999.
Rosenfeld, D., Lohmann, U., Raga, G. B., O'Dowd, C. D., Kulmala, M., Fuzzi, S., Reissell, A., and Andreae, M. O.: Flood or drought: How do aerosols affect precipitation?, Science, 321, 1309–1313, https://doi.org/10.1126/science.1160606, 2008.
Ryzhkov, A. V., Zhuravlyov, V. B., and Rybakova, N. A.: Preliminary results of X-band polarization radar studies of clouds and precipitation, J. Atmos. Ocean. Tech., 11, 132–139, https://doi.org/10.1175/1520-0426(1994)011<0132:PROXBP>2.0.CO;2, 1994.
Saunders, C.: Charge Separation Mechanisms in Clouds, Space Sci. Rev., 137, 335–353, https://doi.org/10.1007/s11214-008-9345-0, 2008.
Saunders, C. P. R., Keith, W. D., and Mitzeva, R. P.: The effect of liquid water on thunderstorm charging, J. Geophys. Res., 96, 11007–11017, https://doi.org/10.1029/91JD00970, 1991.
Scharfenberg, K. A., Miller, D. J., Schuur, T. J., Schlatter, P. T., Giangrande, S. E., Melnikov, V. M., Burgess, D. W., Andra, D. L., Foster, M. P. Jr., and Krause, J. M.: The Joint Polarization Experiment: Polarimetric Radar in Forecasting and Warning Decision Making, Weather Forecast., 20, 775–788, https://doi.org/10.1175/WAF881.1, 2005.
Seliga, T. A. and Bringi, V. N.: Potential Use of Radar Differential Reflectivity Measurements at Orthogonal Polarizations for Measuring Precipitation, J. Appl. Meteorol. Clim., 15, 69–76, https://doi.org/10.1175/1520-0450(1976)015<0069:PUORDR>2.0.CO;2, 1976.
Shi, D., Zheng, D., Zhang, Y., Zhang, Y. J., Huang, Z., and Lyu, W.: Low-frequency E-field Detection Array (LFEDA)-Construction and preliminary results, Sci. China Earth Sci., 60, 1896–1908, https://doi.org/10.1007/s11430-016-9093-9, 2017.
Smith, P. L., Musil, D. J., Detwiler, A. G., and Ramachandran, R.: Observations of Mixed-Phase Precipitation within a CaPE Thunderstorm, J. Appl. Meteorol. Clim., 38, 145–155, https://doi.org/10.1175/1520-0450(1999)038<0145:OOMPPW>2.0.CO;2, 1999.
Snyder, J. C., Ryzhkov, A. V., Kumjian, M. R., Khain, A. P., and Picca, J. C.: A ZDR column detection algorithm to examine convective storm updrafts, Weather Forecast., 30, 1819–1844, https://doi.org/10.1175/WAF-D-15-0068.1, 2015.
Stolzenburg, M., Marshall, T. C., and Rust, W. D.: Serial sounding of electric field through a mesoscale convective system, J. Geophys. Res.-Atmos., 106, 12371–12380, https://doi.org/10.1029/2001JD900074, 2001.
Stolzenburg, M., Marshall, T. C., and Krehbiel, P. R.: Initial electrification to the first lightning flash in New Mexico thunderstorms, J. Geophys. Res.-Atmos., 120, 11253–11276, https://doi.org/10.1002/2015JD023988, 2015.
Stough, S. M. and Carey, L. D.: Observations of anomalous charge structures in supercell thunderstorms in the Southeastern United States, J. Geophys. Res.-Atmos., 125, e2020JD033012, https://doi.org/10.1029/2020JD033012, 2020.
Stough, S. M., Carey, L. D., Schultz, C. J., and Cecil, D. J.: Examining conditions supporting the development of anomalous charge structures in supercell thunderstorms in the Southeastern United States, J. Geophys. Res.-Atmos., 126, e2021JD034582, https://doi.org/10.1029/2021JD034582, 2021.
Takahashi, T.: Riming electrification as a charge generation mechanism in thunderstorms, J. Atmos. Sci., 35, 1536–1548, https://doi.org/10.1175/1520-0469(1978)035<1536:REAACG>2.0.CO;2, 1978.
Takahashi, T., Tajiri, T., and Sonoi, Y.: Charges on Graupel and Snow Crystals and the Electrical Structure of Winter Thunderstorms, J. Atmos. Sci., 56, 1561–1578, https://doi.org/10.1175/1520-0469(1999)056<1561:COGASC>2.0.CO;2, 1999.
Takahashi, T., Sugimoto, S., Kawano, T., and Suzuki, K.: Riming Electrification in Hokuriku Winter Clouds and Comparison with Laboratory Observations, J. Atmos. Sci., 74, 431–447, https://doi.org/10.1175/JAS-D-16-0154.1, 2017.
Takahashi, T., Sugimoto, S., Kawano, T., and Suzuki, K.: Microphysical structure and lightning initiation in Hokuriku winter clouds, J. Geophys. Res.-Atmos., 124, 13156–13181, https://doi.org/10.1029/2018JD030227, 2019.
Tuttle, J. D., Bringi, V. N., Orville, H. D., and Kopp, F. J.: Multiparameter radar study of a microburst: Comparison with model results, J. Atmos. Sci., 46, 601–620, https://doi.org/10.1175/1520-0469(1989)046<0601:MRSOAM>2.0.CO;2, 1989.
Uman, M. A. and Krider, E. P.: Natural and artificially initiated lightning, Science, 246, 457–464, https://doi.org/10.1126/science.246.4929.457, 1989.
Vincent, B. R., Carey, L. D., Schneider, D., Keeter, K., and Gonski, R.: Using WSR-88D reflectivity data for the prediction of cloud-to-ground lightning: A central North Carolina study, National Weather Digest, 27, 35–44, 2003.
Woodard, C. J., Carey, L. D., Petersen, W. A., and Roeder, W. P.: Operational utility of dual-polarization variables in lightning initiation forecasting, Electronic J. Operational Meteor., 13, 79–102, 2012.
Workman, E. J. and Reynolds, S. E.: Electrical activity as related to thunderstorm cell growth, B. Am. Meteorol. Soc., 30, 142–149, https://doi.org/10.1175/1520-0477-30.4.142, 1949.
Wu, C., Liu, L., Wei, M., Xi, B., and Yu, M.: Statistics-based optimization of the polarimetric radar hydrometeor classification algorithm and its application for a squall line in South China, Adva. Atmos. Sci., 35, 296–316, https://doi.org/10.1007/s00376-017-6241-0, 2018.
Zhang, Y., Lyu, W., Chen, S., Zheng, D., Zhang, Y., Yan, X., Chen, L., Dong, W., Dan, J., and Pan, H.: A review of advances in lightning observations during the past decade in Guangdong, China, J. Meteorol. Res.-PRC, 30, 800–819, https://doi.org/10.1007/s13351-016-6928-7, 2016.
Zhang, Y. J., Sun, A., Yan, M., Guo, F., Qie, X., and Huang, M.: Numerical Simulations of the Effects of Electric Environment on Hail Growth, Chinese J. Geophys., 47, 29–37, https://doi.org/10.1002/cjg2.451, 2004.
Zhang, Y. J., Yan, M., Sun, A., and Guo, F.: Thunderstorm electricity, China Meteorological Press, Beijing, 384 pp., 2009.
Zhao, C.: Data for “On the ice microphysics of isolated thunderstorms and non-thunderstorms in southern China: A radar polarimetric perspective”, Figshare [data set], https://doi.org/10.6084/m9.figshare.22718437.v6, 2024.
Zhao, C., Zhang, Y. J., Zheng, D., Zhou, Y., Xiao, H., and Zhang, X.: An improved hydrometeor identification method for X-band dual-polarization radar and its application for one summer Hailstorm over Northern China, Atmos. Res., 245, 105075, https://doi.org/10.1016/j.atmosres.2020.105075, 2020.
Zhao, C., Zheng, D., Zhang, Y. J., Liu, X., Zhang, Y., Yao, W., and Zhang, W.: Turbulence Characteristics before the Occurrence of the First Flash in Thunderstorms and Non-Thunderstorms, Geophys. Res. Lett., 48, e2021GL094821, https://doi.org/10.1029/2021GL094821, 2021a.
Zhao, C., Zheng, D., Zhang, Y. J., Liu, X., Zhang, Y., Yao, W., and Zhang, W.: Characteristics of cloud microphysics at positions with flash initiations and channels in convection and stratiform areas of two squall lines, J. Trop. Meteorol., 37, 358–369, https://doi.org/10.16032/j.issn.1004-4965.2021.035, 2021b.
Zhao, C., Zhang, Y. J., Zheng, D., Liu, X., Zhang, Y., Fan, X., Yao, W., and Zhang, W.: Using polarimetric radar observations to characterize first echoes of thunderstorms and nonthunderstorms: A comparative study, J. Geophys. Res.-Atmos., 127, e2022JD036671, https://doi.org/10.1029/2022JD036671, 2022.
Zipser, E. J., Cecil, D. J., Liu, C., Nesbitt, S. W., and Yorty, D. P.: WHERE ARE THE MOST INTENSE THUNDERSTORMS ON EARTH? B. Am. Meteorol. Soc., 87, 1057–1072, https://doi.org/10.1175/BAMS-87-8-1057, 2006.
Zrnic, D. S. and Ryzhkov, A. V.: Polarimetry for Weather Surveillance Radars, B. Am. Meteorol. Soc., 80, 389–406, https://doi.org/10.1175/1520-0477(1999)080<0389:PFWSR>2.0.CO;2, 1999.