the Creative Commons Attribution 4.0 License.
the Creative Commons Attribution 4.0 License.
 | 17 Oct 2024
Measurement report: Sources, sinks, and lifetime of NOx in a suburban temperate forest at night
Simone T. Andersen
Max R. McGillen
Chaoyang Xue
Tobias Seubert
Patrick Dewald
Gunther N. T. E. Türk
Jan Schuladen
Cyrielle Denjean
Jean-Claude Etienne
Olivier Garrouste
Marina Jamar
Sergio Harb
Manuela Cirtog
Vincent Michoud
Mathieu Cazaunau
Antonin Bergé
Christopher Cantrell
Sebastien Dusanter
Bénédicte Picquet-Varrault
Alexandre Kukui
Abdelwahid Mellouki
Lucy J. Carpenter
Jos Lelieveld
The budget of reactive nitrogen species, which play a central role in atmospheric chemistry (e.g. in photochemical O3 production), is poorly understood in forested regions. In this study, through observations of NO, NO2, NOy, and O3 in the Rambouillet Forest near Paris, France, we have examined nighttime processes controlling NOx in an anthropogenically impacted forest environment. The O3 mixing ratios displayed a strong diel profile at the site that was driven by a variable but generally rapid deposition to soil and foliar surfaces. The O3 diel profile was strongly influenced by relative humidity and temperature inversion. Only when the O3 mixing ratio was sufficiently low (and thus the NO lifetime sufficiently long) were sustained NO peaks observed above the instrumental detection limit, enabling the derivation of average NO emission rates of ∼1.4 ppbv h−1 from the soil. Observations of the lack of increase in NO2 at night, despite a significant production rate from the reaction of NO with O3, enabled an effective lifetime of NO2 of ∼0.5–3 h to be derived. As the loss of NO2 was not compensated for by the formation of gas- or particle-phase reactive nitrogen species, it was presumably either driven by deposition to soil and foliar surfaces or any products formed were themselves short-lived with respect to deposition. By comparison, the daytime lifetime of NO2 with respect to loss by reaction with OH is about 1 d. Our results indicate that the nighttime deposition of NO2 is a major sink of boundary layer NOx in this temperate forest environment.
- Article
(2040 KB) - Full-text XML
-
Supplement
(2284 KB) - BibTeX
- EndNote


Nitrogen oxides () are pollutant trace gases that play a key role in the atmosphere by producing or destroying tropospheric ozone (O3), which can cause respiratory illness (Ciencewicki and Jaspers, 2007) and damage to plants (Emberson et al., 2018). Photolysis of nitrogen dioxide (NO2) (Reaction R1) is the primary source of tropospheric ozone (O3), and the nitric oxide (NO) product is oxidized back to NO2 by either (1) O3 (Reaction R2) or (2) organic peroxy radicals (RO2, under formation of alkoxy radicals (RO)) or hydroperoxyl radicals (HO2) (Reactions R3 and R4) (Lightfoot et al., 1992). The latter results in the formation of the hydroxyl radical (OH); thus, Reactions (R3) and (R4) represent routes to recycle the most important atmospheric radical initiator of oxidation (Hens et al., 2014). It is, therefore, essential to understand the sources and sinks of NOx in the atmosphere.
The dominant global sources of NOx are anthropogenic in the form of the combustion of fossil fuels and, to a lesser degree, biomass burning and agricultural soils. The natural sources, which include lightning (Schumann and Huntrieser, 2007), wildfires (Val Martin et al., 2008), and unperturbed soil emissions from microbial activities (Davidson and Kingerlee, 1997), are important in regions remote from anthropogenic sources. NO2 and NO both react with peroxy radicals in the atmosphere to produce organic nitrates (Reactions R5 and R6), including peroxy nitrates (RO2NO2) and alkyl nitrates (RONO2), which are important precursors for the formation of secondary organic aerosols (SOAs) (Hallquist et al., 2009; Kanakidou et al., 2005; Kiendler-Scharr et al., 2016). NO2 also reacts with OH radicals, O3, and nitrate radicals (NO3), to form nitric acid (HNO3) (Reaction R7); NO3 radicals (Reaction R8); and dinitrogen pentoxide (N2O5) (Reaction R9), respectively. N2O5 is in thermal equilibrium with NO2, and NO3 and can interact with aqueous aerosol or moist surfaces to form HNO3 (Reaction R10) (Kane et al., 2001) or nitryl chloride (ClNO2) (Phillips et al., 2013, 2012). Organic nitrates, SOAs, and HNO3 are all removed from the boundary layer through dry and wet deposition, which also, in turn, removes NOx from the atmosphere.
In the planetary boundary layer, NO2 is also lost through dry deposition to surfaces, such as soil and leaves. Deposition takes places during both nighttime and daytime, but it is expected to be more efficient during daytime due to increased mixing through turbulence. When NO2 deposits onto humid surfaces, it can lead to the production of nitrous acid (HONO), which can be released to the atmosphere (Meusel et al., 2016; Elshorbany et al., 2012). NO2 uptake on leaves takes place through stomatal and non-stomatal processes, which have been reported to depend on multiple factors, such as the stomatal aperture and relative humidity. Stomatal uptake primarily occurs during daytime, when the stomata are open, leading to increased NO2 loss compared with nighttime, when the stomata are not fully open (Delaria et al., 2020, 2018; Chaparro-Suarez et al., 2011). Non-stomatal uptake occurs through the cuticles, although the importance of cuticular uptake has been reported to be small compared with the stomatal uptake (Delaria and Cohen, 2020; Delaria et al., 2020). NO2 uptake by leaves is reported to be enhanced in the presence of water films, which may exist when the relative humidity is >70 % (Thoene et al., 1996; Weber and Rennenberg, 1996; Burkhardt and Eiden, 1994). There is, however, no consensus on this process, as other studies have not observed this effect (Gessler et al., 2000). Most recent work shows that the interactions with foliar surfaces are unidirectional, i.e. emissions are negligible (Delaria et al., 2020).
At nighttime, NO2 photolysis ceases; as a consequence, in the absence of combustion sources, the main sources of NO are emissions from soils (Jaeglé et al., 2005). As NO is oxidized efficiently by O3 at night, its concentration will be highest at the surface and will decrease with altitude. The vertical profile of O3 is the opposite, owing to its physical loss due to deposition near the surface and through chemical reaction with NO and/or alkenes combined with entrainment from the nocturnal residual layer. As NO2 is produced from the reaction between NO and O3, its vertical gradient is expected to be weaker than those of NO and O3 (Geyer and Stutz, 2004; Stutz et al., 2004).
In this study, we use measurements from the ACROSS (Atmospheric ChemistRy Of the Suburban foreSt) campaign to investigate the nighttime sources and sinks of NOx in a temperate forest. O3 measurements are used to explain the observed NO features, and measurements of NO2 and total gas-phase nitrogen species (NOy) and particulate nitrate are used to investigate the lifetime and fate of NOx in the forest environment.
The ACROSS campaign (13 June 2022 to 25 July 2022) was conducted in multiple locations in and around Paris, France (Cantrell and Michoud, 2022). Here, we present measurements from the Rambouillet Forest supersite located approximately 50 km southwest of Paris (48.687° N, 1.704° E). The forest consists of approximately 70 % oak, 20 % pine, and small fractions of beech and chestnut. The top of the forest canopy around the supersite is around 20–25 m. In this work, several instrumented containers were placed in a clearing (∼697 m2) along with a 41 m measurement tower. Most of the instruments used in this study were located in two different containers (MPIC and Orléans). The sampling inlets of the two containers were approximately 17 m apart, and the tower was approximately 9 m from the MPIC container and 16 m from the Orléans container. The soil measurements were carried out at the bottom of the tower, approximately 13 m from the MPIC container and approximately 17 m from the Orléans container. All of the instruments used in this study are described briefly below.
2.1 Measurements
2.1.1 Ground measurements
NO2 was measured using two different cavity ring-down spectroscopy (CRDS) instruments with co-located inlets sampling from a high-volume-flow stainless-steel tube (10 m3 min−1; 15 cm diameter and 0.2 s residence time) that took air from a height of 5.4 m above the ground. One of the instruments (5CH-CRDS) consists of three cavities, operated at 408 nm, to measure NO2 and, via their thermal dissociation to NO2, total peroxy nitrates (∑PNs, 448 K) and total alkyl nitrates (∑ANs, 648 K). Two additional cavities, operated at 662 nm, measured NO3 and (via thermal dissociation to NO3 at 373 K) N2O5 (Sobanski et al., 2016). During this campaign, the NO2 cavity had a limit of detection (LOD) of 9.7 pptv (parts per trillion by volume) for a 1 min averaging time (3σ). The second instrument (k-NO3) primarily measured the NO3 reactivity, but it also had a cavity operated at 405 nm for the measurement of NO2 (Liebmann et al., 2018).
Another CRDS instrument was used to measure NOx, NOy, and particulate nitrate (pNO3) from co-located inlets near the high-volume-flow stainless-steel tube. NOx was measured by adding O3 to the ambient sample, thereby oxidizing NO to NO2, the latter of which was measured with CRDS at 405 nm (Friedrich et al., 2020). A judicious choice of O3 and reaction time ensured that minimal (<1 %) NO2 was oxidized to NO3. At times with low (or zero) NO, NOx concentrations were in close agreement with both NO2 measurements. NOy was measured by passing ambient air through a quartz inlet at ∼900 K; this quantitatively converts reactive nitrogen trace gases to NO or NO2. Exceptions are N2O, HCN, and NH3, which are not detected. At this location, NOy is expected to mainly consist of .
Particulate nitrates (both organic and inorganic) were separately measured (as NOy) after denuding gas-phase reactive nitrogen species (Friedrich et al., 2020). To achieve this, problems involving the ineffective trapping of gas-phase NOx by the denuder were eliminated, as will be described in a forthcoming technical paper.
O3 was measured from the high-volume-flow stainless-steel tube with a commercial instrument (Model 205, 2B Technologies) using UV absorption at 254 nm. The LOD is 2 ppbv for a 10 s averaging time.
A spectral radiometer (METCON GmbH) was installed near the co-located inlets on top of the MPIC container to measure actinic fluxes, which were used to calculate photolysis frequencies, as described elsewhere (Meusel et al., 2016).
NO was measured from the Orléans container using a commercial chemiluminescence instrument (CLD 780 TR, Eco Physics; hereafter CLD) with a LOD of 10 pptv for a 1 min averaging time. The sampling height for NO measurements was about 0.6 and 3.2 m above the container top and the ground surface, respectively. The NO measurements required correction due to a change in the CLD sensitivity during the campaign caused by an interruption in the instrument's oxygen supply. The corrections and the corrective procedure are described in the Supplement.
HONO was measured by a commercial long-path absorption photometer (LOPAP-03, QUMA GmbH) with a sampling height of 2.0 m above ground level. Details about the LOPAP instrument can be found elsewhere (Heland et al., 2001; Kleffmann et al., 2006). During the campaign, the LOPAP was calibrated by diluted nitrite when any supporting solutions were changed. Zero calibration by measuring synthetic air was conducted two to three times per day. The detection limit was <5 pptv.
The sum of peroxy radicals () was measured by their conversion to H2SO4 in the presence of NO and SO2 and detection of the generated H2SO4 using chemical ionization mass spectrometry (Kukui et al., 2008). The calibration coefficient is determined using N2O actinometry and both OH and RO2 generation in a turbulent-flow reactor by photolysis of N2O or H2O at 184.9 nm. The calibration of HO2, CH3O2, and other RO2 species is performed by adding CO, CH4, or other RO2 precursors into the calibration reactor and converting OH to RO2. The overall estimated calibration accuracy (2σ) for XO2 is about 30 %, although the uncertainty of the XO2 measurements is typically higher due to uncertainty in the ambient-air XO2 composition. The lower limit of detection for XO2 radicals at a signal-to-noise ratio of 3 and a 4 min integration time is 2×10⁶ .
Time series of the most relevant measurements can be found in Figs. S1 and S2 in the Supplement. Due to missing total NOx and NOy measurements prior to 25 June and missing NO measurements after 18 July, the data analysis is focused on the time period in between these dates.
2.1.2 Tower measurements
Measurements at 41 m were conducted with instruments located on the tower as well as through a manifold with an inlet at the top of the tower. The manifold was built from BORODRAIN glass tubing (4.9 cm inner diameter) with a residence time in the manifold of 2.1 s. NO2 was measured using a cavity attenuated phase shift (CAPS) instrument on the tower with a LOD of 40 pptv; this instrument was zeroed every 1–2 h. NO and O3 were both measured from the manifold using a chemiluminescence instrument with a LOD of 30 pptv and a HORIBA (APOA370) with a LOD of 2.5 ppbv, respectively. The NO measurements were corrected for losses due to the reaction of NO with O3 in the manifold and the sampling line (total of 5.5 s), with corrections ranging from 1 % to 28 %. Time series of all three measurements are plotted in Fig. S3 in the Supplement.
2.1.3 Meteorology and soil measurements
Ambient temperature was measured at four different heights on the tower – 5, 13, 21, and 41 m – using temperature sensors from ATEXIS (PT1000) and Thermo Est (PT100). Relative humidity was measured at 5 m using a Vaisala humidity sensor (HMP45A). Soil temperature and moisture were measured at 5, 10, and 30 cm below the surface using probes from Thermo Est (PT100) and Delta-T Devices (ThetaProbe ML2X), respectively. Wind speed and direction were measured at 41 m using a wind monitor from Young Company. Time series of all of the meteorological and soil measurements are shown in Figs. S4 and S5 in the Supplement.
2.2 HYSPLIT
To identify different air masses, 48 h back trajectories were simulated every hour at a terminating height of 40 m using the Hybrid Single-Particle Lagrangian Integrated Trajectory (HYSPLIT) model (version 4, 2019; Draxler and Rolph, 2011). The back trajectories were modelled using meteorological data from the Global Data Assimilation System (GDAS) at a resolution of 1°. This led to the separation of the data into two periods, 25 June to 2 July and 3 July to 18 July, which are plotted in Fig. 1. The first phase was dominated by clean air from over the Atlantic Ocean (hereafter referred to as “Atlantic”). Back trajectories indicated that the vast majority of the air masses were transported within the boundary layer prior to reaching the site and, thus, may have a reasonably fresh “marine influence”. The second phase was dominated by air that had passed over urban locations, including Paris, Brussels, and the Ruhr area, within the prior 48 h (hereafter referred to as “Continental”).
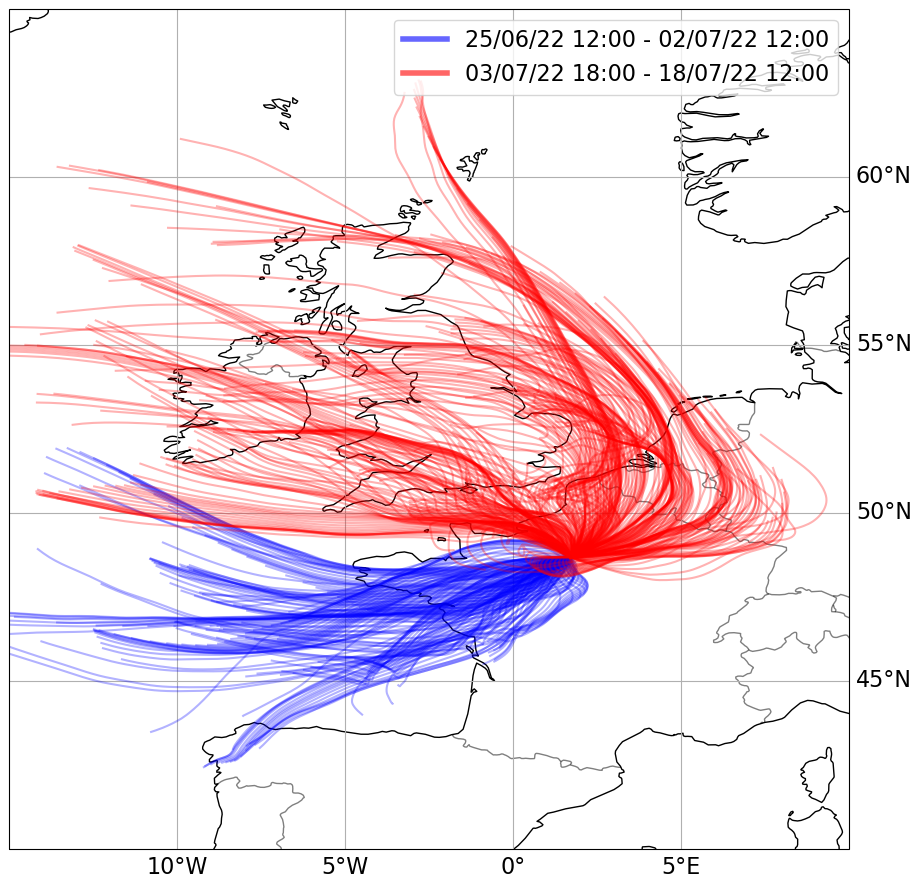
Figure 1The 48 h back trajectories from the Rambouillet Forest supersite using the Hybrid Single-Particle Lagrangian Integrated Trajectory (HYSPLIT) model (version 4, 2019).
Two 24 h periods of temperature (at four different heights), NO, O3, relative humidity (RH), NO2, and the NO2 photolysis rate constant (JNO2) are plotted in Fig. 2. The left column shows the 24 h period with Atlantic air, whereas the right column shows the 24 h with Continental air. Immediately apparent in these datasets (and in Fig. S1) is the large diel cycle in the O3 mixing ratios, with net daytime production resulting in mid-afternoon mixing ratios of between ∼30 and 90 ppbv. In contrast, very low O3 mixing ratios (often approaching zero) were observed at nighttime.
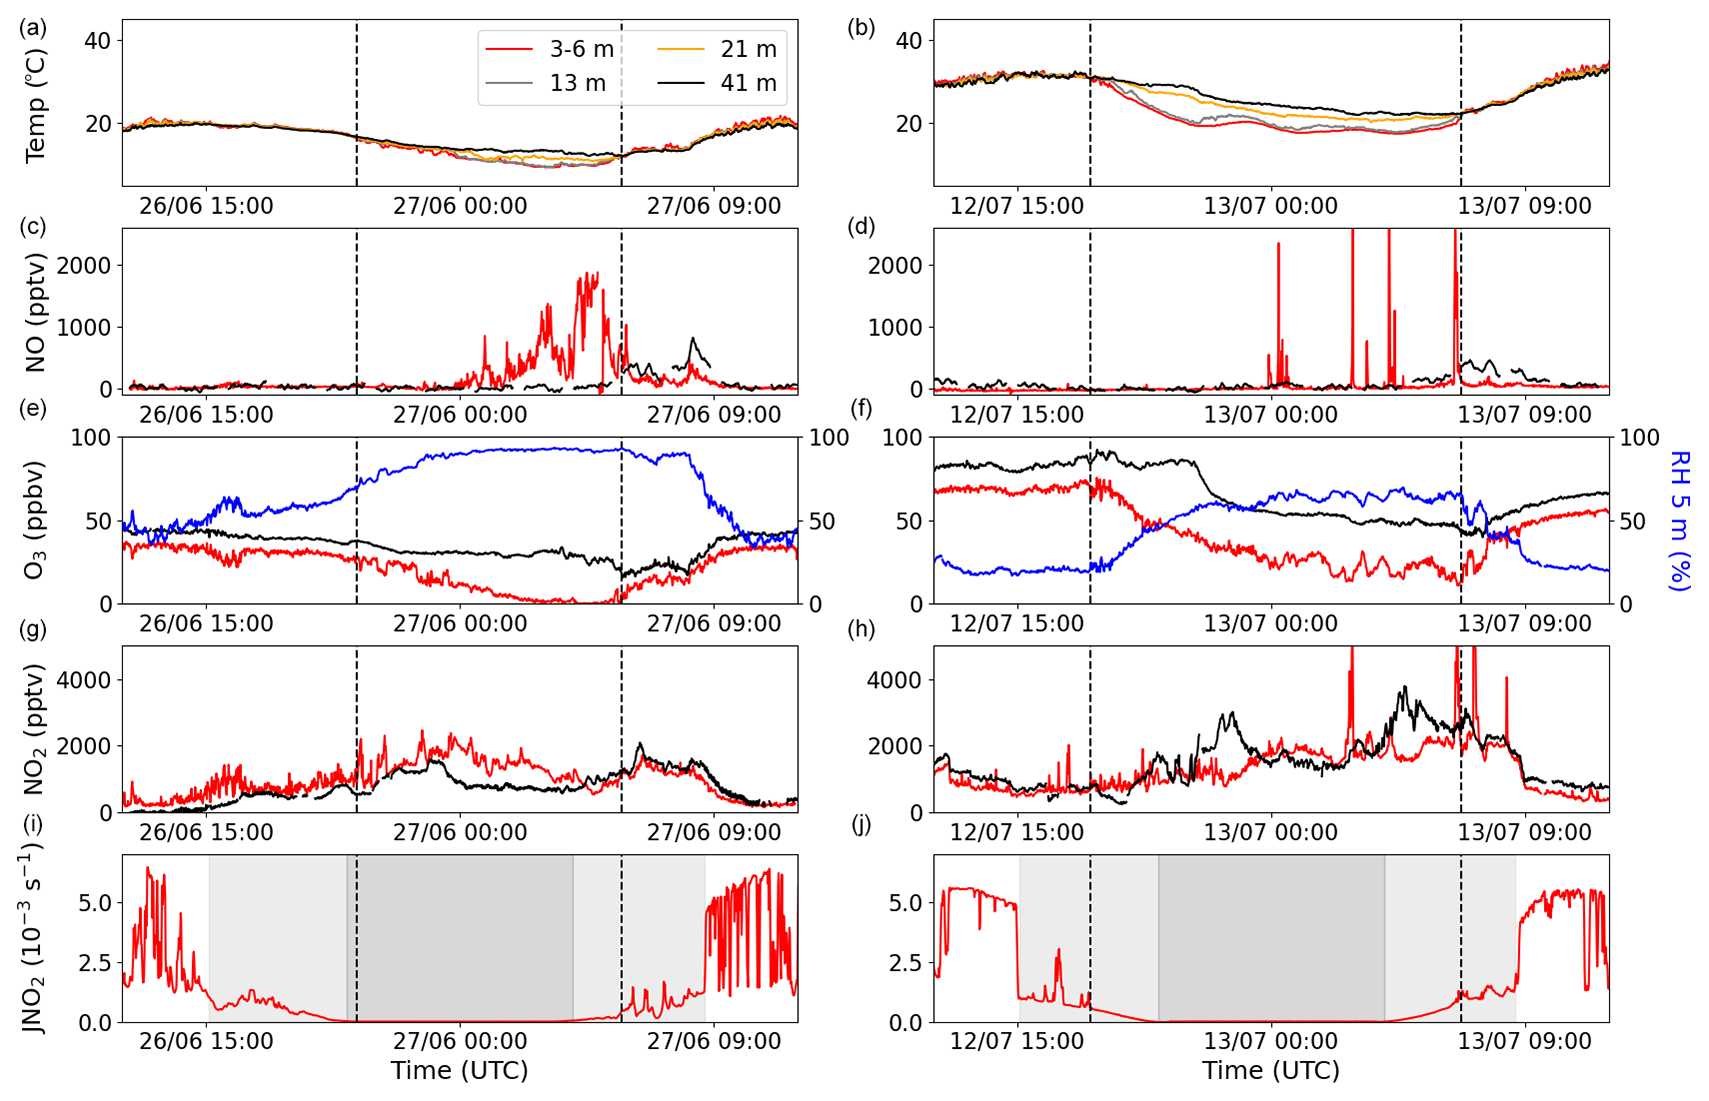
Figure 2Measurements of temperature, NO, O3, RH, NO2, and JNO2 for two different nights during the campaign: one during the Atlantic phase (a, c, e, g, i) and one during the Continental phase (b, d, f, h, j). The four different colours in the legend symbolize four different heights: red represents 3–6 m, grey represents 13 m, orange represents 21 m, and black represents 41 m. Blue shows the RH at 5 m. The grey shaded areas in the JNO2 plots show the time during which the MPIC container was in the shade in the afternoon and morning (light grey) and nighttime (dark grey). The vertical dashed black lines indicate the beginning and end of the observed temperature inversions in panels (a) and (b).
In Fig. 2i and j (JNO2 measurements), nighttime is shown in dark grey, while the two light-grey areas represent the time before sunset (about 5 h) and after sunrise (about 4.5 h) when very little direct sunlight reaches the ground at the site due to shading by the trees. This leaves about 6.5 h centred around midday when direct sunlight reaches the ground. The shading results in radiative cooling of the ground in the late afternoon, and associated temperature inversions begin to form prior to sunset, as can be observed in the right column of Fig. 2 and in more detail in Fig. S6 in the Supplement. The temperature inversions begin at approximately the same time as the ground temperature at 5 cm below the surface starts to decrease (see Fig. S6). These conditions of insolation were relatively consistent throughout the campaign.
Clear temperature inversions were observed for both of the nights shown in Fig. 2, the beginning and end of which are indicated by dashed lines. Vertical mixing can be significantly reduced during a temperature inversion, which is apparent from the O3 and RH measurements in the right-hand column. In both examples, O3 decreases at ground level (5.4 m) at the beginning of the temperature inversion and increases as the inversion breaks down in the morning. This behaviour is understood in terms of O3 loss to soil surfaces and through stomatal and non-stomatal uptake on leaves (Zhou et al., 2017; Rannik et al., 2012; Altimir et al., 2006; Ganzeveld and Lelieveld, 1995) as well as through chemical reactions with, for example, NO, NO2, and unsaturated (biogenic) organics (Kurpius and Goldstein, 2003). Reduced vertical mixing means that, during the inversion, O3 is only slowly replenished by downward mixing of air masses above the canopy, where higher O3 levels are observed. In contrast, the RH behaves in the opposite sense, as the air above the inversion is drier than that close to the ground, where evapotranspiration contributes to enhanced water vapour concentrations.
If the only source of NO was the photolysis of NO2, NO mixing ratios would be expected to follow the NO2 photolysis rate during the day and tend toward zero at night, as NO is oxidized to NO2 by O3 on a timescale of minutes (for O3>10 ppb). This was not always the case during ACROSS. A pronounced NO peak (up to ∼2 ppbv) was observed at ground level between 00:00 and 06:00 UTC (02:00 and 08:00 LT) during the phase dominated by Atlantic air (shown in Fig. 2); this peak is absent in the phase dominated by Continental air. The peak occurs prior to sunrise and is only observed by the ground-level measurements, suggesting a non-photolytic source of NO close to the ground; this is discussed further below. Very low (0–5 ppbv) O3 mixing ratios coincide with the sustained nighttime NO peak observed, which is never reached in the Continental-phase example, although clear temperature inversions were seen in both cases. Additional examples of sustained NO peaks (i.e. lasting several hours at a level of between 1 and 2 ppbv) at night during the first phase are shown in Fig. S7 in the Supplement. Examples of additional nights with temperature inversions during phase 2, during which NO mixing ratios remained close to zero, are shown in Fig. S8 in the Supplement.
3.1 Nighttime ozone loss
For each night between 17 June and 22 July, the net O3 loss-rate constant, kL(O3), was derived by fitting exponential expressions to the data for periods of 4.5 to 8 h. kL(O3) was highly variable, with values between and s−1, depending on the strength of the temperature inversion and the relative humidity (see discussion below). These values of kL(O3) correspond to lifetimes of 1–15 h for O3 at nighttime. Chemical losses of O3 occur through reactions with NO, NO2, and unsaturated biogenic volatile organic compounds (BVOCs) (Zhou et al., 2017). Rate coefficients of reactions of O3 with NO ( at 298 K), NO2 ( at 298 K), limonene (a reactive terpene, at 298 K), and β-caryophyllene (a sesquiterpene, at 298 K) are low; thus, mixing ratios in excess of 1 ppbv would be required for NO and β-caryophyllene to explain the O3 loss-rate constant (IUPAC, 2024). The required mixing ratios of terpenes or NO2 would be even larger (60–300 ppbv). As such high mixing ratios of NO and NO2 were not observed continuously and such BVOC levels are unlikely, we assume that chemical losses of O3 are insignificant compared with deposition, as previously observed (Zhou et al., 2017). Ignoring entrainment from other heights, we can then equate kL(O3) to (), where Vd is the deposition velocity and h is the boundary layer height; the factor 2 is used to account for a positive vertical gradient (Shepson et al., 1992). Using a boundary layer height of 20 m (arbitrarily set equal to the top of the canopy) gives net deposition velocities of between 0.018 and 0.3 cm s−1. These values for Vd are in broad agreement with other studies in temperate forests, where deposition velocities for O3 at nighttime have been reported to be around 0.07–0.3 cm s−1 (Padro, 1996, 1993; Finkelstein et al., 2000; Wu et al., 2016).
In Fig. 3, the O3 production rate (JNO2×[NO2]), RH, temperature at four different heights, and O3 mixing ratio are plotted for two nights with high average RH to illustrate the impact of temperature inversions on the net O3 loss-rate constants. The production rate of O3 is used to identify periods in which production is negligible. In the left column, a night without a temperature inversion is plotted, where the average RH for the period used to fit the exponential decay is 93 % ± 3 %. These conditions resulted in a net O3 loss-rate constant of s−1. In contrast, the night depicted in the right column has the same average RH (92 % ± 3 %) and a very clear temperature inversion, which gives a net O3 loss-rate constant of s−1. This gives a factor of 5 between these two net O3 loss-rate constants depending on whether a temperature inversion is observed or not. This can be understood in terms of the O3 being replenished from above when there is no (or a weak) inversion, which is not the case when there is an inversion. Bearing this in mind, the use of kL(O3) (a net O3 loss constant) must result in a lower limit to Vd unless strong temperature inversions (preventing O3 entrainment from above) are present. The O3 loss rate will also be enhanced under conditions of strong inversion if trace gases that are reactive towards O3 are released into a very shallow boundary layer. However, as indicated above, chemical losses are not expected to compete with physical losses.
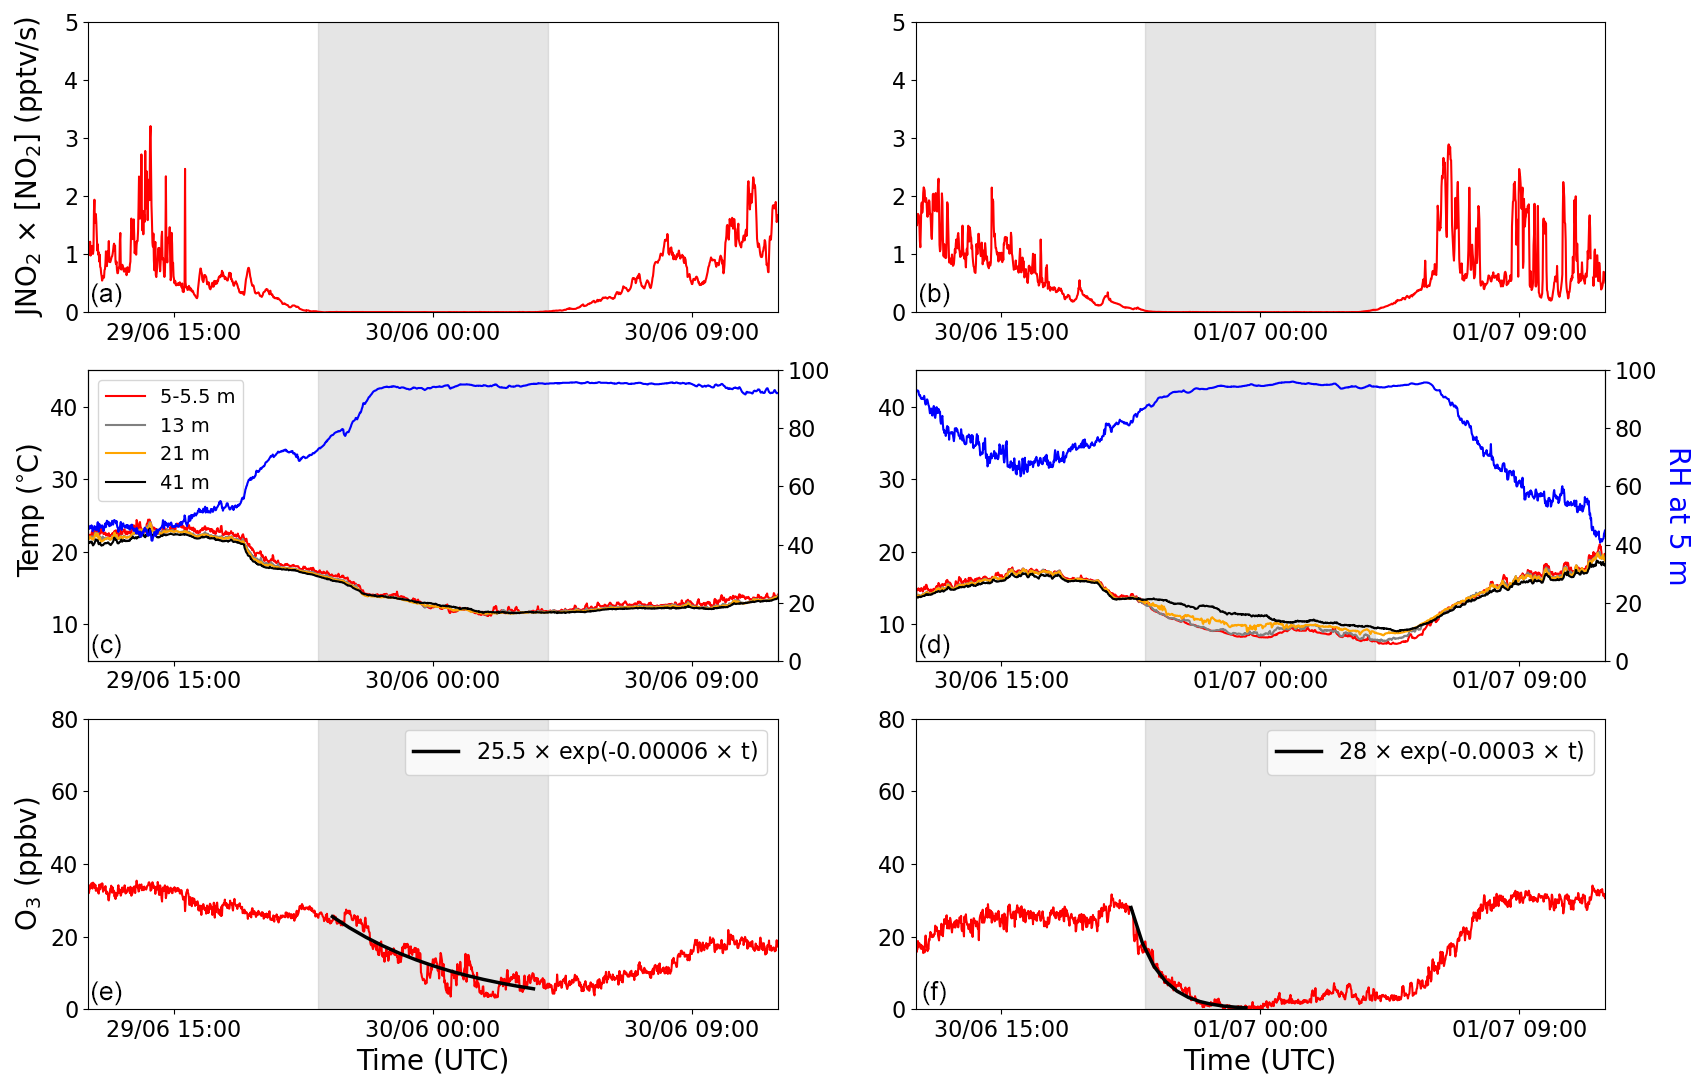
Figure 3The production of O3 (JNO2×[NO2]), temperature, RH, and O3 plotted for two nights with high average RH: one without a temperature inversion (a, c, e) and one with a temperature inversion (b, d, f). The four different colours in the legend symbolize four different heights: red represents 5–5.5 m, grey represents 13 m, orange represents 21 m, and black represents 41 m. Blue shows the RH at 5 m. The net nighttime O3 loss is fitted with an exponential decay curve (solid black line) in panels (e) and (f). The grey shaded areas represent nighttime.
To investigate the impact of RH on the net O3 loss-rate constants, two nights with temperature inversions are plotted in Fig. S9 in the Supplement: one with a high RH (92 % ± 3 %) and one with a lower RH (63 % ± 6 %). Here, we see a large decrease in kL(O3), from to s−1, when going from a high to a lower RH. The individually determined O3 loss-rate constants are plotted as a function of RH in Fig. 4 and colour-coded depending on whether a temperature inversion is observed during the time period that was used for the exponential decay fit. A clear increase in O3 loss-rate constants can be observed when the RH increased above 70 %–80 % when a temperature inversion was observed. A small increase at a RH higher than 70 %–80 % was also observed when temperature inversions were absent. The observed dependence of kL(O3) on relative humidity is consistent with previous studies in forested regions, which have reported an increase in O3 loss above 60 %–70 % RH (Altimir et al., 2006; Rannik et al., 2012; Zhou et al., 2017). Altimir et al. (2006) suggested an enhancement factor that is humidity dependent above 70 % RH: 1 at 70 % RH, 2 at 85 % RH, and a sharp increase to over 5 when moving towards 100 % RH. In a boreal forest, these observations have been explained by the formation of a “wet skin” on leaves that enhances surface O3 losses by modifying (reducing) the surface-resistance to uptake (Zhou et al., 2017). This is in broad agreement with our observations during nights with a temperature inversion (see Fig. 4), and the discrepancies between the studies could be explained, for example, by different tree types, the height of the boundary layer, the strength of the inversion, and the temperature.
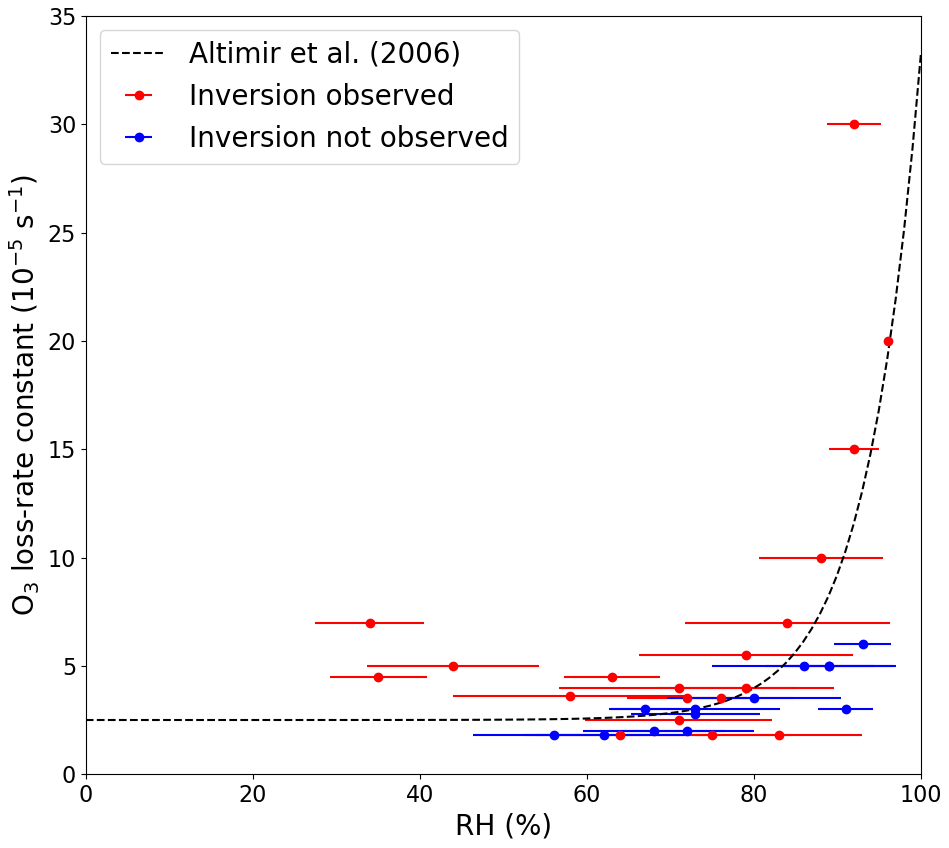
Figure 4Net O3 loss-rate constants at 5.4 m plotted against the average relative humidity measured during the time used to fit the exponential decay of O3. The error bars represent ±1σ on the average RH. The dashed line symbolizes the observations made by Altimir et al. (2006).
The faster net rate of O3 loss on nights with high RH and well-defined temperature inversions explains the differences observed in the O3 mixing ratios at night during the Atlantic and Continental phases. The average nighttime (20:00–04:00 UTC) RH for the Atlantic phase was 87.4 % ± 7.6 % (1σ) compared with 68.4 % ± 12.7 % (1σ) for the Continental phase, indicating that higher loss-rate constants would be expected for the Atlantic phase on nights with temperature inversions. The high RH combined with the significantly lower average peak O3 mixing ratio in the Atlantic phase (34.5 ± 6.0 (1σ) ppbv between 14:00 and 15:00 UTC) compared with the Continental phase (52.7 ± 13.6 (1σ) ppbv between 14:00 and 15:00 UTC) explains why the O3 was essentially completely depleted on nights with temperature inversions during the Atlantic phase, as shown in Figs. 2 and S7.
3.2 Nitrogen oxide soil emissions
Figures 2c and S7 show nighttime periods in which NO was observed when O3 was depleted during the Atlantic phase. The several-hour duration of the period during which NO was above the LOD excludes very local combustion as the source, leaving soil emissions resulting from microbial activity (Davidson and Kingerlee, 1997) as the most likely source of NO. At 293 K and 2 ppbv of O3, the lifetime of NO with respect to the reaction with O3 is around 20 min. It is, therefore, reasonable to assume that NO is close to steady state when there is 2 ppbv or more of O3 available. The NO emission rate (ENO) can, thus, be equated to the loss rate of NO, as described in Eq. (1), assuming that all peroxy radicals (XO2) react with the same rate coefficient as HO2:
where kNO+O3 and kNO+HO2 are the temperature-dependent rate constants for the reaction of NO with O3 and HO2, respectively (IUPAC, 2024), and [NO], [O3], and [XO2] are the measured concentrations of NO, O3, and XO2, respectively. In Fig. 5, NO and ENO (when O3>2 ppbv) at nighttime ( s−1) are separated by air masses and plotted against O3, where the outliers are defined as being outside 1.5 × the interquartile range (IQR). While the nighttime NO mixing ratio increased rapidly when O3 tended towards 0 ppbv during the Atlantic phase, O3 was never depleted to less than 5 ppbv during the Continental phase and, therefore, no sustained periods of enhanced NO were observed at nighttime. In contrast, no significant trend is found when plotting ENO against O3 for either of the phases, which shows that the calculated soil emission of NO is not dependent on O3. This indicates that, while the soil is an important but variable source of NO, sustained nighttime NO peaks are only observed above the instrument LOD when O3 is almost totally depleted so that the lifetime of NO is long enough to allow its concentration to build up sufficiently.
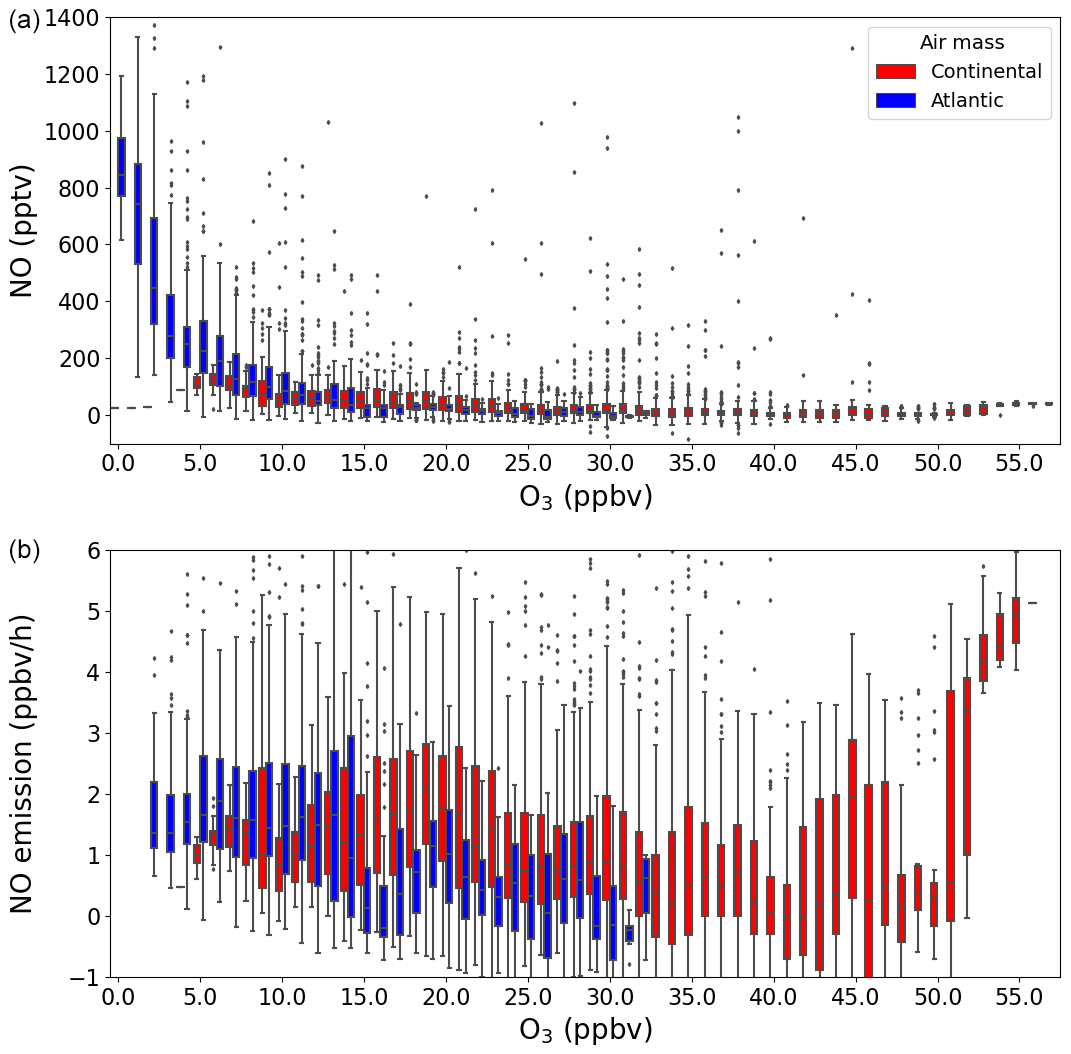
Figure 5The NO (a) and NO emission (b) plotted against O3 in a box and whiskers plot, where the outliers are defined as being outside 1.5×IQR. The colours represent the two different air masses.
Water content and temperature have previously been shown to impact the emission rate of NO from soil (Pilegaard, 2013; Rosenkranz et al., 2006). Rosenkranz et al. (2006) found a positive correlation between soil moisture and NO emission up to a 40 % water-filled pore space and an optimum between 12.5 and 15 °C soil temperature in a sessile oak forest in Hungary. In Fig. 6, NO and ENO are plotted against the soil temperature and moisture at 5 cm below the surface. The measured NO mixing ratios peak towards the highest soil moisture and lowest soil temperature measured during this campaign; however, as with O3, there is no significant trend in the NO emission rates with soil moisture. At the low (11.5–12.5 °C) and high (19.5–20.5 °C) nighttime soil temperatures, very few measurements were made (around 2 h combined) compared with the rest of the temperature intervals. Across the remaining temperature intervals, no significant trend was observed in the estimated NO emission.
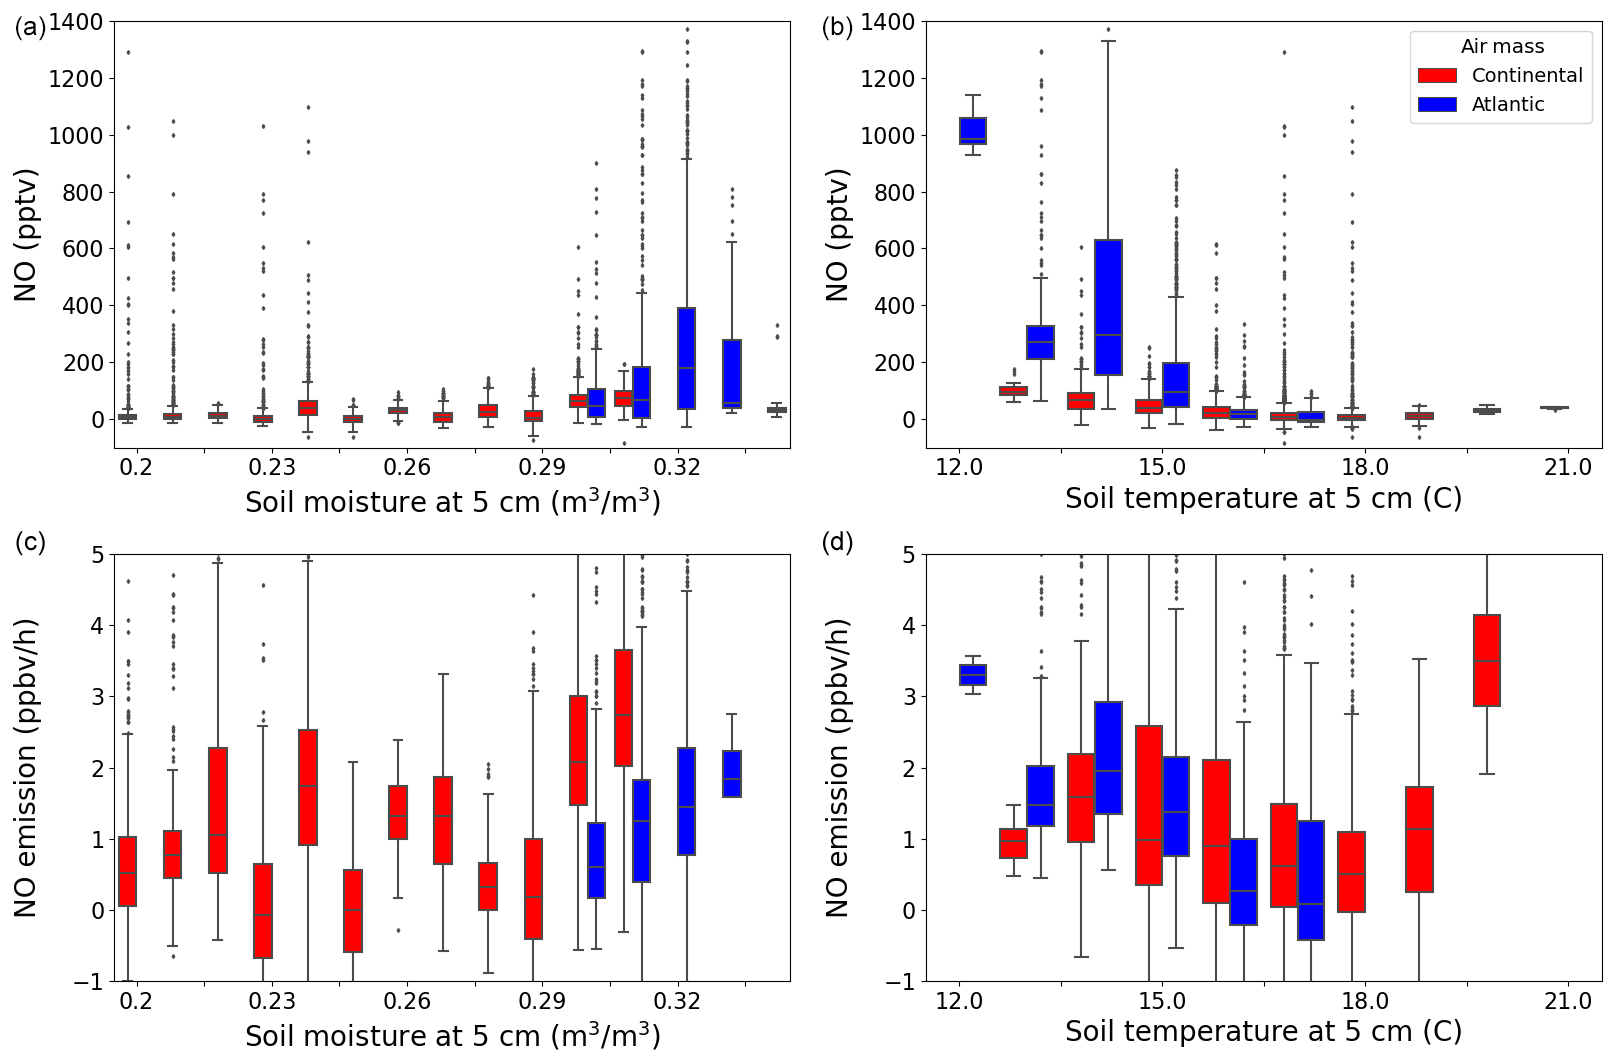
Figure 6The NO (a, b) and NO emission (c, d) plotted against soil moisture (a, c) and temperature (b, d) at 5 cm below the surface in a box and whiskers plot, where the outliers are defined as being outside 1.5×IQR. The colours represent the two different air masses.
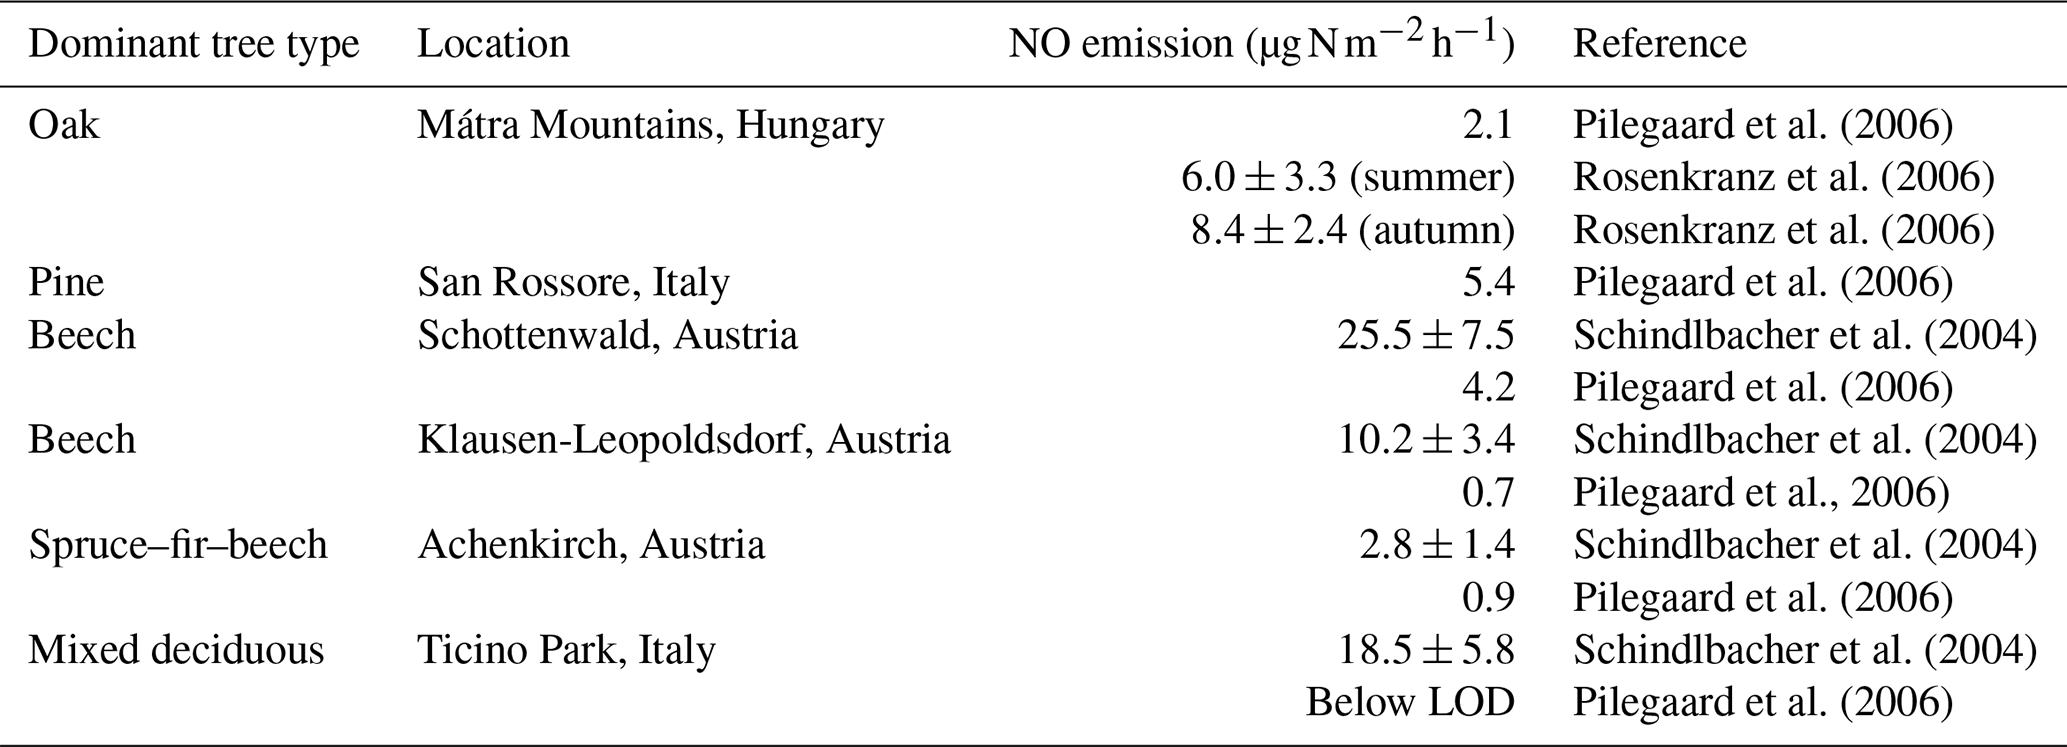
The average NO emission rate derived for the two phases is identical, with values of 1.45 ± 1.61 ppbv h−1 (1σ, median of 1.27 ppbv h−1) and 1.42 ± 5.68 ppbv h−1 (1σ, median of 0.71 ppbv h−1) for the Atlantic and Continental phases, respectively, when using data where O3>2 ppbv. The Continental phase shows much higher variability, resulting from more spikes in the data during that period. When O3 is completely depleted during the Atlantic phase, the increase in NO per hour results in NO emission rates of 0.3–1.8 ppbv h−1, which is in reasonable agreement with the averages across each of the two phases when there is still O3 present. By assuming a mixed nocturnal boundary layer (NBL) with a height of 20 m (top of the canopy), the average emission rates can be converted to NO emission fluxes of 16.6 ± 18.5 (1σ) and 16.2 ± 65.0 (1σ) , respectively. These values are within the range of previous measurements in different European forests with similar tree types to those found in the Rambouillet Forest (see Table 1). The measurements by Pilegaard et al. (2006) and Rosenkranz et al. (2006) were all performed using the chamber technique, whereas Schindlbacher et al. (2004) measured the emission from soil samples collected in the field and exposed to different temperature and humidity levels in the laboratory. The chamber-derived emission rates are all either lower than or, within combined uncertainties, equal to the values determined in this study, while emission rates from the soil samples were higher than or, within combined uncertainties, equal to the values derived in the present study. Davidson and Kingerlee (1997) modelled the global NO emission inventory from soil depending on the biome (e.g. temperate forest, agriculture, and savanna) and split the temperate forest category into regions affected or unaffected by nitrogen deposition. For temperate forests not affected by nitrogen deposition, those authors estimated a flux of 0.0–0.2 (0.0–2.3 ), which is in good agreement with the lower measurements by Pilegaard et al. (2006). In contrast, the temperate forests impacted by nitrogen deposition had estimated fluxes of 1.1–5.0 (12.6–57.1 ), which is in good agreement with our measurements at Rambouillet Forest, where nitrogen deposition is enhanced by pollution arriving from Paris and other surrounding urbanized/industrialized areas. While noting that our fluxes are broadly consistent with previous measurements, we recognize that the calculations are based on the assumptions of a well-mixed boundary layer of fixed height (arbitrarily set at 20 m) and should not be overinterpreted.
Table 1Measured NO soil emission in European forests with the same tree types as in the Rambouillet Forest.
3.3 Nitrogen dioxide losses
At nighttime, in the absence of its photolysis, NO2 may be expected to increase in concentration (via Reaction R2) when a constant NO source exists (e.g. from soil, as observed here) and when O3 is present. For both the Atlantic and the Continental phases, an average diel profile, between 20:00 and 04:00 UTC, of NO2 (black) is plotted in Fig. 7. No obvious increase in NO2 can be observed in the Atlantic phase, whereas an average increase of around 1 ppbv can be observed in the Continental phase. The expected NO2 resulting from the NO+O3 reaction if there were no loss mechanisms of NO2 is plotted in red. This is determined by using the NO2 measured at 20:00 UTC and incrementally altering this value by the NO2 that would have been produced through NO oxidation by O3 and peroxy radicals at each time step. In both phases, the simple assumptions of nighttime NO2 production through NO+O3 and NO+XO2 and no NO2 loss result in the significant generation of NO2 with an overestimation of 10–12 ppbv of NO2 at the end of the night compared with the measured NO2. Thus, a loss mechanism of around 1.4 ppbv h−1 of NO2 is necessary to explain the observed (lack of increase in) NO2.
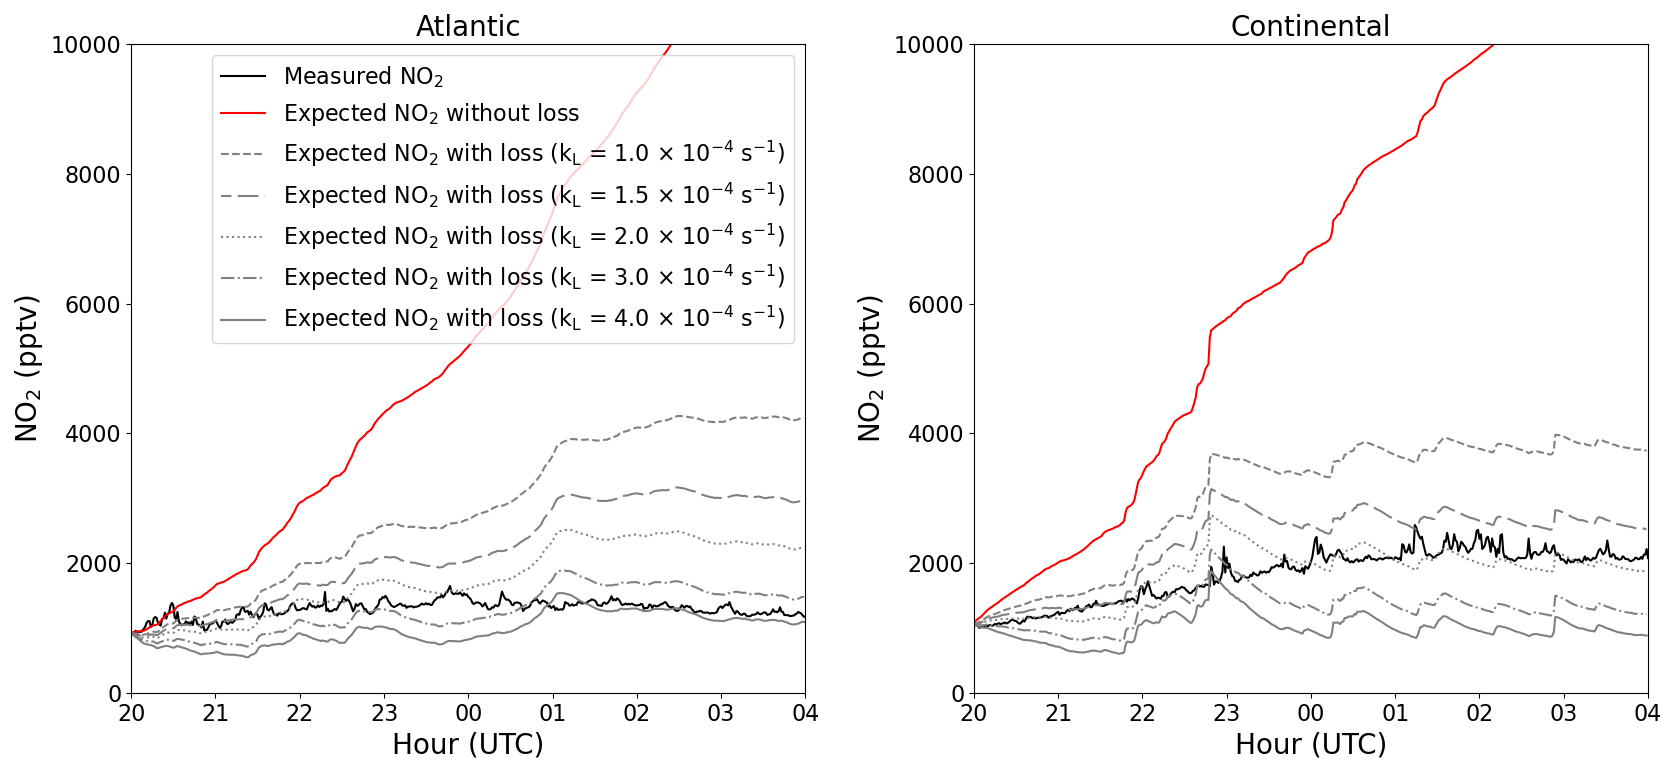
Figure 7Average nighttime profiles of NO2 at 5.4 m for each of the two phases (black) plotted along with the expected NO2 with (grey) and without (red) NO2 loss.
3.3.1 Chemical losses
While NO2 is removed in a largely irreversible process through reaction with OH radicals to form HNO3 during the daytime, this is unlikely to represent a significant sink at nighttime. In the absence of photochemical formation pathways, OH is generated at night via the ozonolysis of olefins and in the reaction of HO2 with NO3 and NO.
In the forested environment in summer, emissions of BVOCs (e.g. olefinic terpenoids) will favour Reaction (R11) and, simultaneously, disfavour Reaction (R12), as NO3 will be reduced with respect to its concentration via its reactions with BVOCs. During the ACROSS campaign, ground NO3 levels were generally below the instrument detection limits of 2 pptv; hence, we can reasonably ignore Reaction (R12). Measurements of OH in forested environments are sparse, although they indicate that nocturnal OH levels are low, with concentrations generally lower than 1×10⁵ . Combining the rate coefficient for the reaction of OH with NO2 of (IUPAC, 2024) at ambient pressure and ≈300 K with an upper limit (confirmed by measurements) to the OH concentration of 1×10⁶ results in an NO2 loss constant of s−1, or (at the average nighttime concentration of NO2=1650 pptv) a loss rate of ∼60 ppt h−1, which is clearly insufficient to explain the observations.
NO2 is also lost via its reaction with O3 to form the NO3 radical (Reaction R8). We have shown (Dewald et al., 2024) that the majority of NO3 formed in the forest will react with BVOCs rather than with NO (to re-form NO2) and, to a good approximation, that Reaction (R8) represents an irreversible loss of NO2, as the alkyl nitrates will not release nitrogen in the form of NO2 at nighttime. However, the rate coefficient for this process ( at 298 K; IUPAC, 2024) is very small; therefore, with average nighttime O3 levels reduced by deposition (see above) to 23 ppbv, the lifetime of NO2 with respect to this reaction is 14 h and the loss rate (at the average nighttime concentration of NO2=1650 pptv) is ∼120 pptv h−1, which is again too slow to contribute significantly to the apparent loss rate of NO2.
The chemical loss of NO2 via reaction with OH or via formation of NO3 and its further reactions with BVOCs to form alkyl nitrates is expected to result in the conversion of NOx to NOy. As described in Sect. 2.1.1, we operated an NOy instrument to measure NOy in both the gas- and particle-phases during the ACROSS campaign. Figure 8 displays the average diel profiles of NOz (NOy–NOx) and pNO3 during the Atlantic and Continental phases. For both NOz and pNO3, the diel profiles show either a decrease or a stable mixing ratio across the period in which losses of 10–12 ppbv of NO2 are required to explain the observations. Clearly, the loss of NO2 at nighttime is not balanced by the formation of other forms of reactive nitrogen that were long-lived enough to be detected. Trace gases, such as HNO3 or alkyl nitrates, may be lost via deposition to surfaces, especially at high relative humidity, and lifetimes for biogenic alkyl nitrates of a few hours have been reported (Liebmann et al., 2019; Farmer and Cohen, 2008; Browne et al., 2013; Romer Present et al., 2020). However, as shown above, the limiting step in the formation of organic nitrates is the slow reaction of NO2 with O3, which will not convert sufficient NO2 to NOz to explain our observations. The formation of organic nitrates that do not require the intermediacy of NO3 (i.e. peroxy nitrates formed from RO2+NO2) would also have been detected by the NOy instrument and can, thus, also be ruled out as major reservoirs of NOx.
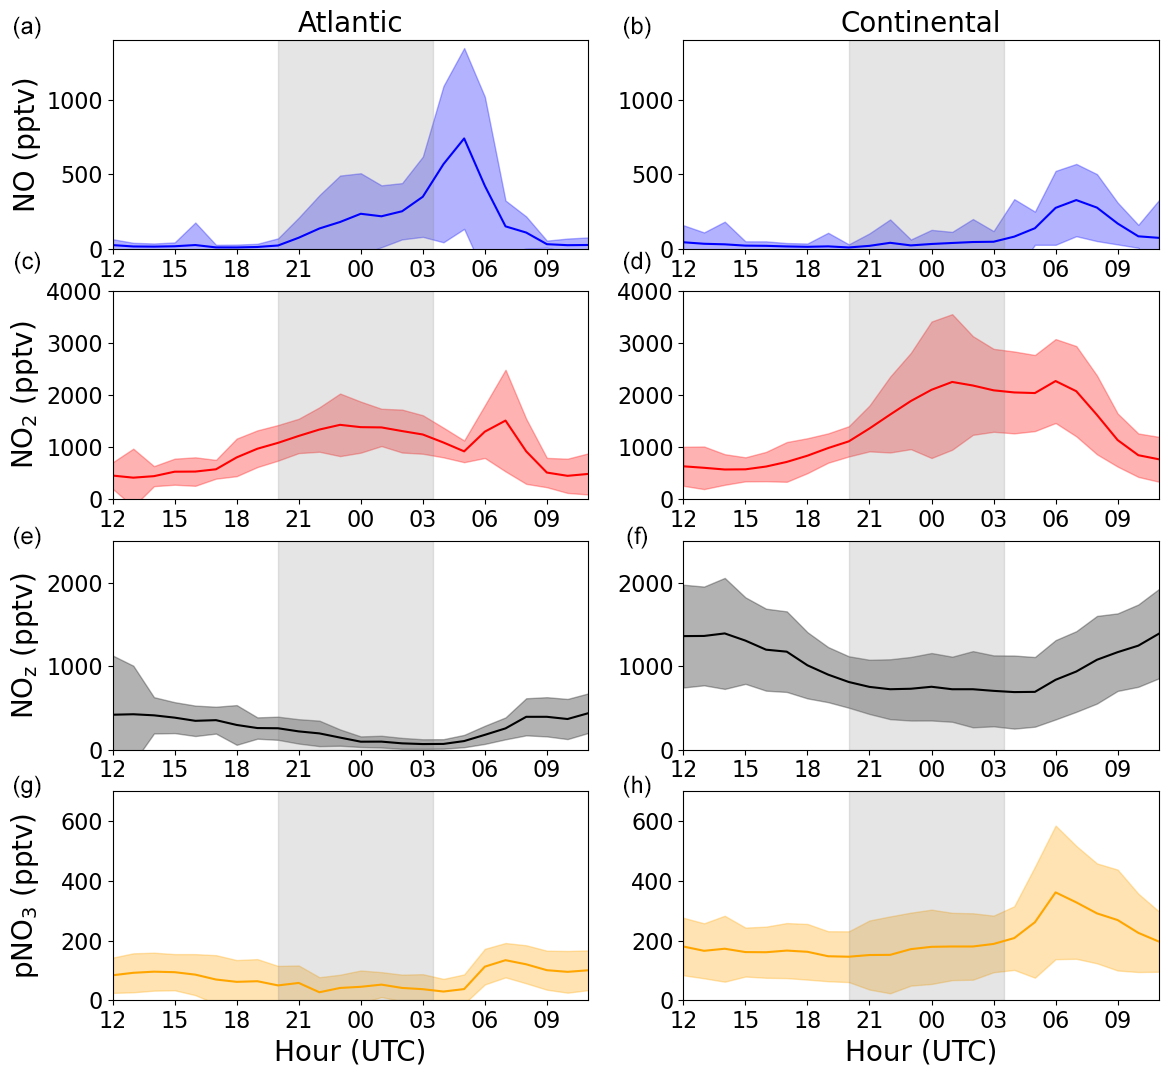
Figure 8Average diel profiles of NO, NO2, total gas-phase NOz, and particulate nitrate (pNO3) at 3–6 m above ground for the Atlantic (a, c, e, g) and Continental (b, d, f, h) phases. The grey shaded areas symbolize nighttime.
NO2 deposited to humid surfaces can be converted to HONO and released to the atmosphere (Elshorbany et al., 2012; Meusel et al., 2016). A time series of HONO can be found in Fig. S2 and reveals increases in HONO at nighttime. However, the HONO mixing ratios can account for only a small fraction of the NO2 loss described above. This may reflect the fact that, if formed at a moist surface, (soluble) HONO is unlikely to desorb quantitatively into the gas phase. The low HONO mixing ratios measured during the Atlantic phase, compared with the Continental phase, could potentially be explained by the difference in soil humidity; however, the factors influencing the formation and release of HONO are complex. The HONO observations will be analysed in detail in a separate publication from the ACROSS campaign.
In the absence of other known gas-phase mechanisms for the removal of NO2 at night and owing to the fact that very small amounts of other reactive nitrogen trace gases or nitrate particles are formed during nighttime, we conclude that the physical removal of NO2 (i.e. deposition) is responsible for its lack of build-up at night during ACROSS and that any transformation of NO2 at the surface does not lead to a quantitative release into the gas phase.
3.3.2 Physical losses
NO2 is known to be lost through dry deposition to surfaces such as soil and leaves, with the latter depending on whether the stomata are open (daytime) or not fully open (nighttime) (Delaria et al., 2020, 2018; Chaparro-Suarez et al., 2011). As for O3, the dry deposition of NO2 to surfaces can be described by an exponential decay with a first-order decay rate constant of , where Vd is the deposition velocity and h is the boundary layer height. This expression applies when gradients within the boundary layer are weak, as expected for NO2 (see above), even though vertical mixing is very slow at night. The net production (or loss) of NO2 is given by Eq. (2), where the first term on the right-hand side is the NO2 production rate from the reaction of NO with O3 or XO2 (which is identical to the NO soil emission rate) and the second term is the loss rate assuming only depositional losses (see above) and ignoring the entrainment of NO2 from other heights. This will give an upper limit for the NO2 deposition rate, as a small fraction (<10 %) of NO2 is lost through chemical reactions with O3 and OH (see above).
where [NO2]0 is the NO2 mixing ratio at 20:00 UTC. The NO2 concentration at any subsequent time can then be calculated as described in Eq. (3) via variation of the kL(NO2) term in order to match the observed NO2 mixing ratio.
In Fig. 7, the grey lines symbolize the calculated NO2 mixing ratios at nighttime using values of kL(NO2) between and s−1. As expected, no single value of kL(NO2) can explain all of the measurements, as the height of the boundary layer will not be invariant during the whole night. However, for the Continental and Atlantic phases, the observed NO2 can be explained with s−1 and s−1, respectively, resulting in respective lifetimes of ∼1–3 h and ∼40–110 min for NO2 at nighttime. As the deposition of NO2 in this environment represents a permanent loss of NOx from the gas phase, this lifetime can be compared to, for example, the lifetime of NOx with respect to its conversion to HNO3 via the reaction of NO2 with OH, which is ∼1 d (assuming an average of ). The low aerosol surface area during ACROSS combined with the low uptake coefficient for NO2 renders losses due to heterogeneous processes insignificant (IUPAC, 2024). Clearly, only depositional losses of NO2 in a forested environment contribute substantially to its lifetime at night and to the NOx budget.
If we continue to assume that the NBL at the forest site is at the top of the canopy (20 m), the NO2 loss-rate constants that we determined can be converted to a deposition velocity of 0.4 ± 0.2 cm s−1 and 0.55 ± 0.25 cm s−1 for the Continental and Atlantic phase, respectively. These are comparable to previous measurements of NO2 deposition velocities of 0.15 cm s−1 (Dewald et al., 2022), 0.1–0.57 cm s−1 (Rondón et al., 1993), 0.098 cm s−1 (Breuninger et al., 2013), 0.2–0.5 cm s−1 (Horii et al., 2004), and 0.02–0.64 cm s−1 (Puxbaum and Gregori, 1998) for a mountain observatory surrounded by coniferous trees, boreal coniferous forests, a temperate coniferous forest, a temperate mixed deciduous forest, and a temperate oak forest, respectively, where a combination of soil and foliage deposition was measured. Horii et al. (2004) saw an increase in the deposition velocity with an increasing NO2 mixing ratio: from 0.2 cm s−1 at 1 ppbv to 0.5 cm s−1 at 30 ppbv. Puxbaum and Gregori (1998) reported monthly averages of 0.02–0.64 cm s−1; however, their average nighttime deposition velocities were below 0.05 cm s−1. The deposition velocities determined here are a factor of 5–40 higher than what has been measured for nighttime foliage deposition velocities to the leaves of different trees native to California (Delaria et al., 2020, 2018), although they are in good agreement with measurements for daytime. It is, however, important to note that the deposition velocities estimated here are upper limits, as the estimation of the NO emission rate is an upper limit and the chemical loss of NO2 is not taken into account. Using an average nighttime NO2 mixing ratio of 1650 and 1450 pptv for the Continental and Atlantic phase, respectively, results in respective NO2 deposition rates of 13.6 ± 6.8 and 18.7 ± 8.5 , which are in reasonable agreement with that measured for soil NO2 deposition in a sessile oak forest (9.67 ± 1.92 ) during the summer (Rosenkranz et al., 2006). The estimated NO soil emission rate and NO2 deposition rate are, within the uncertainties, identical, which means that the Rambouillet Forest is not a significant direct source or sink of NOx.
Measurements of NO, NO2, NOy, and O3 during the ACROSS campaign (June–July 2022) in the Rambouillet Forest, southwest of Paris, France, have been used to gain insight into nighttime processes controlling NOx in an anthropogenically impacted forest environment. Based on HYSPLIT back trajectories, two phases of the campaign were identified: one dominated by air originating over the Atlantic Ocean (“Atlantic”), which on average had high relative humidity and low O3 mixing ratios, and one dominated by continental air masses from different urban/industrialized regions (“Continental”), which on average had a lower relative humidity than the Atlantic phase and higher O3 mixing ratios. Strong diel profiles were observed in the O3 measurements across the campaign, with daytime peak mixing ratios varying from ∼30 to 90 ppbv and nighttime values tending towards 0–10 ppbv. The daily variation was driven by a variable but generally rapid O3 deposition to soil and foliar surfaces, with a strong influence of relative humidity (influencing the surface resistance to uptake) and inversion (influencing the rate of entrainment of O3 from above the canopy).
During the Atlantic phase, periods of sustained NO above the instrumental detection limit were observed at nighttime, when O3 was sufficiently low (i.e. the NO lifetime was sufficiently long). This enabled the derivation of an average NO emission rate from the soil (ENO) of ∼1.4 ppbv h−1, which was confirmed by the approximately linear increase in NO observed in the absence of O3 in the Atlantic phase. The estimated ENO is in broad agreement with previous measurements in other European temperate forests with similar tree types to those found in the Rambouillet Forest. The uncertainty in the estimated NO emission rate is determined from the uncertainties in NO and O3 at 3–5 m above the ground, which leads to higher relative uncertainties at low NO and O3 mixing ratios. Measurements of either NO fluxes or highly resolved height profiles of NO and O3 will improve the NO emission rate estimate during future field campaigns.
An increase in NO2 at night would be expected with a constant NO emission rate of ∼1.4 ppbv h−1 in the presence of O3, as observed in this study; however, this was not the case. The lack of an increase in NO2 was used to estimate first-order decay constants of s−1 and s−1, resulting in an effective lifetime of NO2 of ∼0.5–3 h. The loss of NO2 at nighttime is presumably driven by deposition to soil and foliar surfaces, as the lifetime of NO2 with respect to its reactions with OH and O3 at night is >28 and 14 h, respectively. By comparison, the daytime lifetime of NO2 with respect to loss by reaction with OH is about 1 d. We conclude that the nighttime deposition of NO2 is a major sink of boundary layer NOx in this forested environment.
All data from the ACROSS campaign, including NOx (https://doi.org/10.25326/705, Andersen and Crowley, 2023a; https://doi.org/10.25326/687, Crowley, 2024; https://doi.org/10.25326/708, Dusanter and Jamar, 2023; https://doi.org/10.25326/512, Xue et al., 2023b), O3 (https://doi.org/10.25326/707, Crowley, 2023), organic nitrates (https://doi.org/10.25326/706, Andersen and Crowley, 2023b), HONO (https://doi.org/10.25326/709, Xue et al., 2023a), meteorological quantities (https://doi.org/10.25326/437, Denjean, 2023), and peroxy radicals (https://doi.org/10.25326/509, Kukui, 2023), can be found at https://across.aeris-data.fr/catalogue/ (last access: 31 August 2024).
The supplement related to this article is available online at: https://doi.org/10.5194/acp-24-11603-2024-supplement.
All authors contributed measurements. Data analysis was conducted by STA, with contributions from JNC and PD. CC and VM organized the field campaign, with contributions from the individual group leads. STA and JNC developed the manuscript, with contributions from all co-authors.
At least one of the (co-)authors is a member of the editorial board of Atmospheric Chemistry and Physics. The peer-review process was guided by an independent editor, and the authors also have no other competing interests to declare.
Publisher's note: Copernicus Publications remains neutral with regard to jurisdictional claims made in the text, published maps, institutional affiliations, or any other geographical representation in this paper. While Copernicus Publications makes every effort to include appropriate place names, the final responsibility lies with the authors.
This article is part of the special issue “Atmospheric Chemistry of the Suburban Forest – multiplatform observational campaign of the chemistry and physics of mixed urban and biogenic emissions”. It is not associated with a conference.
Simone T. Andersen is thankful to the Alexander von Humboldt foundation for funding her stay at Max Planck Institute for Chemistry.
Patrick Dewald gratefully acknowledges the Deutsche Forschungsgemeinschaft (“MONOTONS” project; project no. 522970430).
The ACROSS project has received funding from the French National Research Agency (ANR), under the investment programme integrated into France 2030 (grant no. ANR-17-MPGA-0002), and was supported by the French National programme LEFE (Les Enveloppes Fluides et l'Environnement) of the CNRS/INSU (Centre National de la Recherche Scientifique/Institut National des Sciences de l'Univers). Data from the ACROSS campaign are hosted by the French national Atmosphere Data Centre (AERIS).
IMT Nord Europe acknowledges financial support from the CaPPA project, which is funded by the French National Research Agency (ANR) through the PIA (Programme d'Investissement d'Avenir; grant no. ANR-11-LABX-0005-01), the regional council of Hauts-de-France, and the European Regional Development Fund (ERDF).
This research has been supported by the Agence Nationale de la Recherche (grant nos. ANR-17-MPGA-0002 and ANR-11-LABX-0005-01), the Alexander von Humboldt-Stiftung (postdoc fellowship), and the Deutsche Forschungsgemeinschaft (grant no. 522970430).
The article processing charges for this open-access publication were covered by the Max Planck Society.
This paper was edited by Amos Tai and reviewed by two anonymous referees.
Altimir, N., Kolari, P., Tuovinen, J.-P., Vesala, T., Bäck, J., Suni, T., Kulmala, M., and Hari, P.: Foliage surface ozone deposition: a role for surface moisture?, Biogeosciences, 3, 209–228, https://doi.org/10.5194/bg-3-209-2006, 2006.
Ammann, M., Cox, R. A., Crowley, J. N., Herrmann, H., Jenkin, M. E., McNeill, V. F., Mellouki, A., Rossi, M. J., Troe, J. and Wallington, T. J.: IUPAC Task Group on Atmospheric Chemical Kinetic Data Evaluation, https://iupac.aeris-data.fr/, last access: April 2024.
Andersen, S. T. and Crowley, J. N.: ACROSS_MPIC_RambForest_5ch-NO2_1min_L2 [data set], https://doi.org/10.25326/705, 2023a.
Andersen, S. T. and Crowley, J. N.: ACROSS_MPIC_RambForest_5ch-PNs-ANs_10min_L2 [data set], https://doi.org/10.25326/706, 2023b.
Breuninger, C., Meixner, F. X., and Kesselmeier, J.: Field investigations of nitrogen dioxide (NO2) exchange between plants and the atmosphere, Atmos. Chem. Phys., 13, 773–790, https://doi.org/10.5194/acp-13-773-2013, 2013.
Browne, E. C., Min, K.-E., Wooldridge, P. J., Apel, E., Blake, D. R., Brune, W. H., Cantrell, C. A., Cubison, M. J., Diskin, G. S., Jimenez, J. L., Weinheimer, A. J., Wennberg, P. O., Wisthaler, A., and Cohen, R. C.: Observations of total RONO2 over the boreal forest: NOx sinks and HNO3 sources, Atmos. Chem. Phys., 13, 4543–4562, https://doi.org/10.5194/acp-13-4543-2013, 2013.
Burkhardt, J. and Eiden, R.: Thin water films on coniferous needles: A new device for the study of water vapour condensation and gaseous deposition to plant surfaces and particle samples, Atmos. Environ., 28, 2001–2011, https://doi.org/10.1016/1352-2310(94)90469-3, 1994.
Cantrell, C. and Michoud, V.: An Experiment to Study Atmospheric Oxidation Chemistry and Physics of Mixed Anthropogenic–Biogenic Air Masses in the Greater Paris Area, B. Am. Meteorol. Soc., 103, 599–603, https://doi.org/10.1175/BAMS-D-21-0115.1, 2022.
Chaparro-Suarez, I. G., Meixner, F. X., and Kesselmeier, J.: Nitrogen dioxide (NO2) uptake by vegetation controlled by atmospheric concentrations and plant stomatal aperture, Atmos. Environ., 45, 5742–5750, https://doi.org/10.1016/j.atmosenv.2011.07.021, 2011.
Ciencewicki, J. and Jaspers, I.: Air Pollution and Respiratory Viral Infection, Inhal. Toxicol., 19, 1135–1146, https://doi.org/10.1080/08958370701665434, 2007.
Crowley, J.: ACROSS_MPIC_RambForest_O3_10min_L1 [data set], https://doi.org/10.25326/707, 2023.
Crowley, J.: ACROSS_MPIC_RambForest_NOx_1min_L2 [data set], https://doi.org/10.25326/687, 2024.
Davidson, E. A. and Kingerlee, W.: A global inventory of nitric oxide emissions from soils, Nutr. Cycl. Agroecosys., 48, 37–50, https://doi.org/10.1023/A:1009738715891, 1997.
Delaria, E. R. and Cohen, R. C.: A model-based analysis of foliar NOx deposition, Atmos. Chem. Phys., 20, 2123–2141, https://doi.org/10.5194/acp-20-2123-2020, 2020.
Delaria, E. R., Vieira, M., Cremieux, J., and Cohen, R. C.: Measurements of NO and NO2 exchange between the atmosphere and Quercus agrifolia, Atmos. Chem. Phys., 18, 14161–14173, https://doi.org/10.5194/acp-18-14161-2018, 2018.
Delaria, E. R., Place, B. K., Liu, A. X., and Cohen, R. C.: Laboratory measurements of stomatal NO2 deposition to native California trees and the role of forests in the NOx cycle, Atmos. Chem. Phys., 20, 14023–14041, https://doi.org/10.5194/acp-20-14023-2020, 2020.
Denjean, C.: ACROSS_CNRM_RambForest_MTO-1MIN_L2 [data set], https://doi.org/10.25326/437, 2023.
Dewald, P., Nussbaumer, C. M., Schuladen, J., Ringsdorf, A., Edtbauer, A., Fischer, H., Williams, J., Lelieveld, J., and Crowley, J. N.: Fate of the nitrate radical at the summit of a semi-rural mountain site in Germany assessed with direct reactivity measurements, Atmos. Chem. Phys., 22, 7051–7069, https://doi.org/10.5194/acp-22-7051-2022, 2022.
Dewald, P., Seubert, T., Andersen, S. T., Türk, G. N. T. E., Schuladen, J., McGillen, M. R., Denjean, C., Etienne, J.-C., Garrouste, O., Jamar, M., Harb, S., Cirtog, M., Michoud, V., Cazaunau, M., Bergé, A., Cantrell, C., Dusanter, S., Picquet-Varrault, B., Kukui, A., Xue, C., Mellouki, A., Lelieveld, J., and Crowley, J. N.: NO3 reactivity during a summer period in a temperate forest below and above the canopy, Atmos. Chem. Phys., 24, 8983–8997, https://doi.org/10.5194/acp-24-8983-2024, 2024.
Draxler, R. R. and Rolph, G. D.: HYSPLIT (HYbrid Single-Particle Lagrangian Integrated Trajectory) Model access via NOAA ARL READY Website, NOAA Air Resources Laboratory, Silver Spring, MD, https://www.ready.noaa.gov/HYSPLIT.php (last access: 13 April 2023), 2011.
Dusanter, S. and Jamar, M.: ACROSS_IMTNE_RambForest_Nox_AboveCanopy_L2 [data set], https://doi.org/10.25326/708, 2023.
Elshorbany, Y. F., Steil, B., Brühl, C., and Lelieveld, J.: Impact of HONO on global atmospheric chemistry calculated with an empirical parameterization in the EMAC model, Atmos. Chem. Phys., 12, 9977–10000, https://doi.org/10.5194/acp-12-9977-2012, 2012.
Emberson, L. D., Pleijel, H., Ainsworth, E. A., van den Berg, M., Ren, W., Osborne, S., Mills, G., Pandey, D., Dentener, F., Büker, P., Ewert, F., Koeble, R., and Van Dingenen, R.: Ozone effects on crops and consideration in crop models, Eur. J. Agron., 100, 19–34, https://doi.org/10.1016/j.eja.2018.06.002, 2018.
Farmer, D. K. and Cohen, R. C.: Observations of HNO3, ΣAN, ΣPN and NO2 fluxes: evidence for rapid HOx chemistry within a pine forest canopy, Atmos. Chem. Phys., 8, 3899–3917, https://doi.org/10.5194/acp-8-3899-2008, 2008.
Finkelstein, P. L., Ellestad, T. G., Clarke, J. F., Meyers, T. P., Schwede, D. B., Hebert, E. O., and Neal, J. A.: Ozone and sulfur dioxide dry deposition to forests: Observations and model evaluation, J. Geophys. Res.-Atmos., 105, 15365–15377, https://doi.org/10.1029/2000JD900185, 2000.
Friedrich, N., Tadic, I., Schuladen, J., Brooks, J., Darbyshire, E., Drewnick, F., Fischer, H., Lelieveld, J., and Crowley, J. N.: Measurement of NOx and NOy with a thermal dissociation cavity ring-down spectrometer (TD-CRDS): instrument characterisation and first deployment, Atmos. Meas. Tech., 13, 5739–5761, https://doi.org/10.5194/amt-13-5739-2020, 2020.
Ganzeveld, L. and Lelieveld, J.: Dry deposition parameterization in a chemistry general circulation model and its influence on the distribution of reactive trace gases, J. Geophys. Res.-Atmos., 100, 20999–21012, https://doi.org/10.1029/95JD02266, 1995.
Gessler, A., Rienks, M., and Rennenberg, H.: NH3 and NO2 fluxes between beech trees and the atmosphere – correlation with climatic and physiological parameters, New Phytol., 147, 539–560, https://doi.org/10.1046/j.1469-8137.2000.00712.x, 2000.
Geyer, A. and Stutz, J.: Vertical profiles of NO3, N2O5, O3, and NOx in the nocturnal boundary layer: 2. Model studies on the altitude dependence of composition and chemistry (vol. 109, art. no. D16399, 2004), J. Geophys. Res.-Atmos., 109, D16399, https://doi.org/10.1029/2004JD005217, 2004.
Hallquist, M., Wenger, J. C., Baltensperger, U., Rudich, Y., Simpson, D., Claeys, M., Dommen, J., Donahue, N. M., George, C., Goldstein, A. H., Hamilton, J. F., Herrmann, H., Hoffmann, T., Iinuma, Y., Jang, M., Jenkin, M. E., Jimenez, J. L., Kiendler-Scharr, A., Maenhaut, W., McFiggans, G., Mentel, Th. F., Monod, A., Prévôt, A. S. H., Seinfeld, J. H., Surratt, J. D., Szmigielski, R., and Wildt, J.: The formation, properties and impact of secondary organic aerosol: current and emerging issues, Atmos. Chem. Phys., 9, 5155–5236, https://doi.org/10.5194/acp-9-5155-2009, 2009.
Heland, J., Kleffmann, J., Kurtenbach, R., and Wiesen, P.: A new instrument to measure gaseous nitrous acid (HONO) in the atmosphere, Environ. Sci. Technol., 35, 3207–3212, https://doi.org/10.1021/es000303t, 2001.
Hens, K., Novelli, A., Martinez, M., Auld, J., Axinte, R., Bohn, B., Fischer, H., Keronen, P., Kubistin, D., Nölscher, A. C., Oswald, R., Paasonen, P., Petäjä, T., Regelin, E., Sander, R., Sinha, V., Sipilä, M., Taraborrelli, D., Tatum Ernest, C., Williams, J., Lelieveld, J., and Harder, H.: Observation and modelling of HOx radicals in a boreal forest, Atmos. Chem. Phys., 14, 8723–8747, https://doi.org/10.5194/acp-14-8723-2014, 2014.
Horii, C. V., Munger, J. W., Wofsy, S. C., Zahniser, M., Nelson, D., and McManus, J. B.: Fluxes of nitrogen oxides over a temperate deciduous forest, J. Geophys. Res.-Atmos., 109, D08305, https://doi.org/10.1029/2003JD004326, 2004.
Jaeglé, L., Steinberger, L., Martin, R. V., and Chance, K.: Global partitioning of NOx sources using satellite observations: Relative roles of fossil fuel combustion, biomass burning and soil emissions, Faraday Discuss., 130, 407–423, https://doi.org/10.1039/B502128F, 2005.
Kanakidou, M., Seinfeld, J. H., Pandis, S. N., Barnes, I., Dentener, F. J., Facchini, M. C., Van Dingenen, R., Ervens, B., Nenes, A., Nielsen, C. J., Swietlicki, E., Putaud, J. P., Balkanski, Y., Fuzzi, S., Horth, J., Moortgat, G. K., Winterhalter, R., Myhre, C. E. L., Tsigaridis, K., Vignati, E., Stephanou, E. G., and Wilson, J.: Organic aerosol and global climate modelling: a review, Atmos. Chem. Phys., 5, 1053–1123, https://doi.org/10.5194/acp-5-1053-2005, 2005.
Kane, S. M., Caloz, F., and Leu, M. T.: Heterogeneous uptake of gaseous N2O5 by (NH4)2SO4, NH4HSO4, and H2SO4 aerosols, J. Phys. Chem. A, 105, 6465–6470, 2001.
Kiendler-Scharr, A., Mensah, A. A., Friese, E., Topping, D., Nemitz, E., Prevot, A. S. H., Aijala, M., Allan, J., Canonaco, F., Canagaratna, M., Carbone, S., Crippa, M., Dall Osto, M., Day, D. A., De Carlo, P., Di Marco, C. F., Elbern, H., Eriksson, A., Freney, E., Hao, L., Herrmann, H., Hildebrandt, L., Hillamo, R., Jimenez, J. L., Laaksonen, A., McFiggans, G., Mohr, C., O'Dowd, C., Otjes, R., Ovadnevaite, J., Pandis, S. N., Poulain, L., Schlag, P., Sellegri, K., Swietlicki, E., Tiitta, P., Vermeulen, A., Wahner, A., Worsnop, D., and Wu, H. C.: Ubiquity of organic nitrates from nighttime chemistry in the European submicron aerosol, Geophys. Res. Lett., 43, 7735–7744, https://doi.org/10.1002/2016gl069239, 2016.
Kleffmann, J., Lörzer, J. C., Wiesen, P., Kern, C., Trick, S., Volkamer, R., Rodenas, M., and Wirtz, K.: Intercomparison of the DOAS and LOPAP techniques for the detection of nitrous acid (HONO), Atmos. Environ., 40, 3640–3652, https://doi.org/10.1016/j.atmosenv.2006.03.027, 2006.
Kukui, A.: ACROSS_LPC2E_Rambforest_RO2_L2 [data set], https://doi.org/10.25326/509, 2023.
Kukui, A., Ancellet, G., and Le Bras, G.: Chemical ionisation mass spectrometer for measurements of OH and Peroxy radical concentrations in moderately polluted atmospheres, J. Atmos. Chem., 61, 133–154, https://doi.org/10.1007/s10874-009-9130-9, 2008.
Kurpius, M. R. and Goldstein, A. H.: Gas-phase chemistry dominates O3 loss to a forest, implying a source of aerosols and hydroxyl radicals to the atmosphere, Geophys. Res. Lett., 30, 1371, https://doi.org/10.1029/2002gl016785, 2003.
Liebmann, J., Sobanski, N., Schuladen, J., Karu, E., Hellén, H., Hakola, H., Zha, Q., Ehn, M., Riva, M., Heikkinen, L., Williams, J., Fischer, H., Lelieveld, J., and Crowley, J. N.: Alkyl nitrates in the boreal forest: formation via the NO3-, OH- and O3-induced oxidation of biogenic volatile organic compounds and ambient lifetimes, Atmos. Chem. Phys., 19, 10391–10403, https://doi.org/10.5194/acp-19-10391-2019, 2019.
Liebmann, J. M., Muller, J. B. A., Kubistin, D., Claude, A., Holla, R., Plass-Dülmer, C., Lelieveld, J., and Crowley, J. N.: Direct measurements of NO3 reactivity in and above the boundary layer of a mountaintop site: identification of reactive trace gases and comparison with OH reactivity, Atmos. Chem. Phys., 18, 12045–12059, https://doi.org/10.5194/acp-18-12045-2018, 2018.
Lightfoot, P. D., Cox, R. A., Crowley, J. N., Destriau, M., Hayman, G. D., Jenkin, M. E., Moortgat, G. K., and Zabel, F.: Organic peroxy radicals – kinetics, spectroscopy and tropospheric chemistry, Atmos. Environ. A-Gen., 26, 1805–1961, 1992.
Meusel, H., Kuhn, U., Reiffs, A., Mallik, C., Harder, H., Martinez, M., Schuladen, J., Bohn, B., Parchatka, U., Crowley, J. N., Fischer, H., Tomsche, L., Novelli, A., Hoffmann, T., Janssen, R. H. H., Hartogensis, O., Pikridas, M., Vrekoussis, M., Bourtsoukidis, E., Weber, B., Lelieveld, J., Williams, J., Pöschl, U., Cheng, Y., and Su, H.: Daytime formation of nitrous acid at a coastal remote site in Cyprus indicating a common ground source of atmospheric HONO and NO, Atmos. Chem. Phys., 16, 14475–14493, https://doi.org/10.5194/acp-16-14475-2016, 2016.
Padro, J.: Seasonal contrasts in modelled and observed dry deposition velocities of O3, SO2 and NO2 over three surfaces, Atmos. Environ. A-Gen., 27, 807–814, https://doi.org/10.1016/0960-1686(93)90002-G, 1993.
Padro, J.: Summary of ozone dry deposition velocity measurements and model estimates over vineyard, cotton, grass and deciduous forest in summer, Atmos. Environ., 30, 2363–2369, https://doi.org/10.1016/1352-2310(95)00352-5, 1996.
Phillips, G. J., Tang, M. J., Thieser, J., Brickwedde, B., Schuster, G., Bohn, B., Lelieveld, J., and Crowley, J. N.: Significant concentrations of nitryl chloride observed in rural continental Europe associated with the influence of sea salt chloride and anthropogenic emissions, Geophys. Res. Lett., 39, L10811, https://doi.org/10.1029/2012GL051912, 2012.
Phillips, G. J., Makkonen, U., Schuster, G., Sobanski, N., Hakola, H., and Crowley, J. N.: The detection of nocturnal N2O5 as HNO3 by alkali- and aqueous-denuder techniques, Atmos. Meas. Tech., 6, 231–237, https://doi.org/10.5194/amt-6-231-2013, 2013.
Pilegaard, K.: Processes regulating nitric oxide emissions from soils, Philos. T. Roy. Soc. B, 368, 20130126, https://doi.org/10.1098/rstb.2013.0126, 2013.
Pilegaard, K., Skiba, U., Ambus, P., Beier, C., Brüggemann, N., Butterbach-Bahl, K., Dick, J., Dorsey, J., Duyzer, J., Gallagher, M., Gasche, R., Horvath, L., Kitzler, B., Leip, A., Pihlatie, M. K., Rosenkranz, P., Seufert, G., Vesala, T., Westrate, H., and Zechmeister-Boltenstern, S.: Factors controlling regional differences in forest soil emission of nitrogen oxides (NO and N2O), Biogeosciences, 3, 651–661, https://doi.org/10.5194/bg-3-651-2006, 2006.
Puxbaum, H. and Gregori, M.: Seasonal and annual deposition rates of sulphur, nitrogen and chloride species to an oak forest in north-eastern austria (Wolkersdorf, 240 m a.s.l.), Atmos. Environ., 32, 3557–3568, https://doi.org/10.1016/S1352-2310(98)00073-9, 1998.
Rannik, Ü., Altimir, N., Mammarella, I., Bäck, J., Rinne, J., Ruuskanen, T. M., Hari, P., Vesala, T., and Kulmala, M.: Ozone deposition into a boreal forest over a decade of observations: evaluating deposition partitioning and driving variables, Atmos. Chem. Phys., 12, 12165–12182, https://doi.org/10.5194/acp-12-12165-2012, 2012.
Romer Present, P. S., Zare, A., and Cohen, R. C.: The changing role of organic nitrates in the removal and transport of NOx, Atmos. Chem. Phys., 20, 267–279, https://doi.org/10.5194/acp-20-267-2020, 2020.
Rondón, A., Johansson, C., and Granat, L.: Dry deposition of nitrogen dioxide and ozone to coniferous forests, J. Geophys. Res.-Atmos., 98, 5159–5172, https://doi.org/10.1029/92JD02335, 1993.
Rosenkranz, P., Brüggemann, N., Papen, H., Xu, Z., Horváth, L., and Butterbach-Bahl, K.: Soil N and C trace gas fluxes and microbial soil N turnover in a sessile oak (Quercus petraea (Matt.) Liebl.) forest in Hungary, Plant Soil, 286, 301–322, https://doi.org/10.1007/s11104-006-9045-z, 2006.
Schindlbacher, A., Zechmeister-Boltenstern, S., and Butterbach-Bahl, K.: Effects of soil moisture and temperature on NO, NO2, and N2O emissions from European forest soils, J. Geophys. Res.-Atmos., 109, D17302, https://doi.org/10.1029/2004JD004590, 2004.
Schumann, U. and Huntrieser, H.: The global lightning-induced nitrogen oxides source, Atmos. Chem. Phys., 7, 3823–3907, https://doi.org/10.5194/acp-7-3823-2007, 2007.
Shepson, P. B., Bottenheim, J. W., Hastie, D. R., and Venkatram, A.: Determination of the relative ozone and PAN deposition velocities at night, Geophys. Res. Lett., 19, 1121–1124, https://doi.org/10.1029/92gl01118, 1992.
Sobanski, N., Schuladen, J., Schuster, G., Lelieveld, J., and Crowley, J. N.: A five-channel cavity ring-down spectrometer for the detection of NO2, NO3, N2O5, total peroxy nitrates and total alkyl nitrates, Atmos. Meas. Tech., 9, 5103–5118, https://doi.org/10.5194/amt-9-5103-2016, 2016.
Stutz, J., Alicke, B., Ackermann, R., Geyer, A., White, A., and Williams, E.: Vertical profiles of NO3, N2O5, O3, and NOX in the nocturnal boundary layer: 1. Observations during the Texas Air Quality Study 2000, J. Geophys. Res.-Atmos., 109, D12306, https://doi.org/10.1029/2003JD004209, 2004.
Thoene, B., Rennenberg, H., and Weber, P.: Absorption of atmospheric NO2 by spruce (Picea abies) trees, New Phytol., 134, 257–266, https://doi.org/10.1111/j.1469-8137.1996.tb04630.x, 1996.
Val Martin, M., Honrath, R. E., Owen, R. C., and Lapina, K.: Large-scale impacts of anthropogenic pollution and boreal wildfires on the nitrogen oxides over the central North Atlantic region, J. Geophys. Res.-Atmos., 113, D17308, https://doi.org/10.1029/2007JD009689, 2008.
Weber, P. and Rennenberg, H.: Dependency of nitrogen dioxide (NO2) fluxes to wheat (Triticum aestivum L.) leaves from NO2 concentration, light intensity, temperature and relative humidity determined from controlled dynamic chamber experiments, Atmos. Environ., 30, 3001–3009, https://doi.org/10.1016/1352-2310(96)00008-8, 1996.
Wu, Z., Staebler, R., Vet, R., and Zhang, L.: Dry deposition of O3 and SO2 estimated from gradient measurements above a temperate mixed forest, Environ. Pollut., 210, 202–210, https://doi.org/10.1016/j.envpol.2015.11.052, 2016.
Xue, C., McGillen, M., and Mellouki, A.: ACROSS_ICARE_RambForest_HONO_L2 [data set], https://doi.org/10.25326/709, 2023a.
Xue, C., McGillen, M., and Mellouki, A.: ACROSS_ICARE_RambForest_NO_L2 [data set], https://doi.org/10.25326/512, 2023b.
Zhou, P., Ganzeveld, L., Rannik, Ü., Zhou, L., Gierens, R., Taipale, D., Mammarella, I., and Boy, M.: Simulating ozone dry deposition at a boreal forest with a multi-layer canopy deposition model, Atmos. Chem. Phys., 17, 1361–1379, https://doi.org/10.5194/acp-17-1361-2017, 2017.