the Creative Commons Attribution 4.0 License.
the Creative Commons Attribution 4.0 License.
 | 16 Oct 2024
Measurement report: Intra-annual variability of black carbon and brown carbon and their interrelation with meteorological conditions over Gangtok, Sikkim
Pramod Kumar
Khushboo Sharma
Ankita Malu
Rajeev Rajak
Aparna Gupta
Bidyutjyoti Baruah
Shailesh Yadav
Thupstan Angchuk
Jayant Sharma
Anil Kumar Misra
Nishchal Wanjari
Black carbon (BC) and brown carbon (BrC) both have a versatile nature, and they have an apparent role in climate variability and changes. As anthropogenic activity is surging, BC and BrC are also reportedly increasing. So, the monitoring of BC and BrC and observations of land use land cover change (LULCC) at a regional level are necessary for the changes in various interconnected meteorological phenomena. The current study investigates BC, BrC, CO2, BC from fossil fuels (BCff), BC from biomass burning (BCbb), and LULCC and their relationship to the corresponding meteorological conditions over Gangtok in the Sikkim Himalayan region. The concentration of BC (BrC) was found to be highest during March 2022 (April 2021) at 43.5 µg m−3 (32.0 µg m−3). Surface pressure exhibits a significant positive correlation with BC, BCff, BCbb, and BrC. Higher surface pressure results in a calmer and more stable boundary layer, which effectively retains deposited contaminants. Conversely, the wind appears to facilitate the dispersion of pollutants, showing a strong negative correlation. The fact that all pollutants and precipitation have been shown to behave similarly points to moist scavenging of the pollutants. Despite the dense cloud cover, it is clear that the area is not receiving convective precipitation, implying that orographic precipitation is occurring over the region. Most of Sikkim receives convective rain from May to September, indicating that the region has significant convective activity contributed from the Bay of Bengal during the monsoon season. Furthermore, monsoon months have the lowest concentrations of BC, BCbb, BCff, and BrC, suggesting the potential of convective rain (as rainout scavenging) to remove most of the pollutants.
- Article
(6515 KB) - Full-text XML
-
Supplement
(1931 KB) - BibTeX
- EndNote


Black carbon (BC) and brown carbon (BrC) are components of fine particulate matter in air pollution, which has a deceptive role in climate variability and change. BC and BrC are short-lived climate pollutants with a lifetime of only days to weeks after release into the atmosphere (Pierrehumbert, 2014). During this short period of time, BC and BrC can have significant direct and indirect impacts on the climate, the cryosphere, agriculture, and human health (Shindell et al., 2012). BC and BrC consist of pure carbon in several interconnected forms. BC is formed through the incomplete combustion of fossil fuels, biofuel, and biomass and is one of the main types of particles in both anthropogenic and naturally occurring soot (Bond et al., 2004). BrC in the atmosphere has been attributed to the burning of biomass and fossil fuels; the biogenic release of fungi, plant debris, and humic matter; and multiphase reactions between gas-phase, particulate, and cloud microdroplet constituents in the atmosphere (Laskin et al., 2015). BC and BrC are transported from their source to many locations across the world (Ramanathan and Carmichael, 2008). The BC and BrC released into the atmosphere exhibit a vertical distribution and follow the prevailing wind speed and direction. They engage with various atmospheric components before eventually settling on the Earth's surface through either wet or dry deposition processes. Their hygroscopic properties render them more prone to cloud seeding and cloud formation, thereby contributing directly to the precipitation mechanism in regions with high humidity (Stevens and Feingold, 2009). In addition, they absorb both incoming and outgoing radiation. Atmospheric BC and BrC modify radiative forcing; disturb atmospheric stability, regional circulation, and rainfall patterns; affect cloud albedo; cause material damage; reduce agricultural productivity; degrade the ecosystem; and affect human health (Zhang et al., 2013). However, due to an insufficiency of observations, BrC is one of the least understood and uncertain warming agents (Yue et al., 2022). Numerous studies have been conducted to analyse the global distribution of BC and BrC, including research focused on these species within India as well (Reddy and Venkataraman, 2002a, b; Venkataraman et al., 2006; Park et al., 2010; Sloss, 2012; Helin et al., 2021; R. R. Kumar et al., 2020; Watham et al., 2021; Bhat et al., 2022; Runa et al., 2022; Yue et al., 2022; P. Kumar et al., 2018). However, the overall worldwide BC emission is estimated to be 4800–7200 Gg yr−1 (Klimont et al., 2017). In 2001, India's total BC emissions were projected to be 1343.78 Gg (Sloss, 2012). Residential fuel burning and transportation contribute a maximum to the global anthropogenic BC emission (Helin et al., 2021). About 60 % to 80 % of residential fuel (coal and biomass) emissions are reported from Asian and African countries, whereas approximately 70 % of diesel engine emissions are found to be from Europe, North America, and Latin America (Johnson et al., 2019; Ayompe et al., 2021; Adeeyo et al., 2022; Sun et al., 2022).
On the other hand, emissions on the Indian subcontinent have increased by 40 % since the year 2000 (Kurokawa and Ohara, 2020; Sun et al., 2022). According to Reddy and Venkataraman (2002a, b), the estimated BC emissions in India are fossil fuels (100 Gg), biofuel (207 Gg), and open burning (39 Gg) with a climatic forcing of +1.1 W m−2. Black carbon is the second-most-significant human emission in the current atmosphere (Sharma et al., 2022). BC concentration was measured by Zhao et al. (2017) in the south-eastern Tibetan Plateau (TP). Daily mean BC loadings ranged from 57.7 to 5368.9 ng m−3, demonstrating a high BC burden even at free-tropospheric altitudes (Zhao et al., 2017). Black carbon (BC) deposition was estimated at the Nepal Climate Observatory at Pyramid (NCO-P) site in the Himalayan region during the pre-monsoon season (March–May). A total BC deposition rate of 2.89 was estimated, resulting in a total deposition of 266 µg m−3 for March–May (Yasunari et al., 2010). From the Indian perspective, several key short-term incidents have contributed to a rise in India's BC concentration from biomass burning and other sources (R. R. Kumar et al., 2020). Burning agricultural waste (stubble) is widespread in India and several other nations. Many studies suggest that increased BC in northern India, notably the Indo-Gangetic Plain (IGP), is the global absorbing aerosol hotspot (Venkataraman et al., 2006; Ramanathan and Carmichael, 2008). In India, post-monsoon paddy crop waste burning occurs in the months of October and November in the north and north-west parts of India (Venkataraman et al., 2006). In the north-western IGP (especially Punjab, Haryana, and western Uttar Pradesh), stubble burning is a popular practice (Venkataraman et al., 2006). Long-distance transport of BC aerosols, mostly from Asia to the North Pacific and South America to the south-west Atlantic, is often recognised as a significant factor in local concentration (Evangelista et al., 2007). However, in India, only local sources (89 %) affect BC concentrations (Zhang et al., 2013), as there is not much movement of transboundary aerosols over the IGP (M. Kumar et al., 2018; Kedia et al., 2014; Ramachandran and Rupakheti, 2022; Ramachandran et al., 2020). Both marine and continental air masses contributed to total aerosol loading over the central IGP (Kumar et al., 2017; Shukla et al., 2022).
Black carbon is a light-absorbing particle that is released into the atmosphere directly in the form of ultrafine (< 0.1 µm) to fine particles (< 2.5 µm) (Gupta et al., 2017). BC is a good tracer for particle deposition as it is non-volatile, insoluble, and chemically inert, and it can also mix well with other aerosol species in the atmosphere (Kiran et al., 2018). As a result, BC deposition data are important, not just for BC sinks but also for a broader understanding of aerosol deposition. BC emissions are mostly influenced by significant changes in the energy sector, fuel usage, and industrial expansion and an increase in the number of vehicles (Bisht et al., 2015). Residential fuels like wood, agricultural waste, and cow dung used for cooking and biomass usage for home purposes are the primary sources of BC emissions (Venkataraman et al., 2006). The Asian mainland is a substantial contributor to global BC emissions and has been identified as a hotspot (Gupta et al., 2017). BC has a high absorption ability, accounting for 90 %–95 % of total atmospheric aerosol absorption (Hansen et al., 1984). It can absorb solar energy in the visible–infrared band and warm the environment. In comparison to carbon dioxide, BC has a much shorter life cycle in the atmosphere. As a result, mitigation or reduction has a greater positive impact on the atmosphere (Kirchstetter et al., 2004; Takemura and Suzuki, 2019). Changing land use land cover (LULC) has a very significant impact on weather, climate, and aerosols (Mahmood et al., 2010). It is a well-established fact that land use land cover change (LULCC) is directly related to land surface temperature, vehicular emission, and anthropogenic activity (Aithal et al., 2019). This motivated the present study for further analysis of LULCC in the Sikkim region and its relation with temperature and BC and BrC for March 2021–March 2022. The current study's objectives are to assess the intra-annual variability of black and brown carbon (BC and BrC) (diurnal, daily, monthly) during the study period March 2021 to March 2022 and the interrelationship between meteorological conditions and BC and BrC, along with LULCC for 3 decades (2000, 2010, and 2020) and its relationship with anthropogenic activity over Gangtok.
The Gangtok Municipal Corporation (GMC) has been selected for the present study on the basis of its urban exposure and settlement change for 3 decades, as well as congruent temperature rise (Fig. S1 in the Supplement). The sampling was carried out in the Pani House area in Gangtok, GMC, with a latitude of 27.323° N and a longitude of 88.609° E. Sikkim is surrounded by Nepal, China, and Bhutan from the west, north, and east, respectively, and is part of the Trans-Himalaya and Greater Himalayan range. Moreover, Sikkim has one of the most fragile forest covers. However, Gangtok is a densely populated city and the capital of the state of Sikkim; it is situated in the East Sikkim district (see Fig. 1a). The population of Sikkim has been found to have increased as per the Indian census for 3 decades, as can be seen in Table S1 in the Supplement.
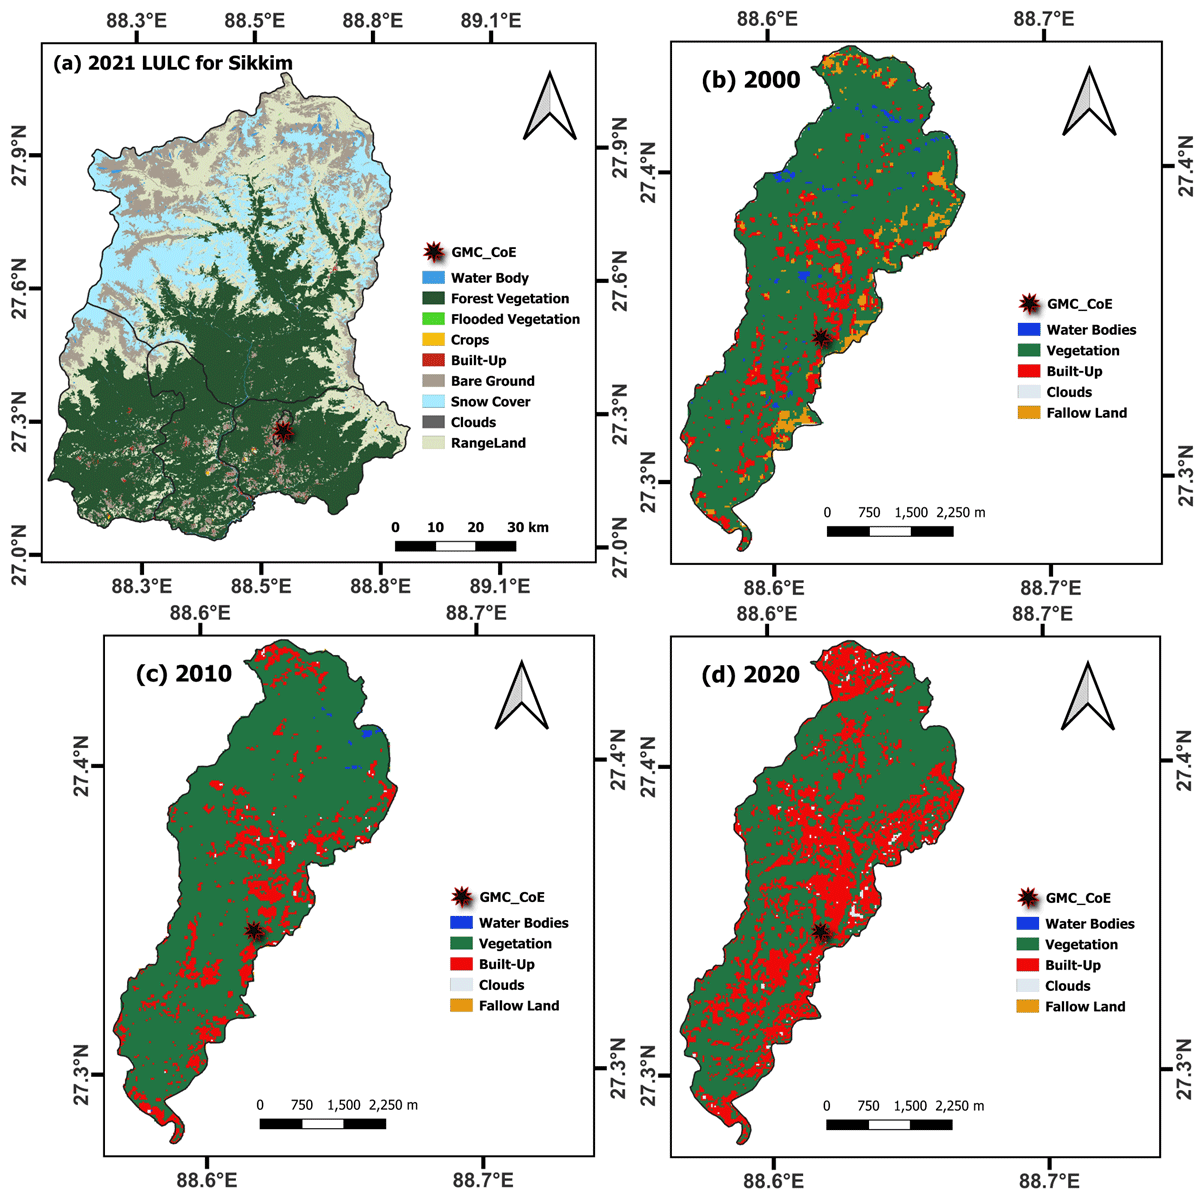
Figure 1The study location and land use land cover for 2000, 2010, 2020, and 2021 for December over Gangtok and the Sikkim region using Landsat-5, Landsat-8, and Sentinel-2 datasets.
2.1 Data and methodology
The real-time sampling of BC was carried out from 10 March 2021 to 17 March 2022 at Gangtok using the seven-channel dual-spot aethalometer (Model AE-33-7, Magee Scientific, USA). The Aethalometer AE-33 is an aerosol instrument with a detection limit of < 0.005 µg m−3 for a 1 h period and a measuring range of 0.01 to 100 µg m−3. It has a programmable measuring frequency of 1 s or 1 min and a programmable flow rate of 2 to 5 lpm. The data were collected for the measurement of BC and BrC associated with particulate matter with an aerodynamic diameter of less than 2.5 µm (PM2.5). The concentrations of BC, BrC, BCbb, and BCff have been estimated by the Carbonaceous Aerosol Analysis Tools (CAAT) software tool from the Magee Scientific Aethalometer, model AE33 (Hansen and Schnell, 2005). The carbon dioxide (CO2) was measured using a CO2 sensor (Vaisala-GMP343), which is attached to the aethalometer. The inlet of the aethalometer was mounted at a height of 15 m above ground level. One of the main sources of uncertainty in utilising aerosol absorption measurements to estimate the BrC absorption coefficient at 370 nm is the potential contribution of other species, such as black carbon and dust, to the measured absorption. This can result in an overestimation of BrC mass concentration, especially in environments where these species coexist. However, the Sikkim region stands out for having one of the highest precipitation levels globally and a minimal dust pollution contribution. Consequently, there is likely to be less over- or underestimation. Therefore, in this study, mass concentration was employed to address these uncertainties.
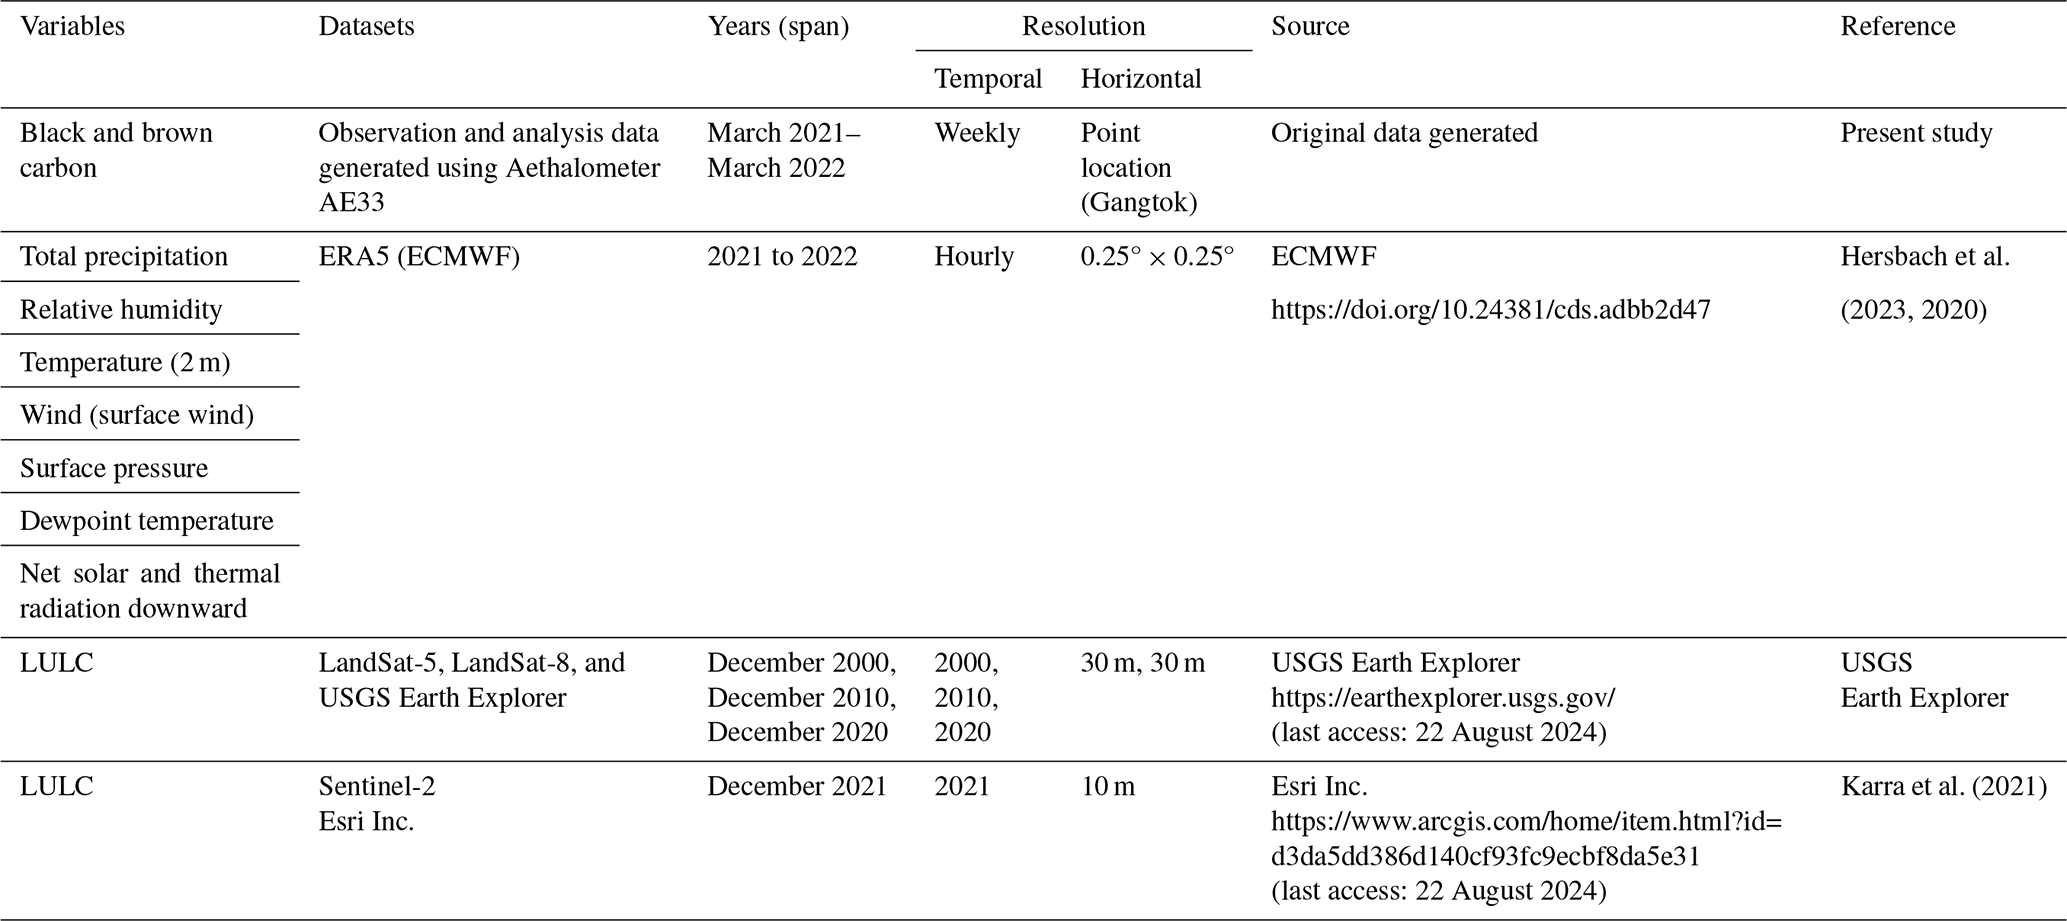
A new dataset of BC, BrC, black carbon from biomass burning (BCbb), black carbon from fossil fuels (BCff), the percentage contribution of biomass burning to BC (BB %), and CO2 has been generated over the unreported region of Sikkim Himalaya. The diurnal and monthly datasets of BC, BCbb, BCff, BrC, BB %, and CO2 have been given in detail in Table S2 and S3 in the Supplement. In addition to this, the meteorological data have been selected for ERA5 reanalysis for the study. LULC data have been taken from USGS Earth Explorer of Landsat-5 data for 2000 and 2010, Landsat-8 data for 2020, and Sentinel-2 data for 2021 (Karra et al., 2021). LULC data have been chosen for the month of December to minimise the cloud cover. The details of the LULC calculation steps used are given in Sect. S1.3 in the Supplement. Brief details of the dataset are given in Table 1.
2.2 Estimation of BrC
Carbonaceous Aerosol Analysis Tools (CAAT) software from the Magee Scientific Aethalometer, model AE33, was utilised to estimate the concentrations of BC, BrC, BCbb, and BCff. The absorption coefficients of BC and BrC were determined using the multi-wavelength absorption coefficients provided by the aethalometer. The presence of BrC was identified by observing the maximum light absorption between 370–590 nm, but its absorption may increase significantly below this range depending on its composition. The attenuation of illumination measured in this study using the aethalometer was attributed solely to the contribution of BC and BrC. It is believed that the absorption coefficient at 370 nm measured by the aethalometer represents the combined absorption coefficients of BC and BrC, which is denoted as σBC+BrC (370 nm). This assumption is similar to the model used in the multi-wavelength absorbance analyser (MWAA) approach for source allocation, as described in Massabò et al. (2015). Equation (1) was used to calculate the σBrC (370 nm) absorption coefficient (Sect. S1 in the Supplement), which involved subtracting the contribution of BC (σBC, 370 nm) from the observed absorption coefficient (σBC+BrC (370 nm)).
The σBC (370 nm) was calculated by applying the power-law fit to absorption data in the 590–950 nm wavelength range provided in Eq. (1).
The absorption Ångström exponent of BC is denoted as AAEBC, with β being a constant value. As BC is a significant contributor to light absorption at wavelengths beyond 590 nm, the contribution of other aerosol species can be neglected, and AAEBC can be calculated using Eq. (3), as stated in Rathod and Sahu (2022). The AAE for both BC and BrC can be expressed as σ, and in this study, the AAE definition by Moosmüller et al. (2011) was used instead of the AAE specified for a wavelength pair. This value is determined by Eq. (3), which calculates the negative log–log slope of the absorption spectrum at wavelength λ.
Instead of the conventional approach where AAEBC is assumed to be 1, we utilised the AAEBC that was observed onsite to calculate σBC(λ). Equation (4) was employed to determine σBrC (370 nm) by substituting σBC(λ) at 370 nm, which was obtained using Eq. (2) (Wang et al., 2020), into Eq. (4) (refer to Sects. S1.1 and S1.2 and Fig. S2 in the Supplement for details).
To calculate σBrC(λ) at 470 nm and 520 nm, we can subtract the modelled BC from the measured absorption coefficients in a similar manner. It is worth noting that the BrC absorption coefficients are very low at wavelengths beyond 590 nm (Wang et al., 2020), according to Rathod et al. (2017) and Rathod and Sahu (2022); hence they are not taken into account (Sect. S1 in the Supplement; referred to Eqs. S1 to S13).
2.3 Data analysis
LULCC also has a direct impact on vehicular emissions and other anthropogenic activities. Urbanisation, conceivably, can lead to increased vehicle traffic and emissions, which can contribute to air pollution and climate change. Changes in land use can also affect the amount and type of vegetation, which can influence the carbon cycle and the amount of greenhouse gases in the atmosphere. ERA-5 reanalysis data have been used for meteorological analysis viz. wind pattern, precipitation, relative humidity, and temperature (Hersbach et al., 2020). The hourly data have been taken for the analysis, and then the daily, monthly, and seasonal averages have been computed for the study period over Sikkim and surrounding states for a better understanding of the meteorological conditions influencing the BC and BrC. The total precipitation is computed as a sum of the hourly data for a day to daily total precipitation and further, it was summed for monthly cumulative total precipitation using the sum formula as follows:
where i is the initial, n is the last date, and X is the hourly total precipitation taken from ERA5. The wind circulation has been computed using the u component and v component of wind and the wind speed, calculated as follows:
The temperature and relative humidity averaged have been computed using the mean formula as follows:
where i is the initial, and n is the last date of the variables such as temperature, relative humidity, and wind components.
Let x and y be two real-valued random variables such that the Spearman and Pearson correlation coefficients can be calculated between the BC and BrC and meteorological parameters. The coefficient of Pearson correlation (PCC) (Pearson, 1909; Benesty et al., 2009) is calculated as
where n is the population size of the variables used for the study.
Table 1 contains additional information about the dataset, and a more detailed methodology can be found in Sect. S1 in the Supplement.
Anthropogenic activities in Gangtok have drastically increased in the last 20 years. As evident from Fig. 1b–d, LULC has been changed from 2000 to 2020 over the Gangtok Municipal Corporation (GMC). Population change and growth have also been observed in the Sikkim (Table S1). LULC during the years 2000 and 2010 evidently shows that most of the fallow land has been built up due to a recent change in the policy of construction in Sikkim, suggesting urban settlement load over Gangtok has increased significantly. As a result, there has been a significant increase in built-up areas in the GMC for the last 20 years. The vegetation cover also reduced from 2000 to 2020 (Fig. 1b–d). The rainfed water bodies are reducing in the GMC. However, due to the seasonal nature of the regional water bodies, streams emerged less often in 2020, which perhaps shows the precipitation pattern alteration over the GMC due to the highly built-up sprawl. The built-up extent has been sprawling and consuming dense vegetation regions as well. This increases the study region's urge to be acknowledged so that Sikkim's future policymakers can consider the effects of rising anthropogenic activities. This anthropogenic activity leads to a heavy load on the environment over one of the cleanest states of India. Long-term spatiotemporal variation of 2 m air temperature justifies the LULCC and warming pattern (Chu et al., 2022) over the Gangtok region (Fig. S1a–e). The decadal warming rate is varying from 0.25 to 0.45 °C (Fig. S1e). BC and BrC over Gangtok have been measured to report the issue and attract more attention from the scientific and local community. The higher anthropogenic activity releases a higher amount of emission in the name of development due to the population load on the region (Shaddick et al., 2020) (i.e. the growth rate has risen from 12.89 % to 13.05 % in recent years) (Table S1). Diurnal variation of the BC, BrC, BCbb, BCff, and CO2 shows two peaks. BC, BCff, and CO2 have almost similar time of peaks observed. The first peak is found during 08:00–10:00 IST (India standard time), and the second peak is observed during 20:00–22:00 IST. However, BrC and BCbb have peak concentration during 10:00–11:00 and 18:00–20:00 IST (Fig. 2a), suggesting the peak biomass burning time over the region. The meteorological conditions observed are the low dewpoint, low temperature, high surface pressure, low wind speed, and high relative humidity during 08:00–10:00 IST, while the opposite is found in 20:00–22:00 IST; see Fig. 2b.
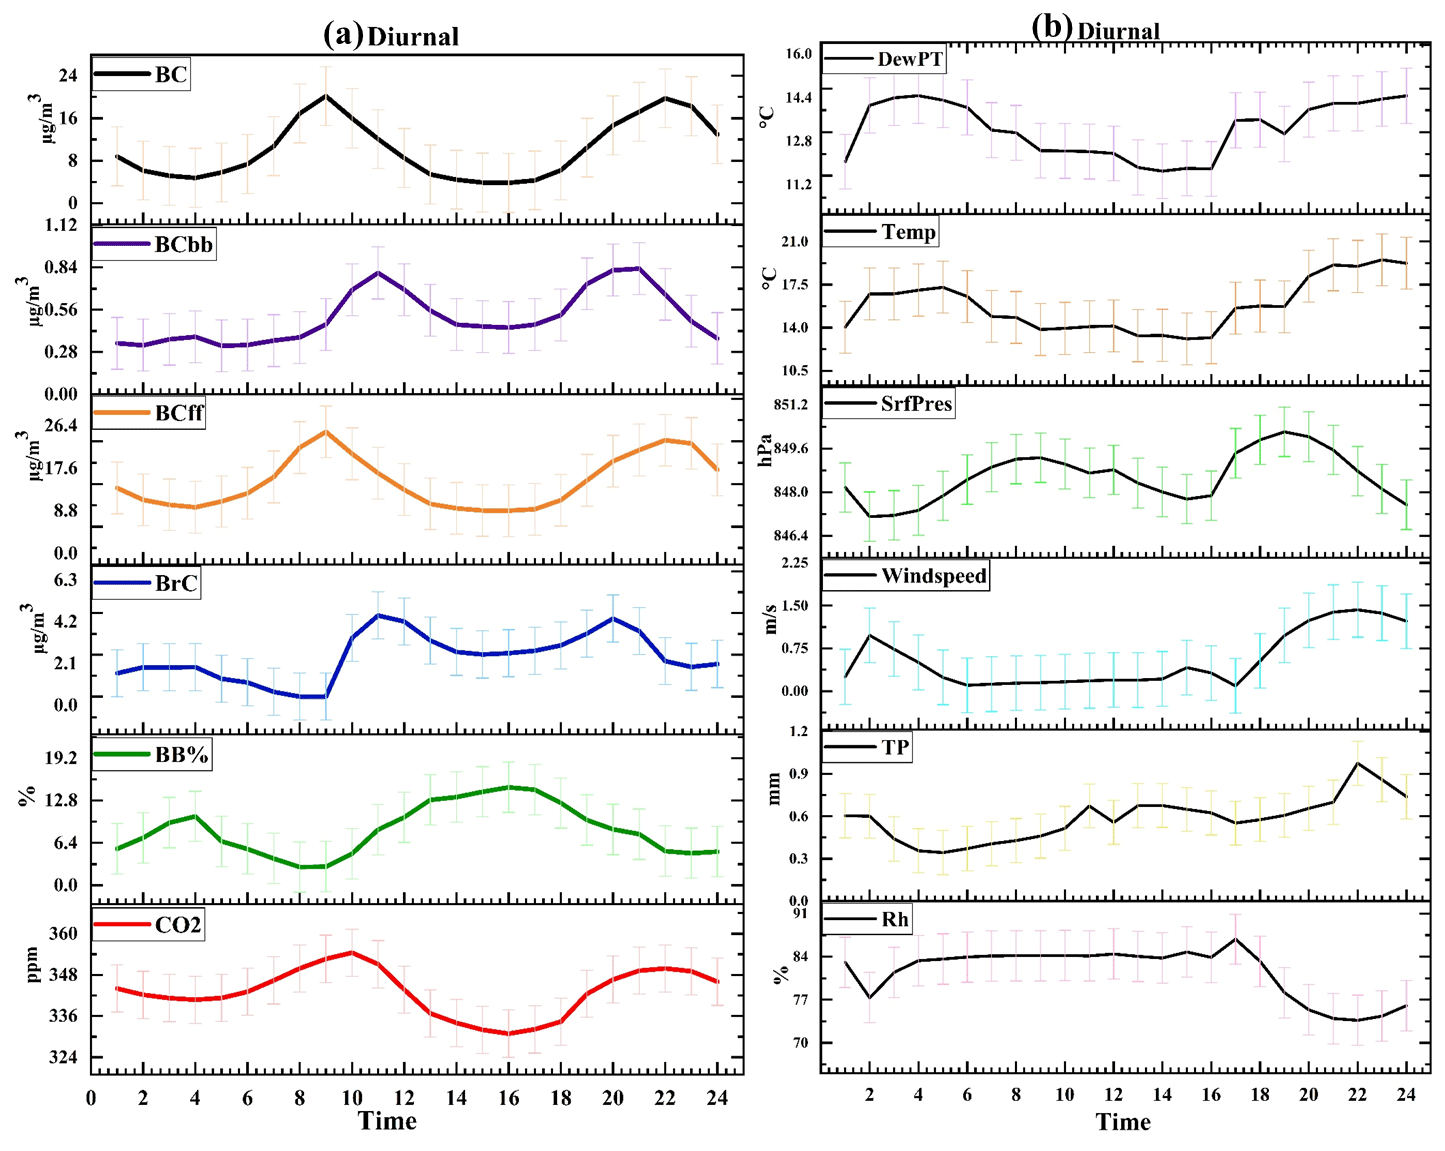
Figure 2(a) The hourly observation of black carbon, black carbon through biomass burning, black carbon through fossil fuel, brown carbon, biomass burning percentage, and carbon dioxide (BC, BCbb, BCff, BrC, BB %, and CO2, respectively) (BC, BCbb, BCff, and BrC are given in µg m−3; BB % in percent (%); and CO2 in parts per million (ppm)) for 16 March 2021 to 10 March 2022 over the study location (27.32° N, 88.61° E). The light colour shading refers to ± σ standard deviation for each variable. (b) Same as Fig. 2a but for meteorological parameters such as dewpoint temperature (DewPT), temperature (Temp), surface pressure (SrfPres), wind speed, total precipitation (TP), and relative humidity (RH) from 16 March 2021 to 10 March 2022.
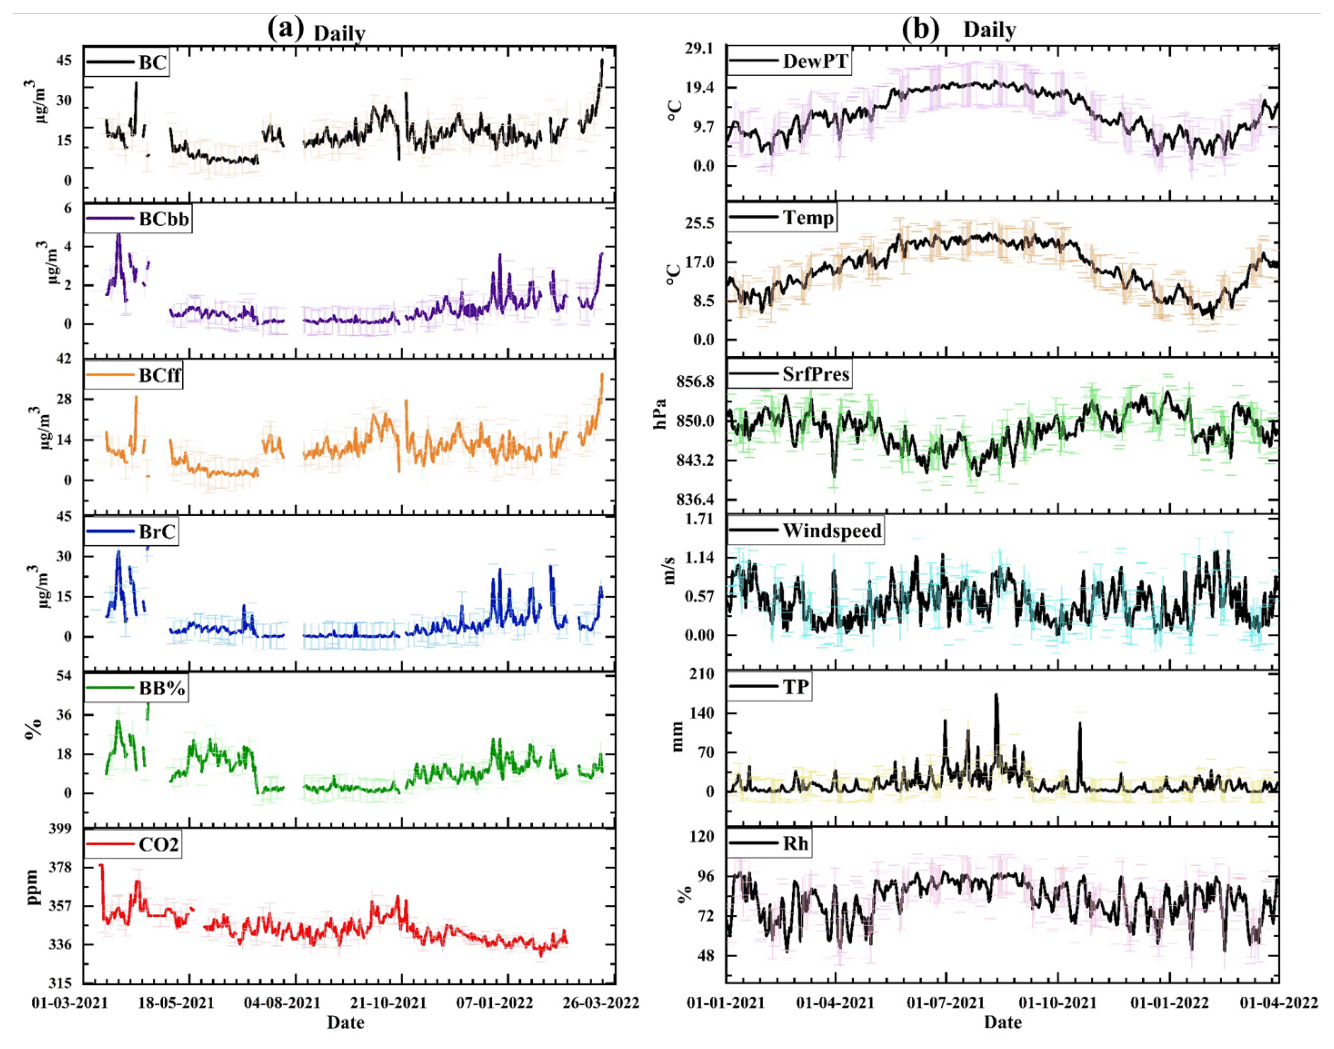
Figure 3(a) The daily mean of black carbon, black carbon through biomass burning, black carbon through fossil fuel, brown carbon, biomass burning percentage, and carbon dioxide (BC, BCbb, BCff, BrC, BB %, and CO2, respectively) (BC, BCbb, BCff, and BrC are given in µg m−3; BB % in percent (%); and CO2 in parts per million (ppm)) for 16 March 2021 to 10 March 2022 over the study location (27.32° N, 88.61° E). The light colour shading refers to ± σ standard deviation for each variable. (b) Same as Fig. 3a but for meteorological parameters such as dewpoint temperature (DewPT), temperature (Temp), surface pressure (SrfPres), wind speed, total precipitation (TP), and relative humidity (RH) from 1 January 2021 to 31 March 2022.
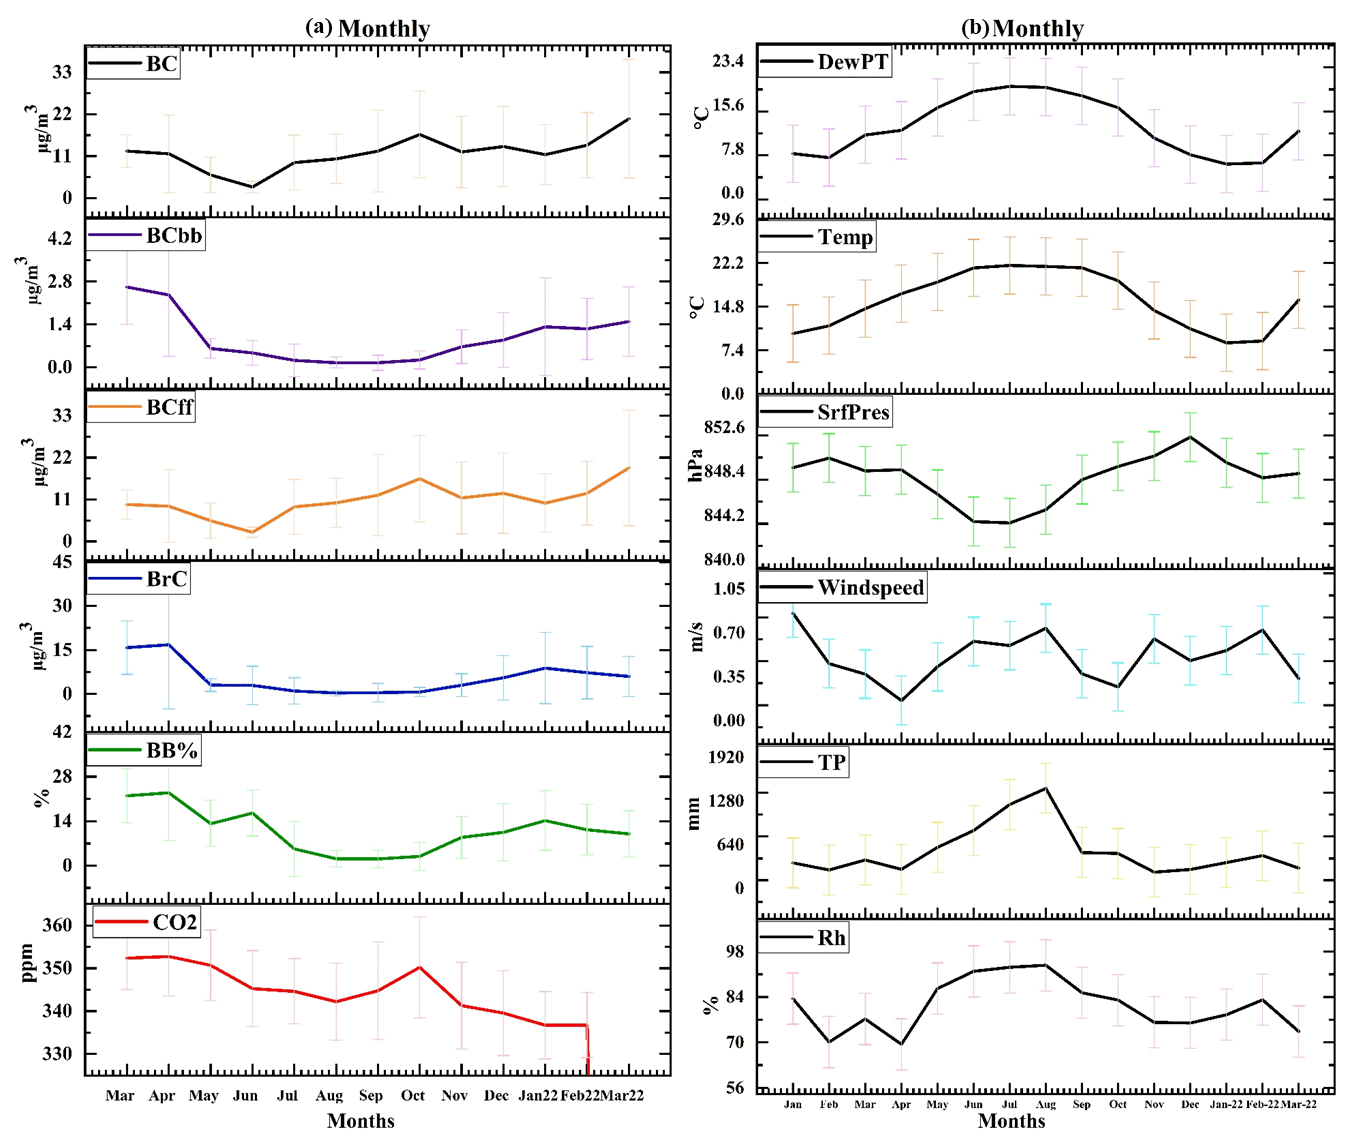
Figure 4(a) The monthly mean of black carbon, black carbon through biomass burning, black carbon through fossil fuel, brown carbon, biomass burning percentage, and carbon dioxide (BC, BCbb, BCff, BrC, BB %, and CO2, respectively) (BC, BCbb, BCff, and BrC are given in µg m−3; BB % in percent (%); and CO2 in parts per million (ppm)) for 16 March 2021 to 10 March 2022 over the study location (27.32° N, 88.61° E). The error bar shows ± σ standard deviation for each variable. (b) Same as Fig. 4a but for meteorological parameters such as dewpoint temperature (DewPT), temperature (Temp), surface pressure (SrfPres), wind speed, total precipitation (TP), and relative humidity (RH) during January 2021 to March 2022.
The daily time series of the BC, BCbb, BCff, BrC, BB %, and CO2 show the highest fluctuation from 20 to 30 March in both 2021 and 2022 years, respectively. The maximum BC (BrC) content was found in March 2022 (April 2021), at 43.5 µg m−3 (32 µg m−3). The lowest fluctuation is observed from 15 May to 15 September 2021 (Fig. 3a). The intense peaks of BC, BCff, and CO2 were observed from 10 October to 15 November 2021 (Fig. 3a), which may be linked to the heavy tourist season of the state and indicate the traffic overload in Gangtok (Sharma et al., 2022). The meteorological conditions also favour similar circumstances to accumulate the pollutant from 10 October to 15 November 2021 (Fig. 3b). The lowest surface pressure with minimum fluctuation and the highest temperature and dewpoint temperature with minimum fluctuation were noticed from 15 June to 20 September 2021 (Fig. 3b). BrC is found to be the highest, with significant variability from 10 January to 30 March, pointing to winter wood burning for livelihood, which is also supported by BCbb. The monthly variations of BC, BCbb, BCff, BrC, and BB % are discussed in Fig. 4a, and the highest value of standard deviation was observed during March 2022 for BC and BCff and during April 2021 for BCbb, BrC, and BB %. The CO2 is observed to be almost constant, with a small value of standard deviation. The maximum concentration of the BC and BCff is found in March 2022. However, BCbb and BrC were measured to be highest in April 2021. This is probably related to the high tourist season (i.e. vehicular emission) as well as random wood burning at higher-altitude regions surrounding Gangtok. The minimum concentration of the BrC was seen in the month of August 2021 as the highest total precipitation month with high wind speed, temperature dewpoint temperature, and relative humidity (Figs. 4b, and S3 and S4 in the Supplement) (Rana et al., 2023).
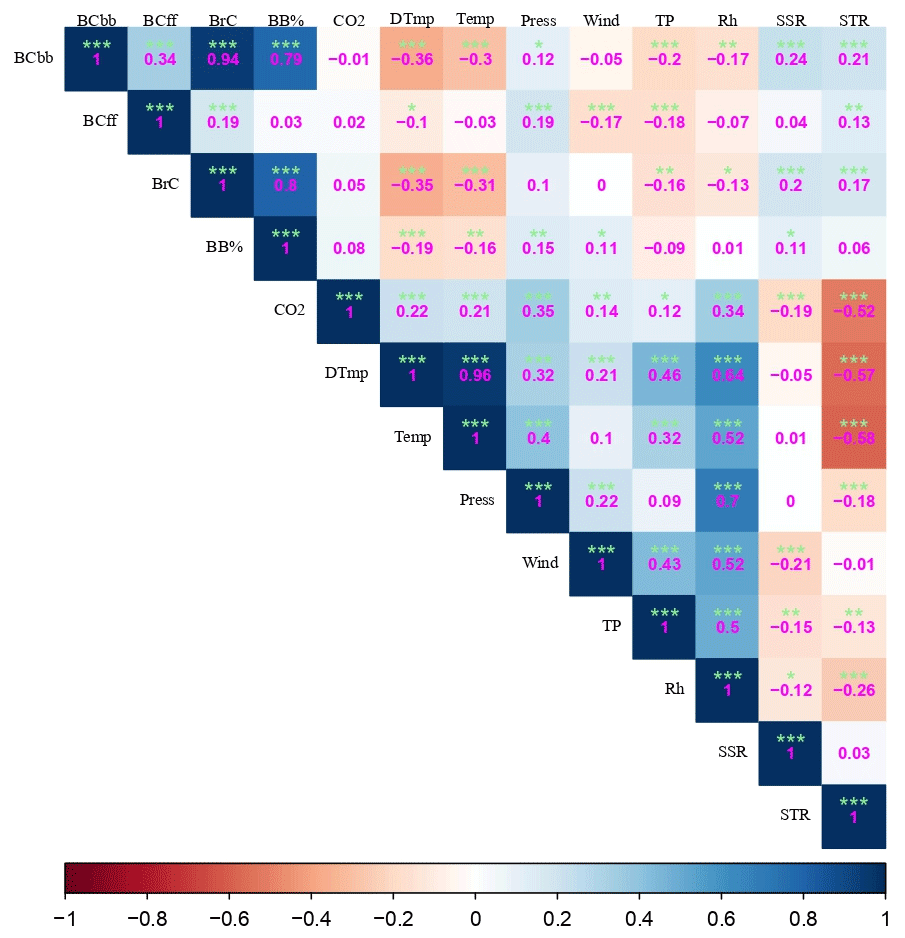
Figure 5Correlation among BCbb, BCff, BrC, BB %, CO2, dewpoint temperature (DTmp), temperature (Temp), surface pressure (Press), wind, total precipitation (TP), relative humidity (RH), net solar radiation (SSR), and net thermal radiation (STR). shows 99 % significance, shows 95 % significance, ∗ shows 90 % significance, and no asterisk shows no significance. The correlation coefficient values (−0.3 to −0.49) or (0.3 to 0.49) are considered a “good correlation”, and values ≤ (−0.5) or ≥ (0.5) are considered a “strong correlation”.
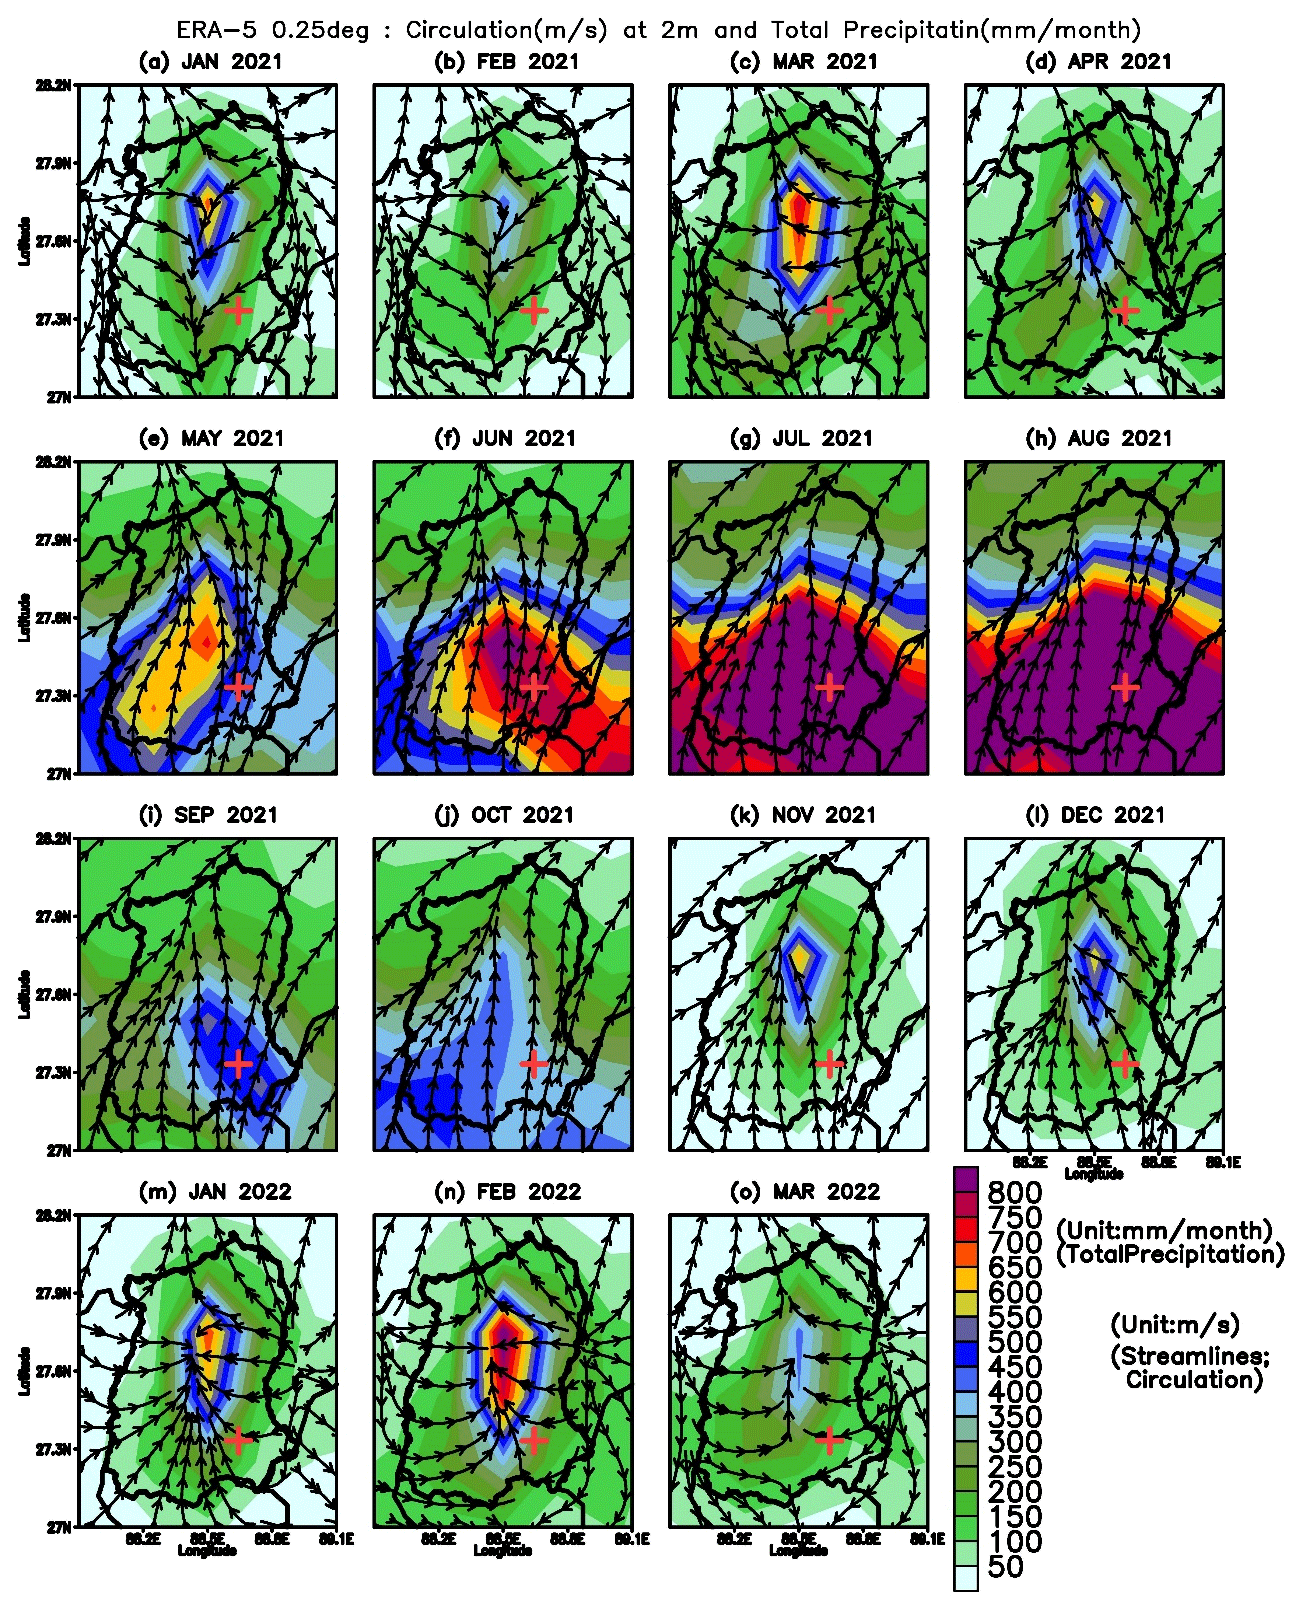
Figure 6Monthly total precipitation (cumulative) and wind circulation pattern during January 2021 to March 2022. The shading shows precipitation patterns, and the streamline shows wind circulation. The (+) mark is a representation of the sampling location.
The good correlation between BC and BCff showed that the primary source of BC is fossil fuel combustion (Osborne et al., 2008; Jung et al., 2021). A significant correlation between BCbb and BrC indicates that biomass burning is a major contributor to BrC (Prabhu et al., 2020), which is supported by the BB % and BrC (Fig. 5). The positive correlation between CO2 and BC and BCff suggests that fossil fuel burning is influencing the CO2 concentration (Rana et al., 2023). Dewpoint temperature and CO2 have a significant positive correlation, suggesting positive radiative forcing of CO2 (Huang et al., 2017; Stjern et al., 2023). A similar relationship has also been observed for temperature. BCbb and BrC and temperature have a significant negative correlation suggesting the negative radiative nature of the BCbb and BrC (Fig. S5 in the Supplement). Moreover, net thermal and solar radiation (STR and SSR) and BC and BrC have a significant positive correlation (Figs. 5 and S5) (Liu et al., 2020). A significant positive correlation between surface pressure and BC and BCff (BCbb and BrC ) has been observed (Fig. 5). Higher surface pressure creates calm conditions and a stable boundary layer, which keeps the pollutants accumulated in the boundary layer (Igarashi et al., 1988; Lee et al., 1995; Bharali et al., 2019; Liu et al., 2021). However, the opposite has been observed for the wind, indicating the dispersion of pollutants with a strong negative correlation. A similar relationship has been observed between total precipitation and all the pollutants, indicating the process of wet scavenging of pollutants (Yoo et al., 2014; Ohata et al., 2016; Ge et al., 2021; Wu et al., 2022). The relative humidity also shows a similar result to the total precipitation, with greater coefficient values. The negative correlation between total precipitation and surface pressure suggests that the rain falls over the region mostly occurs in a low-pressure system that is caused due to the vertical rising of an air parcel, causing condensation and precipitation (Johnson and Hamilton, 1988; Sarkar, 2018). Aerosols, including black carbon (BC) and absorbing organic aerosol (brown carbon, BrC), play a vital role as cloud condensation nuclei (CCN) for cloud-droplet growth, and a fraction of mineral particles initiate the freezing of supercooled cloud droplets, leading to the release of precipitation in the form of snow, hail, and rain (Mason, 1999). However, cloud condensation nuclei formation and precipitation are prompted by primary aerosols, secondary aerosols (such as nitrate, and sulfate), and BC and BrC (Ohata et al., 2016; Liu et al., 2020; Moteki, 2023). Moreover, BC particles are mainly hydrophobic and less efficient as CCN compared to more hydrophilic particles; they can still act as CCN under certain conditions. These conditions include the size and mixing state of the particles, as well as the atmospheric conditions such as relative humidity and temperature (Ohata et al., 2016; Moteki, 2023; Liu et al., 2020). The conditions required for BC particles to efficiently play the role of CCN depend on several factors, including their size, mixing state, and atmospheric conditions (Moteki, 2023; Liu et al., 2020). For example, smaller BC particles are more efficient as CCN than larger ones (Moteki, 2023). The mixing state of BC particles also plays a role, as externally mixed BC particles are less efficient as CCN than internally mixed ones (Liu et al., 2020). Atmospheric conditions such as relative humidity and temperature also affect the efficiency of BC particles as CCN (Moteki, 2023). For example, higher relative humidity and lower temperatures can increase the efficiency of BC particles as CCN (Moteki, 2023). Additionally, relative humidity over the study region is very high during the entire year, with favourable temperature. BC and BrC have a crucial role in the precipitation mechanism (Zhu et al., 2021; Li et al., 2023) over the study region. Total precipitation and wind circulation indicated that the study region received precipitation throughout each month of the study period (i.e. most of the time in the form of rain and occasionally as snow). Hence the maximum is observed in August and the minimum in March 2022. The wind pattern illustrates the monsoon seasonal strong influence from May to September 2021 (Fig. 6). The wind converses in the valley and diverges from the mountain for the rest of the period (Fig. 6). Because the strong wind and heavy rainfall indicated pollution scavenging (rainout or washout), it is significantly negatively correlated in terms of TP vs BCbb, TP vs BCff, and TP vs BrC (Fig. 5).
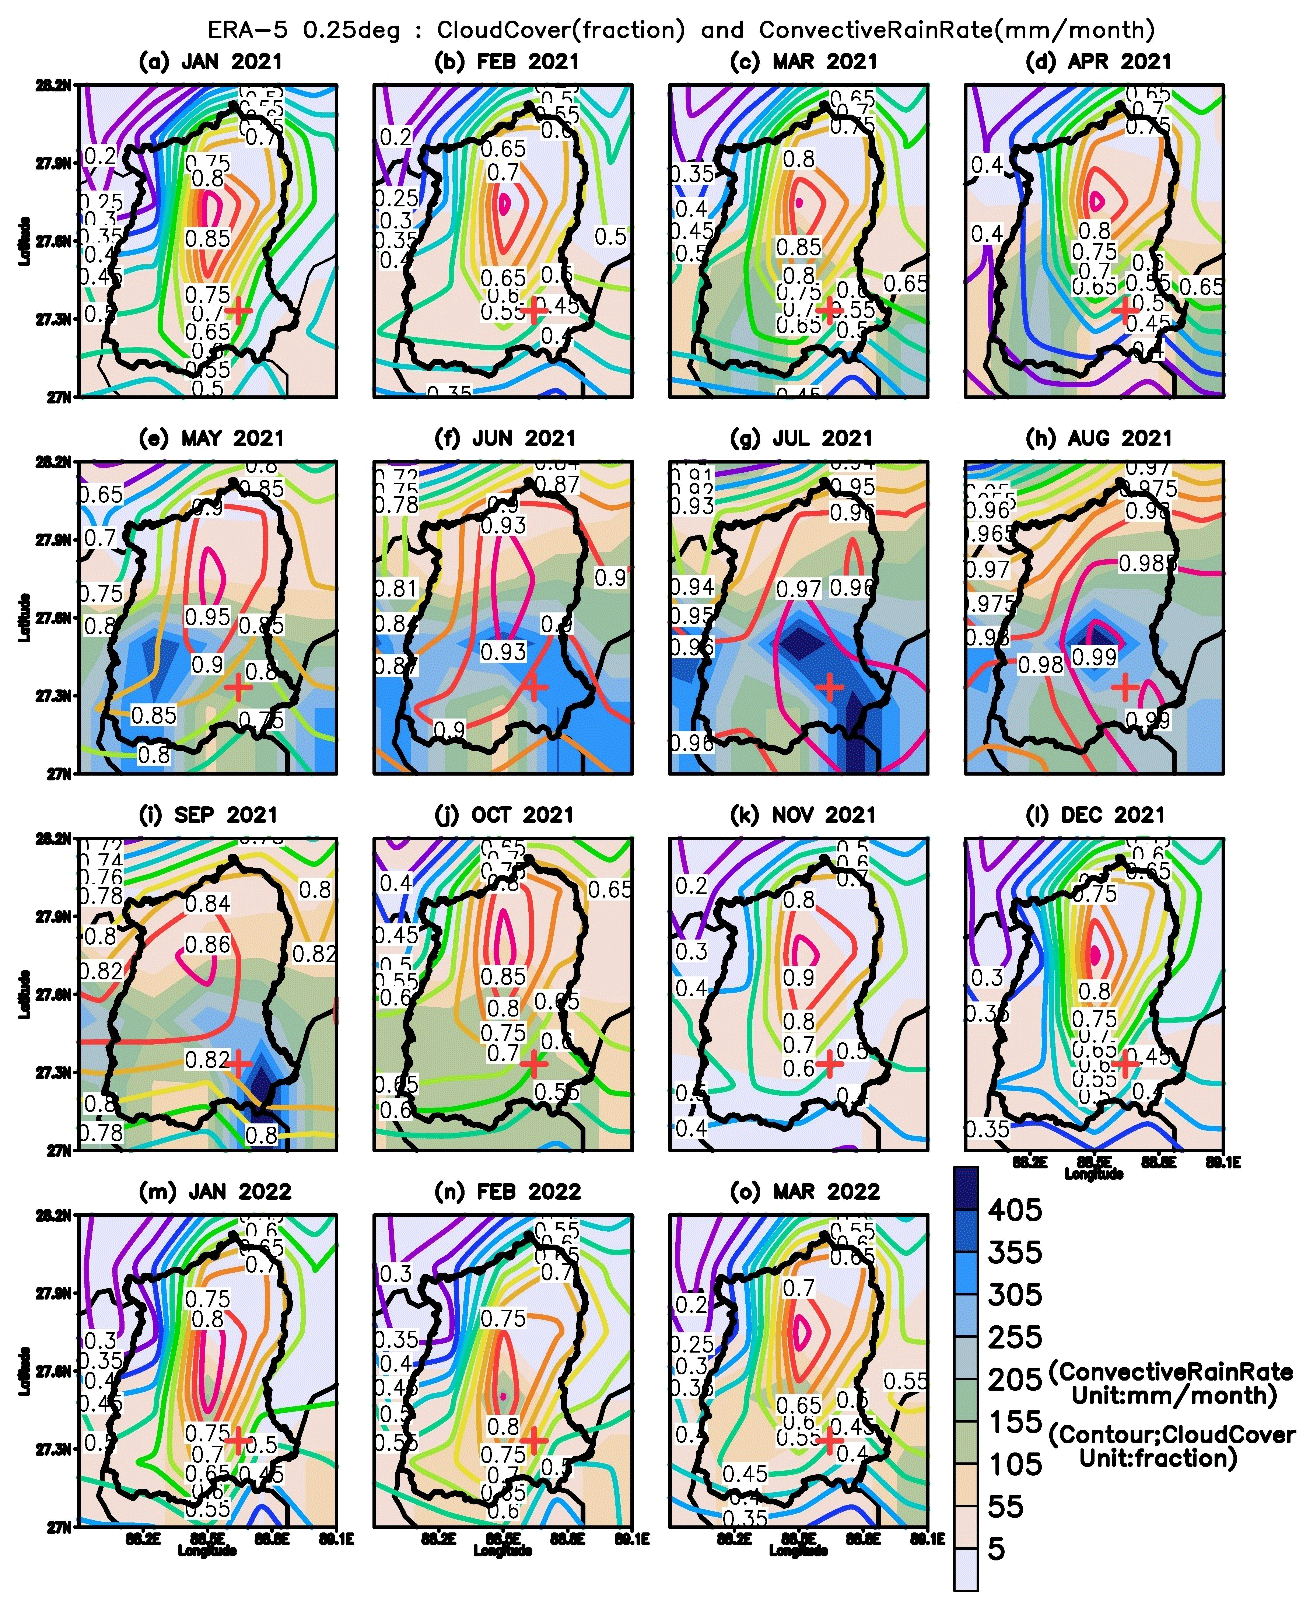
Figure 7Monthly convective rain and total cloud cover during January 2021 to March 2022. The shading shows a convective rain pattern, and the contour shows a total cloud cover fraction. The (+) mark is a representation of the sampling location.
Relative humidity and temperature follow the same pattern when the temperature gradients change from January to December, resulting in a decrease in moisture content in the atmosphere (Fig. S6 in the Supplement). The lowest is observed in the month of February, and the temperature gradient gets steep from November (Fig. S6). The dewpoint temperature contour and surface pressure shading match well, suggesting that the surface pressure creates the dewpoint temperature gradient and keeps it sustained and stable atmospheric condition (Jung et al., 2023) (Fig. S7 in the Supplement). During the month of June, it is very peculiar that the dewpoint temperature contours are wide and a very small gradient is observed (Fig. 7). This points toward warm conditions during June over the entire Sikkim region. The cloud cover and convective precipitation over Sikkim are discussed in Fig. 7. It is clear from Fig. 7a–d that the region does not receive much convective precipitation, even if there is huge cloud cover, which leads to a conclusion of orographic precipitation over the region (Fig. 7). However, the relative humidity is very high over the sampling site from the lower to upper middle level of the atmosphere during the study period (Fig. S3). Most of the Sikkim region receives convective rain from May to September, which indicates that the region has strong convective activity added from the Bay of Bengal during the monsoon season (Rahman et al., 2012; P. Kumar et al., 2020; Kakkar et al., 2022; Biswas and Bhattacharya, 2023). Again, from October to April, the region does not receive convective rain, even though there is strong cloud cover pointing toward orographic rainfall over the entire Sikkim (Kumar and Sharma, 2023). This makes the weather conditions in Sikkim unique (Figs. S3 and S4). In addition, the lowest concentration of BC, BCff, BCbb, and BrC is observed during the monsoon months. This observation supports the convective rain, as rainout scavenging, of all pollutants (Liu et al., 2020; Moteki, 2023). During the monsoon season, the region experiences high convective activity, which is added from the Bay of Bengal (Brooks et al., 2019; Liu et al., 2020; Moteki, 2023; Sankar et al., 2023). Convective rain is an effective process for removing air pollutants from the atmosphere (Liu et al., 2020; Moteki, 2023). Wet removal of BC and BrC occurs via cloud particle formation and subsequent conversion to precipitation or impaction processes with hydrometeors below clouds during precipitation (Liu et al., 2020; Moteki, 2023; Sankar et al., 2023). The BC and BrC have a significant positive correlation with thermal and solar radiation (Zhang et al., 2020; Wang et al., 2021; Li et al., 2023). A stronger negative correlation between CO2 and surface thermal radiation (STR) and surface solar radiation (SSR) would have significant implications (Fig. 5). The negative correlation between CO2 and STR implies that as the concentration of CO2 in the atmosphere increases, the amount of heat radiating from the Earth's surface into space decreases (Zhang et al., 2020). This can lead to an increase in Gangtok's temperature, which can have various impacts on climate and weather as well (Figs. S1 and 5). The negative correlation between CO2 and SSR implies that as the concentration of CO2 in the atmosphere increases, the amount of solar radiation absorbed by the Earth's surface decreases (Davis, 2017; Zhang et al., 2020; Li et al., 2023) (Fig. 5). Overall, a significant negative correlation between CO2 and STR and SSR would indicate a stronger influence of greenhouse gas concentrations on the surface's radiation balance (Chiodo et al., 2018) and would have important implications for climate change as well as anomalous warming over the Gangtok region (Fig. S1).
In accordance with the LULC between 2000 and 2010, Sikkim's recent changes to its development regulations have resulted in the majority of fallow land being consumed by construction, which suggests that Gangtok's urban settlement load has increased significantly. In addition, the LULC for 2020 depicts a booming built-up region over the GMC. From 2000 to 2020, the vegetation cover likewise decreased. However, due to the seasonal nature, streams emerged less often in 2020, indicating precipitation pattern variation over the GMC. The areas covered in dense vegetation are also being consumed by the expanding built-up area. The present study is the report of newly produced data BC and BrC for the fragile region of the Himalayas and their relation with meteorological conditions. It has been observed that the temperature over Gangtok is increasing as well. Peak concentrations of BC and BrC have been found during October 2021, March 2021, and March 2022. The diurnal distribution of BC and BrC suggests two peaks in a day, first at 08:00–10:00 IST and second at 09:00–11:00 IST. The meteorological conditions for the same have been observed to be favourable to diurnal variation of BC and BrC concentration. The monthly variation of the BC and BrC delineated the peak concentration of BC, BCbb, and BCff, during March 2022. However, BrC and BB % have a maximum concentration during April 2021. BB % and BrC as well as BB and carbon dioxide have a strong significant positive correlation coefficient, which is evidence that biomass burning is a substantial factor in the rise in carbon dioxide levels. In addition to this, there is a strong, positive correlation between CO2 and BC and BCff, indicating that burning fossil fuels is also one of the causes of rising CO2 levels. The relationship between net thermal radiation, net solar radiation, and BC and BrC suggests that BC and BrC have positive radiative forcing. Furthermore, the monsoon months show the lowest concentrations of BC, BCbb, BCff, BrC, and BB %, demonstrating the ability of convective rain (i.e. rainout scavenging) to remove a majority of contaminants. BC particles in the atmosphere have a strong ability to absorb solar radiation, and their lifetime depends on atmospheric transport, ageing, and wet scavenging processes. Organic aerosols, including BrC, can undergo photochemical ageing, affecting their ability to act as cloud condensation nuclei (CCN). The effective density of BC is a crucial factor in evaluating its climate effect, and variations in BC density can lead to uncertainties in predicting CCN number concentration.
Data are provided in the Supplement, and further details are available from the corresponding author upon reasonable request. Data are also available at https://docs.google.com/spreadsheets/d/1N4F_fT68syY6n0UIfA6nzI5o-8LUWjyFfk5NpfquRyg/edit?usp=sharing (Kumar et al., 2024).
The supplement related to this article is available online at: https://doi.org/10.5194/acp-24-11585-2024-supplement.
PK: conceptualisation, drafting, writing, figures, and editing. KS: sampling, data analysis, and figures. AM: data analysis, figures, and editing. RR: editing. AG: editing. BB: editing. JS: sampling. SY: editing, and mentoring. TA: editing and mentoring. RKR: conceptualisation, data interpretation, mentoring, and editing. NW: editing and mentoring. AKM: editing and mentoring.
The contact author has declared that none of the authors has any competing interests.
Publisher's note: Copernicus Publications remains neutral with regard to jurisdictional claims made in the text, published maps, institutional affiliations, or any other geographical representation in this paper. While Copernicus Publications makes every effort to include appropriate place names, the final responsibility lies with the authors.
The authors acknowledge the Department of Science and Technology, government of India, and the host department, the DST Centre of Excellence (CoE), at the Department of Geology, Sikkim University (DST/CCP/CoE/186/2019 (G)), for the generation of BC and BrC data. We also acknowledge free data sources used in the study as ERA5 and USGS Earth Explorer. The authors appreciate freely available software such as RStudio, QGIS, CDO, and GrADS used for the analysis and visualisation. We also acknowledge Anirud Rai, Kuldeep Dutta, Abhinav Tiwari, Richard Rai, and anonymous persons, who have helped and supported us in the collection of black carbon data.
This research has been supported by the DST Centre of Excellence (CoE), at the Department of Geology, Sikkim University (grant no. DST/CCP/CoE/186/2019 (G)).
This paper was edited by Alex Lee and reviewed by two anonymous referees.
Adeeyo, R. O., Edokpayi, J. N., Volenzo, T. E., Odiyo, J. O., and Piketh, S. J.: Determinants of solid fuel use and emission risks among households: insights from Limpopo, South Africa, Toxics, 10, 67, https://doi.org/10.3390/toxics10020067, 2022.
Aithal, B. H., M C, C., and G, N.: Assessing land surface temperature and land use change through spatio-temporal analysis: a case study of select major cities of India, Arab. J. Geosci., 12, 367, https://doi.org/10.1007/s12517-019-4547-1, 2019.
Ayompe, L. M., Davis, S. J., and Egoh, B. N.: Trends and drivers of African fossil fuel CO2 emissions 1990–2017, Environ. Res. Lett., 15, 124039, https://doi.org/10.1088/1748-9326/abc64f, 2021.
Benesty, J., Chen, J., Huang, Y., and Cohen, I.: Pearson correlation coefficient, in: Noise reduction in speech processing, Springer, Berlin, Heidelberg, https://doi.org/10.1007/978-3-642-00296-0_5, pp. 1-4, 2009.
Bharali, C., Nair, V. S., Chutia, L., and Babu, S. S.: Modeling of the effects of wintertime aerosols on boundary layer properties over the Indo Gangetic Plain, J. Geophys. Res.-Atmos., 124, 4141–4157, https://doi.org/10.1029/2018JD029758, 2019.
Bhat, M. A., Romshoo, S. A., and Beig, G.: Characteristics, source apportionment and long-range transport of black carbon at a high-altitude urban centre in the Kashmir valley, North-western Himalaya, Environ. Pollut., 305, 119295, https://doi.org/10.1016/j.envpol.2022.119295, 2022.
Bisht, D. S., Dumka, U. C., Kaskaoutis, D. G., Pipal, A. S., Srivastava, A. K., Soni, V. K., Attri, S. D., Sateesh, M., and Tiwari, S.: Carbonaceous aerosols and pollutants over Delhi urban environment: temporal evolution, source apportionment and radiative forcing, Sci. Total Environ., 521, 431–445, https://doi.org/10.1016/j.scitotenv.2015.03.083, 2015.
Biswas, J. and Bhattacharya, S.: Future changes in monsoon extreme climate indices over the Sikkim Himalayas and West Bengal Dynam. Atmos. Oceans, 101, 101346, https://doi.org/10.1016/j.dynatmoce.2022.101346, 2023.
Bond, T. C., Streets, D. G., Yarber, K. F., Nelson, S. M., Woo, J. H., and Klimont, Z.: A technology-based global inventory of black and organic carbon emissions from combustion, J. Geophys. Res.-Atmos., 109, D14203, https://doi.org/10.1029/2003JD003697, 2004.
Brooks, J., Liu, D., Allan, J. D., Williams, P. I., Haywood, J., Highwood, E. J., Kompalli, S. K., Babu, S. S., Satheesh, S. K., Turner, A. G., and Coe, H.: Black carbon physical and optical properties across northern India during pre-monsoon and monsoon seasons, Atmos. Chem. Phys., 19, 13079–13096, https://doi.org/10.5194/acp-19-13079-2019, 2019.
Chiodo, G., Polvani, L. M., Marsh, D. R., Stenke, A., Ball, W., Rozanov, E., Muthers, S., and Tsigaridis, K.: The response of the ozone layer to quadrupled CO2 concentrations, J. Climate, 31, 3893–3907, https://doi.org/10.1175/jcli-d-19-0086.1, 2018.
Chu, X.-L., Lu, Z., Wei, D., and Lei, G.-P..: Effects of land use/cover change on temporal and spatial variability of precipitation and temperature in the Songnen Plain of China, J. Integr. Agr., 21, 235, https://doi.org/10.1016/S2095-3119(20)63495-5, 2022.
Davis, W. J.: The relationship between atmospheric carbon dioxide concentration and global temperature for the last 425 million years, Climate, 5, 76, https://doi.org/10.3390/cli5040076, 2017.
Evangelista, H., Maldonado, J., Godoi, R. H. M., Pereira, E. B., Koch, D., Tanizaki-Fonseca, K., Van Grieken, R., Sampaio, M., Setzer, A., Alencar, A., and Gonçalves, S. C.: Sources and transport of urban and biomass burning aerosol black carbon at the South–West Atlantic Coast, J. Atmos. Chem., 56, 225–238, https://doi.org/10.1007/s10874-006-9052-8, 2007.
Ge, B., Xu, D., Wild, O., Yao, X., Wang, J., Chen, X., Tan, Q., Pan, X., and Wang, Z.: Inter-annual variations of wet deposition in Beijing from 2014–2017: implications of below-cloud scavenging of inorganic aerosols, Atmos. Chem. Phys., 21, 9441–9454, https://doi.org/10.5194/acp-21-9441-2021, 2021.
Gupta, P., Singh, S. P., Jangid, A., and Kumar, R.: Characterization of black carbon in the ambient air of Agra, India: Seasonal variation and meteorological influence, Adv. Atmos. Sci., 34, 1082–1094, https://doi.org/10.1007/s00376-017-6234-z, 2017.
Hansen, A. D. A. and Schnell, R. C.: The aethalometer, Magee Scientific Company, Berkeley, California, USA, 7, 2005.
Hansen, J., Lacis, A., Rind, D., Russell, G., Stone, P., Fung, I., Ruedy, R., and Lerner, J.: Climate sensitivity: Analysis of feedback mechanisms, Climate processes and climate sensitivity, 29, 130–163, https://doi.org/10.1029/GM029p0130, 1984.
Helin, A., Virkkula, A., Backman, J., Pirjola, L., Sippula, O., Aakko-Saksa, P., Väätäinen, S., Mylläri, F., Järvinen, A., Bloss, M., and Aurela, M.: Variation of absorption Ångström exponent in aerosols from different emission sources, J. Geophys. Res.-Atmos., 126, 2020JD034094, https://doi.org/10.1029/2020JD034094, 2021.
Hersbach, H., Bell, B., Berrisford, P., Hirahara, S., Horányi, A., Muñoz-Sabater, J., Nicolas, J., Peubey, C., Radu, R., Schepers, D., and Simmons, A.: The ERA5 global reanalysis, Q. J. Roy. Meteorol. Soc., 146, 1999–2049, https://doi.org/10.1002/qj.3803, 2020.
Hersbach, H., Bell, B., Berrisford, P., Biavati, G., Horányi, A., Muñoz Sabater, J., Nicolas, J., Peubey, C., Radu, R., Rozum, I., Schepers, D., Simmons, A., Soci, C., Dee, D., and Thépaut, J.-N.: ERA5 hourly data on single levels from 1940 to present. Copernicus Climate Change Service (C3S) Climate Data Store (CDS) [data set], https://doi.org/10.24381/cds.adbb2d47, 2023.
Huang, Y., Xia, Y., and Tan, X.: On the pattern of CO2 radiative forcing and poleward energy transport, J. Geophys. Res.-Atmos., 122, 10–578, https://doi.org/10.1002/2017JD027221, 2017.
Igarashi, S., Sasaki, H. and Honda, M.: Influence of pressure gradient upon boundary layer stability and transition, Acta Mech., 73, 187–198, https://doi.org/10.1007/BF01177038, 1988.
Johnson, M. A., Garland, C. R., Jagoe, K., Edwards, R., Ndemere, J., Weyant, C., Patel, A., Kithinji, J., Wasirwa, E., Nguyen, T., and Khoi, D. D.: In-home emissions performance of cookstoves in Asia and Africa, Atmosphere, 10, 290, https://doi.org/10.3390/atmos10050290, 2019.
Johnson, R. H. and Hamilton, P. J.: The relationship of surface pressure features to the precipitation and airflow structure of an intense midlatitude squall line, Mon. Weather Rev., 116, 1444–1473, https://doi.org/10.1175/1520-0493(1988)116<1444:TROSPF>2.0.CO;2, 1988.
Jung, C. H., Lee, H. M., Park, D., Yoon, Y. J., Choi, Y., Um, J., Lee, S. S., Lee, J. Y., and Kim, Y. P.: Parameterization of below-cloud scavenging for polydisperse fine mode aerosols as a function of rain intensity, J. Environ. Sci.-China, 132, pp.43-55, https://doi.org/10.1016/j.jes.2022.07.031, 2023.
Jung, K. H., Goodwin, K. E., Perzanowski, M. S., Chillrud, S. N., Perera, F. P., Miller, R. L., and Lovinsky-Desir, S.: Personal exposure to black carbon at school and levels of Fractional Exhaled nitric Oxide in New York city, Environ. Health Persp., 129, 097005, https://doi.org/10.1289/EHP8985, 2021.
Karra, K., Kontgis, C., Statman-Weil, Z., Mazzariello, J. C., Mathis, M., and Brumby, S. P.: Global land use/land cover with Sentinel 2 and deep learning, in: 2021 IEEE international geoscience and remote sensing symposium IGARSS, 11–16 July 2021, Brussels, Belgium, IEEE, 4704–4707, https://doi.org/10.1109/IGARSS47720.2021.9553499, 2021.
Kedia, S., Ramachandran, S., Holben, B. N., and Tripathi, S. N.: Quantification of aerosol type, and sources of aerosols over the Indo–Gangetic Plain, Atmos. Environ., 98, 607–619, https://doi.org/10.1016/j.atmosenv.2014.09.022, 2014.
Kiran, V. R., Talukdar, S., Ratnam, M. V., and Jayaraman, A.: Long-term observations of black carbon aerosol over a rural location in southern peninsular India: Role of dynamics and meteorology, Atmos. Environ., 189, 264–274, https://doi.org/10.1016/j.atmosenv.2018.06.020, 2018.
Kirchstetter, T. W., Novakov, T., and Hobbs, P. V.: Evidence that the spectral dependence of light absorption by aerosols is affected by organic carbon, J. Geophys. Res.-Atmos., 109, 37–50, https://doi.org/10.1029/2004JD004999, 2004.
Kakkar, A., Rai, P. K., Mishra, V. N., and Singh, P.: Decadal trend analysis of rainfall patterns of past 115 years and its impact on Sikkim, India, Remote Sensing Applications: Society and Environment, 26, 100738, https://doi.org/10.1016/j.rsase.2022.100738, 2022.
Klimont, Z., Kupiainen, K., Heyes, C., Purohit, P., Cofala, J., Rafaj, P., Borken-Kleefeld, J., and Schöpp, W.: Global anthropogenic emissions of particulate matter including black carbon, Atmos. Chem. Phys., 17, 8681–8723, https://doi.org/10.5194/acp-17-8681-2017, 2017.
Kumar, M., Raju, M. P., Singh, R. S., and Banerjee, T.: Impact of drought and normal monsoon scenarios on aerosol induced radiative forcing and atmospheric heating in Varanasi over middle Indo–Gangetic Plain, J. Aerosol Sci., 113, 95–107, https://doi.org/10.1016/j.jaerosci.2017.07.016, 2017.
Kumar, M., Parmar, K. S., Kumar, D. B., Mhawish, A., Broday, D. M., Mall, R. K., and Banerjee, T.: Long-term aerosol climatology over Indo–Gangetic Plain: Trend, prediction and potential source fields, Atmos. Environ., 180, 37–50, https://doi.org/10.1016/j.atmosenv.2018.02.027, 2018.
Kumar, P. and Sharma, M. C.: Frontal changes in medium-sized glaciers in Sikkim, India during 1988–2018: Insights for glacier-climate synthesis over the Himalaya, Iscience, 26, https://doi.org/10.1016/j.isci.2023.107789, 2023.
Kumar, P., Patton, A. P., Durant, J. L., and Frey, H. C.: A review of factors impacting exposure to PM2.5, ultrafine particles and black carbon in Asian transport microenvironments, Atmos. Environ., 187, 301–316, https://doi.org/10.1016/j.atmosenv.2018.05.046, 2018.
Kumar, P., Sharma, M. C., Saini, R., and Singh, G. K.: Climatic variability at Gangtok and Tadong weather observatories in Sikkim, India, during 1961–2017, Sci. Rep.-UK, 10, 15177, https://doi.org/10.1038/s41598-020-71163-y, 2020.
Kumar, P., Sharma, K., Malu, A., Rajak, R., Gupta, A., Baruah, B., Yadav, S. K., Angchuck, T., Sharma, J., Ranjan, R. K., Misra, A. K., and Wanjari, N.: BC_Data_For_Sikkim, Google [data set], https://docs.google.com/spreadsheets/d/1N4F_fT68syY6n0UIfA6nzI5o-8LUWjyFfk5NpfquRyg/edit?usp=sharing, last access: 22 August 2024.
Kumar, R. R., Soni, V. K., and Jain, M. K.: Evaluation of spatial and temporal heterogeneity of black carbon aerosol mass concentration over India using three year measurements from IMD BC observation network, Sci. Total Environ., 723, 138060, https://doi.org/10.1016/j.scitotenv.2020.138060, 2020.
Kurokawa, J. and Ohara, T.: Long-term historical trends in air pollutant emissions in Asia: Regional Emission inventory in ASia (REAS) version 3, Atmos. Chem. Phys., 20, 12761–12793, https://doi.org/10.5194/acp-20-12761-2020, 2020.
Laskin, A., Laskin, J., and Nizkorodov, S. A.: Chemistry of atmospheric brown carbon, Chem. Rev., 115, 4335–4382, https://doi.org/10.1021/cr5006167, 2015.
Lee, T., Fisher, M., and Schwarz, W.: Investigation of the effects of a compliant surface on boundary-layer stability, J. Fluid Mech., 288, 37–58, https://doi.org/10.1017/S0022112095001054, 1995.
Li, S., Zhang, H., Wang, Z., Chen, Y.: Advances in the Research on Brown Carbon Aerosols: Its Concentrations, Radiative Forcing, and Effects on Climate, Aerosol Air Qual. Res., 23, 220336, https://doi.org/10.4209/aaqr.220336, 2023.
Liu, C., Huang, J., Tao, X., Deng, L., Fang, X., Liu, Y., Luo, L., Zhang, Z., Xiao, H. W., and Xiao, H. Y.: An observational study of the boundary-layer entrainment and impact of aerosol radiative effect under aerosol-polluted conditions, Atmos. Res., 250, 105348, https://doi.org/10.1016/j.atmosres.2020.105348, 2021.
Liu, D., He, C., Schwarz, J. P., and Wang, X.: Lifecycle of light-absorbing carbonaceous aerosols in the atmosphere, NPJ Climate and Atmospheric Science, 3, 40, https://doi.org/10.1038/s41612-020-00145-8, 2020.
Mahmood, R., Pielke Sr, R. A., Hubbard, K. G., Niyogi, D., Bonan, G., Lawrence, P., McNider, R., McAlpine, C., Etter, A., Gameda, S., and Qian, B.: Impacts of land use/land cover change on climate and future research priorities, B. Am. Meteorol. Soc., 91, 37–46, https://doi.org/10.1175/2009BAMS2769.1, 2010.
Mason, J.: The role of aerosols in cloud physics and climate change, Sci. Prog., 82, 185–207, https://doi.org/10.1177/003685049908200301, 1999.
Massabò, D., Caponi, L., Bernardoni, V., Bove, M. C., Brotto, P., Calzolai, G., Cassola, F., Chiari, M., Fedi, M. E., Fermo, P., and Giannoni, M.: Multi-wavelength optical determination of black and brown carbon in atmospheric aerosols, Atmos. Environ., 108, 1–12, https://doi.org/10.1016/j.atmosenv.2015.02.058, 2015.
Moosmüller, H., Chakrabarty, R. K., Ehlers, K. M., and Arnott, W. P.: Absorption Ångström coefficient, brown carbon, and aerosols: basic concepts, bulk matter, and spherical particles, Atmos. Chem. Phys., 11, 1217–1225, https://doi.org/10.5194/acp-11-1217-2011, 2011.
Moteki, N.: Climate-relevant properties of black carbon aerosols revealed by in situ measurements: a review, Progress in Earth and Planetary Science, 10, 1–16, https://doi.org/10.1186/s40645-023-00544-4, 2023.
Ohata, S., Moteki, N., Mori, T., Koike, M., and Kondo, Y.: A key process controlling the wet removal of aerosols: new observational evidence, Sci. Rep.-UK, 6, 34113, https://doi.org/10.1038/srep34113, 2016.
Osborne, S. R., Johnson, B. T., Haywood, J. M., Baran, A. J., Harrison, M. A. J., and McConnell, C. L.: Physical and optical properties of mineral dust aerosol during the Dust and Biomass-burning Experiment, J. Geophys. Res.-Atmos., 113, D00C03, https://doi.org/10.1029/2007JD009551, 2008.
Park, R. J., Kim, M. J., Jeong, J. I., Youn, D., and Kim, S.: A contribution of brown carbon aerosol to the aerosol light absorption and its radiative forcing in East Asia, Atmos. Environ., 44, 1414–1421, https://doi.org/10.1016/j.atmosenv.2010.01.042 , 2010.
Pearson, K.: Determination of the coefficient of correlation, Science, 30, 23–25, https://doi.org/10.1126/science.30.757.23, 1909.
Pierrehumbert, R. T.: Short-lived climate pollution, Annu. Rev. Earth Pl. Sc., 42, 341–379, https://doi.org/10.1146/annurev-earth-060313-054843, 2014.
Prabhu, V., Soni, A., Madhwal, S., Gupta, A., Sundriyal, S., Shridhar, V., Sreekanth, V., and Mahapatra, P. S.: Black carbon and biomass burning associated high pollution episodes observed at Doon valley in the foothills of the Himalayas, Atmos. Res., 243, 105001, https://doi.org/10.1016/j.atmosres.2020.105001, 2020.
Rahman, H., Karuppaiyan, R., Senapati, P. C., Ngachan, S. V., and Kumar, A.: An analysis of past three decade weather phenomenon in the mid-hills of Sikkim and strategies for mitigating possible impact of climate change on agriculture. Climate change in Sikkim: Patterns, impacts and initiatives, Sikkim forest climate change report, Sikkim state ministry repository, 1–18, http://sikkimforest.gov.in/climate-change-in-sikkim/2-chapter-An%20analysis%20of%20past%20three%20decade%20weather.pdf (last access: 22 August 2024), 2012.
Ramachandran, S. and Rupakheti, M.: Trends in the types and absorption characteristics of ambient aerosols over the Indo–Gangetic Plain and North China Plain in last two decades, Sci. Total Environ., 831, 154867, https://doi.org/10.1016/j.scitotenv.2022.154867, 2022.
Ramachandran, S., Rupakheti, M., and Lawrence, M. G.: Black carbon dominates the aerosol absorption over the Indo–Gangetic Plain and the Himalayan foothills. Environment international, 142, 105814, https://doi.org/10.1016/j.envint.2020.105814, 2020.
Ramanathan, V. and Carmichael, G.: Global and regional climate changes due to black carbon, Nat. Geosci., 1, 221–227, https://doi.org/10.1038/ngeo156, 2008.
Rana, A., Rawat, P., and Sarkar, S.: Sources, transport pathways and radiative effects of BC aerosol during 2018–2020 at a receptor site in the eastern Indo–Gangetic Plain, Atmos. Environ., 309, 119900, https://doi.org/10.1016/j.atmosenv.2023.119900, 2023.
Rathod, T., Sahu, S. K., Tiwari, M., Yousaf, A., Bhangare, R. C., and Pandit, G. G.: Light absorbing properties of brown carbon generated from pyrolytic combustion of household biofuels, Aerosol Air Qual. Res., 17, 108–116, https://doi.org/10.4209/aaqr.2015.11.0639, 2017.
Rathod, T. D. and Sahu, S. K.: Measurements of optical properties of black and brown carbon using multi-wavelength absorption technique at Mumbai, India, J. Earth Syst. Sci., 131, 32, https://doi.org/10.1007/s12040-021-01774-0, 2022.
Reddy, M. S. and Venkataraman, C.: Inventory of aerosol and sulphur dioxide emissions from India: I—Fossil fuel combustion, Atmos. Environ., 36, 677–697, https://doi.org/10.1016/S1352-2310(01)00463-0, 2002a.
Reddy, M. S. and Venkataraman, C.: Inventory of aerosol and sulphur dioxide emissions from India. Part II—biomass combustion, Atmos. Environ., 36, 699–712, https://doi.org/10.1016/S1352-2310(01)00464-2, 2002b.
Runa, F., Islam, M., Jeba, F., and Salam, A.: Light absorption properties of brown carbon from biomass burning emissions, Environ. Sci. Pollut. R., 29, 21012–21022, https://doi.org/10.1007/s11356-021-17220-z, 2022.
Sankar, T. K., Ambade, B., Mahato, D. K., Kumar, A., and Jangde, R.: Anthropogenic fine aerosol and black carbon distribution over urban environment, Journal of Umm Al-Qura University for Applied Sciences, 9, 471–480, https://doi.org/10.1007/s43994-023-00055-4, 2023.
Sarkar, A.: A generalized relationship between atmospheric pressure and precipitation associated with a passing weather system, MAUSAM, 69, 133–140, https://doi.org/10.54302/mausam.v69i1.242, 2018.
Shaddick, G., Thomas, M. L., Mudu, P., Ruggeri, G., and Gumy, S.: Half the world's population are exposed to increasing air pollution, NPJ Climate and Atmospheric Science, 3, 23, https://doi.org/10.1038/s41612-020-0124-2, 2020.
Sharma, K., Ranjan, R. K., Lohar, S., Sharma, J., Rajak, R., Gupta, A., Prakash, A., and Pandey, A. K.: Black Carbon Concentration during Spring Season at High Altitude Urban Center in Eastern Himalayan Region of India, Asian Journal of Atmospheric Environment (AJAE), 16, 2021149, https://doi.org/10.5572/ajae.2021.149, 2022.
Shindell, D., Kuylenstierna, J. C., Vignati, E., van Dingenen, R., Amann, M., Klimont, Z., Anenberg, S. C., Muller, N., Janssens-Maenhout, G., Raes, F., and Schwartz, J.: Simultaneously mitigating near-term climate change and improving human health and food security, Science, 335, 183–189, https://doi.org/10.1126/science.1210026, 2012.
Shukla, K. K., Sarangi, C., Attada, R., and Kumar, P.: Characteristic dissimilarities during high aerosol loading days between western and eastern Indo–Gangetic Plain, Atmos. Environ., 269, 118837, https://doi.org/10.1016/j.atmosenv.2021.118837, 2022.
Sloss, L.: Black carbon emissions in India, CCC/209, IEA Clean Coal Centre, London, 38, 2012.
Stevens, B. and Feingold, G.: Untangling aerosol effects on clouds and precipitation in a buffered system, Nature, 461, 607–613, https://doi.org/10.1038/nature08281, 2009.
Stjern, C. W., Forster, P. M., Jia, H., Jouan, C., Kasoar, M. R., Myhre, G., Olivié, D., Quaas, J., Samset, B. H., Sand, M., and Takemura, T.: The Time Scales of Climate Responses to Carbon Dioxide and Aerosols, J. Climate, 36, 3537–3551, https://doi.org/10.1175/JCLI-D-22-0513.1, 2023.
Sun, Y., Hao, Q., Cui, C., Shan, Y., Zhao, W., Wang, D., Zhang, Z., and Guan, D.: Emission accounting and drivers in East African countries, Appl. Energ., 312, 118805, https://doi.org/10.1016/j.apenergy.2022.118805, 2022.
Takemura, T. and Suzuki, K.: Weak global warming mitigation by reducing black carbon emissions, Sci. Rep.-UK, 9, 1–6, https://doi.org/10.1038/s41598-019-41181-6, 2019.
Venkataraman, C., Habib, G., Kadamba, D., Shrivastava, M., Leon, J. F., Crouzille, B., Boucher, O., and Streets, D. G.: Emissions from open biomass burning in India: Integrating the inventory approach with high-resolution Moderate Resolution Imaging Spectroradiometer (MODIS) active-fire and land cover data, Global Biogeochem. Cy., 20, GB2013, https://doi.org/10.1029/2005GB002547, 2006.
Wang, L., Jin, W., Sun, J., Zhi, G., Li, Z., Zhang, Y., Guo, S., He, J., and Zhao, C.: Seasonal features of brown carbon in northern China: Implications for BrC emission control, Atmos. Res., 257, 105610, https://doi.org/10.1016/j.atmosres.2021.105610, 2021.
Wang, Q., Liu, H., Ye, J., Tian, J., Zhang, T., Zhang, Y., Liu, S., and Cao, J.: Estimating Absorption Ångström Exponent of Black Carbon Aerosol by Coupling Multiwavelength Absorption with Chemical Composition, Environmental Science and Technology Letters, 8, 121–127, https://doi.org/10.1021/acs.estlett.0c00829, 2020.
Watham, T., Padalia, H., Srinet, R., Nandy, S., Verma, P. A., and Chauhan, P.: Seasonal dynamics and impact factors of atmospheric CO2 concentration over subtropical forest canopies: observation from eddy covariance tower and OCO-2 satellite in Northwest Himalaya, India, Environ. Monit. Assess., 193, 1–15, https://doi.org/10.1007/s10661-021-08896-4, 2021.
Wu, Y., Wang, Y., Zhou, Y., Liu, X., Tang, Y., Wang, Y., Zhang, R., and Li, Z.: The wet scavenging of air pollutants through artificial precipitation enhancement: A case study in the Yangtze River Delta, Frontiers in Environmental Science, 10, 1027902, https://doi.org/10.3389/fenvs.2022.1027902, 2022.
Yasunari, T. J., Bonasoni, P., Laj, P., Fujita, K., Vuillermoz, E., Marinoni, A., Cristofanelli, P., Duchi, R., Tartari, G., and Lau, K.-M.: Estimated impact of black carbon deposition during pre-monsoon season from Nepal Climate Observatory – Pyramid data and snow albedo changes over Himalayan glaciers, Atmos. Chem. Phys., 10, 6603–6615, https://doi.org/10.5194/acp-10-6603-2010, 2010.
Yoo, J. M., Lee, Y. R., Kim, D., Jeong, M. J., Stockwell, W. R., Kundu, P. K., Oh, S. M., Shin, D. B., and Lee, S. J.: New indices for wet scavenging of air pollutants (O3, CO, NO2, SO2, and PM10) by summertime rain, Atmos. Environ., 82, 226–237, https://doi.org/10.1016/j.atmosenv.2013.10.022, 2014.
Yue, S., Zhu, J., Chen, S., Xie, Q., Li, W., Li, L., Ren, H., Su, S., Li, P., Ma, H., and Fan, Y.: Brown carbon from biomass burning imposes strong circum-Arctic warming, One Earth, 5, 293–304, https://doi.org/10.1016/j.oneear.2022.02.006, 2022.
Zhang, A., Wang, Y., Zhang, Y., Weber, R. J., Song, Y., Ke, Z., and Zou, Y.: Modeling the global radiative effect of brown carbon: a potentially larger heating source in the tropical free troposphere than black carbon, Atmos. Chem. Phys., 20, 1901–1920, https://doi.org/10.5194/acp-20-1901-2020, 2020.
Zhang, R., Jing, J., Tao, J., Hsu, S.-C., Wang, G., Cao, J., Lee, C. S. L., Zhu, L., Chen, Z., Zhao, Y., and Shen, Z.: Chemical characterization and source apportionment of PM2.5 in Beijing: seasonal perspective, Atmos. Chem. Phys., 13, 7053–7074, https://doi.org/10.5194/acp-13-7053-2013, 2013.
Zhao, Z., Wang, Q., Xu, B., Shen, Z., Huang, R., Zhu, C., Su, X., Zhao, S., Long, X., Liu, S., and Cao, J.: Black carbon aerosol and its radiative impact at a high‐altitude remote site on the southeastern Tibet Plateau, J. Geophys. Res.-Atmos., 122, 5515–5530, https://doi.org/10.1002/2016JD026032, 2017.
Zhu, C. S., Qu, Y., Huang, H., Chen, J., Dai, W. T., Huang, R. J., and Cao, J. J.: Black carbon and secondary brown carbon, the dominant light absorption and direct radiative forcing contributors of the atmospheric aerosols over the Tibetan Plateau, Geophys. Res. Lett., 48, e2021GL092524, https://doi.org/10.1029/2021GL092524, 2021.