the Creative Commons Attribution 4.0 License.
the Creative Commons Attribution 4.0 License.
 | 16 Oct 2024
Long-range transport of air pollutants increases the concentration of hazardous components of PM2.5 in northern South America
Maria P. Velásquez-García
K. Santiago Hernández
James A. Vergara-Correa
Richard J. Pope
Miriam Gómez-Marín
Angela M. Rendón
Long-range transport (LRT) of air pollutants from a range of sources can substantially enhance background pollution levels, especially in urbanized regions, which can exacerbate high-pollution episodes. In the Aburrá Valley (AV), Colombia, and other cities in northern South America, biomass burning (BB), dust, and volcanic degassing have been identified as sources of long-range aerosol transport. However, the impact of these sources on air quality and the characterization of these sources have yet to be thoroughly studied. This work investigates the influence of these sources on the chemical composition of PM2.5 during annual and intra-annual high-load aerosol events in the AV. We identified, tracked, and meteorologically characterized LRT events and evaluated their influence on PM2.5 concentration and chemical composition. We found that the LRT of aerosols from BB, dust, and volcanic degassing influenced approximately 13 %, 8 %, and 13 % of days in the year, respectively. We applied the positive-matrix-factorization (PMF) statistical model to quantify PM2.5 concentrations and chemical compositions for the different LRT event types (e.g., BB). For BB events, we identified large contributions from organic carbon (OC1 and OC2), F−, and secondary aerosol tracers ( and ). For dust LRT events, crustal mineral components, along with Ti and Ca, were the primary contributors to aerosol composition, while , Na, Al, and Ca were the primary contributors during volcanic events. The concentrations of some ions and toxic heavy metals (Cr, Mn, Cd, and Ni) were also elevated during BB and volcanic-degassing events. BB contributed the most to PM2.5 levels during the LRT events (∼11 µg m−3), while contributions from aerosols arising from dust and volcanic events were also substantial (<7 µg m−3). Our study identifies the Orinoco and the Middle Magdalena Valley as sizable sources of BB aerosols and Nevado del Ruiz as a source of volcanic aerosols. Additionally, we found that African dust reached the Andean region via the Caribbean route. As a result, we identify the need for future chemical-transport modeling studies in the region and new support strategies to manage internal and external pollution sources that degrade air quality in the AV and the surrounding region.
- Article
(8911 KB) - Full-text XML
-
Supplement
(1150 KB) - BibTeX
- EndNote


Long-range transport (LRT) of aerosols influences the chemical composition of air over thousands of kilometers (Kaneyasu et al., 2014; Wang et al., 2015; Rincón-Riveros et al., 2020) and plays a crucial role in the biogeochemical cycle of certain components, such as dust and biomass aerosols, which distribute iron and phosphorus across oceans and continents (Okin et al., 2004; Boyd and Ellwood, 2010). Furthermore, aerosols interact with solar radiation, influencing cloud formation and light scattering (absorbance), resulting in a cooling (warming) effect on the planet (Choobari et al., 2014). In particular, dust and black carbon contribute to a reduction in albedo over snow-covered regions, which can accelerate snow melting, significantly affecting the global climate (Kaspari et al., 2014).
LRT of aerosols also increases human health risks, particularly in urban areas with high local emissions. One of many air pollutants, fine aerosols, represented by PM2.5 (particulate matter with a diameter less than 2.5 µm), can penetrate deep into the human body and trigger cerebrovascular and heart diseases, lung cancer and obstruction, and respiratory infections (Xie et al., 2021; Lippmann et al., 2013). Indeed, the LRT of aerosols can substantially increase total PM2.5 concentrations to more hazardous levels and can increase the toxicity of aerosols with respect to human health. For instance, carbonaceous dominant particles are known to be more toxic than crustal components (Tuomisto et al., 2008). Increased OC (organic carbon) and EC (elemental carbon) associated with biomass-burning (BB) episodes have been linked to a greater risk of cardiovascular diseases (Hwang et al., 2017).
The contribution of PM2.5 concentrations from the LRT of aerosols has prompted cooperation between cities and countries to identify and control key precursor aerosol emissions, with the goal of reducing population vulnerability and the risk of hazardous air pollution events. For decades, in Europe and Asia, LRT of air pollutants has been recognized as a significant factor in air pollution (Kulshrestha and Kumar, 2014) and has informed the development and implementation of key policy strategies. For instance, the Task Force on Hemispheric Transport of Air Pollution (TF HTAP), a collaboration led by the European Union and the United States, targets the intercontinental and Northern Hemisphere transport of particular matter (PM) and O3, acknowledging the importance of these pollutants for meeting air quality targets (UN, 2010). This collaboration has contributed to identifying and tracking regional sources, as well as creating more effective emission reduction strategies (Liang et al., 2018; Zhao et al., 2021; Dong et al., 2018). On a smaller scale, cooperation between Hong Kong SAR and Guangdong has aimed to address the transboundary issue of air pollution in the Pearl River Delta region (Zhong et al., 2013). This collaboration has involved monitoring pollution levels and changes, evaluating the effectiveness of control measures, and providing feedback and training to stakeholders.
In northern South America (NSA), the LRT of air pollutants is a more recently recognized public problem, and regional cooperation is gaining importance and momentum. Particularly in the Colombian Andes, biomass burning, desert dust, and volcanic emissions have been identified as three main sources of aerosols that can impact air quality from distant regions. Although biomass burning around the Amazon Basin is one of the primary sources of aerosols in South America (Ballesteros-González et al., 2020), atmospheric-circulation patterns and substantial precipitation (i.e., aerosol wet deposition) limit the LRT of aerosols toward Colombia (Hamburger et al., 2013). Therefore, transboundary emissions from open fires in the Orinoco Basin and the Caribbean are more important drivers of intra-annual periods of hazardous air quality in Colombian cities such as Bogotá, Medellín, Arauca, Yopal, Bucaramanga, and Villavicencio (Mendez-Espinosa et al., 2019; Rincón-Riveros et al., 2020; Henao et al., 2021; Rodríguez-Gómez et al., 2022) as well as on Pico Espejo in Venezuela (Hamburger et al., 2013).
Similarly, the LRT of dust, primarily emitted from the Sahara and Sahel, has also been reported in NSA (Prospero et al., 2020). These particles predominately affect the Caribbean region, including Barbados, Guadeloupe, the US Virgin Islands, and Tobago, and parts of the continent, e.g., French Guiana (Prospero et al., 2014; Kumar et al., 2014). African dust effects have also been reported in Colombia, with analyses evidencing the occurrence of high particle loads in June 2014 and 2020 (Bolaño-Ortiz et al., 2023a; Mendez Espinosa et al., 2018; Bedoya et al., 2016). Notably, the LRT of African dust in June 2014 resulted in 95 % of the country experiencing dust coverage (with dust concentrations >90 kg km−2) (Mendez Espinosa et al., 2018). However, a few long-term assessments have also been carried out in the Caribbean and Andean regions (Bolaño-Ortiz et al., 2023b; Arregocés et al., 2023).
Volcanic eruptions and degassing also play a crucial role in the LRT of air pollutants in NSA and are part of the natural ecosystem in the region, which belongs to the Andean Volcanic Belt. Few studies have assessed the influence of volcanic aerosols on air quality in this region, but those which have conducted such assessments have mainly focused on Sangay, a volcano in Ecuador, and Nevado del Ruiz in Colombia (Casallas et al., 2024; Moran-Zuloaga et al., 2024). These studies have identified elevated PM2.5 and sulfur dioxide (SO2) concentrations in the air resulting from these volcanoes (Casallas et al., 2024; Cuesta-Mosquera et al., 2020; Trejos et al., 2021). The degassing activities pertaining to Nevado del Ruiz have been especially highlighted for their magnitude and frequency (Carn et al., 2016).
In the last few years, multiple studies in Colombia have undertaken substantial efforts to monitor and assess the impacts of open-fire emissions on local air quality (see e.g., Hernandez et al., 2019; Mendez-Espinosa et al., 2019; Ballesteros-González et al., 2020; Rincón-Riveros et al., 2020; Henao et al., 2021). Nonetheless, dust and volcanic-aerosol studies have been limited to episodic high-pollution events (Mendez Espinosa et al., 2018) and do not provide a comprehensive long-term assessment of the LRT of aerosols from these sources (Liu et al., 2022). Overall, there are still significant gaps in our understanding of how the LRT of aerosols from these three sources influences regional air quality throughout the year, which directly relates to absolute concentrations and aerosol chemical composition. This is especially true for dust and volcanic aerosols, which are frequently overlooked due to their uncontrolled natural source types (Woo et al., 2020; Pouliot et al., 2012). Therefore, quantifying the properties (i.e., absolute concentrations and chemical compositions) of aerosols from LRT events would allow for a detailed assessment of surface aerosol mixtures (and air quality impacts) at local and national scales. It would enable decision-makers to develop cooperative and effective projects to manage the risk of air pollution involving natural sources (Gómez Peláez et al., 2020; Jiao et al., 2021). Furthermore, advances in the characterization of the chemical composition of air can provide an opportunity to devise strategies that reduce the exposure of the population to high concentrations of certain species, such as toxic heavy metals and carbonaceous matter (Gómez Peláez et al., 2020; Briffa et al., 2020; Allajbeu et al., 2017).
This study aims to analyze the impact of the inter-annual LRT of biomass burning (BB-LRT), dust (Dust-LRT), and volcanic aerosols (Volcanic-LRT) on PM2.5 concentrations and chemical composition in the Aburrá Valley (AV), one of the most populated metropolitan areas in Colombia, situated within the Andes Mountains. We characterize meteorologically favorable conditions for the LRT events and incorporate information from one of the largest registered PM2.5 chemical characterization campaigns conducted in the region (April 2019 to October 2022), as well as from in situ PM2.5 measurements and satellite-based products. We identify representative events, analyze atmospheric transport, and highlight potential sources. Finally, we evaluate the impact of these sources on ground-level PM2.5 concentrations and chemical composition in the AV.
2.1 Study region
The AV, illustrated in Fig. 1b, is a 1152 km2 natural river basin located in the northeast of Colombia (see Fig. 1a). The territory contains 10 cities, with Medellín being the largest. The AV is located in the central mountain range of the Colombian Andes, and its elevation ranges from 1300 m a.s.l. (meters above sea level) in the valley to 2800 m a.s.l. at the western mountaintop. By 2018, the population in the AV had reached 3.73 million inhabitants, making the region a dense conurbation. Due to accelerated urban expansion (Echeverri and Orsini, 2011; Salazar Hernandez et al., 2022), an increasing vehicular fleet (García et al., 2016), and limited air pollutant dispersion, average daily concentrations of PM2.5 frequently exceed national and international standards (15 µg m−3; WHO, 2021) in the valley. Across the AV, more than 60 % of days in the year exceed these standards, with most stations located in urban areas (see Table S1 in the Supplement). Hence, the addition of external pollution sources has caused severe air quality episodes in the valley (SIATA, 2021).
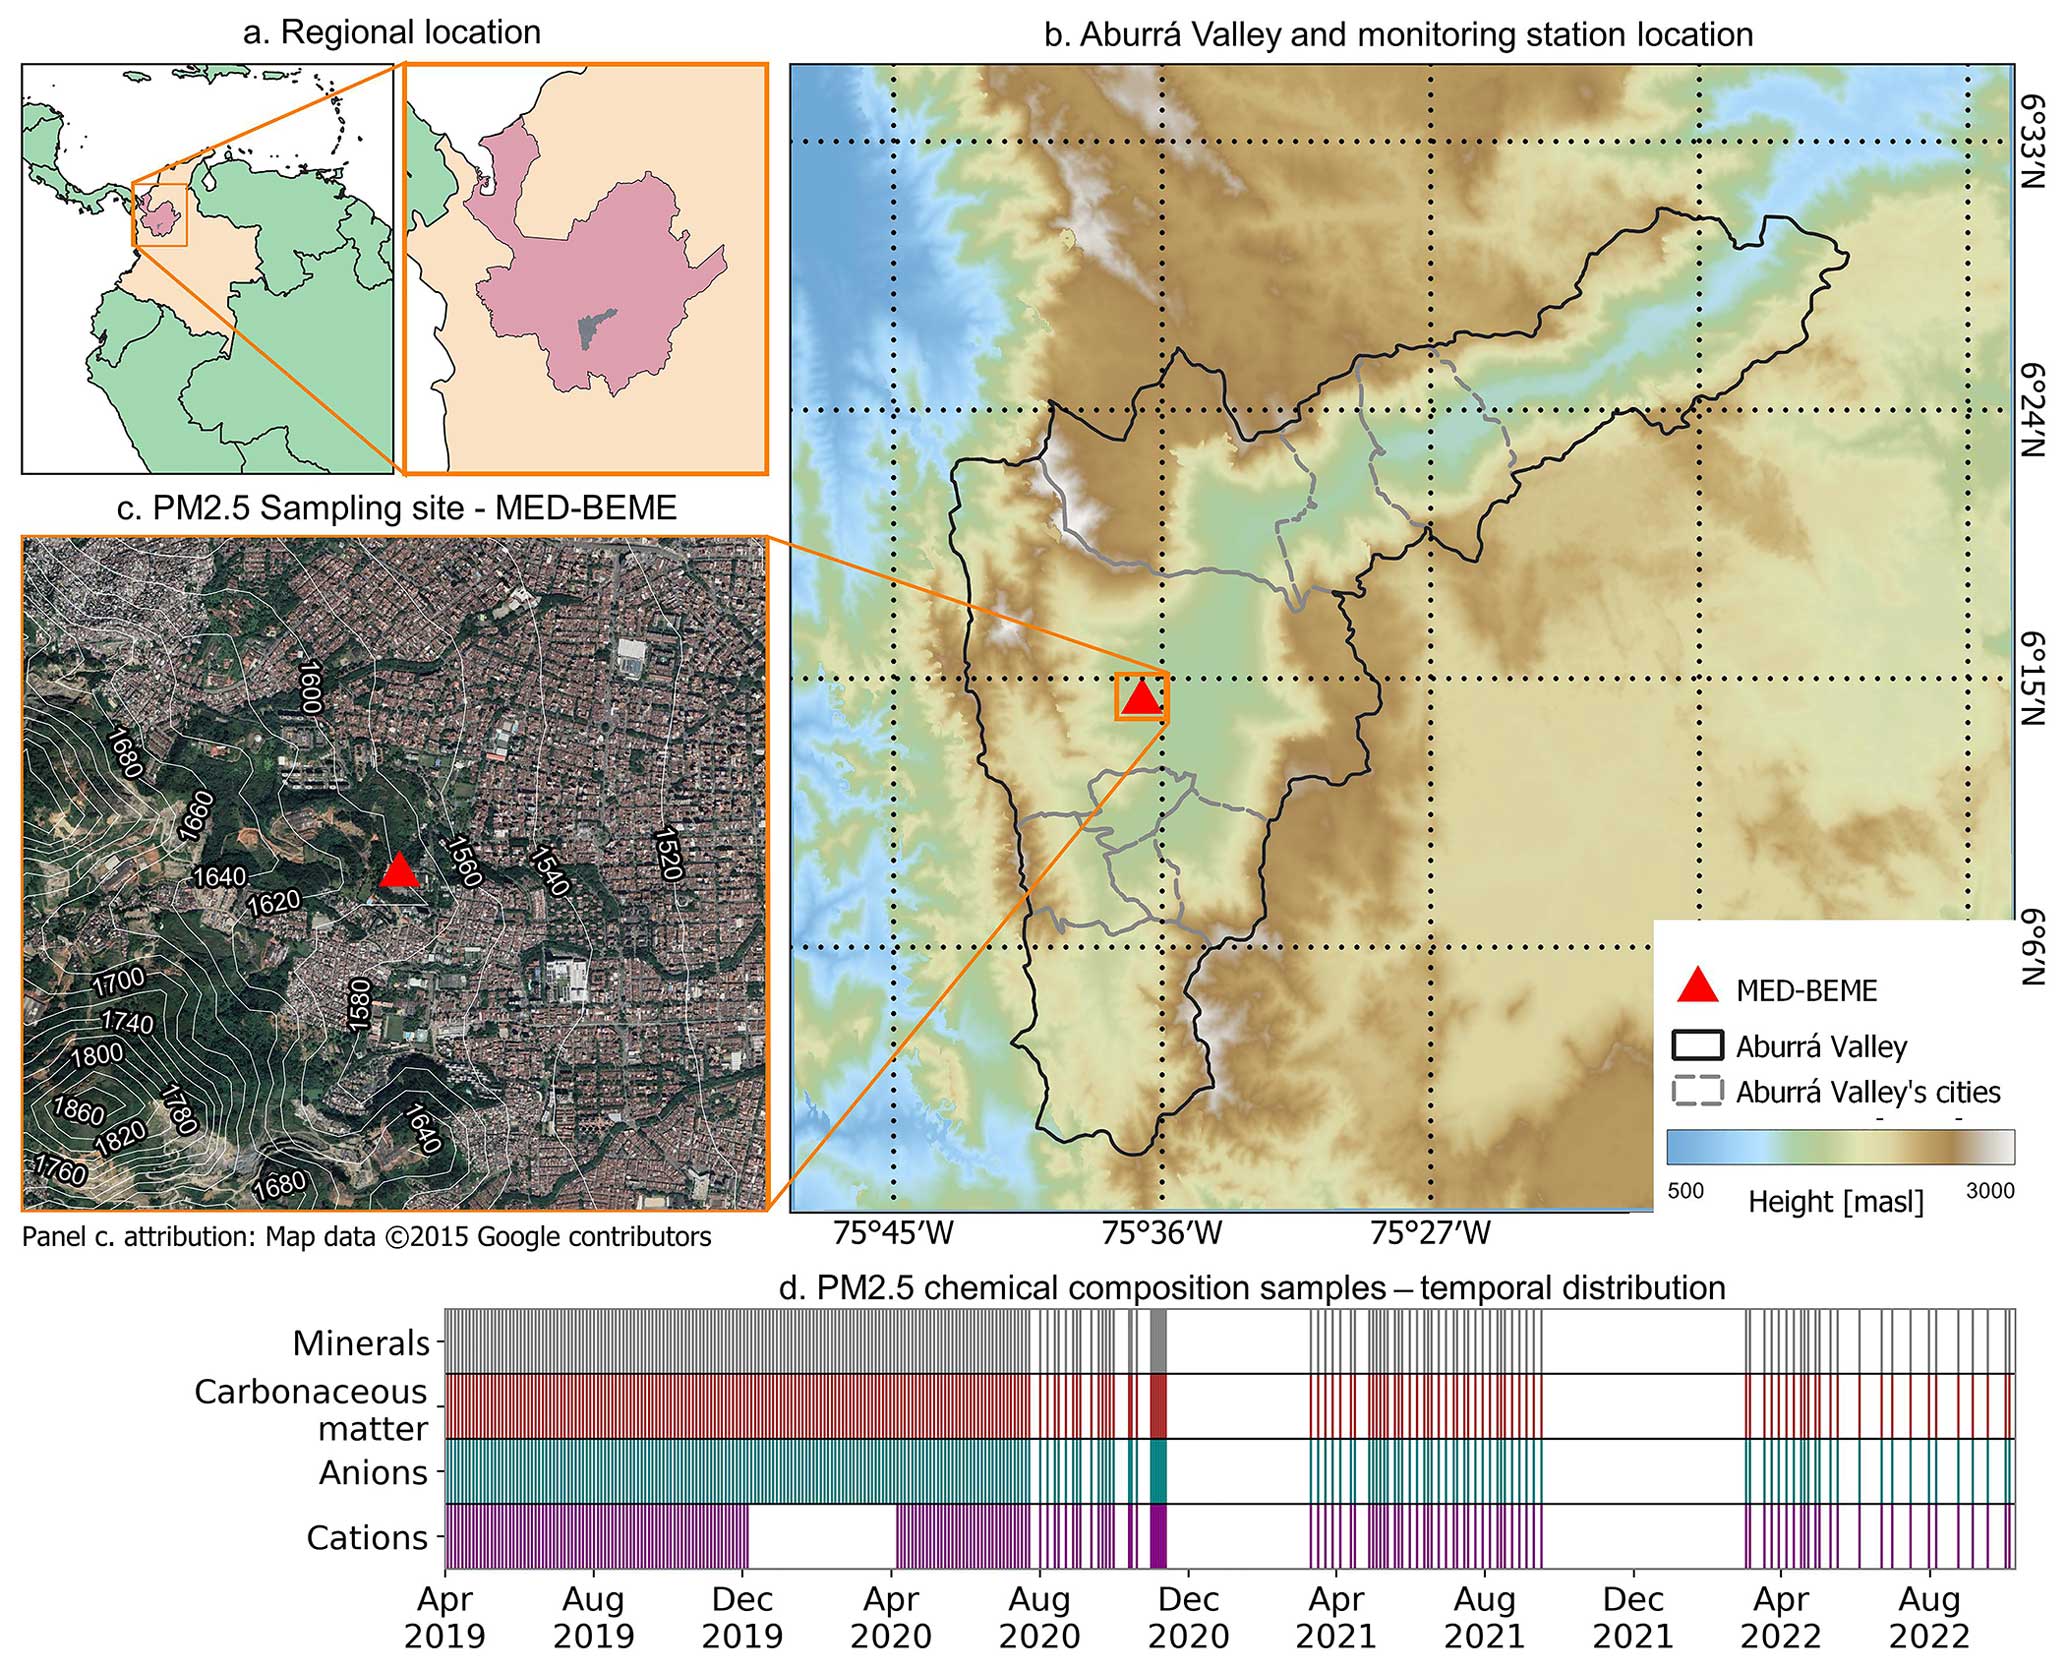
Figure 1(a) Regional location of the AV. (b) Map of the geomorphology of the AV and the distribution of the 10 municipalities (indicated by dashed gray lines). (c) Location of the station used for the PM2.5 sampling campaign (MED-BEME), represented by the red triangle in panels (b) and (c). (d) Temporal coverage of the PM2.5 sampling campaign, with white patches denoting “no-sampling” days.
The AV experiences two rainy periods corresponding to the latitudinal migration of the Intertropical Convergence Zone (ITCZ), with maximum precipitation occurring during April and November and minimum precipitation occurring during January and July. The transition period, i.e., February and March, is characterized by persistent atmospheric stability and a thinner atmospheric boundary layer, enhancing the accumulation of air pollutants (Herrera-Mejía and Hoyos, 2019). During this period of dry conditions, fires are more likely to spread in NSA, which affects air quality in the AV and neighboring regions (Mendez-Espinosa et al., 2019; Henao et al., 2021). These conditions modulate intra-annual variability in PM2.5 and PM10 (Mendez-Espinosa et al., 2019). During this period, the local authority for transport and the environment (Área Metropolitana del Valle de Aburrá) implements special controls for mobile sources, limiting daily vehicle use.
2.2 Data sources
2.2.1 PM2.5 sampling campaign
A sampling campaign was conducted at an urban background station from 3 April 2019 to 5 October 2022 to characterize the aerosol composition of PM2.5 filters. A total of 247 daily (noon-to-noon) PM2.5 samples were analyzed and recorded. Although an intense sampling campaign took place from April 2019 to July 2020, with samples collected every 3 d, the frequency of the surface site observations became less intense after 23 July 2020 (i.e., sampling intervals extended to a maximum of 2 weeks during periods of routine sampling). There were two extended gaps in the campaign from November 2020 to mid-March 2021 and from mid-September 2021 to March 2022. Despite the decrease in sampling frequency, the measurements still provide sufficient temporal coverage for obtaining robust seasonal and annual information on aerosol mass concentration and composition.
The samples were collected in Belén, Medellín, on the western slope of the valley by members of the GHYGAM (Grupo de Higiene y Gestión Ambiental) laboratory at the Politécnico Jaime Isaza Cadavid. The sampling campaign was hosted at the Institución Educativa Pedro Justo Berrio in Belén, Medellín (MED-BEME), a station in the official air quality monitoring network (see Fig. 1c). The sector has a brick factory, but in general, the local economy is based on services and small businesses. The residential areas and brick factory are around 250 and 620 m from the station, respectively. According to Gómez-Marín et al. (2021), the primary sources of PM2.5 detected at MED-BEME are the ceramic industry (22.2 %), emissions from BB (21.9 %), diesel (13.6 %), gasoline combustion (12.8 %), incineration (1.7 %), and coal-fired boilers (16.3 %).
The campaign considered minerals (Be, Na, Mg, Al, Si, K, Ca, Ti, V, Cr, Mn, Fe, Co, Ni, Cu, Zn, As, Se, Mo, Ag, Cd, Sb, Ba, Hg, and Pb), anions (F−, , , and Cl−), cations (K+, Mg2+, Ca2+, and Na+), and species of carbonaceous matter (OC1, OC2, OC3, OC4, OC5, pyrogenic carbon (PyC), EC1, EC2, EC3, EC4, EC5, EC6, OC, EC, and C). In particular, cations were measured only on 207 of the 247 sampling days. Figure 1d shows the temporal distribution of the samples throughout the study period. Note that measurements of some minerals (e.g., Na, Mg, K, Se, Ca, and Hg) finished in March 2021. The elements were analyzed using a 20.32 × 25.4 cm quartz filter in a high-volume PM2.5 ambient-air sampler (i.e., a Tisch Environmental TE-6070 sampler), following the Australian/New Zealand Standard 3580.9.14:2013 (Method 9.14; AS/NZS, 2013). Distinct analytical methodologies were applied to determine the concentrations of minerals, carbonaceous matter, and ions in the filters. Inductively coupled plasma mass spectrometry (ICP-MS) was used for minerals, a thermo-optical-transmission (TOT) methodology was used for carbonaceous matter, and ionic chromatography (IC) was used for both anions and cations. PM25 was additionally sampled by a low-volume sampler (i.e., a Tisch Environmental TE-Wilbur sampler), following the reference method described in Title 40 of the Code of Federal Regulations (Appendix L to Part 50), as suggested by the United States Environmental Protection Agency (EPA; US-EPA, 2011) and adopted by Colombian regulators (MinAmbiente-Colombia, 2010). The measured 24 h PM2.5 concentrations from the low-volume sampler are used in the positive-matrix-factorization (PMF) statistical model. Further details on the techniques and laboratory protocols are described in Gómez-Marín et al. (2021).
To complement the characterization of carbonaceous matter, secondary organic carbon (SOC) was calculated using the elemental-carbon tracer method (Huntzicker et al., 1986). This method assumes that the organic carbon measured comes from background, primary, and secondary sources and follows the relationships described in Eqs. (1) and (2).
Here, POC represents primary organic carbon, OCback represents background OC, OCtotal represents consolidated OC measured in the campaign, and (OCEC)pri represents the primary ratio between OC and EC.
Equation (1) describes a linear relationship for the composition of primary carbon matter. The linear model was calculated using the 20th percentile of OC and EC concentrations, aligning with the approach of Yao et al. (2020) and Lin et al. (2009). The process was repeated for each season – DJF (December–February), MAM (March–May), JJA (June–August), and SON (September–November) – due to the influence of weather conditions in the region. The resulting slope is interpreted as (OCEC)pri, and the intercept is given as OCback. After calculating (OCEC)pri and OCback, Eq. (1) was used to calculate POC for each sampling day using the measured EC concentrations. Then, SOC was calculated using Eq. (2).
This study involved creating four different linear regression models (Eq. 1) for the two dry periods (June–August and December–February) and two rainy periods (March–May and September–November). The square of the correlation coefficient (R2) showed the high performance of the models, with values ≥0.95.
2.2.2 PM2.5 concentrations
In addition to the campaign data, we downloaded hourly PM2.5 concentrations for MED-BEME from the official air quality monitoring network operated by the local early-warning system SIATA (Sistema de Alerta Temprana de Medellín y el Valle de Aburrá; https://siata.gov.co/, last access: 1 October 2024). PM2.5 concentrations recorded at MED-BEME from April 2019 to October 2022 coincided with the period and site of the chemical sampling campaign (illustrated in Fig. 1b). Daily average concentrations were calculated to match the (noon-to-noon) sampling schedule. Only days with at least 75 % of the hourly data were processed. Within our study period, we derived valid daily average concentrations for 96.7 % of the days investigated.
We found good agreement between the campaign instrument (i.e., the low-volume sampler) and the official automatic station (MED-BEME). For the study period, PM2.5 concentrations from the automatic instrument exhibited a minor overestimation compared to the reference method, with a mean bias error of −0.76 µg m−3. The corresponding mean absolute error (MAE) was 21.5 %. For PM2.5 measurements, using the low-volume sampler as a reference method provided better precision and accuracy than using the MED-BEME sensor (Tasić et al., 2012), which follows an equivalent method. Despite this, the official sensor provided continuous measurements, which are used in this study for more robust comparisons. Regarding temporal variability, the Pearson correlation coefficient was 0.84, highlighting good consistency between the methods.
2.2.3 CAMS reanalysis dataset
The European Centre for Medium-Range Weather Forecasts (ECMWF) provides atmospheric-composition datasets through the Copernicus Atmosphere Monitoring Service (CAMS; Inness et al., 2019). For this research, we utilized the ECMWF Atmospheric Composition Reanalysis 4 (EAC4) dataset. This global atmospheric-chemistry model simulates a range of key tracers of composition, using four-dimensional variational data assimilation to assimilate satellite retrievals of, for example, aerosol optical depth (AOD), carbon monoxide (CO), nitrogen dioxide (NO2), and ozone (O3) (Inness et al., 2019).
CAMS simulates different aerosols, and these results can be summed to determine the total AOD at 550 nm. To identify considerable loads from BB, dust, and volcanic aerosols, this study considers two AOD types – dust AOD (Du-AOD) and organic-matter AOD (OM-AOD) – and total column sulfur dioxide (TCSO2). The products were downloaded daily at the original 3-hourly resolution and then resampled to align with local noon-to-noon periods based on the sampling campaign schedule. Only reanalysis information for the sampling location was used.
2.2.4 Meteorological data
Meteorological data were obtained from version 5 of the ECMWF Reanalysis (ERA5; Hersbach et al., 2020). Fields of zonal and meridional winds, temperature, and moisture were obtained at temporal and spatial resolutions of 3 h and 0.25° (approximately 27 km), respectively. ERA5 data were up-sampled to a daily frequency to guarantee consistency with the chemical sampling campaign. Due to the poor performance of reanalyses in simulating precipitation in the region (Posada-Marín et al., 2019), satellite-based fields were retrieved from the final daily precipitation product (0.1° spatial resolution) provided by the Global Precipitation Measurement (GPM) mission (Huffman et al., 2019).
Further, back trajectories were used to estimate pollutants arriving at the chemical sampling point in the AV (see Fig. 1c), and 8 d trajectories starting at heights of 800, 750, and 700 hPa were run every 3 h, with a time step of 3 h. The basic model was created with SIATA and has been used in other investigations, such as Hoyos et al. (2019) and Pérez-Carrasquilla et al. (2023). This model only uses wind data from the GPM product's 4 h daily pressure levels, u-wind and v-wind data, and omega data (with a spatial resolution of approximately 2.5°) obtained from NCEP–NCAR Reanalysis 1 (provided by the National Centers for Environmental Prediction and National Center for Atmospheric Research; https://psl.noaa.gov, last access: 1 October 2024). To estimate every back position, the model follows Eq. (3), expressed as
where X is the location with vertical and horizontal coordinators, V is the wind vector, and t is time.
2.3 Identification and tracking of aerosol events
2.3.1 Identification of LRT events
Despite the fact that selected CAMS products cover the entire atmospheric column as well as the surface, CAMS has a high predictive capability for PM2.5 in the AV (Pérez-Carrasquilla et al., 2023). Furthermore, the CAMS products reasonably capture PM2.5 tendencies and extreme events in the territory (Casallas et al., 2022). Therefore, the magnitude of the CAMS products OM-AOD, Du-AOD, and TCSO2 in the AV were utilized to identify possible BB-LRT, Dust-LRT, and Volcanic-LRT events, respectively.
To help identify PM2.5 days that were subject to LRT events, the time series of the CAMS datasets were standardized. For each day, the time series average (mean) was subtracted from the daily value and then normalized by the time series standard deviation (i.e., 1σ). This allowed for the identification of LRT events using a range of subjective thresholds and the quantification of the corresponding PM2.5 concentrations and compositions. The thresholds investigated ranged from 0.8 to 2.0σ, but in this study, we present the results for thresholds of 0.8, 1.5, and 2.0σ. A 7 d rolling window was used to accurately identify prolonged and intense periods of LRT events. Within this window, at least 4 d of data had to have values above the respective thresholds to be classified as an LRT event. We subjectively chose 4 d of elevated values due to the sampling frequency of the campaign. Here, the temporal sampling interval of the campaign corresponded to ≥3 d, meaning these criteria were required to obtain representative samples of aerosol composition for the chemical characterization of the sources.
After identifying potential LRT events, the central day of the 7 d window was marked as the peak of the LRT event. Then, each day was labeled according to its distance from the peak of the LRT event in terms of the number of days (n) to the event (DtEn). Here, the peak of the event is labeled as DtE0, and the LRT events ranged from 3 d before (DtE−3) to 3 d after (DtE3) the peak event. Days outside the 3 d windows around DtE0 are typically identified as no-event days and are assumed to be independent of LRT events. Note that this methodology allows for continuous days to be marked as peaks for longer-lasting events.
Although the process described above was applied to every event and threshold, the results in this study are based on 0.8σ for BB-LRT and 1.5σ for Dust-LRT and Volcanic-LRT, as described in Sect. 3.1.
2.3.2 Regional meteorological analysis
A regional analysis of meteorological fields was performed during the LRT events to identify atmospheric conditions that favored aerosol transport from the sources of interest. Here, we derived anomalies for multiple meteorological variables by taking the values of the pixels and subtracting the average value of the corresponding month from each pixel value. Then, composites for days with different LRT events (i.e., days in the range of DtE−3 to DtE3) were calculated for both meteorological fields and anomalies. This approach helped to reveal particular meteorological conditions during days with aerosol LRT events. The results were further supported by analyzing air masses arriving into the AV using back trajectories during the LRT events. The number of times trajectories passed through a grid box was counted, and the percentage of occurrences was calculated, yielding an estimate of the probability that a particular grid box would experience an LRT event for each type.
2.3.3 Influence on local PM2.5 concentrations
Local measurements of PM2.5 were used to assess the influence of identified CAMS-based LRT events on air quality in the AV. The daily PM2.5 datasets were labeled with the number of days relative to the closest event peak (DtE) to compare concentrations before and after the events. Regarding the days before the event, a range of 15 to 4 d before the event peak (DtE−15 to DtE−4) was observed, while for the days after the event, a range of 4 to 15 d after the event peak (DtE4 to DtE15) was observed. These ranges were determined to ensure that there were enough data from the chemical sampling campaign for similar weather conditions to allow for comparison between the days affected by the LRT of aerosols and the days before and after. We used the Mann–Whitney U test to compare these periods. The null hypothesis was rejected with confidence levels of 90 % (p≤0.1) and 95 % (p≤0.05).
The COVID-19 lockdown period (1 April to 1 June 2020) was excluded from our records to avoid perturbations outside standard emission patterns in the region.
2.3.4 PMF and PM2.5 chemical composition
The PMF model is a receptor model developed by the EPA to analyze water and air samples. The model expresses observations of PM2.5 as a sum of the contributions from a number of (non-time-dependent) source profiles. In this case, we use the PMF model and our campaign measurement data on PM2.5 chemical composition and PM2.5 concentrations to identify the dominant factors/sources (e.g., coal combustion, vehicular emissions, and secondary pollution) during each type of LRT event (i.e., BB, dust, or volcanic LRT events). For the AV, five to seven factors (i.e., sources) have been suggested (see Gómez-Marín et al., 2021).
The PMF model is mathematically expressed as follows (Paatero and Tapper, 1994):
The objective of the PMF model is to determine the values of gik, fkj, and N (i.e., the number of factors) that best reproduce Xij. Here, Xij represents the measurement data for sample i (daily temporal resolution) and chemical component j. An inversion approach is used for this matrix problem, employing an iterative scheme to converge on the solutions for gik and fkj. In the factorization problem, fkj contains the concentration of each chemical component (j) in the unit profile for factor k (i.e., the PM2.5 source). The matrix gik, the contribution factor, defines how much of the profile is counted in the total concentration for day i. Moreover, eij contains the residual for each compound per sampling day. Outputs from the PMF model include statistical metrics that help to evaluate the model's performance, such as the correlation coefficient (R2), the recuperated mass (RM percentage), and the objective function value (Q). The PMF model adjusts gik and fkj to minimize the function Q in Eq. (5) (Paatero, 1997).
where μij represents the uncertainty for each compound/sampling day.
The model uses two input uncertainties. The first is the species uncertainty (μij), which does not change throughout the process and aligns with the unique method used for each species sampled. In this study, μij considers measurement and analytical errors, such as uncertainties in the volume of air processed, filter area, and species mass, as well as uncertainties in the detection limit of the measurement method. The last uncertainty corresponds to the analytical uncertainty and was calculated by following the approach used in Noris and Duvall (2014), employing the corresponding method's detection limit, as suggested by Eugene Kim and Qin (2005). However, for PM2.5, we followed the approach of Eugene Kim and Edgerton (2003), who set μij (where j represents PM2.5 for day i) to be greater than the daily PM2.5 concentration (i.e., 3 times the concentration in this study). The second uncertainty in μij is recognized as the “extra modeling uncertainty”. It is added to the model as a percentage to account for other inherent errors, such as variations in source profiles and chemical transformations in the atmosphere. A range of 10 % to 16 % was tested for PMF for each type of LRT event, which aligns with the approach used in other studies (Callén et al., 2009; Shin et al., 2022; Salim et al., 2019).
During the modeling process, species can be classified as “strong”, “weak”, or “poor” based on individual statistics. The weak category triples the uncertainty μij, and the poor category excludes the species from the model. Two statistics are key for categorizing the species. First, the signal-to-noise ratio () represents overall uncertainty relative to concentration. is generally classified as poor because the uncertainty exceeds twice the concentration (Noris and Duvall, 2014). The second is the regression diagnostic with R2, which provides information about the linear relationship between the observations and modeled concentrations for each species.
The model convergence evaluation statistics consider this classification using the ratio. Qexpected is the theoretical value of Q (Eq. 5) and is expressed as
where n is the number of sampling days and ms is the number of strong species used for modeling (Noris and Duvall, 2014).
We expected to obtain relatively small temporal samples (i.e., a low number of days) from the measured pollutants for each LRT type in the PMF model since the targeted LRT events did not cover the majority of days during the PM2.5 chemical sampling campaign. Nonetheless, multiple studies, with PMF samples ranging in number from 14 to 30, have reported useful and meaningful results (Yu et al., 2015; Haghnazar et al., 2022; Via et al., 2022). As the sample dataset decreases, rotational ambiguity caused by infinite valid solutions strongly affects the results and increases overall uncertainty (Manousakas et al., 2017). To mitigate the error, version 5.0 of the EPA PMF software allows for the estimation of the effects of random errors and rotational ambiguity on the dataset using bootstrapping (BS) and displacement (DISP) tools. While BS evaluates random errors by performing 100 runs with randomly relocated blocks of observations from the original dataset, DISP focuses on indicating rotational ambiguity by adjusting all values in the factors profile up or down. This is restricted to four permitted changes controlled by the maximum differential of Q (dQmax), i.e., the maximum permitted change in Q calculated by the PMF model, and monitoring major factor swaps (Noris and Duvall, 2014).
Additionally, constraining the base run can improve the solution when data are limited by reducing the rotational space (Dai et al., 2020). The PMF software include functions to “pull down maximally”, “pull up maximally”, “set to zero”, and manually set the profile concentrations. While the first two options are soft constraints, the third and fourth are hard constraints and require a high level of confidence in the magnitude of the profile contributions. For this study, only soft constraints were considered. The constraint increases the final Q value, with a differential (dQ) that should be less than 5 %, which represents the recommended maximum change (Noris and Duvall, 2014). For this study, the dQmax percentage was set by default to <0.5 %.
Due to missing data, all species except cations were included in the model. Only total OC and EC from carbonaceous matter were included for Dust-LRT and Volcanic-LRT events since incorporating all carbon species could have disproportionately influenced the results and overshadowed tracer elements for the sources. For such LRT events, the potential run period was reduced until April 2021 since the tracer minerals Na, K, and Mg were not measured afterward.
The factor interpretation of this study was strongly supported by the source characterization made by Gómez-Marín et al. (2021) for the studied station.
A final comparison of the characterized compounds was conducted, focusing on the days when a positive contribution occurred for the LRT events (gik>0) and the days categorized as occurring before events (DtE−15 to DtE−4) and after events (DtE4 to DtE15).
This section is divided into four subsections. The first subsection identifies potential aerosol events pertaining to BB-LRT, Dust-LRT, and Volcanic-LRT. The second is focused on the temporal and regional characterization of these events, including descriptions of the associated meteorological patterns and possible aerosol sources. Finally, the third and fourth subsections locally assess the identified events using ground-level PM2.5 concentrations and chemical compositions, respectively.
3.1 Identification of LRT events
The products OM-AOD, Du-AOD, and TCSO2 from the CAMS reanalyses were used to identify aerosols from BB-LRT, Dust-LRT, and Volcanic-LRT, respectively. Table 1 shows different statistics for identifying each type of event using thresholds of 0.8σ, 1.5σ, and 2.0σ. The most intense events reached maximum magnitudes of 0.66 for OM-AOD (30 March 2020), 0.11 for Du-AOD (24 June 2020), and 1.96 mg m−2 for TCSO2 (10 September 2022). On these days, the products exceeded the average magnitudes for the target events by more than 2 times for OM-AOD and TCSO2 and by more than 5 times for Du-AOD. Notably, OM-AOD was responsible for 77 % of the total AOD modeled in the most intense event. Regarding variability, all identified events showed high variability, with standard deviations around 42 %, 90 %, and 35 % of the average for OM-AOD, Du-AOD, and TCSO2, respectively.
Table 1Statistics for OM-AOD, Du-AOD, and TCSO2, representing BB-LRT, Dust-LRT, and Volcanic-LRT, respectively.
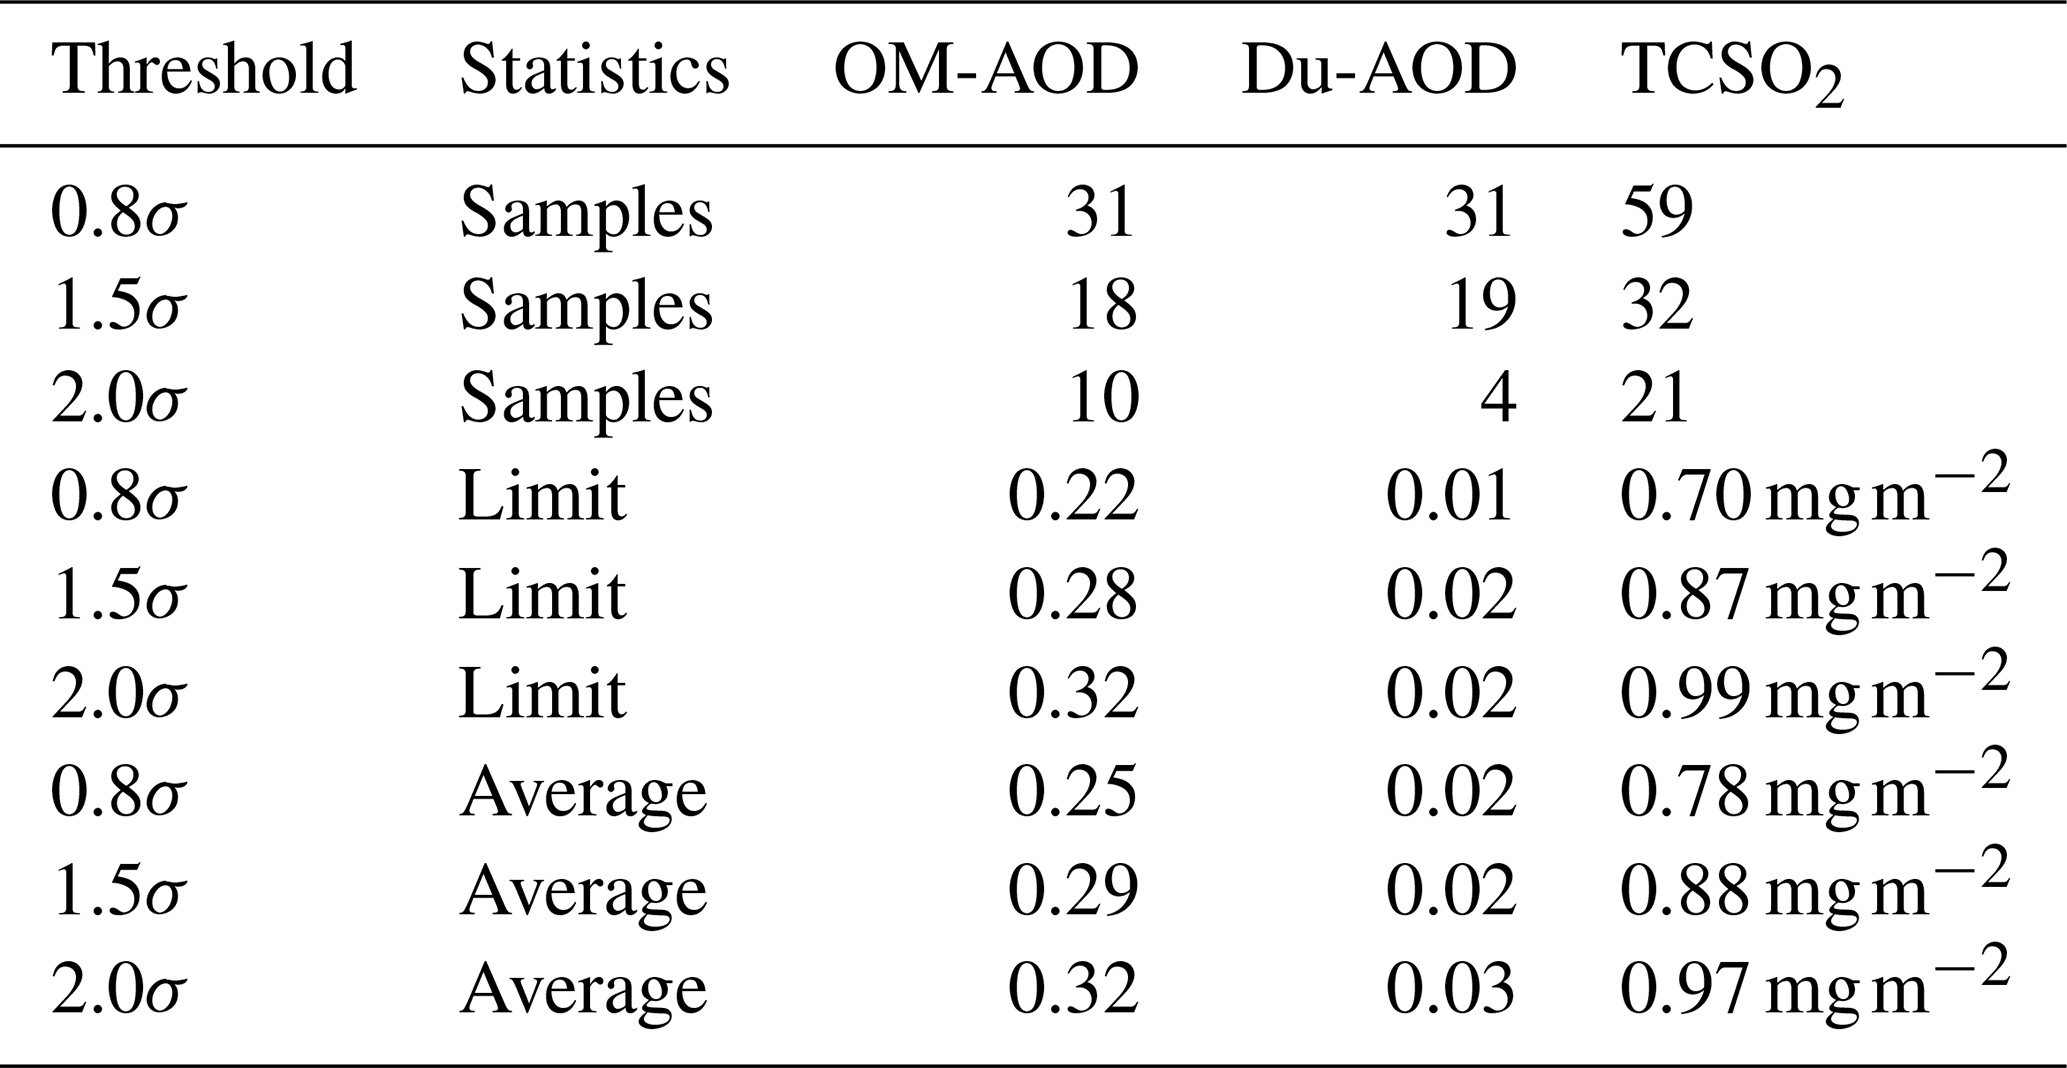
The term “samples” refers to the number of sampling days available for PMF characterization. Each threshold limit defines the calculated absolute magnitude. Note that AOD is a dimensionless quantity.
Figure 2 shows the average behavior of each variable, centered around the event peak for thresholds of 0.8σ, 1.5σ, and 2.0σ. The events exhibit a clear peak centered on DtE0 for most of the considered thresholds. However, events identified with a 2.0σ threshold exhibit noisier behavior around the peak for BB-LRT and Volcanic-LRT. In particular, OM-AOD exhibits a second peak after the event peak. This may be caused by the smaller sampling size or the higher aerosol loads, which do not meet the duration criteria for the threshold. Besides, the strictest threshold (2.0σ) results in a considerable reduction in the number of studied events (see Table 1), which is critical for the assessment of PM2.5 chemical composition.
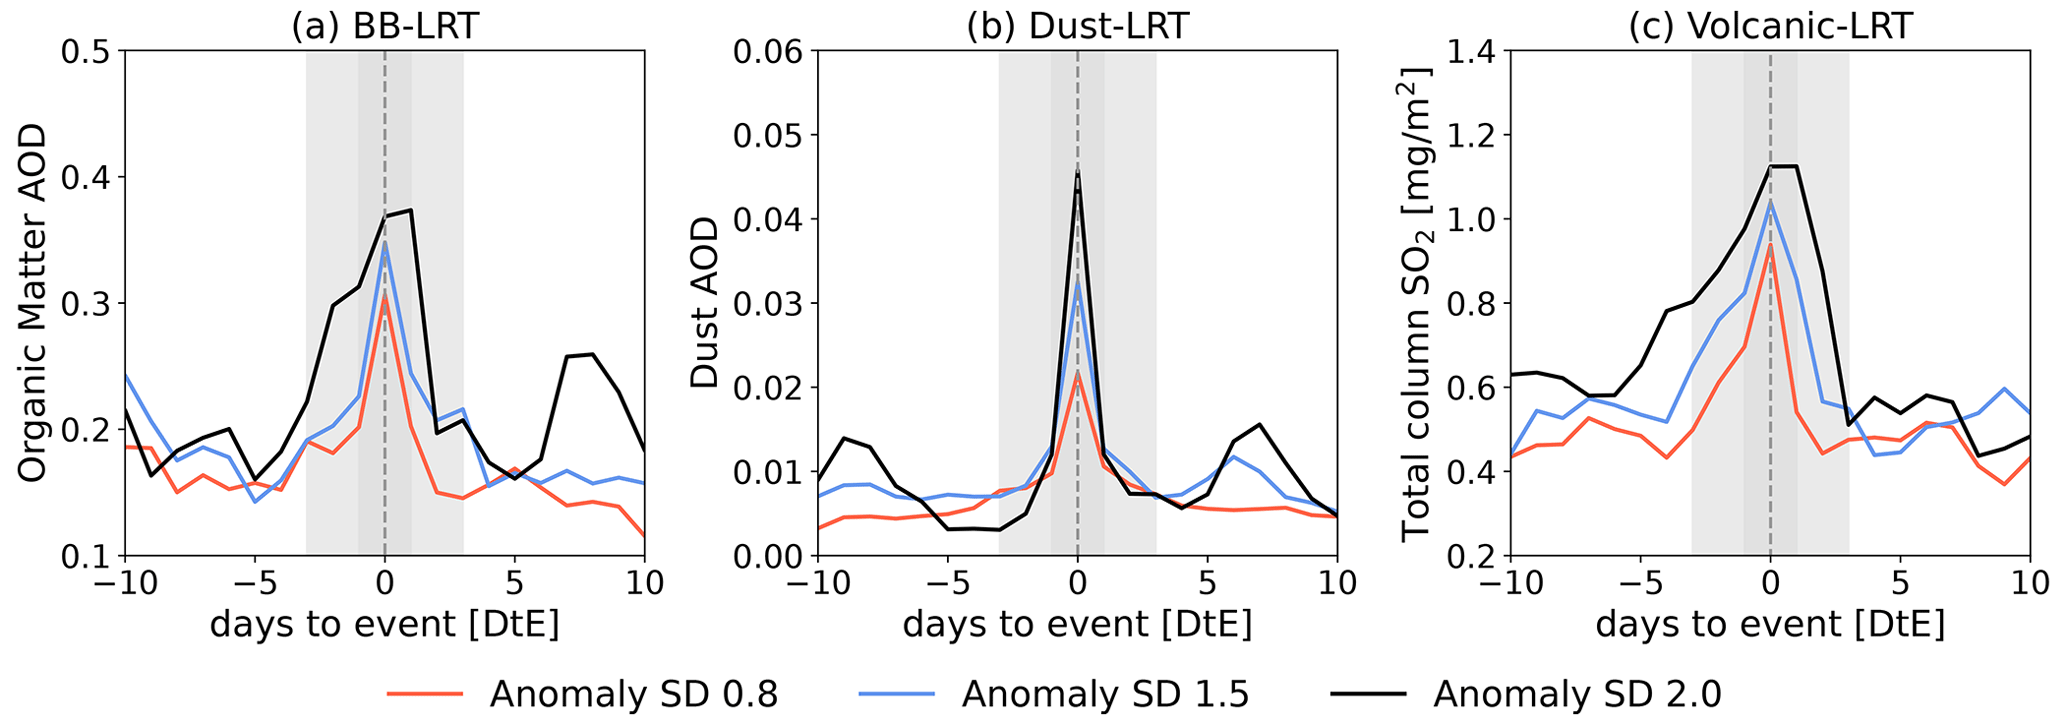
Figure 2Average magnitudes of (a) OM-AOD, (b) Du-AOD, and (c) TCSO2 concentration around the events. Different colors represent different anomalies. The shaded region delimits the event. Du-AOD is represented on a scale that is 10 times smaller than the scale used for OM-AOD.
For each type of LRT event, we selected a single σ threshold value. Based on the results and literature about the expected frequency of each type of event for the city (Mendez-Espinosa et al., 2019; SIATA, 2021), we selected events that exceed 0.8σ for BB-LRT and events that exceed 1.5σ for Dust-LRT and Volcanic-LRT. Anomalies exceeding 2.0σ significantly limited the number of days used in the analysis, whereas using 0.8σ probably resulted in the oversampling of volcanic-aerosol and dust aerosol load events since these are recorded as extremely infrequent events. Moreover, the selection ensures annual representation for each event (see Fig. S2 in the Supplement). BB-LRT, Dust-LRT, and Volcanic-LRT events were all detected during the complete study period, occurring within at least 3 years of each record. These events typically occurred on 13 %, 8 %, and 13 % of days in the year, respectively. With this selection, the sampling campaign can represent BB-LRT, Dust-LRT, and Volcanic-LRT events in the PMF model with 31, 19, and 32 samples, respectively.
3.2 Regional analysis of events
Regional analysis was conducted to establish the meteorological conditions that may favor air pollution LRT events and identify potential aerosol sources. The average spatial distributions of OM-AOD, Du-AOD, and TCSO2 during the aerosol LRT events are shown in Fig. 3, along with the integrated back trajectories of air masses arriving into the AV. OM-AOD values above 0.2 occur over most of Colombia during BB aerosol events (Fig. 3a), consistent with a high number of fire hotspots in northern South America (Venezuela and Colombia). In particular, back trajectories during these days indicate that a large percentage of air masses arriving into the AV (10 % to 20 %) come from the northeast, where OM-AOD exhibits its peak values (exceeding a magnitude of 0.35).
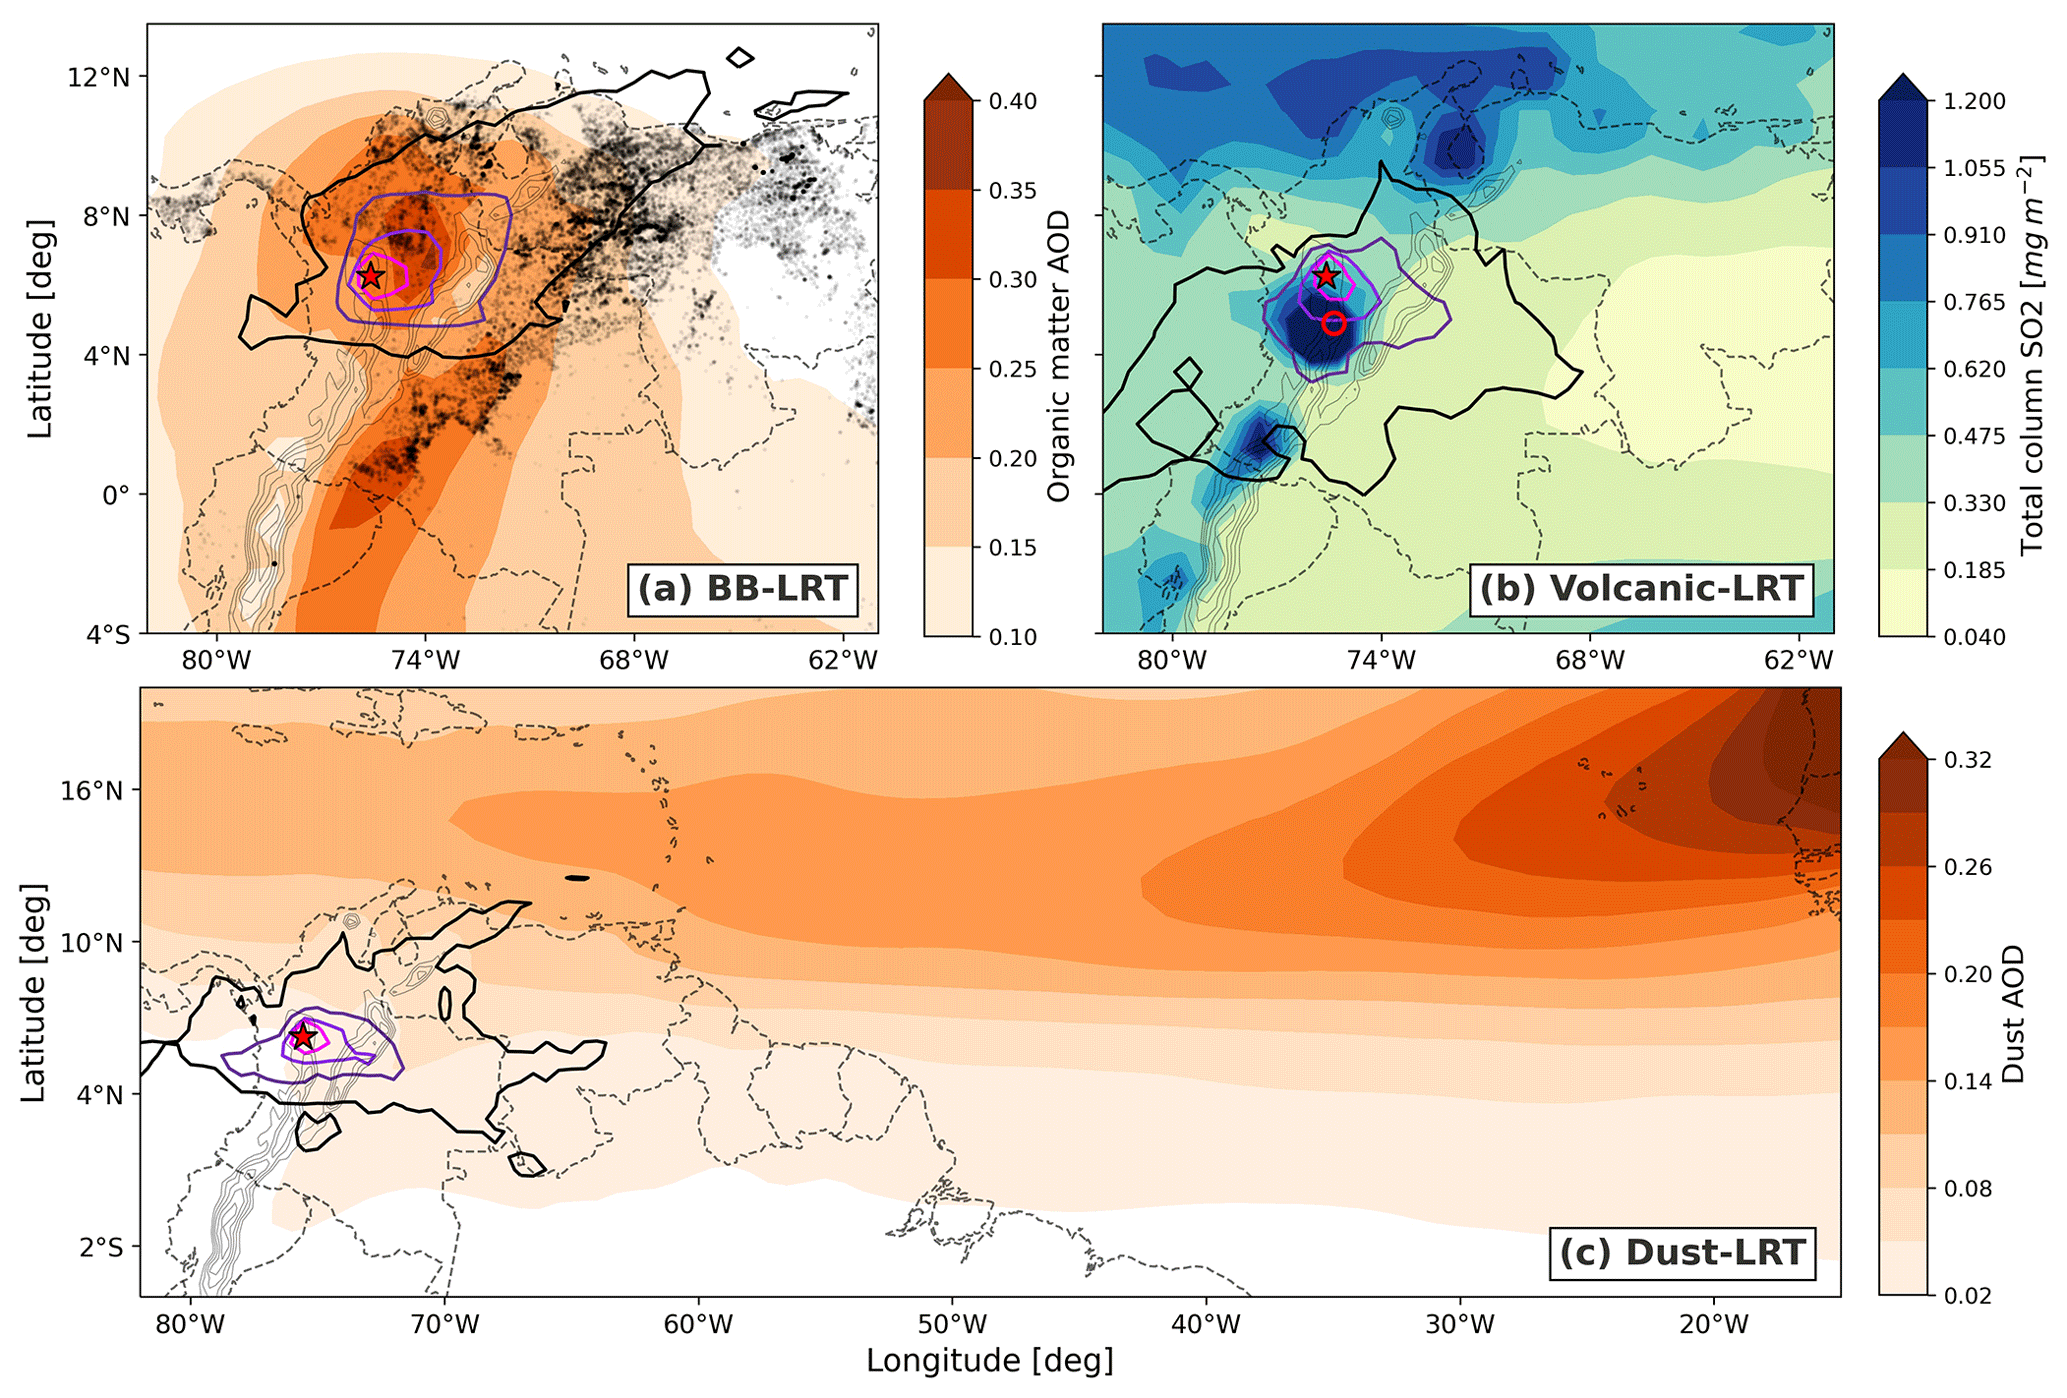
Figure 3Mean spatial distribution of (a) OM-AOD, (b) TCSO2, and (c) Du-AOD for days with each type of LRT event. Solid contours (ranging in color from pink to black) enclose the regions from which 20 %, 10 %, 5 %, and 1 % of air masses arrive into the AV according to the back trajectories. The gray dots in panel (a) indicate MODIS-retrieved hotspots associated with fires (70 % confidence level). In each panel, the red star marks the location of the AV, while the red circle in panel (b) marks the location of Nevado del Ruiz. The thin black contours show terrain elevation from 1500 to 5000 m a.s.l.
Volcanic-LRT (Fig. 3b) shows high SO2 values (over 1.2 mg m−2) in the atmospheric column above Nevado del Ruiz (hollow red circle). Additionally, two other spots are evident: the first, located in southwestern Colombia, could be related to another degassing volcano, Galeras, whereas the other is located over Lake Maracaibo in the northeast of Venezuela, exhibiting relatively high values that are possibly associated with oil extraction (see Fioletov et al., 2016). According to the back trajectories, during Volcanic-LRT events, around 10 % of the air masses arriving into the AV come from the southeast, where the Nevado del Ruiz hotspot exists. A smaller fraction of air masses (1 %) arrive from the hotspot in the southwest of Colombia (i.e., Galeras). Similarly, there is clear propagation of dust aerosol from the Sahara toward the Caribbean and, to a lesser extent, NSA (see Fig. 3c). While air masses for BB-LRT and Volcanic-LRT exhibit different trajectories, most air masses that reach the AV during Dust-LRT events come from the east.
Despite the short study period, the identified events suggest a marked annual cycle (Fig. 4). For March, 50.0 % of studied days correspond to BB-LRT events. April and February also show high proportions of BB-LRT events (43.3 % and 24.8 %, respectively). Dust-LRT events exhibit two seasonal peaks (in April and July), with proportions of 23.3 % and 23.4 %, respectively. The distribution of Volcanic-LRT events covers June to September, with a clear peak observed in August, exhibiting a frequency of 49.2 %. Additionally, as shown in Fig. 4, external events overlap in some cases. The highest occurrence of combined LRT events was observed in April and comprised BB-LRT and Dust-LRT events, while BB-LRT and Volcanic-LRT events showed substantial overlap in September. Here, for example, days defined as corresponding to both BB-LRT and Dust-LRT were added to the joint classification (i.e., “BB-LRT & Dust-LRT” in Fig. 4) and were not included in the respective singular classifications. Overall, the annual cycle of these LRT event occurrences and local PM2.5 concentrations show that the influence of LRT on measured PM2.5 is non-linear.
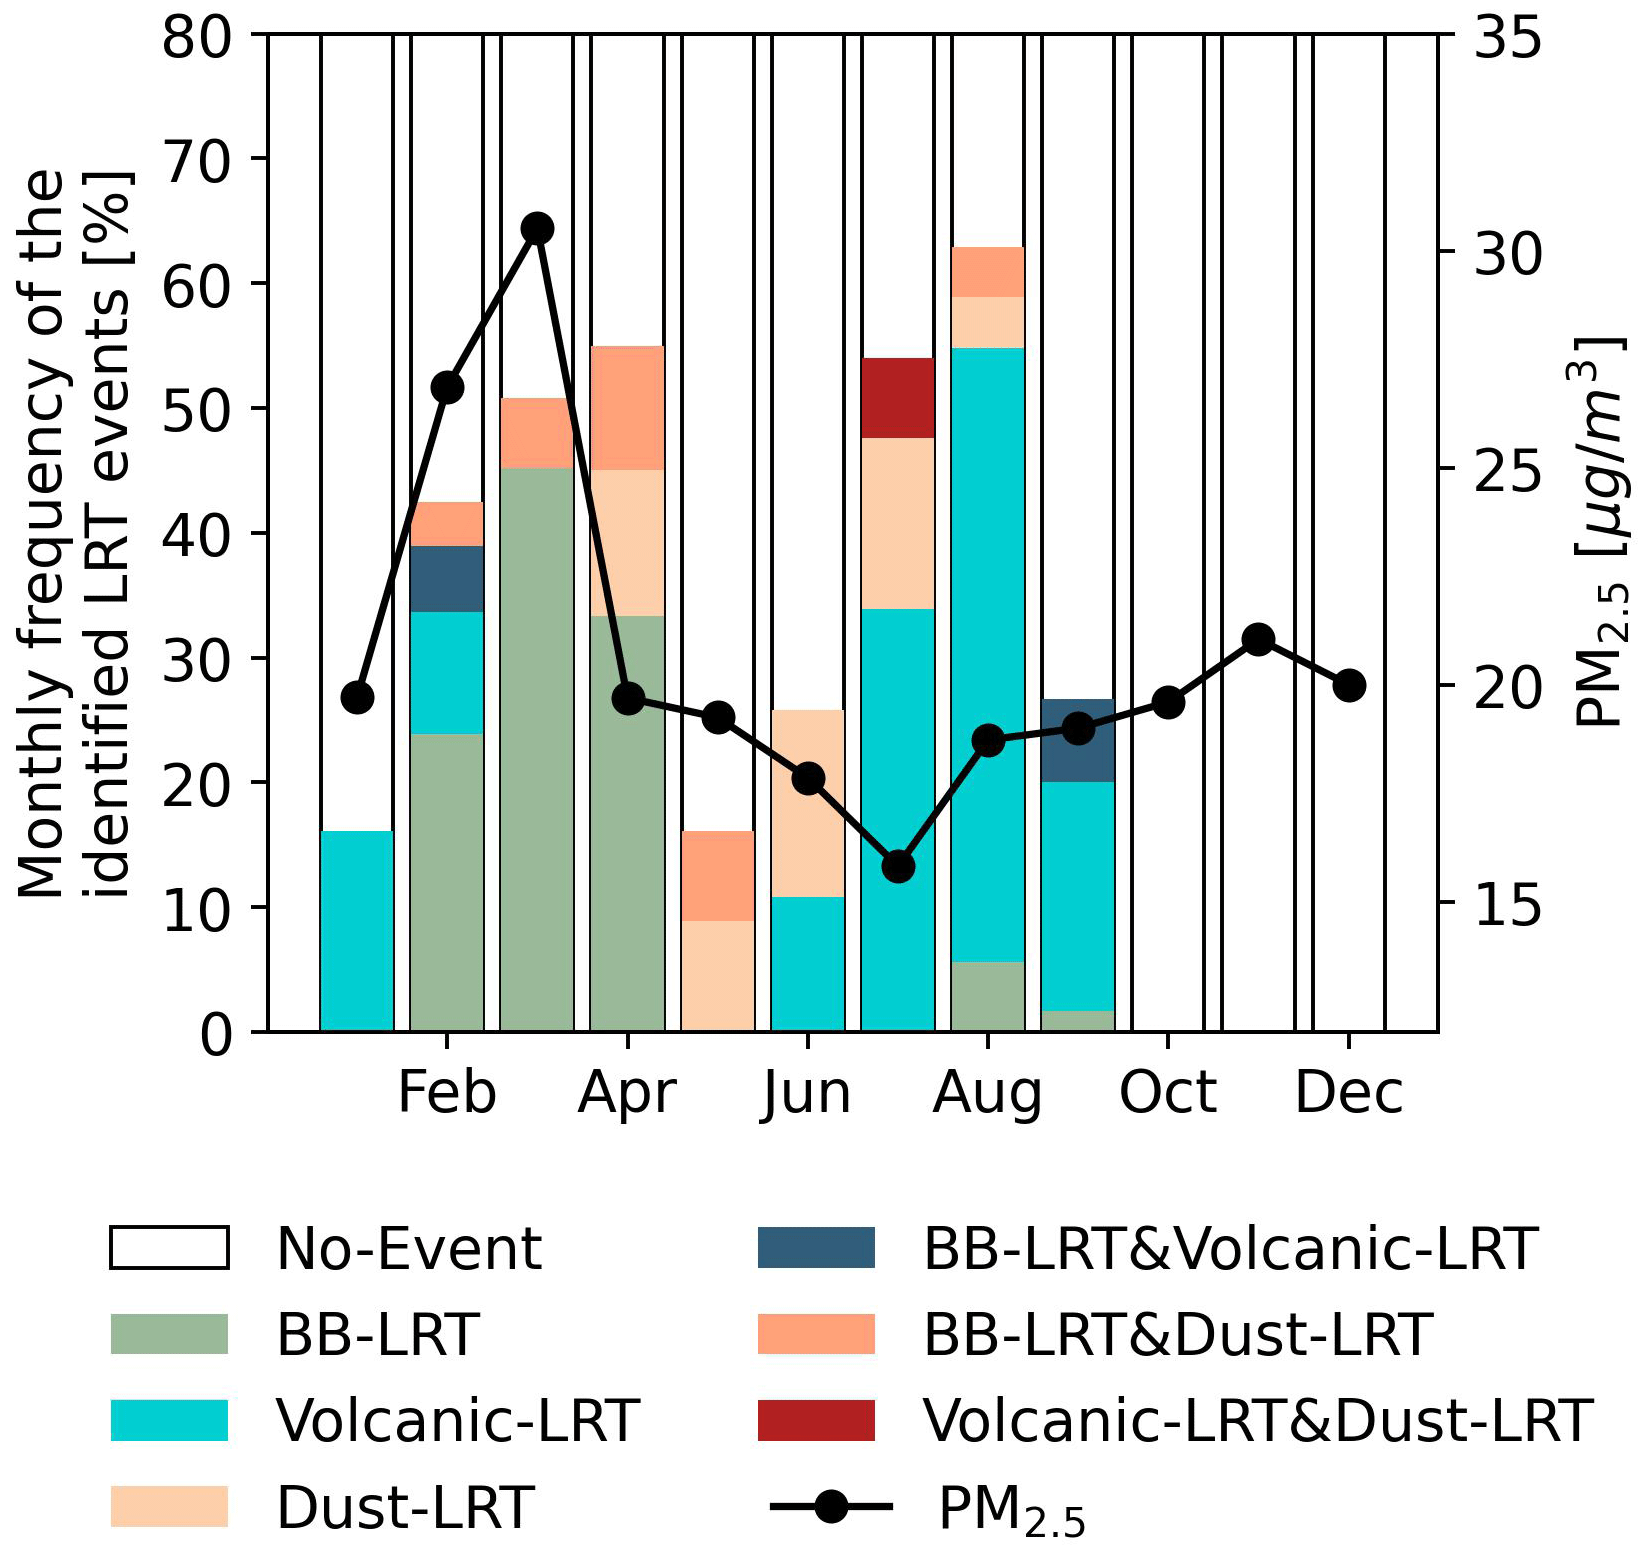
Figure 4Monthly frequency of days with BB-LRT events (green bars), Dust-LRT events (light-orange bars), and Volcanic-LRT events (blue bars), as identified in the CAMS reanalysis. Overlapping events are depicted with bars colored dark blue (BB-LRT and Volcanic-LRT events), orange (BB-LRT and Dust-LRT events), and red (Volcanic-LRT and Dust-LRT events) since different LRT events can happen at the same time. White bars represent the frequency of days without LRT events, while the black line shows the monthly average PM2.5 concentration (µg m−3) for MED-BEME.
Although LRT events display marked seasonality, a significant percentage of days in each month experience negligible impacts resulting from LRT events (see Fig. 4). This suggests that intra-seasonal variations are also relevant for explaining the occurrence of these events. To isolate specific meteorological patterns during LRT event days, Figs. 5 and 6 present composites of meteorological variables for the lower troposphere (800 to 700 hPa) and the middle troposphere (600 to 400 hPa) for the different kinds of events. The Andes Mountains generally cause large spatial variability in the low-level wind field. Winds from the east of the Andes Mountains cross the mountain range through two zones of relatively low altitude (hereafter referred to as mountain passes), which are demarcated with white boxes (see Fig. 5a–c).
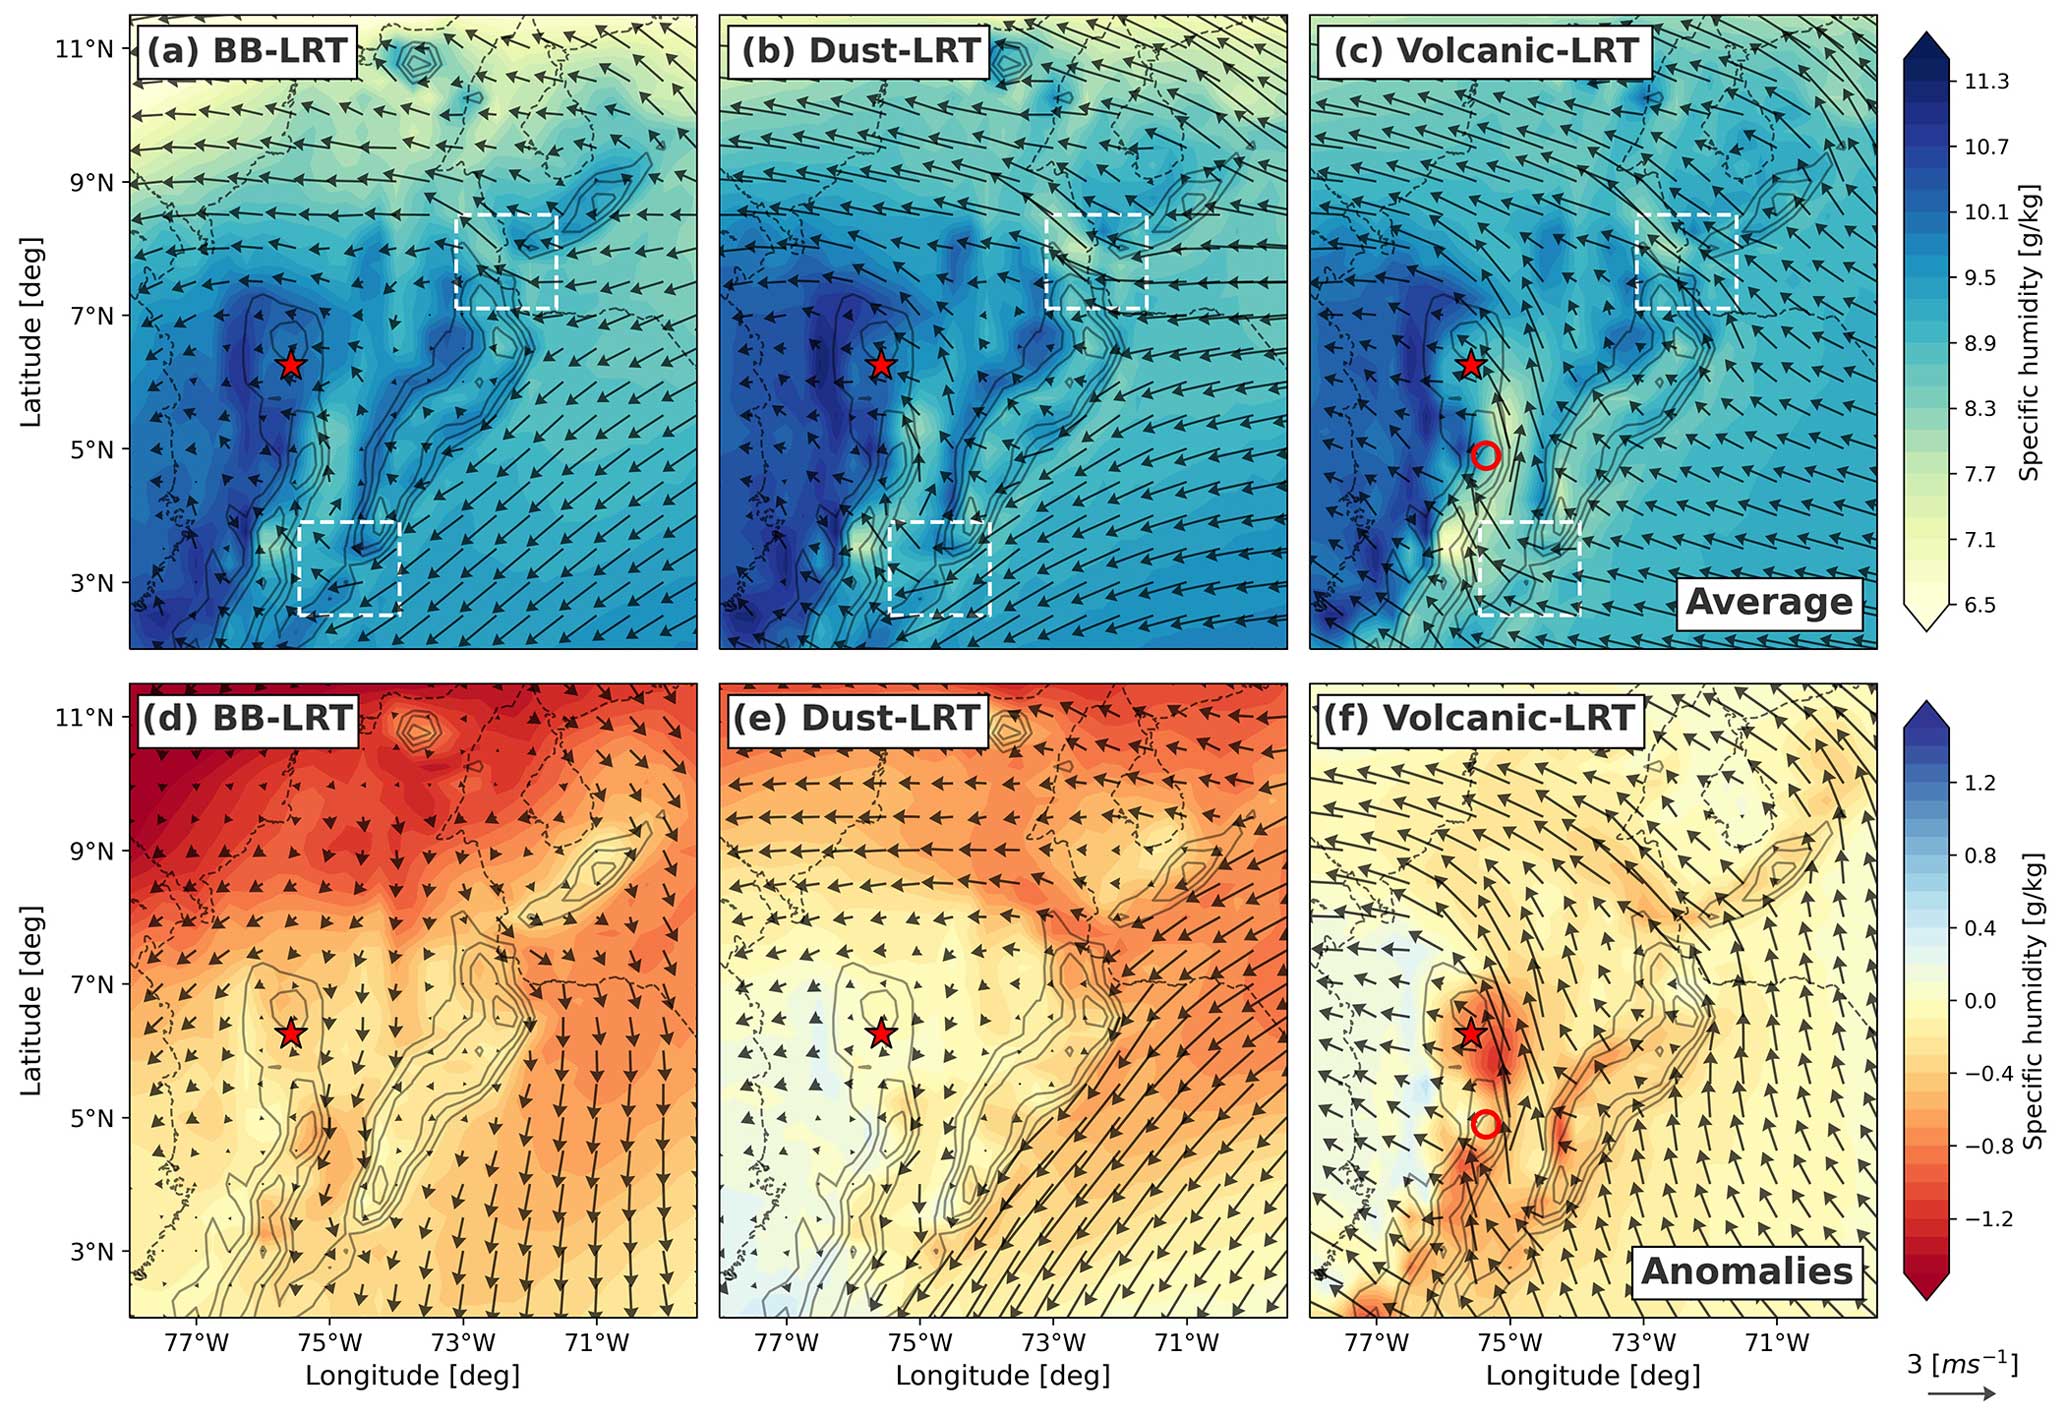
Figure 5Meteorological composites for low-level (800 to 700 hPa) winds and specific humidity during days with (a) BB-LRT, (b) Dust-LRT, and (c) Volcanic-LRT events. (d–f) Composites are the same as in panels (a), (b), and (c), but they pertain to the anomalies. The red star marks the Aburrá Valley, and the red circle in the panel (c) marks Nevado del Ruiz. The white rectangles mark the two mountain passes in the Colombian Andes. The black contours show terrain elevation from 1500 to 5000 m a.s.l.
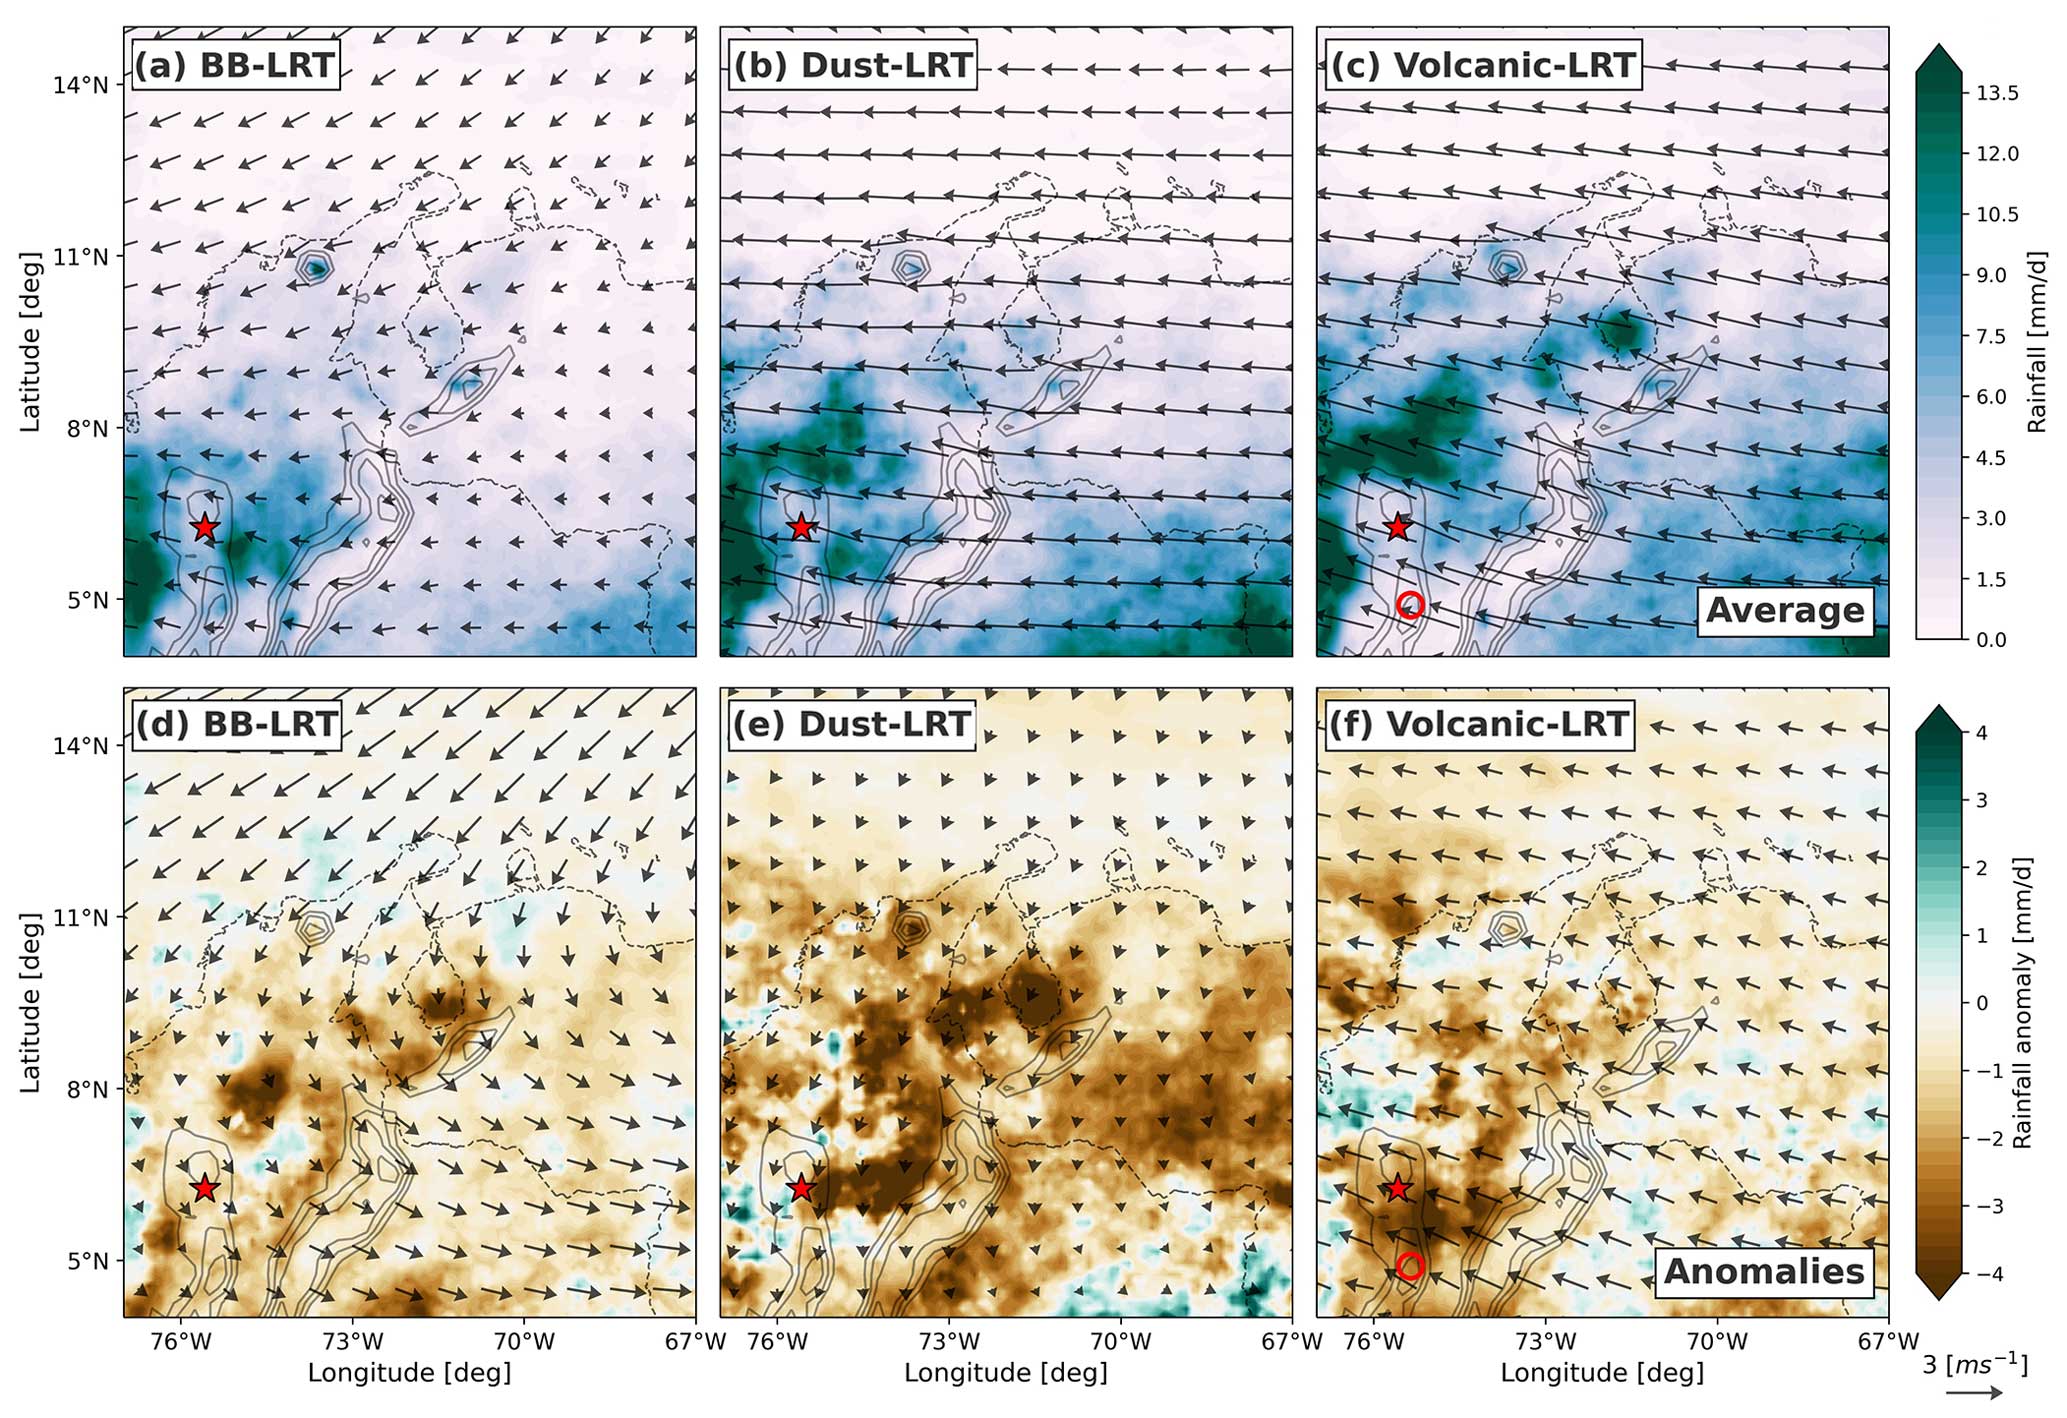
Figure 6Meteorological composites for mid-level (600 to 400 hPa) winds and rainfall during days with (a) BB-LRT, (b) Dust-LRT, and (c) Volcanic-LRT events. (d–f) Composites are the same as in panels (a), (b), and (c), but they pertain to the anomalies. The red star marks the Aburrá Valley, and the red circle in panel (c) marks Nevado del Ruiz. The black contours show terrain elevation from 1500 to 5000 m a.s.l.
Anomalous dry winds of around 1 m s−1 originate from the north during BB-LRT events (Fig. 5d), connecting the AV with the high-OM-AOD region. Additionally, winds blowing from Venezuela, where multiple BB hotspots were identified, reach northern Colombia through the mountain pass located north of the Andes Mountains, at the border between Colombia and Venezuela (see Fig. 5a). Low-level winds during LRT events align with the back trajectories shown in Fig. 3a. A reduction of 2 to 3 m s−1 in the intensity of mid-level winds (between 5 and 8° N; see Fig. 6a and d) was also observed, along with less rainy conditions (anomalies of around −2 mm d−1) in northern Colombia.
For Dust-LRT events, low-level winds flow across the two mountain passes in the Andes Mountains (Fig. 5b), with increased easterly winds observed north of Colombia and increased northeasterly winds found east of the Andes Mountains (Fig. 5e), representing dry flow from the Atlantic Ocean, where Du-AOD is higher. Figure 6b and e show that mid-level winds exhibit a notable eastward direction, with anomalous winds coming from the Caribbean and a rainfall reduction of 3 to 4 mm d−1 in NSA.
Finally, days with Volcanic-LRT events are characterized by southeasterly winds traveling toward the AV (see Fig. 5c) from the Nevado del Ruiz region. Here, the southeasterly wind anomalies reach 3 m s−1, resulting in stronger transport across the southern mountain pass, as shown in Fig. 5f, and drier air reaching the AV. Less rainy conditions are also present in the Colombian Andes (Fig. 6f), particularly between the AV and Nevado del Ruiz, where a reduction in rainfall of around 3 mm d−1 is observed.
Overall, the three types of events (BB-LRT, Dust-LRT, and Volcanic-LRT) are accompanied by drier and less rainy atmospheric conditions in northern Colombia, Venezuela, and the Andes Mountains, respectively. Here, rainfall and specific humidity anomalies are typically larger (in absolute terms) than −4 mm d−1 and −1 g kg−1, respectively. These results highlight the importance of precipitation control on aerosol LRT to the AV (i.e., a lack of precipitation aids the LRT of aerosols).
3.3 PM2.5 concentration change
After identifying LRT events and the meteorological conditions favoring them, an analysis of local surface PM2.5 was undertaken to understand the influence of LRT on the AV's air quality. Figure 7 compares the PM2.5 concentrations observed before (DtE−15 to DtE−4), during (DtE−3 to DtE3), and after (DtE4 to DtE15) each event. BB-LRT exhibited the largest PM2.5 increments, especially during DtE0. Moreover, 86.7 % of values during the peak day exceeded the average PM2.5 concentration for the study period (20.25 µg m−3). Over half of the PM2.5 concentrations during DtE0 exceed twice the WHO (2021) guidelines for daily concentrations (15 µg m−3). During DtE0, the average PM2.5 concentrations (31.48 µg m−3) were significantly higher than those corresponding to the surrounding days (p≤0.05), according to the Mann–Whitney U test. Similarly, the event days before the peak (DtE−3 to DtE−1) exhibited significantly higher concentrations compared to days before and after the identified BB-LRT events (p≤0.05). In contrast, concentrations following the event peak were similar to the average magnitude, indicating a sudden decrease.
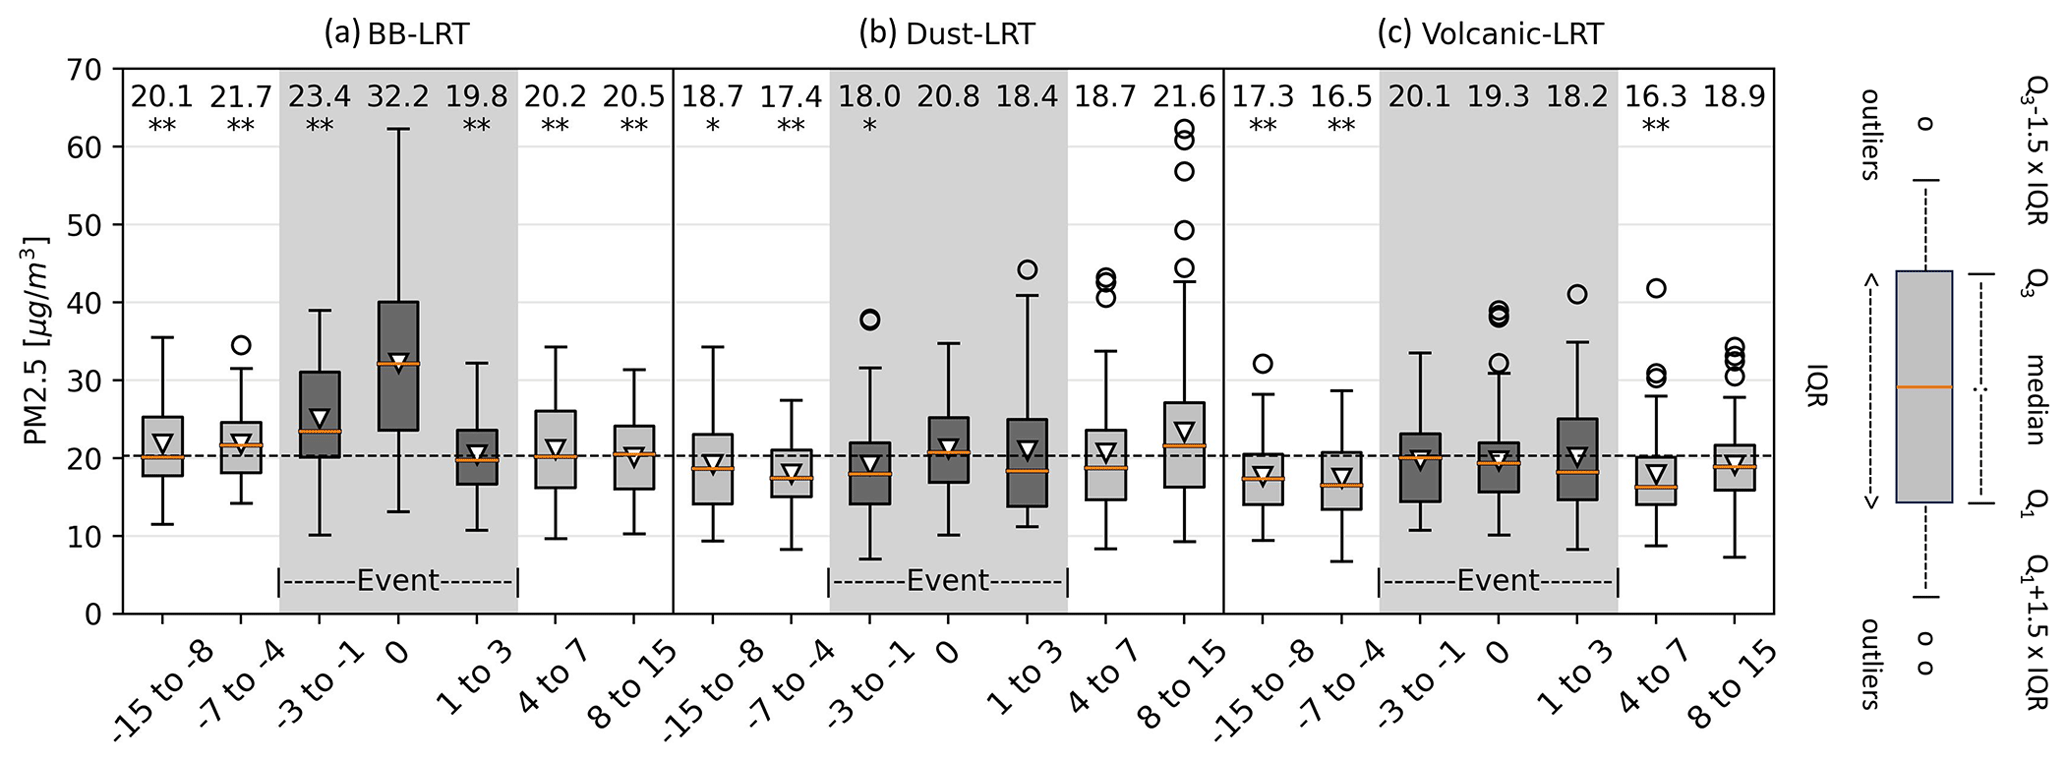
Figure 7PM2.5 concentrations before, during, and after (a) BB, (b) dust, and (c) volcanic-aerosol events. The top of the chart presents the median concentrations of the datasets, with significance levels compared to the peak of the data indicated as ≤0.1 (*) or ≤0.05 (**). The darker-gray boxes represent the events. The upturned triangles each represent the average concentration for each day, and the dashed gray line represents the average for the entire study period. The boxes are bounded by the first and third quartiles (Q1 and Q3, respectively). IQR: interquartile range.
While there is a substantial BB-LRT signature in the local PM2.5 measurements, the response is more subtle for Dust-LRT and Volcanic-LRT events. For Dust-LRT and Volcanic-LRT events, the median PM2.5 concentrations during the event (DtE−3 to DtE3) are actually lower than the campaign average (20.25 µg m−3). However, for Dust-LRT events, PM2.5 concentrations are significantly higher (p≤0.1) than those observed before the event. This is likely due to the large variability in the Dust-LRT event data, with Q3 peaking above 35 µg m−3; this value was lower before the event (especially from DtE−7 to DtE−4, where it reached approximately 28 µg m−3). For Volcanic-LRT events, there is a small PM2.5 gradient between the days before and during the LRT event, which is not dissimilar to that observed for Dust-LRT events. However, the tighter range in variability (i.e., lower Q3 values) yields a non-significant difference, despite the larger median values for Volcanic-LRT events (approximately 2–3 µg m−3 higher). After the peak Dust-LRT event, PM2.5 in the DtE4 to DtE7 window decreases to pre-event levels. However, the DtE8 to DtE15 window shows a similar median value to the Dust-LRT peak (DtE0), approximately 20 µg m−3, and has a larger data range (i.e., Q3 peaks at approximately 43 µg m−3). These larger-than-expected values occurred in March 2020, which was a period strongly affected by BB-LRT events. For days after Volcanic-LRT events (DtE4 to DtE7), we find that PM2.5 concentrations are significantly lower (p≤0.1), contrasting with the subsequent days (DtE8 to DtE15). Overall, it is clear that BB-LRT events have a larger influence on PM2.5 concentrations in the AV than Dust-LRT and Volcanic-LRT events.
3.4 PMF and chemical composition change
The PMF models of BB-LRT and Volcanic-LRT presented a good fit, and all residuals were normally distributed; however, for the Dust-LRT model, some components' residuals exceeded the recommended range of −3 to 3 (Noris and Duvall, 2014), so three samples were excluded due to anomalous data. Overall, the three final PMF models selected for the analysis demonstrated good performance, meeting the acceptance criteria, with an RM in the range of 80 % to 120 % and an R2 coefficient greater than 0.8 (Noris and Duvall, 2014). The results showed good convergence, where the ratio for the selected base models was close to 1 – a crucial parameter for determining the correct number of factors. A summary of the models' statistics is given in Table 2.
Table 2Performance statistics of the PMF models during days affected by BB-LRT, Dust-LRT, and Volcanic-LRT.
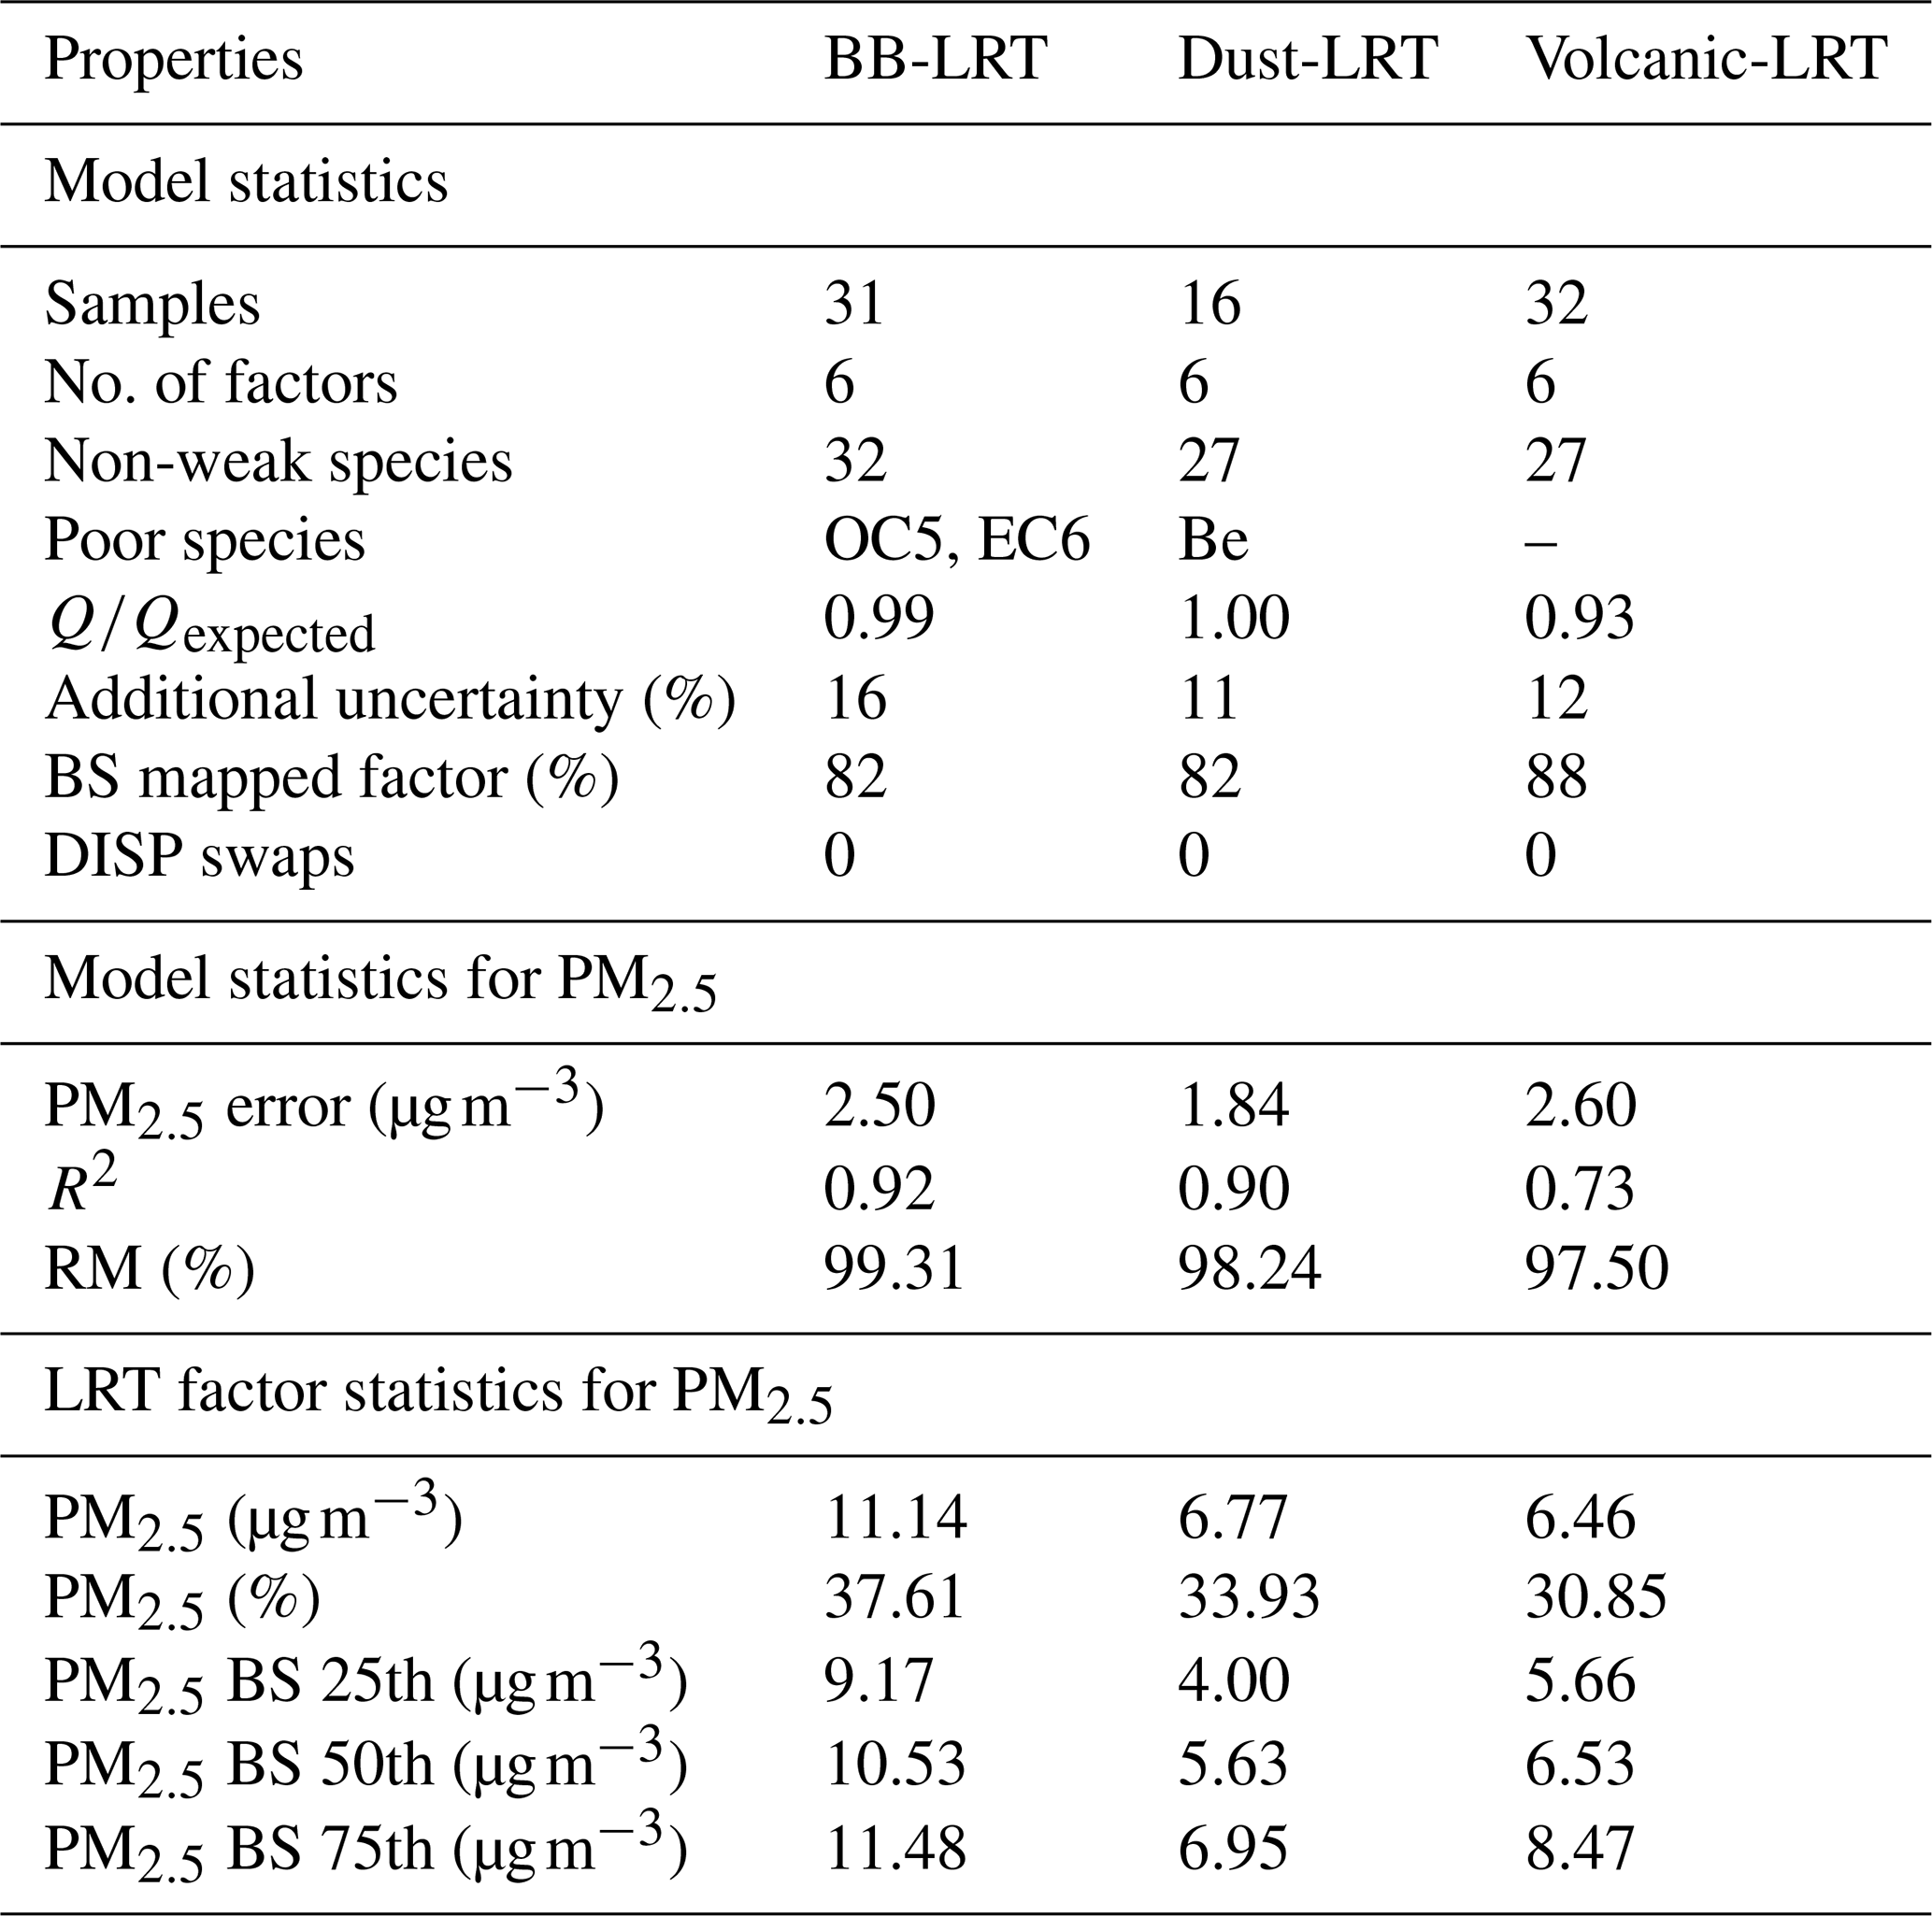
When evaluating errors in the PMF model, none of the three simulated scenarios showed significant rotational ambiguity, and there were no substantial random errors in the dataset after running the DISP and BS methods. Results for the DISP method showed no factor swaps for all dQmax values. In the BS analysis, outputs were considered stable, although not all base factors were mapped to the boot factors. On average, 84 % of factors were correctly mapped, which aligns with Noris and Duvall (2014), where a minimum of 80 % mapped factors is recommended for robust results and to support the number of factors selected. The target BB-LRT, Dust-LRT, and Volcanic-LRT profiles for the models were mapped in 88 %, 80 %, and 98 % of the runs, respectively. The 25th, 50th, and 75th percentiles of the PM2.5 contribution rates calculated for the target profiles in the BS runs are presented in Table 2. The variability in the contribution factor (g) represented by the BS runs is particularly important for the PMF model when using small dataset inputs (i.e., when the sample size is smaller than 100) as it determines whether the results from the model are stable or unstable (Feng et al., 2023).
Final base models were constrained to improve the correspondence between the chemical profiles found by the PMF model and those expected based on the identified emission sources. Specific constraints were defined in the different modeling scenarios to refine the factor profiles. The models' factors are presented in Fig. S3 in the Supplement. For the BB-LRT model, three soft constraints were applied to the coal boiler factor to pull up the EC1, Se, and As concentrations. Conversely, the Ag, Se, and EC1 concentrations were pulled down in the ceramic industry, gasoline, and diesel factors. For the Dust-LRT model, four soft constraints were established. In the vehicular-emissions factor, the concentrations of EC and Ni were maximally adjusted downward and upward, respectively. In the resuspended-materials factor, Ni was reduced to improve the fit, and in the biomass-burning factor, OC was maximally increased. In the Volcanic-LRT event scenario, two soft constraints were implemented. We pulled down the concentrations of Cu and Mg, while the concentration of Se was pulled up for secondaries, and the concentration of Cu was pulled down for vehicular emissions. For the models, the dQ percentage (i.e., the Q change due to the constraint) was <1 %.
The results from the PMF model for BB-LRT attributed concentrations to six emission sources (or factors): BB (37.6 %), coal boilers (20.1 %), the ceramic industry (16.7 %), gasoline (12.8 %), diesel (11.4 %), and incineration (1.4 %). The contribution factor for BB-LRT on the sampled days ranged from 0.0 to 4.5 (with the maximum value identified on 25 March 2020), indicating that not all identified event days are backed up by the PMF model (the contribution factor from the PMF model runs is shown in Fig. S4 in the Supplement). In the 31 samples identified, 27 d (equivalent to 87.0 %) had positive contributions from BB-LRT events. The PMF profile for the BB factor, represented in Fig. 8a, is characterized by its dominant contribution (≥30 %) of OC species, PyC, and certain anions. The identified contribution of this factor to OC, especially OC1 (50.9 %) and OC2 (46.1 %), agrees with observations made by Chow et al. (2004) for vegetation burning. Similarly, the high contribution of PyC (43.0 %) supports the profile since BB produces ∼50 % of global PyC emissions (Santín et al., 2016). Regarding anions, the high contribution to F− (42.1 %) supports the identification of BB-LRT since F− is a tracer of BB with a long lifetime (Jayarathne et al., 2014). The contributions to (37.7 %) and NO3− (22.0 %) suggest secondary-pollutant formation resulting from BB emissions during the daytime and nighttime, respectively (Rastogi et al., 2014). Moreover, the influence of Cl− concentrations (35.7 %) may indicate semiarid vegetation burning (Andreae et al., 1998). Other species, such as K (16.2 %), are also indicators of BB emissions (Yu et al., 2018; Rastogi et al., 2014).
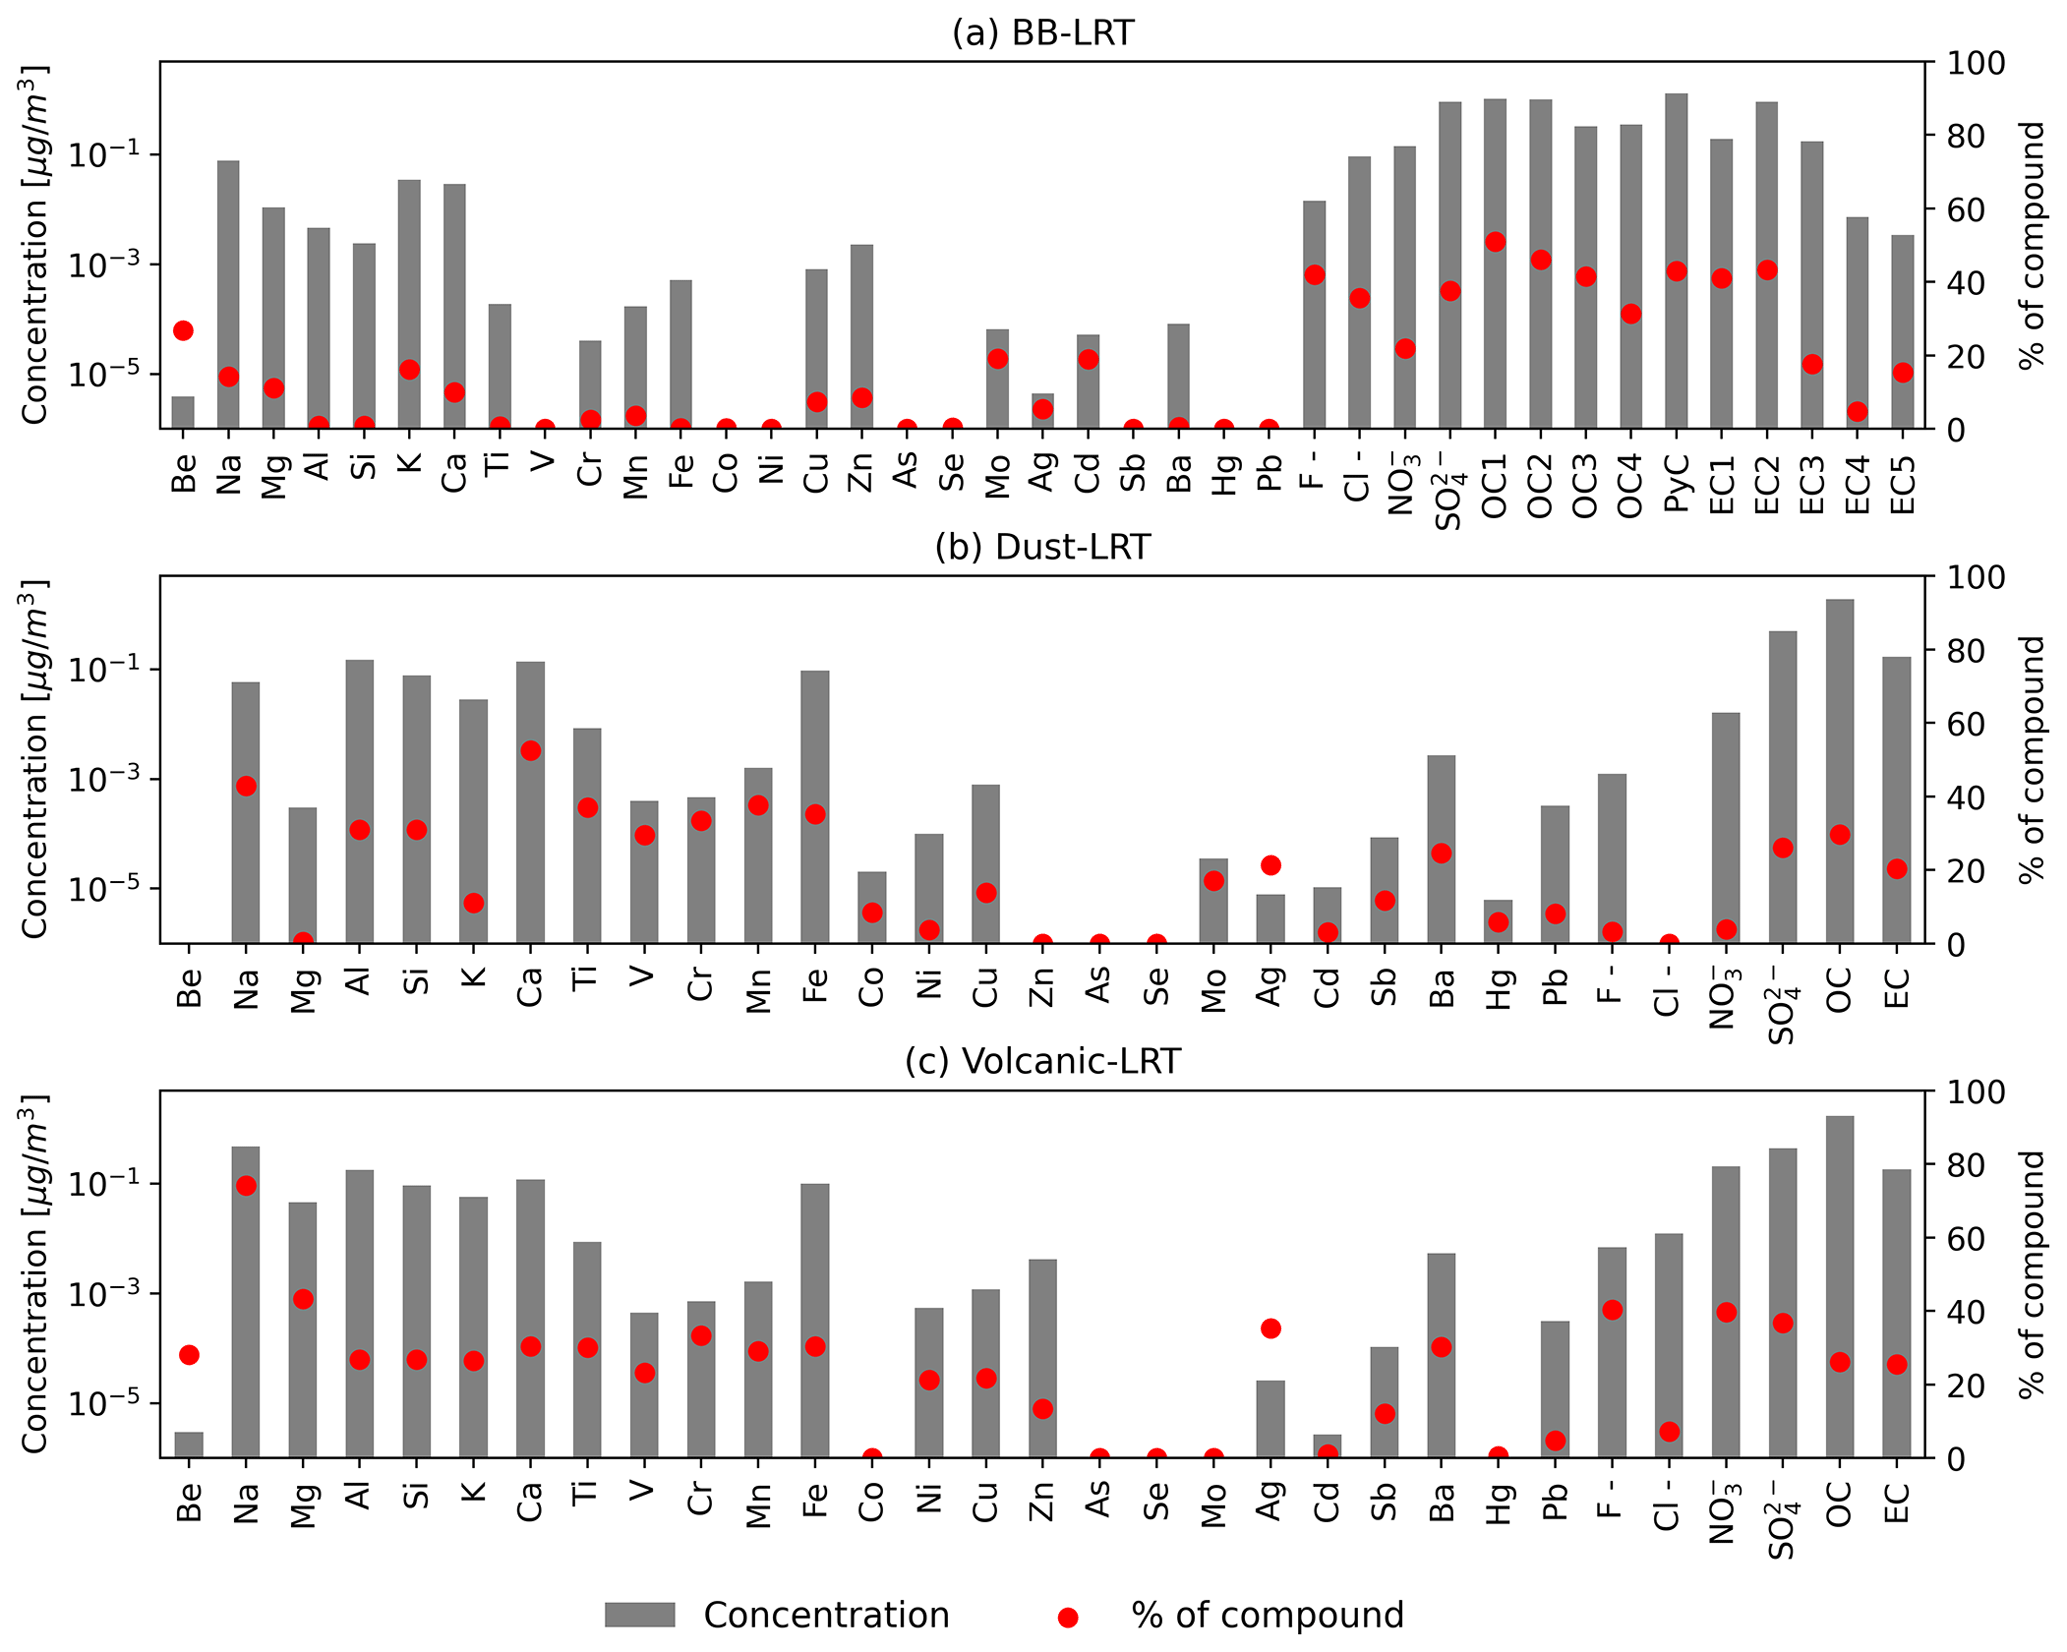
Figure 8PMF model output profiles for (a) BB-LRT, (b) Dust-LRT, and (c) Volcanic-LRT events. The bars represent the average concentrations of the compounds, while each red point denotes the average percentage contribution of each compound to the total concentration of elements. Refer to Fig. S3 to see the contributions of all factors.
For the Dust-LRT event days, the model identified PM2.5 contributions from dust (33.9 %), BB (27.8 %), vehicular emissions (12.4 %), resuspended material (6.5 %), incineration (7.7 %), and the ceramic industry (11.7 %). Since only total OC and EC were considered, distinguishing between vehicular emissions from diesel and those from gasoline is difficult. The contribution factor for dust varies from 0.0 to 4.1 (with the maximum identified on 27 February 2020). For this event, 81.2 % (13 out of 16 samples) of the identified days exhibited a positive contribution. The dust profile classification is supported by high contributions (>31.0 %) of Al, Ca, Fe, and Si (≥ 0.1 µg m−3), as illustrated in Fig. 8b. Similarly, Malaguti et al. (2015) highlight the presence of Fe, Al, Ca, Ti, and Mg in fine Saharan dust aerosols. Ca and Ti are specially weighted with respect to LRT from the Sahara since the other elements are more generic crustal-aerosol tracers (Martinez-Verduzco et al., 2023; Nicolás et al., 2008). Dust contributes to 52.6 % and 37.0 % of Ca and Ti concentrations, respectively. The profile also diverges from general crustal material in its contribution of secondary inorganic aerosols, specifically , likely from (NH4)2SO4 (Varrica et al., 2019; Malaguti et al., 2015), with an average concentration of 33.9 % in the samples. Similarly, a particular mix of dust minerals and OC (29.7 %) might also be a characteristic for identifying the dust profile (Aymoz et al., 2004; Malaguti et al., 2015).
For the days with Volcanic-LRT events, the model identified 30.8 % of the PM2.5 profile from volcanic-aerosol contributions. Other sources included BB (29.1 %), vehicular emissions (15.7 %), resuspended dust and the ceramic industry (11.0 %), secondary aerosol formation (9.1 %), and incineration (4.3 %). The volcanic factor exhibited contributions varying from 0.0 to 3.9 (with the maximum identified on 6 February 2020). According to the model, the volcanic factor influences only 78.1 % of identified days (25 out of 32 samples). As expected, the volcanic-LRT profile in Fig. 8c shows a high contribution of (36.9 %). However, the days affected by this LRT event did not exhibit significantly higher concentrations than the surrounding days. The contribution of the LRT event was higher for F− and NO3− than for . F− from volcanic emissions frequently accumulates on the surface of ash as CaF2, AlF3, or Na2SiF6 (Bia et al., 2020; Delmelle et al., 2021), while NO3− may be related to the oxidized tracer species HNO3 (Martin et al., 2012). Minerals with relatively large concentrations in the identified profile include Na, Al, Ca, Fe, Si, K, and Mg in descending order, with concentrations >0.04 µg m−3 (contributing >26.5 %). The findings of Trejos et al. (2021) and Vanegas et al. (2021) support the volcanic profile, with Si, Al, Fe, Ca, K, Mg, and Na identified as the main minerals in Nevado del Ruiz ashes. Although the composition may vary between volcanoes, results for volcanic ashes from Sangay in South America also back up the profile with similar main elements (Moran-Zuloaga et al., 2024). Of these, Fe, Al, and Na are the most representative of ash aerosols, exhibiting a diameter <2.5 µm (Mason et al., 2021), while Ca, Na, Si, and K might be particularly persistent after LRT (Ruggieri et al., 2012) due to their atmospheric lifetime. Cu and Zn are additional tracers observed here and have previously been identified for Volcán de Colima in Mexico (Miranda et al., 2004).
Figure 9 shows the average daily PM2.5 concentrations of campaign-measured data for each type of LRT event and for instances when no event is identified, considering only days with a positive contribution factor (g) from the PMF model's results. Although the average non-event concentration is presented, a statistical comparison is made between the LRT event period (DtE−3 to DtE+3) and the combined time series for days before and after the event (i.e., the DtE−15 to DtE−4 period is combined with the DtE+4 to DtE+15 period) using the Mann–Whitney U test. Unlike the PMF model, the comparison in Fig. 9 includes an analysis of the cations, carbon matter species, and OCEC and SOCOC ratios for each type of event. Here, the major elements generally show a more significant increase in LRT events. Some elements support the model's fingerprint (Fig. 8) – for example, OC, OC1, OC2, and for BB; Fe, Al, and Ti for dust; and Si, Al, Fe, Ca, Mg, and Na for volcanic aerosols (Fig. 9). OC was significantly higher for BB, presenting a median OCEC ratio of 11.3, exceeding common urban combustion ratios, such as those pertaining to fossil fuel (∼4), combustion, and diesel exhausts (<1) (Pani et al., 2019). Although the OCEC ratio is more commonly used to identify sources of urban combustion and BB, some studies have demonstrated its potential in determining the influence of volcanic activity (Pongpiachan et al., 2019), supported by evidence of carbon enrichment resulting from volcanic activity (Martinsson et al., 2009). This is also observed in this study, with consistently higher concentrations observed for all OC species and almost all EC species (EC3, EC4, EC5, and EC6). For volcanic aerosols, the OCEC ratio had a median value of 9.5. Similarly, the formation of SOC significantly increased for both events, with ratios of 5.0 and 2.9 obtained for BB and volcanic aerosols, respectively. Concentrations of three heavy metals, i.e., Cr (2.30 ng m−3), Ni (2.67 ng m−3), and Mn (5.76 ng m−3), notably increased on event days for volcanic aerosols. Only the maximum daily concentration of Ni (25.05 ng m−3) exceeded the air quality standards posed by the European Commission (2019) for annual average concentrations (20 ng m−3). Increases of Mn (4.64 ng m−3), Cr (1.67 ng m−3), and Cd (0.18 ng m−3) were observed for BB. The European Commission (2019) has set an air quality standard of 5 ng m−3 for annual average Cd concentrations.
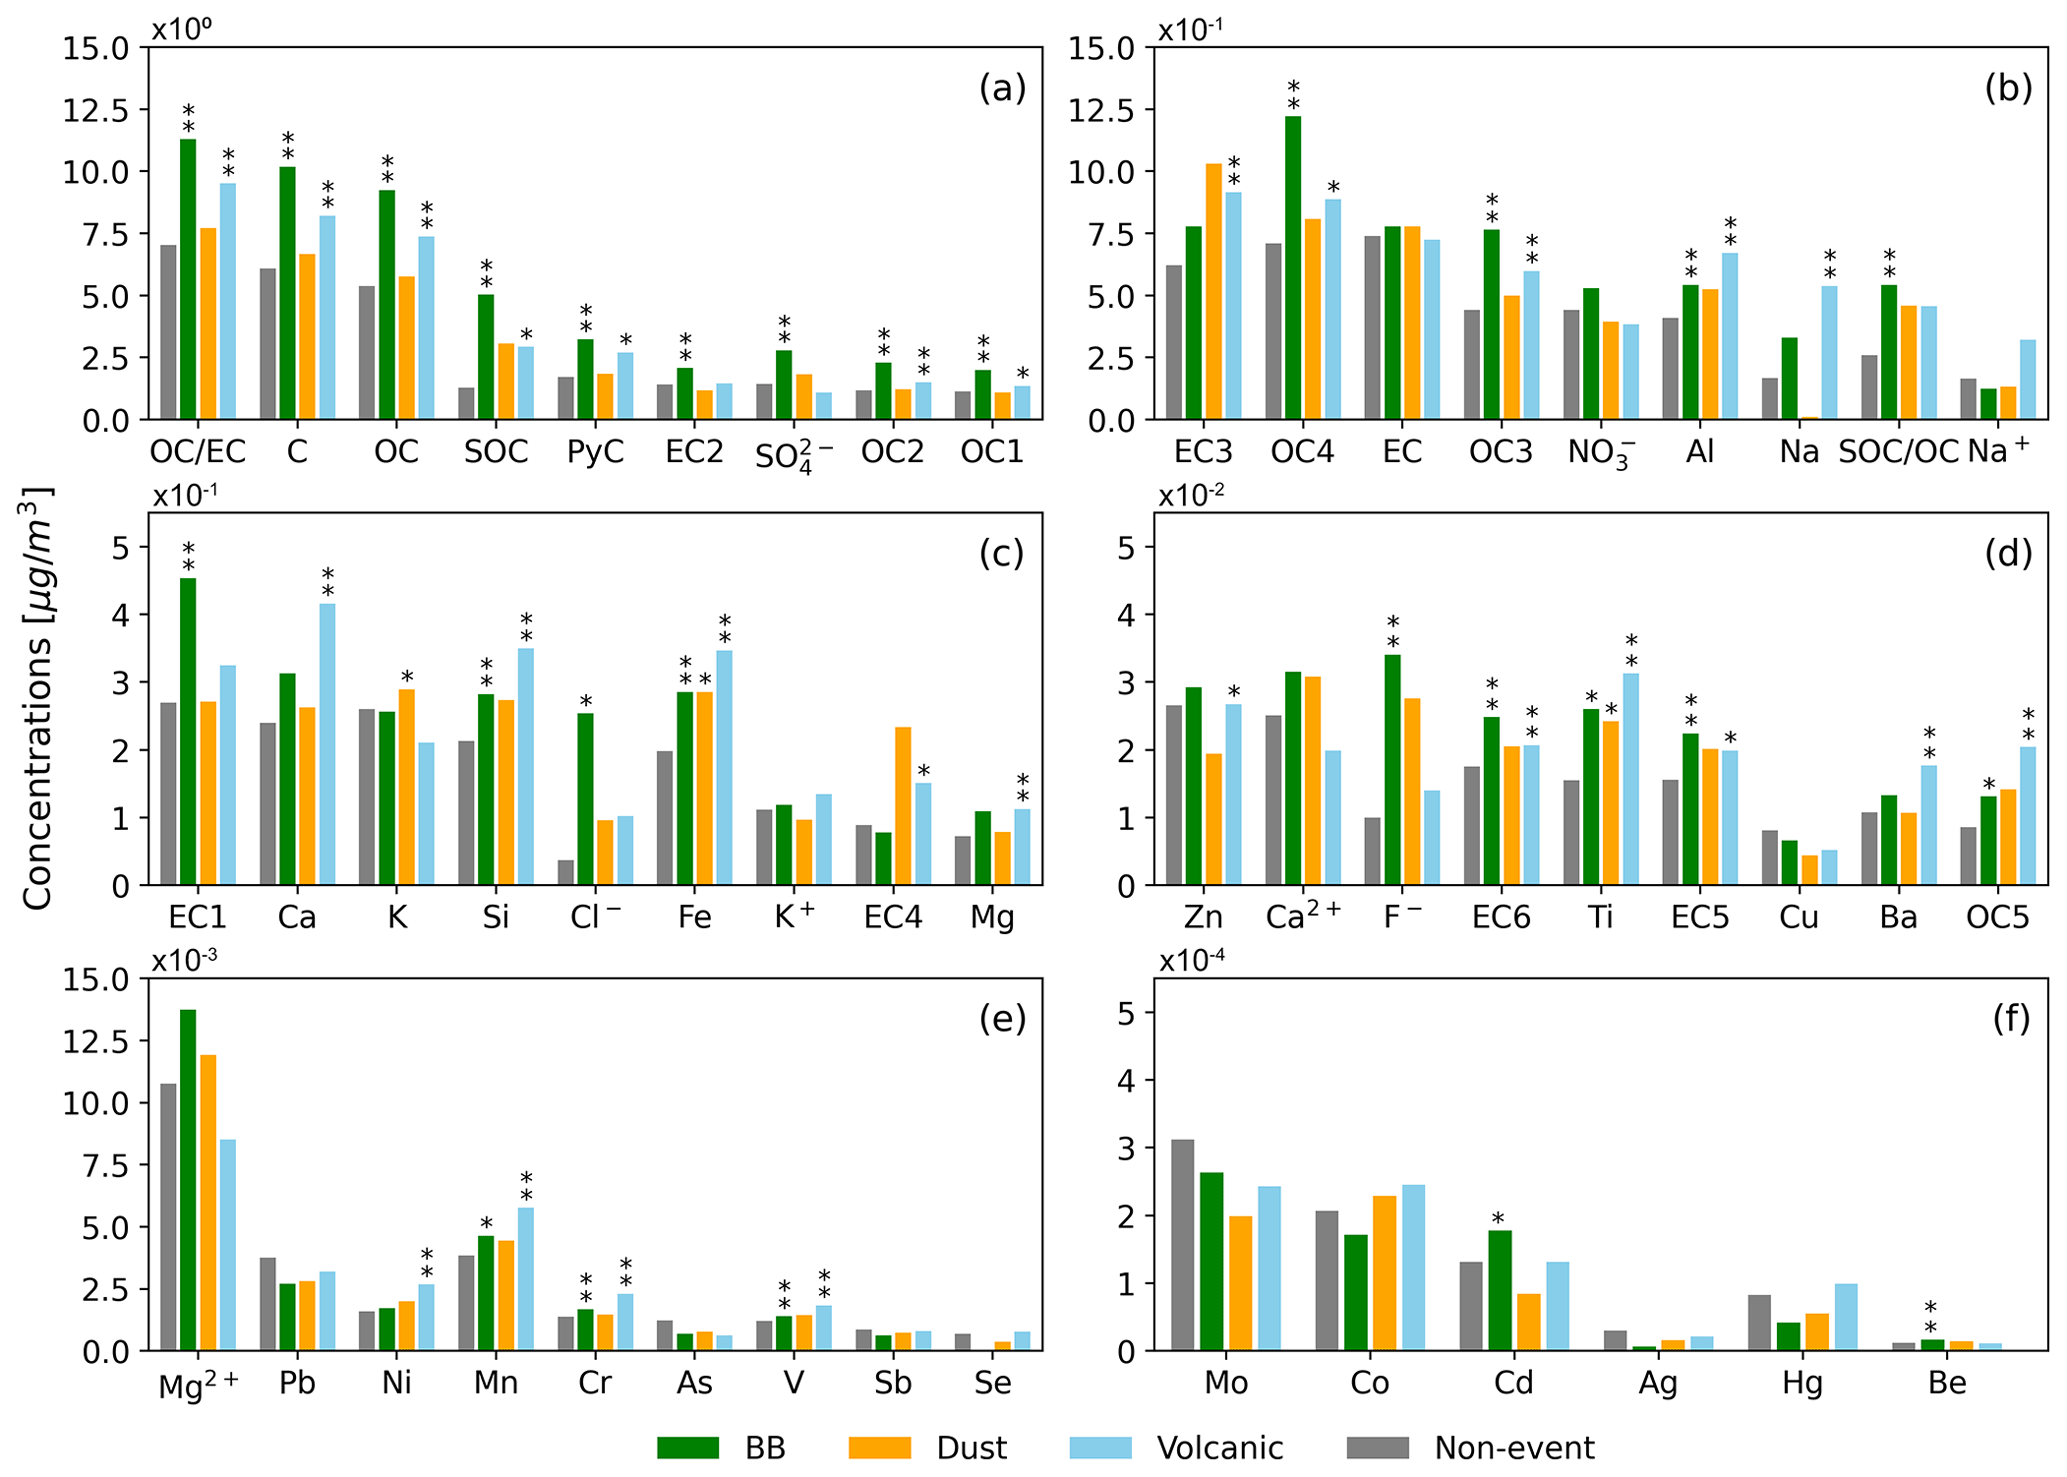
Figure 9Campaign average concentrations with regard to BB-LRT, Dust-LRT, and Volcanic-LRT for non-event and positive-contribution days. The bars represent the concentrations of the compounds, with significance levels compared to the days before and after the events indicated as ≤0.1 (*) or ≤0.05 (**). The y axes vary for each figure to better highlight concentrations. Table S2 in the Supplement presents these values and the mean concentrations of the compounds for the days surrounding (i.e., before and after) each event.
The elevated concentrations of ions on the days with events (Fig. 9) also support the profiles (Fig. 8) and align with the literature. In addition to the ions observed in the PMF profile for BB, the cations, e.g., K+, are representative of ions (Rastogi et al., 2014; Moreno et al., 2024) that present significant increases for this type of event. Regarding volcanic-aerosol compositions (Fig. 9), the observed increase in Na+ and K+ also aligns with previous reports (Moreno et al., 2024; Mather et al., 2003; Roberts et al., 2018). On the other hand, although the PMF model's fingerprint indicated high contributions of SO24− and F−, this was not enough to show a significant rise in daily concentrations, as shown in Fig. 9.
Our analysis focused on the LRT of aerosols from a range of sources (BB, dust, and volcanic aerosols) to the AV. Long-term (i.e., multi-year) field measurements of PM2.5 and its chemical composition helped to identify the impact of these events on local air quality. This long-term approach was important as it avoided restricting the study to short periods (i.e., singular sporadic large-scale high-impact events). We used model- and satellite-derived reanalysis data to identify regional-scale transboundary events and evaluated their effects on PM2.5 using local aerosol field measurements.
Consistent with other studies, thresholds were set to identify LRT events (Ridley et al., 2012; Carn et al., 2008). However, the thresholds selected in this study were representative of local events rather than sporadic high-pollution events. The OM-AOD threshold for BB-LRT events (0.2) agrees with previous results (0.2–0.3) (Kaiser et al., 2012; Misra et al., 2020). The Du-AOD threshold (0.02) was lower than the threshold of 0.05 suggested by Ridley et al. (2012) and the threshold used by Achilleos et al. (2020) to track outstanding episodes; however, it is of a comparable order of magnitude. In contrast, the TCSO2 threshold used in this study for volcanic-degassing events differed from thresholds discussed in the literature. The threshold used (0.87 mg m−2) was more than 10 times lower than that used for another degassing volcano (17.15 mg m−2) (Carn et al., 2008).
The lower TCSO2 threshold derived in this study is likely linked to the CAMS product we used. While we used the CAMS reanalyses for OM-AOD, Du-AOD, and TCSO2 (i.e., tracers from the same model) for consistency, the actual magnitude of TCSO2 in the reanalysis product is lower than in the operational product. This reanalysis version uses an older (2005–2010) climatological-emissions dataset (CAMS-GLOB-VOLC) for volcanic degassing (Granier et al., 2019) and only assimilates satellite AOD. While satellite AOD is a useful product for representing volcanic properties (e.g., volcanic plumes and SO2 concentrations), the operational product also assimilates satellite TCSO2 (CAMS, 2023), providing more constraints on the absolute magnitude of TCSO2. However, in this study, the identification process is more focused on data variability rather than the overall magnitude.
The identified BB-LRT reproduced the seasonality described in the literature (Mendez-Espinosa et al., 2019; Hernandez et al., 2019; Rodríguez-Gómez et al., 2022). With respect to the BB-LRT events, peak PM2.5 concentrations occurred in February and March. Consistent with Mendez-Espinosa et al. (2019) and Henao et al. (2021), our findings show that during this period, average conditions are characterized by wind transport from the northeast of the AV, covering parts of the Orinoco and Caribbean regions. BB aerosols from fires in the Orinoco can reach the AV through two passes in the Andes Mountains. The limited transport through this complex topography potentially promotes the accumulation of aerosols, thereby increasing their concentration in the AV (Ballesteros González, 2021). Furthermore, the back trajectories highlight the Middle Magdalena Valley, suggesting high BB emissions based on the reported OM-AOD hotspots. This area has been previously identified as critical for open fires in Colombia (Bolaño-Díaz et al., 2022; Ballesteros González, 2021). According to Ballesteros González (2021), fires from this region are more likely to affect Andean cities than fires from the Orinoco due to the mountain terrain acting as a natural barrier to LRT.
The meteorological characterization of BB-LRT showed conditions favorable for enhancing the LRT of aerosols to the AV. Here, dry conditions (i.e., low precipitation and humidity) in NSA promote both the occurrence of fires and the LRT of pollutants. In contrast, despite high emissions of Amazon fire smoke in the Southern Hemisphere, aerosol levels do not increase significantly in the city due to the scavenging of particles during their transport (Hamburger et al., 2013). However, BB-LRT occurring around August might be related to fires from this region (SIATA, 2021; Hamburger et al., 2013).
The estimated contribution of BB-LRT events to PM2.5 concentrations was the highest among the events studied, reaching 11.14 µg m−3 (37.6 %), as supported by the comparison of PM2.5 concentrations. According to Ballesteros-González et al. (2020), the contribution from BB was calculated to be 4.7 µg m−3 for Medellín in February 2010 and 2018. This result is consistent with the average (maximum) estimation of 6.0 (12.5) µg m−3 for samples collected in February 2020 during our campaign, which is also supported by the PMF model's results. In March 2020, at the beginning of the COVID-19 pandemic lockdown, the PMF model estimated a maximum contribution from BB-LRT of 50.0 µg m−3 out of 60.9 µg m−3. This particular event was characterized by a sudden reduction in local emissions, coupled with a sharp rise in PM2.5 concentrations due to LRT from BB (Henao et al., 2021; Mendez-Espinosa et al., 2020).
As with BB-LRT events, the monthly frequency of Dust-LRT events coincides with the annual cycle described in other studies. South America experiences dust reception from the Sahara mainly in two seasons: from March to May and from June to August (Prospero et al., 2020). The seasonality of dust events partially coincides with the months of BB-LRT events, causing substantial overlap between the identified days for these two types of events. Consequently, the weak impact on PM2.5 resulting from dust events controlled by the Andes Mountains (Prospero et al., 2020) might be overshadowed by the more critical effect of BB-LRT. The only widely recognized event recorded for the study period occurred on 24 and 25 June 2020 (Mendez-Espinosa et al., 2020; SIATA, 2021). According to the PMF model's results, this event contributed nearly twice as much to PM2.5 as the average event considered in this study. However, the PMF model identified equivalent contributions in February 2020. The overlap between these LRT event types and the small database size for the Dust-LRT model might result in less robust information from the PMF factor related to Saharan dust. However, the dust profile aligns with the literature, and the organic-carbon contribution likely included contributions from combustion sources.
In contrast to BB-LRT and Dust-LRT events, the impact of Volcanic-LRT events is primarily determined by the direction of the wind rather than the actual seasonality of emissions. Volcanic-LRT events occurred more frequently from July to September, when low-level to mid-level winds blow from the Nevado del Ruiz region in the southeast, facilitating the transport of emitted aerosols to the AV. According to the SO2 V2 catalog, available at https://so2.gsfc.nasa.gov/measures.html (last access: 1 October 2024) (Fioletov et al., 2023), the AV is within the influence of Nevado del Ruiz. Indeed, this study identified a significant increase in PM2.5 concentrations. According to the PMF model's results, the average contribution to PM2.5 was 6.46 µg m−3. Likewise, Casallas et al. (2024) linked the increase in PM2.5 concentration during the JJA season with volcanic activity in Cali, a city situated at a similar distance from the volcano as the AV but positioned to the south of it.
Although the Volcanic-LRT profile is predominantly made up of , the total concentration of the elements does not show a significant increase compared to surrounding days (i.e., non-event days). This lack of significance in has been observed in other cities where urban sources of SO2 dominate (Miyakawa et al., 2007). However, some alternative hypotheses pertain to the magmatic gas state, suggesting that the presence of lower temperatures before emissions might promote low sulfate oxidation and moderate formation (Mather et al., 2003) since precursors are often formed at higher temperatures close to the volcanic vent (Roberts et al., 2018). For instance, as observed in the Volcanic-LRT profile, Cl-poor plumes might reduce sulfate oxidation and the forward formation of (Mather et al., 2003).
The results have several implications for future research in the region. Modeling studies in the AV have only considered local emissions as inputs (e.g., Henao et al., 2020; Hernández et al., 2022). Therefore, it has been highlighted that external pollution sources should be included as additional inputs in chemical-transport models to achieve a more complete representation of air quality in the region. Further, this study suggests conducting shorter chemical sampling campaigns and human health impact studies focused on target elements and sources, particularly in the valley and upwind regions. For instance, special attention should be given to carbonaceous matter, F−, and Cd emitted from BB in open fires when conducting human and ecosystem health studies in Colombia (Tuomisto et al., 2008; Jayarathne et al., 2014) since BB, as a source, is particularly important in the region. The infrequent contribution of Saharan dust is still relevant, particularly in northern Colombia, where more intense events significantly increase mortality risk (Arregocés et al., 2023). On the other hand, Colombia has 12 active volcanoes, highlighting the importance of monitoring degassing activity in the country. Monitoring emissions and human health exposure is of primary importance for municipalities, especially those close to active volcanoes, such as Nevado del Ruiz. Both BB and volcanic events contribute to an increase in heavy-metal concentrations. This can adversely impact human health when metal accumulation occurs in the body, leading to diseases such as thyroid cancer (Malandrino et al., 2020; Vigneri et al., 2017). When heavy metals enter the body via multiple routes (e.g., inhalation, ingestion, and dermal absorption), the risk of exposure increases, especially nearer the source (e.g., contaminated air, water, and crops). The increase in Mn and Cr may enhance PM2.5 toxicity in lung epithelial cells (Yuan et al., 2019). A deep assessment of Cr(VI) and Cr(III) needs to be conducted to evaluate the correct toxicity status of Cr.
Finally, this study highlights the need for cooperation among local, national, and international entities to manage complex aerosol sources and emissions, as well as human exposure.
This study evaluates the impact of BB-LRT, Dust-LRT, and Volcanic-LRT aerosols on PM2.5 concentrations and chemical composition in the AV, a densely populated and mountainous region in the tropical Andes Mountains. LRT events pertaining to aerosols and their precursors (e.g., volcanic SO2) were categorized based on substantial (i.e., non-local) enhancements in relevant tracers above background levels, as derived from CAMS reanalyses over the campaign site in the AV. Meteorological data from ERA5 and the GPM mission, along with back-trajectory analysis, were used to link aerosol events in the AV with their sources and to characterize the meteorological patterns that determine the LRT of aerosols. The impact of these regional events on local PM2.5 was finally evaluated using field campaign measurements of local PM2.5 and its chemical composition, along with PMF modeling. This field campaign represents a unique long-term PM2.5 composition dataset from April 2019 to October 2022.
The methodology allowed for identifying periods influenced by the LRT of air pollutants, distinguishing between the days before, during, and after the LRT events. During LRT event days, the back trajectories identified air masses arriving from regions previously reported as critical sources of aerosols, connecting aerosol events in the AV with their sources. The sources were identified as regional fires for BB-LRT, Saharan dust for Dust-LRT, and emissions from Nevado del Ruiz for Volcanic-LRT. The different types of events were associated with substantial seasonal variability (i.e., pronounced seasonal cycles). BB-LRT events occurred mainly in February, March, and April, with a lower incidence during August. Dust-LRT events showed a higher incidence from April to August, while Volcanic-LRT showed a high incidence from June to September and from January to February. No events were identified during October, November, and December.
The weather patterns for BB-LRT events exhibited anomalous lower-tropospheric northeasterly winds, favoring regional transport of aerosols. Additionally, drier conditions in northern Colombia and Venezuela promoted the occurrence and spread of fires in these regions. For Dust-LRT, more intense winds from the Caribbean in the middle troposphere favored transport to the AV when aerosol loading was high. Moreover, during Volcanic-LRT events, anomalous southeasterly winds throughout the lower and middle troposphere were present, along with lower precipitation in the southeast of the AV, where Nevado del Ruiz is located, enabling LRT.
When evaluating the impact of LRT events on ground-level PM2.5, BB-LRT events resulted in more significant increases in concentrations. The relative increase in PM2.5 observed during Dust-LRT and Volcanic-LRT events was smaller but still prominent. Similarly, consistent with profiles in the literature, the PMF model's results highlighted the importance of each LRT event type in influencing PM2.5 chemical composition. OC species (e.g., OC1 and OC2), anions (e.g., F−), and secondary pollutants (e.g., and ) were the dominant components in the BB-LRT profile. On the other hand, general crustal minerals, as well as Ca and Ti, defined the Sahara-influenced Dust-LRT profile. For Volcanic-LRT, and characteristic minerals (e.g., Na, Al, Ca, Fe, Si, K, and Mg) were substantially present in the corresponding profile. Further comparison of observations on days with a positive contribution factor (gij>0) supported the PMF model's results, although no substantial rise in was identified during volcanic-degassing events. This observation aligns with the low Cl− contribution, supporting the hypothesis of reduced sulfur oxidation. Increases in carbon and ion identification were mainly observed for BB-LRT and Volcanic-LRT. Lastly, the profiles associated with significant increases in heavy metals (Cr, Mn, Cd, and Ni) highlight the potential risk posed by LRT to local air quality and are a cause for concern for both local and national public health authorities. Future studies using chemical models, larger event datasets, and more detailed measurement and characterization techniques may offer further explanations for the observed increase in heavy-metal tracers.
The findings have several implications for future research. For instance, modeling studies in the region have only considered local emissions as inputs, and external pollution sources, especially volcanic degassing, need to be included as inputs in chemical-transport modeling studies.
A Python code for calculating the back trajectories is available on the Zenodo open-access platform at https://doi.org/10.5281/zenodo.13730208 (Velásquez-García et al., 2024).
The CAMS reanalysis (Inness et al., 2019) data were downloaded from the Atmosphere Data Store at https://ads.atmosphere.copernicus.eu/datasets/cams-global-reanalysis-eac4 (CAMS, 2020). Meteorological data from the ERA5 reanalysis were downloaded from the Climate Data Store at https://doi.org/10.24381/cds.bd0915c6 (Hersbach et al., 2023), and GPM data were retrieved from NASA Earthdata at https://doi.org/10.5067/GPM/IMERG/3B-HH/07 (Huffman et al., 2023). The hourly PM2.5 concentration data were downloaded from the official network platform at https://siata.gov.co/descarga_siata/index.php/index2/login/cerrar_sesion (SIATA, 2024). The wind datasets for trajectory calculations were downloaded from NCEP–NCAR Reanalysis 1 (https://downloads.psl.noaa.gov/Datasets/ncep.reanalysis/pressure/; NCEP-NCAR, 2023). The PM2.5 sampling campaign datasets are available in the Zenodo open-access platform at https://doi.org/10.5281/zenodo.13891195 (GHYGAM, 2024).
The supplement related to this article is available online at: https://doi.org/10.5194/acp-24-11497-2024-supplement.
MPVG: conceptualization, methodology, software, formal analysis, data curation, writing (original draft), and visualization. KSH: conceptualization, methodology, software, writing (original draft), writing (review and editing), and visualization. JAVC: data curation, formal analysis, and software. RJP: writing (review and editing). MGM: conceptualization, data curation, formal analysis, methodology, and resources. AMR: conceptualization, methodology, writing (review and editing), supervision, and project administration.
The contact author has declared that none of the authors has any competing interests.
Publisher's note: Copernicus Publications remains neutral with regard to jurisdictional claims made in the text, published maps, institutional affiliations, or any other geographical representation in this paper. While Copernicus Publications makes every effort to include appropriate place names, the final responsibility lies with the authors.
The authors would like to acknowledge the ONU-ARCAL project (grant no. RLA7023) from the United Nations (UN) and the International Atomic Energy Agency (IAEA); the Área Metropolitana del Valle de Aburrá (contract codes: 734, 787, and 671); Ecopetrol (grant no. 3017481); and the Colombian Ministry of Science, Technology, and Innovation (grant no. 2020000100410) for funding the PM2.5 chemical composition sampling campaign. We also thank the Colombian Ministry of Science, Technology, and Innovation for funding the research work of Maria P. Velásquez-García and Miriam Gómez-Marín (grant no. 2020000100410). Additionally, we thank SIATA for providing air quality data and fostering a community of scientists in the region.
Special thanks are due to the research project “Implementación de un sistema de investigación y pronóstico meteorológico de corto plazo con el modelo WRF, para apoyo a sistemas de comando y control de la Fuerza Aérea Colombiana” (grant no. 1115-852-70955), funded by the “Patrimonio Autónomo Fondo Nacional de Financiamiento para la Ciencia, la Tecnología y la Innovación, Fondo Francisco José de Caldas” of the Colombian Ministry of Science, Technology, and Innovation (Minciencias).
This work was also funded by the UK Natural Environment Research Council (NERC), which provided funding for the National Centre for Earth Observation (NCEO; grant no. NE/R016518/1) and the NERC Panorama Doctoral Training Partnership (DTP; grant no. NE/S007458/1).
This research has been supported by the Ministry of Science, Technology, and Innovation (grant nos. 2020000100410 and 1115-852-70955); Ecopetrol (grant no. 3017481); the International Atomic Energy Agency (grant no. RLA7023); the United Nations (grant no. RLA7023); the National Centre for Earth Observation (grant no. NE/R016518/1); and the Natural Environment Research Council (grant no. NE/S007458/1). This project was also funded by the Área Metropolitana del Valle de Aburrá (grant nos. 734, 787, and 671).
This paper was edited by Luis A. Ladino and reviewed by two anonymous referees.
Achilleos, S., Mouzourides, P., Kalivitis, N., Katra, I., Kloog, I., Kouis, P., Middleton, N., Mihalopoulos, N., Neophytou, M., Panayiotou, A., Papatheodorou, S., Savvides, C., Tymvios, F., Vasiliadou, E., Yiallouros, P., and Koutrakis, P.: Spatio-temporal variability of desert dust storms in Eastern Mediterranean (Crete, Cyprus, Israel) between 2006 and 2017 using a uniform methodology, Sci. Total Environ., 714, 136693, https://doi.org/10.1016/j.scitotenv.2020.136693, 2020. a
Allajbeu, S., Qarri, F., Marku, E., Bekteshi, L., Ibro, V., Frontasyeva, M. V., Stafilov, T., and Lazo, P.: Contamination scale of atmospheric deposition for assessing air quality in Albania evaluated from most toxic heavy metal and moss biomonitoring, Air Qual. Atmos. Hlth., 10, 587–599, https://doi.org/10.1007/s11869-016-0453-9, 2017. a
Andreae, M. O., Andreae, T. W., Annegarn, H., Beer, J., Cachier, H., Le Canut, P., Elbert, W., Maenhaut, W., Salma, I., Wienhold, F. G., and Zenker, T.: Airborne studies of aerosol emissions from savanna fires in southern Africa: 2. Aerosol chemical composition, J. Geophys. Res.-Atmos., 103, 32119–32128, https://doi.org/10.1029/98JD02280, 1998. a
Arregocés, H. A., Rojano, R., and Restrepo, G.: Health risk assessment for particulate matter: application of AirQ+ model in the northern Caribbean region of Colombia, Air Qual. Atmos. Hlth., 16, 897–912, https://doi.org/10.1007/s11869-023-01304-5, 2023. a, b
AS/NZS: Methods for sampling and analysis of ambient air – Method 9.14: Determination of suspended particulate matter – PM2.5 high volume sampler with size selective inlet – Gravimetric method, Standards New Zeland, https://www.standards.govt.nz/shop/asnzs-3580-9-142013/ (last access: 1 October 2024), 2013. a
Aymoz, G., Jaffrezo, J.-L., Jacob, V., Colomb, A., and George, Ch.: Evolution of organic and inorganic components of aerosol during a Saharan dust episode observed in the French Alps, Atmos. Chem. Phys., 4, 2499–2512, https://doi.org/10.5194/acp-4-2499-2004, 2004. a
Ballesteros González, K.: Assessing the effects of medium-range transport of biomass burning aerosols on air quality in Northern South America through chemical transport modelling, PhD thesis, Universidad del los Andes, https://doi.org/10.57784/1992/52989, 2021. a, b, c
Ballesteros-González, K., Sullivan, A. P., and Morales-Betancourt, R.: Estimating the air quality and health impacts of biomass burning in northern South America using a chemical transport model, Sci. Total Environ., 739, 139755, https://doi.org/10.1016/j.scitotenv.2020.139755, 2020. a, b, c
Bedoya, A., Nisperuza, D., Alegría, D., Múnera, M., Guerrero-Rascado, J. L., Zapata, C. E., Jiménez, J. F., Landulfo, E., and Bastidas, Á.: Strong Saharan Dust Event Detected at Lalinet LOA-UNAL Station, over Medellín, Colombia by Active and Passive Remote Sensing, EPJ Web Conf., 119, 08006, https://doi.org/10.1051/epjconf/201611908006, 2016. a
Bia, G., Borgnino, L., Zampieri, G., and Garcia, M.: Fluorine surface speciation in South Andean volcanic ashes, Chem. Geol., 532, 119402, https://doi.org/10.1016/j.chemgeo.2019.119402, 2020. a
Bolaño-Díaz, S., Camargo-Caicedo, Y., Soro, T. D., N'Dri, A. B., and Bolaño-Ortiz, T. R.: Spatio-Temporal Characterization of Fire Using MODIS Data (2000–2020) in Colombia, Fire, 5, 134, https://doi.org/10.3390/fire5050134, 2022. a
Bolaño-Ortiz, T. R., Constante-Ballestas, J. I., Puliafito, S. E., Vélez-Pereira, A. M., Tovar-Bernal, F. A., and Camargo-Caicedo, Y.: Spread COVID-19 during Godzilla African dust in June 2020 on the Colombian Caribbean region, Atmos. Pollut. Res., 14, 101860, https://doi.org/10.1016/j.apr.2023.101860, 2023a. a
Bolaño-Ortiz, T. R., Díaz-Gutiérrez, V. L., Vélez-Pereira, A. M., Vergara-Vásquez, E. L., and Camargo-Caicedo, Y.: Snow Albedo Reduction in the Colombian Andes Mountains Due to 2000 to 2020 Saharan Dust Intrusions Events, Water, 15, 3150, https://doi.org/10.3390/w15173150, 2023b. a
Boyd, P. W. and Ellwood, M. J.: The biogeochemical cycle of iron in the ocean, Nat. Geosci., 3, 675–682, https://doi.org/10.1038/ngeo964, 2010. a
Briffa, J., Sinagra, E., and Blundell, R.: Heavy metal pollution in the environment and their toxicological effects on humans, Heliyon, 6, e04691, https://doi.org/10.1016/j.heliyon.2020.e04691, 2020. a
Callén, M., de la Cruz, M., López, J., Navarro, M., and Mastral, A.: Comparison of receptor models for source apportionment of the PM10 in Zaragoza (Spain), Chemosphere, 76, 1120–1129, https://doi.org/10.1016/j.chemosphere.2009.04.015, 2009. a
CAMS: CAMS global reanalysis (EAC4), CAMS Atmosphere Data Store [data set], https://ads.atmosphere.copernicus.eu/datasets/cams-global-reanalysis-eac4 (last access: 1 October 2024), 2020. a
CAMS: Global atmospheric composition forecast data documentation, https://confluence.ecmwf.int/display/CKB/CAMS%3A+Global+atmospheric+composition+forecast+data+documentation#heading-Satelliteobservations (last access: 1 October 2024), 2023. a
Carn, S., Krueger, A., Arellano, S., Krotkov, N., and Yang, K.: Daily monitoring of Ecuadorian volcanic degassing from space, J. Volcanol. Geoth. Res., 176, 141–150, https://doi.org/10.1016/j.jvolgeores.2008.01.029, 2008. a, b
Carn, S., Clarisse, L., and Prata, A.: Multi-decadal satellite measurements of global volcanic degassing, J. Volcanol. Geoth. Res., 311, 99–134, https://doi.org/10.1016/j.jvolgeores.2016.01.002, 2016. a
Casallas, A., Castillo-Camacho, M. P., Guevara-Luna, M. A., González, Y., Sanchez, E., and Belalcazar, L. C.: Spatio-temporal analysis of PM2.5 and policies in Northwestern South America, Sci. Total Environ., 852, 158504, https://doi.org/10.1016/j.scitotenv.2022.158504, 2022. a
Casallas, A., Cabrera, A., Guevara-Luna, M.-A., Tompkins, A., González, Y., Aranda, J., Belalcazar, L. C., Mogollon-Sotelo, C., Celis, N., Lopez-Barrera, E., Peña-Rincon, C. A., and Ferro, C.: Air pollution analysis in Northwestern South America: A new Lagrangian framework, Sci. Total Environ., 906, 167350, https://doi.org/10.1016/j.scitotenv.2023.167350, 2024. a, b, c
Choobari, O. A., Zawar-Reza, P., and Sturman, A.: The global distribution of mineral dust and its impacts on the climate system: A review, Atmos. Res., 138, 152–165, https://doi.org/10.1016/j.atmosres.2013.11.007, 2014. a
Chow, J. C., Watson, J. G., Kuhns, H., Etyemezian, V., Lowenthal, D. H., Crow, D., Kohl, S. D., Engelbrecht, J. P., and Green, M. C.: Source profiles for industrial, mobile, and area sources in the Big Bend Regional Aerosol Visibility and Observational study, Chemosphere, 54, 185–208, https://doi.org/10.1016/j.chemosphere.2003.07.004, 2004. a
Cuesta-Mosquera, A. P., Wahl, M., Acosta-López, J. G., García-Reynoso, J. A., and Aristizábal-Zuluaga, B. H.: Mixing layer height and slope wind oscillation: Factors that control ambient air SO2 in a tropical mountain city, Sustain. Cities Soc., 52, 101852, https://doi.org/10.1016/j.scs.2019.101852, 2020. a
Dai, Q., Hopke, P. K., Bi, X., and Feng, Y.: Improving apportionment of PM2.5 using multisite PMF by constraining G-values with a prioriinformation, Sci. Total Environ., 736, 139657, https://doi.org/10.1016/j.scitotenv.2020.139657, 2020. a
Delmelle, P., Maters, E. C., Calkins, J. A., Gaspard, F., Opfergelt, S., and Jenkins, S. F.: Eruptive style controls the formation of silicon hexafluoride salts on volcanic ash: The case of the 2010 eruption of Eyjafjallajökull volcano, Iceland, Chem. Geol., 579, 120327, https://doi.org/10.1016/j.chemgeo.2021.120327, 2021. a
Dong, X., Fu, J. S., Zhu, Q., Sun, J., Tan, J., Keating, T., Sekiya, T., Sudo, K., Emmons, L., Tilmes, S., Jonson, J. E., Schulz, M., Bian, H., Chin, M., Davila, Y., Henze, D., Takemura, T., Benedictow, A. M. K., and Huang, K.: Long-range transport impacts on surface aerosol concentrations and the contributions to haze events in China: an HTAP2 multi-model study, Atmos. Chem. Phys., 18, 15581–15600, https://doi.org/10.5194/acp-18-15581-2018, 2018. a
Echeverri, A. and Orsini, F.: Informalidad y urbanismo social en Medellín, EAFIT, https://www.eafit.edu.co/centros/urbam/articulos-publicaciones/Documents/111103_RS3_AEcheverri_%20P%2011-24.pdf (last access: 1 October 2024), 2011. a
Eugene Kim, P. K. H. and Edgerton, E. S.: Source Identification of Atlanta Aerosol by Positive Matrix Factorization, J. Air Waste Manage., 53, 731–739, https://doi.org/10.1080/10473289.2003.10466209, 2003. a
Eugene Kim, P. K. H. and Qin, Y.: Estimation of Organic Carbon Blank Values and Error Structures of the Speciation Trends Network Data for Source Apportionment, J. Air Waste Manage., 55, 1190–1199, https://doi.org/10.1080/10473289.2005.10464705, 2005. a
European Commission: EU air quality standards, AMVA, https://environment.ec.europa.eu/topics/air/air-quality/eu-air-quality-standards_en (last access: 1 October 2024), 2019. a, b
Feng, J., Song, N., and Li, Y.: An in-depth investigation of the influence of sample size on PCA-MLR, PMF, and FA-NNC source apportionment results, Environ. Geochem. Hlth., 45, 5841–5855, https://doi.org/10.1007/s10653-023-01598-5, 2023. a
Fioletov, V. E., McLinden, C. A., Krotkov, N., Li, C., Joiner, J., Theys, N., Carn, S., and Moran, M. D.: A global catalogue of large SO2 sources and emissions derived from the Ozone Monitoring Instrument, Atmos. Chem. Phys., 16, 11497–11519, https://doi.org/10.5194/acp-16-11497-2016, 2016. a
Fioletov, V. E., McLinden, C. A., Griffin, D., Abboud, I., Krotkov, N., Leonard, P. J. T., Li, C., Joiner, J., Theys, N., and Carn, S.: Version 2 of the global catalogue of large anthropogenic and volcanic SO2 sources and emissions derived from satellite measurements, Earth Syst. Sci. Data, 15, 75–93, https://doi.org/10.5194/essd-15-75-2023, 2023. a
García, J., Posada, C., and Corrales, A.: Congestión vehicular en medellín una posible solución desde la economía, Coyuntura Económica, 46, 175–207, https://www.repository.fedesarrollo.org.co/bitstream/handle/11445/3349/Co_Eco_Garcia_Posada_y_Corrales.pdf (last access: 2 October 2024), 2016. a
GHYGAM: PM2.5 Chemical characterisation campaign at Medellín from April 2019 to October 2022, Version v2.0.0, Zenodo [code], https://doi.org/10.5281/zenodo.13891195, 2024. a
Gómez-Marín, M., Yepes, D. L., Patiño, K., Grajales, D., Tavera, J., and Vergara-Correa, J. A.: Convenio interadministrativo 671 de 2021, AMVA-PCJIC, https://www.metropol.gov.co/ambiental/calidad-del-aire/Biblioteca-aire/Estudios-calidad-del-aire/Informe-Final-Caracterizacion-Fase-IV.pdf (last access: 1 October 2024), 2021. a, b, c, d
Gómez Peláez, L. M., Santos, J. M., de Almeida Albuquerque, T. T., Reis, N. C., Andreão, W. L., and de Fátima Andrade, M.: Air quality status and trends over large cities in South America, Environ. Sci. Policy, 114, 422–435, https://doi.org/10.1016/j.envsci.2020.09.009, 2020. a, b
Granier, C., Darras, S., van Der Gon, H. D., Jana, D., Elguindi, N., Bo, G., Michael, G., Marc, G., Jalkanen, J.-P., Kuenen, J., Liousse, C., Quack, B., Simpson, D., and Sindelarova, K.: The Copernicus atmosphere monitoring service global and regional emissions (April 2019 version), https://doi.org/10.24380/d0bn-kx16, 2019. a
Haghnazar, H., Johannesson, K. H., González-Pinzón, R., Pourakbar, M., Aghayani, E., Rajabi, A., and Hashemi, A. A.: Groundwater geochemistry, quality, and pollution of the largest lake basin in the Middle East: Comparison of PMF and PCA-MLR receptor models and application of the source-oriented HHRA approach, Chemosphere, 288, 132489, https://doi.org/10.1016/j.chemosphere.2021.132489, 2022. a
Hamburger, T., Matisāns, M., Tunved, P., Ström, J., Calderon, S., Hoffmann, P., Hochschild, G., Gross, J., Schmeissner, T., Wiedensohler, A., and Krejci, R.: Long-term in situ observations of biomass burning aerosol at a high altitude station in Venezuela – sources, impacts and interannual variability, Atmos. Chem. Phys., 13, 9837–9853, https://doi.org/10.5194/acp-13-9837-2013, 2013. a, b, c, d
Henao, J. J., Mejía, J. F., Rendón, A. M., and Salazar, J. F.: Sub-kilometer dispersion simulation of a CO tracer for an inter-Andean urban valley, Atmos. Pollut. Res., 11, 928–945, https://doi.org/10.1016/j.apr.2020.02.005, 2020. a
Henao, J. J., Rendón, A. M., Hernández, K. S., Giraldo-Ramirez, P. A., Robledo, V., Posada-Marín, J. A., Bernal, N., Salazar, J. F., and Mejía, J. F.: Differential Effects of the COVID-19 Lockdown and Regional Fire on the Air Quality of Medellín, Colombia, Atmosphere, 12, 1137, https://doi.org/10.3390/atmos12091137, 2021. a, b, c, d, e
Hernandez, A. J., Morales-Rincon, L. A., Wu, D., Mallia, D., Lin, J. C., and Jimenez, R.: Transboundary transport of biomass burning aerosols and photochemical pollution in the Orinoco River Basin, Atmos. Environ., 205, 1–8, https://doi.org/10.1016/j.atmosenv.2019.01.051, 2019. a, b
Hernández, K. S., Henao, J. J., and Rendón, A. M.: Dispersion simulations in an Andean city: Role of continuous traffic data in the spatio-temporal distribution of traffic emissions, Atmos. Pollut. Res., 13, 101361, https://doi.org/10.1016/j.apr.2022.101361, 2022. a
Herrera-Mejía, L. and Hoyos, C. D.: Characterization of the atmospheric boundary layer in a narrow tropical valley using remote-sensing and radiosonde observations and the WRF model: the Aburrá Valley case-study, Q. J. Roy. Meteor. Soc., 145, 2641–2665, https://doi.org/10.1002/qj.3583, 2019. a
Hersbach, H., Bell, B., Berrisford, P., Hirahara, S., Horányi, A., Muñoz-Sabater, J., Nicolas, J., Peubey, C., Radu, R., Schepers, D., Simmons, A., Soci, C., Abdalla, S., Abellan, X., Balsamo, G., Bechtold, P., Biavati, G., Bidlot, J., Bonavita, M., Chiara, G. D., Dahlgren, P., Dee, D., Diamantakis, M., Dragani, R., Flemming, J., Forbes, R., Fuentes, M., Geer, A., Haimberger, L., Healy, S., Hogan, R. J., Hólm, E., Janisková, M., Keeley, S., Laloyaux, P., Lopez, P., Lupu, C., Radnoti, G., de Rosnay, P., Rozum, I., Vamborg, F., Villaume, S., and Thépaut, J.: The ERA5 global reanalysis, Q. J. Roy. Meteor. Soc., 146, 1999–2049, https://doi.org/10.1002/qj.3803, 2020. a
Hersbach, H., Bell, B., Berrisford, P., Biavati, G., Horányi, A., Muñoz Sabater, J., Nicolas, J., Peubey, C., Radu, R., Rozum, I., Schepers, D., Simmons, A., Soci, C., Dee, D., and Thépaut, J.-N.: ERA5 hourly data on pressure levels from 1940 to present, Copernicus Climate Change Service (C3S) Climate Data Store (CDS) [data set], https://doi.org/10.24381/cds.bd0915c6, 2023. a
Hoyos, C. D., Ceballos, L. I., Pérez-Carrasquilla, J. S., Sepúlveda, J., López-Zapata, S. M., Zuluaga, M. D., Velásquez, N., Herrera-Mejía, L., Hernández, O., Guzmán-Echavarría, G., and Zapata, M.: Meteorological conditions leading to the 2015 Salgar flash flood: lessons for vulnerable regions in tropical complex terrain, Nat. Hazards Earth Syst. Sci., 19, 2635–2665, https://doi.org/10.5194/nhess-19-2635-2019, 2019. a
Huffman, G., Stocker, E., Bolvin, D., Nelkin, E., and Tan, J.: GPM IMERG Final Precipitation L3 1 day 0.1 degree × 0.1 degree V06, edited by: Savtchenko, A., Goddard Earth Sciences Data and Information Services Center (GES DISC), Greenbelt, MD, https://doi.org/10.5067/GPM/IMERGDF/DAY/06, 2019. a
Huffman, G. J., Stocker, E. F., Bolvin, D. T., Nelkin, E. J., and Tan, J.: GPM IMERG Final Precipitation L3 Half Hourly 0.1 degree x 0.1 degree V07, Goddard Earth Sciences Data and Information Services Center (GES DISC) [data set], https://doi.org/10.5067/GPM/IMERG/3B-HH/07, 2023. a
Huntzicker, J. J., Heyerdahl, E. K., McDow, S. R., Rau, J. A., Griest, W. H., and MacDougall, C. S.: Combustion as the Principal Source of Carbonaceous Aerosol in the Ohio River Valley, JAPCA J. Air Waste Ma., 36, 705–709, https://doi.org/10.1080/00022470.1986.10466105, 1986. a
Hwang, S.-H., Lee, J. Y., Yi, S.-M., and Kim, H.: Associations of particulate matter and its components with emergency room visits for cardiovascular and respiratory diseases, PLoS One, 12, e0183224, https://doi.org/10.1371/journal.pone.0183224, 2017. a
Inness, A., Ades, M., Agustí-Panareda, A., Barré, J., Benedictow, A., Blechschmidt, A.-M., Dominguez, J. J., Engelen, R., Eskes, H., Flemming, J., Huijnen, V., Jones, L., Kipling, Z., Massart, S., Parrington, M., Peuch, V.-H., Razinger, M., Remy, S., Schulz, M., and Suttie, M.: The CAMS reanalysis of atmospheric composition, Atmos. Chem. Phys., 19, 3515–3556, https://doi.org/10.5194/acp-19-3515-2019, 2019. a, b, c
Jayarathne, T., Stockwell, C. E., Yokelson, R. J., Nakao, S., and Stone, E. A.: Emissions of Fine Particle Fluoride from Biomass Burning, Environ. Sci. Technol., 48, 12636–12644, https://doi.org/10.1021/es502933j, 2014. a, b
Jiao, Y., Su, M., Ji, C., Yang, S., and Zhang, P.: How to design fully cooperative policies to abate transboundary air pollution between two highly asymmetric regions: An abnormal incrementalism analysis, J. Clean. Prod., 278, 124042, https://doi.org/10.1016/j.jclepro.2020.124042, 2021. a
Kaiser, J. W., Heil, A., Andreae, M. O., Benedetti, A., Chubarova, N., Jones, L., Morcrette, J.-J., Razinger, M., Schultz, M. G., Suttie, M., and van der Werf, G. R.: Biomass burning emissions estimated with a global fire assimilation system based on observed fire radiative power, Biogeosciences, 9, 527–554, https://doi.org/10.5194/bg-9-527-2012, 2012. a
Kaneyasu, N., Yamamoto, S., Sato, K., Takami, A., Hayashi, M., Hara, K., Kawamoto, K., Okuda, T., and Hatakeyama, S.: Impact of long-range transport of aerosols on the PM2.5 composition at a major metropolitan area in the northern Kyushu area of Japan, Atmos. Environ., 97, 416–425, https://doi.org/10.1016/j.atmosenv.2014.01.029, 2014. a
Kaspari, S., Painter, T. H., Gysel, M., Skiles, S. M., and Schwikowski, M.: Seasonal and elevational variations of black carbon and dust in snow and ice in the Solu-Khumbu, Nepal and estimated radiative forcings, Atmos. Chem. Phys., 14, 8089–8103, https://doi.org/10.5194/acp-14-8089-2014, 2014. a
Kulshrestha, U. and Kumar, B.: Airmass Trajectories and Long Range Transport of Pollutants: Review of Wet Deposition Scenario in South Asia, Adv. Meteorol., 2014, 1–14, https://doi.org/10.1155/2014/596041, 2014. a
Kumar, A., Abouchami, W., Galer, S., Garrison, V., Williams, E., and Andreae, M.: A radiogenic isotope tracer study of transatlantic dust transport from Africa to the Caribbean, Atmos. Environ., 82, 130–143, https://doi.org/10.1016/j.atmosenv.2013.10.021, 2014. a
Liang, C.-K., West, J. J., Silva, R. A., Bian, H., Chin, M., Davila, Y., Dentener, F. J., Emmons, L., Flemming, J., Folberth, G., Henze, D., Im, U., Jonson, J. E., Keating, T. J., Kucsera, T., Lenzen, A., Lin, M., Lund, M. T., Pan, X., Park, R. J., Pierce, R. B., Sekiya, T., Sudo, K., and Takemura, T.: HTAP2 multi-model estimates of premature human mortality due to intercontinental transport of air pollution and emission sectors, Atmos. Chem. Phys., 18, 10497–10520, https://doi.org/10.5194/acp-18-10497-2018, 2018. a
Lin, P., Hu, M., Deng, Z., Slanina, J., Han, S., Kondo, Y., Takegawa, N., Miyazaki, Y., Zhao, Y., and Sugimoto, N.: Seasonal and diurnal variations of organic carbon in PM2.5 in Beijing and the estimation of secondary organic carbon, J. Geophys. Res.-Atmos., 114, D00G11, https://doi.org/10.1029/2008JD010902, 2009. a
Lippmann, M., Chen, L.-C., Gordon, T., Ito, K., and Thurston, G. D.: National Particle Component Toxicity (NPACT) Initiative: integrated epidemiologic and toxicologic studies of the health effects of particulate matter components, Research report, Health Effects Institute, 5–13, PMID: 24377209, 2013. a
Liu, J., Li, J., and Yao, F.: Source-receptor relationship of transboundary particulate matter pollution between China, South Korea and Japan: Approaches, current understanding and limitations, Crit. Rev. Env. Sci. Tec., 52, 3896–3920, https://doi.org/10.1080/10643389.2021.1964308, 2022. a
Malaguti, A., Mircea, M., La Torretta, T. M., Telloli, C., Petralia, E., Stracquadanio, M., and Berico, M.: Chemical Composition of Fine and Coarse Aerosol Particles in the Central Mediterranean Area during Dust and Non-Dust Conditions, Aerosol Air Qual. Res., 15, 410–425, https://doi.org/10.4209/aaqr.2014.08.0172, 2015. a, b, c
Malandrino, P., Russo, M., Gianì, F., Pellegriti, G., Vigneri, P., Belfiore, A., Rizzarelli, E., and Vigneri, R.: Increased Thyroid Cancer Incidence in Volcanic Areas: A Role of Increased Heavy Metals in the Environment?, Int. J. Mol. Sci., 21, 3425, https://doi.org/10.3390/ijms21103425, 2020. a
Manousakas, M., Papaefthymiou, H., Diapouli, E., Migliori, A., Karydas, A., Bogdanovic-Radovic, I., and Eleftheriadis, K.: Assessment of PM2.5 sources and their corresponding level of uncertainty in a coastal urban area using EPA PMF 5.0 enhanced diagnostics, Sci. Total Environ., 574, 155–164, https://doi.org/10.1016/j.scitotenv.2016.09.047, 2017. a
Martin, R., Ilyinskaya, E., and Oppenheimer, C.: The enigma of reactive nitrogen in volcanic emissions, Geochim. Cosmochim. Ac., 95, 93–105, https://doi.org/10.1016/j.gca.2012.07.027, 2012. a
Martinez-Verduzco, R., Reyna-Gomez, L., Cruz-López, A., Carrillo-Avila, J., Valdez-Cavazos, A., and Suárez-Vázquez, S.: Approach into the influence of Saharan dust on the physicochemical properties of PM2.5 in Monterrey, México, Int. J. Environ. Sci. Te., 21, 2939–2952, https://doi.org/10.1007/s13762-023-05121-2, 2023. a
Martinsson, B. G., Brenninkmeijer, C. A. M., Carn, S. A., Hermann, M., Heue, K.-P., van Velthoven, P. F. J., and Zahn, A.: Influence of the 2008 Kasatochi volcanic eruption on sulfurous and carbonaceous aerosol constituents in the lower stratosphere, Geophys. Res. Lett., 36, L12813, https://doi.org/10.1029/2009GL038735, 2009. a
Mason, E., Wieser, P. E., Liu, E. J., Edmonds, M., Ilyinskaya, E., Whitty, R. C. W., Mather, T. A., Elias, T., Nadeau, P. A., Wilkes, T. C., McGonigle, A. J. S., Pering, T. D., Mims, F. M., Kern, C., Schneider, D. J., and Oppenheimer, C.: Volatile metal emissions from volcanic degassing and lava–seawater interactions at Kīlauea Volcano, Hawai'i, Communications Earth & Environment, 2, 79, https://doi.org/10.1038/s43247-021-00145-3, 2021. a
Mather, T., Pyle, D., and Oppenheimer, C.: Tropospheric volcanic aerosol, Geophys. Monogr. Ser., 139, 189–212, 2003. a, b, c
Mendez Espinosa, J., Herrera, L., and Belalcazar, L.: Study of a Saharan Dust Intrusion into the Colombian Atmosphere/Estudio de una intrusión de polvo sahariano en la atmósfera de Colombia, Revista Ingenierías Universidad de Medellín, 17, 17–34, https://doi.org/10.22395/rium.v17n32a1, 2018. a, b, c
Mendez-Espinosa, J., Belalcazar, L., and Betancourt, R. M.: Regional air quality impact of northern South America biomass burning emissions, Atmos. Environ., 203, 131–140, https://doi.org/10.1016/j.atmosenv.2019.01.042, 2019. a, b, c, d, e, f, g
Mendez-Espinosa, J. F., Rojas, N. Y., Vargas, J., Pachón, J. E., Belalcazar, L. C., and Ramírez, O.: Air quality variations in Northern South America during the COVID-19 lockdown, Sci. Total Environ., 749, 141621, https://doi.org/10.1016/j.scitotenv.2020.141621, 2020. a, b
MinAmbiente-Colombia: Manual de Diseñol de Sistemas de Vigilancia de la Calidad del Aire, https://www.minambiente.gov.co/wp-content/uploads/2021/06/Protocolo_Calidad_del_Aire_-_Manual_Diseno.pdf (last access: 1 October 2024), 2010. a
Miranda, J., Zepeda, F., and Galindo, I.: The possible influence of volcanic emissions on atmospheric aerosols in the city of Colima, Mexico, Environ. Pollut., 127, 271–279, https://doi.org/10.1016/S0269-7491(03)00265-3, 2004. a
Misra, A., Tripathi, S., Sembhi, H., and Boesch, H.: Validation of CAMS AOD using AERONET Data and Trend Analysis at Four Locations in the Indo-Gangetic Basin, Ann. Geophys. Discuss. [preprint], https://doi.org/10.5194/angeo-2020-40, 2020. a
Miyakawa, T., Takegawa, N., and Kondo, Y.: Removal of sulfur dioxide and formation of sulfate aerosol in Tokyo, J. Geophys. Res.-Atmos., 112, D13209, https://doi.org/10.1029/2006JD007896, 2007. a
Moran-Zuloaga, D., Merchan-Merchan, W., Rodriguez-Caballero, E., Mulas, M., and Hernick, P.: Long-range transport and microscopy analysis of Sangay volcanic ashes in Ecuador, Air Qual. Atmos. Hlth., 17, 155–175, https://doi.org/10.1007/s11869-023-01434-w, 2024. a, b
Moreno, C. I., Krejci, R., Jaffrezo, J.-L., Uzu, G., Alastuey, A., Andrade, M. F., Mardóñez, V., Koenig, A. M., Aliaga, D., Mohr, C., Ticona, L., Velarde, F., Blacutt, L., Forno, R., Whiteman, D. N., Wiedensohler, A., Ginot, P., and Laj, P.: Tropical tropospheric aerosol sources and chemical composition observed at high altitude in the Bolivian Andes, Atmos. Chem. Phys., 24, 2837–2860, https://doi.org/10.5194/acp-24-2837-2024, 2024. a, b
NCEP–NCAR: Reanalisys 1, NOAA Physical Sciences Laboratory [data set], https://downloads.psl.noaa.gov/Datasets/ncep.reanalysis/pressure/ (last access: 1 October 2024), 2023. a
Nicolás, J., Chiari, M., Crespo, J., Orellana, I. G., Lucarelli, F., Nava, S., Pastor, C., and Yubero, E.: Quantification of Saharan and local dust impact in an arid Mediterranean area by the positive matrix factorization (PMF) technique, Atmos. Environ., 42, 8872–8882, https://doi.org/10.1016/j.atmosenv.2008.09.018, 2008. a
Noris, G. and Duvall, R.: EPA Positive Matrix Factorization (PMF) 5.0 Fundamentals and User Guide, US-EPA, https://www.epa.gov/sites/production/files/2015-02/documents/pmf_5.0_user_guide.pdf (last access: 30 September 2021), 2014. a, b, c, d, e, f, g, h
Okin, G. S., Mahowald, N., Chadwick, O. A., and Artaxo, P.: Impact of desert dust on the biogeochemistry of phosphorus in terrestrial ecosystems, Global Biogeochem. Cy., 18, GB2005, https://doi.org/10.1029/2003GB002145, 2004. a
Paatero, P.: Least squares formulation of robust non-negative factor analysis, Chemometr. Intell. Lab., 37, 23–35, https://doi.org/10.1016/S0169-7439(96)00044-5, 1997. a
Paatero, P. and Tapper, U.: Positive matrix factorization: A non-negative factor model with optimal utilization of error estimates of data values, Environmetrics, 5, 111–126, 1994. a
Pani, S. K., Chantara, S., Khamkaew, C., Lee, C.-T., and Lin, N.-H.: Biomass burning in the northern peninsular Southeast Asia: Aerosol chemical profile and potential exposure, Atmos. Res., 224, 180–195, https://doi.org/10.1016/j.atmosres.2019.03.031, 2019. a
Pérez-Carrasquilla, J. S., Montoya, P. A., Sánchez, J. M., Hernández, K. S., and Ramírez, M.: Forecasting 24 h averaged PM2.5 concentration in the Aburrá Valley using tree-based machine learning models, global forecasts, and satellite information, Adv. Stat. Clim. Meteorol. Oceanogr., 9, 121–135, https://doi.org/10.5194/ascmo-9-121-2023, 2023. a, b
Pongpiachan, S., Tipmanee, D., Choochuay, C., Hattayanone, M., Deelaman, W., Iadtem, N., Bunsomboonsakul, S., Palakun, J., Poshyachinda, S., Leckngam, A., Somboonpon, P., Panyaphirawat, T., Aukkaravittayapun, S., Wang, Q., Xing, L., Li, G., Han, Y., and Cao, J.: Vertical profile of organic and elemental carbon in sediments of Songkhla Lake, Thailand, Limnology, 20, 203–214, https://doi.org/10.1007/s10201-018-0568-9, 2019. a
Posada-Marín, J. A., Rendón, A. M., Salazar, J. F., Mejía, J. F., and Villegas, J. C.: WRF downscaling improves ERA-Interim representation of precipitation around a tropical Andean valley during El Niño: implications for GCM-scale simulation of precipitation over complex terrain, Clim. Dynam., 52, 3609–3629, 2019. a
Pouliot, G., Pierce, T., Denier van der Gon, H., Schaap, M., Moran, M., and Nopmongcol, U.: Comparing emission inventories and model-ready emission datasets between Europe and North America for the AQMEII project, Atmos. Environ., 53, 4–14, https://doi.org/10.1016/j.atmosenv.2011.12.041, 2012. a
Prospero, J. M., Collard, F.-X., Molinié, J., and Jeannot, A.: Characterizing the annual cycle of African dust transport to the Caribbean Basin and South America and its impact on the environment and air quality, Global Biogeochem. Cy., 28, 757–773, https://doi.org/10.1002/2013GB004802, 2014. a
Prospero, J. M., Barkley, A. E., Gaston, C. J., Gatineau, A., Campos y Sansano, A., and Panechou, K.: Characterizing and quantifying African dust transport and deposition to South America: Implications for the phosphorus budget in the Amazon Basin, Global Biogeochem. Cy., 34, e2020GB006536, https://doi.org/10.1029/2020GB006536, 2020. a, b, c
Rastogi, N., Singh, A., Singh, D., and Sarin, M.: Chemical characteristics of PM2.5 at a source region of biomass burning emissions: Evidence for secondary aerosol formation, Environ. Pollut., 184, 563–569, https://doi.org/10.1016/j.envpol.2013.09.037, 2014. a, b, c
Ridley, D. A., Heald, C. L., and Ford, B.: North African dust export and deposition: A satellite and model perspective, J. Geophys. Res.-Atmos., 117, D02202, https://doi.org/10.1029/2011JD016794, 2012. a, b
Rincón-Riveros, J. M., Rincón-Caro, M. A., Sullivan, A. P., Mendez-Espinosa, J. F., Belalcazar, L. C., Quirama Aguilar, M., and Morales Betancourt, R.: Long-term brown carbon and smoke tracer observations in Bogotá, Colombia: association with medium-range transport of biomass burning plumes, Atmos. Chem. Phys., 20, 7459–7472, https://doi.org/10.5194/acp-20-7459-2020, 2020. a, b, c
Roberts, T., Vignelles, D., Liuzzo, M., Giudice, G., Aiuppa, A., Coltelli, M., Salerno, G., Chartier, M., Couté, B., Berthet, G., Lurton, T., Dulac, F., and Renard, J.-B.: The primary volcanic aerosol emission from Mt Etna: Size-resolved particles with SO2 and role in plume reactive halogen chemistry, Geochim. Cosmochim. Ac., 222, 74–93, https://doi.org/10.1016/j.gca.2017.09.040, 2018. a, b
Rodríguez-Gómez, C., Echeverry, G., Jaramillo, A., and Ladino, L. A.: The negative impact of biomass burning and the Orinoco low-level jet on the air quality of the Orinoco River Basin, Atmósfera, 35, 497–520, https://doi.org/10.20937/ATM.52979, 2022. a, b
Ruggieri, F., Fernandez-Turiel, J., Saavedra, J., Gimeno, D., Polanco, E., Amigo, A., Galindo, G., and Caselli, A.: Contribution of volcanic ashes to the regional geochemical balance: The 2008 eruption of Chaitén volcano, Southern Chile, Sci. Total Environ., 425, 75–88, https://doi.org/10.1016/j.scitotenv.2012.03.011, 2012. a
Salazar Hernandez, C., Vásquez, J., and Agudelo, N.: Perspectiva paisajística de la estructura ecológica urbana de Medellín, Universidad Pontificia Bolivariana, https://doi.org/10.18566/978-628-500-081-2, 2022. a
Salim, I., Sajjad, R. U., Paule-Mercado, M. C., Memon, S. A., Lee, B.-Y., Sukhbaatar, C., and Lee, C.-H.: Comparison of two receptor models PCA-MLR and PMF for source identification and apportionment of pollution carried by runoff from catchment and sub-watershed areas with mixed land cover in South Korea, Sci. Total Environ., 663, 764–775, https://doi.org/10.1016/j.scitotenv.2019.01.377, 2019. a
Santín, C., Doerr, S. H., Kane, E. S., Masiello, C. A., Ohlson, M., de la Rosa, J. M., Preston, C. M., and Dittmar, T.: Towards a global assessment of pyrogenic carbon from vegetation fires, Global Change Biol., 22, 76–91, https://doi.org/10.1111/gcb.12985, 2016. a
Shin, S. M., Kim, J. Y., Lee, J. Y., Kim, D.-S., and Kim, Y. P.: Enhancement of modeling performance by including organic markers to the PMF modeling for the PM2.5 at Seoul, Air Qual. Atmos. Hlth., 15, 91–104, https://doi.org/10.1007/s11869-021-01087-7, 2022. a
SIATA: Seguimiento de los aerosoles y eventos externos que afectan la calidad del aire del Valle de Aburrá, AMVA-EAFIT, https://www.metropol.gov.co/ambiental/calidad-del-aire/Biblioteca-aire/Estudios-calidad-del-aire/Estudio-Fuentes-Externas-SIATA.pdf (last access: 30 September 2024), 2021. a, b, c, d
SIATA: Estaciones Calidad del Aire, SIATA [data set], https://siata.gov.co/descarga_siata/index.php/index2/login/cerrar_sesion (last access: 1 October 2024), 2024. a
Tasić, V., Jovašević-Stojanović, M., Vardoulakis, S., Milošević, N., Kovačević, R., and Petrović, J.: Comparative assessment of a real-time particle monitor against the reference gravimetric method for PM10 and PM2.5 in indoor air, Atmos. Environ., 54, 358–364, https://doi.org/10.1016/j.atmosenv.2012.02.030, 2012. a
Trejos, E. M., Silva, L. F., Hower, J. C., Flores, E. M., González, C. M., Pachón, J. E., and Aristizábal, B. H.: Volcanic emissions and atmospheric pollution: A study of nanoparticles, Geosci. Front., 12, 746–755, 2021. a, b
Tuomisto, J. T., Wilson, A., Evans, J. S., and Tainio, M.: Uncertainty in mortality response to airborne fine particulate matter: Combining European air pollution experts, Reliab. Eng. Syst. Safe., 93, 732–744, https://doi.org/10.1016/j.ress.2007.03.002, 2008. a, b
UN: Hemispheric Transport of Air Pollution, https://unece.org/sites/default/files/2021-06/Air.Pollution%20Studies.No_.17_100.pdf (last access: 30 September 2024), 2010. a
US-EPA: 40 CFR Appendix L to Part 50 – Reference Method for the Determination of Fine Particulate Matter as PM2.5 in the Atmosphere, https://www.govinfo.gov/app/details/CFR-2017-title40-vol2/CFR-2017-title40-vol2-part50-appL/context (last access: 30 September 2024), 2011. a
Vanegas, S., Trejos, E. M., Aristizábal, B. H., Pereira, G. M., Hernández, J. M., Murillo, J. H., Ramírez, O., Amato, F., Silva, L. F. O., Rojas, N. Y., Zafra, C., and Pachón, J. E.: Spatial Distribution and Chemical Composition of Road Dust in Two High-Altitude Latin American Cities, Atmosphere, 12, 1109, https://doi.org/10.3390/atmos12091109, 2021. a
Varrica, D., Tamburo, E., Vultaggio, M., and Di Carlo, I.: ATR–FTIR Spectral Analysis and Soluble Components of PM10 and PM2.5 Particulate Matter over the Urban Area of Palermo (Italy) during Normal Days and Saharan Events, Int. J. Env. Res. Pub. He., 16, 2507, https://doi.org/10.3390/ijerph16142507, 2019. a
Velásquez-García, M. P., Hernández, D. A., and Pérez-Carrasquilla, J. S.: Basic trajectories code in python (v2.0.0), Zenodo [code], https://doi.org/10.5281/zenodo.13730208, 2024. a
Via, M., Chen, G., Canonaco, F., Daellenbach, K. R., Chazeau, B., Chebaicheb, H., Jiang, J., Keernik, H., Lin, C., Marchand, N., Marin, C., O'Dowd, C., Ovadnevaite, J., Petit, J.-E., Pikridas, M., Riffault, V., Sciare, J., Slowik, J. G., Simon, L., Vasilescu, J., Zhang, Y., Favez, O., Prévôt, A. S. H., Alastuey, A., and Cruz Minguillón, M.: Rolling vs. seasonal PMF: real-world multi-site and synthetic dataset comparison, Atmos. Meas. Tech., 15, 5479–5495, https://doi.org/10.5194/amt-15-5479-2022, 2022. a
Vigneri, R., Malandrino, P., Gianì, F., Russo, M., and Vigneri, P.: Heavy metals in the volcanic environment and thyroid cancer, Mol. Cell. Endocrinol., 457, 73–80, https://doi.org/10.1016/j.mce.2016.10.027, 2017. a
Wang, L., Liu, Z., Sun, Y., Ji, D., and Wang, Y.: Long-range transport and regional sources of PM2.5 in Beijing based on long-term observations from 2005 to 2010, Atmos. Res., 157, 37–48, https://doi.org/10.1016/j.atmosres.2014.12.003, 2015. a
WHO: WHO global air quality guidelines: particulate matter (PM2.5 and PM10), ozone, nitrogen dioxide, sulfur dioxide and carbon monoxide: executive summary, WHO, ISBN: 9789240034228, 2021. a, b
Woo, J.-H., Kim, Y., Kim, H.-K., Choi, K.-C., Eum, J.-H., Lee, J.-B., Lim, J.-H., Kim, J., and Seong, M.: Development of the CREATE Inventory in Support of Integrated Climate and Air Quality Modeling for Asia, Sustainability, 12, 7930, https://doi.org/10.3390/su12197930, 2020. a
Xie, W., You, J., Zhi, C., and Li, L.: The toxicity of ambient fine particulate matter (PM2.5) to vascular endothelial cells, J. Appl. Toxicol., 41, 713–723, https://doi.org/10.1002/jat.4138, 2021. a
Yao, L., Huo, J., Wang, D., Fu, Q., Sun, W., Li, Q., and Chen, J.: Online measurement of carbonaceous aerosols in suburban Shanghai during winter over a three-year period: Temporal variations, meteorological effects, and sources, Atmos. Environ., 226, 117408, https://doi.org/10.1016/j.atmosenv.2020.117408, 2020. a
Yu, J., Yan, C., Liu, Y., Li, X., Zhou, T., and Zheng, M.: Potassium: A Tracer for Biomass Burning in Beijing?, Aerosol Air Qual. Res., 18, 2447–2459, https://doi.org/10.4209/aaqr.2017.11.0536, 2018. a
Yu, W., Liu, R., Wang, J., Xu, F., and Shen, Z.: Source apportionment of PAHs in surface sediments using positive matrix factorization combined with GIS for the estuarine area of the Yangtze River, China, Chemosphere, 134, 263–271, https://doi.org/10.1016/j.chemosphere.2015.04.049, 2015. a
Yuan, Y., Wu, Y., Ge, X., Nie, D., Wang, M., Zhou, H., and Chen, M.: In vitro toxicity evaluation of heavy metals in urban air particulate matter on human lung epithelial cells, Sci. Total Environ., 678, 301–308, https://doi.org/10.1016/j.scitotenv.2019.04.431, 2019. a
Zhao, N., Dong, X., Huang, K., Fu, J. S., Lund, M. T., Sudo, K., Henze, D., Kucsera, T., Lam, Y. F., Chin, M., and Tilmes, S.: Responses of Arctic black carbon and surface temperature to multi-region emission reductions: a Hemispheric Transport of Air Pollution Phase 2 (HTAP2) ensemble modeling study, Atmos. Chem. Phys., 21, 8637–8654, https://doi.org/10.5194/acp-21-8637-2021, 2021. a
Zhong, L., Louie, P. K., Zheng, J., Yuan, Z., Yue, D., Ho, J. W., and Lau, A. K.: Science–policy interplay: Air quality management in the Pearl River Delta region and Hong Kong, Atmos. Environ., 76, 3–10, https://doi.org/10.1016/j.atmosenv.2013.03.012, 2013. a