the Creative Commons Attribution 4.0 License.
the Creative Commons Attribution 4.0 License.
 | 15 Oct 2024
The Paris low-level jet during PANAME 2022 and its impact on the summertime urban heat island
Jonnathan Céspedes
Simone Kotthaus
Jana Preissler
Clément Toupoint
Ludovic Thobois
Marc-Antoine Drouin
Jean-Charles Dupont
Aurélien Faucheux
Martial Haeffelin
The low-level jet (LLJ) and the urban heat island (UHI) are common nocturnal phenomena. While the UHI has been studied extensively, interactions of the LLJ and the urban atmosphere in general (and the UHI in particular) have received less attention. In the framework of the PANAME (PAris region urbaN Atmospheric observations and models for Multidisciplinary rEsearch) initiative in the Paris region, continuous profiles of horizontal wind speed and vertical velocity were recorded with two Doppler wind lidars (DWLs) – for the first time allowing for a detailed investigation of the summertime LLJ characteristics in the region. Jets are detected for 70 % of the examined nights, often simultaneously at an urban and a suburban site, highlighting the LLJ regional spatial extent. Emerging at around sunset, the mean LLJ duration is ∼ 10 h, the mean wind speed is 9 m s−1, and the average core height is 400 m above the city. The temporal evolution of many events shows signatures that indicate that the inertial oscillation mechanism plays a role in the jet development: a clockwise veering of the wind direction and a rapid acceleration followed by a slower deceleration. The horizontal wind shear below the LLJ core induces variance in the vertical velocity () above the urban canopy layer. It is shown that is a powerful predictor for regional contrast in air temperature, as the UHI intensity decreases exponentially with increasing and strong UHI values only occur when is very weak. This study demonstrates how DWL observations in cities provide valuable insights into near-surface processes relevant to human and environmental health.
- Article
(6320 KB) - Full-text XML
- BibTeX
- EndNote


The nocturnal urban heat island (UHI) in the canopy layer is surely among the most studied phenomena in the urban environment. As this UHI is defined as the difference in air temperature between built-up and rural settings right above ground level (Oke et al., 2017), investigations usually focus on the near-surface atmosphere conditions, while the dynamics of the atmospheric boundary layer (ABL) are rarely considered explicitly. Although wind speed and atmospheric stratification play a significant role in the formation of the UHI, the intensity of the UHI is strongest under low wind speed and cloud-free conditions (Oke et al., 2017), i.e., when atmospheric stratification in rural settings tends to be relatively stable. During stable atmospheric stratification, the atmospheric boundary layer flow may become decoupled from the friction exerted by the surface, which can lead to the formation of the nocturnal low-level jet (LLJ). The LLJ is manifested by a sharp maximum in the vertical profile of the horizontal wind speed, typically at a height between 100 and 1000 m above the ground, referred to as the core of the jet (Stull, 1988). Another feature related to the LLJ wind profile is a strong decrease that goes along with a minimum in the horizontal wind speed above the core height (Shapiro et al., 2016). The LLJ is a mesoscale phenomenon frequently observed in the ABL, mostly during nights with fair-weather conditions after clear-sky days. It is usually characterized based on its core height, wind speed, and wind direction.
With clear links to various processes such as advection, wind shear, and turbulent mixing, the LLJ core characteristics can have a series of practical implications with respect to, e.g., air quality (Wei et al., 2023; Klein et al., 2019), changes in precipitation patterns (Algarra et al., 2019; Chen et al., 2022), aviation safety (Gultepe et al., 2019; Liu et al., 2014), the potential of and risk to wind energy production (Lundquist, 2021; Luiz and Fiedler, 2022; Rubio et al., 2022), urban ventilation (He et al., 2022), and the heat spatial distribution and intensity of the UHI effect (Kallistratova and Kouznetsov, 2012; Hu et al., 2013; Ulpiani, 2021; Lin et al., 2022). The LLJ is highly relevant for meteorology because its core characteristics are associated with the turbulent mass exchange in the ABL (Blackadar, 1957). Since the 1950s, the LLJ has been extensively documented, worldwide and throughout the year (Blackadar, 1957; Qi et al., 1999; Banta et al., 2002; Tuononen et al., 2017; Hartman, 2018; Du and Chen, 2019; Jiménez-Sánchez et al., 2019; Li and Du, 2021). One converging point of the previous studies is that the LLJ core is generally formed during the evening, followed by an increase in the core wind speed, and it eventually dissipates at about sunrise.
Blackadar (1957) proposed the inertial oscillation theory to explain the physical mechanism behind LLJ formation, but other mechanisms can also play a role. In the Great Plains, LLJ formation is linked to the IO and the differential heating and cooling of the sloping terrain (Holton, 1967; Shapiro et al., 2016). Jets are also observed over coastal regions as the result of land–sea breeze interactions and temperature gradients (Karipot et al., 2009; Roy et al., 2021).
Regardless of the study area or mechanism of formation, most observational and descriptive studies agree on the importance of classifying the LLJ, usually by one of its main characteristics (Banta et al., 2002; Baas et al., 2009; Karipot et al., 2009; Bonin et al., 2015). Grouping of LLJ events into categories facilitates the description and analysis of potential effects on the environment of the affected area. The most widely used classification criterion is the core wind speed. Banta et al. (2002) were among the first to propose four categories of wind speed to describe LLJs: (0–5), (5–10), (10–15), and (15–20) m s−1. Subsequently, several studies around the world adopted similar categories of wind speed to study the LLJ (Karipot et al., 2009; Kallistratova et al., 2013; Wei et al., 2013; Arfeuille et al., 2015; Vanderwende et al., 2015; Carroll et al., 2019). This classification system provides a better understanding of the LLJ phenomenon development, evolution, and impacts based on the wind speed intensity. Studies focused on the effects of the LLJ dynamics on the near-surface atmosphere tend to consider other parameters like turbulent kinetic energy (TKE) in addition to the core wind speed. Banta et al. (2002, 2003) successfully showed that the mechanical turbulence generated by the wind shear below the jet core plays a key role in controlling fluxes between the surface and the atmosphere. In particular, the downward transport of turbulence can modulate near-urban surface atmospheric processes like the UHI effect (Hu et al., 2013; Lin et al., 2022).
The UHI can be observed worldwide throughout the year, but in high-density cities in the midlatitudes, it tends to be stronger during the summer (Lemonsu and Masson, 2002; Oke et al., 2017). The expansion of urban areas under poor ventilation and cooling design has made the UHI a prominent factor in the deterioration of human thermal comfort (Kong et al., 2016; Li et al., 2019; Lin et al., 2022). High nocturnal temperatures increase the stress on the human body at times when it needs to rest (sleep), leading to higher mortality (Robine et al., 2008; Taylor et al., 2015; Ridder et al., 2016; He et al., 2022). While the UHI phenomenon is driven by excess heat in the built environment, atmospheric dynamics (advection, mixing, subsidence) significantly modulate the UHI intensity (Oke, 1973; Oke et al., 2017). Weak flow conditions favor the formation of a strong UHI (Lemonsu and Masson, 2002), while each increase of 1 m s−1 in wind speed was found to reduce the urban air temperature during summer nights by up to 2 °C (Cheng et al., 2012; He et al., 2022).
Although surface wind speed has long been recognized as an important indicator for variations in the UHI intensity, only a few studies in urban areas have investigated the relation between advection produced by the nocturnal LLJ and the UHI. Studies conducted in Sao Paulo (Brazil) (Sánchez et al., 2022), Oklahoma (USA) (Hu et al., 2013), Moscow (Russia) (Kallistratova and Kouznetsov, 2012; Kallistratova et al., 2013), and Beijing (China) (Lin et al., 2022) concluded that there is a negative correlation between the UHI intensity and the core wind speed of the jet. Even though these efforts have contributed to understanding the potential implications of the LLJ for UHI development, these works are mostly based on a limited number of radiosonde observations and few case studies. Hence, continuous observations of the wind speed profile with high temporal and spatial resolution are still needed in urban environments. Another relevant aspect of the interaction between the LLJ and the urban boundary layer (UBL) is that the urban environment enhances atmospheric mixing and buoyancy that can also affect the characteristics of LLJs originating in rural surroundings. In London, UK, Barlow et al. (2014) and Tsiringakis et al. (2022) have investigated the interaction between the LLJ and the UBL based on a combination of continuous DWL observations and modeling data, highlighting the importance of both the LLJ (downward mixing by shear-driven turbulence) and the urban surface (upward mixing driven by urban heat and roughness).
In France, the LLJ has been observed in northern coastal urban areas (Roy et al., 2021, 2022; Dieudonné et al., 2023), but coastal jets usually present different formation mechanisms and characteristics than those observed inland. This is mainly explained due to the importance of the land–sea breeze interactions (Karipot et al., 2009). Particularly in the urban area of Paris, some studies have been conducted to understand the impact of the LLJ on air quality, the mixing of pollutants within the UBL, and the UHI development. Klein et al. (2019) performed a 1 d case study using a combination of DWL profiles, numerical simulations, and ancillary observations, concluding that nocturnal LLJs can modulate the evolution of the mixing layer with implications for the ozone concentration in the early morning. Cheliotis et al. (2021) collected DWL data during a period of 3 months in fall 2014, observing LLJs in 20 out of 63 nights. They linked the production of turbulent coherent structures to the presence of LLJ events, which in turn play an important role in the transport of heat, moisture, and pollutants through the ABL. Wouters et al. (2013) presented a model-based case study during the summer of 2006, where simulations of UHI and LLJ allowed them to conclude that the UHI could be affected by the nocturnal stability and mixing associated with the LLJ. However, when comparing with radiosonde profiles the strong jets were underestimated by the model, making it hard to identify what characteristics of the jets influenced the UHI development. Therefore, as far as the authors of the present work are aware, variations of the LLJ characteristics over periods exceeding a few days and their possible implications for UHI development have not yet been investigated in the Paris region. One key reason is the previous lack of medium-term or continuous long-term observations of the wind speed profile within the Paris UBL.
Strengthening the knowledge in this field is important because there is observational evidence that the LLJ is a common phenomenon in Europe, frequently detected at distances of less than 400 km from the city of Paris (Baas et al., 2009). Furthermore, gaining understanding about the LLJ impacts on the UHI is imperative, given the significance of the UHI as a main concern in a city like Paris where a large number of inhabitants (approx. 12 million) are potentially exposed to severe heat hazards that are expected to become increasingly severe in future climates. As a consequence, the present study investigates the characteristics and nocturnal temporal evolution of the LLJ observed over the Paris region in summer 2022 as well as their implications for the UHI intensity, for the first time providing a comprehensive description of the occurrence of the summertime LLJ in the Paris region and an analysis of its variability. Here, we assess the impact of the LLJ on the profile of the horizontal wind speed and the UHI intensity. This paper is structured as follows: Sect. 2 provides details of the study area, study period, DWL and surface-based meteorological observations, and automatic detection of LLJ and UHI determination. Section 3 presents the results of the LLJ detection and performance, LLJ classification, LLJ characteristics and wind profile, LLJ nocturnal evolution, and the UHI evolution. Finally, Sect. 4 presents the summary and conclusions of this paper.
2.1 Study area and study period
Here we study the LLJ characteristics in the Paris region, France. With a population of over 12 million people, the Paris agglomeration is the second-biggest megalopolis and the most densely populated city in Europe. The Paris region has experienced fast and wide urbanization during the last decades but is still surrounded by natural and agricultural areas. Anthropogenic heat emissions and changes in land cover are aggravating the UHI effect (Lemonsu and Masson, 2002). Figure 1 shows the topography of the Paris region, the land cover classification, and the geographical location of the experimental sites. Paris is located about 150 km from the sea in a valley defined by the Seine River basin and surrounded by plateaus with modest topographic variation, which rise no more than 230 m above sea level (a.s.l.). In the city of Paris, the terrain is relatively flat, the lowest altitude is about 20 m a.s.l. along the river, and the highest altitude is about 130 m a.s.l. on hills in the northern parts of the city. About 20 km southwest of the city is the Paris–Saclay Plateau, which has a mean extension of 10 km and is elevated about 160 m a.s.l. It is an important economic, academic, and industrial area in the region. Due to the distance from the sea, there is no interaction of the sea breeze with the urban area. The long-term prevailing wind direction in the area is southwesterly and has a maritime origin, but winds from the northeast are also often observed (Haeffelin et al., 2005; Pal et al., 2012).

Figure 1Paris region (France) study area and the location of the experimental sites. (a) Topographic map from the ESA (2023) and (b) land cover map from Region (2023). The red borders indicate the administrative boundary of the city of Paris. The black polygons are administrative borders within the Paris region. The red dot represents the location of the WindCube Scan 400S at QUALAIR-SU (urban lidar), the cyan dot is the location of the WindCube WLS70 at SIRTA (suburban site), and the yellow dot is the location of the Météo-France meteorological measurement site at Melun (rural site).
This study focuses on the summer of 2022 between 15 June and 31 August. The year 2022 was recorded as the warmest observed in France so far, with three reported heat waves between June and August, leading to an exceptional nocturnal mesoscale flow over the Paris region during summertime with a predominant northeasterly flow. Severe conditions were observed especially in the July heat wave, when sea level temperature anomalies above 12 °C were associated with a deficit in precipitation rate of about 80 %, leading to extreme droughts (Petit et al., 2023). In general, the summer of 2022 had prevailing winds coming from the northerly to northeasterly directions (0–75°), with speeds below 7 m s−1. The air temperature ranged between 11.8 and 35.2 °C, with a mean value of 20.6 °C. These temperature values for 2022 are high when compared to longer-term averages. Using a comprehensive data set spanning from 2006 to 2022, collected by the Météo-France surface meteorological network and processed by the ReOBS project (Chiriaco et al., 2018), the typical synoptic conditions within the study area are analyzed for the summer months of June, July, and August. The prevailing nocturnal winds exhibit a range of directions mostly between 170 and 45°, with average speeds below 8 m s−1. The nocturnal air temperature ranges between 6.6 and 38 °C, with a mean temperature of 18.6 °C.
2.2 Doppler wind lidar measurements
The Doppler wind lidar (DWL) measurements recorded during the study period (15 June and 31 August 2022) at both the urban and the suburban sites contribute to the wind profile measurement network of the initiative PANAME (PAris region urbaN Atmospheric observations and models for Multidisciplinary rEsearch). The PANAME initiative is an unprecedented program bringing together a collection of multidisciplinary scientific projects that investigate the Paris urban environment in relation to weather, climate, air quality, and impacts on human health. The present study is part of the project called DYNAMICS, which contributes to PANAME with an improved characterization of nocturnal mean flow and turbulence conditions.
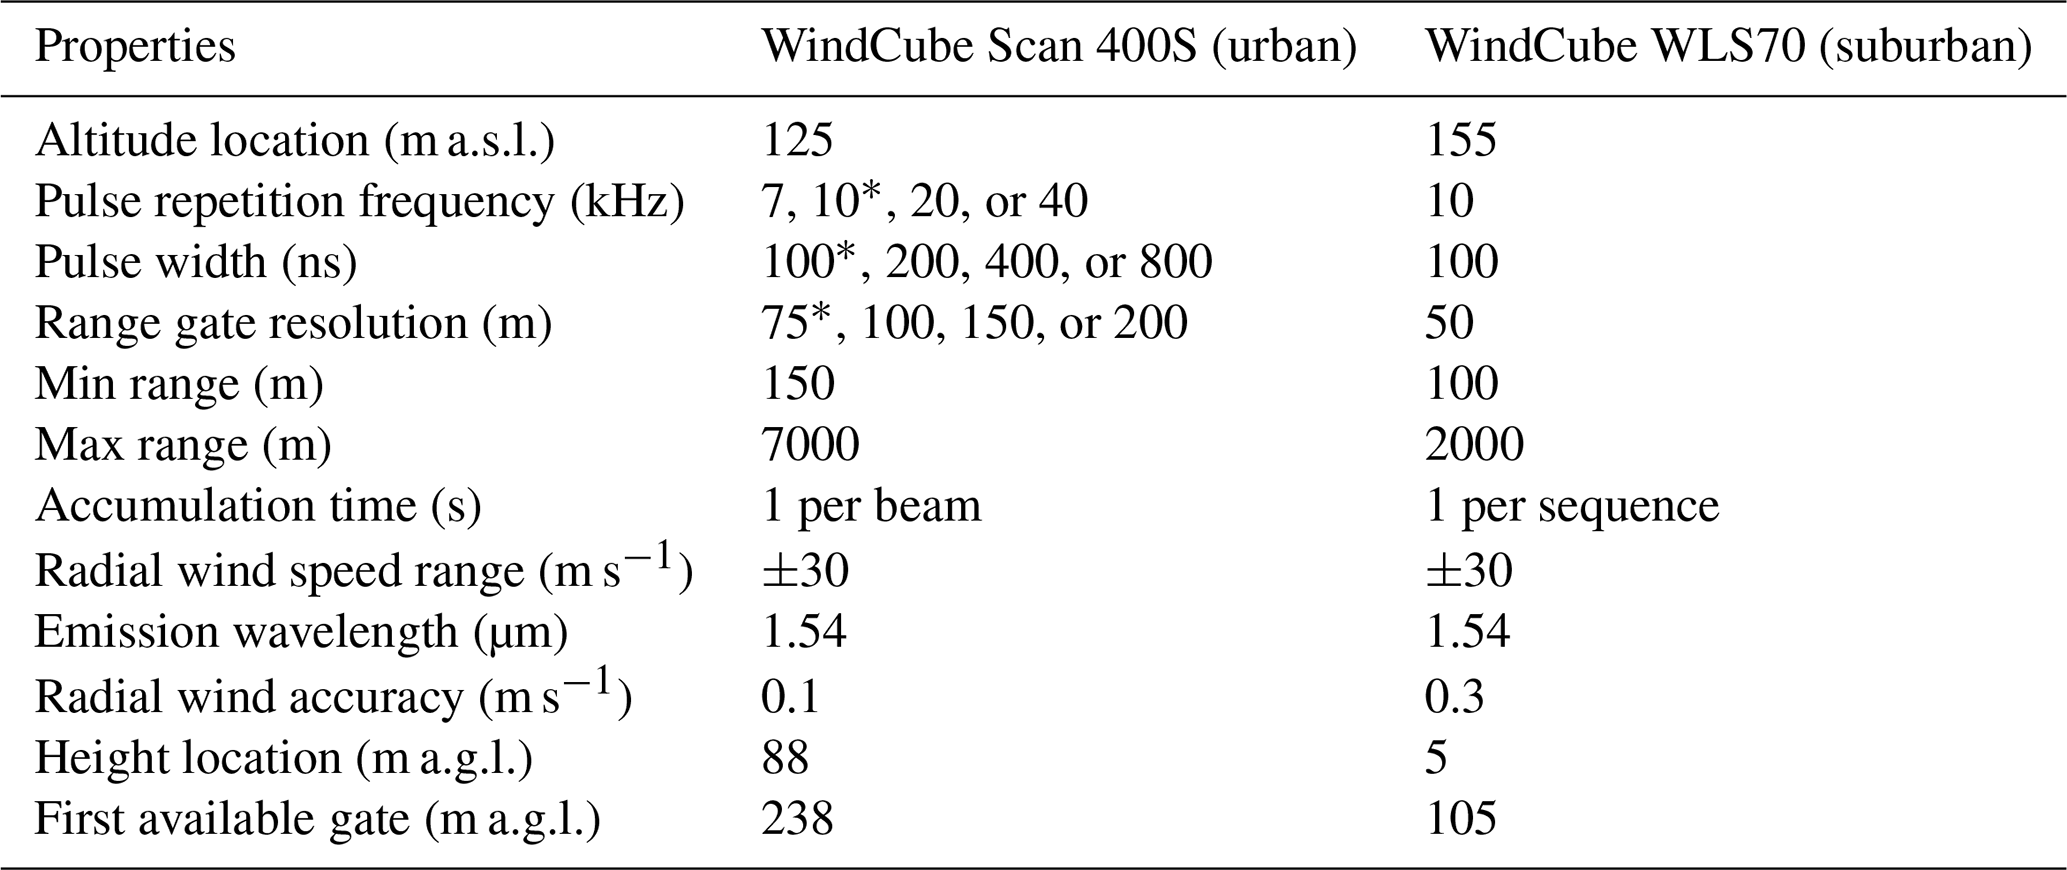
The high-power scanning DWL Vaisala WindCube Scan 400S was deployed in the city center of Paris (red dot in Fig. 1), on the roof of the Zamansky tower (88 m above ground level – a.g.l.) at the QUALAIR-SU supersite (48.8° N; 2.36° E; 400 m a.s.l.). QUALAIR-SU is a platform dedicated to atmospheric observations and air quality monitoring, which is operated by the Laboratoire Atmosphères, Observations Spatiales (LATMOS) and is hosted by Sorbonne Université at the Jussieu campus (Qualair, 2022). The WindCube Scan 400S is a DWL equipped with a scanning head capable of orienting the laser beam in any direction of the hemisphere (Thobois et al., 2019; Dolfi-Bouteyre et al., 2008). The high energy emitted by the pulse, at 1.54 µm wavelength, allows it to sample the atmosphere at a distance of up to 7 km. Several configurations of pulses are available corresponding to different spatial resolutions (75, 100, 150, or 200 m), with a resolution of 75 m used in this study. A blind zone, spanning twice the spatial resolution (150 m in this study), restricts measurements close to the sensor. Table 1 provides a summary of the main properties of the instrument. The WindCube Scan 400S can measure under different scanning strategies such as vertical stare, plan-position indicator (PPI), and Doppler beam swinging (DBS). Liu et al. (2019) provide a detailed technical description of every scan mode operation and their potential applications. The DBS mode is widely used in urban meteorology to measure vertical profiles of horizontal wind speed and wind direction. It was shown by Pearson et al. (2009) that DBS operates fast and captures unstable flows well in the urban interface. In this study, a five-point DBS mode is used, with the scanning head successively addressing five lines of sight (LOSs): one vertically oriented LOS (90° elevation angle) and four tilted LOSs (75° elevation angle) pointing north, east, south, and west. Each scanning sequence (one DBS cycle) is completed in approximately 15 s, with 1 s of accumulation time for each LOS and 2 s between two LOSs. The WindCube Scan 400S has been aligned with the geographic north using the hard target method, which has a precision of ±2°.
Table 1Properties of the Vaisala Doppler wind lidars WindCube Scan 400S (urban site) and WLS70 (suburban site). For the WindCube Scan 400s, the symbol * marks the setting used in this study.
During the study period (15 June–31 August 2022) the scan strategy was designed to follow an hourly schedule, integrating the DBS scan with the vertical stare and PPI. In the first half of every hour the DBS is performed for 9 min, followed by a 3 min full PPI at 0° of elevation with an angular resolution of 2° s−1, then 5 min of continuous vertical stare at 90° of elevation, followed by another 9 min of DBS and closing with another 3 min full PPI at 0°. The second half of the hour repeats the same schedule. In this study, all vertical profiles of horizontal wind speed observations were derived from the DBS, while the vertical stare data are used to derive the vertical velocity variance (). Observations from the PPI are not used in this study. The implemented scanning schedule was designed to fulfill several objectives but was not specifically optimized for the detection of LLJ. One quality control step is implemented to ensure a high-quality wind profile product: data with a CNR (carrier-to-noise ratio) below −20 dB and above 5 dB are excluded, thereby omitting weak signals and clouds, respectively.
In addition to the observations in central Paris, data collected by a Vaisala WindCube WLS70 at a suburban location on the Saclay Plateau are used in this study. The data recorded with this instrument are used in this study only to highlight the regional scale of the LLJ observed. A detailed analysis of this data collection will be the subject of future studies. This profiling DWL is an instrument specially developed for meteorological applications (Cariou et al., 2009). The observations are conducted at the SIRTA observatory (Site Instrumental de Recherche par Télédetection Atmosphérique; Haeffelin et al., 2005), located on the campus of École Polytechnique in Palaiseau, 20 km southwest of Paris (48.713° N, 2.208° E; 156 m a.s.l.; Fig. 1). Over the last 25 years, SIRTA has collected a comprehensive data set of atmospheric observations using in situ measurements as well as passive and active remote sensing instruments, characterizing the regional atmospheric background of the Paris region (Dupont et al., 2016). The WindCube WLS70 uses a 1.54 µm pulsed-fiber laser and a coherent detection system which provides sufficient backscattering signal up to 4 km. Every LOS performed by the WLS70 has a fixed spatial resolution of 50 m (see Table 1). The WLS70 performs four-point DBS measurements (10 s) in a way similar to the WindCube Scan 400S, but without the vertical LOS. This study uses 10 min averaged profiles; a previous quality control step is applied to these profiles to ensure 80 % of data availability at each range gate.
2.3 Automatic LLJ detection
Various methods and criteria have been developed to detect a LLJ in a vertical profile of horizontal wind, with techniques depending on the characteristics of the data source (e.g., limitations from measurement sensors) and even the study area. Stull (1988) defined a LLJ as any lower-tropospheric wind maximum in the vertical profile of horizontal wind speed that is at least 2 m s−1 greater than speeds both above and below within the lowest 1500 m of the atmosphere. This absolute criterion is widely found in the literature. It was applied to SODAR data collections (Karipot et al., 2009; Duarte et al., 2015) and radiosonde profiles measured in the USA (Bonner, 1968; Whiteman et al., 1997) and even in the Arctic Sea (Andreas et al., 2000). The threshold of this absolute criterion can be tuned as done by Banta et al. (2002), who used a value of 0.5 m s−1. However, under very weak flow conditions (< 2 m s−1) the performance of the criterion could present limitations in the identification of LLJ events (Baas et al., 2009). In such cases, it is possible to use a relative threshold instead, in which a LLJ is detected by a velocity difference of 20 %–25 % between the local maxima and minima. In fact, absolute and relative thresholds have been combined to further improve detection. In different long-term radiosonde campaigns in Sao Paulo, Brazil, the criterion to identify a LLJ event in a single wind speed profile was that the maximum at the LLJ must be greater than or equal to 2 m s−1 and 25 % faster than the minimum above (Sánchez et al., 2022; Sánchez et al., 2020).
Although in other DWL or SODAR-based studies, the same thresholds have been used, the high temporal and spatial resolution of surface-based remote sensing observations allows the incorporation of complementary steps. This enables not only an optimized detection of individual LLJ profiles but also the identification of LLJ events evolving over time (Baas et al., 2009; Tuononen et al., 2015, 2017). In this study, automatic LLJ detection is an adaptation from the method described by Tuononen et al. (2017) and uses 30 min averaged profiles of horizontal wind speed to best combine the 15 min data products available at QUALAIR-SU and the 10 min data products available at SIRTA. This temporal resolution was previously used in SODAR studies presenting coherent LLJ detection (Karipot et al., 2009; Baas et al., 2009; Duarte et al., 2015).
Therefore, based on the literature and exploratory tests on the data set, some important conceptual aspects were adapted compared to the original method from Tuononen et al. (2017).
-
Daytime LLJ events are negligible in the Paris region. During the day, very few LLJ events are recorded at the urban site. Therefore, this study focuses on the nocturnal periods at times between 18:00 and 09:00 UTC (20:00 and 11:00 local time).
-
The maximum height explored in every 30 min wind profile is 1000 m a.g.l.
-
In the study area, 99 % of nocturnal periods present only one LLJ event within the ABL. Therefore, this study considers the presence of only one single LLJ event per night, unlike Tuononen et al. (2017), who accounted for the possible development of up to three simultaneous LLJ events within the ABL column in the same night.
Additionally, technical aspects of the algorithm were also adapted. In the following, a brief description of the implemented adaptations in this study is given, and further details can be found in Tuononen et al. (2017).
-
LLJ detection from a single wind profile. We consider every horizontal wind speed profile between the first available gate (238 m a.g.l. at QUALAIR-SU and 105 m a.g.l. at SIRTA) and 1000 m a.g.l. A LLJ is identified in a profile if the local maximum of the horizontal wind speed is at least 1.5 m s−1 stronger than the first local minimum above or below. Note that the minimum below the core height may not be captured correctly by the observations because no information is available < 238 m a.g.l. in the instrument's blind zone. A relative detection criterion was tested, but it produced a high number of false negatives (43 %).
-
LLJ event detection. A LLJ event is considered to be a coherent detection if it lasts at least 2 h (i.e., four 30 min averaged profiles). However, an event is valid if at least three profiles are detected over the course of this period with the following criteria for consecutive detections:
- –
difference in core height < 150 m,
- –
difference in core wind speed < 20 %,
- –
difference in core wind direction < 45°,
- –
difference in core time < 1.5 h.
- –
The output parameters of the algorithm are listed as follows. (i) LLJ occurrence is a Boolean value (True [1] or False [0]) given to each profile. (ii) LLJ core height is the height of the maximum in the wind speed profile; in this case, the algorithm can provide it in both meters above ground level (m a.g.l.) and above sea level (a.s.l.). (iii) LLJ core speed is the value of the wind speed at the core height. (iv) LLJ core direction is the wind direction at the height of the wind speed maximum. Additionally, the algorithm identifies the corresponding parameters for the minimum both above and below the jet core in the case that they are recorded by the profile observations.
2.4 Surface data and UHI determination
The UHI intensity (ΔUHI = Turban−Trural) is defined as the difference in air temperature between an urban (Turban) and a rural (Trural) site. Usually, standard meteorological observations at 2 m a.g.l. height are compared. In the current work, the QUALAIR-SU site (red dot in Fig. 1) is chosen as the urban site, and a Météo-France station at Melun (48.613° N; 2.679° E; 91 m a.s.l.) is chosen as the rural site (yellow dot in Fig. 1).
Data collected at the QUALAIR-SU supersite were used to represent the central urban air temperature (Turban) given that continuous and long-term observations are available. During the intensive observation period (IOP) in the framework of the PANAME 2022 campaign, surface-based meteorological stations were installed by Météo-France to capture the air temperature within the built environment at street level, e.g., at Place de la Madeleine (48.87084° N and 2.32432° N; 79 m a.s.l.) and Boulevard des Capucines (48.87066° N and 2.33175° N; 81 m a.s.l.) on 10 July 2022, i.e., later than the start of the analysis period of the current study (15 June 2022). Hence, data from the QUALAIR-SU meteorological station located at roof level (20 m a.g.l.) are considered here to represent the intensity of the UHI for the Paris region well. ΔUHI is stronger when using the street-level urban measurement sites by about 1 °C when ΔUHI > 6 °C (see Fig. A1). Additionally, wind data collected from a 25 m meteorological tower installed at Montsouris Park are used in this study to assess the relationship between ΔUHI and the near-surface wind speed.
The temperature at Melun is measured using a Sterela Opale UME at 2 m a.g.l. and that at QUALAIR-SU using a Vaisala WXT520 automatic weather station at 22 m a.g.l. The mean building height around the QUALAIR-SU site is about 25 m. 30 min averages are calculated for both sites to match the DWL analysis intervals. The average nocturnal UHI intensity is calculated as the mean of the temperature differences recorded during the nocturnal period (sunset to sunrise). Additionally, based on cloud-base height observations from a Lufft CHM15k automatic lidar ceilometer operated at the QUALIR-SU site, nights were classified into cloudy, partly cloudy, and cloud-free periods using the classification approach presented by Kotthaus and Grimmond (2018).
3.1 LLJ detection performance
For the performance evaluation of the algorithm the time difference between two consecutive time steps for which a LLJ is detected gives an indication of the persistence of the jet event. The threshold sensitivity and performance analysis by Tuononen et al. (2017) revealed that the time difference threshold has a strong influence on the performance of the algorithm. This may bias the algorithm towards the detection of false positives or very short events, which are not the subject of study in this work. The detection of false positives is further dependent on the quality of the measurements, which in turn depends on factors such as power and sensitivity of the laser system, vertical distribution of the aerosol load (tracers; see Sect. 2.2), and the presence of clouds.
An example of a coherent LLJ detection is presented in Fig. 2a. The jet core becomes visible in the late evening of 9 August at 19:00 UTC at 550 m a.g.l., with a wind speed of approximately 8 m s−1. After sunset, the core height stabilizes at 500 m a.g.l. and reaches a maximum wind speed between 21:00 and 23:00 UTC. After midnight, the core height increases beyond 550 m a.g.l., followed by a gradual decrease in the core wind speed. The jet persists throughout the night and into the early morning before it dissipates at 08:00 UTC on 10 August. Figure 2b presents a LLJ detection under weaker flow conditions and lower boundary layer height than the previous example. This LLJ event clearly failed the criterion of four consecutive detections explained in Sect. 2.2, and it is not considered in this study.
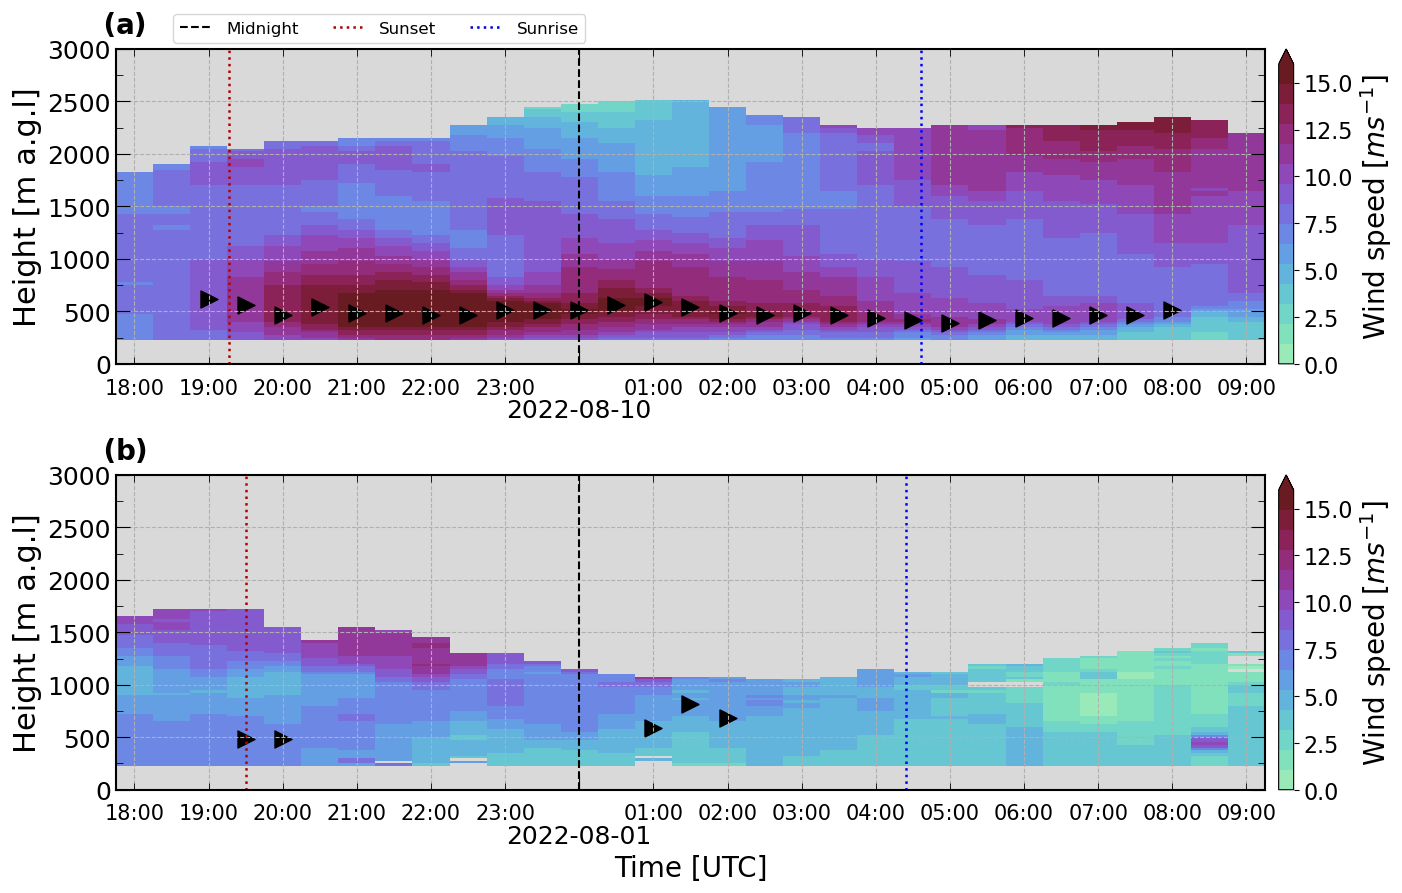
Figure 2Time–height evolution of the horizontal wind speed. The temporal series are composites of 30 min average profiles retrieved from measurements performed by the WindCube Scan 400S at QUALAIR-SU (urban site) between 18:00 and 09:00 UTC (a) between 9 and 10 August 2022 and (b) between 31 July and 1 August 2022. In both cases, the black triangles represent the core of the low-level jet detected by the automatic procedure.
3.2 LLJ classification
By classifying LLJs according to their core wind speed magnitude, Banta et al. (2002) found that strong jets tend to occur at greater altitudes. Banta et al. (2003) studied the relationship between LLJ characteristics and turbulence within the stable nocturnal boundary layer, concluding that the core wind speed and core height can be used to diagnose turbulence effects in the region beneath the jet, considering that strong core wind speeds are usually associated with strong turbulence below (Bonin et al., 2015) and above the core (Conangla and Cuxart, 2006). In this study, both core wind speed and core height were tested as indicators for the classification of LLJs (not shown here); however, it was not possible to identify groups with consistent patterns in the LLJ characteristics. Hence, we found that the vertical velocity variance () is a more meaningful indicator as it effectively describes the link between the jet winds and surface–atmosphere exchanges. This turbulence quantity approximates the vertical component of the TKE during stable conditions (Banta et al., 2006). Here it is assumed that the observations at the first range gate (238 m a.g.l.) of the DWL at the urban site are representative of the vertical mixing conditions in the nocturnal urban boundary layer. Each LLJ event is classified according to the mean nocturnal average (between sunset and sunrise). Three classes are defined based on thresholds defined by the median and the 75th percentile of the distribution of (Fig. 3), indicating low (< 0.11 m−2 s−2), intermediate (0.11 m−2 s−2 ≤ < 0.23 m−2 s−2), and high (≥ 0.23 m−2 s−2) vertical velocity variance.

Figure 3Histogram of the vertical velocity variance () retrieved from vertical stare measurements at the first range gate at the urban site (238 m a.g.l.). The colors correspond to the classes and are low vertical mixing < 0.11 m−2 s−2 (red), moderate vertical mixing 0.11 m−2 s−2 ≤ < 0.23 m−2 s−2 (orange), and strong vertical mixing ≥ 0.23 m−2 s−2 (blue). N is the total number of 30 min profiles and Q3 represents quartile 3 (upper quartile).
3.3 LLJ characteristics
Based on the 77 d period spanning from 15 June 2022 to 31 August 2022, 55 nights (70 %) exhibit a LLJ event at the urban QUALAIR-SU site. 96 % (53 out of 55 nights) of these LLJ events were also detected over the suburban site at SIRTA, showing that the nocturnal LLJ is a regional phenomenon in the Paris region. A total of 9 out of 55 LLJ events were detected during cloudy conditions, but the complex interactions with cloud dynamics are beyond the scope of this work. Therefore, this study focuses on 46 nights (60 % of the total of 77 nights in the study period) with a LLJ event detected at QUALAIR-SU under cloud-free conditions, in which 830 individual 30 min profiles (i.e., 415 h) were associated with a jet. According to these results, it is possible to say that the LLJ activity during summer Paris 2022 is high, especially when compared to previous studies conducted in Paris during the autumn period or to other European studies of summertime LLJ activity. In the local context, Cheliotis et al. (2021) reported a 32 % occurrence of LLJs during the fall of 2014 in Paris by using data collected by a DWL installed at the QUALAIR-SU site. A climatological study at Cabauw, the Netherlands, found that LLJs occurred 32 % of the time during summer, based on 7 years of SODAR profile data (Baas et al., 2009). At Utö, Finland, another climatological study reported an average occurrence of LLJs of 28 % for the month of July, based on 2 years of DWL observations (Tuononen et al., 2017). Outside Europe, a long-term study in Florida, USA, reported a 47 % occurrence rate of LLJs during summer, based on 4 years of SODAR data (Karipot et al., 2009), and another work by Duarte et al. (2015) also reported a 47 % occurrence rate in a summer study in South Carolina, USA.
During the study period, the LLJ core height (ZLLJ) ranges between 238 and 950 m a.g.l. (Fig. 4a), i.e., throughout the entire height range considered for detection (Sect. 2.3). Note that for 7 % of the 30 min profiles, when the core height is detected at 238 m a.g.l., the actual LLJ core may at times be located in the instrument blind zone, i.e., below that level. Most jets (64 %) have a core height between 300 and 500 m a.g.l., with 350–400 m a.g.l. being the most common interval (22 %). The median value of the LLJ core height is 388 m a.g.l. These results are similar to previous case study analyses that found the core height of LLJs in the Paris region at 400 m a.g.l. (Klein et al., 2019) and compare well with observations conducted over Greater London that reported core heights between 300 and 400 m a.g.l. (Tsiringakis et al., 2022). The analysis carried out at Boulogne-sur-Mer, France (about 200 km north of Paris), reports LLJ core heights < 200 m (Roy et al., 2021). At this coastal site, it is likely that land–sea breezes play a role in the formation of the jet, which might explain the occurrence of low-altitude core heights. At other European sites with a coastal influence (Cabauw and Utö), lower ZLLJ values (140 m a.g.l.) were observed during the summer (Baas et al., 2009; Tuononen et al., 2017).
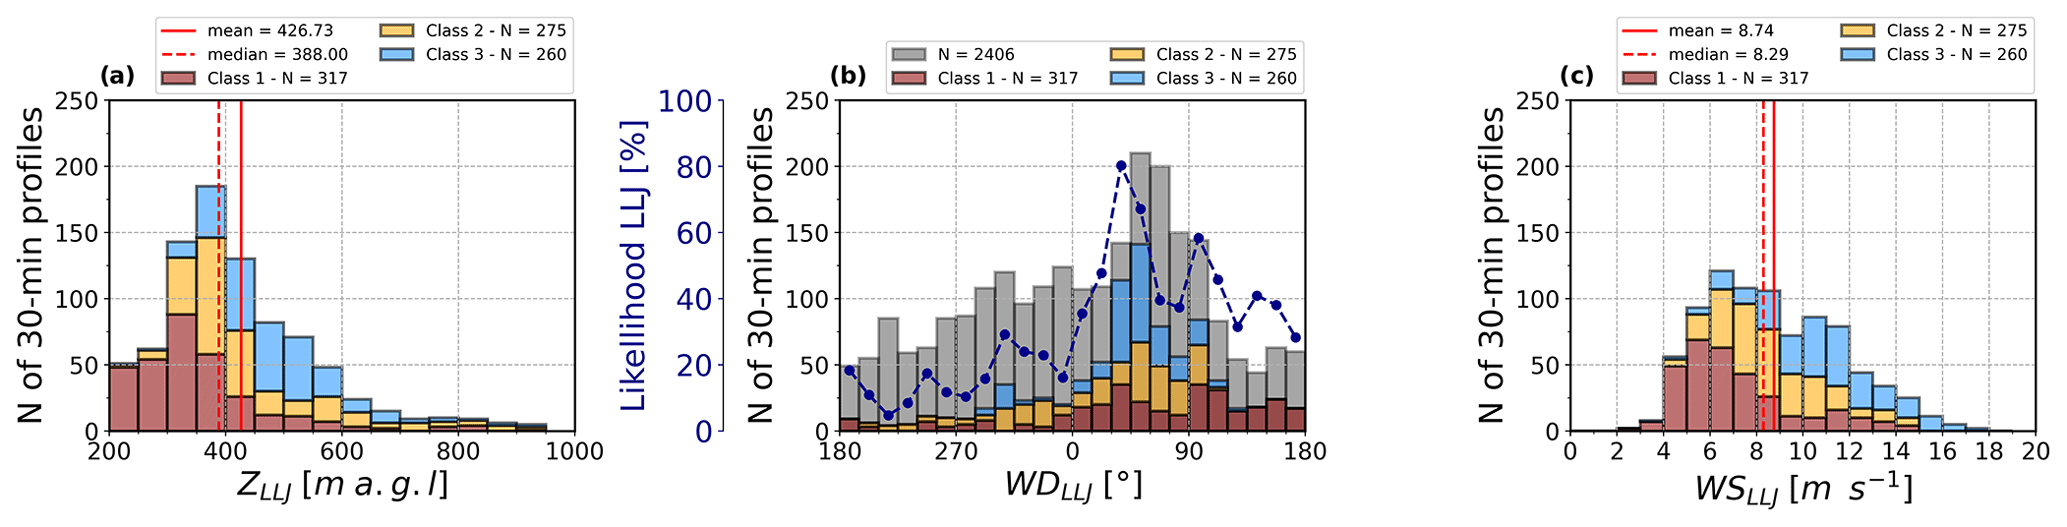
Figure 4Histogram of (a) the LLJ core height (ZLLJ), (b) the LLJ core wind direction (WDLLJ), and (c) the LLJ core wind speed (WSLLJ). The colors of the bars represent the vertical mixing () classes as defined in Fig. 3. In (b) the gray bars denote the wind direction distribution at 400 m a.g.l. for all nocturnal periods between 15 June and 31 August 2022, and the dashed dark blue line represents the likelihood of a LLJ being detected from a given wind direction.
The histogram of the LLJ core wind direction (WDLLJ) (Fig. 4b) shows that LLJs are mostly observed under easterly–northeasterly flow during the study period in summer 2022. 66 % of LLJs have a core wind direction between 0 and 105°, with 30–60° being the most common interval. LLJ profiles with northwesterly flow (300° < WDLLJ ≤ 360°) present an occurrence of 12 %, while southeasterly flow (105° < WDLLJ ≤ 180°) contributes ≈ 14 % of the observed jets. The remaining 8 % of the profiles are distributed in the interval 180 to 300°. To assess how the LLJ over Paris relates to the general regional flow, the overall nocturnal wind direction distribution at 400 m a.g.l. (i.e., the level of the median ZLLJ) is compared to the wind direction occurrence of LLJ events. The wind direction distribution of the LLJ follows a similar pattern as observed for the wind during the entire study period, where the northeasterly–easterly flow is predominant (44 % of 2375 profiles). The likelihood of observing a LLJ is also higher in this sector with a 60 % probability between 0 and 105°, and the highest occurrence (80 %) is in the 30–45° interval. Note that only 2 out of 46 jets (4 %) present a southwest (190–300°) wind direction, a sector that usually has a much larger frequency during summer nights with respect to the long-term climatology (2006–2022; Sect. 2.1).
Figure 4c shows that the LLJ core wind speed (WSLLJ) varies between 2 and 19 m s−1. For the majority of the jets (85 %), the core wind speed ranges between 4 and 12 m s−1, with a median value of 8.3 m s−1. This is again similar to the modeling results of the 2 d case study in Paris reported by Klein et al. (2019) and comparable to a climatological study conducted in Jülich, Germany, a suburban area located 370 km from Paris in the northeasterly direction where the median summer value of WSLLJ is 8.3 m s−1 (Marke et al., 2018). Similarities are also found with Cabauw, the Netherlands (Baas et al., 2009), which is located in a suburban area 200 km from Paris in the northeasterly direction where the median value of WSLLJ for summer is ≈ 9 m s−1. Given that both Cabauw and Jülich are located roughly upwind of Paris under northeasterly flow, all these sites could be affected by the same LLJ event if the phenomenon has a large enough spatial extent as shown, e.g., by Klein et al. (2019), which could explain these similarities in LLJ wind speed. However, the question of spatial extent goes beyond the scope of the current study. The median WSLLJ found in this study is lower than the wind speeds reported for the summer in Utö, Finland of 11.6 m s−1 (Tuononen et al., 2017) and results from a study in Florida, USA, of ≈ 10 m s−1 (Karipot et al., 2009).
3.4 LLJ signature in the vertical wind profile
As introduced in Sect. 3.2, a -based classification system is used to identify LLJ events with common characteristics and then study their potential impacts on the near-surface atmosphere. Figure 4 shows that low is mostly related to jets with a low core height between 238–350 m a.g.l., which in turn present a predominantly east–southeast wind direction (90–180°) and low to intermediate core wind speed < 7 m s−1. It should be noted, however, that LLJ events with core wind speed > 10 m s−1 are also found in the low class. These outliers are discussed in Sect. 3.5. Jets with intermediate occur mostly in two wind direction sectors: 300–345 and 45–105°. Their core height presents intermediate altitudes between 300 and 450 m a.g.l. and wind speeds between 5–12 m s−1. In the strong class, the core height tends to be > 450 m a.g.l., with a predominant northeasterly wind direction (30–60°) and wind speeds > 8.3 m s−1.
Figure 5a presents the mean LLJ horizontal wind speed profile for each class. Consistent with the histograms (see Fig. 4), the low class presents rather low values of wind speed throughout the profile. The core height of this profile is observed at 350 m a.g.l. and the wind speed at this altitude is 5 m s−1. The minimum wind speed above the core is 3.8 m s−1 and occurs at 1000 m a.g.l.; above this height the wind speed gradually increases. Similarly, the mean wind profile for the intermediate class presents a core height at a slightly greater altitude of 400 m a.g.l. but with a slightly higher wind speed of about 6.2 m s−1. The minimum above the core is close to that of the low-variance class. The mean profile associated with the strong class exhibits a distinctly different shape and stronger wind speeds. The core height is located at 475 m a.g.l., i.e., 75 m higher than the moderate profile. The core wind speed is about 9.2 m s−1, which is 50 % and 30 % stronger than the core wind speed for the low and intermediate class, respectively. The minimum above the core is about 3.8 m s−1 and located at 1750 m a.g.l., i.e., at greater altitudes than for the other two classes.
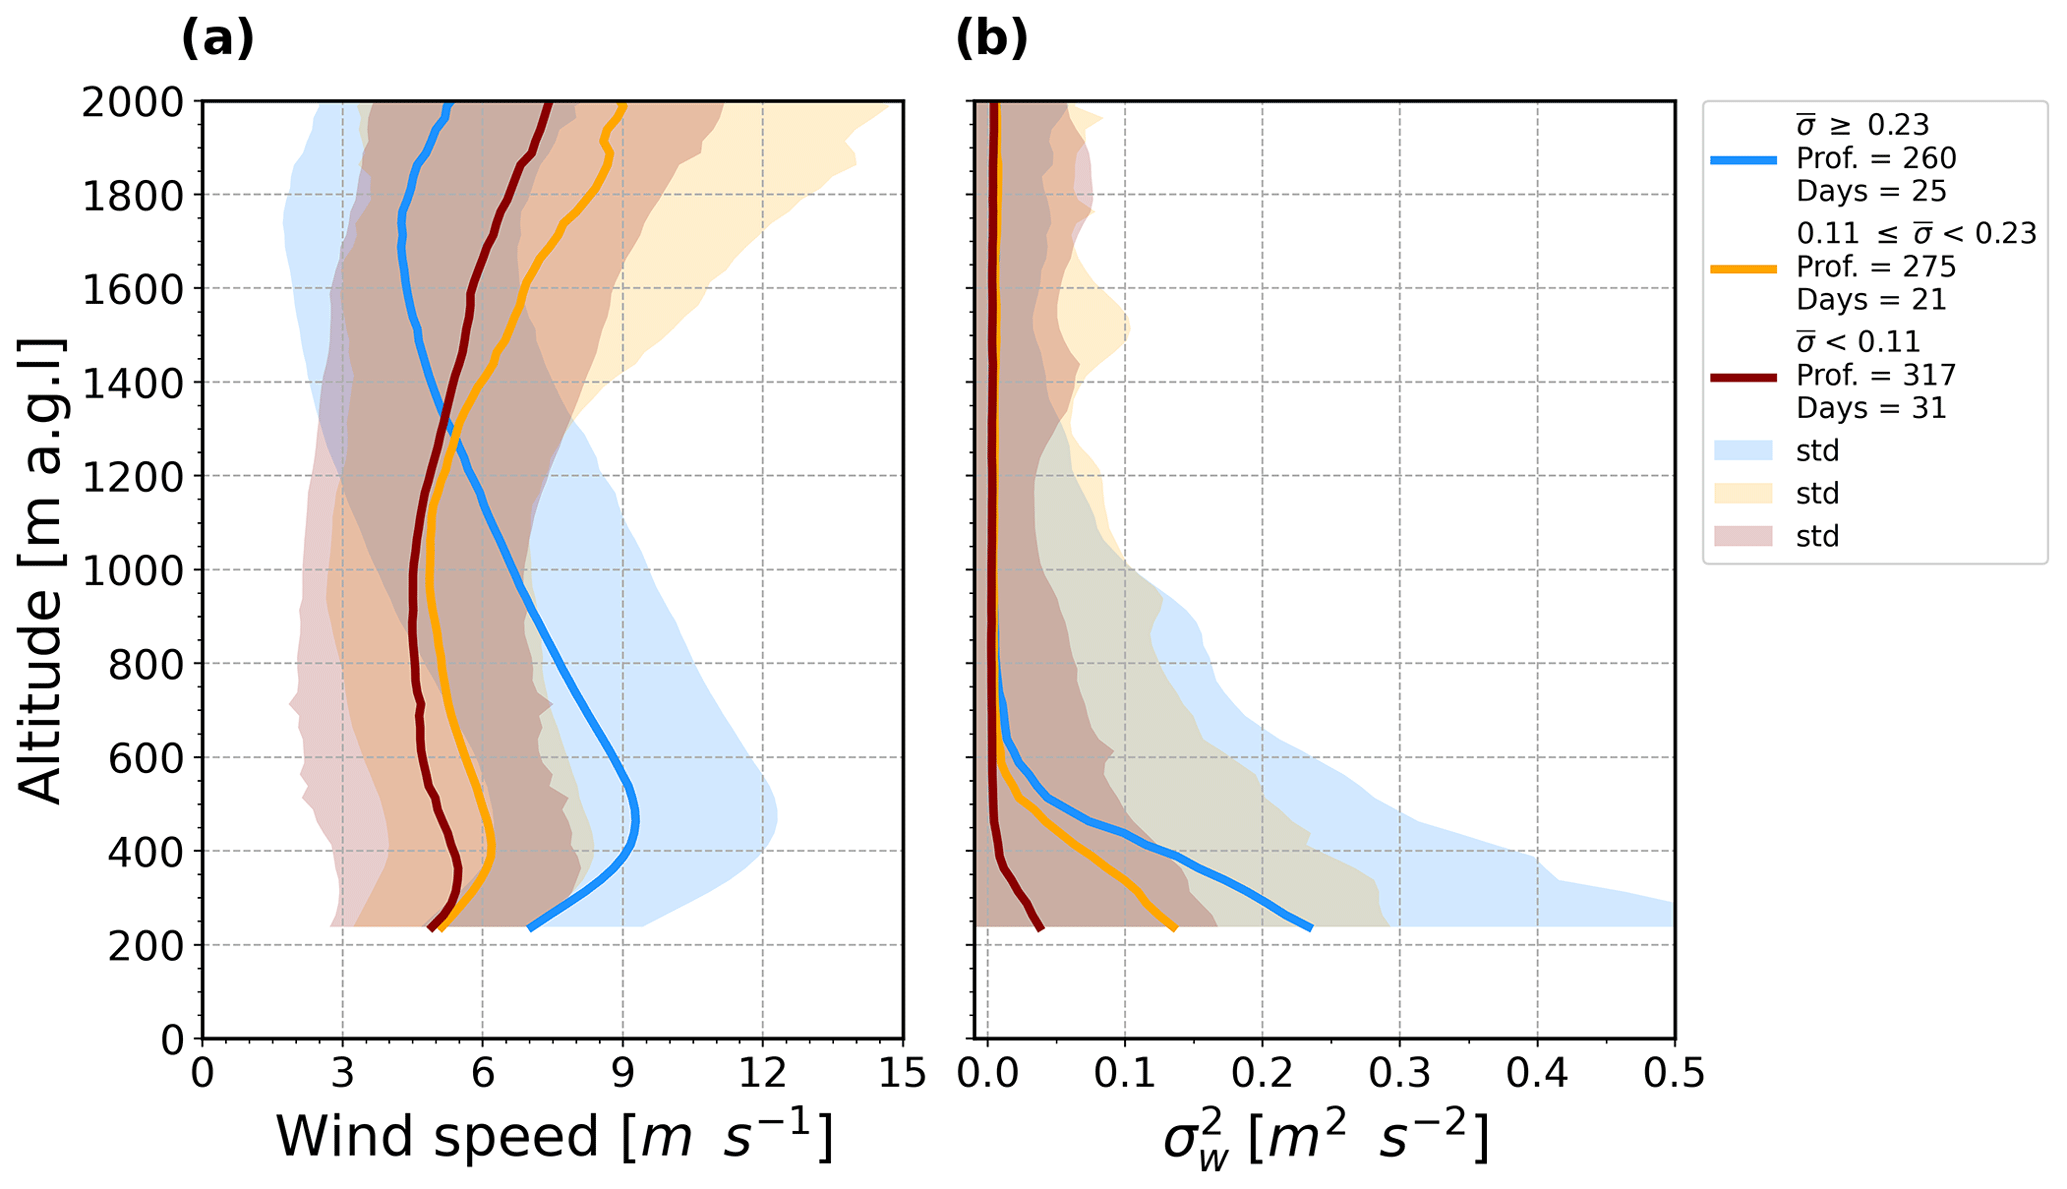
Figure 5Mean profiles of (a) horizontal wind speed and (b) median profiles of vertical velocity variance . The shading denotes 1 ± SD. Each panel presents the respective profiles for each class: red is low , orange is moderate, and blue is strong .
The respective median profiles of for each class are presented in Fig. 5b, which illustrate that LLJ core height not only influences the horizontal wind speed but also the vertical mixing. For all three median profiles, the strongest vertical mixing is retrieved from data recorded at the first range gate of the lidar (238 m a.g.l.), i.e., closer to ground level. Above this height, the median values gradually decrease, reaching values close to zero, above the respective jet core shown in Fig. 5a. As the minimum recorded altitude of the vertical stare depends on the blind zone of the DWL, no information on the vertical velocity variance below 238 m a.g.l. is available. In general, the shape of the three median profiles agrees with those reported in previous studies (Banta et al., 2006; Bonin et al., 2015). In cities, unstable or neutral stratification and higher are maintained by the added urban heat (Theeuwes et al., 2019).
To conclude, the classification system used here in this study allows us to identify the following trends: (i) in the low class the LLJ profiles are detected in a wind direction sector between 0 and 180°. This class represents all the profiles detected in the southeast sector between 105 and 180° and all the low-altitude cases in the interval between 250 and 300 m a.g.l., and it is the dominant class for profiles with a core wind speed < 6 m s−1. (ii) The intermediate class is detected in a wide wind direction sector between 300–115° and dominates the northwest sector between 300–360°. The values of core height range between 300–450 m a.g.l., while the core wind speed varies between 5–12 m s−1. (iii) Finally, profiles in the strong class occur in the wind direction sector between 0–115° but are usually found in the northeast sector between 30 and 60°. LLJs in this category can present core height at high altitudes > 400 m a.g.l. with a strong core wind speed > 8.3 m s−1.
3.5 LLJ nocturnal evolution
According to Stull (1988), a LLJ typically forms during the night and reaches its maximum wind speed before dawn hours, between midnight and 04:00 local time. Figure 6a presents an example of a well-defined nocturnal LLJ event observed in Paris during the night between 16–17 July 2022, showing the characteristics of the LLJ core and the minimum above. The WSLLJ is about 7.5 m s−1 before sunset, and then it increases and reaches its maximum (12.5 m s−1) at 2.5 h after sunset (22:30 UTC and 00:30 LT); it then starts to decrease again from about 1 h before sunrise. The ZLLJ is about 750 m a.g.l. at sunset when the convective boundary layer is still collapsing. When WSLLJ starts to increase after sunset (21:00 UTC), ZLLJ decreases to around 400 m a.g.l. and remains around this altitude throughout the night. At sunset, the jet core follows a northeasterly flow that veers toward the east over the course of the night by 90°. The lack of sudden changes indicates that there are no changes in air mass.
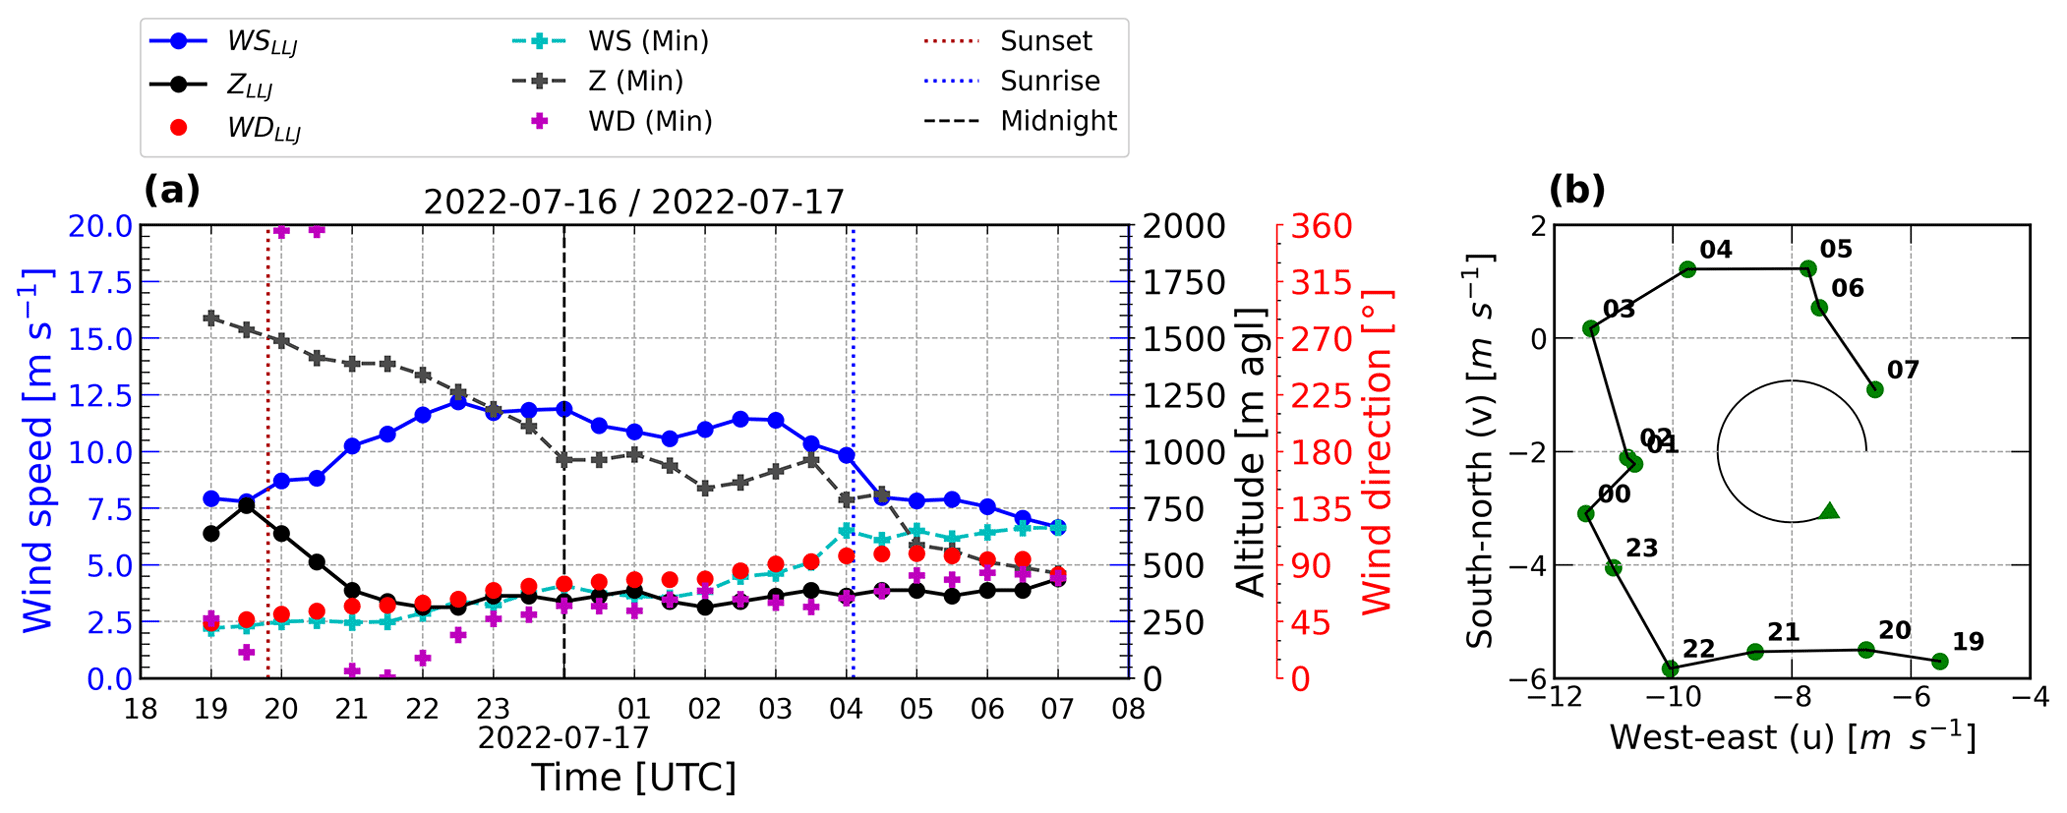
Figure 6Nocturnal evolution of an individual LLJ event (16–17 July 2022). Panel (a) illustrates the jet characteristics: core wind speed (WSLLJ) and the minimum above (WSMin), core height (ZLLJ) and the height of the minimum above (ZMin), and core wind direction (WDLLJ) and wind direction of the minimum above (WDMin). Panel (b) shows the wind hodograph based on the zonal and meridional components of the wind (u,v) at the height of the core of the jet. The green arrow indicates the sense in which the wind is veering during the night (clockwise). Labels indicate the hour from 19:00 on 16 July to 07:00 on 17 July (UTC).
The development of the wind speed minimum above the LLJ core (see Fig. 5a) and the evolution of its characteristics are in accordance with the momentum budget of the atmospheric column in the ABL during a LLJ event (Blackadar, 1957). The wind speed is weak (≈ 2.5 m s−1) at sunset and then experiences a slight increase over the course of the night. The height of this minimum is located about 900 m above the LLJ core at sunset and then gradually decreases until it merges with the jet core at the time of the jet dissipation. The wind direction of the jet core and the minimum above differ by about 50° at sunset and then slowly converge over the course of the night before converging again at about 1 h past sunrise. Overall, the wind speed, wind direction and height in the jet core, and the minimum above show distinct contrasts during the time of jet formation and then reach a common point at 07:00 UTC when the jet is completely dissipated and the momentum is distributed evenly over the entire column in the ABL.
This LLJ evolution (Fig. 6) suggests that inertial oscillation (IO) is the formation mechanism of this event (Blackadar, 1957; van de Wiel et al., 2010). At total of 28 out of 46 (61 %) of the cloud-free detections reported in this study have a similar nocturnal evolution, which suggests that IO is highly relevant for jet dynamics in the Paris region. IO is characterized by an oscillation of the wind above the elevated nocturnal temperature inversion with a period of , where f is the Coriolis parameter (f=2Ωsin θ, with Ω and θ being the angular speed of the Earth's rotation and latitude, respectively). At the QUALAIR-SU latitude (θ≈48.84), this gives T≈ 16 h, which is approximately the duration of the most persistent LLJ events observed here, e.g., 7–10 August (see Fig. 8). The amplitude of this wind speed oscillation is related to the magnitude of the ageostrophic velocity component and can cause the core wind speed to reach supergeostrophic magnitude. In addition to a gradual increase and decrease (wind speed oscillation hereafter) in the core wind speed, IO is associated with a clockwise change in wind direction, which is clearly evident from the time series (Fig. 6a) and also illustrated by the hodograph of the meridional and zonal wind components (u,v) (Fig. 6b).
Fig. 7 presents the nocturnal evolution of the core wind speed for the 46 jets observed under cloud-free conditions during the study period, classified into three groups of intensity (Sect. 3.2). In the low class, 15 out of 19 (79 %) cases do not show the wind speed oscillation, as opposed to 4 visible outliers (16 and 19 July; 11 and 13 August). These outliers do not show common behavior in terms of duration, acceleration, or peak wind speed. These cases are associated with a strong stable atmospheric stratification caused by the advection of hot air masses (Kotthaus et al., 2023), but these details are beyond the scope of this study and will be investigated elsewhere. Omitting those outliers, the behavior of the median wind speed curve for the low class is rather flat with a mean value of 6.23 m s−1. For the events with moderate values (Fig. 7b), the median wind speed curve is stronger, with a mean value of 8.07 m s−1. It increases slightly, starting from 2 h after sunset, and reaches its maximum at about 4–5 h later, before starting to slowly decay until dissipation. Finally, for the strong class (Fig. 7c) most of the events exhibit a clear oscillation in wind speed. The acceleration starts with the jet formation and lasts until 3 h after sunset. A peak in the core wind speed is observed at around midnight (±2 h), followed by a slow deceleration until dawn hours with a mean value of 10.2 m s−1. The median WSLLJ is 9 m s−1 at 1 h before sunset (i.e., of the same order of magnitude as the peak of the wind speed median in the moderate class) and then a gradual increase is produced until it reaches the maximum peak at 2 h after sunset, which lasts about 2 h. The WSLLJ gradually starts to decay from about 4 h after sunset until it reaches a minimum right before sunrise, which is associated with the jet dissipation given.

Figure 7The evolution of the core wind speed throughout the night for each LLJ event classified by and characterized by (a) low, (b) intermediate, and (c) strong vertical mixing. The black line represents the median for each group, which is calculated for times with a minimum of three samples.
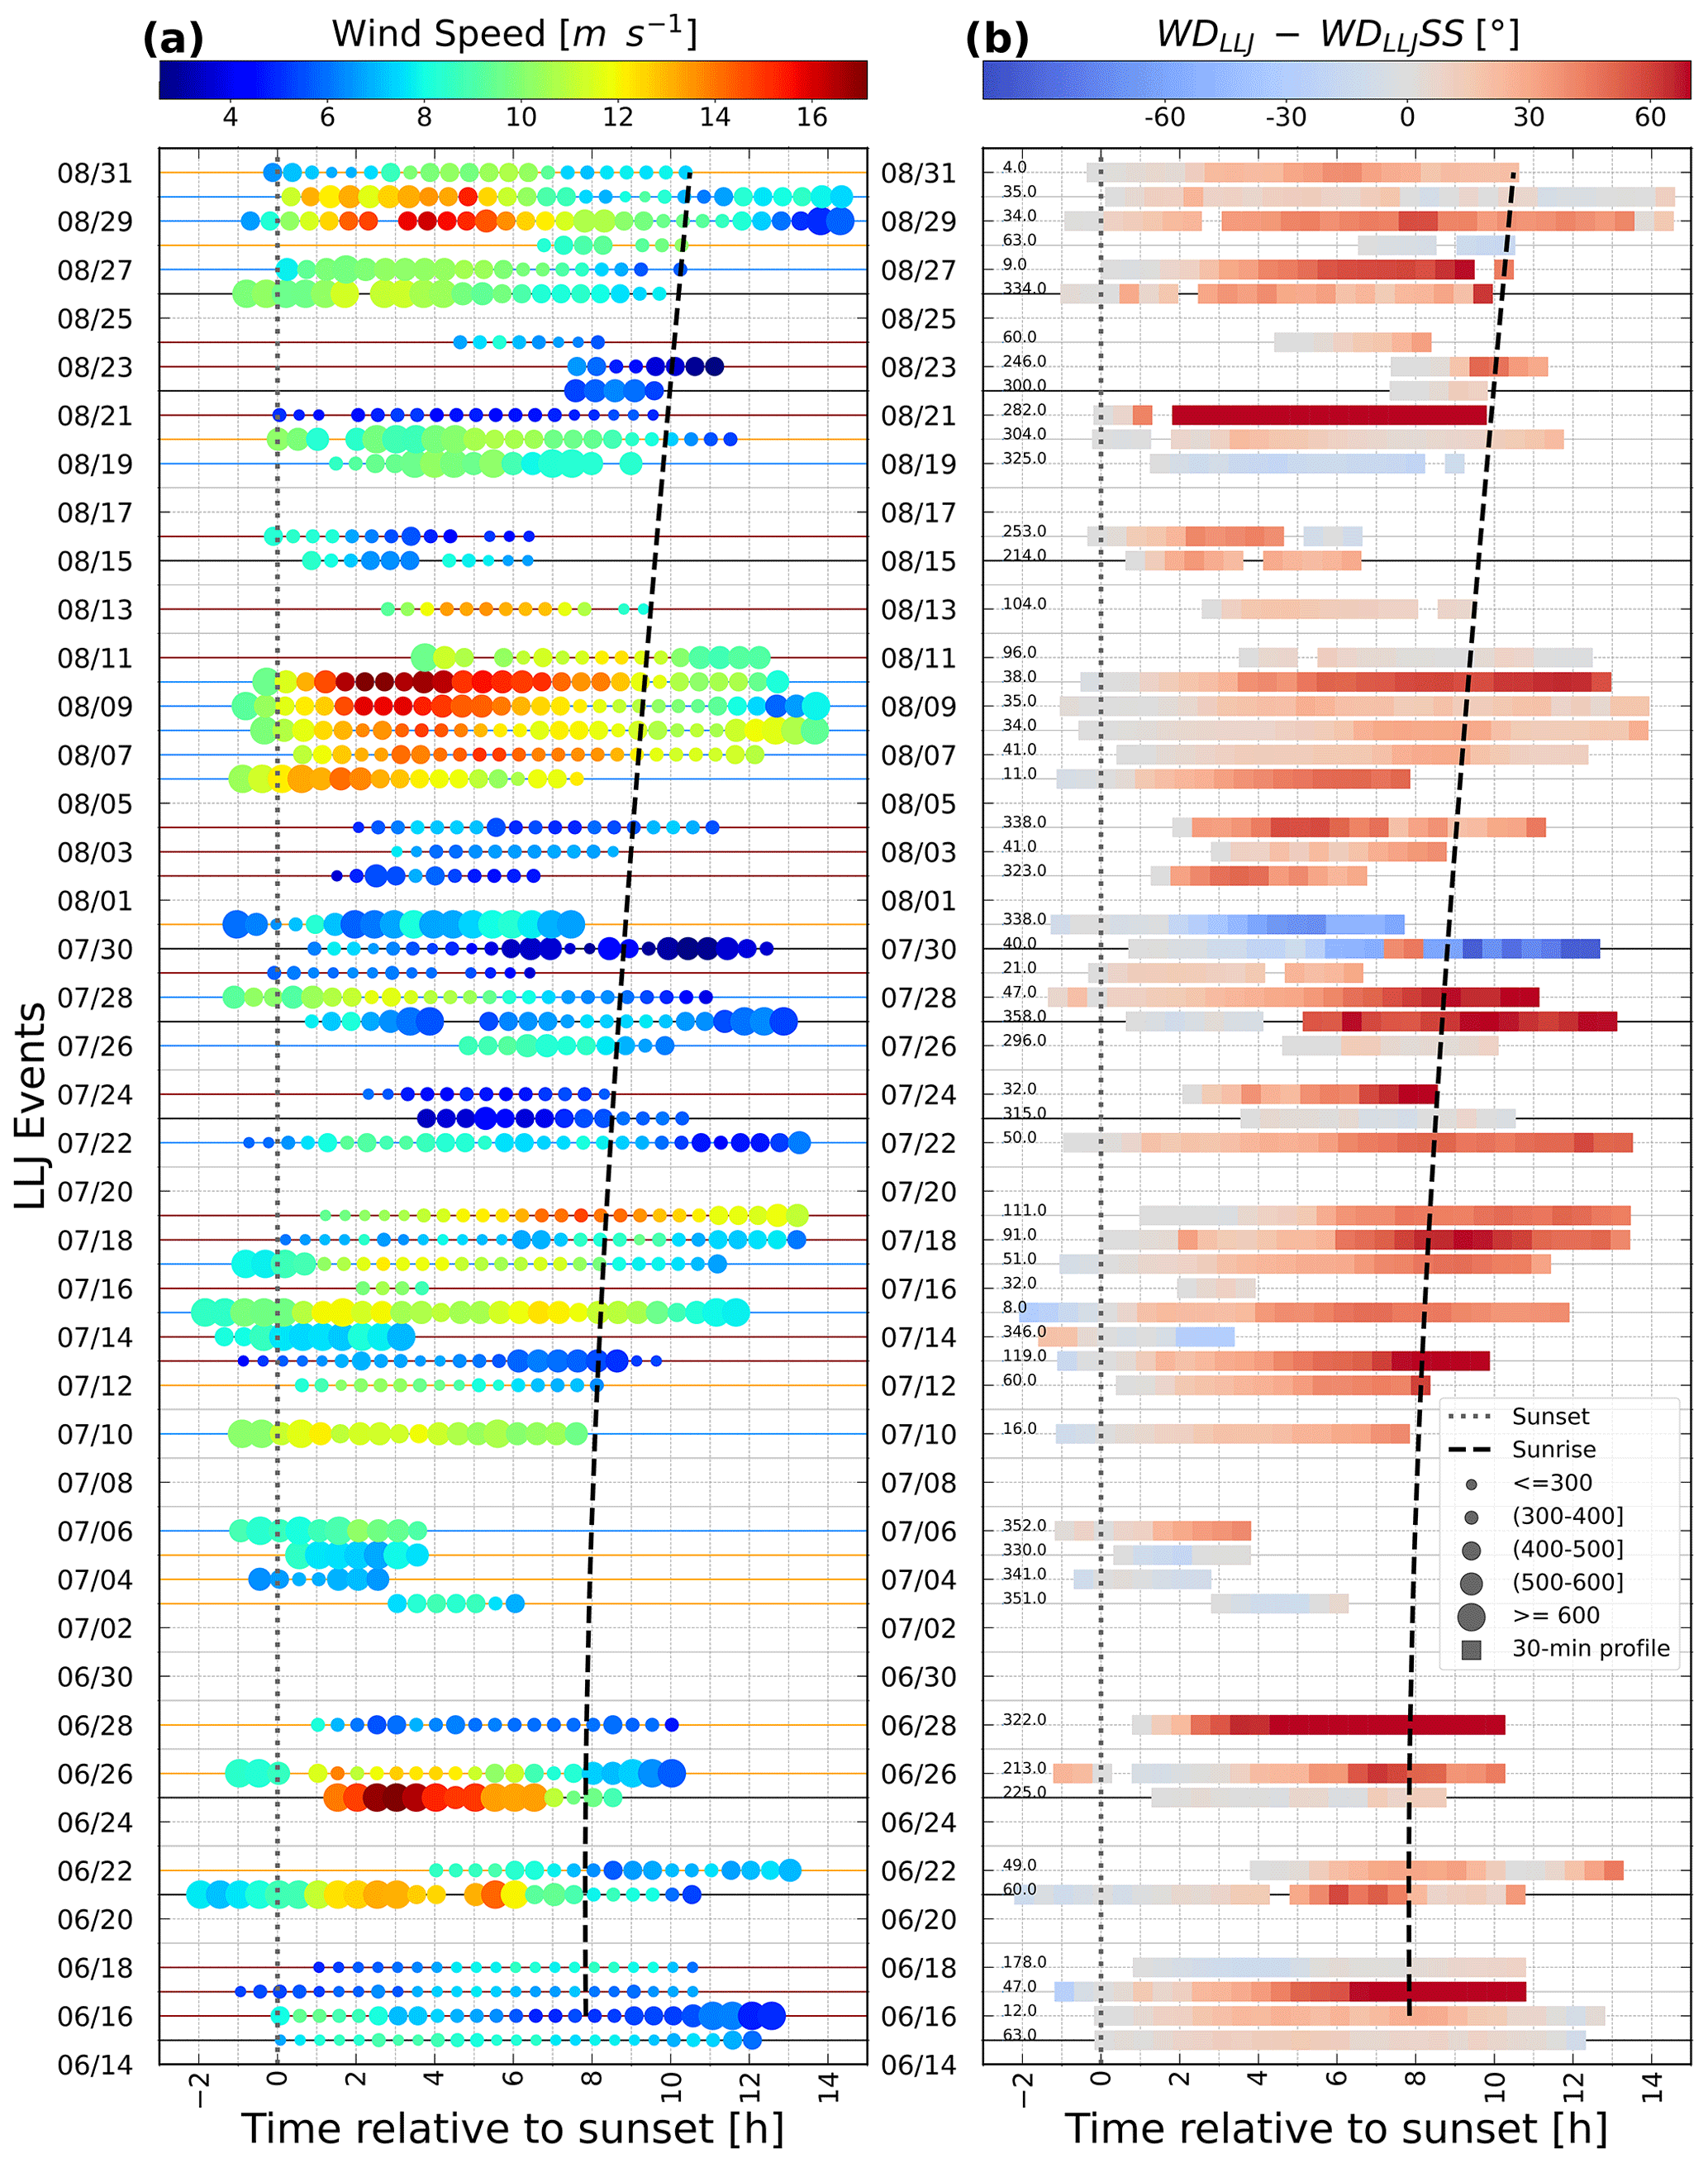
Figure 8Nocturnal evolution of the LLJ events during the study period 15 June–31 August 2022 at 30 min resolution in time relative to sunset (dotted line). In (a) dot size and color indicate the jet core altitude (ZLLJ) and wind speed (WSLLJ), respectively. Horizontal lines represent the vertical mixing category of each case: low (red), intermediate (orange), and strong vertical mixing (blue). (b) Core wind direction (WDLLJ) variability relative to the wind direction at sunset (WDLLJSS) or initial wind direction when the jet is formed in the middle of the night (indicated with the number inside the plot frame, at the left side). Horizontal black lines mark dates that are excluded from further analysis due to cloud conditions in (a) and (b). The dashed line marks the time of sunrise.
3.6 Temporal distribution of the LLJ characteristics
Figure 8 presents the time series of the nocturnal evolution for the three jet core characteristics (height, wind speed, and wind direction) for each event during the study period, including the cloudy nights. An amplitude in wind speed can clearly be identified for 25 out of 46 (i.e., 54 %) jets, mainly observed for jets with strong vertical velocity variance (as shown in Fig. 7c) and high core height. This trend is also valid for short-duration cases (< 4 h), for example 16 July. Nocturnal evolution of the core direction (Fig. 8b) shows that 28 out of 46 (i.e., 61 %) of jets present a persistent clockwise veering with an average change in wind direction of 3.7° h−1. Two cases particularly stand out with a strong veering (> 5° h−1): 28 June and 21 August. They fall into the intermediate and low class, respectively, and both emerge from a northwesterly direction (322 and 282° respective initial core direction). As discussed (Sect. 3.5), both the wind speed oscillation and the clockwise veering are signatures of the IO formation mechanism. However, not all cases with wind speed oscillation (Fig. 6a) necessarily present a strong clockwise veering (Fig. 6b). For example, jets detected between 7 and 9 August show the wind speed oscillation, but their change in core wind direction is less than 1° h−1, remaining almost constant in wind direction.
These time series show the variability in the LLJ duration as well as the timing of both formation and dissipation in detail. Results show that 29 out of 46 (i.e., 63 %) jets last almost the entire night, emerging at sunset ±2 h and dissipating at sunrise ±2 h. However, jets can emerge in the middle of the night and continue even after sunrise. 31 out of 46 (i.e., 67 %) cases last more than 8 h, including cases with a late starting time (up to 4 h after sunset). During the study period, the maximum LLJ duration is 15 h, the minimum duration is 2 h (by conceptual definition), and the mean duration is 9.5 h.
The day-to-day variability highlighted in Fig. 8a reveals the influence of synoptic conditions for the LLJ characteristics. While some cases appear to be isolated (e.g., 28 June and 10 July), during consecutive LLJ detection the characteristics of their core may vary night after night or may be similar each night. A total of 10 events are detected between 10–19 July (heat wave period) with strong day-to-day variability in terms of levels and the core characteristics. During this period, jets at high core height and strong wind speeds are associated with strong , while slow and low-altitude jets present weak . A different situation is observed for the seven jets detected between 6–13 August. Persistent synoptic conditions prevail for the first five detections between 6–10 August, with similar nocturnal evolution of core characteristics and vertical mixing. However, the last two detections on 11 and 13 August (outliers in Fig. 7) clearly differ from this period as they have short duration, low core height, weaker wind speed, and low vertical mixing.
The persistence of synoptic conditions results in a certain clustering of the LLJ events. For example between 15 and 18 June, four consecutive events have similar durations (10–12 h), with similar speeds (6–9 m s−1), and similar core heights at altitudes < 400 m a.g.l. In the period between 6 and 10 August, the detected events present similar core characteristics with strong wind speed oscillation at high altitudes, occurring in the northeast flow with a wind direction veering becoming more pronounced from one night to the next. These cases present very similar nocturnal evolution and duration, and all of them fall into the same class (strong vertical mixing). In the period between 3 and 6 July again, after 4 consecutive days with no detection, four short events (< 5 h) are found at medium to high altitudes between 400 and 600 m a.g.l., with wind speeds between 10 and 12 m s−1.
As discussed in Sect. 3.3, LLJs in a narrow easterly sector (80–115°) are all associated with low vertical velocity variance. Figure 8 reveals that these specific LLJ events (18 and 19 July; 11 and 13 August) in fact show the high wind speed outliers detected in Sect. 3.5 with a distinct wind speed amplitude (Fig. 7a) and clockwise veering (Fig. 8b). It is further evident that these easterly jets are found at relatively low altitudes (< 350 m a.g.l.), suggesting that channeling along the low topography of the river Marne basin towards the east of Paris could play a role in the acceleration mechanisms. These processes will be investigated in future studies.
3.7 LLJ impacts on UHI
Cloudiness and wind are environmental variables that exert an essential control on the intensity of the UHI and its nocturnal evolution. The UHI of the canopy layer is generally strongest during cloud-free nights and low wind speed conditions, following days with the same characteristics (Oke et al., 2017). Figure 9a presents the relationship between the nocturnal mean surface wind speed at the urban park Montsouris and the nocturnal mean ΔUHI intensity in the Paris region, including only cloud-free nights after fair-weather days to focus the analysis on wind effects only. Wind data at Montsouris Park are collected at a tower 25 m a.g.l., a measurement setting not often available in urban areas. The UHI intensity decreases exponentially with increasing wind speed. Based on observations from different cities in Canada, Oke (1973) proposed an empirical formulation where the mean ΔUHI is inversely proportional to the square root of the average regional nocturnal surface wind speed (, with κ being a dimensionless parameter often equal to 0.5). The urban wind direction at Montsouris suggests that weak values of ΔUHI are mostly found under northeasterly flow. This wind direction sector is characterized by LLJs with strong wind speeds and high values. A best fit to the Paris data following this relation is included in Fig. 9a and describes a function that follows the drop in ΔUHI due to the increase in wind speed, with an asymptotic shape defined by the threshold ΔUHI ∼ 1 °C, which appears to be the baseline ΔUHI intensity for summertime cloud-free conditions.

Figure 9Relations between the nocturnal average of UHI (ΔUHI) intensity for all cloud-free nights in the study period and (a) 25 m a.g.l. wind speed at Montsouris Park, an urban reference site. The dots are colored by wind direction at Montsouris (25 m a.g.l.). The dashed black curve is the best fit to the data: ; it follows the empirical relationship described by Oke (1973). (b) The vertical velocity variance () at 238 m a.g.l. The dots are colored by the LLJ core height above the ground. The curves represent the best nonlinear fit () found using data collected at the rural Melun site (Trural) and at the urban QUALAIR-S site (T rooftop) (, b=0.84) as well as at Boulevard de Capucines (T street level) (, b=0.77), respectively (see Sect. 2.4). The background shading indicates the LLJ classes described in Sect. 3.2. In all panels, dots and triangles represent nights with and without LLJ events, respectively.
The near-surface urban wind speed, sampled at a height (25 m a.g.l.) slightly above the mean building height of 20 m, provides insights on advection processes. However, to assess the role of vertical mixing in spatial contrasts in air temperature, the response of ΔUHI to the vertical velocity variance at 238 m a.g.l. is shown in Fig. 9b. This relation is even more clearly pronounced as can be seen from the smaller error statistics listed in Table 2. Given that wind observations above the urban canopy layer (as here at Montsouris Park) are rarely available, the wind speed observations at the rural site Melun were also tested to have a full view of the ΔUHI response to the regional winds. As the rural near-surface wind speeds are associated with a higher uncertainty when predicting the ΔUHI, it is concluded that turbulence observations inside the urban boundary layer show a closer link to the processes that drive the UHI development. The curves in Fig. 9b represent the best nonlinear model fitted to the data collected during the nights with a LLJ event, using the Tair data collected at QUALAIR-SU. We also add the fit resulting from the data collected by the IOP station at Boulevard des Capucines (see Sect. 2.4). The similarity between the two curves shows that the relationship between ΔUHI and is preserved even when using QUALAIR-SU data collected at roof level.
Table 2Error metrics for the prediction of ΔUHI. In order of appearance from left to right: following the surface wind speed relationship proposed by Oke (1973), the best-fit model to the surface wind speed at the urban site, (Montsouris), the best-fit model to the surface wind speed at the rural site (Melun), and the vertical velocity variance () in the urban boundary layer above the roughness sublayer. The metrics are mean square error (MSE), root mean square error (RMSE), mean absolute error (MAE), and determination coefficient (R2).

These results are consistent with findings by Bonin et al. (2015) and Banta et al. (2006), who showed that the mixing below the LLJ core can affect the turbulent exchange processes near the surface. Table 3 presents a summary of the average values of ΔUHI and the LLJ characteristics corresponding to each class. Weak vertical mixing is associated with strong ΔUHI, calm winds, and shallow core heights, whereas strong mixing relates to weak ΔUHI, strong wind speeds, and greater core heights. Previous studies have shown that jets at low altitudes (up to 300 m a.g.l.) tend to present low to moderate core wind speeds (Banta et al., 2002; Karipot et al., 2009; Carroll et al., 2019) so that weak wind shear only produces little mechanical turbulence. These low-altitude jets are often associated with a strong temperature inversion over the rural surfaces so that the stable stratification of the atmosphere leads to a more effective decoupling from the surface friction. For these conditions of strong atmospheric stratification and weak momentum transport by the LLJ, the cool air remains locally over the vegetated rural surfaces where it was generated through efficient radiative cooling during the cloud-free nights. Both advection and vertical mixing processes are weak and hence support the formation of very strong ΔUHI (Hu et al., 2013; Lin et al., 2022). Here we demonstrate that , commonly obtained at one measurement location at a height above the roughness sublayer but below the LLJ core, can be considered a representative indicator of the vertical mixing in the nocturnal urban boundary layer and hence a powerful predictor for the UHI intensity.
Table 3Mean values of core height (ZLLJ), core wind speed (WSLLJ), and the corresponding ΔUHI for each class of vertical velocity variance ().

Note that the relation between ΔUHI and remains valid even during nights when no consistent LLJ was detected by the automatic procedure (black triangles in Fig. 9b), and other synoptic processes (such as fronts) are likely to modulate the atmospheric mixing. 53 % of the jet-free nights fall into the low class (red shading), and all show ΔUHI > 3.5 °C. Future studies will investigate why there is no LLJ detected for some nights although a low suggests a stable atmospheric stratification that is likely to favor decoupling.
This study presents the first comprehensive description of the characteristics of the summertime low-level jet (LLJ) over the Paris region. LLJ events are detected automatically from continuous scanning Doppler wind lidar (DWL) measurements over the city center using a tailored algorithm amended from an existing method (Tuononen et al., 2017). A key feature of this study is the high temporal and spatial resolution of wind profile observations, which allow LLJ variability to be captured in great detail. During the study period from 15 June to 31 August 2022, LLJs were identified on 55 nights (70 % of the nights). Notably, observations at an urban and a suburban sites reveal the regional nature of the LLJ, with 90 % of events detected at both sites. This study focuses on nights with cloud-free conditions; hence, nine cloudy nights were excluded from the analysis, isolating 46 LLJ cases for detailed investigation.
As jets were rarely observed during the daytime, this work focuses on nocturnal jets between 18:00 and 09:00 UTC (20:00 and 11:00 local time). A comprehensive analysis of LLJ characteristics is presented here, including core height, wind speed, and wind direction. An exceptional predominant easterly and northeasterly flow during the summer of 2022 led to the detection of jets with mostly northeast flow origins (30–60°), showing a mean core height of approximately 430 m a.g.l. Very few LLJs were detected under a southeast and east flow (190 and 300°). On average the core wind speed is 8.9 m s−1 and in an range between 4 and 12 m s−1.
To systematically assess the temporal variability of LLJs in the Paris region in terms of both the nocturnal evolution and the night-to-night variability, we take a novel approach to classify LLJ events. Rather than grouping profiles according to the core wind speed, as is usually found in the literature, nocturnal events are defined with a certain continuity and then classified according to the magnitude of the vertical velocity variance () below the jet core. Three LLJ classes (with weak, intermediate, and strong vertical mixing) were established based on the frequency distribution of . It was found that these mixing classes are a clear indicator for the core characteristics (speed, height, temporal evolution) of most LLJ events and tend to depend on the wind direction of the synoptic flow. Jets with low are predominantly observed with flow from the south to southeast (105–180°), at low altitudes (< 300 m a.g.l.), and with low to intermediate wind speeds (< 6 m s−1). The intermediate class is mainly found in the northwest sector (300–360°), with intermediate core heights (< 450 m a.g.l.) and core wind speeds (< 8.3 m s−1). Jets in the strong mixing class are primarily found under northeasterly flow, with most cases detected in a narrow sector (30–60°) at high altitudes > 400 m a.g.l. and with strong wind speeds > 8.5 m s−1.
The continuous DWL measurements and automatic detection provide novel insights into the nocturnal dynamics of the jets in the region. Most events persist from sunset to sunrise, with an average duration of ≈ 10 h, showcasing oscillations in core wind speeds that peak around midnight. Additionally, a prevalent clockwise wind direction veering was observed in 57 % of cases, with an average change in wind direction of 3.7° h−1. Notably, two outlier cases that fell into the intermediate class exhibited a sharp eastward veering from the northwest, with low wind speeds and relatively low altitudes.
For LLJ events characterized by the distinct signature of oscillatory wind speed and core wind direction veering, the inertial oscillation (IO) formation mechanism is clearly evident. For others, changes in synoptic flow may cause variations in the geostrophic wind that can mask this signature. Wind speed oscillation is found for most cases with strong and medium to high wind speeds, while it hardly appears in weak LLJs with low . Wind direction veering occurs in all vertical mixing classes but is most pronounced in LLJs with strong . Four outliers with strong wind speeds and a late starting time in the low class exhibit the oscillation signature. These cases, characterized by strong core wind speeds and low , are likely generated under very stable near-surface atmospheric stratification. Additionally, particularly low surface drag may favor the acceleration of these jets as they pass over a basin area of low topography east of Paris before reaching the urban site. Both the role of IO in LLJ formation over the Paris region and the impact of topography require further investigation.
In addition to the LLJ characterization, a key contribution of this work is the investigation of the impacts of the LLJ on the canopy layer urban heat island (UHI) effect. The surface wind speed is a meaningful parameter that explains variations in UHI intensity, as they account for dynamic effects. Our results, however, reveal that explains even more of the ΔUHI variability, as it also accounts for the mechanical mixing induced by the LLJ at the top of the nocturnal urban boundary layer. Using as a predictor results in a reduced mean absolute error (MAE) of 0.63 °C compared to the uncertainty when using surface wind speed to explain the ΔUHI variations (MAE = 1.23 °C). The LLJ core wind speed does not sufficiently characterize the advection and mixing processes that reduce ΔUHI intensity, as highlighted by four outlier events (16 and 19 July; 11 and 13 August) with strong core wind speeds and weak that are among the nights with the strongest UHI. Although the LLJ is not the only source of mechanical turbulence, this nocturnal phenomenon certainly plays a key role in UHI development.
This study demonstrates that the regional-scale synoptic flow in the form of the LLJ has clear implications for conditions in the urban boundary layer down to the surface. The mechanical turbulence driven by the LLJ significantly affects spatial contrasts in air temperature between the city and its surroundings and likely also influences the dispersion of atmospheric pollutants. In the summer of 2022, the LLJ was a very frequent phenomenon with variable characteristics that often suggest that inertial oscillation plays a role in its formation. A better understanding of LLJ formation in response to synoptic pressure patterns and topography is required to fully grasp its interactions with the urban atmosphere.

Figure A1Comparison of ΔUHI = Turban−Trural calculated using a rooftop site at QUALAIR-SU (20 m a.g.l.) against ΔUHI determined for two street levels: Boulevard des Capucines and Place de la Madeleine. Solid lines represent the best linear fit for each group of data.

Figure B1Nocturnal average of 25 m a.g.l. wind speed at Melun (rural site) as a function of the nocturnal average vertical velocity variance () at 238 m a.g.l. in the urban boundary layer for all cloud-free nights in the study period. Data are colored by the nocturnal average of ΔUHI. Dots represent nights with LLJ and the triangles the LLJ-free events.
The data sets are available in the AERIS–PANAME database (https://paname.aeris-data.fr/data-catalogue-2/, PANAME, 2024), and the code will be available upon request.
JC, SK, LT, CT, and MH worked on the conceptualization of this work. JC, MH, and JCD performed the WindCube Scan 400s deployment and ensured continuous operation. JC, SK, LT, and MH designed the experiment and JC performed the measurements. AF performed the measurements and data curation of the WindCube Scan WLS70. JC, SK, JP, and MAD worked on the computational algorithm implementation and data curation. JC, SK, JP, CT, LT, and MH conducted the investigation. JC writing of original draft. SK, CT, JP, LT, and MH reviewed and edited the manuscript. MH, SK, and LT worked on funding acquisition.
The contact author has declared that none of the authors has any competing interests.
Publisher’s note: Copernicus Publications remains neutral with regard to jurisdictional claims made in the text, published maps, institutional affiliations, or any other geographical representation in this paper. While Copernicus Publications makes every effort to include appropriate place names, the final responsibility lies with the authors.
The authors thank OBS4CLIM ANR France 2030, DIM QI2, and ACTRIS-FR for financing the investment of the Doppler wind lidar (DWL) Vaisala WindCube Scan 400s. Jonnathan Céspedes is grateful to the Region île de France and Vaisala France SAS for funding the doctoral scholarship as part of the “Paris Region PhD 2020” program (convention no. 20007179). We thank the QUALAIR-SU platform for hosting the 400s and for the meteorological data, especially Camille Viatte and Cristelle Cailteau-Fischbach. The authors are grateful to AERIS for providing SIRTA ReOBS data and support for PANAME (https://paname.aeris-data.fr/, last access: 28 February 2024), as well as to Météo-France for the meteorological surface station data. Thanks go to the SIRTA team, especially to Christophe Boitel for his technical support and to Jean-François Ribaud for support on the ReOBS data processing. The authors thank EDF R&D/CEREA for providing data collected by the DWL WLS70. This work is conducted in the context of the COST Action PROBE (CA18235), supported by COST (European Cooperation in Science and Technology, https://www.cost.eu/, last access: 28 February 2024). The authors extend their thanks to two anonymous referees for their valuable feedback, which has helped to improve the clarity of this study.
This paper was edited by Stephanie Fiedler and reviewed by two anonymous referees.
Algarra, I., Eiras-Barca, J., Nieto, R., and Gimeno, L.: Global climatology of nocturnal low-level jets and associated moisture sources and sinks, Atmos. Res., 229, 39–59, https://doi.org/10.1016/J.ATMOSRES.2019.06.016, 2019. a
Andreas, E. L., Claffey, K. J., and Makshtas, A. P.: Low-Level Atmospheric Jets And Inversions Over The Western Weddell Sea, Bound.-Lay. Meteorol., 97, 459–486, https://doi.org/10.1023/A:1002793831076, 2000. a
Arfeuille, G., Quintanilla-Montoya, A. L., González, F. C. V., and Villarreal, L. Z.: Observational Characteristics of Low-Level Jets in Central Western Mexico, Bound.-Lay. Meteorol., 155, 483–500, https://doi.org/10.1007/S10546-015-0005-0, 2015. a
Baas, P., Bosveld, F. C., Baltink, H. K., and Holtslag, A. A.: A Climatology of Nocturnal Low-Level Jets at Cabauw, J. Appl. Meteorol. Clim., 48, 1627–1642, https://doi.org/10.1175/2009JAMC1965.1, 2009. a, b, c, d, e, f, g, h
Banta, R. M., Newsom, R. K., Lundquist, J. K., Pichugina, Y. L., Coulter, R. L., and Mahrt, L.: Nocturnal low-level jet characteristics over Kansas during cases-99, Bound.-Lay. Meteorol., 105, 221–252, https://doi.org/10.1023/A:1019992330866, 2002. a, b, c, d, e, f, g
Banta, R. M., Pichugina, Y. L., and Newsom, R. K.: Relationship between Low-Level Jet Properties and Turbulence Kinetic Energy in the Nocturnal Stable Boundary Layer, J. Atmos. Sci., 60, 2549–2555, https://doi.org/10.1175/1520-0469(2003)060<2549:RBLJPA>2.0.CO;2, 2003. a, b
Banta, R. M., Pichugina, Y. L., and Brewer, W. A.: Turbulent Velocity-Variance Profiles in the Stable Boundary Layer Generated by a Nocturnal Low-Level Jet, J. Atmos. Sci., 63, 2700–2719, https://doi.org/10.1175/JAS3776.1, 2006. a, b, c
Barlow, J. F., Halios, C. H., Lane, S. E., and Wood, C. R.: Observations of urban boundary layer structure during a strong urban heat island event, Environ. Fluid Mech., 15, 373–398, https://doi.org/10.1007/S10652-014-9335-6, 2014. a
Blackadar, A. K.: Boundary Layer Wind Maxima and Their Significance for the Growth of Nocturnal Inversions, B. Am. Meteorol. Soc., 38, 283–290, https://doi.org/10.1175/1520-0477-38.5.283, 1957. a, b, c, d, e
Bonin, T. A., Blumberg, W. G., Klein, P. M., and Chilson, P. B.: Thermodynamic and Turbulence Characteristics of the Southern Great Plains Nocturnal Boundary Layer Under Differing Turbulent Regimes, Bound.-Lay. Meteorol., 157, 401–420, https://doi.org/10.1007/S10546-015-0072-2/METRICS, 2015. a, b, c, d
Bonner, W. D.: Climatology of the Low Level Jet, Mon. Weather Rev., 96, 833–850, https://doi.org/10.1175/1520-0493(1968)096<0833:COTLLJ>2.0.CO;2, 1968. a
Cariou, J. P., Boquet, M., Lolli, S., Parmentier, R., and Sauvage, L.: Validation of the new long range 1.5 µm wind lidar WLS70 for atmospheric dynamics studies, Proc. SPIE, 7479, 180–189, https://doi.org/10.1117/12.830292, 2009. a
Carroll, B. J., Demoz, B. B., and Delgado, R.: An Overview of Low-Level Jet Winds and Corresponding Mixed Layer Depths During PECAN, J. Geophys. Res.-Atmos., 124, 9141–9160, https://doi.org/10.1029/2019JD030658, 2019. a, b
Cheliotis, I., Dieudonné, E., Delbarre, H., Sokolov, A., Dmitriev, E., Augustin, P., Fourmentin, M., Ravetta, F., and Pelon, J.: Properties of Coherent Structures over Paris: A Study Based on an Automated Classification Method for Doppler Lidar Observations, J. Appl. Meteorol. Clim., 60, 1545–1559, https://doi.org/10.1175/JAMC-D-21-0014.1, 2021. a, b
Chen, Y.-L., Tu, C.-C., Hsiao, F., Chen, C.-S., Lin, P.-L., and Lin, P.-H.: An Overview of Low-Level Jets (LLJs) and Their Roles in Heavy Rainfall over the Taiwan Area during the Early Summer Rainy Season, Meteorology, 1, 64–112, https://doi.org/10.3390/METEOROLOGY1010006, 2022. a
Cheng, V., Ng, E., Chan, C., and Givoni, B.: Outdoor thermal comfort study in a sub-tropical climate: A longitudinal study based in Hong Kong, Int. J. Biometeorol,, 56, 43–56, https://doi.org/10.1007/S00484-010-0396-Z, 2012. a
Chiriaco, M., Dupont, J.-C., Bastin, S., Badosa, J., Lopez, J., Haeffelin, M., Chepfer, H., and Guzman, R.: ReOBS: a new approach to synthesize long-term multi-variable dataset and application to the SIRTA supersite, Earth Syst. Sci. Data, 10, 919–940, https://doi.org/10.5194/essd-10-919-2018, 2018. a
Conangla, L. and Cuxart, J.: On the turbulence in the upper part of the low-level jet: An experimental and numerical study, Bound.-Lay. Meteorol., 118, 379–400, https://doi.org/10.1007/S10546-005-0608-Y, 2006. a
Dieudonné, E., Delbarre, H., Sokolov, A., Ebojie, F., Augustin, P., and Fourmentin, M.: Characteristics of the low-level jets observed over Dunkerque (North Sea French coast) using 4 years of wind lidar data, Q. J. Roy. Meteor. Soc., 149, 1745–1768, https://doi.org/10.1002/QJ.4480, 2023. a
Dolfi-Bouteyre, A., Augere, B., Besson, C., Canat, G., Fleury, D., Gaudo, T., Goular, D., Lombard, L., Planchat, C., and Valla, M.: 1.5 µm all fiber pulsed lidar for wake vortex monitoring, in: Conference on Lasers and Electro-Optics, p. CMQ3, Optica Publishing Group, https://doi.org/10.1109/CLEO.2008.4551273, 2008. a
Du, Y. and Chen, G.: Climatology of Low-Level Jets and Their Impact on Rainfall over Southern China during the Early-Summer Rainy Season, J. Climate, 32, 8813–8833, https://doi.org/10.1175/JCLI-D-19-0306.1, 2019. a
Duarte, H. F., Leclerc, M. Y., Zhang, G., Durden, D., Kurzeja, R., Parker, M., and Werth, D.: Impact of Nocturnal Low-Level Jets on Near-Surface Turbulence Kinetic Energy, Bound.-Lay. Meteorol., 156, 349–370, https://doi.org/10.1007/S10546-015-0030-Z, 2015. a, b, c
Dupont, J. C., Haeffelin, M., Badosa, J., Elias, T., Favez, O., Petit, J. E., Meleux, F., Sciare, J., Crenn, V., and Bonne, J. L.: Role of the boundary layer dynamics effects on an extreme air pollution event in Paris, Atmos. Environ., 141, 571–579, https://doi.org/10.1016/J.ATMOSENV.2016.06.061, 2016. a
ESA: Copernicus DEM – Global and European Digital Elevation Model (COP-DEM), Copernicus [data set], https://doi.org/10.5270/ESA-c5d3d65, 2023. a
Gultepe, I., Sharman, R., Williams, P. D., Zhou, B., Ellrod, G., Minnis, P., Trier, S., Griffin, S., Yum, S. S., Gharabaghi, B., Feltz, W., Temimi, M., Pu, Z., Storer, L. N., Kneringer, P., Weston, M. J., ya Chuang, H., Thobois, L., Dimri, A. P., Dietz, S. J., França, G. B., Almeida, M. V., and Neto, F. L.: A Review of High Impact Weather for Aviation Meteorology, Pure Appl. Geophys., 176, 1869–1921, https://doi.org/10.1007/S00024-019-02168-6, 2019. a
Haeffelin, M., Barthès, L., Bock, O., Boitel, C., Bony, S., Bouniol, D., Chepfer, H., Chiriaco, M., Cuesta, J., Delanoë, J., Drobinski, P., Dufresne, J.-L., Flamant, C., Grall, M., Hodzic, A., Hourdin, F., Lapouge, F., Lemaître, Y., Mathieu, A., Morille, Y., Naud, C., Noël, V., O'Hirok, W., Pelon, J., Pietras, C., Protat, A., Romand, B., Scialom, G., and Vautard, R.: SIRTA, a ground-based atmospheric observatory for cloud and aerosol research, Ann. Geophys., 23, 253–275, https://doi.org/10.5194/angeo-23-253-2005, 2005. a, b
Hartman, A. T.: An analysis of the effects of temperatures and circulations on the strength of the low-level jet in the Turkana Channel in East Africa, Theor. Appl. Climatol., 132, 1003–1017, https://doi.org/10.1007/S00704-017-2121-X/METRICS, 2018. a
He, Y., Yuan, C., Ren, C., Wang, W., Shi, Y., and Ng, E.: Urban ventilation assessment with improved vertical wind profile in high-density cities – Investigations in nighttime extreme heat, Build. Environ., 216, 109018, https://doi.org/10.1016/J.BUILDENV.2022.109018, 2022. a, b, c
Holton, J. R.: The diurnal boundary layer wind oscillation above sloping terrain, Tellus A, 19, 200–205, https://doi.org/10.3402/TELLUSA.V19I2.9766, 1967. a
Hu, X. M., Klein, P. M., Xue, M., Lundquist, J. K., Zhang, F., and Qi, Y.: Impact of Low-Level Jets on the Nocturnal Urban Heat Island Intensity in Oklahoma City, J. Appl. Meteorol. Clim., 52, 1779–1802, https://doi.org/10.1175/JAMC-D-12-0256.1, 2013. a, b, c, d
Jiménez-Sánchez, G., Markowski, P. M., Jewtoukoff, V., Young, G. S., and Stensrud, D. J.: The Orinoco Low-Level Jet: An Investigation of Its Characteristics and Evolution Using the WRF Model, J. Geophys. Res.-Atmos., 124, 10696–10711, https://doi.org/10.1029/2019JD030934, 2019. a
Kallistratova, M. A. and Kouznetsov, R. D.: Low-Level Jets in the Moscow Region in Summer and Winter Observed with a Sodar Network, Bound.-Lay. Meteorol., 143, 159–175, https://doi.org/10.1007/S10546-011-9639-8, 2012. a, b
Kallistratova, M. A., Kouznetsov, R. D., Kramar, V. F., and Kuznetsov, D. D.: Profiles of Wind Speed Variances within Nocturnal Low-Level Jets Observed with a Sodar, J. Atmos. Ocean. Tech., 30, 1970–1977, https://doi.org/10.1175/JTECH-D-12-00265.1, 2013. a, b
Karipot, A., Leclerc, M. Y., and Zhang, G.: Characteristics of Nocturnal Low-Level Jets Observed in the North Florida Area, Mon. Weather Rev., 137, 2605–2621, https://doi.org/10.1175/2009MWR2705.1, 2009. a, b, c, d, e, f, g, h, i
Klein, A., Ravetta, F., Thomas, J. L., Ancellet, G., Augustin, P., Wilson, R., Dieudonné, E., Fourmentin, M., Delbarre, H., and Pelon, J.: Influence of vertical mixing and nighttime transport on surface ozone variability in the morning in Paris and the surrounding region, Atmos. Environ., 197, 92–102, https://doi.org/10.1016/j.atmosenv.2018.10.009, 2019. a, b, c, d, e
Kong, F., Yan, W., Zheng, G., Yin, H., Cavan, G., Zhan, W., Zhang, N., and Cheng, L.: Retrieval of three-dimensional tree canopy and shade using terrestrial laser scanning (TLS) data to analyze the cooling effect of vegetation, Agr. Forest Meteorol., 217, 22–34, https://doi.org/10.1016/J.AGRFORMET.2015.11.005, 2016. a
Kotthaus, S. and Grimmond, C. S. B.: Atmospheric boundary-layer characteristics from ceilometer measurements. Part 1: A new method to track mixed layer height and classify clouds, Q. J. Roy. Meteor. Soc., 144, 1525–1538, https://doi.org/10.1002/QJ.3299, 2018. a
Kotthaus, S., Haeffelin, M., Céspedes, J., Van Hove, M., Drouin, M.-A., Dupont, J.-C., and Foret, G.: Urban atmosphere dynamics for air quality applications: Atmospheric boundary layer height and wind profiles from ground-based remote sensing networks, EGU General Assembly 2023, Vienna, Austria, 23–28 Apr 2023, EGU23-13154, https://doi.org/10.5194/egusphere-egu23-13154, 2023. a
Lemonsu, A. and Masson, V.: Simulation of a Summer Urban Breeze Over Paris, Bound.-Lay. Meteorol., 104, 463–490, https://doi.org/10.1023/A:1016509614936, 2002. a, b, c
Li, X. and Du, Y.: Statistical Relationships between Two Types of Heavy Rainfall and Low-Level Jets in South China, J. Climate, 34, 8549–8566, https://doi.org/10.1175/JCLI-D-21-0121.1, 2021. a
Li, X., Zhang, C., Li, W., Anyah, R. O., and Tian, J.: Exploring the trend, prediction and driving forces of aerosols using satellite and ground data, and implications for climate change mitigation, J. Clean. Prod., 223, 238–251, https://doi.org/10.1016/J.JCLEPRO.2019.03.121, 2019. a
Lin, Y., Wang, C., Yan, J., Li, J., and He, S.: Observation and Simulation of Low-Level Jet Impacts on 3D Urban Heat Islands in Beijing: A Case Study, J. Atmos. Sci., 79, 2059–2073, https://doi.org/10.1175/JAS-D-21-0245.1, 2022. a, b, c, d, e
Liu, H., He, M., Wang, B., and Zhang, Q.: Advances in low-level jet research and future prospects, J. Meteorol. Res., 28, 57–75, https://doi.org/10.1007/S13351-014-3166-8, 2014. a
Liu, Z., Barlow, J. F., Chan, P. W., Fung, J. C. H., Li, Y., Ren, C., Mak, H. W. L., and Ng, E.: A Review of Progress and Applications of Pulsed Doppler Wind LiDARs, Remote Sensing, 11, 2522, https://doi.org/10.3390/RS11212522, 2019. a
Weide Luiz, E. and Fiedler, S.: Spatiotemporal observations of nocturnal low-level jets and impacts on wind power production, Wind Energ. Sci., 7, 1575–1591, https://doi.org/10.5194/wes-7-1575-2022, 2022. a
Lundquist, J. K.: Wind Shear and Wind Veer Effects on Wind Turbines, Handbook of Wind Energy Aerodynamics, Springer, Cham, 1–22, https://doi.org/10.1007/978-3-030-05455-7_44-1, 2021. a
Marke, T., Crewell, S., Schemann, V., Schween, J. H., and Tuononen, M.: Long-Term Observations and High-Resolution Modeling of Midlatitude Nocturnal Boundary Layer Processes Connected to Low-Level Jets, J. Appl. Meteorol. Clim., 57, 1155–1170, https://doi.org/10.1175/JAMC-D-17-0341.1, 2018. a
Oke, T. R.: City size and the urban heat island, Atmos. Environ., 7, 769–779, https://doi.org/10.1016/0004-6981(73)90140-6, 1973. a, b, c, d
Oke, T. R., Mills, G., Christen, A., and Voogt, J. A.: Urban Heat Island, Cambridge University Press, 197–237, https://doi.org/10.1017/9781139016476.008, 2017. a, b, c, d, e
Pal, S., Xueref-Remy, I., Ammoura, L., Chazette, P., Gibert, F., Royer, P., Dieudonné, E., Dupont, J. C., Haeffelin, M., Lac, C., Lopez, M., Morille, Y., and Ravetta, F.: Spatio-temporal variability of the atmospheric boundary layer depth over the Paris agglomeration: An assessment of the impact of the urban heat island intensity, Atmos. Environ., 63, 261–275, https://doi.org/10.1016/J.ATMOSENV.2012.09.046, 2012. a
PANAME: Data catalogue, https://paname.aeris-data.fr/data-catalogue-2/, 28 February 2024. a
Pearson, G., Davies, F., and Collier, C.: An Analysis of the Performance of the UFAM Pulsed Doppler Lidar for Observing the Boundary Layer, J. Atmos. Ocean. Tech., 26, 240–250, https://doi.org/10.1175/2008JTECHA1128.1, 2009. a
Petit, J.-E., Gros, V., Favez, O., Simon, L., Kalalian, C., Brugère, E., Borbon, A., Dupont, J.-C., Abbou, G., Ghersi, V., Michoud, V., Di Biagio, C., Formenti, P., Cantrell, C., Gration, A., Brito, J., Dusanter, S., Jamar, M., and Haeffelin, M.: Forest fire plumes in the Paris region (France) during summer 2022, the spoor of a schorching summer, EGU General Assembly 2023, Vienna, Austria, 23–28 Apr 2023, EGU23-15788, https://doi.org/10.5194/egusphere-egu23-15788, 2023. a
Qi, L., Leslie, L. M., and Zhao, S. X.: Cut-off low pressure systems over southern australia: climatology and case study, Int. J. Climatol, 19, 1633–1649, https://doi.org/10.1002/(SICI)1097-0088(199912)19:15<1633::AID-JOC445>3.0.CO;2-0, 1999. a
Qualair: Site Qualair, http://qualair.aero.jussieu.fr/qualair.php?menu=present (last access: 11 June 2022), 2022. a
Region, L. P.: Ilots de chaleur Urbains (ICU) : classification des IMU en zone climatique locale (LCZ), Aléas et Vulnérabilités à la chaleur de Jour et de Nuit en Île-de-France, https://data-iau-idf.opendata.arcgis.com/datasets/2846134ea6b94177af1366d11e517187_18/explore (last access: 28 February 2024), 2023. a
Ridder, K. D., Maiheu, B., Lauwaet, D., Daglis, I. A., Keramitsoglou, I., Kourtidis, K., Manunta, P., and Paganini, M.: Urban Heat Island Intensification during Hot Spells – The Case of Paris during the Summer of 2003, Urban Science, 1, 3, https://doi.org/10.3390/URBANSCI1010003, 2016. a
Robine, J. M., Cheung, S. L. K., Roy, S. L., Oyen, H. V., Griffiths, C., Michel, J. P., and Herrmann, F. R.: Death toll exceeded 70,000 in Europe during the summer of 2003, CR Biol., 331, 171–178, https://doi.org/10.1016/J.CRVI.2007.12.001, 2008. a
Roy, S., Sentchev, A., Schmitt, F. G., Augustin, P., and Fourmentin, M.: Impact of the Nocturnal Low-Level Jet and Orographic Waves on Turbulent Motions and Energy Fluxes in the Lower Atmospheric Boundary Layer, Bound.-Lay. Meteorol., 180, 527–542, https://doi.org/10.1007/S10546-021-00629-X, 2021. a, b, c
Roy, S., Sentchev, A., Fourmentin, M., and Augustin, P.: Machine Learning and Deterministic Methods for Detection Meteorological Phenomena from Ground Measurements: Application for Low-Level Jet and Sea-Breeze Identification in Northern France, Atmosphere, 13, 1873, https://doi.org/10.3390/ATMOS13111873, 2022. a
Rubio, H., Kühn, M., and Gottschall, J.: Evaluation of low-level jets in the southern Baltic Sea: a comparison between ship-based lidar observational data and numerical models, Wind Energ. Sci., 7, 2433–2455, https://doi.org/10.5194/wes-7-2433-2022, 2022. a
Shapiro, A., Fedorovich, E., and Rahimi, S.: A Unified Theory for the Great Plains Nocturnal Low-Level Jet, J. Atmos. Sci., 73, 3037–3057, https://doi.org/10.1175/JAS-D-15-0307.1, 2016. a, b
Stull, R. B.: Stable Boundary Layer, in: An Introduction to Boundary Layer Meteorology, edited by: Stull, R. B., Atmospheric Sciences Library, vol. 13, Springer, Dordrecht, https://doi.org/10.1007/978-94-009-3027-8_12, 1988. a, b, c
Sánchez, M. P., de Oliveira, A. P., Varona, R. P., Tito, J. V., Codato, G., Ribeiro, F. N. D., Filho, E. P. M., and da Silveira, L. C.: Rawinsonde-Based Analysis of the Urban Boundary Layer in the Metropolitan Region of São Paulo, Brazil, Earth and Space Science, 7, e2019EA000781, https://doi.org/10.1029/2019EA000781, 2020. a
Sánchez, M. P., Varona, R. P., Tito, J. V., Codato, G., Ynoue, R. Y., Dutra Ribeiro, F. N., and Marques Filho, E. P.: Observational Investigation of the Low-Level Jets in the Metropolitan Region of São Paulo, Brazil, Earth and Space Science, 9, e2021EA002190, https://doi.org/10.1029/2021EA002190, 2022. a, b
Taylor, J., Wilkinson, P., Davies, M., Armstrong, B., Chalabi, Z., Mavrogianni, A., Symonds, P., Oikonomou, E., and Bohnenstengel, S. I.: Mapping the effects of urban heat island, housing, and age on excess heat-related mortality in London, Urban Climate, 14, 517–528, https://doi.org/10.1016/J.UCLIM.2015.08.001, 2015. a
Theeuwes, N. E., Barlow, J. F., Teuling, A. J., Grimmond, C. S. B., and Kotthaus, S.: Persistent cloud cover over mega-cities linked to surface heat release, npj Climate and Atmospheric Science, 2, 1–6, https://doi.org/10.1038/s41612-019-0072-x, 2019. a
Thobois, L., Cariou, J. P., and Gultepe, I.: Review of Lidar-Based Applications for Aviation Weather, Pure Appl. Geophys., 176, 1959–1976, https://doi.org/10.1007/S00024-018-2058-8, 2019. a
Tsiringakis, A., Theeuwes, N. E., Barlow, J. F., and Steeneveld, G. J.: Interactions Between the Nocturnal Low-Level Jets and the Urban Boundary Layer: A Case Study over London, Bound.-Lay. Meteorol., 183, 249–272, https://doi.org/10.1007/S10546-021-00681-7, 2022. a, b
Tuononen, M., Sinclair, V. A., and Vihma, T.: A climatology of low-level jets in the mid-latitudes and polar regions of the Northern Hemisphere, Atmos. Sci. Lett., 16, 492–499, https://doi.org/10.1002/ASL.587, 2015. a
Tuononen, M., O'Connor, E. J., Sinclair, V. A., and Vakkari, V.: Low-Level Jets over Utö, Finland, Based on Doppler Lidar Observations, J. Appl. Meteorol. Clim., 56, 2577–2594, https://doi.org/10.1175/JAMC-D-16-0411.1, 2017. a, b, c, d, e, f, g, h, i, j, k
Ulpiani, G.: On the linkage between urban heat island and urban pollution island: Three-decade literature review towards a conceptual framework, Sci. Total Environ., 751, 141727, https://doi.org/10.1016/J.SCITOTENV.2020.141727, 2021. a
Vanderwende, B. J., Lundquist, J. K., Rhodes, M. E., Takle, E. S., and Irvin, S. L.: Observing and Simulating the Summertime Low-Level Jet in Central Iowa, Mont. Weather Rev., 143, 2319–2336, https://doi.org/10.1175/MWR-D-14-00325.1, 2015. a
van de Wiel, B. J., Moene, A. F., Steeneveld, G. J., Baas, P., Bosveld, F. C., and Holtslag, A. A.: A Conceptual View on Inertial Oscillations and Nocturnal Low-Level Jets, J. Atmos. Sci., 67, 2679–2689, https://doi.org/10.1175/2010JAS3289.1, 2010. a
Wei, W., Wu, B. G., Ye, X. X., Wang, H. X., and Zhang, H. S.: Characteristics and Mechanisms of Low-Level Jets in the Yangtze River Delta of China, Bound.-Lay. Meteorol., 149, 403–424, https://doi.org/10.1007/S10546-013-9852-8, 2013. a
Wei, W., Zhang, H., Zhang, X., and Che, H.: Low-level jets and their implications on air pollution: A review, Front. Environ. Sci., 10, 1082623, https://doi.org/10.3389/FENVS.2022.1082623, 2023. a
Whiteman, C. D., Bian, X., and Zhong, S.: Low-Level Jet Climatology from Enhanced Rawinsonde Observations at a Site in the Southern Great Plains, J. Appl. Meteorol., 36, 1363–1376, https://doi.org/10.1175/1520-0450(1997)036<1363:LLJCFE>2.0.CO;2, 1997. a
Wouters, H., De Ridder, K., Demuzere, M., Lauwaet, D., and van Lipzig, N. P. M.: The diurnal evolution of the urban heat island of Paris: a model-based case study during Summer 2006, Atmos. Chem. Phys., 13, 8525–8541, https://doi.org/10.5194/acp-13-8525-2013, 2013. a