the Creative Commons Attribution 4.0 License.
the Creative Commons Attribution 4.0 License.
 | 10 Oct 2024
Influence of covariance of aerosol and meteorology on co-located precipitating and non-precipitating clouds over the Indo-Gangetic Plain
Nabia Gulistan
Yangang Liu
Aerosol–cloud–precipitation interaction (ACPI) plays a pivotal role in the global and regional water cycle and the earth's energy budget; however, it remains highly uncertain due to the different underlying physical mechanisms. Therefore, this study aims to systematically analyze the effects of aerosols and meteorological factors on ACPI in the co-located precipitating clouds (PCs) and non-precipitating clouds (NPCs) in winter and summer seasons by employing the long-term (2001–2021) retrievals from the Moderate Resolution Imaging Spectroradiometer (MODIS) and Tropical Rainfall Measuring Mission (TRMM) coupled with the National Center for Environmental Prediction/National Center for Atmospheric Research (NCEP/NCAR) reanalysis-II datasets over the Indo-Gangetic Plain (IGP). The results exhibit a decadal increase in aerosol optical depth (AOD) over Lahore (5.2 %), Delhi (9 %), Kanpur (10.7 %), and Gandhi College (22.7 %) and a decrease over Karachi (−1.9 %) and Jaipur (−0.5 %). The most stable meteorology with high values of lower-tropospheric stability (LTS) is found in both seasons over Karachi. In the summer season, the occurrence frequency of clouds is high (74 %) over Gandhi College, 60 % of which are PCs. Conversely, the lowest number of PCs is found over Karachi. Similarly, in the winter season, the frequency of cloud occurrence is low over Karachi and high over Lahore and Gandhi College. The analysis of cloud top pressure (CTP) and cloud optical thickness (COT) indicates high values of cloud fraction (CF) for thick and high-level clouds over all study areas except Karachi. The microphysical properties such as cloud effective radius (CER) and cloud droplet number concentration (CDNC) bear high values (CER ≳ 15 µm and CDNC ≳ 50 cm−3) for both NPCs and PCs in summer. The AOD–CER correlation is good (weak) for PCs (NPCs) in winter. Similarly, the sensitivity value of the first indirect effect (FIE) is high (ranging from 0.2 ± 0.13 to 0.3 ± 0.01 in winter and from 0.19 ± 0.03 to 0.32 ± 0.05 in summer) for PCs and low for NPCs. The sensitivity value for the second indirect effect (SIE) is relatively higher (such as 0.6 ± 0.14 in winter and 0.4 ± 0.04 in summer) than FIE. Sensitivity values of the aerosol–cloud interaction (ACI) are low (i.e., −0.06 ± 0.09) for PCs in summer. Furthermore, the precipitation rate (PR) exhibits high values in the summer season, primarily due to the significant contribution from optically thick clouds with lower CDNC (≲ 50 cm−3) and larger CER and the intermediate contribution from optically thick clouds with higher CDNC ( ≳ 50 cm−3).
- Article
(7693 KB) - Full-text XML
-
Supplement
(1250 KB) - BibTeX
- EndNote


-
Strong aerosol–cloud relations under unstable meteorological conditions led to the formation of thick precipitating clouds.
-
In thick clouds, the activation of cloud droplets is weakly dependent on aerosols.
-
Optically thin clouds led to a high precipitation rate.
The aerosol–cloud–precipitation interaction (ACPI) and aerosol–radiation interaction (ARI) significantly influence climates at the regional and global scales (López-Romero et al., 2021). Assessing the direct and indirect effects of aerosols is crucial to understanding and predicting the energy budget and the water cycle. In the direct effect, the absorption and scattering of solar radiation by aerosols lead to the warming of the atmosphere and cooling of the earth's surface (Zhou et al., 2020), causing changes in the lower-tropospheric stability (LTS) that further lead to modulation of precipitating clouds (PCs) and non-precipitation clouds (NPCs) (Andreae and Rosenfeld, 2008). Precipitating clouds are thick clouds with significant vertical development and high moisture content that form under unstable atmospheric conditions, such as cumulonimbus and nimbostratus, that produce precipitation reaching the ground. In contrast, non-precipitating clouds are typically thin, have low moisture content, and form under stable atmospheric conditions, and they include cloud types like cirrus, cirrostratus, altostratus, and stratus, which generally do not produce significant precipitation (Houze, 2014).
In the indirect effect, the water-soluble aerosols such as soil dust, sulfates, nitrates, and other organic aerosols ejected naturally and anthropogenically serve as cloud condensation nuclei (CCN) and ice-nucleating particles (INPs). Hence, aerosols affect the aerosol–cloud interaction (ACI) by influencing the growth of cloud droplets and cloud droplet number concentration (CDNC) (Twomey, 1977; Albrecht, 1989; Jiang et al., 2002; Chen et al., 2011; Tao et al., 2012). The increase in CDNC and decrease in cloud droplet effective radius (CER) inhibit the onset of precipitation and increase the cloud lifetime (Albrecht, 1989). Conversely, the decrease in CDNC and the increase in CER together increase the probability of the precipitation rate (PR). Conversely, Stevens and Feingold (2009) have shown that initially, more sea salt carried by high wind speed inhibits precipitation formation. However, the same sea spray tends to seed the coalescence by producing larger CER that leads to enhanced precipitation.
In the last few decades, most of the cultivable land of the Indo-Gangetic Plain (IGP) has been replaced by urban developments. Due to the fastest growth of population, urbanization, industrialization, and massive combustion of biomass and fossil fuels in residential homes and factories, a decadal increase in aerosols is observed over the IGP. The high aerosol loading may affect the formation of tropospheric clouds and seasonal precipitation patterns (Kaskaoutis et al., 2011; Singh et al., 2015; Thomas et al., 2021). The high aerosol loading makes the IGP suitable for the study of ACPI. In addition, frequent variations in cloud fraction (CF), extreme precipitation and drought abrupt temperature changes (e.g., heat waves), and irregular unseasonal rains may cause major and unavoidable hazards at local and regional levels in the future (Zhou et al., 2020).
In the last 2 decades, the scientific community has focused on quantification of ACI using both observations (Feingold et al., 2003; Koren et al., 2004; Costantino and Bréon, 2010; Wang et al., 2015; Zhao et al., 2018; Guo et al., 2019; Anwar et al., 2022) and modeling techniques (Chen et al., 2018; Zhou et al., 2020; Sharma et al., 2023). However, a similar recent study (Anwar et al., 2022) attempted to understand the sensitivities of ACI and the first indirect effect of different subsets of aerosol optical depth (AOD) to the different conditions of RH and wind directions and found a decrease (increase) in CER with an aerosol loading Twomey effect (anti-Twomey effect) over the monsoon (weak and moderately intensive monsoon) regions. However, the above study excluded the other significant meteorological parameters such as LTS, PR, and T850 and was also limited to the monsoon regions of Pakistan only. Further, in the context of warm rain processes, it is generally understood that the high concentration of aerosols capable of serving as CCN leads to enhanced CDNC, known as the first indirect effect (FIE) or Twomey effect (Twomey et al., 1977). It is also widely acknowledged that CDNC plays a pivotal role in cloud microphysics and significantly influences the onset of precipitation and retention of water in clouds called the second indirect effect (SIE) (Gryspeerdt et al., 2016; Naud et al., 2017). However, in the above study, the analysis of CDNC is also not addressed. Therefore, the present study aims to deepen the previous study (Anwar et al., 2022), with a long-term and detailed analysis of the ACPI including aerosol indirect effects for low-level liquid clouds extended over the whole IGP for understanding different mechanisms (condensation, droplet growth and precipitation rate) of cloud and precipitation formation. Due to the absence of in situ measurement facilities and the constraints of limited computational resources, the study concentrated on satellite data for specific locations across the entire IGP. These locations were strategically chosen due to their positioning within significant aerosol belts, where the concentration and behavior of aerosols are of particular interest. Therefore, the satellite-based approach was chosen as it provides detailed insights into aerosol dynamics in these critical regions while also benefiting from the broader spatial coverage of satellite data.
This study is focused on estimating the variations in sensitivities of the aerosol–cloud relationship to the variations in aerosol loading at specified meteorological conditions for low-level PCs and NPCs in the summer and winter seasons over the IGP. This study is unique in using a large number of samples; classification of liquid clouds as PCs and NPCs; further classification of clouds as low-, mid-, and high-level clouds through joint cloud optical thickness–cloud top pressure (COT–CTP) histograms; and quantification of the sensitivities of the FIE, SIE, total indirect effect (TIE), and ACI to CDNC. The significant meteorological parameters considered include temperature at 850 hPa, LTS, relative humidity (RH, in %) at 850 hPa, vertical velocity (ω), and PR. Furthermore, by utilizing the Moderate Resolution Imaging Spectroradiometer (MODIS) and Tropical Rainfall Measuring Mission (TRMM) data, the correlation of cloud microphysical properties (CER and CDNC) and AOD at specified values of LTS and cloud liquid water path (CLWP) is examined, and precipitation sensitivity at constant macrophysical conditions is estimated.
2.1 Study area
The selected study area (Fig. 1) comprises the upper, middle, and eastern portions of the IGP. The upper part consists of the densely populated and developed regions of the eastern part of Pakistan, i.e., Karachi (24.87° N, 67.03° E) and Lahore (31.54° N, 74.32° E), whereas the middle part comprises the northern part of India and Bangladesh, i.e., Delhi (28.59° N, 77.22° E), Kanpur (26.51° N, 80.23° E), Jaipur (26.91° N, 75.81° E), Gandhi College (25.87° N, 84.13° E), Kolkata (22.57° N, 88.36° E), Dhaka (23.80° N, 90.41° E), and Patna (25.59° N, 85.13° E). The data analysis for the eastern part of the IGP (Kolkata, Dhaka, and Patna) is documented as the Supplement.

Figure 1Topography of the study area.
2.2 Methodology
2.2.1 MODIS, NCEP/NCAR reanalysis-II, and TRMM data
Moderate Resolution Imaging Spectroradiometer (MODIS) is a major constituent of NASA's Earth Observing System (EOS). MODIS is orbiting with two onboard satellites, Terra and Aqua, launched in 1999 and 2002, respectively, with a range of 2330 km spanning the entire globe in a day. It provides data and information with a spatial resolution of 1° to study atmospheric processes and physical structure (Kedia et al., 2014; Srivastava et al., 2015). This study uses the daily mean of combined dark target and deep blue AOD at 0.55 µm, cloud top pressure (CTP), cloud top temperature (CTT), CF, CER, and COT for liquid clouds from the level 3 MOD08 (TERRA) aerosol–cloud data product. Data with AOD > 1.5 are excluded to avoid potential misidentification of aerosols as clouds. The following adiabatic approximation (Brenguier et al., 2000; Wood, 2006; Kubar et al., 2009; Michibata et al., 2014) is used to calculate CDNC (cm−3):
where = 0.0620, ρwater is the liquid water density, and γeff is the adiabatic gradient of liquid water content in the moist air column (Michibata et al., 2014). Values of γeff range from 1 to 2.5 at a temperature of 32 to 104 K (Brenguier, 1991; Zhu et al., 2018; Zhou et al., 2020). The CLWP is estimated by the following equation:
where ρw is the water density at room temperature (Koike et al., 2016).
The National Center for Environmental Prediction/National Center for Atmospheric Research (NCEP/NCAR) reanalysis datasets provide global reanalysis datasets that combine satellite observations with the simulation of models through data assimilation (Purdy et al., 2016). Daily data for meteorological parameters including temperature, RH, and ω at 850 hPa are retrieved at a spatial resolution of a T62 Gaussian grid (1.915° × 1.875°) from NCEP reanalysis-II datasets and used to calculate lower-tropospheric stability (LTS), defined as (Li et al., 2017)
where θ is the potential temperature, and the subscripts denote the pressure levels of 700 and 1000 hPa.
The Tropical Rainfall Measuring Mission (TRMM) is the first joint satellite mission between NASA America and the National Space Development Agency (NASDA) Japan, utilizing visible infrared and microwaves to measure the rain precipitation over tropical and subtropical regions. The main TRMM instruments that are used to measure rain precipitation are Precipitation Radar and the TRMM Microwave Imager (TMI). Precipitation Radar is operating at a frequency of 13.8 GHz and TMI is a passive microwave radiometer consisting of nine channels. A calibrated dataset, TRMM 2B31, of the TRMM Combined Instrument (TCI) for TRMM Multi-satellite Precipitation Analysis (TMPA) is formed from an algorithm that uses the TMI and Precipitation Radar. The TMPA 3B42 product gives the rain precipitation averages on a daily and sub-daily basis. In the current study, the TMPA or TRMM 3B42 data product is used for the retrieval of the PR daily. The spatial resolution of TRMM 3B42 is 0.25° × 0.25° and is available from the year 1998 to present.
2.2.2 Methodology
The present study is designed to analyze and quantify the ACPI for PCs and NPCs in winter and summer under a variety of meteorological conditions. The daily mean data of each parameter for warm clouds are retrieved from the respective satellites and NCEP/NCAR reanalysis-II for each study site. Subsequently, the VLOOKUP function in Microsoft Excel is applied to filter out counts where data are not available, search for values of a parameter in the first column, and retrieve the values of other parameters in the same rows on the corresponding dates in a large dataset. The data are then segregated into two subsets for the summer and winter seasons. Based on precipitation data from TRMM, the subsets are further divided into precipitating and non-precipitating clouds.
The sensitivities of cloud parameters to CDNC are analyzed through the following formulation considered from previous studies (Zhou et al., 2020):
In this study, the term on the left side of Eq. (4) is defined as the total indirect aerosol effect (TIE), and the first and second terms on the right side of the equation are defined as the first indirect aerosol effect (FIE) and second indirect effect (SIE), respectively. Similarly, the sensitivity of CDNC to AOD is evaluated by employing the index of ACI:
The sensitivity of PR to CDNC is calculated using the following equation (Leena et al., 2018):
3.1 Regional and seasonal distribution of AOD
AOD is a commonly used proxy for aerosol concentration in the atmosphere and is analyzed here (Figs. 2–3).
The IGP characteristically exhibits a diverse and massive pool of aerosols due to its unique topography. The western part of the IGP is a coastal location and inlet for westerly winds. Therefore, dry regions and the Arabian Sea in the west contribute dust, sea salt, and water vapors to the region. The Himalayas in the north act as a barrier to the winds, leading to the trapping of aerosols over the central part of the IGP. Therefore, this region exhibits a high concentration of anthropogenic aerosols. The Bay of Bengal in the east allows southeasterly winds to enter passing across Dhaka, Kolkata, and Patna to Delhi and Lahore (Hassan et al., 2002; Anwar et al., 2022). The westerly and easterly winds traverse forested hilly terrain, rivers, and lakes, elevating humidity levels and initiating the cloud formation by activation of the newly originated small aerosol particles as CCN and cloud formation affecting the local microclimate.
Figure 2 shows a decadal variation in time-average maps for combined dark target and deep blue AOD retrieved at 0.55 µm over the entire study area for the years 2001–2010 and 2011–2021. Also, Table 1 illustrates the percentage change in decadal average values of AOD. The results indicate that AOD exhibits a decrease over Karachi (−1.9 %) and Jaipur (−0.5 %). An increase in AOD is observed over Lahore (5.2 %), Delhi (9 %), Kanpur (10.7 %), and Gandhi College (22.7 %). Similarly, Table S1 in the Supplement shows the decadal change in AOD over Kolkata (18 %), Dhaka (22.6 %), and Patna (23.3 %). Similar to Gandhi College, an increase is observed over all three areas. Reasons for the increase in aerosols include multiple sources of aerosols, human behavior, socio-economic development at local and regional levels, and unique topography that are conducive to the persistence and retention of aerosols.

Figure 2Decadal increase (for the years 2001–2010 and 2011–2021) in AOD over study sites.
Table 1Decadal percentage variations in average values of AOD over all study areas.
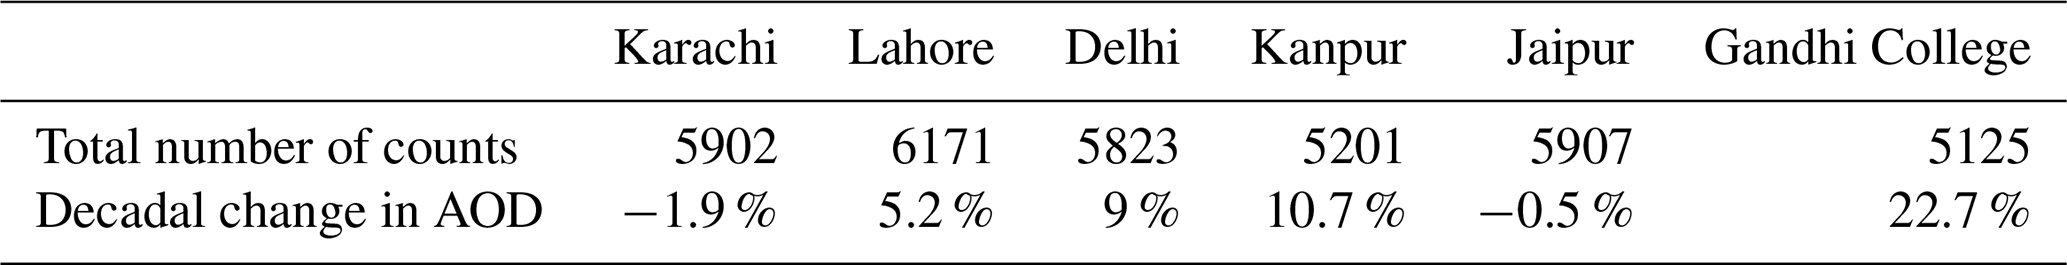
Figure 3a–b show the probability density function (PDF) for AOD, illustrating different distributions in the summer and winter seasons. Figure 3a shows that the distribution of AOD over Delhi, Kanpur, and Gandhi College is similar. However, a shift in the peak value of PDF towards high values of AOD over Lahore and low values over Jaipur illustrates comparatively high and low aerosol concentration in the summer season over Lahore and Jaipur, respectively. Likewise, Fig. S1 in the Supplement shows the seasonal PDF values of AOD over Kolkata, Dhaka, and Patna. The results indicate similar seasonal distribution functions over all three areas of the eastern IGP. In both seasons, PDF peaks for high values of AOD are observed over Patna, showing a high concentration of aerosols as compared to Kolkata and Dhaka.

Figure 3The probability density function (PDF) of AOD over study sites is shown for the (a) summer and (b) winter seasons, respectively.
The loading of high concentrations of aerosols is owing to the high density of population, industrialization, and human activities. The major sources of aerosols in all months of the year include vehicular emission originating from old transport facilities, emission of smoke and soot during consumption of biomass for cooking, heavy industrial emission, and aerosols produced in seasonal harvesting and crop residue burning. All these sources produce organic aerosols, which are characterized as hydrophilic particles and have the potential to act as CCN. Likewise, the soil dust particles also act as good CCN due to their hydroscopic nature (Sun and Ariya, 2006). Moreover, the meteorological conditions also play a substantial role in enhancing AOD values such as the uplifting of loose soil dust and swelling of aerosols due to holding the water vapors (wv's) for a long time (Masmoudi et al., 2003; Alam et al., 2010, 2011). Also, the lower but flat PDF curve demonstrates low values of AOD over Karachi. Ali et al. (2020) associated the low AOD values over Karachi with the westerly and southwesterly wind currents at tropospheric level. However, the decreasing trend in AOD over the coastal city may also be attributed to the variations in other meteorological parameters like T and RH.
As compared to the summer season, the pattern of PDF in winter is significantly different as shown in Fig. 3b. The low value of PDF (0.5) for the high value of AOD (0.9) over Karachi illustrates a comparatively pristine atmosphere. Similarly, the PDF peaks for Lahore, Delhi, and Jaipur (0.7, 0.7, and 0.8) indicate comparatively high AOD over Delhi. Likewise, the distribution over Kanpur and Gandhi College similarly illustrates similar values of AOD (1.1 and 1.2, respectively). These high values of AOD are attributed to the high emission of anthropogenic aerosols at local and regional levels over the central part of the IGP (Delhi, Jaipur, Kanpur, and Gandhi College).
Few authors attributed the reduced values of AOD in the winter season to the wet scavenging and suppressed emission of aerosols from the earth's surface (Alam et al., 2010; Zeb et al., 2019). However, in our case, the low (high) values in winter (summer) are associated with the dispersion of fine-mode (course-mode) particles due to the variations in meteorological conditions.
3.2 Climatology of meteorological parameters
Generally, LTS has relationships to factors such as temperature, humidity, wind patterns, and atmospheric pressure over extended periods. It is also widely acknowledged that atmospheric stability, temperature, RH, wind speed, and direction play a significant role in cloud formation (Yang et al., 2015; Tao et al., 2012). Therefore, the influence of long-term variations in the said meteorological parameters is considered in the current study. The variations in meteorological parameters have an unavoidable impact on ACPI. The parameters considered in this study include the temperature, LTS to determine the lower atmospheric stability and instability that influence the process of cloud and precipitation formation through its significant implications on evaporation and convection of the air parcel, the RH to estimate the level of wv, and the ω to assess the suitable atmospheric dynamics. Figure 4 shows the variations in LTS values for NPCs and PCs in the winter and summer seasons. In the winter season, the LTS values are high for NPCs and comparatively lower for PCs over entire study areas. In the summer season, the scenario is reversed, with high values for PCs but low values for NPCs, suggesting a stable tropospheric layer on rainy days. This stabilization may be attributed to the cold pools generated by the evaporation of falling rain droplets (Wu et al., 2017). The lower LTS values for NPCs in the summer season suggest the likelihood of stronger instability that causes a high potential for vertical motion and the development of thunderstorms. However, Karachi exhibits a distinct pattern of LTS, with the highest values in each case, which indicates the existence of the most stable tropospheric layer in Karachi, likely due to moist and cold sea breeze that occurs in the city's coastal location.

Figure 4Variations in lower-tropospheric stability (LTS) over all study sites for PCs and NPCs in winter and summer seasons; the error bars show the standard deviation (SD) values.
The median values computed for the remaining meteorological parameters considered in this study are listed in Table 2. The high values in each case are indicated in bold, and the low values are italicized. The results show that in the winter season, the temperature at 850 hPa (T850) is relatively high for NPCs ranging from 281 to 285.6 K. The increase in RH for PCs during winter ranged from 59.5 % to 71.5 %. Also, the ω > 0 for NPCs and < 0 for PCs in the winter season.
Table 2Median values of meteorological parameters for PCs (NPCs) in summer and winter seasons. For both types of clouds, maximum values are shown in bold, and minimum values are indicated in italics.
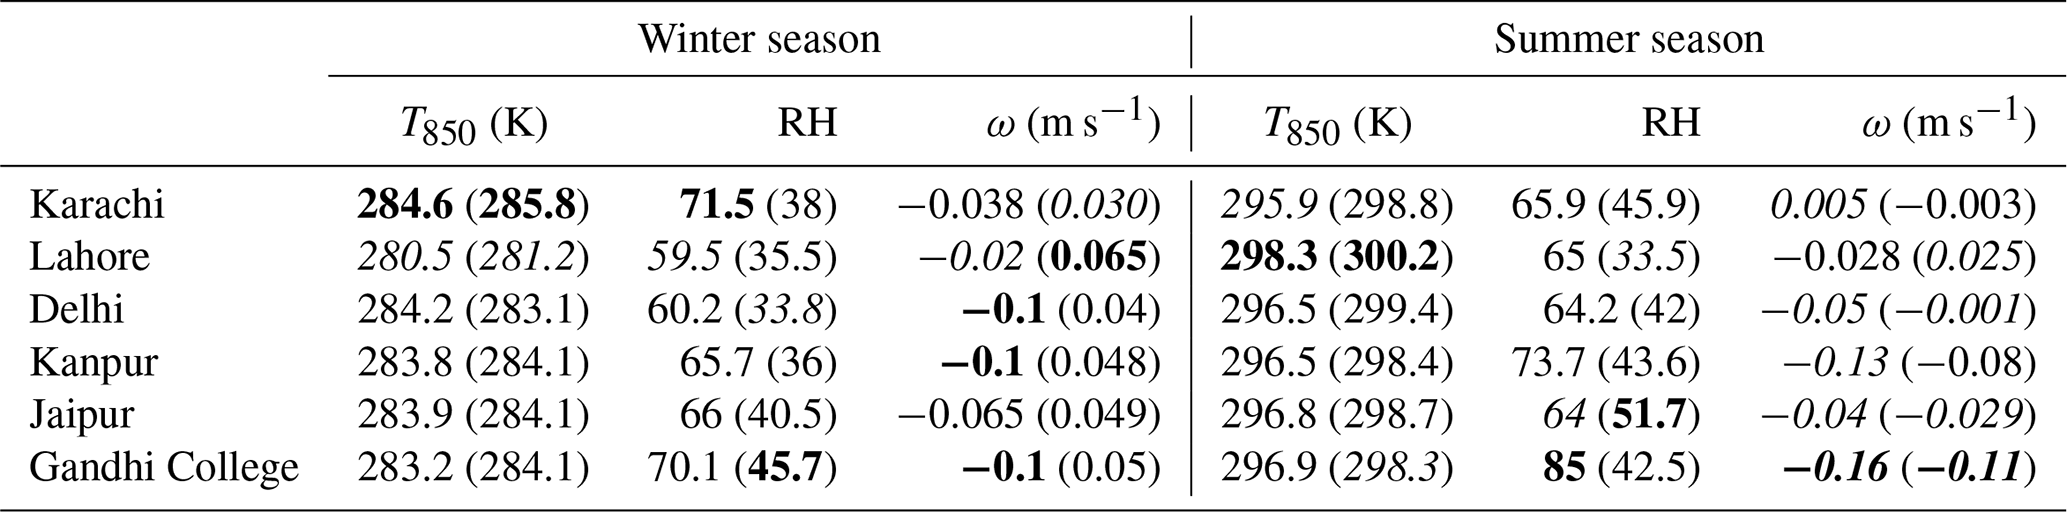
In the summer season, it is observed that T850 is comparatively higher than that for the winter clouds and ranges from 298.3 to 300.2 and 296.5 to 298.3 K for NPCs and PCs, respectively. The high values of T850 are due to intense solar fluxes in the summer season that keep the temperature of the earth's surface and adjacent atmospheric layer higher. Also, the increase in RH during summer ranged between 33.5 % and 51.7 % for NPCs. The reason for the high values of wv and RH is mainly the suitable thermodynamical conditions such as evaporation and convection due to the high temperature of the earth's surface and air (Sherwood et al., 2010). The results show high values of RH, reaching 70.1 % (85 %) in the winter (summer) season for PCs over Gandhi College. Conversely, notable fluctuations in RH are observed over the coastal city of Karachi, with values of 71.5 % (65.9 %) in winter (summer). Similarly, Fig. S2 and Table S2 show the LTS conditions for PCs and NPCs. The high LTS values indicate more stable conditions over Dhaka. Similarly, Tables 2 and S2 show the seasonal average values for other meteorological parameters. The results indicate high values of T850, RH, and ω of 295.3 (297.3) K, 88.8 % (83.5 %), and −0.19 (−0.17) m s−1, respectively, for PCs (NPCs) for over Patna in summer.
In addition, during the last 2 decades, the wv and fog over the Arabian Sea have increased (Verma et al., 2022). Therefore, the high values of wv and RH in summer months are due to the high-speed zonal winds that blow in the summer season and transport water vapors and sea salt from the surface of the Arabian Sea and hydrophilic aerosols such as soil dust from deserts of Iran, Pakistan, and India to the IGP. Moreover, during the winter season, elevated humidity levels are noticeable over the IGP, particularly in the vicinity of Gandhi College. This increased humidity is a result of evapotranspiration driven by agricultural practices, irrigation, the presence of rivers and lakes, and the introduction of moist, cold air from western winds (Nair et al., 2020), where ω < 0 for PCs over all study areas except Karachi.
The distinct variations in meteorological parameters reveal the occurrence of clouds with diverse properties. The detailed analysis of such clouds is given in the next subsections.
3.3 Regional and seasonal distribution of clouds and precipitations
Regional and seasonal differences in cloud occurrence and its microphysical structure
Figure 5 shows the frequency of occurrence of precipitable clouds and the total number of cloudy days. Chen et al. (2018) suggested the COT to be an effective measure for assessing the clouds and potential for precipitation. In our case, to avoid any overestimation, the COT data are aligned with PR data on corresponding dates and then filtered to include COT ≳ 5 for PCs. The results show that in the winter season, the frequency of clouds is low over Karachi and high over Lahore and Gandhi College. The results suggest the high number of PCs only over Lahore. In the summer season, a high number, i.e., 74 %, of the total data counts over Gandhi College are identified as cloudy days, 60 % of which are PCs. Similarly, most of the clouds over Lahore, Delhi, and Jaipur are PCs. Conversely, the lowest number of PCs (6 %) is found over Karachi. Likewise, Fig. S3 shows the total number of cloudy days and the number of days on which PCs occurred. The high occurrence of clouds is observed over Kolkata, reaching 83 % (60 %), and in Dhaka, reaching 91 % (69 %), in the summer (winter) season. The high occurrence of PCs in summer is due likely to the significant impact of elevated aerosols with the southwesterly winds on the summer monsoons and the occurrence of PCs. Therefore, Kolkata and Dhaka are of critical importance from the perspective of aerosol loading and ACI (Dahal et al., 2022).

Figure 5The frequency of occurrence of total cloudy days (including PCs and NPCs) and of only PCs is shown for both winter and summer seasons.
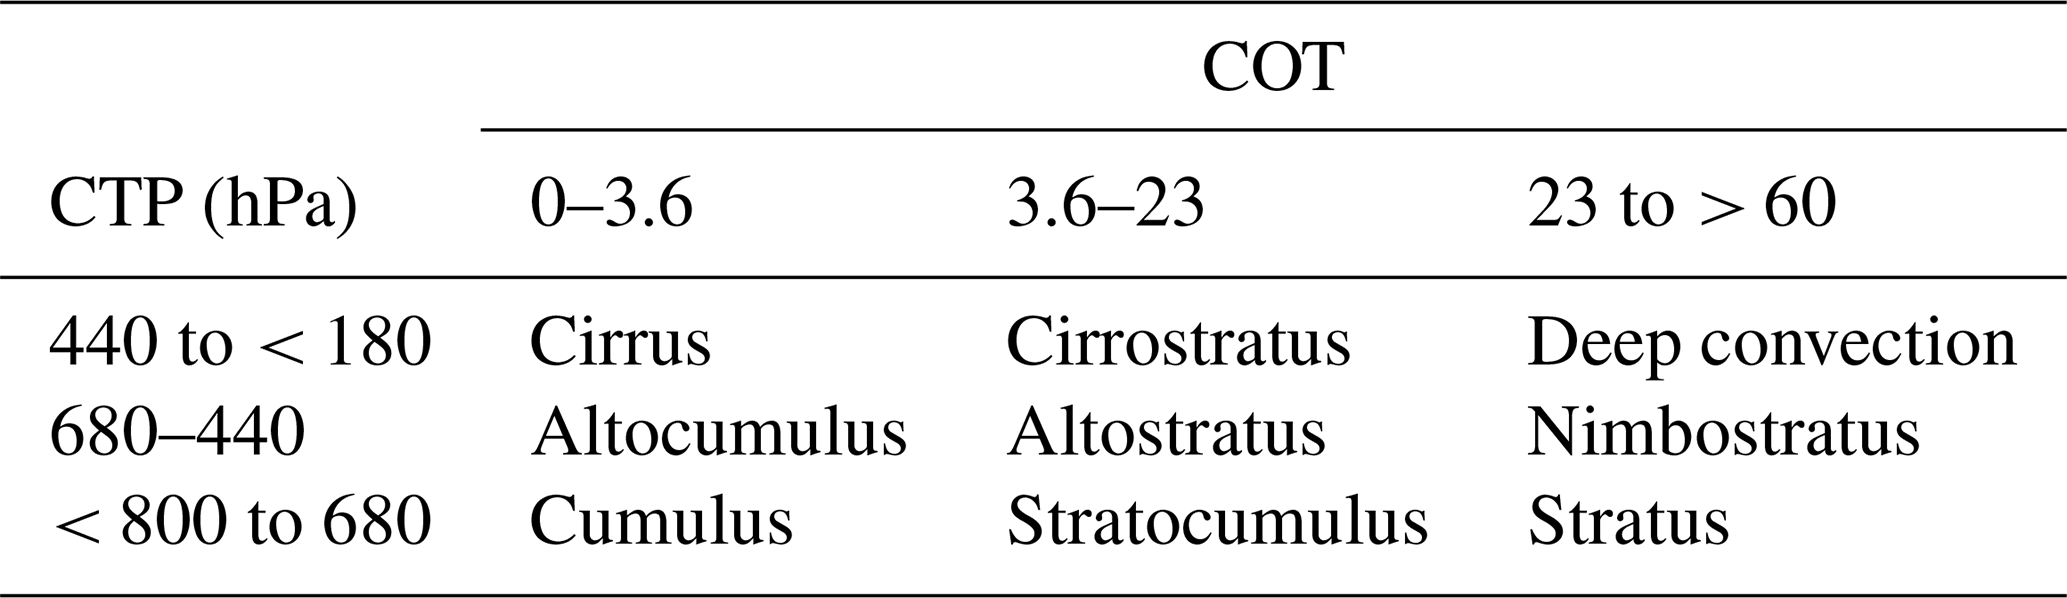
Table 3 shows the criteria adopted from previous papers (Rossow and Schiffer, 1999; Wyant et al., 2006; Sharma et al., 2023) for further classification of NPCs and PCs into different types of clouds. The aim of identifying the cloud types is to assess the cloud regimes and their vertical structure for a better understanding of ACPI. Following Table 3, Fig. 6 shows joint histograms of COT–CTP, displaying the median values of CF for nine different types of clouds. For a quick visual comparison, the cloud types are ordered from low- to high-level clouds. Also, for each histogram, the COT and CTP bins are located on the x and y axis, respectively. The CF of each bin is represented with the colored bar, with its value mentioned in the histograms, as shown in Fig. 6.
Table 3Classification of clouds based on CTP–COT joint histograms.

The results exhibit noticeable differences in the pattern of cloud regimes over all study areas. The diverse CF values are observed in the winter and summer seasons for NPCs and PCs over Karachi. In the winter season, only stratus NPCs (23 < COT < 60, 800 > CTP > 680 hPa) are dominant, with CF ∼ 0.9, while, in summer, high values of CF ∼ 0.9 for low- and intermediate-thickness high-level clouds such as cirrostratus NPCs (3.6 < COT < 23, 180 < CTP < 440 hPa) are observed. Similarly, the types of PCs in both summer and winter seasons that occurred with CF ∼ 1.0 include cirrus and cirrostratus. The relatively reduced value of CF for thick NPCs in winter and PCs in summer is attributed to the low values of AOD and high values of LTS. The results depicted slight differences and similarities in CF values for thick and thin NPCs, respectively, in the winter season for all areas except Karachi. In addition, the high-level PCs are identified in the two CTP bins (180 < CTP < 440 hPa) and (440 < CTP < 680 hPa) over all study areas. The formation of these similar types of PCs in winter is associated with the similarities in ω, LTS values, and aerosol concentration.
Likewise, in the summer season, the matrices of PCs and NPCs exhibit a wide range of cloud types. However, the CF values are comparatively high for PCs. Most of the identified PCs are formed in the two CTP bins (180 < CTP < 440 hPa) and (440 < CTP < 680 hPa), with CF values ranging from 0.8 to 1.0. The results suggest low values of CF for the low-lying thick NPCs over all study areas. Moreover, the results illustrate a more frequent occurrence of all three types of thick NPCs in one COT bin (23 < COT < 60) and all three types of high-level NPCs for CTP (180 < CTP < 440 hPa) over Delhi, Kanpur, and Gandhi College. Therefore, these are considered the cloudiest regimes. In addition, contrasting regional variations are also observed in PCs. The maximum CF values for all types of PCs are observed over Kanpur and Gandhi College. Similarly, relatively good values of CF in a COT bin (23 < COT < 60) and a CTP bin (180 < CTP < 440 hPa) over Lahore, Delhi, and Jaipur depict the frequent occurrence of thick and high-level PCs, respectively. In addition, among all the estimated low-level PCs, cumulus and stratocumulus exhibit good CF values (0.7) over Kanpur and Gandhi College. The formation of thick clouds can be attributed to the enhanced convection process due to atmospheric instability.
After estimating the cloud types, Fig. 7 shows the probability distribution function (PDF) of cloud microphysical properties for the identification of differences in the microstructure of NPCs and PCs in the summer and winter seasons. From the results, an approximately similar pattern is depicted for the CER of NPCs in winter. However, the clouds have high peaks of PDF for lower values of CDNC over Karachi. The low number of CDNC results in thin NPCs, as shown in Fig. 7. Similarly, Fig. 7c and g show the microstructure of NPCs in summer. The results indicate that, compared to CER values in winter, the probability of CER ≳ 15 µm is high in the summer season. However, the high peak for CER < 15 µm is observed over Karachi. Similarly, the CDNC shows a high probability for CDNC > 50 cm−3, with high PDF values over Karachi, where the lowest number of CDNC is observed over Lahore, indicating the formation of high-level thin NPCs in summer.
Figure 7b and f show the distribution pattern of CER and CDNC of PCs in the winter season. It is observed that the distribution of CER for PCs is like that for NPCs in the winter season. However, PDFs have peak values for relatively higher CDNC, which illustrates the occurrence of thick clouds. Figure 7d and h show the variations in CER and CDNC in the summer season. The results show a wider distribution for CER ≳ 15 µm and higher peaks for CDNC ≳ 50 cm−3, suggesting the formation of thick PCs, in summer as shown in Fig. 6.

Figure 7Probability density function (PDF) of precipitating clouds (PCs) and non-precipitating clouds (NPCs) in the winter and summer seasons.
3.4 Aerosol–cloud–precipitation interaction (ACPI)
In the following sections, ACPI is analyzed and discussed in detail for PCs and NPCs in the summer and winter seasons.
3.4.1 Aerosol effects on cloud properties
The impact of aerosols on CDNC and CER of PCs and NPCs is illustrated as scatter plots in Figs. 8–9. The quantification of the AOD–CER and AOD–CDNC relationships is demonstrated through detailed linear regressed slopes, regression coefficients (R2), and Pearson's correlation coefficient (R). The color bar represents the variations in LTS. The two-sample Student t test is carried out to analyze the AOD–CER and AOD–CDNC relationship in view of statistics. The results illustrate that the relationships are statistically significant at a 95 % (p < 0.05) significance level for all study areas. Figure 8 shows that in the winter season, the AOD–CER correlation is good for PCs and weak for NPCs. The results also show that the LTS values are higher for NPCs. The weak AOD–CER correlation may be linked to the inhibition of droplet growth due to less soluble aerosols, originating from biomass burning (Kang et al., 2015). In our case, all the selected study areas are among the most urbanized and industrialized areas of the IGP. Therefore, most of the prevailing aerosols are the less soluble soot and BC particles. That weakened activation of cloud droplets inhibits the formation of PCs and evaporates to higher altitudes, thereby increasing the droplet residence time (Kumar and Physics, 2013). In addition, the results show a contrasting pattern of LTS values. Although RH over Karachi (38.3 ± 9 %) is higher than over the other study areas (shown in Table 2), the negative AOD–CER correlation is observed over Karachi due to its coastal location, the low value of AOD, and the high level of LTS.
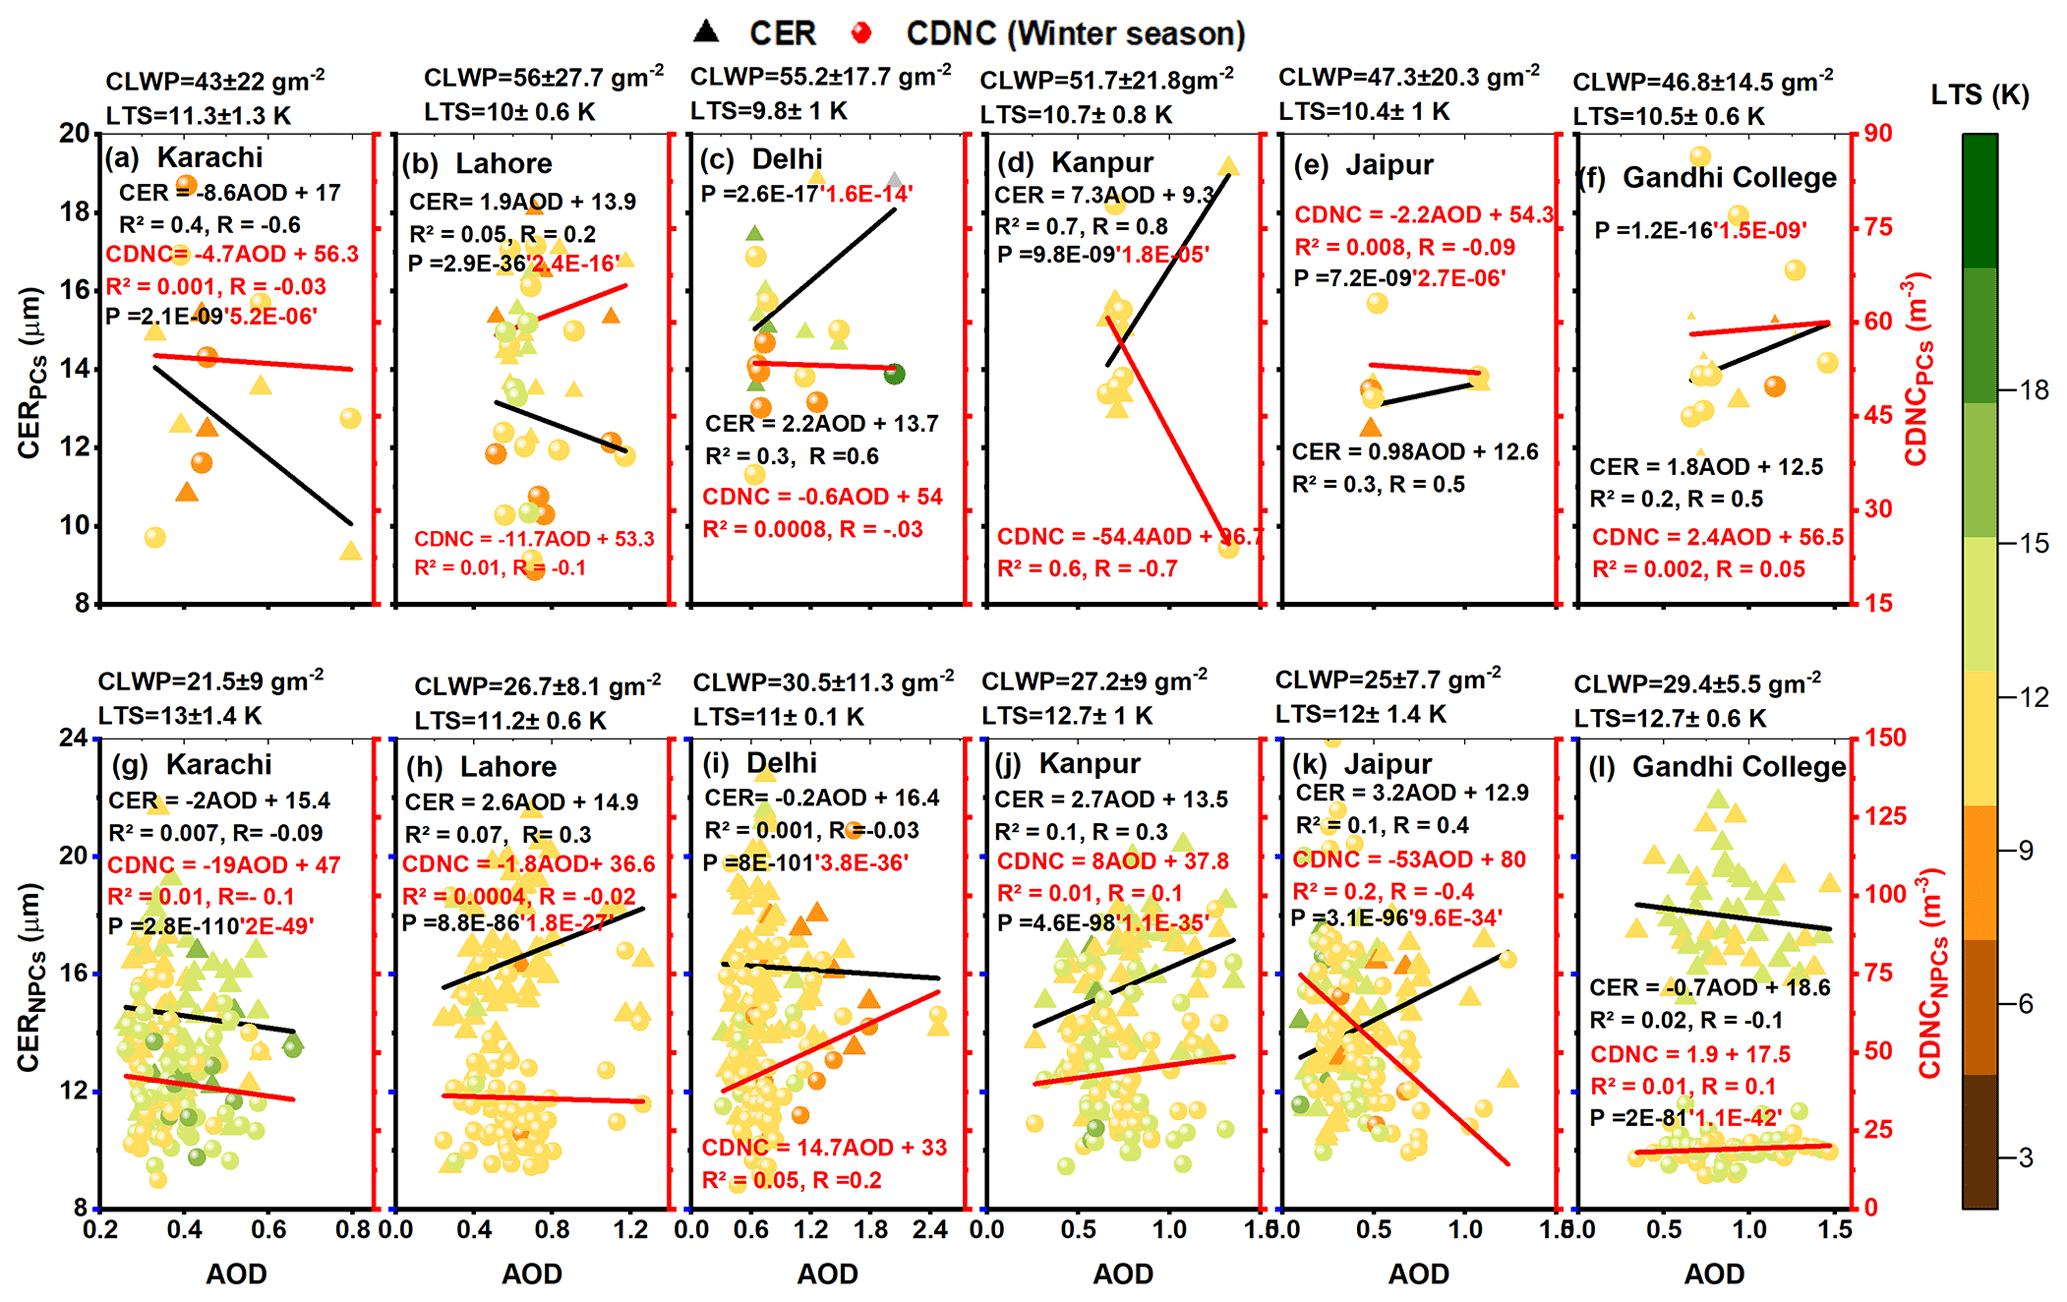
Figure 8AOD–CER and AOD–CDNC regression and correlation coefficient considered at a 95 % confidence level for PCs and NPCs over all study areas in the winter season.
Figure 9 illustrates the AOD–CER and AOD–CDNC correlation in the summer season. The results depict a more significant and positive AOD–CER correlation in the summer season than the winter season. Unlike the winter season, high LTS values are observed for PCs. Yuan (2008) associated the positive AOD–CER correlation with the soluble organic aerosols. Myhre et al. (2007) hypothesized that the positive AOD–CER correlation is a maximum for low CTP and a minimum for high CTP. Hence, in our study, referring to the approximated CF values shown in Fig. 6, the significant and positive AOD–CER correlation under unstable atmospheric conditions resulted in thick and high-level clouds. Furthermore, it is observed that CER and CDNC values for NPCs increase with increasing instability. Meanwhile, the enhanced process of droplet activation may result in large AOD, higher CER, and giant and fewer CCN (Yuan, 2008). Therefore, the weak correlation of AOD with CER and CDNC may be due to the anthropogenically ejected water-soluble organic aerosols and a lower number of CCN.
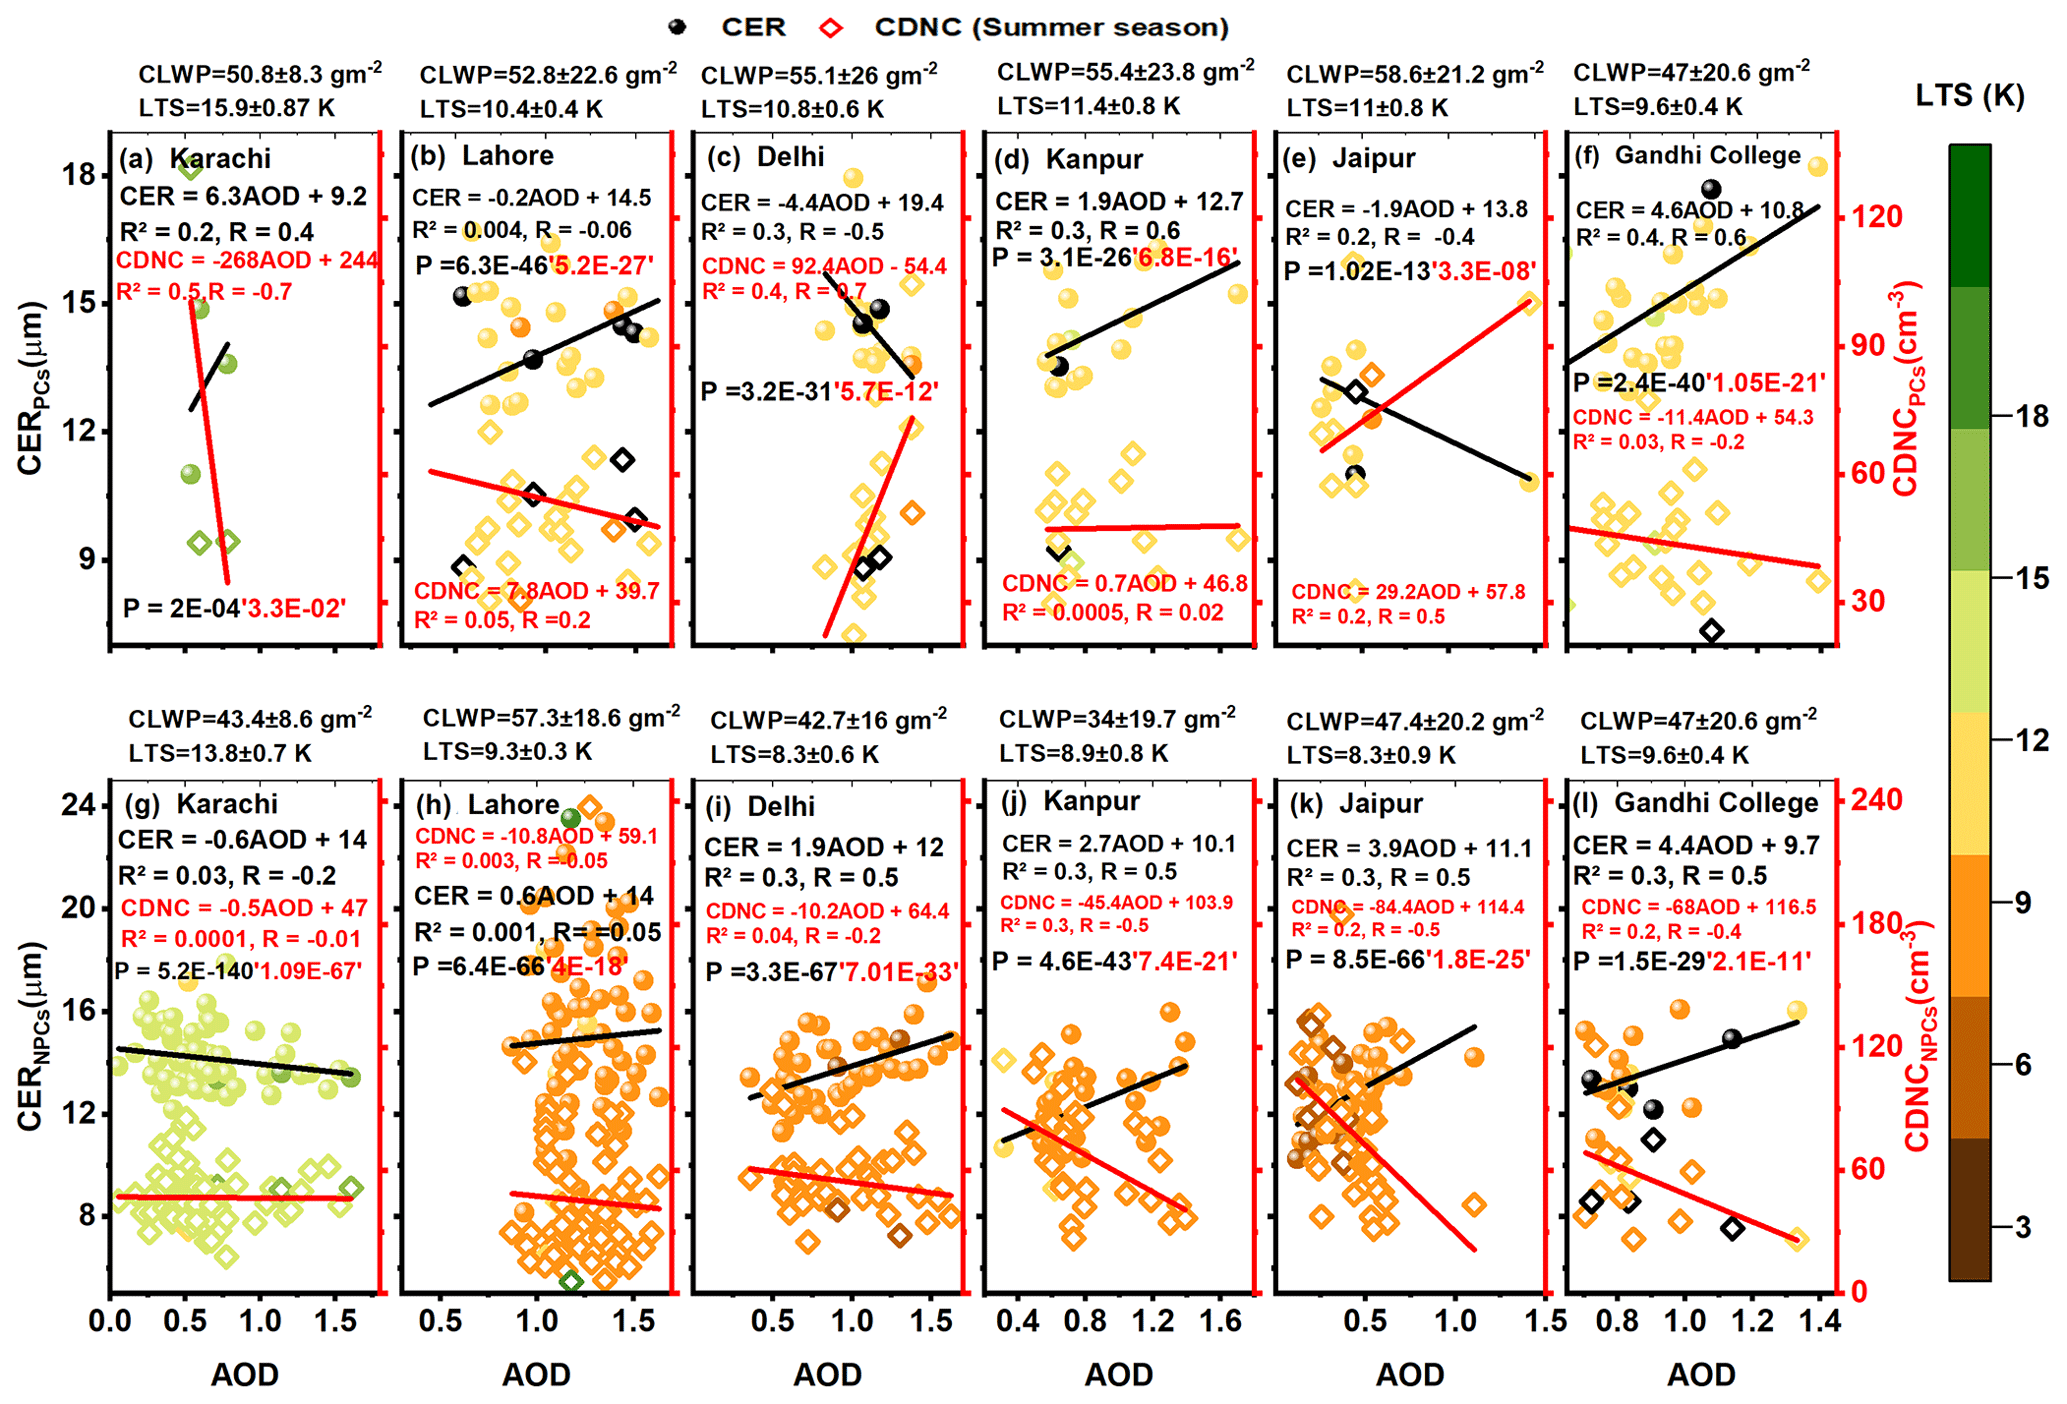
Figures S5 and S6 show the impact of AOD on CER and CDNC for PCs and NPCs in winter and summer, respectively. The results indicate a positive and weak AOD–CER correlation of 0.2, 0.07, and 0.004 for NPCs over Kolkata, Dhaka, and Patna, respectively, and for PCs (0.08) over both Kolkata and Patna. Similarly, a positive and weak AOD–CDNC correlation is observed over all areas for PCs. Likewise, Fig. S6 also illustrates a weak AOD–CER correlation of 0.06, 0.2, and 0.12 for both types of clouds in summer. As compared to other areas, the correlation analysis is less significant over Karachi, Kolkata, Dhaka, and Patna. This can be attributed to the persistence of diverse aerosol types influenced by their coastal locations, different meteorology, and the alternating inflow and outflow of easterly and westerly winds.
Recent advances in remote sensing have led to cost-effective solutions and an increase in available data at various temporal and spatial resolutions to bridge scientific gaps among different disciplines. While satellite-based retrievals have many advantages over in situ and ground-based measurement such as broader regional coverage and enhanced spatial resolution, they are still prone to considerable uncertainties, owing to the indirect nature of remote sensing, retrieval algorithms, thermal radiance, infrequency of satellite overpasses, and cloud top reflectance (Hong et al., 2006; Tian et al., 2010; Hossain et al., 2006). In our study, apart from the aforementioned factors contributing to the uncertainty, any residual cloud contamination could also lead to biased retrieval of AOD. Likewise, satellite-based retrievals for cloud properties are crucial to understanding the pivotal role of clouds in climate, and the role of clouds is still a dominant source of uncertainty in the prediction of climate change. These uncertainties in AOD and retrievals of cloud properties also propagate through the modeling process, potentially leading to less accurate climate predictions. Likewise, these uncertainties appeared to influence the findings in the current investigation. For instance, a limited correlation between AOD and CER is observed over Lahore, particularly in cloudier regimes, as depicted in Figs. 5–6. This contrasts with robust impacts documented in earlier studies (Michibata et al., 2014). However, a high sensitivity of SIE is observed for PCs, particularly in the winter season, indicating the delay in the onset of precipitation and more retention of clouds.
3.4.2 Seasonal variations in sensitivities of aerosol–cloud indirect effects and ACI
Figure 10 shows an assessment of four ACI sensitivities in terms of CDNC using daily mean values of MODIS observations available over the entire study area. Studying the effects of aerosols on co-located clouds is a challenging task due to the overestimation of thin clouds in AOD retrievals. Therefore, to minimize the propagation of AOD retrieval errors in ACI, the current study attempted to estimate the sensitivities of different cloud mechanisms to CDNC.

Figure 10The sensitivity matrices estimated for an aerosol–cloud relationship using CDNC are shown as follows: (a) FIE = (b) SIE = , (c) TIE = , and (d) ACI = . The error bars show the standard deviation (SD).
The sensitivity of CER to CDNC is assessed as a signature of FIE, as shown in Fig. 10a. The positive values illustrate that CER decreases with an increase in CDNC, revealing the occurrence of the Twomey effect, while the negative values depict the anti-Twomey effect. Tripathi et al. (2007) divided the IGP into four regions: the western, central, and eastern part of the IGP and the foothills of the Himalayas. Their results depicted a high concentration of dust in the western part and an increase in anthropogenic aerosols as one moves from the western to the eastern part of the IGP. Therefore, they attributed the resulting strong indirect effect in winter to the high concentration of regional anthropogenic pollution. However, in our case, the FIE is investigated for both PCs and NPCs in both seasons. The resulting approximations in the winter season show a strong (weak) sensitivity of FIE for PCs (NPCs). Similarly, the estimated sensitivity of FIE for all NPCs and PCs is also positive in the summer season. Figure S7a shows sensitivities for FIE in both seasons for PCs and NPCs. The results indicate high values of sensitivity FIE in the winter season, which is similar to the results for Karachi, Lahore, Delhi, and Kanpur, as shown in Fig. 10a. This is attributed to high levels of aerosol emission from residential heating and industrial activities. Furthermore, the results illustrate higher values of FIE in summer. This is attributed to the massive aerosol loading due to aerosol carried by winds and originating from anthropogenic activities and unstable meteorology.
Figure 10b illustrates the sensitivity of CLWP to CDNC as a proxy for the evaluation of the SIE or lifetime effect. The positive sensitivity estimated for all NPCs and PCs suggests that the CLWP increases with an increase in aerosol. Further, the results show that the sensitivity of SIE is stronger for PCs in winter, which indicates the delay in the onset of high PR. Similarly, the results show that the SIE sensitivity values are higher for PCs than for NPCs in the corresponding seasons. Therefore, the results depict that the lifetime of PCs is greater than NPCs. This is attributed to the high level of RH for PCs as shown in Table 2. Figure 10a and b show that the FIE sensitivities are weaker than SIE.
Figure 10c shows the TIE in terms of the sensitivity of the COT to CDNC. The results illustrate positive values of sensitivity for all NPCs and PCs, which indicate that the COT increases with an increase in aerosol concentration. The results also reveal that the sensitivity of TIE is a linear sum of the sensitivities of FIE and SIE. Further, the results also suggest that the variations in TIE sensitivity are largely dependent on SIE.
Figure 10d shows the sensitivity of CDNC to AOD as an estimation of ACI in terms of CDNC. The positive values show the increase in CDNC with the increase in AOD. Therefore, positive ACI reflects the inhibition of precipitation formation, whilst the negative values illustrate the decrease in CDNC and enhanced PR (Fan et al., 2019). The results depict relatively large and positive sensitivities for NPCs in winter over Lahore, Delhi, and Kanpur, which inhibit the onset of rainfall. The sensitivity of ACI for NPCs in summer is positive over Karachi and Lahore and negative over Delhi, Kanpur, Jaipur, and Gandhi College. Ackerman et al. (2004) associated the negative ACICDNC with the wet scavenging and mixing of air by entertainment. In our case, negative ACI may be due to the growth of CER and a decrease in CDNC with aerosol loading under unstable conditions (shown in Fig. 9). Further, the magnitude of sensitivity for PCs in summer is low. This can be due to droplet growth through collision coalescence and wet scavenging in thick clouds and the decreased dependency on CCN.
3.4.3 Aerosol effects on precipitation
Figure 11 shows the average values of PR in mm d−1 retrieved from TRMM. The results show an obvious seasonal difference in precipitation occurrence. The reason for the high (low) PR values is the suitable meteorological conditions, including high (low) LTS values for PCs in the summer (winter) season (shown in Figs. 8–9). The stable atmospheric condition with a high LTS value in winter serves to inhibit the convection process and have a significant impact on controlling the PR in winter (Zhao et al., 2006). Conversely, during the summer season, meteorological instability prevails with low LTS values, which result in high RH. This not only causes enhanced AOD due to the water uptake and results in swelled hydrophilic aerosols (Alam et al., 2010, 2011) but also affects the cloud and precipitation formation due to the enhanced evaporation and convection. Additionally, Figs. 8–9 also evidently and specifically show that during summer, the possible cause of positive AOD–CER correlation is the negative AOD–CDNC correlation under unstable meteorology over all areas except Karachi. As a result, Fig. 11 shows high (low) values of PR over all areas with a maximum over Gandhi College (Karachi). The results show a high (low) approximation of PR over Gandhi College (Karachi). We know that the rate of conversion of CDNC to precipitation is proportional to CER (Wolf and Toon, 2014). Therefore, the high PR values are due to the growth of bigger cloud droplets in summer. Further, apart from the reasons mentioned in the preceding sections, the other justification for the differently perturbed aerosols, clouds, and precipitation pattern over the study areas in summer is the entrance of southeast winds from the Bay of Bengal passing across Gandhi College to Delhi and Lahore and the entrance of the same winds from the Arabian Sea to Pakistan through Karachi (Anwar et al., 2022).
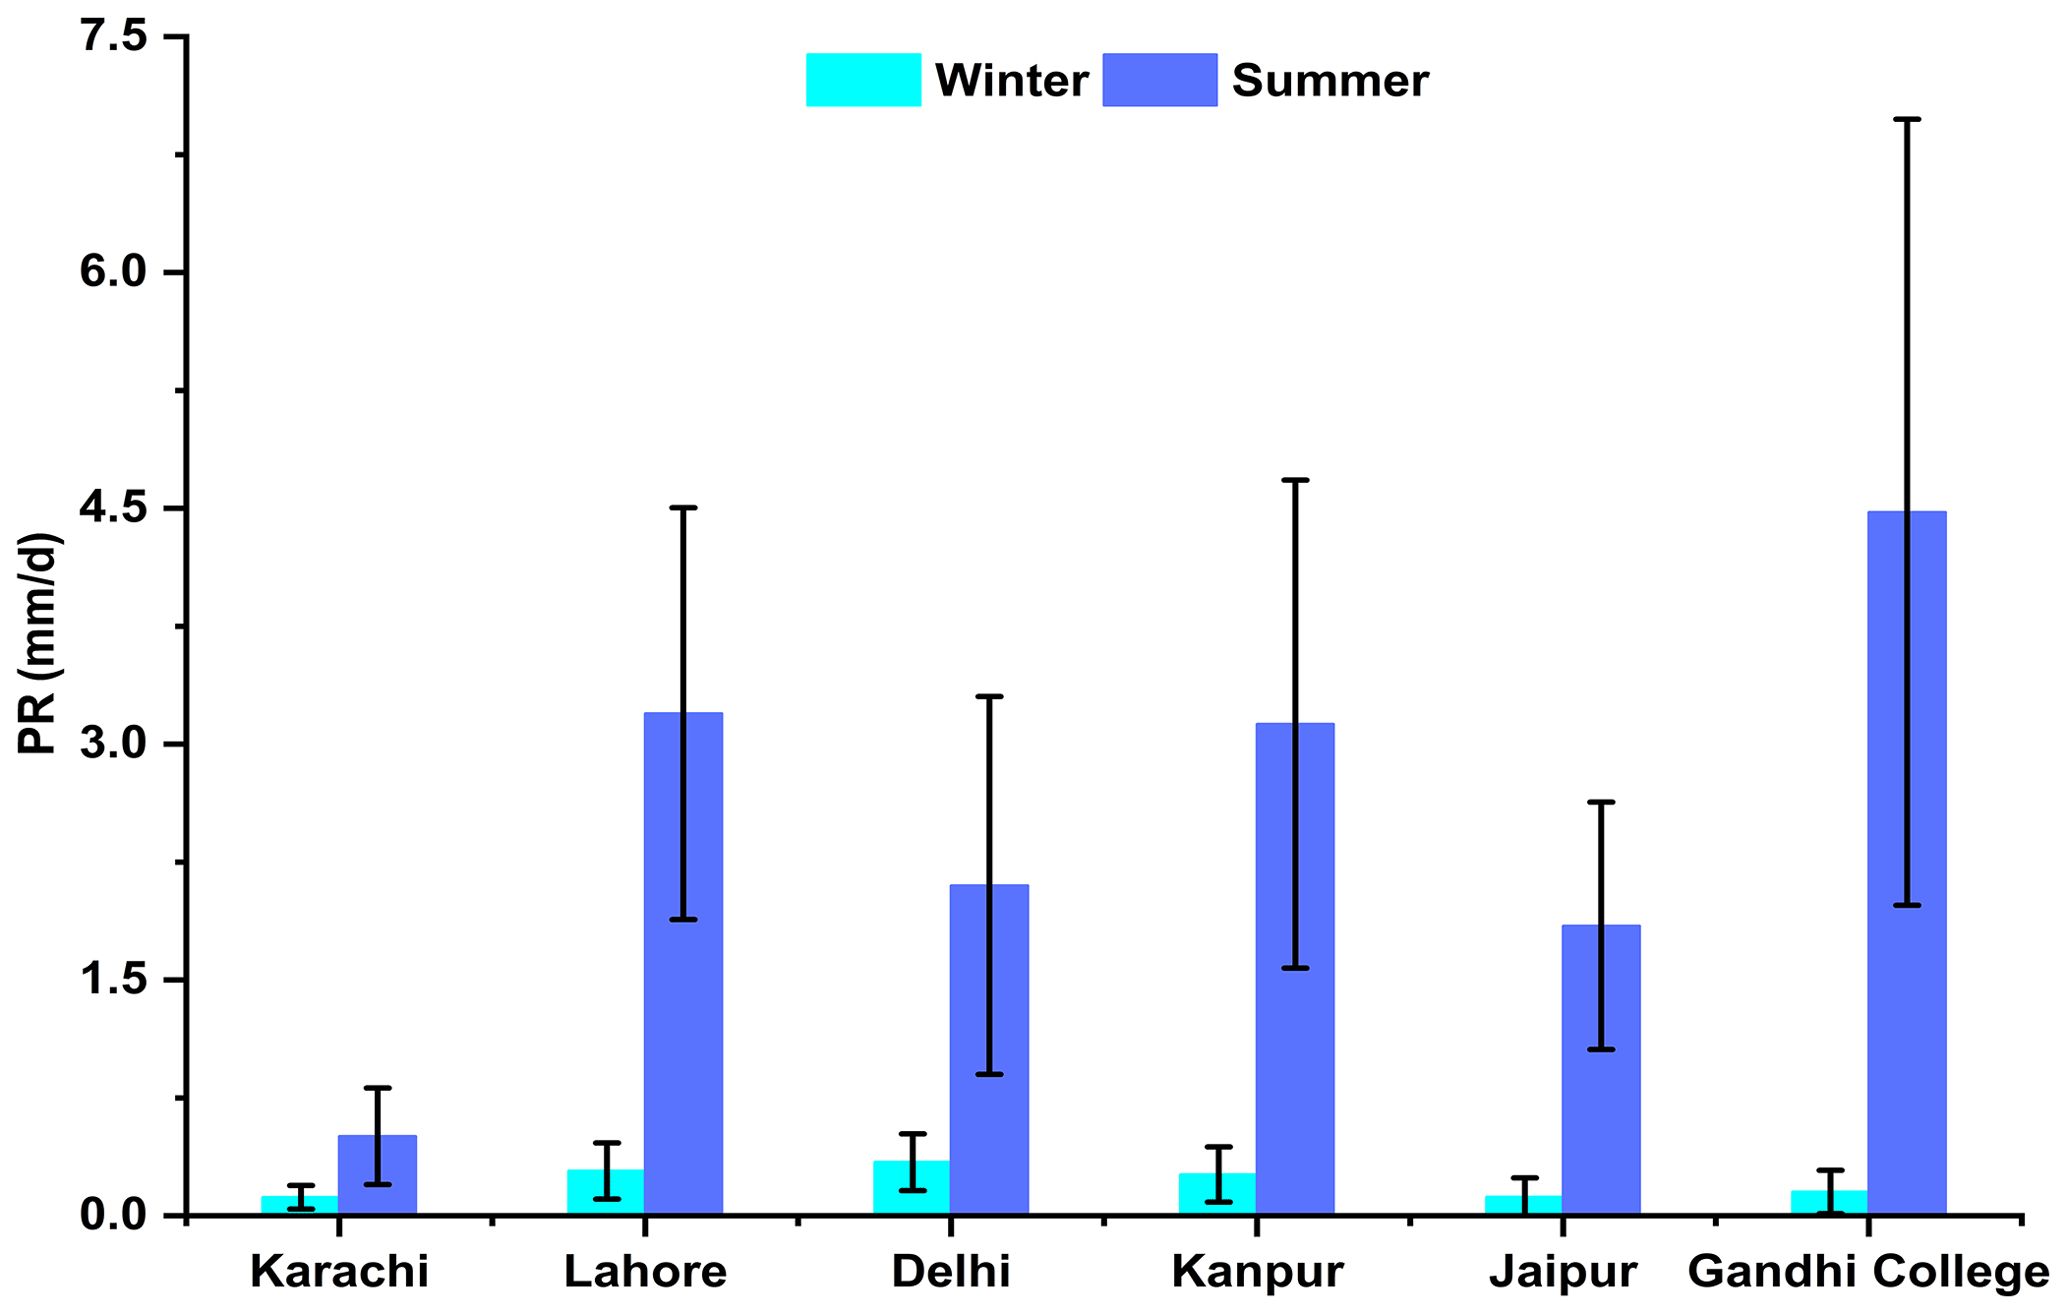
Figure 11Mean precipitation rate (PR) for the PCs in winter and summer season and SD values with a 95 % confidence interval.
Figure 12 shows scatter plots of PR versus CDNC. The plot is colored with the COT to examine the impact of CDNC on PR for similar macrophysics. When CDNC is lower, COTs are sparse, grow larger, form less reflective clouds, and precipitate faster (Kump and Pollard, 2008). The same phenomenon seems true in our case. The results illustrate high PR (0.0007 mm d−1) values for clouds with a COT ranging from 3 to 28 with CDNC ≲ 50 cm−3 and intermediate PR values for optically thick clouds and CDNC ≳ 50 cm−3 in both seasons.

Figure 12Scatter diagrams of PR (mm d−1) versus CDNC (cm−3) in summer and winter seasons. Color coding shows the COT of PCs.
Figure 13 shows the sensitivity (So) of PR to CDNC defined by So = for clouds of low and intermediate thickness, illustrated in Fig. 13a and b, respectively. However, sensitivity analysis for COT > 23 could not be performed due to the smaller number (0 to 04) of available samples. In the sensitivity equation, the minus sign shows the suppression of precipitation formation due to the increase in CDNC. Further, when So is positive, the correlation between PR and CDNC is negative; however, for negative So, PR and CDNC are positively correlated. The results show peak values of So, i.e., 0.7 ± 0.3, 0.6 ± 0.3, 0.5 ± 0.3, and 0.4 ± 0.4 over Jaipur, Delhi, Gandhi College, and Karachi, respectively, at intermediate values of the COT in winter, indicating the occurrence of lightly precipitating clouds. Referring to Fig. 13b, the low magnitude of So 0.2 ± 0.3 and 0.08 ± 0.2 over Kanpur and Lahore, respectively, is due to coagulation, whereby precipitation is less sensitive to CDNC.

Figure 13The sensitivity So of the precipitation rate (PR) for two COT bins is shown: (a) 0 ≤ COT ≤ 3.6 and (b) 3.6 ≤ COT ≤ 23.
In this study, the long-term (2001–2021) data retrievals from MODIS coupled with TRMM and NCEP/NCAR reanalysis-II datasets over the entire study area are compiled and analyzed for PCs and NPCs in the winter and summer season. The following are the main findings of this study.
A decadal decrease in AOD is observed over Karachi (−1.9 %) and Jaipur (−0.5 %). Meanwhile, AOD exhibits an increase over Lahore (5.2 %), Delhi (9 %), Kanpur (10.7 %), and Gandhi College (22.7 %). The LTS values are high (low) for NPCs (PCs) in winter and for PCs (NPCs) in the summer season. However, among all study areas, Karachi exhibits comparatively high LTS values in both seasons. In addition, the increase in RH for PCs ranged from 33 %–57 % in winter and from 25 %–45 % in summer. ω > 0 for all NPCs in winter and < 0 for PCs in both winter and summer seasons.
In the winter season, a low frequency of cloudy days over Karachi and a high frequency over Lahore and Gandhi College are estimated. Also, the high number of PCs is estimated only over Lahore. In the summer season, of the 74 % of cloudy days, 60 % are PCs over Gandhi College. Similarly, most of the clouds over Lahore, Delhi, and Jaipur are PCs. Conversely, the lowest number of PCs (6 %) is found over Karachi. The high-level PCs are identified in one CTP bin (180 < CTP < 440 hPa) over all study areas in winter. In the summer season, all three types of high-level and thick PCs have significant values of CF. The low-level PCs are identified as stratus clouds. Further, PDF values for CER ≳ 15 µm and CDNC ≳ 50 cm−3 for NPCs and PCs are high (low) in summer (winter) over all areas except Karachi.
The AOD–CER correlation is good for PCs and weak for NPCs in the winter season. Also, the CER and CDNC values increase with the increase in LTS. The sensitivity value of FIE is high (low) for PCs (NPCs) in winter. Further, the magnitude of sensitivity of FIE (SIE) is low (high). Also, the sensitivity of TIE is a linear sum of the sensitivities of FIE and SIE. Further, ACI sensitivity values for PCs in summer are small, illustrating less dependency of CER on CDNC in thick clouds.
High (low) PR values are observed in summer (winter). Further, high PR values for comparatively thin clouds with fewer CDNC ≲ 50 cm−3 and intermediate for optically thick clouds and CDNC ≳ 50 cm−3 are observed. Sensitivity values are small (high) for thick clouds in summer (winter).
Being one of the major source regions of anthropogenic aerosols across the globe, the IGP offers interesting insights into the study of ACPI coupled with aerosol indirect effects. This study demonstrates that the aerosol–cloud relationship exhibits different behavior under different meteorological conditions, at coastal and inland locations. Thus, compared to other study areas, the stable atmospheric conditions due to the constant sea breeze weakened the ACI over Karachi, which resulted in a smaller number of CDNC, NPCs, and PCs. Further, our study also provides a very good platform for the detailed analysis of sensitivity tests of aerosol indirect effects and precipitation formation.
Although the sample size limits the study, the observed trends offer important insights that provide a foundation for future research. Therefore, further investigations with larger sample sizes are suggested to validate and extend these findings.
Limitations and future recommendations
Although the current study is as thorough as possible, it has its limitations due to the topographical complexity of the IGP, the lack of in situ measuring instruments in Pakistan, and the intrinsic uncertainties associated with satellite-based data. Therefore, simulations of ground-based measurements, along with satellite-based retrievals and calculation of cloud properties and CCN by different Community Atmosphere Model (CAM) and Weather Research and Forecasting (WRF) models, are recommended for deeper insight into the various mechanisms of ACPI over the IGP.
The MODIS and TRMM data can be obtained from the NASA Goddard Earth Sciences Data and Information Services Center (GES DISC) and are accessible via https://modis.gsfc.nasa.gov/data/ (NASA, 2022b) and https://gpm.nasa.gov/data (NASA, 2022a). The meteorological parameters are from National Center for Environmental Prediction/National Center for Atmospheric Research (NCEP/NCAR) reanalysis-II datasets and are available at https://psl.noaa.gov/data/gridded/data.ncep.reanalysis2.html (NOAA Physical Sciences Laboratory, 2022). The processed data used in this work are available on reasonable request from the corresponding author.
The supplement related to this article is available online at: https://doi.org/10.5194/acp-24-11333-2024-supplement.
NG processed and analyzed the data and wrote the original draft of the manuscript. KA proposed the idea, supervised this work, and revised the manuscript. YL helped in revising the manuscript.
The contact author has declared that none of the authors has any competing interests.
Publisher’s note: Copernicus Publications remains neutral with regard to jurisdictional claims made in the text, published maps, institutional affiliations, or any other geographical representation in this paper. While Copernicus Publications makes every effort to include appropriate place names, the final responsibility lies with the authors.
The authors gratefully acknowledge the NASA Goddard Earth Sciences Data and Information Services Center (GES DISC) for the provision of freely available data retrieved from MODIS and TRMM. We are also grateful to the NOAA Physical Sciences Laboratory (PSL) for free accessibility to NCEP/NCAR reanalysis-II datasets.
This paper was edited by Jianping Huang and reviewed by three anonymous referees.
Ackerman, A. S., Kirkpatrick, M. P., Stevens, D. E., and Toon, O. B.: The impact of humidity above stratiform clouds on indirect aerosol climate forcing, Nature, 432, 1014–1017, https://doi.org/10.1038/nature03174, 2004.
Alam, K., Iqbal, M. J., Blaschke, T., Qureshi, S., and Khan, G.: Monitoring spatio-temporal variations in aerosols and aerosol–cloud interactions over Pakistan using MODIS data, Adv. Space Res., 46, 1162–1176, https://doi.org/10.1016/j.asr.2010.06.025, 2010.
Alam, K., Qureshi, S., and Blaschke, T.: Monitoring spatio-temporal aerosol patterns over Pakistan based on MODIS, TOMS and MISR satellite data and a HYSPLIT model, Atmos. Environ., 45, 4641–4651, https://doi.org/10.1016/j.atmosenv.2011.05.055, 2011.
Albrecht, B. A.: Aerosols, cloud microphysics, and fractional cloudiness, Science, 245, 1227–1230, https://doi.org/10.1126/science.245.4923.1227, 1989.
Ali, G., Bao, Y., Ullah, W., Ullah, S., Guan, Q., Liu, X., Li, L., Lei, Y., Li, G., and Ma, J.: Spatiotemporal trends of aerosols over urban regions in Pakistan and their possible links to meteorological parameters, Atmosphere, 11, 306, https://doi.org/10.3390/atmos11030306, 2020.
Andreae, M. and Rosenfeld, D.: Aerosol–cloud–precipitation interactions. Part 1. The nature and sources of cloud-active aerosols, Earth-Sci. Rev., 89, 13–41, https://doi.org/10.1016/j.earscirev.2008.03.001, 2008.
Anwar, K., Alam, K., Liu, Y., Huang, Z., Huang, J., and Liu, Y.: Analysis of aerosol cloud interactions with a consistent signal of meteorology and other influencing parameters, Atmos. Res., 275, 106241, https://doi.org/10.1016/j.atmosres.2022.106241, 2022.
Brenguier, J. L.: Parameterization of the condensation process: A theoretical approach, J. Atmos. Sci., 48, 264–282, 1991.
Brenguier, J.-L., Pawlowska, H., Schüller, L., Preusker, R., Fischer, J., and Fouquart, Y.: Radiative properties of boundary layer clouds: Droplet effective radius versus number concentration, Atmos. Sci., 57, 803–821, https://doi.org/10.1175/1520-0469(2000)057<0803:RPOBLC>2.0.CO;2, 2000.
Chen, F., Sheng, S., Bao, Z., Wen, H., Hua, L., Paul, N. J., and Fu, Y. : Precipitation Clouds Delineation Scheme in Tropical Cyclones and Its Validation Using Precipitation and Cloud Parameter Datasets from TRMM, Appl. Meteorol. Clim., 57, 821-836, https://doi.org/10.1175/JAMC-D-17-0157.1, 2018.
Chen, Q., Yin, Y., Jin, L.-J., Xiao, H., and Zhu, S.: The effect of aerosol layers on convective cloud microphysics and precipitation, Atmos. Res., 101, 327–340, https://doi.org/10.1016/j.atmosres.2011.03.007, 2011
Costantino, L. and Bréon, F.-M.: Analysis of aerosol-cloud interaction from multi-sensor satellite observations, Geophys. Res. Lett., 37, L11801, https://doi.org/10.1029/2009GL041828, 2010.
Dahal, S., Rupakheti, D., Sharma, R. K., Bhattarai, B. K., and Adhikary, B.: Aerosols over the Foothills of the Eastern Himalayan Region during Post-monsoon and Winter Seasons, Aerosol Air Qual. Res., 22, 210152, https://doi.org/10.4209/aaqr.210152, 2022.
Fan, C., Ding, M., Wu, P., and Fan, Y.: The Relationship between Precipitation and Aerosol: Evidence from Satellite Observation, arXiv [preprint], https://doi.org/10.48550/arXiv.1812.02036, 4 February 2019.
Feingold, G., Eberhard, W. L., Veron, D. E., and Previdi, M.: First measurements of the Twomey indirect effect using ground-based remote sensors, Geophys. Res. Lett., 30, 1287, https://doi.org/10.1029/2002GL016633, 2003.
Gryspeerdt, E., Quaas, J., and Bellouin, N.: Constraining the aerosol influence on cloud fraction, J. Geophys. Res.-Atmos., 121, 3566–3583, https://doi.org/10.1002/2015JD023744, 2016.
Guo, J., Su, T., Chen, D., Wang, J., Li, Z., Lv, Y., and Zhai, P.: Declining summertime local-scale precipitation frequency over China and the United States, 1981–2012: The disparate roles of aerosols, Geophy. Res. Lett., 46, 13281–13289, https://doi.org/10.1029/2019GL085442, 2019.
Hassan, M. A., Mehmood, T., Liu, J., Luo, X., Li, X., Tanveer, M., and Abid, M.: A review of particulate pollution over Himalaya region: Characteristics and salient factors contributing ambient PM pollution, Atmos. Environ., 294, 119472, https://doi.org/10.1016/j.atmosenv.2022.119472, 2002.
Hong, Y., Hsu, K. L., Moradkhani, H., and Sorooshian, S.: Uncertainty quantification of satellite precipitation estimation and Monte Carlo assessment of the error propagation into hydrologic response, Water Resour. Res., 42, W08421, https://doi.org/10.1029/2005WR004398, 2006.
Hossain, F., Anagnostou, E. N., and Bagtzoglou, A.: On Latin Hypercube sampling for efficient uncertainty estimation of satellite rainfall observations in flood prediction, Comput. Geosci., 32, 776–792, https://doi.org/10.1016/j.cageo.2005.10.006, 2006.
Houze Jr., R. A. Nimbostratus and the separation of convective and stratiform precipitation, in: International geophysics, Elsevier, 104, 141–163, 2014.
Jiang, H., Feingold, G., and Cotton, W.: Simulations of aerosol-cloud-dynamical feedbacks resulting from entrainment of aerosol into the marine boundary layer during the Atlantic Stratocumulus Transition Experiment, J. Geophys. Res.-Atmos., 107, AAC 20-1–AAC 20-11, https://doi.org/10.1029/2001JD001502, 2002.
Kang, N., Kumar, K. R., Yin, Y., Diao, Y., and Yu, X.: Correlation analysis between AOD and cloud parameters to study their relationship over China using MODIS data (2003–2013): impact on cloud formation and climate change, Aerosol Air Qual. Res., 15, 958–973, https://doi.org/10.4209/aaqr.2014.08.0168, 2015.
Kaskaoutis, D. G., Kumar Kharol, S., Sinha, P. R., Singh, R. P., Kambezidis, H. D., Rani Sharma, A., and Badarinath, K. V. S.: Extremely large anthropogenic-aerosol contribution to total aerosol load over the Bay of Bengal during winter season, Atmos. Chem. Phys., 11, 7097–7117, https://doi.org/10.5194/acp-11-7097-2011, 2011.
Kedia, S., Ramachandran, S., Holben, B., and Tripathi, S.: Quantification of aerosol type, and sources of aerosols over the Indo-Gangetic Plain, Atmos. Environ., 98, 607–619, https://doi.org/10.1016/j.atmosenv.2014.09.022, 2014.
Koike, M., Asano, N., Nakamura, H., Sakai, S., Nagao, T., and Nakajima, T.: Modulations of aerosol impacts on cloud microphysics induced by the warm Kuroshio Current under the East Asian winter monsoon, J. Geophys. Res.-Atmos., 121, 282–297, https://doi.org/10.1002/2016JD025375, 2016.
Koren, I., Kaufman, Y. J., Remer, L. A., and Martins, J. V.: Measurement of the effect of Amazon smoke on inhibition of cloud formation, Science, 303, 1342–1345, https://doi.org/10.1126/science.1089424, 2004.
Kubar, T., Hartmann, D., and Wood, R.: Understanding the importance of microphysics and macrophysics for warm rain in marine low clouds. Part I: Satellite observations, Atmos. Sci., 66, 2953–2972, https://doi.org/10.1175/2009jas3071.1, 2009.
Kumar, A. and Physics, S.: Variability of aerosol optical depth and cloud parameters over North Eastern regions of India retrieved from MODIS satellite data, Atmos. Sol.-Terr. Phy., 100, 34–49, https://doi.org/10.1016/j.jastp.2013.03.025, 2013.
Kump, L. R. and Pollard, D.: Amplification of Cretaceous Warmth by Biological Cloud Feedbacks, Science, 320, 195–195, https://doi.org/10.1126/science.1153883, 2008.
Leena, P. P., Anilkumar, V., Sravanthi, N., Patil, R., Chakravarty, K., Saha, S. K., and Pandithurai, G.: On the precipitation susceptibility of monsoon clouds to aerosols using high-altitude ground-based observations over Western Ghats, India, Atmos. Environ., 185, 128–136, https://doi.org/10.1016/j.atmosenv.2018.05.001, 2018.
Li, J., Lv, Q., Zhang, M., Wang, T., Kawamoto, K., Chen, S., and Zhang, B.: Effects of atmospheric dynamics and aerosols on the fraction of supercooled water clouds, Atmos. Chem. Phys., 17, 1847–1863, https://doi.org/10.5194/acp-17-1847-2017, 2017.
López-Romero, J. M., Montávez, J. P., Jerez, S., Lorente-Plazas, R., Palacios-Peña, L., and Jiménez-Guerrero, P.: Precipitation response to aerosol–radiation and aerosol–cloud interactions in regional climate simulations over Europe, Atmos. Chem. Phys., 21, 415–430, https://doi.org/10.5194/acp-21-415-2021, 2021.
Masmoudi, M., Chaabane, M., Tanré, D., Gouloup, P., Blarel, L., and Elleuch, F.: Spatial and temporal variability of aerosol: size distribution and optical properties, Atmos. Res., 66, 1–19, https://doi.org/10.1016/S0169-8095(02)00174-6, 2003.
Michibata, T., Kawamoto, K., and Takemura, T.: The effects of aerosols on water cloud microphysics and macrophysics based on satellite-retrieved data over East Asia and the North Pacific, Atmos. Chem. Phys., 14, 11935–11948, https://doi.org/10.5194/acp-14-11935-2014, 2014.
Myhre, G., Stordal, F., Johnsrud, M., Kaufman, Y. J., Rosenfeld, D., Storelvmo, T., Kristjansson, J. E., Berntsen, T. K., Myhre, A., and Isaksen, I. S. A.: Aerosol-cloud interaction inferred from MODIS satellite data and global aerosol models, Atmos. Chem. Phys., 7, 3081–3101, https://doi.org/10.5194/acp-7-3081-2007, 2007.
Nair, V. S., Giorgi, F., and Keshav Hasyagar, U.: Amplification of South Asian haze by water vapour–aerosol interactions, Atmos. Chem. Phys., 20, 14457–14471, https://doi.org/10.5194/acp-20-14457-2020, 2020.
NASA: GPM and TRMM Data, https://gpm.nasa.gov/data (last access: 29 September 2022), 2022a.
NASA: MODIS data, https://modis.gsfc.nasa.gov/data/ (last access: 29 September 2022), 2022b.
Naud, C., Posselt, D., and van den Heever, S.: Observed covariations of aerosol optical depth and cloud cover in extratropical cyclones, J. Geophys. Res.-Atmos., 122, 10338–10356, https://doi.org/10.1002/2017JD027240, 2017.
NOAA Physical Sciences Laboratory: NCEP/DOE Reanalysis II datasets, https://psl.noaa.gov/data/gridded/data.ncep.reanalysis2.html (last access: 10 September 2022), 2022.
Purdy, A. J., Fisher, J. B., Goulden, M. L., and Famiglietti, J. S.: Ground heat flux: An analytical review of 6 models evaluated at 88 sites and globally, J. Geophys. Res. Biogeosci., 121, 3045–3059, https://doi.org/10.1002/2016JG003591, 2016.
Rossow, W. and Schiffer, R.: Advances in understanding clouds from ISCCP, B. Am.. Meteorol. Soc., 80, 2261–2288, https://doi.org/10.1175/1520-0477(1999)080<2261:AIUCFI>2.0.CO;2, 1999.
Sharma, P., Ganguly, D., Sharma, A., Kant, S., and Mishra, S.: Assessing the aerosols, clouds and their relationship over the northern Bay of Bengal using a global climate model, Earth. Space Sci., 10, e2022EA002706, https://doi.org/10.1029/2022EA002706, 2023.
Sherwood, S., Roca, R., Weckwerth, T., and Andronova, N.: Tropospheric water vapor, convection, and climate, Rev. Geophys., 48, RG2001, https://doi.org/10.1029/2009RG000301, 2010.
Singh, A., Rastogi, N., Sharma, D., and Singh, D.: Inter and intra-annual variability in aerosol characteristics over northwestern Indo-Gangetic Plain, Aerosol Air Qual. Res., 15, 376–386, https://doi.org/10.4209/aaqr.2014.04.0080, 2015.
Srivastava, P., Pal, D., Aruche, K., Wani, S., and Sahrawat, K.: Soils of the Indo-Gangetic Plains: a pedogenic response to landscape stability, climatic variability and anthropogenic activity during the Holocene, Earth. Sci. Rev., 140, 54–71, https://doi.org/10.1016/j.earscirev.2014.10.010, 2015.
Stevens, B. and Feingold, G.: Untangling aerosol effects on clouds and precipitation in a buffered system, Nature, 461, 607–613, https://doi.org/10.1038/nature08281, 2009.
Sun, J. and Ariya, P.: Atmospheric organic and bio-aerosols as cloud condensation nuclei (CCN): A review, Atmos. Environ., 40, 795–820, https://doi.org/10.1016/j.atmosenv.2005.05.052, 2006.
Tao, W., Chen, J., Li, Z., Wang, C., and Zhang, C.: Impact of aerosols on convective clouds and precipitation, Rev. Geophys., 50, RG2001, https://doi.org/10.1029/2011RG000369, 2012.
Thomas, A., Kanawade, V., Sarangi, C., and Srivastava, A.: Effect of COVID-19 shutdown on aerosol direct radiative forcing over the Indo-Gangetic Plain outflow region of the Bay of Bengal, Sci. Total Environ., 782, 146918, https://doi.org/10.1016/j.scitotenv.2021.146918, 2021.
Tian, Y. and Peters-Lidard, C.: A global map of uncertainties in satellite-based precipitation measurements, Geophys. Res. Lett., 37, L24407, https://doi.org/10.1029/2010GL046008, 2010.
Tripathi, S. N., Pattnaik, A., and Dey, S.: Aerosol indirect effect over Indo-Gangetic plain, Atmos. Environ., 41, 7037–7047, https://doi.org/10.1016/j.atmosenv.2007.05.007, 2007.
Twomey, S.: The influence of pollution on the shortwave albedo of clouds, Atmos. Sci., 34, 1149–1152, https://doi.org/10.1175/1520-0469(1977)034<1149:TIOPOT>2.0.CO;2, 1977.
Verma, S., Ramana, M., and Kumar, R.: Atmospheric rivers fueling the intensification of fog and haze over Indo-Gangetic Plains, Sci. Rep.-UK, 12, 5139, https://doi.org/10.1038/s41598-022-09206-9, 2022.
Wang, F., Guo, J., Zhang, J., Huang, J., Min, M., Chen, T., and Li, X.: Multi-sensor quantification of aerosol-induced variability in warm clouds over eastern China, Atmos. Environ., 113, 1–9, https://doi.org/10.1016/j.atmosenv.2015.04.063, 2015.
Wolf, E. and Toon, O.: Controls on the Archean climate system investigated with a global climate model, Astrobiology, 14, 241–253, https://doi.org/10.1089/ast.2013.1112, 2014.
Wu, P., Dong, X., Xi, B., Liu, Y., Thieman, M., and Minnis, P.: Effects of environment forcing on marine boundary layer cloud-drizzle processes, J. Geophys. Res.-Atmos., 122, 4463–4478, https://doi.org/10.1002/2016JD026326, 2017.
Wyant, M., Bretherton, C., Bacmeister, J., Kiehl, J., Held, I., Zhao, M., and Soden, B.: A comparison of low-latitude cloud properties and their response to climate change in three AGCMs sorted into regimes using mid-tropospheric vertical velocity, Clim. Dynam., 27, 261–279, https://doi.org/10.1007/s00382-006-0138-4, 2006.
Yuan, T.: Increase of cloud droplet size with aerosol optical depth: An observation and modeling study, J. Geophys. Res.-Atmos., 113, D04201, https://doi.org/10.1029/2007JD008632, 2008.
Yang, Y. R., Liu, X. G., Qu, Y., An, J. L., Jiang, R., Zhang, Y. H., Sun, Y. L., Wu, Z. J., Zhang, F., Xu, W. Q., and Ma, Q. X.: Characteristics and formation mechanism of continuous hazes in China: a case study during the autumn of 2014 in the North China Plain, Atmos. Chem. Phys., 15, 8165–8178, https://doi.org/10.5194/acp-15-8165-2015, 2015.
Zeb, B., Alam, K., Sorooshian, A., Chishtie, F., Ahmad, I., and Bibi, H.: Temporal characteristics of aerosol optical properties over the glacier region of northern Pakistan, J. Atmos. Sol.-Terr. Phy., 186, 35–46, https://doi.org/10.1016/j.jastp.2019.02.004, 2019.
Zhao, C., Tie, X., and Lin, Y.: A possible positive feedback of reduction of precipitation and increase in aerosols over eastern central China, Geophys. Res. Lett., 33, L11814, https://doi.org/10.1029/2006GL025959, 2006.
Zhao, X., Liu, Y., Yu, F., and Heidinger, A. K.: Using long‐term satellite observations to identify sensitive regimes and active regions of aerosol indirect effects for liquid clouds over global oceans, J. Geophys. Res., 123, 457–472, https://doi.org/10.1002/2017JD027187, 2018.
Zhou, S., Yang, J., Wang, W.-C., Zhao, C., Gong, D., and Shi, P.: An observational study of the effects of aerosols on diurnal variation of heavy rainfall and associated clouds over Beijing–Tianjin–Hebei, Atmos. Chem. Phys., 20, 5211–5229, https://doi.org/10.5194/acp-20-5211-2020, 2020.
Zhu, Y., Rosenfeld, D., and Li, Z.: Under what conditions can we trust retrieved cloud drop concentrations in broken marine stratocumulus?, J. Geophys. Res., 123, 8754–8767, https://doi.org/10.1029/2017JD028083, 2018.