the Creative Commons Attribution 4.0 License.
the Creative Commons Attribution 4.0 License.
 | 07 Oct 2024
Dominant influence of biomass combustion and cross-border transport on nitrogen-containing organic compound levels in the southeastern Tibetan Plateau
Meng Wang
Qiyuan Wang
Steven Sai Hang Ho
Jie Tian
Yong Zhang
Shun-cheng Lee
Junji Cao
The Tibetan Plateau (TP) is highly susceptible to climate change, and nitrogen-containing organic compounds (NOCs) in fine particulate matter (PM2.5) represent one of the largest uncertainties with respect to their impact on the climate in high-altitude areas. Previous studies have shown that NOCs play a vital role in the nitrogen budget of PM2.5. However, our understanding of the composition and sources of NOCs in PM2.5, particularly in the TP, is limited. Here, we aim to enhance our understanding of NOCs in the TP region by examining their identification, concentration levels, sources, and origins. We conducted field sampling at a regional background sampling site in Gaomeigu, in the southeastern margin of the TP from 11 March to 13 May 2017, followed by laboratory analysis of the NOCs collected on the filters. The daily mass concentrations of NOCs ranged from 714.4 to 3887.1 ng m−3, with an average of 2119.4 ± 875.0 ng m−3 during the campaign. This average concentration was approximately 40 % higher than that reported at a typical regional site in the North China Plain (NCP), highlighting a more significant presence of NOCs in the Tibetan area. Biomass burning and secondary sources were identified as the major contributors to total NOCs. This was further substantiated by a regional air quality model, which indicated that over 80 % of the aerosol in the southeast of the TP originated from neighboring countries. This study improves our understanding of NOCs' contribution to PM2.5 in the TP and their potential impacts on climate stability in high-altitude areas.
- Article
(3356 KB) - Full-text XML
-
Supplement
(1283 KB) - BibTeX
- EndNote


The Tibetan Plateau (TP), located near densely populated and industrialized regions, is particularly susceptible to climate change (Meng et al., 2013; Duo et al., 2015; Li et al., 2015; Yuan et al., 2016; Zhao et al., 2022). The dry season features prevalent natural forest fires and anthropogenic burning activities, such as the combustion of agricultural residues, leading to substantial emissions of atmospheric pollutants (Zhao et al., 2015; Ran et al., 2022; Arun et al., 2021). Consequently, aerosol concentrations in the TP, especially during the pre-monsoon period, have risen markedly (Han et al., 2020). Previous studies in the Tibetan region have mainly focused on carbonaceous organic aerosols (OAs), with nitrogen-containing organic compounds (NOCs) garnering less focus (Zhang et al., 2020, 2019; Chen et al., 2014). NOCs play an important role in modulating climate, primarily through their light absorption abilities which influence aerosol radiative effects (Li et al., 2023). These compounds actively contribute to the formation of new particulate matter and secondary organic aerosols (SOAs), affecting cloud properties and the Earth's energy balance (Lin et al., 2021; Yu et al., 2024). The anthropogenic augmentation of nitrogen emissions has notably disrupted the global nitrogen cycle, with NOC deposition emerging as a significant source of reactive nitrogen (Li et al., 2023). The increased input of reactive nitrogen from human activities, such as fertilizer production, adversely affects terrestrial and aquatic ecosystems and human health by impacting air, soil, and water quality (De Vries, 2021). These effects have profound implications for atmospheric chemistry and climate, necessitating a deeper understanding of NOC sources and atmospheric processes in the climate-sensitive region of the TP.
The pre-monsoon period features meteorological conditions that facilitate the long-range transport of NOC-containing aerosols onto the TP, with prevailing atmospheric circulations transporting pollutants from neighboring countries in southwestern China (Wang et al., 2019a). Anthropogenic biomass burning is more intensive during the pre-monsoon period, and the incoming NOCs associated with biomass burning may have the potential to alter the chemical composition of the atmosphere, influence cloud microphysics, and affect the regional radiative balance during a critical time of hydrological accumulation and ecological transition (Tan et al., 2021). Given the TP's significance in the Asian water cycle and its role as a global climate regulator, the poorly characterized atmospheric behavior of NOCs during the pre-monsoon season represents a significant knowledge gap (Li et al., 2023).
Over the past decade, studies on NOCs have primarily focused on identifying their sources and concentrations (Song et al., 2017; Boreson et al., 2004; Barbaro et al., 2015; Lin et al., 2021). More than 200 NOCs have been detected in the atmosphere, originating from a variety of natural sources, such as animals, vegetation, the ocean, and husbandry, as well as anthropogenic sources, including sewage treatment, combustion processes, vehicle emissions, and industrial activities (Zhu et al., 2020; Zhang and Anastasio, 2003; Shi et al., 2010; Ho et al., 2019; Wang et al., 2022). Determining the sources of NOCs in the atmosphere remains challenging. For example, studies have identified the sources of specific NOCs like amines, amino acids, amides, nitriles, urea, and nitrophenol (Ge et al., 2011). Notably, amines are prevalent in both urban and rural areas in the USA, mainly derived from industrial and animal husbandry (Sorooshian et al., 2008). Biomass burning and animal farming are known emission pathways for amino acids (Zhang and Anastasio, 2003). Furthermore, investigations have shown that a significant portion of water-soluble organic nitrogen (WSON) may form secondarily, as indicated by its correlations with water-soluble ionic species like nitrate (), sulfate (), and ammonia () (Ho et al., 2015). Amides can react with atmospheric acidic particles, forming secondary aerosols (Priestley et al., 2018). Although previous studies have focused on identifying sources of prevalent NOCs (e.g. amino acids and amines) via tracer correlations, uncertainties about specific NOC concentrations and their sources persist. Recent studies have employed receptor models for source apportionment (Yu et al., 2024), yet a comprehensive understanding of NOCs is still lacking.
In this study, we collected fine particulate matter (PM2.5) samples during the pre-monsoon season at a high-altitude remote location near the Sino–Burmese border along the southeastern edge of the TP. The collected samples were analyzed to determine their NOCs, carbonaceous components, water-soluble ions, and elements. The objectives of the study were to investigate the general attributes and chemical composition of NOCs, ascertain the contribution of various sources to these compounds, and identify the source regions influencing PM2.5 and specific chemical constituents in the area.
2.1 Sampling
Aerosol sampling was conducted at the Lijiang Astronomical Station, the Chinese Academy of Sciences (26.70° N, 100.03° E; 3260 m above sea level, Fig. S1), in Gaomeigu from 11 March to 13 May 2018. The location is approximately 2 km away from Gaomeigu and 30 km from Lijiang, located on the southeastern edge of the TP (Zhao et al., 2019; Wang et al., 2019a). The surrounding area comprises farmland and forests, with no obvious industrial proximity. Two highways are situated about 6 km from the sampling site. Daily PM2.5 samples were collected using a high-volume sampler (model TE-6070, Tisch Environmental Inc., village of Cleves, OH, USA) at a flow rate of 1.13 m3 min−1. The aerosol samples were collected on quartz fiber filters (20.3 cm×25.4 cm, Whatman QM-A, Clifton, NJ, USA) that had been pre-heated to 780 °C for 3 h to remove carbonaceous materials. The sampling equipment was positioned approximately 10 m above ground level on a building's rooftop. All sampled filters were enveloped in clean aluminum foils and stored at −20 °C in a freezer until subsequent analysis in the laboratory. To account for background levels, field blank filters were processed and analyzed using the same method as the PM samples. All data presented were subtracted by field blank values.
2.2 NOC analysis
A total of 64 PM2.5 samples were analyzed to determine the target NOCs in this study. Amines and amino acids were quantified with the derivatization and analytical procedures by the Waters AccQ-Tag method (Cohen and Michaud, 1993; Ho et al., 2015, 2019). For sample extraction, a 4.3 cm2 filter was cut into pieces and subjected to ultrasonic extraction twice with 5 mL of Milli-Q water (18 MΩ cm) in a water bath at 25 °C. Each extract was then filtered through a 0.45 µm filter and concentrated to 0.5 mL using a rotary evaporator under vacuum. The resulting extracts were reacted with 6-aminoquinolyl-N-hydroxysuccinimidyl carbamate (AQC) to produce fluorescent derivatives. The AccQ-Fluor reagent kit (WAT052880, Waters Corporation, Milford, MA, USA) consists of AQC and AccQ-Tag borate buffer, and AccQ-Tag Eluent A was used for the derivatization process. The derivatized sample extracts were reconstituted and stored in a desiccator at room temperature before analysis. In the high-performance liquid chromatography (HPLC) analysis, the derivatives and calibration standards were injected into the HPLC (1200 Series, Agilent Technology, Santa Clara, CA, USA) equipped with a fluorescence detector. The sample vials were heated at 55 °C for 10 min using the oven within the system. The mixture was separated using a column (3.9×150 mm AccQ-Tag amino acid analysis silica base) bonded with a 4 µm C18 reversed-phase column at 37 °C and detected at an absorption wavelength of 395 nm. The linearity of the calibrations was assessed by the correlation coefficient (R2>0.999), and the minimum detection limits (MDLs) for the target organic nitrogen species ranged from 0.036 to 0.086 nmol m−3. To ensure the reliability of the analysis, one replicate analysis of the ambient sample was conducted for every 10 samples. Additionally, ambient samples spiked with known amounts of internal and external standards were analyzed to assess potential interference from the sample matrix.
For alkyl amides, alkyl nitriles, isocyanates, and cyclic NOCs, the extraction procedures were the same as those used for the free amino acids (FAAs). After extraction, combination, filtration, and concentration, the extracts were mixed with 50 µL of borate buffer to adjust the pH to 9.1. The solutions were then diluted with a water–acetone mixture (, ) to a final volume of 150 mL. A total of 40 mL of dansyl chloride in acetone and 10 mL of an internal standard were added to this mixture. The resulting mixture underwent a derivatization reaction, which involved vortex agitation for 1 min and subsequent ultrasound irradiation at 35 °C for 15 min, following the method described by Ruiz-Jiménez et al. (2012). The reaction vials were kept in the dark until the analysis. The derivatized products were introduced into the HPLC system, which was equipped with a 2.1 × 150 mm C18 column (3.5 µm particle size, Waters SunFire) and coupled with an ion-trap mass spectrometer (Esquire 3000, Bruker Daltonics). The linearity of the calibrations for these compounds was evaluated using the correlation coefficient (R2 > 0.999). The MDL for the target organic nitrogen species ranged from 0.005 to 0.019 nmol m−3.
Urea was identified and quantified using a direct-injection method on an HPLC system coupled with a photodiode array detector (DAD) (1200 Series, Agilent Technology). The separation of urea was achieved using a 4.6 × 150 mm C18 column (4 µm particle size, Cogent Bidentate), and its detection was performed at an absorption wavelength of 210 nm (Ho et al., 2019). The calibration of the method exhibited a high correlation coefficient (R2 > 0.999), indicating a strong linear relationship between the concentration of urea and the detector response. The MDL for urea was determined to be 0.05 ng mL−1, denoting the lowest concentration of urea that could be reliably detected using the analytical method. By employing this direct-injection approach, along with the specific column and detection parameters, accurate identification and quantification of urea in the samples were achieved. The high linearity of the calibration and low MDL underscore the sensitivity and reliability of the method for analyzing urea content in the study.
2.3 Auxiliary measurements
Organic carbon (OC); elemental carbon (EC); organic markers, including polycyclic aromatic hydrocarbons (PAHs) and levoglucosan; and elemental components of PM2.5, including Ca, Ti, V, Mn, Fe, Cu, As, Br, Pb, and Zn, were also determined (Table S1 in the Supplement). Further details regarding the chemical analyses, including processes, accuracies, precisions, and quality assurance/quality control (QA/QC) procedures of auxiliary data, can be found in Sect. S1.
2.4 Estimation of secondary organic carbon (SOC)
In this study, an approach called the minimum R2 (MRS) method was utilized to estimate [SOC] concentration (Wu and Yu, 2016), which is deduced using the following equations:
where [OC] and [EC] represent the measured concentrations, [POC] represents the primary organic carbon concentrations, and (OC EC)primary denotes an estimate of the primary OC EC ratio. We calculated a series of (OC EC)primary values to achieve the lowest coefficient of determination (R2) between [SOC] and [EC], as shown in Fig. S2 in the Supplement. This minimization of R2 allows for the accurate deduction of SOC levels, considering the relationship between [SOC] and [EC].
2.5 Source apportionment
Source apportionment using positive matrix factorization (PMF) with the multilinear engine (ME-2) was performed by employing the source finder tool SoFi v6.7 (Canonaco et al., 2013). The analysis involved aligning daily measurements of 7 nitrogen organic classes with concurrent measurements of 3 carbonaceous materials (EC, POC, and SOC), 1 water-soluble inorganic ion (K+), and 10 elements (Ca, Ti, V, Mn, Fe, Cu, As, Br, Pb, and Zn) in the PM2.5 fraction. The characteristics of the input species and the correlation matrix of each species can be found in Table S2 and Fig. S3, respectively, providing statistical information for the analysis. Details of the PMF and ME-2 analysis can be found in the Supplement (Sect. S1). Briefly, we first performed unconstrained PMF with a factor number of 2–12 and examined the factor profile and time series (Figs. S4–S7). Seven-factor factors were determined as the optimum solution (Figs. S8 and S9). To reduce the mixing between the factors, a constrained PMF analysis using the “a-value” approach of the ME-2 solver was applied (Canonaco et al., 2013). The 7-factor solution with the constrained matrix is shown in Table S2. The constrained run was performed by adding constraints in the base-run-resolved factor profiles so that the tracers are only present in the corresponding sources (Wang et al., 2019b).
2.6 Potential source contribution function (PSCF)
The potential source contribution function (PSCF) was used to identify the likely pollution regions that influenced PMF factors based on back trajectories. PSCF analysis was performed using ZeFir (Petit et al., 2017). Each trajectory includes a range of latitude–longitude coordinates every 1 h backward in a whole day. The studying field is from 20 to 30° N and 90 to 105° E, which includes more than 95 % of the area covered by all the paths. The set of trajectory data for each arriving elevation level contained two trajectories per day. More details of the PSCF analysis can be found in Sect. S1.
2.7 Community Multiscale Air Quality
The Community Multiscale Air Quality (CMAQ) model (version 5.4) was applied to assess the transport of aerosols from neighboring countries in southwestern China. The CMAQ model was configured with the AERO7 aerosol module and CB6r5 gas-phase mechanism (Murphy et al., 2021). The model adopted a horizontal grid resolution of 27 km, consisting of 34 vertical layers.
To generate the necessary meteorological fields for the CMAQ simulations, the Weather Research and Forecasting (WRF) model (version 4.4) was utilized. The initial and boundary conditions for the WRF were obtained from the National Centers for Environmental Prediction (NCEP) Final (FNL) dataset, which is a reanalysis dataset. For the domestic emission inventory, the Multi-resolution Emission Inventory for China (MEIC) was employed. Additionally, the MIX inventory was used to account for emissions from other countries (Li et al., 2017).
Two simulation cases were conducted: one considering only domestic emissions (i.e. MEIC) and the other considering emissions from both domestic and other countries (i.e. MEIC + MIX). By employing the zero-out method, the differences between these two cases represented the contribution of emissions from other countries to the PM2.5 levels in the study area. The CMAQ simulations were performed from 9 to 27 March 2018, with the first 3 d considered a spin-up period for the model. The simulation period covered the first 2 weeks of the campaign, encompassing the period before and during the initial pollution event from 22 to 26 March. CMAQ reproduced the measured PM2.5 at Gaomeigu (GMG) reasonably well when considering both MEIC and MIX in the emission inventory, with a correlation coefficient of r > 0.9 between the modeled and measured PM2.5 and a slope of 0.61 (Fig. S11).
3.1 Overview of NOC concentration
Figure 1 illustrates the concentration variations in NOCs, carbonaceous aerosols, and meteorological parameters in Gaomeigu during the campaign. The daily mass concentrations of NOCs range from 714.4 to 3887.1 ng m−3, with an average of 2119.4 ± 875.0 ng m−3. This average is approximately 40 % greater than the NOC concentrations observed at a regional site in Xianghe, China (1270 ng m−3) (Wang et al., 2022). The NOCs are classified into major (> 10 % contribution) and minor (< 10 % contribution) compounds, as detailed in Table 1, with the major classes including FAAs, amines, and urea. The average concentrations of these major NOCs are 1922.6 ± 790.5 ng m−3, dominated by FAAs (58.9 %), followed by amines (28.0 %) and urea (13.7 %). Minor NOC species, such as alkyl amides, alkyl nitriles, isocyanates, and cyclic NOCs, have average concentrations of 45.1 ± 18.6, 4.68 ± 1.75, 10.9 ± 4.73, and 136.2 ± 61.6 ng m−3, respectively.
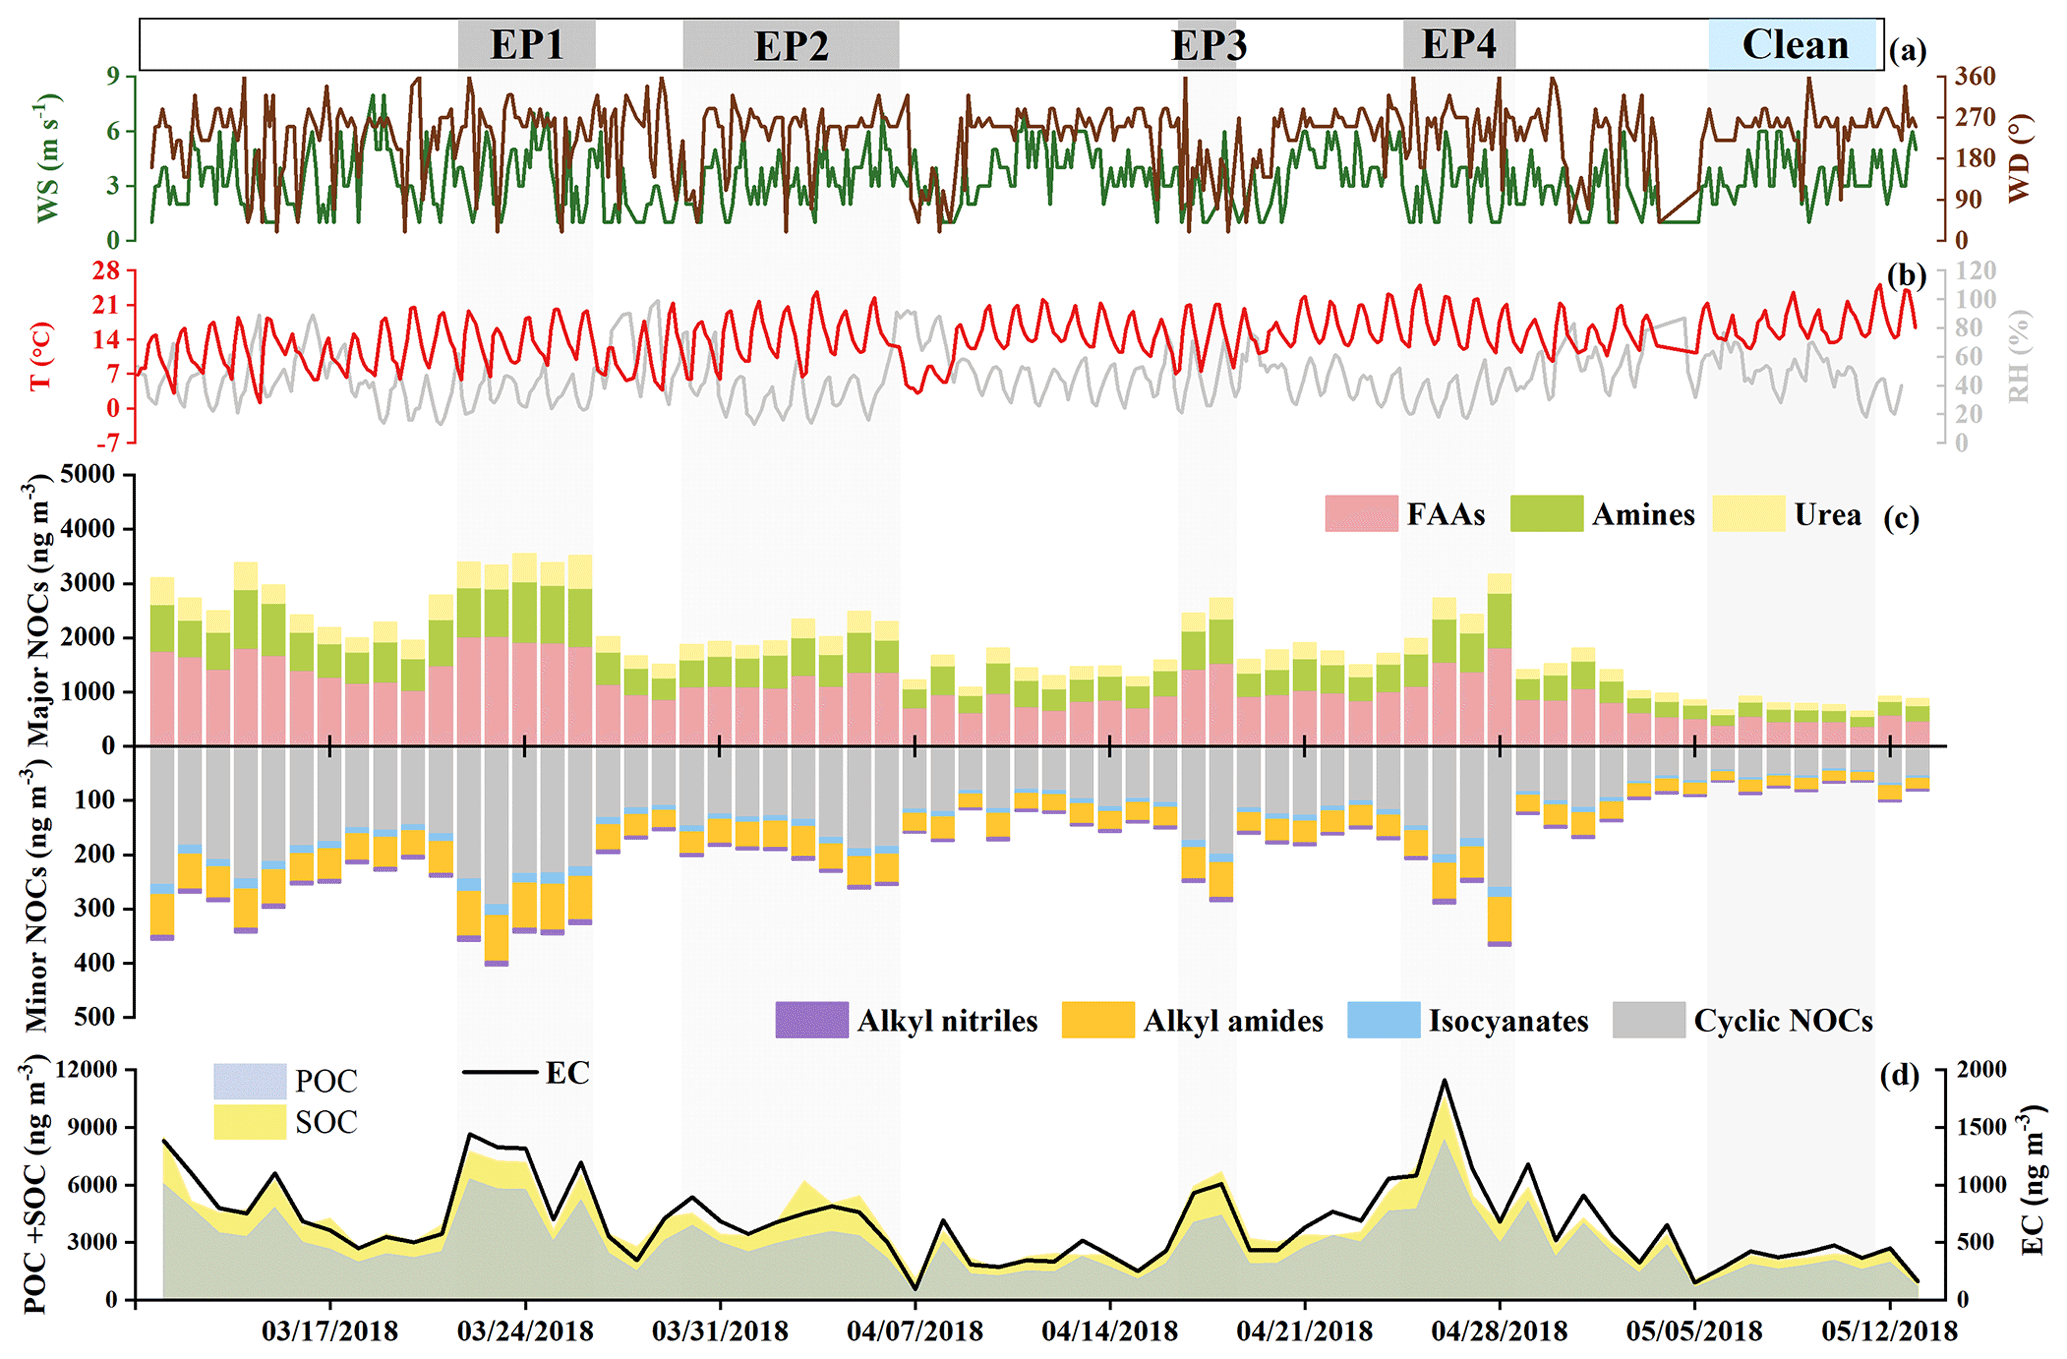
Figure 1Hourly variations in meteorological parameters and daily chemical compositions of NOCs during different events in Gaomeigu in 2018 (EP1: 22 to 26 March, EP2: 30 March to 6 April, EP3: 17 to 18 April, EP4: 25 to 28 April, clean period: 6 to 11 May).
Table 1Concentration levels of chemical compounds and groups in Gaomeigu, China (ng m−3).
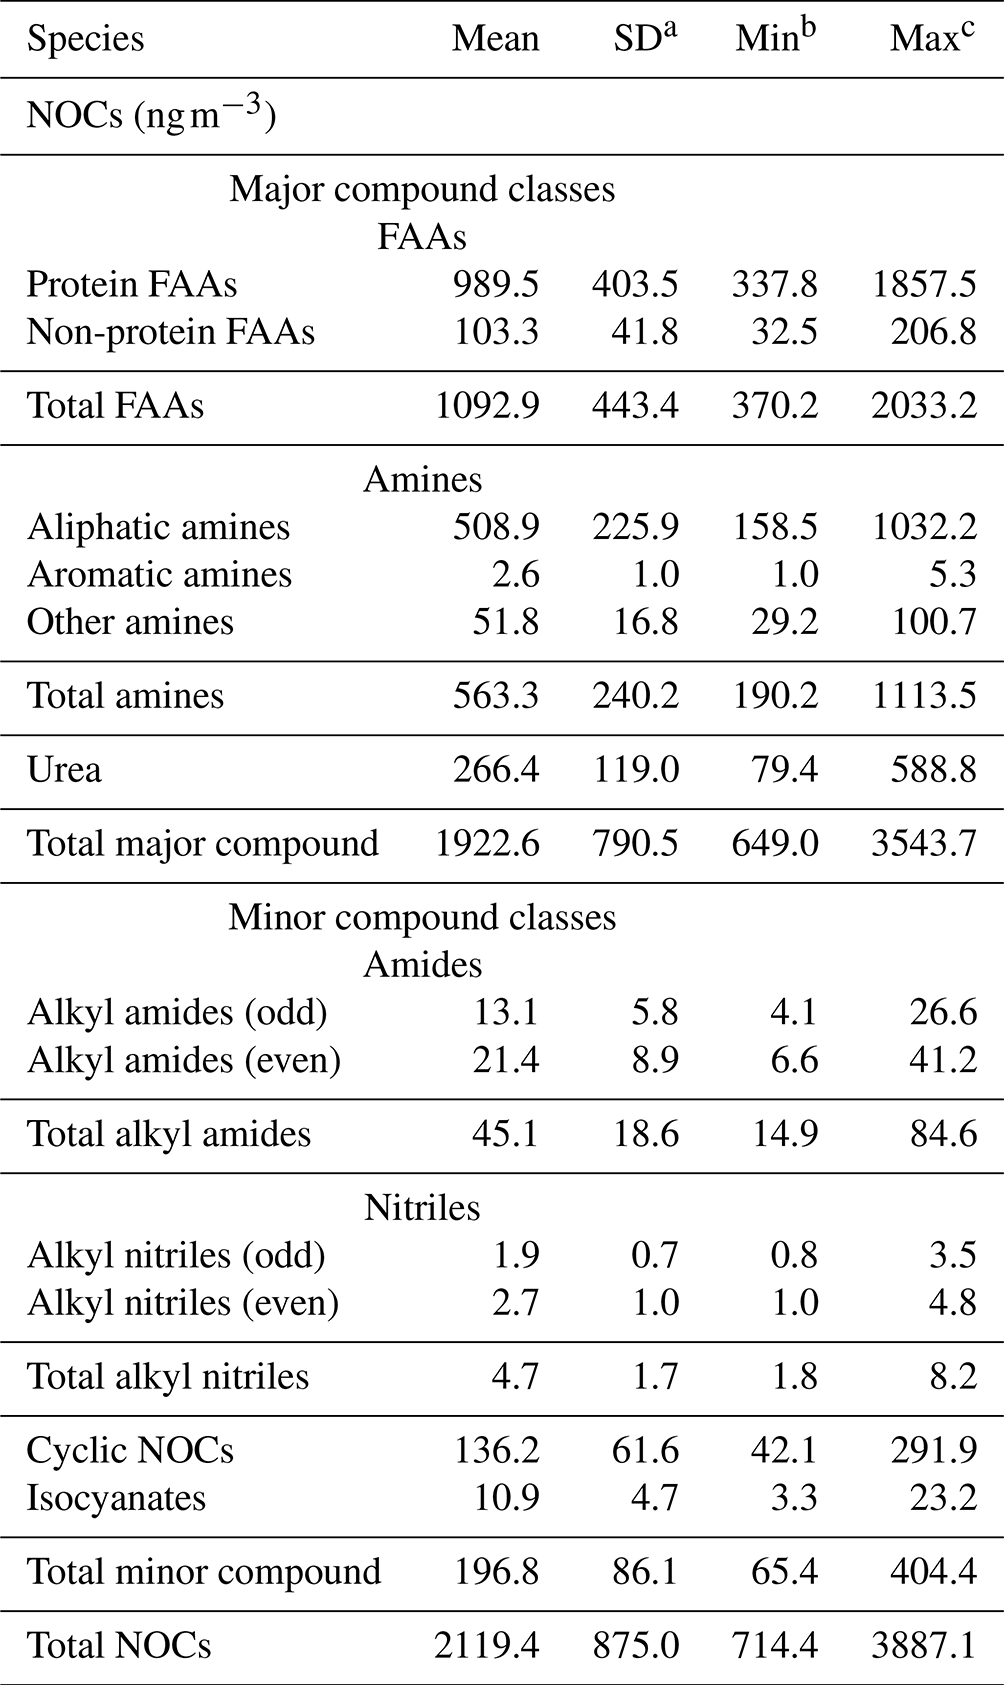
a SD represents standard deviation. b Min and c Max donate minimum and maximum, respectively.
As shown in Fig. 1, the campaign is segmented into five periods (EP1–EP5) based on NOC concentration variations. The clean period featured a temperature consistently above 9 °C and an average OC concentration of 2137.3 ± 296.7 ng m−3. Elevated wind speeds during this period (4.4 ± 1.3 m s−1) enhanced atmospheric dispersion relative to other polluted periods. Notably, average NOC concentration increased during pollution periods, reaching 1482.6 ± 346.4 ng m−3, which is more than triple the level observed during the clean period (451.8 ± 65.2 ng m−3). Delving into the high-NOC-concentration periods individually, EP1 shows the highest aggregate concentration of major NOCs, which is 4.3 to 5.0 times greater than during the clean period. The NOC POC ratios were 0.773 (EP1), 0.774 (EP2), 0.674 (EP3), and 0.638 (EP4), presenting a stark contrast to the clean period's ratio of 0.503. However, the NOC SOC ratio remains relatively stable across the phases. These trends underscore the significant influence of primary sources during elevated-NOC-concentration periods. Conversely, during the clean period, the source of NOCs appears to be more complex, suggesting a nuanced interplay of primary and secondary sources. More in-depth discussions on source apportionment are provided in Sect. 3.4.
3.2 Major NOC classes
3.2.1 Free amino acids (FAAs)
During the sampling campaign, the average FAA concentration is 1092.9 ± 443.37 ng m−3, in a range of 370.2 and 2033.2 ng m−3 (Table 1). This level is comparable with FAAs observed in regions such as rural Guangzhou, China (Song et al., 2017); Arizona, USA (Boreson et al., 2004); and Antarctica's MZ Station, USA (Barbaro et al., 2015), but it is higher than in urban/suburban and marine regions like Nanchan, China (Zhu et al., 2020); California, USA (Zhang and Anastasio, 2003); Qingdao, China (Shi et al., 2010); and Hong Kong SAR, China (Ho et al., 2019). Notably, the average FAA concentration in this study is approximately 4 times higher than that reported in Xianghe, China (Wang et al., 2022).
FAAs are classified into protein-type and non-protein-type categories. Table S3 provides an overview of protein-type and non-protein-type FAAs, with mean concentrations of 989.5 ± 403.54 and 103.3 ± 41.76 ng m−3, respectively. Protein-type FAAs, including Asp, Ser, Glu, Gly, His, Thr, Ala, Pro, Cys, Tyr, Val, Met, Lys, Ile, Leu, and Phe, account for 90.5 % of total FAAs, with glycine (Gly) being the most prevalent. These findings are consistent with previous studies that identified Gly as the predominant FAA in Nanchang (Zhu et al., 2020), Hong Kong SAR (Ho et al., 2019), and Venice (Barbaro et al., 2011). Non-protein-type FAAs, such as β-alanine (β-Ala), γ-aminobutyric acid (γ-Ala), and ornithine (Orn), also contributed, with β-Ala representing 9.5 % of these FAAs.
Figure 2 illustrates a positive correlation between FAAs and Ox (NO2+O3), indicating an association with secondary formation processes following precursor emissions. The average FAA concentration is 900 ng m−3 at Ox levels below 70 ppb but rises above 1200 ng m−3 when Ox exceeds 85 ppb. Moreover, FAAs correlate strongly with both POC (r = 0.95) and SOC (r = 0.90), indicating that secondary processes likely influence the FAA formation. Despite no obvious direct local emission near the sampling site, secondary formation of FAAs can occur through several mechanisms, including direct photolysis, photochemical hydrolysis, and enzyme-based hydrolysis (Mopper and Zika, 1987; Milne and Zika, 1993; Song et al., 2017). Given that the sampling site is subject to long-range transport (discussed in Sect. 3.5), it is likely that free amino acids were secondarily produced by the breakdown of proteins during the transport.
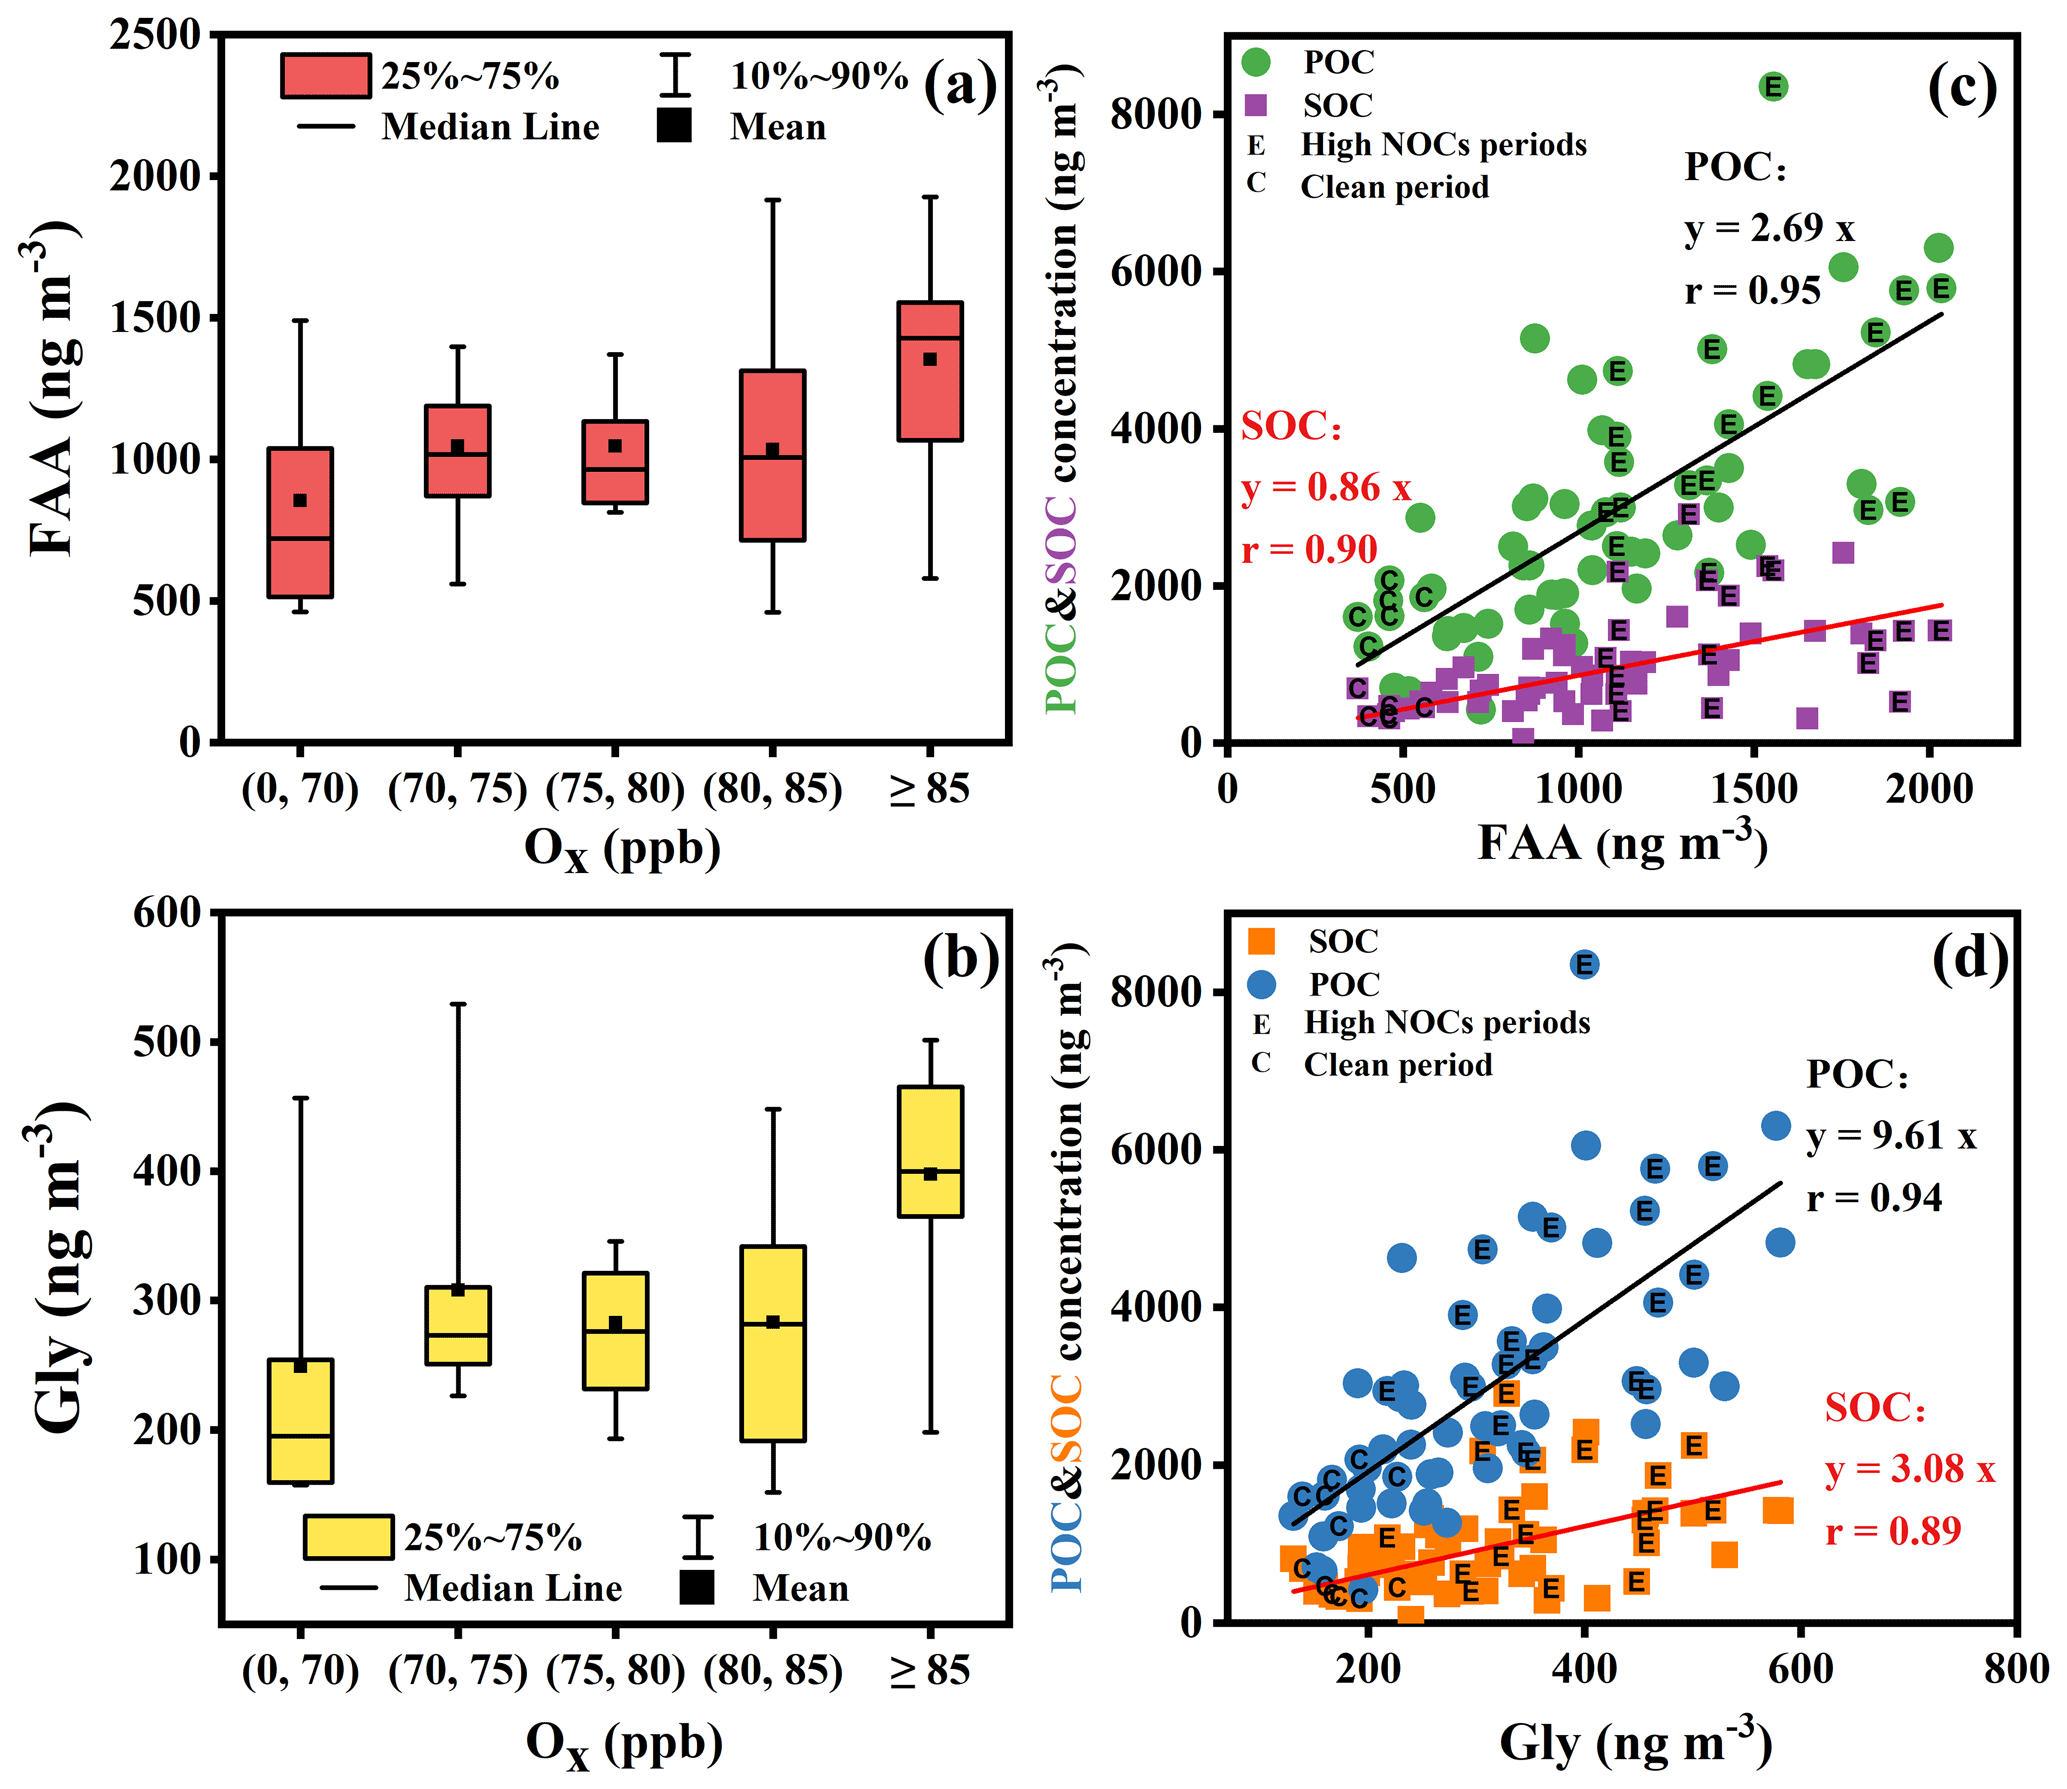
Figure 2(a) FAA dependence of O3, (b) Gly dependence of O3, correlation plots of POC and SOC concentrations versus (c) FAA and (d) Gly. The box represents the 25th (bottom) and 75th percentiles (top), and the box–whisker data represent the range from the 10th to 90th percentiles.
Moreover, Gly comprises 31 % of total FAAs and shows a similar positive relationship with Ox. The Gly concentration increases from 250 ng m−3 when the Ox is below 70 ppb to 400 ng m−3 when the Ox is above 85 ppb. Its correlations with POC (r = 0.94) and SOC (r = 0.89) reinforce the impact of secondary formation processes, similar to patterns observed in the North China Plain (NCP) region, China (Wang et al., 2022).
3.2.2 Amines and urea
The average concentration of amines during the sampling period was 563 ng m−3. Aliphatic amines dominate, contributing 90 % of the total amine, while aromatic amines constitute less than 1 % (Fig. 3). The remaining 9 % include other amine compounds, such as ethanolamine, galactosamine, 2-amino-1-butanol, and N-methylformamide. During the pollution episodes, aliphatic amine concentrations exceed 600 ng m−3, with a maximum of 1000 ng m−3. In contrast, during clean periods, these levels decline to ∼ 200 ng m−3. The proportions of aliphatic amines during pollution episodes are 90 %–91 %, which decreases to 84 % during clean periods, with an increase in other concentrations.
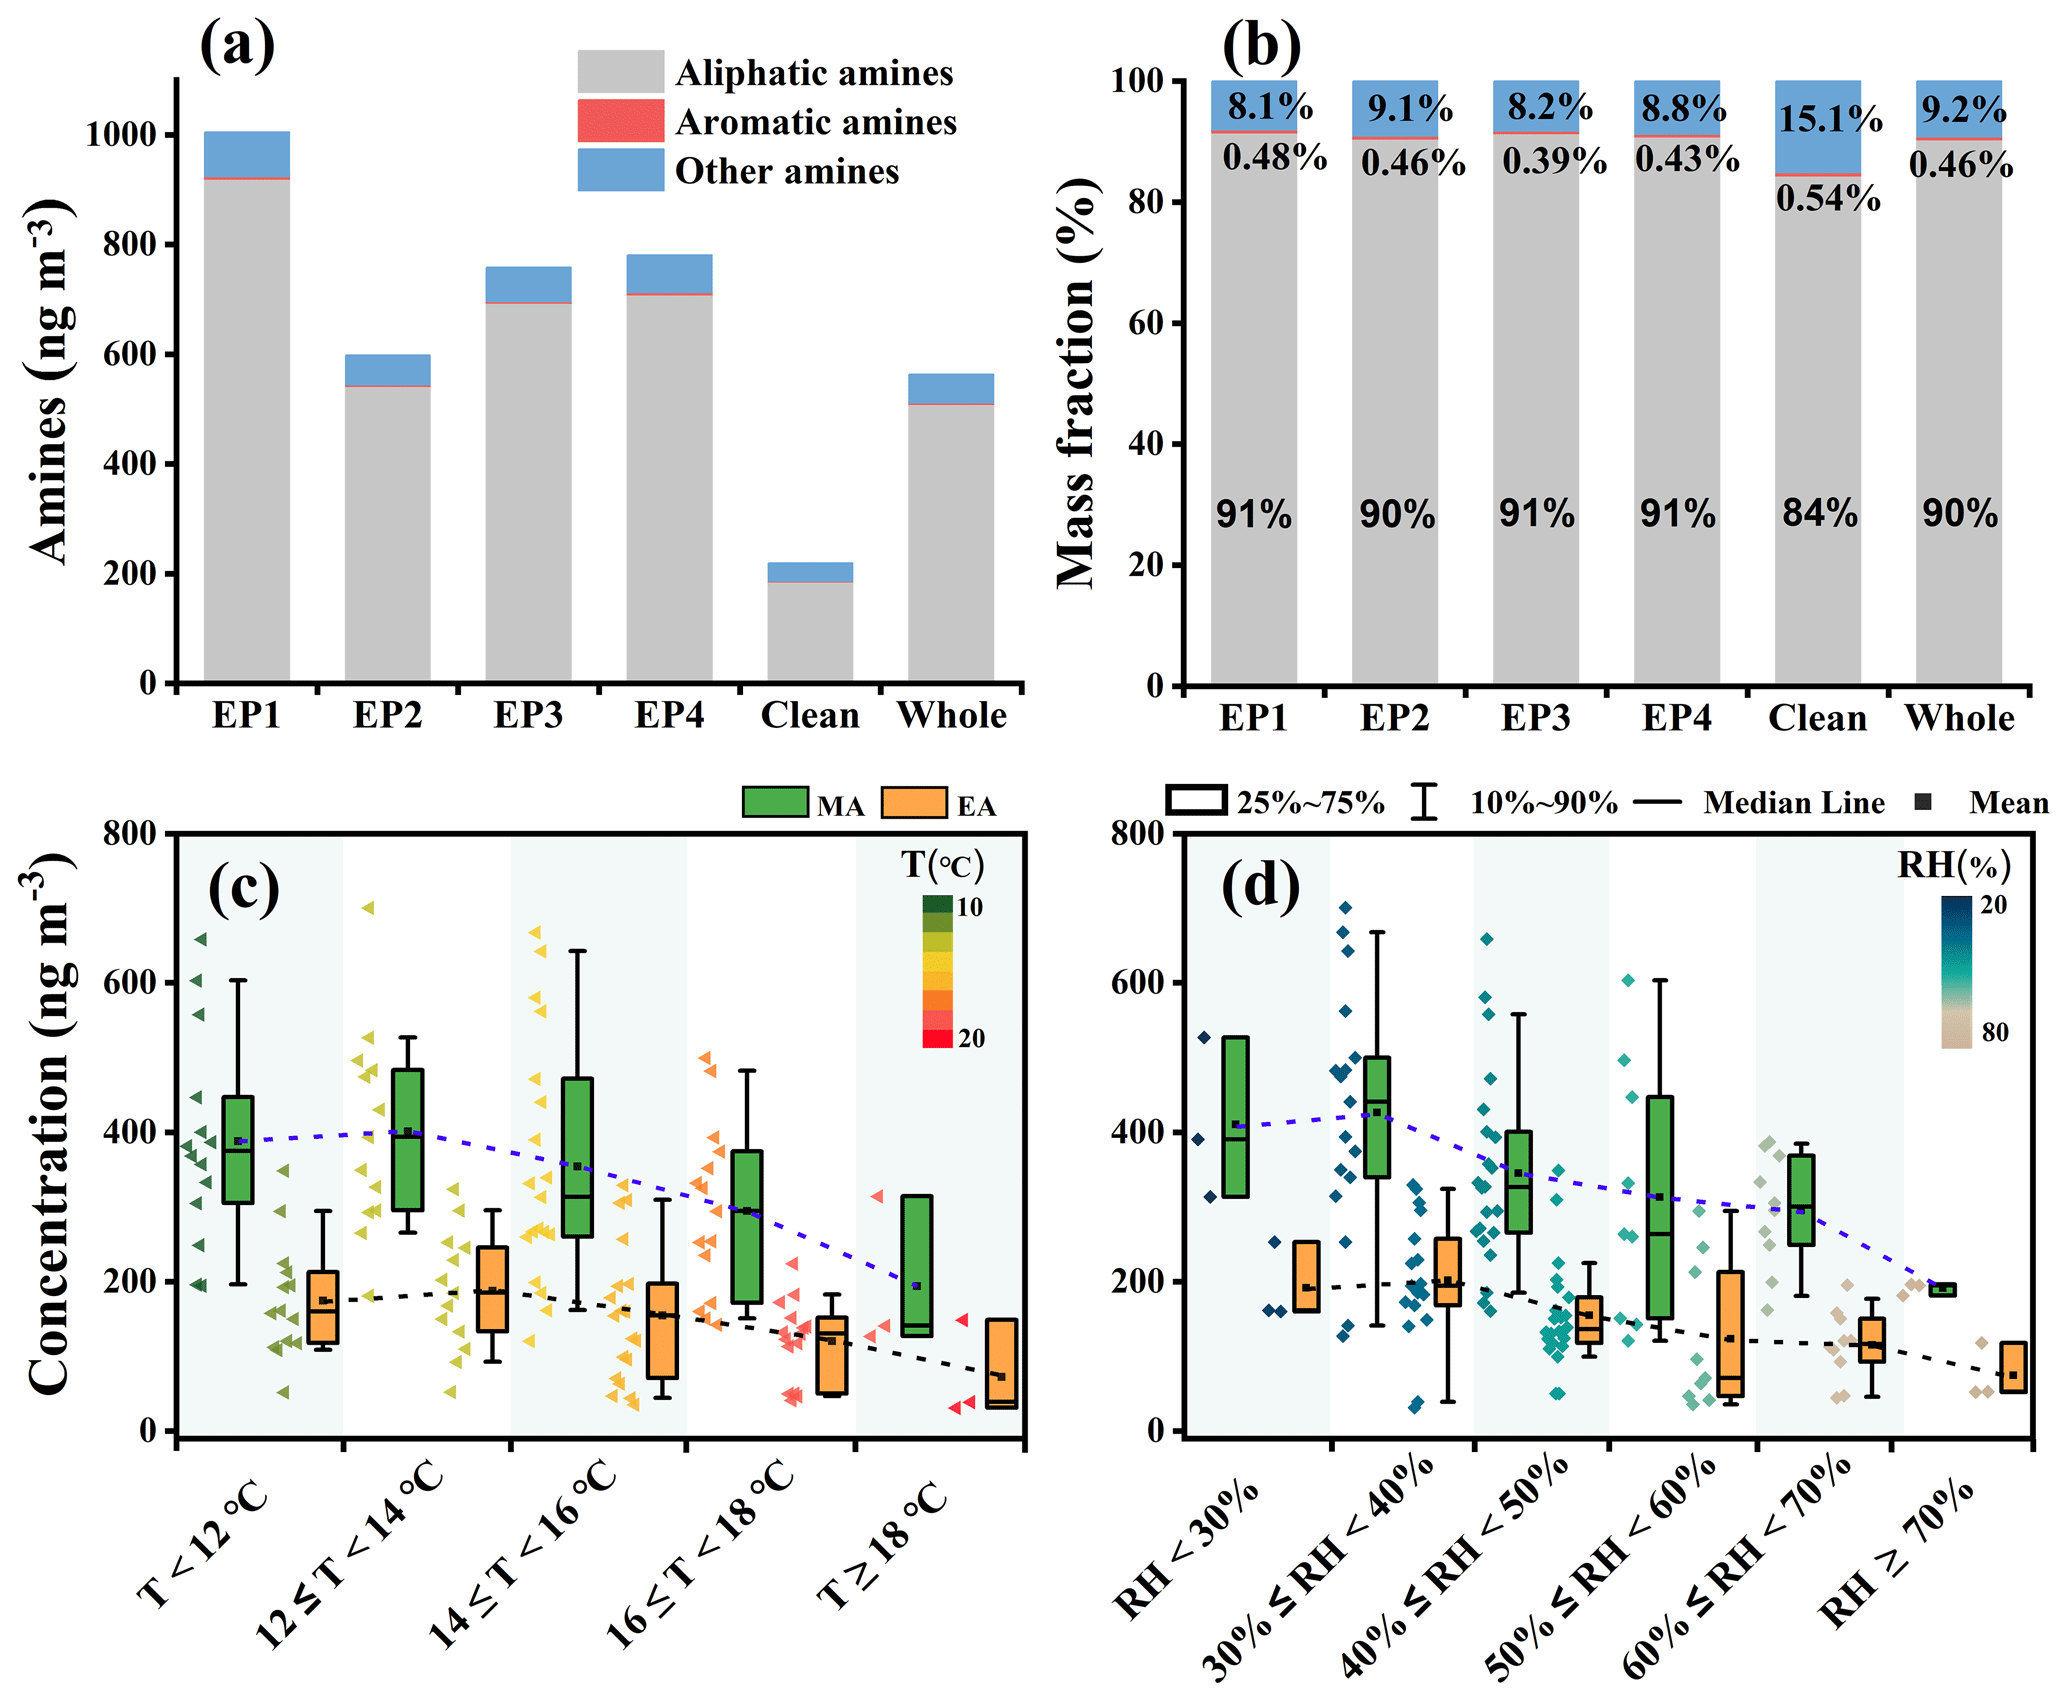
Figure 3(a) Concentration and (b) composition of amines. (c) Temperature dependence of EA and MA, and (d) RH dependence of EA and MA. The box represents the 25th (bottom) and 75th percentiles (top), and the box–whisker data represent the 10th to 90th percentiles.
Methylamine (MA) emerges as the predominant aliphatic amine, constituting 62 % of the total aliphatic amines. Ethylamine (EA) follows, contributing 28 % to the total aliphatic amines. Dimethylamine (DMA), trimethylamine (TMA), and other amine species together account for the remaining 10 %. Both MA and EA exhibit negative correlations with ambient temperature (Fig. 3), indicating the potential influence of temperature on gas-to-particle partitioning. Below 12 °C, the average MA concentration is around 400 ng m−3, which halves to 200 ng m−3 as temperature increases above 18 °C. Similarly, EA concentration is higher at lower ambient temperatures, around 195 ng m−3 below 12 °C, decreasing to 100 ng m−3 above 18 °C. Given their low molecular weight, MA and EA are more prevalent in the gas phase at elevated ambient temperatures, where they also exhibit enhanced atmospheric reactivity with acids, transforming into other compounds.
Both MA and EA show negative correlations with RH, with elevated concentrations at lower RHs (Fig. 3d). This inverse relationship might be counterintuitive, given that higher RH typically promotes the partitioning of low-molecular-weight amine into the particle phase. However, MA and EA, being atmospherically reactive amines, are involved in in-particle reactions. Under high-RH conditions, increased condensation of acids and/or reactive organic compounds occurs, which subsequently react with MA and EA, consuming them and thus establishing a negative correlation with RH.
Urea is identified as the third major NOC species, with an average concentration of 266 ng m−3 during the campaign. This value is approximately half that reported at a regional site in the NCP (Wang et al., 2022), though direct comparison is limited due to spatial and temporal differences. The urea level at this elevated site highlights the notable role of agricultural fertilizers as a potential source. Urea can be released into the atmosphere through agricultural activities and biomass burning (Wang et al., 2022), and it can also be formed secondarily in the atmosphere through chemical reactions (Leung et al., 2024).
3.3 Minor NOC classes
3.3.1 Alkyl amides and nitriles
In this study, the distributions and sources of alkyl amides in a range of C6–C20 were determined in Gaomeigu. Figure S10 illustrates the distribution patterns of these species during the campaign, where the concentrations of n-alkyl amides vary from 1.11 to 7.57 ng m−3, reflecting diverse emission sources. These amides can originate from anthropogenic activities such as coal combustion and vehicular traffic, as well as biogenic processes. To distinguish between these sources, we use the carbon preference index (CPI) and the oleamide to stearamide ratio (Cheng et al., 2006). The CPI, calculated as the ratio of the sum of odd-numbered C7–C19 alkyl amides to even-numbered C6–C20 alkyl amides, helps identify the dominant source: a CPI ≤ 1 indicates anthropogenic dominance, whereas > 1 suggests biogenic predominance (Abas and Simoneit, 1996). The results show that the CPI of alkyl amides ranges from 0.46 to 0.75, with an average of 0.61 ± 0.05, emphasizing the anthropogenic impact on their concentrations. Notably, the CPI values do not vary between the periods having low and high NOC concentrations, suggesting consistent alkyl amide sources throughout the campaign, potentially influenced by long-range transport and stable meteorological conditions.
Beyond the CPI, the R18, which is a ratio of oleamide (C18 : 1) and stearamide (C18 : 0), serves as an indicator for alkyl amide aging (Wang et al., 2022). This ratio provides insights into the precursor composition, oxidation degradation, and transport processes influencing unsaturated amide concentrations (Nielsen et al., 2012). An R18 < 1 implies the aging of alkyl amides due to long-range transport, whereas R18 > 1 indicates local biomass burning emissions (Cheng et al., 2006). According to the results of this study, R18 values range from 0.73 to 2.27, with an average of 1.36 ± 0.35, suggesting the alternation between local and long-range transport (Cheng et al., 2006).
During the sampling period, the average concentration of alkyl nitriles was 4.69 ± 1.75 ng m−3 in Gaomeigu. As shown in Table S3, hexadecanenitrile (C16) is the most prevalent (0.49 ng m−3), followed by tetradecanenitrile (C14) (0.45 ng m−3). The concentrations of the other analyzed alkyl nitriles are below 0.4 ng m−3. The results are consistent with the higher concentrations observed at the Xianghe site (Wang et al., 2022). Moreover, the CPI values for alkyl nitriles were between 0.605 and 0.848, with an average of 0.702 ± 0.05, which points out the anthropogenic influence on their levels. During high-NOC-concentration phases, the CPI values remain constant (i.e. EP1: 0.72, EP2: 0.71, EP3: 0.71, and EP4: 0.72) compared to 0.75 during clean periods. This consistency implies that anthropogenic sources predominantly influence alkyl nitrile concentrations regardless of the pollution levels (Wang et al., 2022).
Furthermore, it is important to note that alkyl amides and nitriles might form as secondary products during biomass burning through reactions between ammonia (NH3) and FAAs (Simoneit et al., 2003). The link between biomass burning and the generation of these compounds is reinforced by robust correlations with levoglucosan and K+ in Fig. S3 (r > 0.88, p < 0.01), both recognized as markers of biomass burning (Wang et al., 2018; Liu et al., 2021). This evidence confirms that biomass burning is a key contributor to the occurrence of alkyl amides and nitriles in the region.
3.3.2 Cyclic NOCs and isocyanates
The average mass concentration of cyclic NOCs is 136.2 ng m−3. This study identified five cyclic NOCs (Table S3), with caprolactam being the most prevalent at 54.2 ng m−3 (39.8 % of the total cyclic NOC), which is commonly used in commercial manufacturing processes and lysine synthesis (Cheng et al., 2006). Other cyclic NOCs include isoindole-1,3-dione (50.7 ng m−3, 37.2 %), N-butylbenzenesulfonamide (NBBS) (22.1 ng m−3, 16.2 %), N,N-diethyl-m-toluamide (DEET) (5.79 ng m−3, 4.3 %), and benzothiazolone (3.36 ng m−3, 2.5 %). These compounds are known to pose health risks (Cheng et al., 2006; Balducci et al., 2012), and they primarily originate from industrial and agricultural activities (Wang et al., 2022; Richardson and Ternes, 2018; Trapp and Eggen, 2013). In comparison with the findings of the Xianghe site (Wang et al., 2022), the concentrations of cyclic NOCs in this study are lower, indicating the lower contributions of industrial sources. During the four high-NOC-emission periods, the concentrations of cyclic NOCs are 2–4 times higher than those during the clean period, suggesting the influence of pollution levels.
Isocyanates, commonly used in polyurethane resin production, are associated with several health threats, including asthma, allergies, and skin reactions (Lesage et al., 2001). The average total mass concentration of eight isocyanates is 10.89 ± 4.73 ng m−3 (Table 1), while the individual concentration of each isocyanate is given in Table S3, including methyl isocyanate (MIC), toluene-2,4-diisocyanate (2,4-TDI), toluene-2,6-diisocyanate (2,6-TDI), isophorone diisocyanate (IPDI), 1,6-hexamethylene diisocyanate (1,6-HDI), ethyl isocyanate (EIC), phenyl isocyanate (PHI), and propyl isocyanate (PIC). Among these, TDI and HDI are predominantly used in industry (Hejna et al., 2024). TDI is commonly utilized in various foam products (Akindoyo et al., 2016), while HDI is essential in polyurethane paints and coatings (Golling et al., 2019). The presence of these isocyanates in numerous products is linked to heightened health hazards, such as skin allergies, atopic dermatitis, and various respiratory diseases (Nawrot et al., 2008).
3.4 Source apportionment of NOCs
In this study, a constrained PMF analysis was applied to identify the sources of NOCs, which include biomass burning, coal combustion, industry-related sources, crustal sources, traffic emissions, agricultural activities, and secondary sources (Fig. 4).
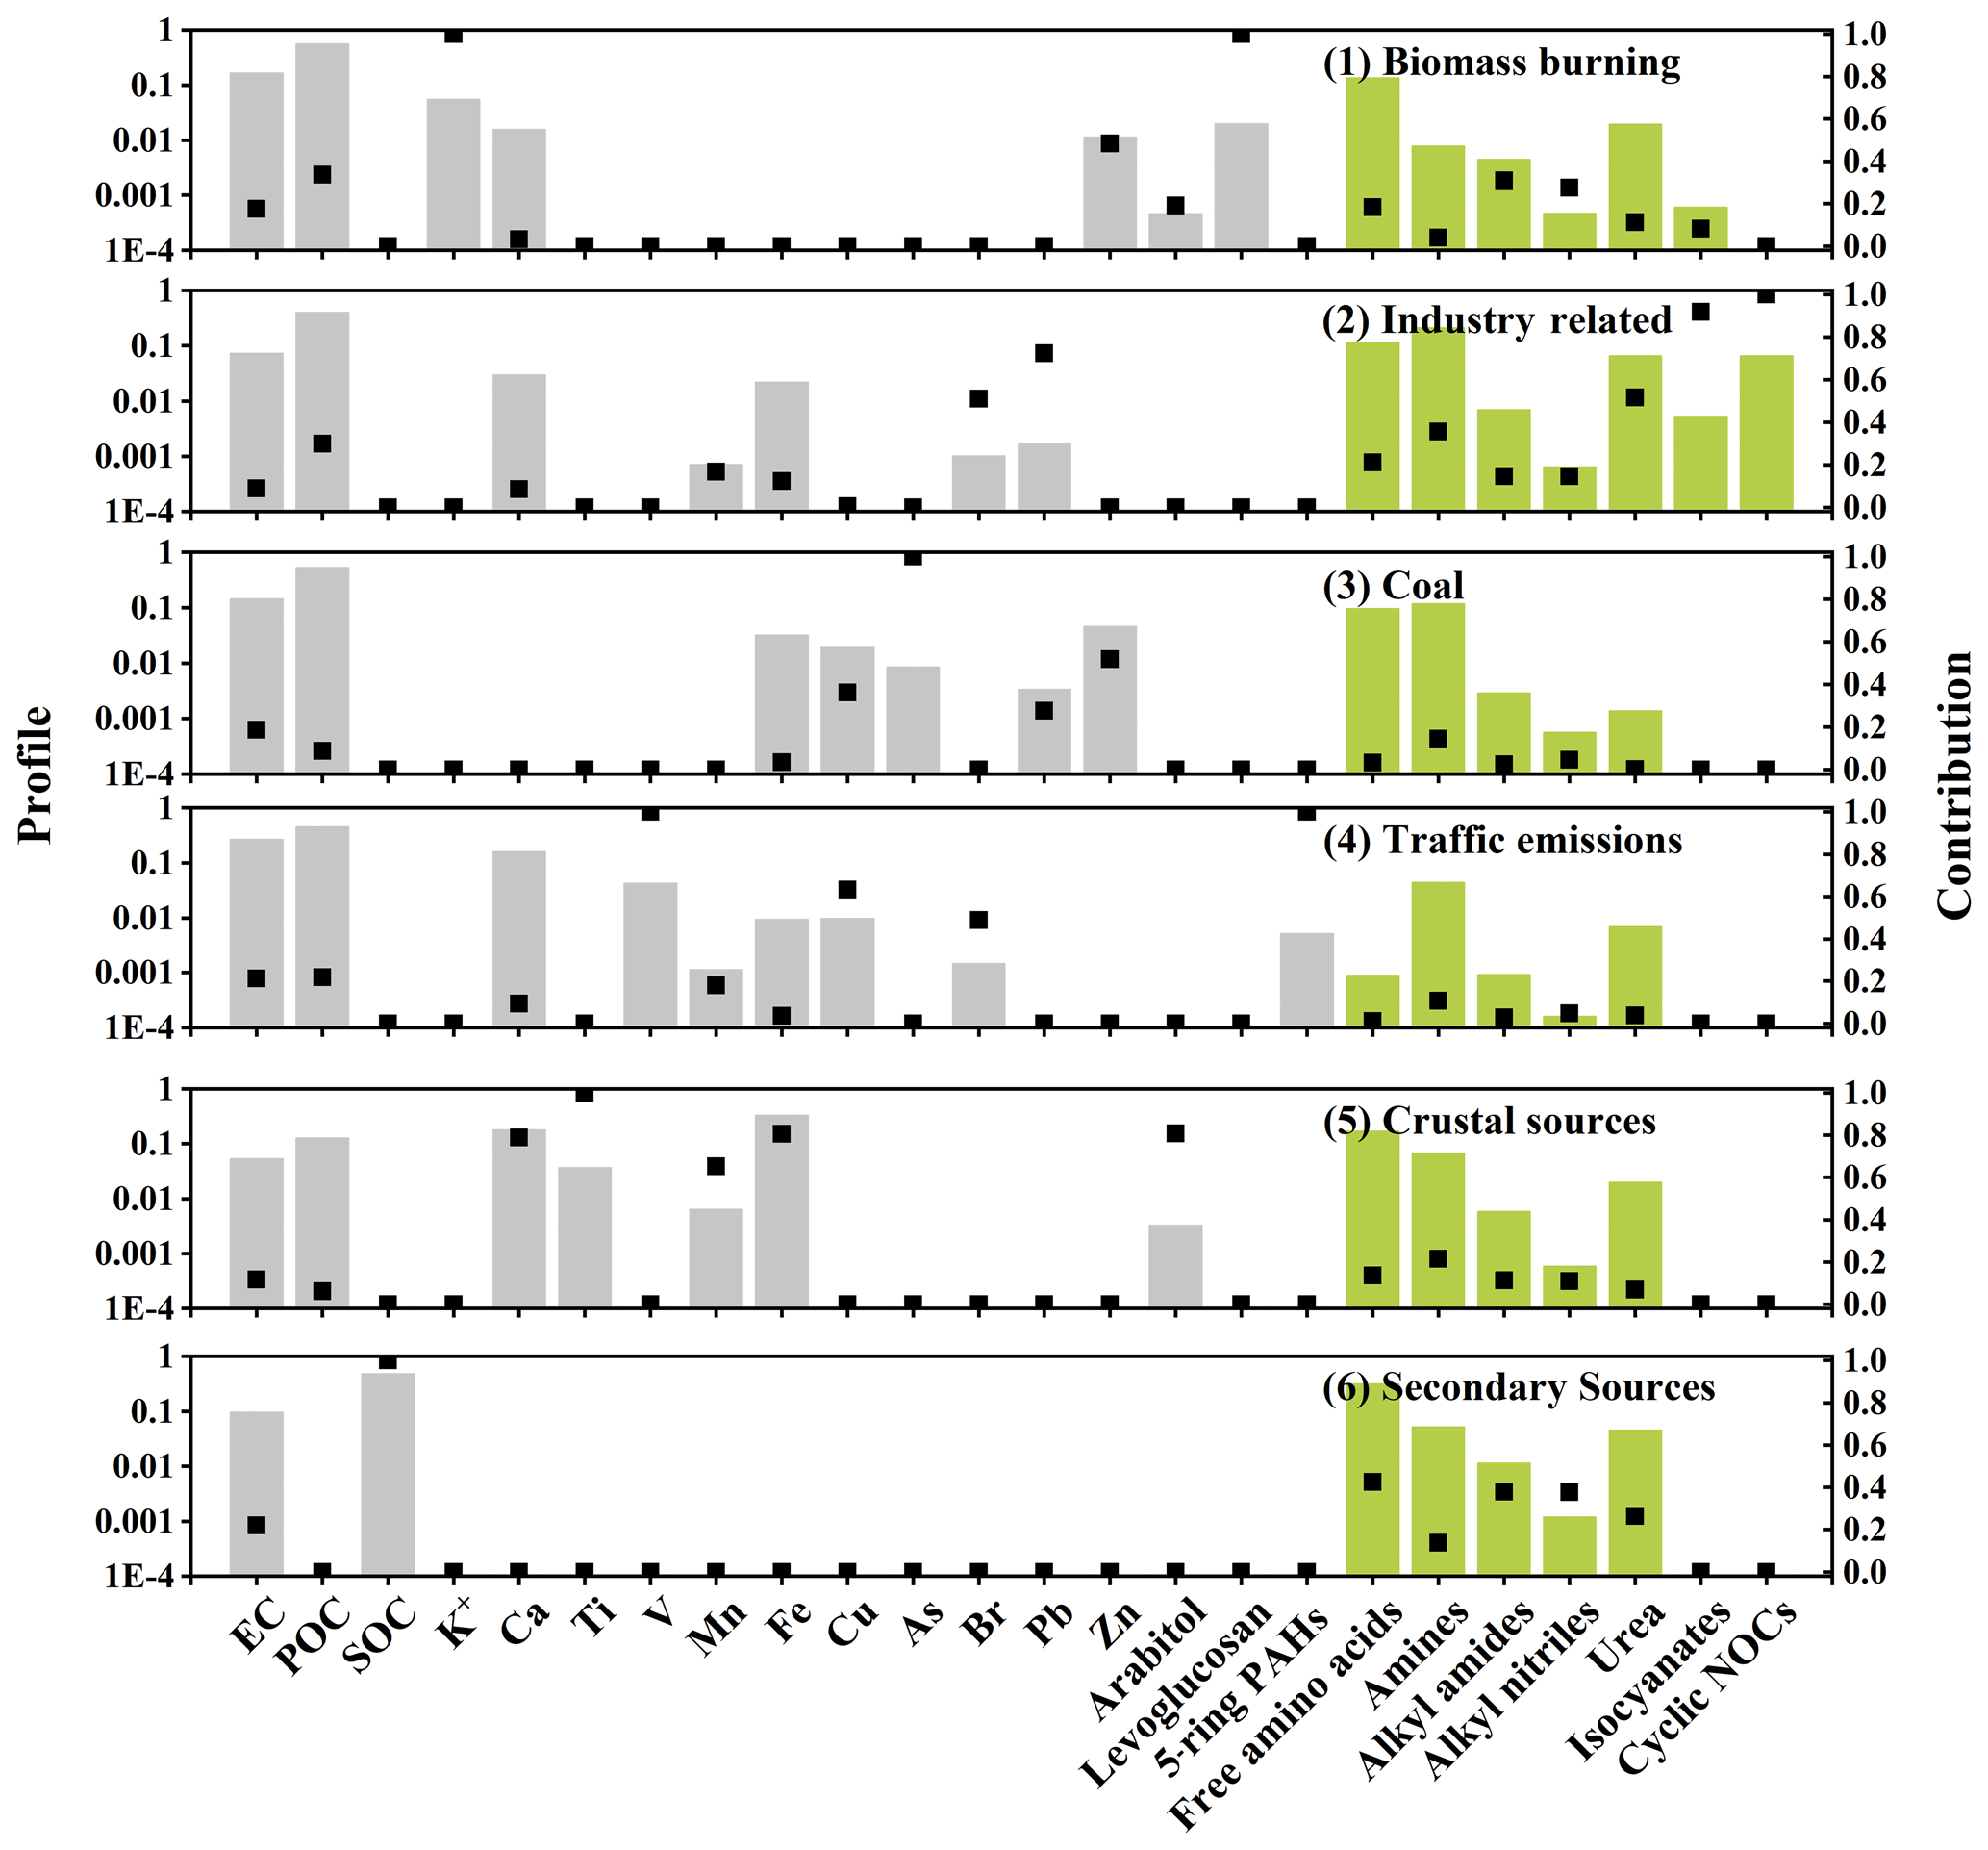
Factor 1, attributed to biomass burning, was characterized by high loadings of K+ (84.3 %) and levoglucosan (100 %), recognized tracers of biomass burning activities (Liu et al., 2021; Lin et al., 2018). This factor also has a notable Zn content (38.7 %), indicative of wood burning (Salam et al., 2013). Biomass burning contributes 26.3 % to the total NOCs, emerging as the second-largest emission category. Factor 2, associated with coal combustion, exhibits substantial loadings of As and also contains Cu, Pb, and EC. As and Pb are typical tracers of coal combustion (Qin et al., 2019), and Cu is also associated with coal combustion (Hsu et al., 2016). Factor 3 is recognized as industry-related emissions and is characterized by high loading of cyclic NOCs and isocyanates, which are synthetic compounds (Wang et al., 2022). It also exhibits a significant characteristic value of Pb, which can be released during industrial processes (Wang et al., 2015). This factor accounts for 7.6 % of NOCs. Factor 4, characterized by crustal sources, had high loadings of Ti and moderate loadings of Mn, Fe, Ca, and arabitol. These elements are acknowledged as crustal constituents (Gosselin et al., 2016), and arabitol is typically released from soil fungal spores (Wang et al., 2018), contributing 6.1 % of the total NOCs. Factor 5, linked to traffic emissions, showed high loadings of V, Br, Zn, and Cu. V acts as an indicator of heavy-oil combustion in marine vessels (Bian et al., 2018), and Br is a tracer of motor vehicle emissions (Guo et al., 2009). Emissions of Zn and Cu are associated with brake, tire, and road wear (Salameh et al., 2018; Liu et al., 2021). Factor 6, named agricultural activities, exhibited relatively high loading of urea and moderate loadings of K+, Ca, and Mn in NOCs. These elements are commonly used in agriculture (Ge et al., 2011), with K+ being crucial for plant growth and metabolic functions (Meena et al., 2014) and Mn playing a role in plant oxidation reduction (Gonçalves et al., 2022). This factor accounted for approximately 13 % of NOCs. Factor 7, ascribed to secondary sources, demonstrated considerable influence on the secondary organic carbon (SOC) variation. It was responsible for 30.2 % of the NOCs, emerging as the predominant emission source, highlighting the role of secondary production in both local and regional pollutant formation.
Figure 5 illustrates the average contributions of the seven identified sources to each NOC species and the total NOC. The analysis demonstrated that secondary sources and biomass burning were predominant, together constituting over 50 % of total NOCs (Fig. 5a). Specifically, for FAAs (Fig. 5b), secondary sources (39.6 %) and biomass burning (37.3 %) are the two major contributors, while other sources accounted for less than 10 %, including agricultural activities, crustal sources, industry-related emissions, coal combustion, and traffic emissions. The notable influence of secondary sources and biomass burning on FAAs could be attributed to increased transportation and biomass/wildfire heating in the region, consistent with findings in a previous study (Zhang et al., 2018).
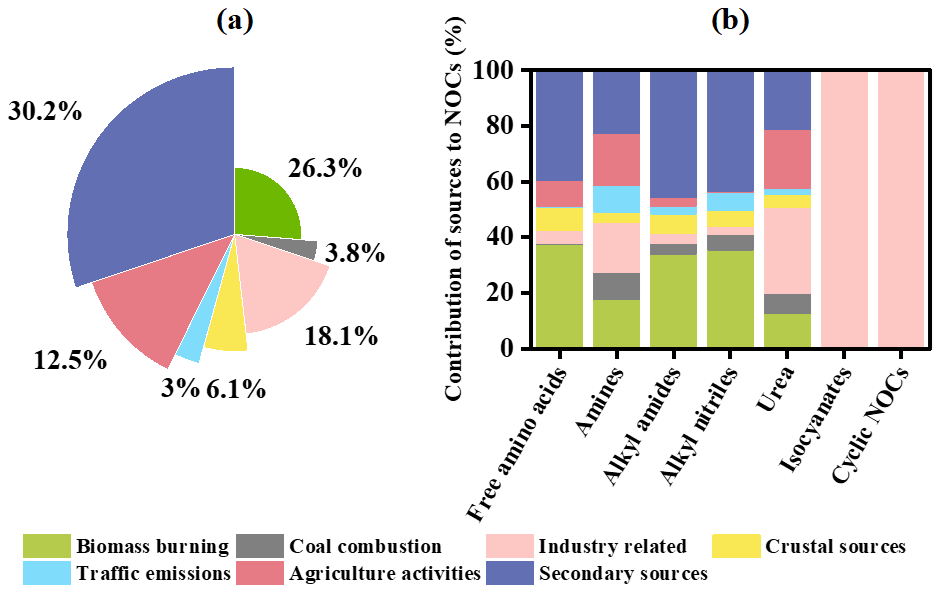
Figure 5Contributions of each source to (a) total NOCs and (b) seven classes of NOC species.
In the context of amines, agricultural activities make a notable contribution (18.8 %), twice as high as their contribution to FAAs (9.3 %). For alkyl amides and nitriles, secondary sources and biomass burning were the primary contributors, each surpassing 30 %. This contrasts with findings from another study in a different Chinese region where biomass burning is predominant in these NOC categories (Wang et al., 2022). These significant contributions from biomass burning and secondary sources underscore the impact of regional transportation on NOC sourcing within this area.
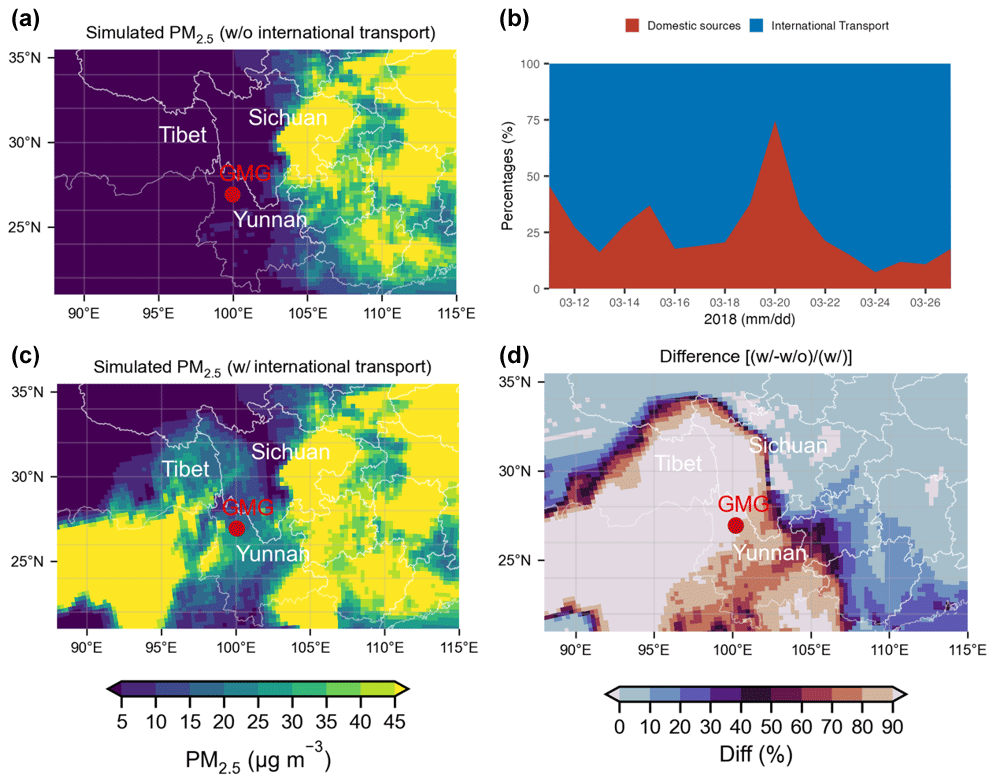
Figure 6(a) Distribution of PM2.5 concentrations resulting solely from China's domestic emissions (MEIC-China only); (b) proportionate contributions of domestic versus international PM2.5 transport during the simulation window of 11–27 March 2018; (c) distribution of PM2.5 incorporating both domestic and international transport influences (MEIC-China + MIX); (d) difference in contribution of international transport to PM2.5 concentrations, derived from the differential analysis .
3.5 Influence of long-range transport and biomass burning in Gaomeigu
Figure 6 presents the spatial distribution of PM2.5 concentrations during the high-NOC events, analyzing two scenarios: one with only domestic emissions (MEIC-China) and another incorporating both domestic and foreign emissions (MEIC-China + MIX). With solely domestic emissions considered, PM2.5 levels at the GMG and across the broader Tibet region, as well as in western Sichuan and Yunnan, were relatively low, not exceeding 5 µg m−3 (Fig. 6a). However, incorporating international transport into the analysis revealed a significant increase in PM2.5 levels at GMG, where daily concentrations exceeded 20 µg m−3 (Fig. 6c). Similarly, elevated PM2.5 concentrations, reaching above 40 µg m−3, were observed in southeastern Tibet and western Sichuan and Yunnan. Figure 6b presents the relative contributions of domestic and international emissions at GMG. The contribution from international transport varied from 25 % to 92 %, overshadowing domestic sources, which most of the time did not exceed 25 %. Notably, during the high-NOC events, such as in EP1, where biomass burning and secondary sources contributed over half of the total NOCs (Fig. S12), the contribution from international transport increased to over 80 % for the study area (Fig. 6d).
The emission inventory used in this study did not include data on NOCs; hence, NOCs were not explicitly simulated in the CMAQ model. However, the marked influence of international transport indicates that PM2.5-bound NOC species likely originated from international sources, corroborated by PSCF analysis linking NOCs to specific PMF factors (Fig. S13) and by the observed correlation between bulk PM2.5 and total NOCs (Fig. S14). The contribution hotspots in India and Myanmar indicate that the long-range transport of biomass burning emissions to the study area is facilitated by prevailing winds. Conversely, secondary NOC sources were predominantly linked to air masses from Myanmar, implying proximate secondary formation through atmospheric reactions of precursor gases and pollutants. The complex atmospheric chemistry leading to secondary NOCs includes the oxidation of precursor compounds such as volatile organic compounds (VOCs) and nitrogen oxides (NOx). Other NOCs that were not measured in this study, such as nitro-aromatics, likely contributed to the NOCs and will be the focus of future research.
Similar spatial patterns were observed for factors related to coal combustion, industry-related sources, crustal sources, traffic emissions, and agricultural activities. This implies that their contributions were associated with the proximity of the sampling site to their respective source origins. For instance, NOCs related to coal combustion were potentially transported from the nearby mining or industrial areas, while industry-related sources could have originated from regional transmission or industrial activities in the vicinity. Crustal sources, which involve the resuspension of dust particles, could be influenced by local soil conditions and wind patterns.
In conclusion, this study provides valuable insights into the composition, sources, and transport of NOCs in the study area. The average daily mass concentrations of NOCs during the campaign ranged from 714.4 to 3887.1 ng m−3, with an average of 2119.4 ± 875.0 ng m−3. The major NOC species include free amino acids (FAAs), amines, and urea, accounting for 58.9 %, 28.0 %, and 13.7 % of the major NOCs, respectively. Minor NOC species such as alkyl amides, alkyl nitriles, isocyanates, and cyclic NOCs were also identified. The PMF analysis revealed seven distinct sources of PM2.5, with biomass burning and secondary sources being the primary contributors to total NOCs. Biomass burning sources exhibited hotspots of contribution from India and Myanmar, indicating long-range transport. Secondary sources, predominantly originating from Myanmar, suggested the formation of NOCs during the transport. This is confirmed by the CMAQ modeling. The study also revealed the possible aging of NOCs from biomass burning sources as they approached the measurement site, highlighting the impact of atmospheric transformation processes. Contributions from industry-related sources, crustal sources, and agricultural activities were influenced by both regional transmission and local emissions in the vicinity of the sampling site. Overall, this research highlights the complex nature of NOCs and their sources, emphasizing the interplay between long-range transport, regional emissions, atmospheric chemistry, and local influences. These findings contribute to our understanding of air pollution dynamics and provide a basis for developing targeted mitigation strategies and policies to reduce NOC emissions and their impacts on air quality and human health in the study area and similar regions. For future research, we suggest further investigation into the specific chemical pathways involved in the formation of NOCs during atmospheric transport, which could involve controlled laboratory experiments and field studies. Additionally, more detailed source apportionment studies in different regions, including urban, rural, and remote areas, would provide a comprehensive understanding of the sources and contributions of NOCs. By addressing these areas, future research can further enhance our understanding of NOCs and inform effective policy measures to mitigate their adverse effects.
Raw data from the study as well as details on the analyses are available upon request to the contact author Meng Wang (meng-cee.wang@polyu.edu.hk).
The supplement related to this article is available online at: https://doi.org/10.5194/acp-24-11175-2024-supplement.
MW: conceptualization, methodology, validation, formal analysis, writing (original draft). QW: conceptualization, writing (review and editing), funding acquisition. SSHH: formal analysis, writing (review and editing). JT: investigation. YZ: investigation, formal analysis. SCL: resources. JC: conceptualization, writing (review and editing), funding acquisition, supervision.
The contact author has declared that none of the authors has any competing interests.
Publisher's note: Copernicus Publications remains neutral with regard to jurisdictional claims made in the text, published maps, institutional affiliations, or any other geographical representation in this paper. While Copernicus Publications makes every effort to include appropriate place names, the final responsibility lies with the authors.
This work was supported by the Second Tibetan Plateau Scientific Expedition and Research Program (STEP) (grant no. 2019QZKK0602), the National Natural Science Foundation of China (grant no. 42305122), the Natural Science Basic Research Program of Shaanxi (grant no. 2023-JC-JQ-23), and the General Research Fund (grant no. 15211522) of the Research Grants Council of the Hong Kong Special Administrative Region. Qiyuan Wang also acknowledges the support from the Youth Innovation Promotion Association of the Chinese Academy of Sciences (grant no. Y2023110).
This research has been supported by the Second Tibetan Plateau Scientific Expedition and Research Program (STEP) (grant no. 2019QZKK0602) and the National Natural Science Foundation of China (grant no. 42305122).
This paper was edited by Quanfu He and reviewed by two anonymous referees.
Abas, M. R. B. and Simoneit, B. R.: Composition of extractable organic matter of air particles from Malaysia: initial study, Atmos. Environ., 30, 2779–2793, 1996.
Akindoyo, J. O., Beg, M., Ghazali, S., Islam, M., Jeyaratnam, N., and Yuvaraj, A.: Polyurethane types, synthesis and applications – a review, RSC Adv., 6, 114453–114482, 2016.
Arun, B. S., Gogoi, M. M., Hegde, P., Borgohain, A., Boreddy, S. K. R., Kundu, S. S., and Babu, S. S.: Carbonaceous Aerosols over Lachung in the Eastern Himalayas: Primary Sources and Secondary Formation of Organic Aerosols in a Remote High-Altitude Environment, ACS Earth Space Chem., 5, 2493–2506, https://doi.org/10.1021/acsearthspacechem.1c00190, 2021.
Balducci, C., Perilli, M., Romagnoli, P., and Cecinato, A.: New developments on emerging organic pollutants in the atmosphere, Environ. Sci. Pollut. R., 19, 1875–1884, https://doi.org/10.1007/s11356-012-0815-2, 2012.
Barbaro, E., Zangrando, R., Moret, I., Barbante, C., Cescon, P., and Gambaro, A.: Free amino acids in atmospheric particulate matter of Venice, Italy, Atmos. Environ., 45, 5050–5057, https://doi.org/10.1016/j.atmosenv.2011.01.068, 2011.
Barbaro, E., Zangrando, R., Vecchiato, M., Piazza, R., Cairns, W. R. L., Capodaglio, G., Barbante, C., and Gambaro, A.: Free amino acids in Antarctic aerosol: potential markers for the evolution and fate of marine aerosol, Atmos. Chem. Phys., 15, 5457–5469, https://doi.org/10.5194/acp-15-5457-2015, 2015.
Bian, Q., Alharbi, B., Shareef, M. M., Husain, T., Pasha, M. J., Atwood, S. A., and Kreidenweis, S. M.: Sources of PM2.5 carbonaceous aerosol in Riyadh, Saudi Arabia, Atmos. Chem. Phys., 18, 3969–3985, https://doi.org/10.5194/acp-18-3969-2018, 2018.
Boreson, J., Dillner, A. M., and Peccia, J.: Correlating bioaerosol load with PM2.5 and PM10cf concentrations: a comparison between natural desert and urban-fringe aerosols, Atmos. Environ., 38, 6029–6041, https://doi.org/10.1016/j.atmosenv.2004.06.040, 2004.
Canonaco, F., Crippa, M., Slowik, J. G., Baltensperger, U., and Prévôt, A. S. H.: SoFi, an IGOR-based interface for the efficient use of the generalized multilinear engine (ME-2) for the source apportionment: ME-2 application to aerosol mass spectrometer data, Atmos. Meas. Tech., 6, 3649–3661, https://doi.org/10.5194/amt-6-3649-2013, 2013.
Chen, Y., Cao, J. J., Zhao, J., Xu, H. M., Arimoto, R., Wang, G. H., Han, Y. M., Shen, Z. X., and Li, G. H.: n-Alkanes and polycyclic aromatic hydrocarbons in total suspended particulates from the southeastern Tibetan Plateau: Concentrations, seasonal variations, and sources, Sci. Total Environ., 470, 9–18, https://doi.org/10.1016/j.scitotenv.2013.09.033, 2014.
Cheng, Y., Li, S.-M., and Leithead, A.: Chemical Characteristics and Origins of Nitrogen-Containing Organic Compounds in PM2.5 Aerosols in the Lower Fraser Valley, Environ. Sci. Technol., 40, 5846–5852, https://doi.org/10.1021/es0603857, 2006.
Cohen, S. A. and Michaud, D. P.: Synthesis of a fluorescent derivatizing reagent, 6-aminoquinolyl-N-hydroxysuccinimidyl carbamate, and its application for the analysis of hydrolysate amino acids via high-performance liquid chromatography, Anal. Biochem., 211, 279–287, https://doi.org/10.1006/abio.1993.1270, 1993.
de Vries, W.: Impacts of nitrogen emissions on ecosystems and human health: A mini review, Current Opinion in Environmental Science & Health, 21, 100249, https://doi.org/10.1016/j.coesh.2021.100249, 2021.
Duo, B., Zhang, Y. C., Kong, L. D., Fu, H. B., Hu, Y. J., Chen, J. M., Li, L., and Qiong, A.: Individual particle analysis of aerosols collected at Lhasa City in the Tibetan Plateau, J. Environ. Sci., 29, 165–177, https://doi.org/10.1016/j.jes.2014.07.032, 2015.
Ge, X., Wexler, A. S., and Clegg, S. L.: Atmospheric amines – Part I. A review, Atmos. Environ., 45, 524–546, https://doi.org/10.1016/j.atmosenv.2010.10.012, 2011.
Golling, F. E., Pires, R., Hecking, A., Weikard, J., Richter, F., Danielmeier, K., and Dijkstra, D.: Polyurethanes for coatings and adhesives–chemistry and applications, Polym. Int., 68, 848–855, 2019.
Gonçalves, J. P. Z., Seraglio, J., Macuvele, D. L. P., Padoin, N., Soares, C., and Riella, H. G.: Green synthesis of manganese based nanoparticles mediated by Eucalyptus robusta and Corymbia citriodora for agricultural applications, Colloid. Surface. A, 636, 128180, https://doi.org/10.1016/j.colsurfa.2021.128180, 2022.
Gosselin, M. I., Rathnayake, C. M., Crawford, I., Pöhlker, C., Fröhlich-Nowoisky, J., Schmer, B., Després, V. R., Engling, G., Gallagher, M., Stone, E., Pöschl, U., and Huffman, J. A.: Fluorescent bioaerosol particle, molecular tracer, and fungal spore concentrations during dry and rainy periods in a semi-arid forest, Atmos. Chem. Phys., 16, 15165–15184, https://doi.org/10.5194/acp-16-15165-2016, 2016.
Guo, H., Ding, A. J., So, K. L., Ayoko, G., Li, Y. S., and Hung, W. T.: Receptor modeling of source apportionment of Hong Kong aerosols and the implication of urban and regional contribution, Atmos. Environ., 43, 1159–1169, https://doi.org/10.1016/j.atmosenv.2008.04.046, 2009.
Han, B., Yang, W., Wang, J., Zhao, X. Y., Yin, B. H., Wang, X. H., Geng, C. M., Dou, X. Y., Xu, X., and Bai, Z. P.: Characterizations and Potential Formation Pathways of Atmospheric Inorganic Ions at a National Background Site in the Northeastern Qinghai-Tibet Plateau During Autumn Season, J. Geophys. Res.-Atmos., 125, e2020JD032819, https://doi.org/10.1029/2020jd032819, 2020.
Hejna, A., Barczewski, M., Kosmela, P., Mysiukiewicz, O., Tercjak, A., Piasecki, A., Saeb, M. R., and Szostak, M.: Sustainable chemically modified poly (butylene adipate-co-terephthalate)/thermoplastic starch/poly (ε-caprolactone)/cellulose biocomposites: looking at the bulk through the surface, J. Mater. Sci., 59, 1327–1347, 2024.
Ho, K. F., Ho, S. S. H., Huang, R.-J., Liu, S. X., Cao, J.-J., Zhang, T., Chuang, H.-C., Chan, C. S., Hu, D., and Tian, L.: Characteristics of water-soluble organic nitrogen in fine particulate matter in the continental area of China, Atmos. Environ., 106, 252–261, https://doi.org/10.1016/j.atmosenv.2015.02.010, 2015.
Ho, S. S. H., Li, L., Qu, L., Cao, J., Lui, K. H., Niu, X., Lee, S.-C., and Ho, K. F.: Seasonal behavior of water-soluble organic nitrogen in fine particulate matter (PM2.5) at urban coastal environments in Hong Kong, Air Qual. Atmos. Hlth., 12, 389–399, https://doi.org/10.1007/s11869-018-0654-5, 2019.
Hsu, C.-Y., Chiang, H.-C., Lin, S.-L., Chen, M.-J., Lin, T.-Y., and Chen, Y.-C.: Elemental characterization and source apportionment of PM10 and PM2.5 in the western coastal area of central Taiwan, Sci. Total Environ., 541, 1139–1150, https://doi.org/10.1016/j.scitotenv.2015.09.122, 2016.
Lesage, J., DeGraff, I., and Danchik, R.: Isocyanates: Sampling, Analysis, and Health Effects, ASTM International, https://doi.org/10.1520/stp1408-eb, 2001.
Leung, C. W., Wang, X., and Hu, D.: Characteristics and source apportionment of water-soluble organic nitrogen (WSON) in PM2.5 in Hong Kong: with focus on amines, urea, and nitroaromatic compounds, J. Hazard. Mater., 469, 133899. https://doi.org/10.1016/j.jhazmat.2024.133899, 2024.
Li, M., Zhang, Q., Kurokawa, J.-I., Woo, J.-H., He, K., Lu, Z., Ohara, T., Song, Y., Streets, D. G., Carmichael, G. R., Cheng, Y., Hong, C., Huo, H., Jiang, X., Kang, S., Liu, F., Su, H., and Zheng, B.: MIX: a mosaic Asian anthropogenic emission inventory under the international collaboration framework of the MICS-Asia and HTAP, Atmos. Chem. Phys., 17, 935–963, https://doi.org/10.5194/acp-17-935-2017, 2017.
Li, W. J., Chen, S. R., Xu, Y. S., Guo, X. C., Sun, Y. L., Yang, X. Y., Wang, Z. F., Zhao, X. D., Chen, J. M., and Wang, W. X.: Mixing state and sources of submicron regional background aerosols in the northern Qinghai–Tibet Plateau and the influence of biomass burning, Atmos. Chem. Phys., 15, 13365–13376, https://doi.org/10.5194/acp-15-13365-2015, 2015.
Li, Y., Fu, T.-M., Yu, J. Z., Yu, X., Chen, Q., Miao, R., Zhou, Y., Zhang, A., Ye, J., Yang, X., Tao, S., Liu, H., and Yao, W.: Dissecting the contributions of organic nitrogen aerosols to global atmospheric nitrogen deposition and implications for ecosystems, Natl. Sci. Rev., 10, nwad244, https://doi.org/10.1093/nsr/nwad244, 2023.
Lin, C., Huang, R.-J., Ceburnis, D., Buckley, P., Preissler, J., Wenger, J., Rinaldi, M., Facchini, M. C., O'Dowd, C., and Ovadnevaite, J.: Extreme air pollution from residential solid fuel burning, Nat. Sustain., 1, 512–517, https://doi.org/10.1038/s41893-018-0125-x, 2018.
Lin, C., Huang, R.-J., Duan, J., Zhong, H., and Xu, W.: Primary and Secondary Organic Nitrate in Northwest China: A Case Study, Environ. Sci. Tech. Let., 8, 947–953, https://doi.org/10.1021/acs.estlett.1c00692, 2021.
Liu, H., Wang, Q., Xing, L., Zhang, Y., Zhang, T., Ran, W., and Cao, J.: Measurement report: quantifying source contribution of fossil fuels and biomass-burning black carbon aerosol in the southeastern margin of the Tibetan Plateau, Atmos. Chem. Phys., 21, 973–987, https://doi.org/10.5194/acp-21-973-2021, 2021.
Meena, V. S., Maurya, B., and Verma, J. P.: Does a rhizospheric microorganism enhance K+ availability in agricultural soils?, Microbiol. Res., 169, 337–347, 2014.
Meng, J. J., Wang, G. H., Li, J. J., Cheng, C. L., and Cao, J. J.: Atmospheric oxalic acid and related secondary organic aerosols in Qinghai Lake, a continental background site in Tibet Plateau, Atmos. Environ., 79, 582–589, https://doi.org/10.1016/j.atmosenv.2013.07.024, 2013.
Milne, P. J. and Zika, R. G.: Amino acid nitrogen in atmospheric aerosols: Occurrence, sources and photochemical modification, J. Atmos. Chem., 16, 361–398, https://doi.org/10.1007/BF01032631, 1993.
Mopper, K. and Zika, R. G.: Free amino acids in marine rains: evidence for oxidation and potential role in nitrogen cycling, Nature, 325, 246–249, https://doi.org/10.1038/325246a0, 1987.
Murphy, B. N., Nolte, C. G., Sidi, F., Bash, J. O., Appel, K. W., Jang, C., Kang, D., Kelly, J., Mathur, R., Napelenok, S., Pouliot, G., and Pye, H. O. T.: The Detailed Emissions Scaling, Isolation, and Diagnostic (DESID) module in the Community Multiscale Air Quality (CMAQ) modeling system version 5.3.2, Geosci. Model Dev., 14, 3407–3420, https://doi.org/10.5194/gmd-14-3407-2021, 2021.
Nawrot, T. S., Alfaro-Moreno, E., and Nemery, B.: Update in occupational and environmental respiratory disease 2007, Am. J. Resp. Crit. Care, 177, 696–700, 2008.
Nielsen, C. J., Herrmann, H., and Weller, C.: Atmospheric chemistry and environmental impact of the use of amines in carbon capture and storage (CCS), Chem. Soc. Rev., 41, 6684–6704, https://doi.org/10.1039/C2CS35059A, 2012.
Petit, J. E., Favez, O., Albinet, A., and Canonaco, F.: A user-friendly tool for comprehensive evaluation of the geographical origins of atmospheric pollution: Wind and trajectory analyses, Environ. Modell. Softw., 88, 183–187, 2017.
Priestley, M., Le Breton, M., Bannan, T. J., Leather, K. E., Bacak, A., Reyes-Villegas, E., De Vocht, F., Shallcross, B. M. A., Brazier, T., Anwar Khan, M., Allan, J., Shallcross, D. E., Coe, H., and Percival, C. J.: Observations of Isocyanate, Amide, Nitrate, and Nitro Compounds From an Anthropogenic Biomass Burning Event Using a ToF-CIMS, J. Geophys. Res.-Atmos., 123, 7687–7704, https://doi.org/10.1002/2017JD027316, 2018.
Qin, X., Wang, X., Shi, Y., Yu, G., Zhao, N., Lin, Y., Fu, Q., Wang, D., Xie, Z., Deng, C., and Huang, K.: Characteristics of atmospheric mercury in a suburban area of east China: sources, formation mechanisms, and regional transport, Atmos. Chem. Phys., 19, 5923–5940, https://doi.org/10.5194/acp-19-5923-2019, 2019.
Ran, L., Deng, Z., Wu, Y., Li, J., Bai, Z., Lu, Y., Zhuoga, D., and Bian, J.: Measurement report: Vertical profiling of particle size distributions over Lhasa, Tibet – tethered balloon-based in situ measurements and source apportionment, Atmos. Chem. Phys., 22, 6217–6229, https://doi.org/10.5194/acp-22-6217-2022, 2022.
Richardson, S. D. and Ternes, T. A.: Water Analysis: Emerging Contaminants and Current Issues, Anal. Chem., 90, 398–428, https://doi.org/10.1021/acs.analchem.7b04577, 2018.
Ruiz-Jiménez, J., Hautala, S., Parshintsev, J., Laitinen, T., Hartonen, K., Petäjä, T., Kulmala, M., and Riekkola, M.-L.: Aliphatic and aromatic amines in atmospheric aerosol particles: Comparison of three ionization techniques in liquid chromatography-mass spectrometry and method development, Talanta, 97, 55–62, https://doi.org/10.1016/j.talanta.2012.03.062, 2012.
Salam, A., Hasan, M., Begum, B. A., Begum, M., and Biswas, S. K.: Chemical characterization of biomass burning deposits from cooking stoves in Bangladesh, Biomass Bioenerg., 52, 122–130, https://doi.org/10.1016/j.biombioe.2013.03.010, 2013.
Salameh, D., Pey, J., Bozzetti, C., El Haddad, I., Detournay, A., Sylvestre, A., Canonaco, F., Armengaud, A., Piga, D., Robin, D., Prevot, A. S. H., Jaffrezo, J. L., Wortham, H., and Marchand, N.: Sources of PM2.5 at an urban-industrial Mediterranean city, Marseille (France): Application of the ME-2 solver to inorganic and organic markers, Atmos. Res., 214, 263–274, https://doi.org/10.1016/j.atmosres.2018.08.005, 2018.
Shi, J., Gao, H., Qi, J., Zhang, J., and Yao, X.: Sources, compositions, and distributions of water-soluble organic nitrogen in aerosols over the China Sea, J. Geophys. Res.-Atmos., 115, D17303, https://doi.org/10.1029/2009JD013238, 2010.
Simoneit, B. R. T., Rushdi, A. I., bin Abas, M. R., and Didyk, B. M.: Alkyl Amides and Nitriles as Novel Tracers for Biomass Burning, Environ. Sci. Technol., 37, 16–21, https://doi.org/10.1021/es020811y, 2003.
Song, T., Wang, S., Zhang, Y., Song, J., Liu, F., Fu, P., Shiraiwa, M., Xie, Z., Yue, D., Zhong, L., Zheng, J., and Lai, S.: Proteins and Amino Acids in Fine Particulate Matter in Rural Guangzhou, Southern China: Seasonal Cycles, Sources, and Atmospheric Processes, Environ. Sci. Technol., 51, 6773–6781, https://doi.org/10.1021/acs.est.7b00987, 2017.
Sorooshian, A., Murphy, S. M., Hersey, S., Gates, H., Padro, L. T., Nenes, A., Brechtel, F. J., Jonsson, H., Flagan, R. C., and Seinfeld, J. H.: Comprehensive airborne characterization of aerosol from a major bovine source, Atmos. Chem. Phys., 8, 5489–5520, https://doi.org/10.5194/acp-8-5489-2008, 2008.
Tan, T., Hu, M., Du, Z., Zhao, G., Shang, D., Zheng, J., Qin, Y., Li, M., Wu, Y., Zeng, L., Guo, S., and Wu, Z.: Measurement report: Strong light absorption induced by aged biomass burning black carbon over the southeastern Tibetan Plateau in pre-monsoon season, Atmos. Chem. Phys., 21, 8499–8510, https://doi.org/10.5194/acp-21-8499-2021, 2021.
Trapp, S. and Eggen, T.: Simulation of the plant uptake of organophosphates and other emerging pollutants for greenhouse experiments and field conditions, Environ. Sci. Pollut. R., 20, 4018–4029, https://doi.org/10.1007/s11356-012-1337-7, 2013.
Wang, M., Wang, Q., Ho, S. S. H., Li, H., Zhang, R., Ran, W., Qu, L., Lee, S.-C., and Cao, J.: Chemical characteristics and sources of nitrogen-containing organic compounds at a regional site in the North China Plain during the transition period of autumn and winter, Sci. Total Environ., 812, 151451, https://doi.org/10.1016/j.scitotenv.2021.151451, 2022.
Wang, Q., Han, Y., Ye, J., Liu, S., Pongpiachan, S., Zhang, N., Han, Y., Tian, J., Wu, C., Long, X., Zhang, Q., Zhang, W., Zhao, Z., and Cao, J.: High Contribution of Secondary Brown Carbon to Aerosol Light Absorption in the Southeastern Margin of Tibetan Plateau, Geophys. Res. Lett., 46, 4962–4970, https://doi.org/10.1029/2019gl082731, 2019a.
Wang, Q., Huang, X. H. H., Tam, F. C. V., Zhang, X., Liu, K. M., Yeung, C., Feng, Y., Cheng, Y. Y., Wong, Y. K., Ng, W. M., Wu, C., Zhang, Q., Zhang, T., Lau, N. T., Yuan, Z., Lau, A. K. H., and Yu, J. Z.: Source apportionment of fine particulate matter in Macao, China with and without organic tracers: A comparative study using positive matrix factorization, Atmos. Environ., 198, 183–193, https://doi.org/10.1016/j.atmosenv.2018.10.057, 2019b.
Wang, Q. Q., Huang, X. H., Zhang, T., Zhang, Q., Feng, Y., Yuan, Z., Wu, D., Lau, A. K., and Yu, J. Z.: Organic tracer-based source analysis of PM2.5 organic and elemental carbon: A case study at Dongguan in the Pearl River Delta, China, Atmos. Environ., 118, 164–175, 2015.
Wang, X., Shen, Z., Liu, F., Lu, D., Tao, J., Lei, Y., Zhang, Q., Zeng, Y., Xu, H., Wu, Y., Zhang, R., and Cao, J.: Saccharides in summer and winter PM2.5 over Xi'an, Northwestern China: Sources, and yearly variations of biomass burning contribution to PM2.5, Atmos. Res., 214, 410–417, https://doi.org/10.1016/j.atmosres.2018.08.024, 2018.
Wu, C. and Yu, J. Z.: Determination of primary combustion source organic carbon-to-elemental carbon (OC EC) ratio using ambient OC and EC measurements: secondary OC-EC correlation minimization method, Atmos. Chem. Phys., 16, 5453–5465, https://doi.org/10.5194/acp-16-5453-2016, 2016.
Yu, X., Li, Q., Liao, K., Li, Y., Wang, X., Zhou, Y., Liang, Y., and Yu, J. Z.: New measurements reveal a large contribution of nitrogenous molecules to ambient organic aerosol, npj Clim. Atmos. Sci., 7, 72, https://doi.org/10.1038/s41612-024-00620-6, 2024.
Yuan, G. L., Wu, M. Z., Sun, Y., Li, J., Li, J. C., and Wang, G. H.: One century of air deposition of hydrocarbons recorded in travertine in North Tibetan Plateau, China: Sources and evolution, Sci. Total Environ., 560, 212–217, https://doi.org/10.1016/j.scitotenv.2016.03.227, 2016.
Zhang, N. N., Cao, J. J., Wang, Q. Y., Huang, R. J., Zhu, C. S., Xiao, S., and Wang, L. L.: Biomass burning influences determination based on PM2.5 chemical composition combined with fire counts at southeastern Tibetan Plateau during pre-monsoon period, Atmos. Res., 206, 108–116, https://doi.org/10.1016/j.atmosres.2018.02.018, 2018.
Zhang, Q. and Anastasio, C.: Free and combined amino compounds in atmospheric fine particles (PM2.5) and fog waters from Northern California, Atmos. Environ., 37, 2247–2258, https://doi.org/10.1016/S1352-2310(03)00127-4, 2003.
Zhang, X., Xu, J., Kang, S., Zhang, Q., and Sun, J.: Chemical characterization and sources of submicron aerosols in the northeastern Qinghai–Tibet Plateau: insights from high-resolution mass spectrometry, Atmos. Chem. Phys., 19, 7897–7911, https://doi.org/10.5194/acp-19-7897-2019, 2019.
Zhang, X. H., Xu, J. Z., and Kang, S. C.: Chemical characterization of submicron particulate matter (PM1) emitted by burning highland barley in the northeastern part of the Qinghai-Tibet Plateau, Atmos. Environ., 224, 117351, https://doi.org/10.1016/j.atmosenv.2020.117351, 2020.
Zhao, W. H., Zhang, X. H., Zhai, L. X., Shen, X. J., and Xu, J. Z.: Chemical characterization and sources of submicron aerosols in Lhasa on the Qinghai-Tibet Plateau: Insights from high-resolution mass spectrometry, Sci. Total Environ., 815, 152866, https://doi.org/10.1016/j.scitotenv.2021.152866, 2022.
Zhao, Z. Z., Cao, J. J., Shen, Z. X., Huang, R. J., Hu, T. F., Wang, P., Zhang, T., and Liu, S. X.: Chemical composition of PM2.5 at a high-altitude regional background site over Northeast of Tibet Plateau, Atmos. Pollut. Res., 6, 815–823, https://doi.org/10.5094/APR.2015.090, 2015.
Zhao, Z. Z., Wang, Q. Y., Li, L., Han, Y. M., Ye, Z. L., Pongpiachan, S., Zhang, Y., Liu, S. X., Tian, R. X., and Cao, J. J.: Characteristics of PM2.5 at a High-Altitude Remote Site in the Southeastern Margin of the Tibetan Plateau in Premonsoon Season, Atmosphere-Basel, 10, 645, https://doi.org/10.3390/atmos10110645, 2019.
Zhu, R.-G., Xiao, H.-Y., Zhu, Y., Wen, Z., Fang, X., and Pan, Y.: Sources and Transformation Processes of Proteinaceous Matter and Free Amino Acids in PM2.5, J. Geophys. Res.-Atmos., 125, e2020JD032375, https://doi.org/10.1029/2020JD032375, 2020.