the Creative Commons Attribution 4.0 License.
the Creative Commons Attribution 4.0 License.
 | 26 Sep 2024
Measurement report: The Fifth International Workshop on Ice Nucleation phase 1 (FIN-01): intercomparison of single-particle mass spectrometers
David M. Bell
Naruki Hiranuma
Fabian Mahrt
Nicholas A. Marsden
Claudia Mohr
Daniel M. Murphy
Harald Saathoff
Johannes Schneider
Jacqueline Wilson
Maria A. Zawadowicz
Alla Zelenyuk
Paul J. DeMott
Ottmar Möhler
Daniel J. Cziczo
Knowledge of the chemical composition and mixing state of aerosols at a single-particle level is critical for gaining insights into atmospheric processes. One common tool to make these measurements is single-particle mass spectrometry. There remains a need to compare the performance of different single-particle mass spectrometers (SPMSs). An intercomparison of SPMSs was conducted at the Aerosol Interaction and Dynamics in the Atmosphere (AIDA) chamber at the Karlsruhe Institute of Technology (KIT) in November 2014, as part of the first phase of the Fifth International Workshop on Ice Nucleation (FIN-01). In this paper we compare size distributions and mass spectra of atmospherically relevant particle types measured by five SPMSs. These include different minerals, desert and soil dusts, soot, bioaerosol (Snomax; protein granule), secondary organic aerosol (SOA), and SOA-coated mineral particles. Most SPMSs reported similar vacuum aerodynamic diameter (dva) within typical instrumental ranges from ∼100–200 nm (lower limit) to ∼2–3 µm (upper limit). In general, all SPMSs exhibited a wide dynamic range (up to ∼103) and high signal-to-noise ratio (up to ∼104) in mass spectra. Common spectral features with small diversities in mass spectra were found with high average Pearson's correlation coefficients, i.e., for average positive spectra ravg-pos=0.74 ± 0.12 and average negative spectra ravg-neg=0.67 ± 0.22. We found that instrument-specific detection efficiency (DE) was more dependent on particle size than particle type, and particle identification favored the use of bipolar, rather than monopolar, instruments. Particle classification from “blind experiments” showed that all instruments differentiated SOA, soot, and soil dust and detected subtle changes in the particle internal mixing but had difficulties differentiating among specific mineral types and dusts. This study helps to further understand the capabilities and limitations of the single-particle mass spectrometry technique in general and the specific performance of the instrument in characterizing atmospheric aerosol particles.
- Article
(4508 KB) - Full-text XML
-
Supplement
(2828 KB) - BibTeX
- EndNote


Aerosol–cloud interactions are one of the largest uncertainties in the climate system (IPCC, 2021). A considerable source of uncertainty is related to an insufficient understanding of how the chemical composition of aerosols affects their ability to act as cloud condensation nuclei (CCN) and ice-nucleating particles (INPs). Both CCN and INPs influence cloud formation, microphysical and radiative properties, and precipitation formation and hence impact climate and the hydrological cycle (Lohmann et al., 2016). Studying INPs is particularly challenging given that in the atmosphere only ∼1 in ∼105 particles act as an INP (Rogers et al., 1998). The low number concentration of INPs and the complex atmospheric aging processes that can affect the particle's ability to nucleate ice, including the acquisition of coatings and/or evaporation of components (Cziczo et al., 2009; Friedman et al., 2011; Möhler et al., 2008), can challenge current measurement techniques (Cziczo et al., 2003, 2017; Fuzzi et al., 2015; Kanji et al., 2017). Knowledge of chemical composition and mixing state on a single-particle level is therefore critical to understanding atmospheric processes and correctly predicting atmospheric impacts (Riemer et al., 2019).
In the past 3 decades, in situ and real-time single-particle mass spectrometry has been widely used to characterize the size and composition of individual particles (Murphy, 2007). Corresponding studies have led to an improved understanding of internal and external mixing of ambient aerosol particles, particle origins, and chemical transformations (Noble and Prather, 2000; Pratt and Prather, 2012). The first airborne single-particle chemical characterization of cirrus ice residues (IRs, the particle remaining after ice crystal sublimation) was in the Cirrus Regional Study of Tropical Anvils and Cirrus Layers-Florida Area Cirrus Experiment (CRYSTAL-FACE) in 2001 (Cziczo et al., 2004). Since then, the single-particle mass spectrometer (SPMS) has emerged as a powerful tool for assessing the chemical composition of ice-nucleating particles (INPs) and for direct measurements of IRs (Cornwell et al., 2019; Cziczo et al., 2003, 2006, 2009, 2013, 2017; Cziczo and Froyd, 2014; DeMott et al., 2003; Kamphus et al., 2010; Lacher et al., 2021; Lin et al., 2017; Pratt and Prather, 2009; Roth et al., 2016; Sullivan et al., 2010). This was one of the major motivating factors for organizing the intercomparison of SPMSs within the framework of the Fifth International Ice Nucleation (FIN) workshops, which sought to conduct comprehensive comparisons of instruments in both laboratory and field settings. Further information about the FIN workshops can be found in DeMott et al. (2011, 2018). The first phase (FIN-01), focused on intercomparing SPMSs, was conducted at the Aerosol Interaction and Dynamics in the Atmosphere (AIDA) chamber located at the Karlsruhe Institute of Technology (KIT) in November 2014.
Since their inception, SPMS design has varied from instrument to instrument while also continuously undergoing improvements (Brands et al., 2011; Clemen et al., 2020; Cziczo et al., 2006; Dragoneas et al., 2022; Du et al., 2024; Erdmann et al., 2005; Gaie-Levrel et al., 2012; Gemayel et al., 2016; Hünig et al., 2022; Jacquot et al., 2024; Li et al., 2011; Marsden et al., 2016; Passig et al., 2020; Prather et al., 1994; Thomson et al., 2000; Trimborn et al., 2000; Zawadowicz et al., 2020; Zelenyuk et al., 2009a, 2015; Zelenyuk and Imre, 2005). Unlike the Aerodyne Aerosol Mass Spectrometer (AMS), used for bulk measurements of non-refractory aerosol components (DeCarlo et al., 2006), no commercial instrument has dominated SPMS design. Design choices and technical details were reviewed by Murphy (2007). SPMSs have various characteristics, some of which are instrument specific, but instruments have some similar components, including an inlet system, a particle detection and sizing region, an ionization region, and one or two mass spectrometers. Here, we will briefly describe some of these key features.
-
The first feature is a critical orifice, capillary, or aerodynamic lens (ADL) inlet to transmit and focus particles into a narrow beam in a low-pressure region (Davis, 1977; Liu et al., 1995; Murphy and Thomson, 1995).
-
The second feature is a detection and sizing region using one or two continuous-wave (CW) lasers, e.g., 532 nm neodymium-doped yttrium aluminum garnet (Nd : YAG) or 405 nm laser diodes. In this region, particle light scattering and the vacuum aerodynamic diameter (dva) of individual particles are determined and recorded. Particles with dva from ∼100 nm up to ∼3 µm are generally detected. Detection is influenced by several factors, such as the particle size, shape, morphology, and optical properties of particles; the wavelength, power, and beam dimensions of the detection lasers; and the distance between two lasers (Gemayel et al., 2016; Sinha and Friedlander, 1985; Su et al., 2004).
-
The third feature is an ion source region where one or two laser pulses provide laser desorption and ionization (LDI). This allows for subsequent identification of most particulate components from volatile and semi-volatile to refractory. For one-step LDI, a pulsed UV laser, e.g., a 193 nm argon fluoride (ArF) excimer or 266 nm Nd : YAG laser, is triggered to ablate and ionize the particle after detection (McKeown et al., 1991; Prather et al., 1994). Two-step LDI often employs an infrared (IR) pulse (e.g., CO2 laser) for desorption followed by a lower-wavelength pulse for ionization (Cabalo et al., 2000; Zelenyuk et al., 1999, 2009a). Two-step LDI is commonly used to reduce ion fragmentation (Morrical et al., 1998; Zelenyuk et al., 2009b). In addition, as part of the ionization occurs in the particle's gaseous plume, quantification can be improved (Woods et al., 2001), and resonance effects can be used to increase the sensitivity to organics (Passig et al., 2022; Schade et al., 2019).
-
The fourth feature is the inclusion of one or two mass spectrometers, most commonly time-of-flight (ToF) mass spectrometers, used for the measurement of ions (Gard et al., 1997; Murphy and Thomson, 1995).
There are limitations inherent to laser ablation and ionization of atmospheric particles with respect to reproducibility of mass spectra and quantitative assessment of single-particle composition. The complexity of LDI mechanisms varies between instruments due to ionization laser wavelength and laser power intensity at the point of ablation or ionization. Different SPMSs may have differences in completeness of particle ablation, leading to diversity in spectral signatures (Murphy, 2007; Reilly et al., 2000; Reinard and Johnston, 2008; Thomson et al., 1997; Zenobi and Knochenmuss, 1998). Effort has been put in to refining particle identification but quantification of specific particle components remains a challenge (Allen et al., 2006, 2000; Bein et al., 2006; Fergenson et al., 2001; Froyd et al., 2019; Gallavardin et al., 2008; Gemayel et al., 2017; Gross et al., 2000; Gunsch et al., 2018; Hatch et al., 2014; Healy et al., 2013; Jeong et al., 2011; Köllner et al., 2017; Lu et al., 2018; Marsden et al., 2018, 2019; May et al., 2018; Qin et al., 2006; Ramisetty et al., 2018; Shen et al., 2018, 2019; Wenzel et al., 2003; Zawadowicz et al., 2017, 2020; Zhou et al., 2016). Data analysis and classification methods used by different SPMSs can also differ substantially.
Intercomparisons of SPMSs and data analysis methods remain rare (Kamphus et al., 2010; Lacher et al., 2021; Middlebrook et al., 2003; Murphy et al., 2007). Middlebrook et al. (2003) reported a comparison of SPMSs, including the Particle Analysis by Laser Mass Spectrometer (PALMS, National Oceanic and Atmospheric Administration, NOAA), Aerosol Time-of-Flight Mass Spectrometer (ATOFMS, University of California at Riverside), and Rapid Single-Particle Mass Spectrometer II (RSMS-II, University of Delaware) during the Atlanta Supersite Project in 1999. They found comparable particle classes with similar number fractions measured by the three SPMSs for the entire measurement period. Murphy et al. (2007) showed a geographically broad distribution of lead in single particles by comparing and combing the results from aircraft and ground-based measurements of different SPMSs: PALMS, a commercial ATOFMS (Model 3800, TSI, USA), and RSMS. Kamphus et al. (2010) compared the Single Particle Laser-Ablation Time-of-Flight Mass Spectrometer (SPLAT, Max Planck Institute for Chemistry, MPIC) and a commercial ATOFMS at the Jungfraujoch research station and showed comparable results for IRs and droplet residuals. They also reported differences due to different ionization lasers and detection efficiencies for the two instruments. In a similar study, Lacher et al. (2021) showed comparable results of total aerosol composition from the Aircraft-based Laser ABlation Aerosol MAss Spectrometer (ALABAMA, MPIC) and the Laser Ablation Aerosol Time-of-Flight Mass Spectrometer (LAAPTOF, AeroMegt GmbH, Germany) for ambient measurements at the Jungfraujoch.
One of the main goals of FIN-01 was to intercompare some of the major SPMSs used for atmospheric aerosol research. This included the custom-built instruments PALMS (Massachusetts Institute of Technology, MIT) (Cziczo et al., 2006), ALABAMA (MPIC) (Brands et al., 2011), and miniSPLAT (Pacific Northwest National Laboratory, PNNL) (Zelenyuk et al., 2015) and the commercial instruments ATOFMS (TSI Model 3800, USA; from the Eidgenössische Technische Hochschule, ETH) (Gard et al., 1997; Prather et al., 1994) and LAAPTOF (AeroMegt GmbH, Germany; from University of Manchester, UoM) (Marsden et al., 2016).
The specific objectives of FIN-01 were as follows:
-
to compare mass spectral signatures for key atmospheric particle types, including desert and soil dusts, soot and biological particles, and particles with coatings;
-
to compare instrument performance and data analysis techniques in “blind experiments”, where participants did not know the particle types being sampled;
-
to evaluate the SPMSs' ability to measure the chemical composition of IRs.
This paper provides an overview of FIN-01. Experiments on particles with coatings by organics are discussed in more detail elsewhere (Bertozzi, 2022; Bertozzi et al., 2024).
More than 90 independent experiments were conducted during the FIN-01 workshop. Nine co-located SPMSs and ancillary aerosol characterization instruments were utilized. Here we focus on a subset, 14 specific experiments, targeting the objectives listed above. Data were provided for five of the nine SPMSs deployed during FIN-01: ALABAMA, miniSPLAT, PALMS, a commercial ATOFMS, and a commercial LAAPTOF.
2.1 SPMSs
Table 1 summarizes the main components and performance parameters of the five SPMSs. Note that the values summarized in Table 1 and presented in this section are attributions to the current literature and were not independently verified during FIN-01. All instruments have been described in detail previously (Brands et al., 2011; Cziczo et al., 2006; Gard et al., 1997; Gemayel et al., 2016; Marsden et al., 2016; Prather et al., 1994; Schmidt et al., 2017; Shen et al., 2018; Su et al., 2004; Zelenyuk et al., 2015). They are functionally similar, but some instrumental differences are noteworthy. For example, all instruments used an ADL but not with the same inlet flow rate. Laser wavelength, laser power, focal spot size, and beam direction varied across the instruments. Laser differences can impact the following measurement parameters.
-
Detectable particle size range varies across the instruments as PALMS, LAAPTOF, and ATOFMS detected a similar size range of ∼100–200 nm to ∼3 µm dva; ALABAMA detected a narrower range of ∼200 nm to ∼1 µm dva; and miniSPLAT detected ∼50 nm to ∼1.4 µm dm (electrical mobility diameter).
-
All instruments exhibited size-dependent detection efficiency (DE) for spherical polystyrene latex (PSL) particles. DE is defined as the ratio of the number of particles detected and/or sized to the total number of particles entering the inlet. Most instruments also exhibit a less pronounced size dependence on morphology. It is important to note that DE for miniSPLAT has been defined differently from the other SPMSs. MiniSPLAT operates simultaneously in a “dual data acquisition mode”, where the size distribution is determined at a rate up to several thousand particles per second, while single-particle mass spectra and corresponding dva are acquired at a rate similar to the other SPMSs, ∼20 particles per second (Zelenyuk et al., 2015). For particle size measurements, miniSPLAT often uses a dilution stage to lower aerosol number density to reduce the coincidence of multiple particles in the detection laser beams. The variable amount of dilution for FIN-01 was not reported and is therefore not addressed in this paper. The DE of miniSPLAT, for comparison to the other instruments, can be referenced either to the ratio of total particles sized after the dilution stage or the ratio of the particles for which the laser was triggered. The former is a more direct comparison of DE to the other SPMSs, but both are presented here for clarity. Note that the other SPMSs run in a single acquisition mode which records single-particle mass spectra and corresponding sizes. Most often, particles size distributions are acquired by separate instruments running in parallel. This difference in methodology leads to differences in terminology, which are described here when relevant.
-
Hit rate (HR) also varies between the instruments. HR is most commonly defined as the ratio of the number of useful spectra generated to the number of detected particles. PALMS had a HR of ∼95 % without obvious size or shape dependency (Cziczo et al., 2006), largely due to the proximity of the final detection beam and the ablation and ionization location. Other instruments had larger distances between detection and ablation, often due to the time required between laser trigger and firing. ALABAMA exhibited a size-dependent HR of ∼1 % and ∼75 % for PSL of 200 and 400 nm, respectively (Brands et al., 2011), ATOFMS exhibited ∼57 % for 90 nm and ∼93 % for 290 nm PSL (Su et al., 2004), and the UoM LAAPTOF had maximum HR of 70 %. Note that miniSPLAT has defined HR differently than the other SPMSs, as the ratio of the number of usable mass spectra to the number of laser triggers (Zelenyuk et al., 2015). This definition is specific to miniSPLAT, due to the aforementioned dual data acquisition mode. In this paper the former, more general, definition of HR is used.
-
Finally, mass-spectra-quality-related parameters, e.g., mass resolution, dynamic range of the ion signals, and signal-to-noise ratio (SNR), are also impacted. The aforementioned size detection ranges and DE and mass spectra obtained in FIN-01 are examined and compared in Sect. 3.1.
Table 1SPMSs, performance parameters, and data analysis methods.
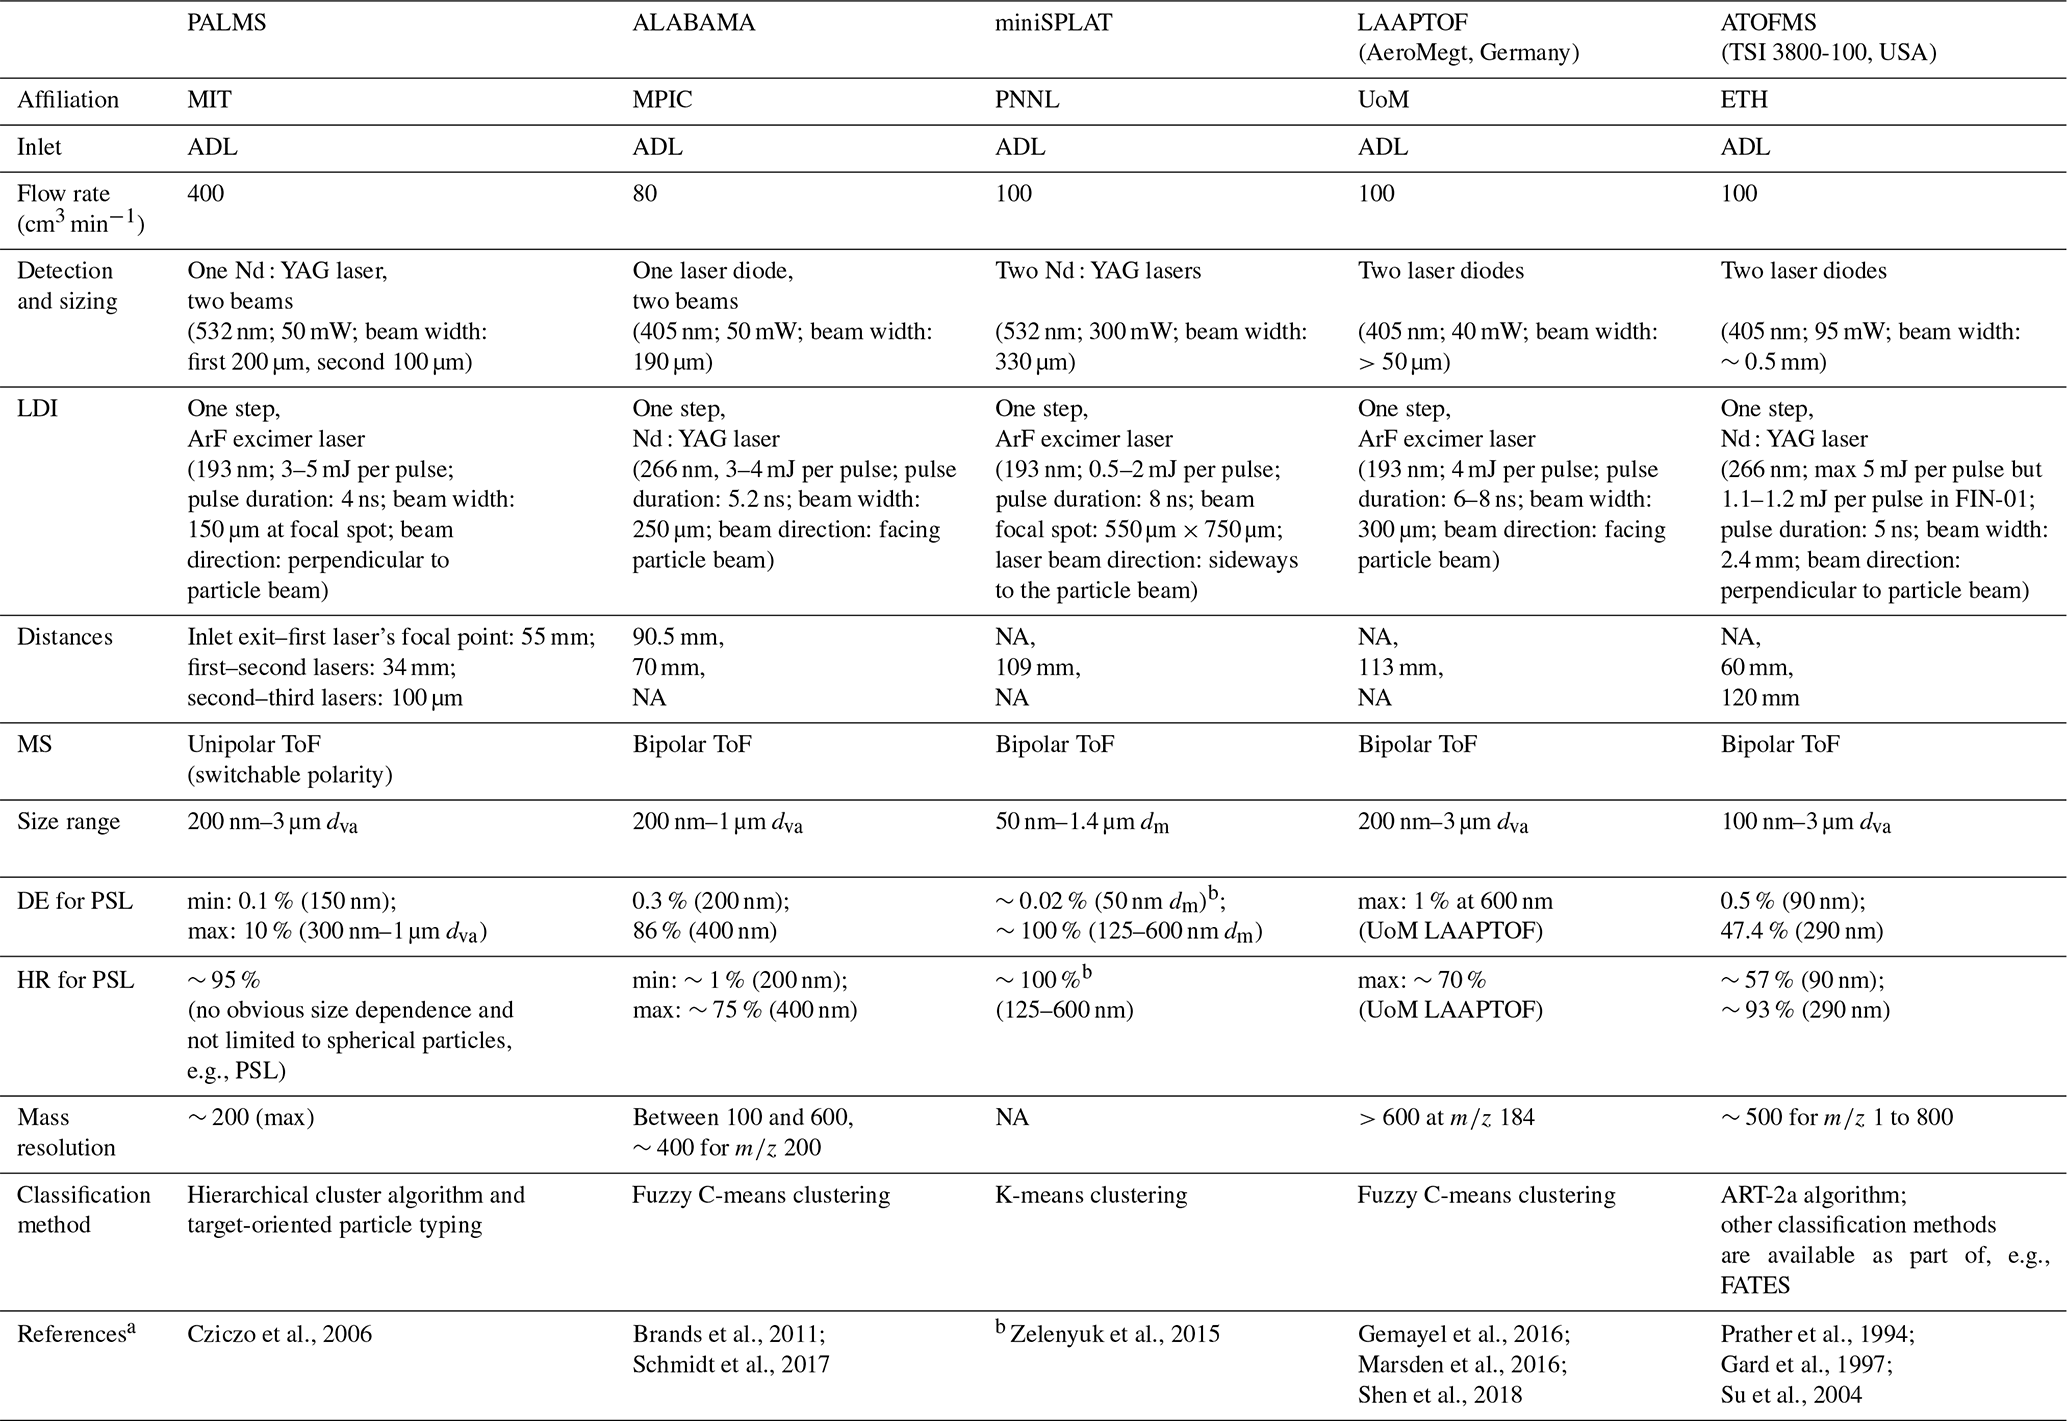
a Note that the references for the commercial instruments are not limited to the specific ones used in this study. b Note that the terminology in DE and HR in the miniSPLAT reference is different from the other SPMSs (see the text for details). NA stands for not available.
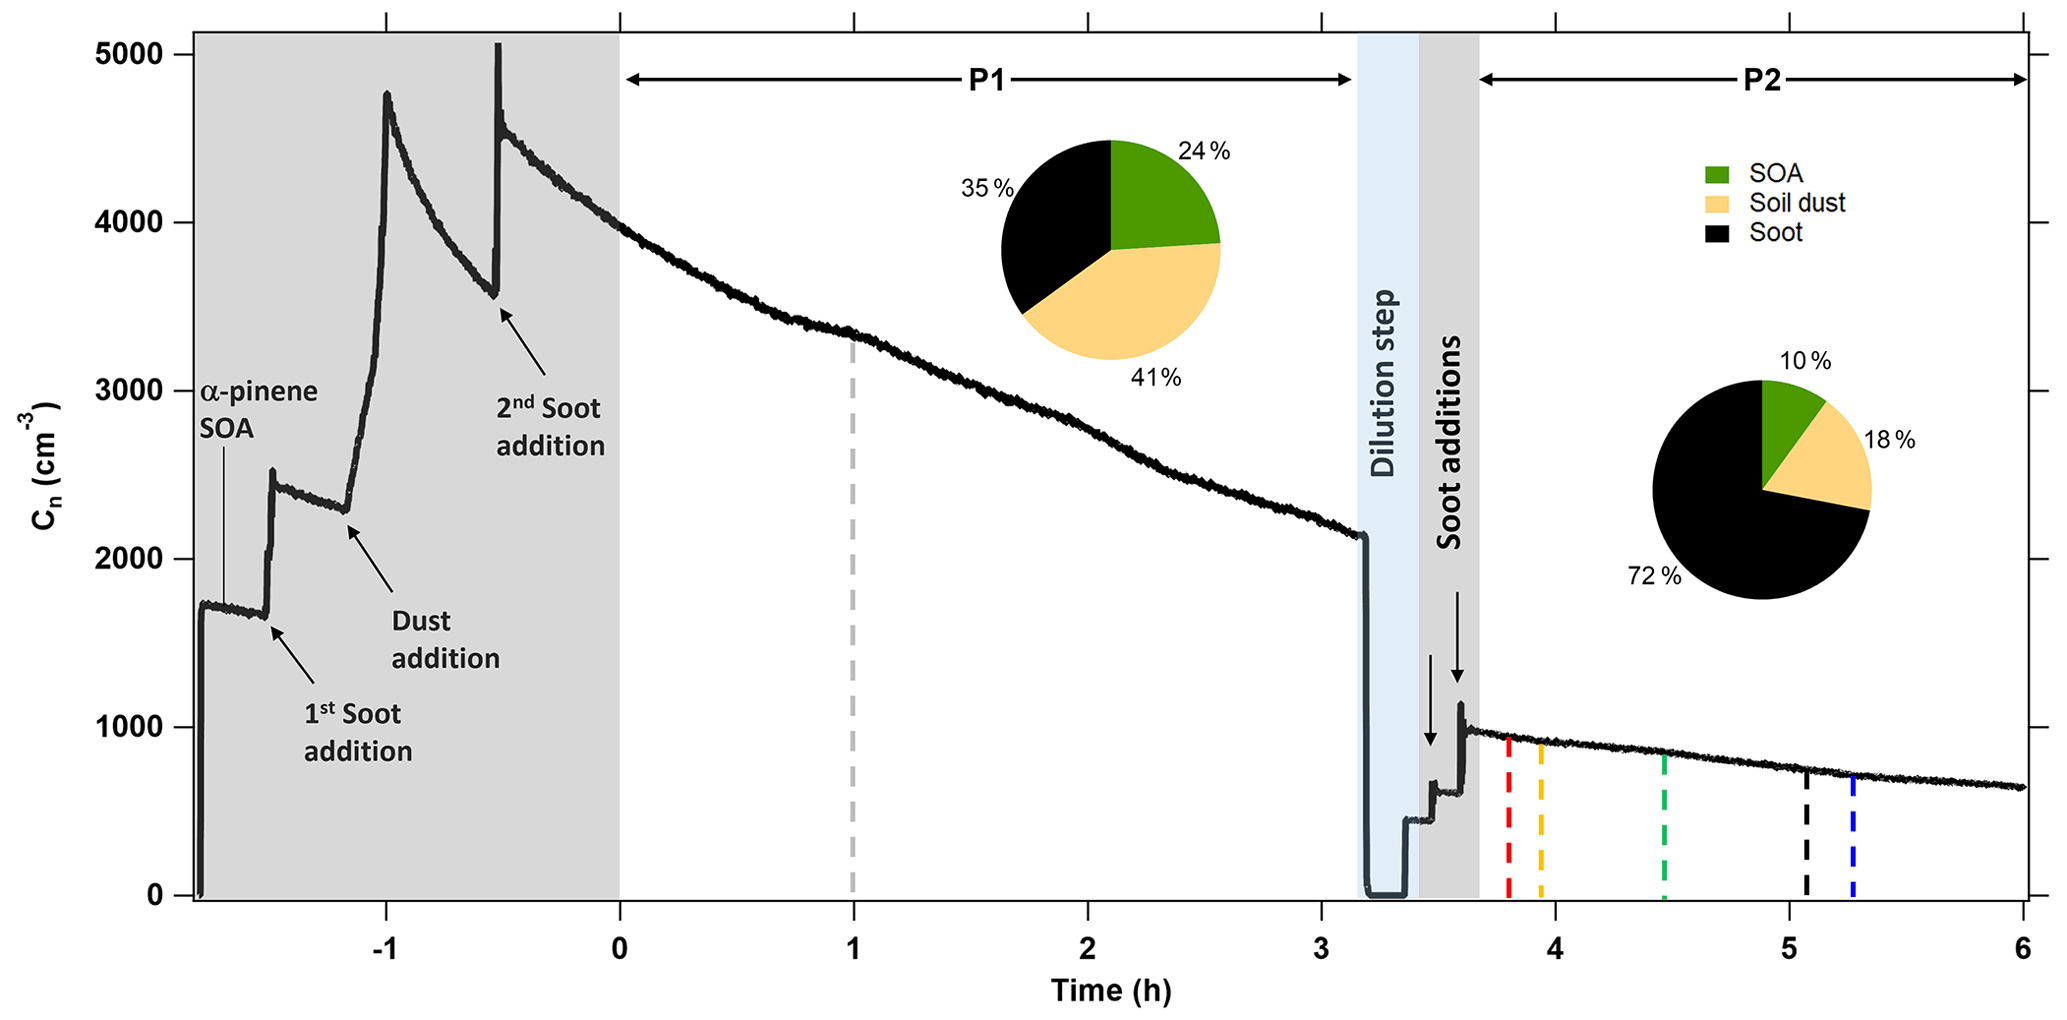
Figure 1Time series of total particle Cn measured by a CPC in the APC chamber during the blind experiments. SPMS measurements were conducted during two periods: P1 and P2. In P1, the SPMSs started sampling at the same time (dashed grey line), with the exception of miniSPLAT, which started 15 min later. In P2, sampling started at different times (dashed red, orange, green, black, and blue lines are for PALMS, ATOFMS, LAAPTOF, miniSPLAT, and ALABAMA, respectively). The pie charts denote particle types and their number fractions in P1 and P2, respectively. Note that the shaded grey and blue areas denote the aerosol mixture preparation periods and a dilution step when the chamber was partly pumped out and refilled with clean air, respectively.
In order to reduce data complexity, so-called “clustering algorithms” have been used to classify or categorize particle mass spectra, i.e., groups of mass spectra that share spectral similarities. Examples of such clustering algorithms include K-means, fuzzy C-means, ART-2a neural network, and hierarchical clustering (Gross et al., 2010; Murphy et al., 2003; Reitz et al., 2016; Zelenyuk et al., 2006, 2008b). The methods used to analyze data collected by the SPMSs deployed during FIN-01 are summarized in Table 1. Because the individual methods have been previously published, we refrain from a detailed description of the different analysis algorithms to instead focus on comparing the resulting grouped data from FIN-01.
2.2 Ancillary instruments
Additional instruments used during FIN-01 included multiple condensation particle counters with different size ranges (CPC, TSI, models 3010, 3022, and 3025), a scanning mobility particle sizer (SMPS, TSI, Inc., Model 3081 differential mobility analyzer, DMA, and Model 3010 CPC), and an aerodynamic particle sizer (APS, TSI Inc., Model 3321) to measure the particle size distributions.
2.3 Experiments
Experiments were conducted using two chambers at KIT: the 84 m3 AIDA chamber and the 3.7 m3 stainless steel aerosol preparation and characterization (APC) chamber (Möhler et al., 2001, 2003; Saathoff et al., 2003). The aerosol particles and associated generation methods are summarized in Table 2. The placement of SPMSs during FIN-01 was used to minimize distance to the AIDA and APC chambers and is shown in Fig. S1 in the Supplement. Specific details of the coating experiments can be found in Bertozzi (2022).
Table 2Aerosol types, properties, composition, and generation techniques.
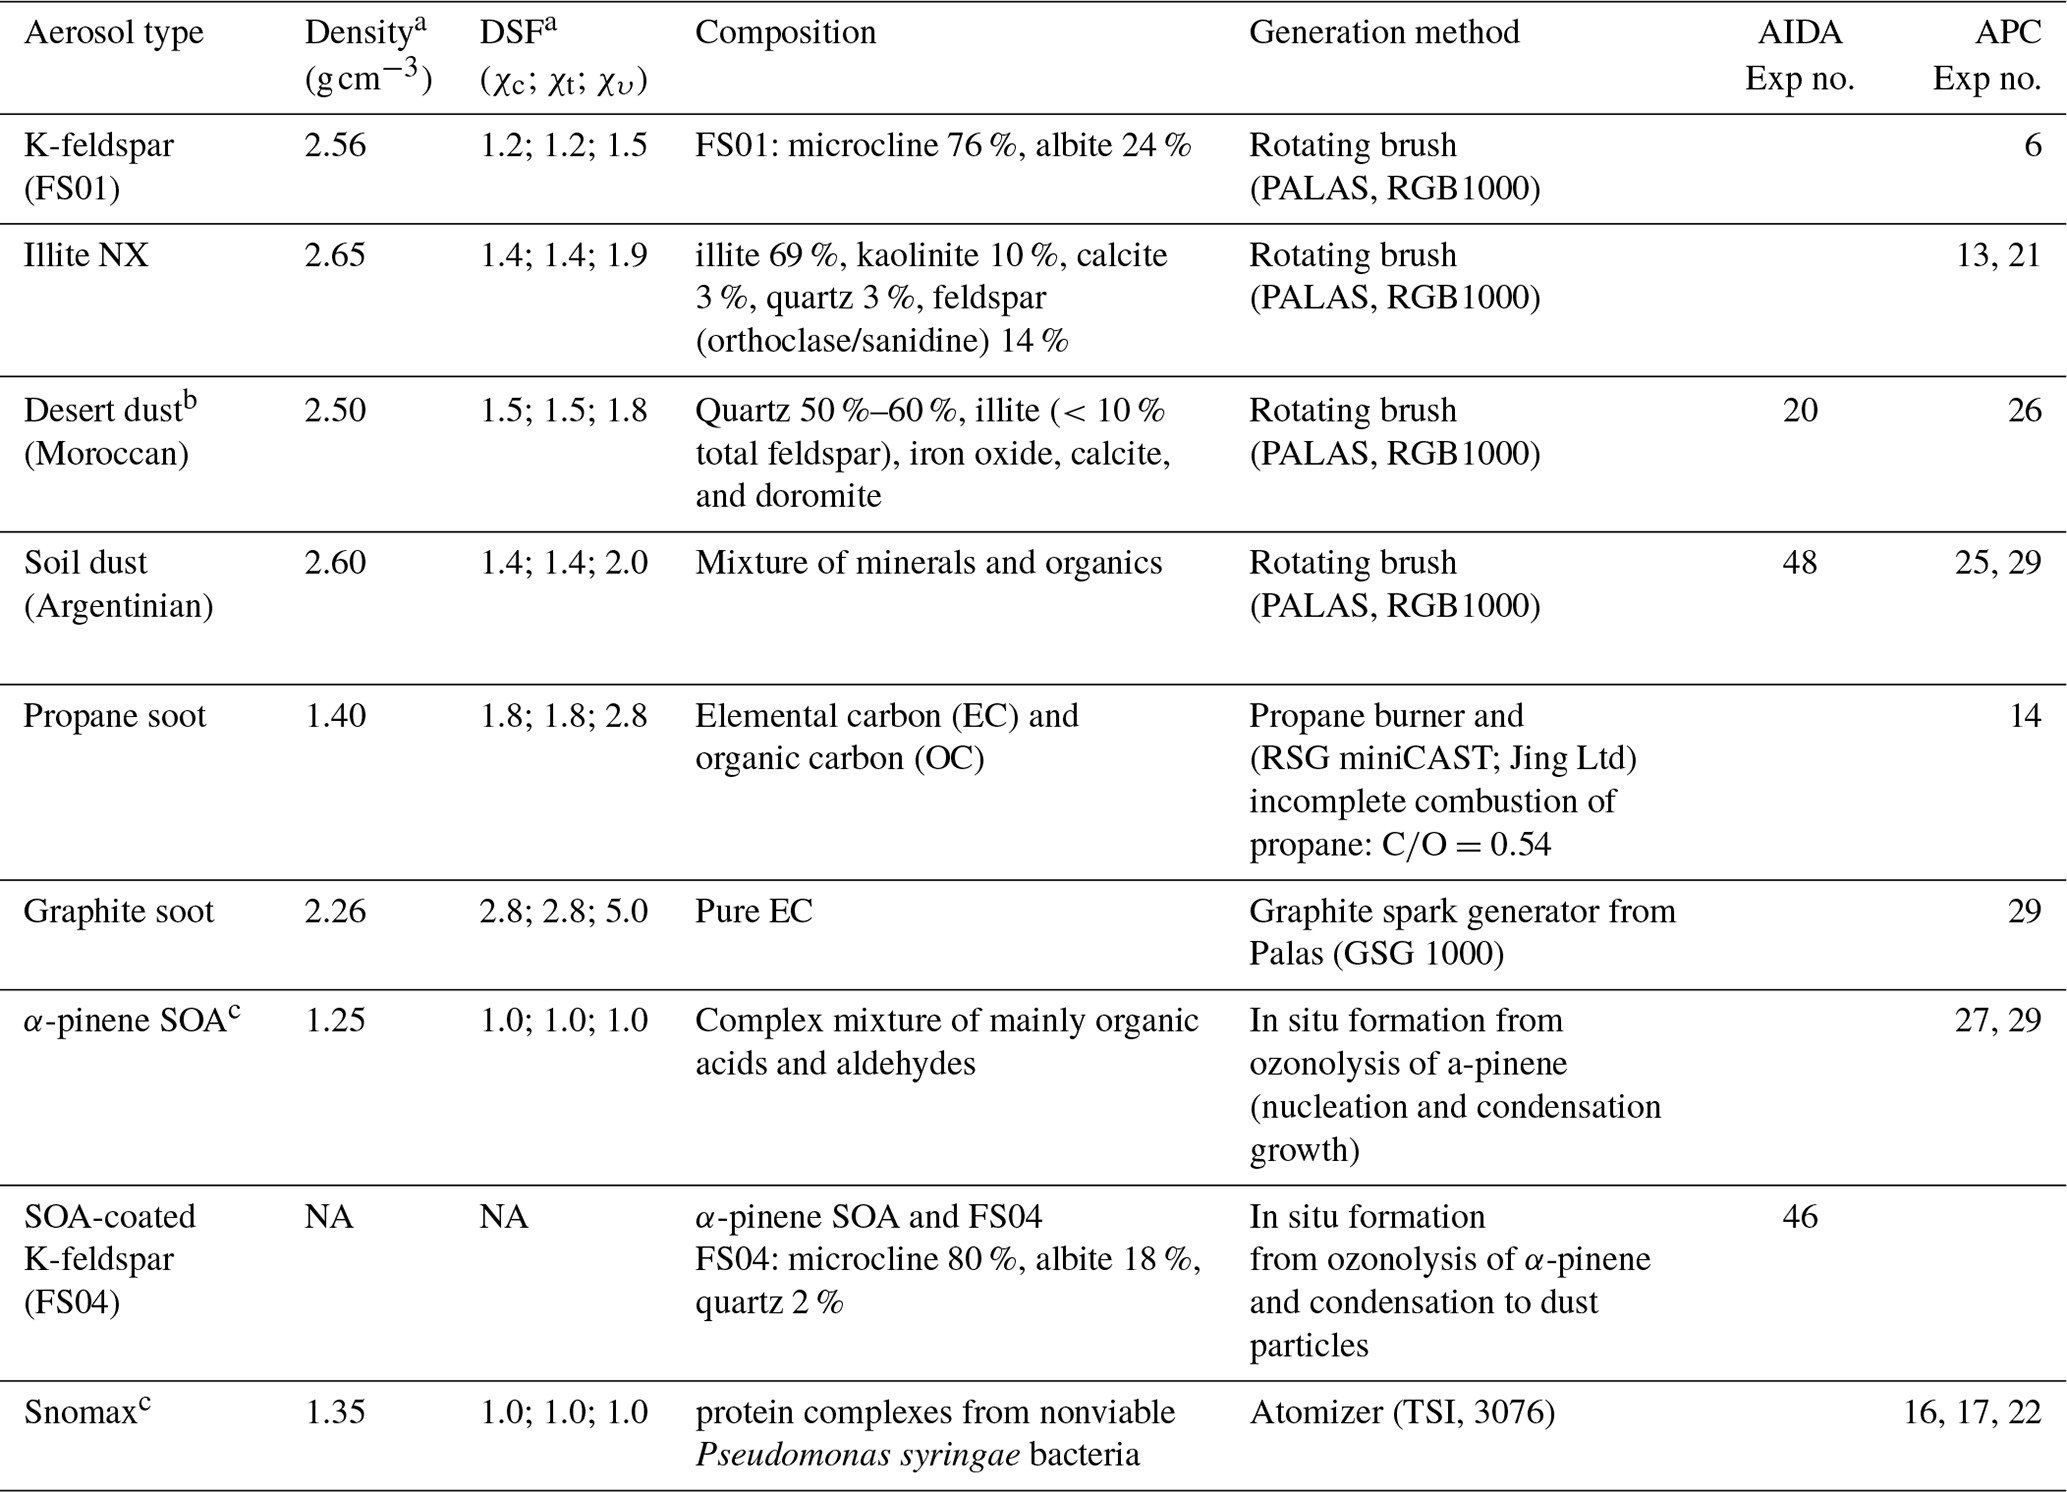
a For most of the particle samples, the particle density and DSF in transitional and free molecular flow regimes, χt and χυ, were obtained from the measurements by miniSPLAT during FIN-01 as described in Alexander et al. (2016). χt is near the continuum flow limit; for simplicity we assume χc (not measured) is equal to χt. b For desert dust, particle density and DSF is described in Froyd et al. (2019). c For α-pinene SOA and Snomax sphericity is assumed (); therefore, the densities shown here are the effective density. Additional details can be found in Zelenyuk et al. (2008a), Saathoff et al. (2009), and Wex et al. (2015). NA stands for not available.
A subset of experiments was termed “blind experiments” with a goal of comparing results from the SPMSs where the aerosol composition was not known by the instrument teams a priori. The blind experiments were conducted under the direction of three referees, not associated with specific instrument teams. The referees added different particle types to the APC chamber and then collected results before disclosure of the chamber contents. The objective of the referees was to provide a range of mass spectral signatures and particle sizes. After injection, the SPMSs sampled the (unknown) particle mixture directly from APC chamber. Groups then provided results to the referees without discussion with referees or other teams. As shown in Fig. 1, there were two blind experiment periods (P1 and P2), each with a duration of 2 to 3 h. The particle samples added at the start of P1 were α-pinene secondary organic aerosol (SOA), Argentinian soil dust, and elemental carbon soot (GSG generator; hereafter, graphite soot). Prior to P2, particle-free air was added to the chamber (i.e., dilution), and more graphite soot was added. The number percentage of α-pinene SOA, Argentinian soil dust, and graphite soot was approximately 24 %, 41 %, and 35 %, respectively, in P1. After dilution and soot addition this mixture was (of α-pinene SOA, Argentinian soil dust, and graphite soot) 10 %, 18 %, and 72 %, respectively, in P2. The fractions were estimated based on (a) the total particle number concentration (Cn) measured by CPC, (b) an assumption of equal wall loss rate for all the particles, and (c) an assumption of no formation of new particle types.
3.1 SPMS performance
3.1.1 Particle size and detection efficiency
Polydisperse samples were used during FIN-01. The particle size measured by the SPMSs was dva in the free molecular regime (da measured by PALMS is assumed equivalent to dva), while the ancillary instruments measured the electrical mobility diameter (dm, SMPS) in the transition regime or aerodynamic diameter in the continuum regime (dca, APS). The differences between dva, dca, and dm are due to non-unity density and non-spherical shape factors of the samples. A comprehensive discussion of the differences can be found in, e.g., DeCarlo et al. (2004) and Slowik et al. (2004). To facilitate comparison, we converted dm and dca to dva using the following equations. It is assumed that particles have no voids and that slip correction is ignored:
where ρ0 is unit density (1 g cm−3); ρp is particle density; and χc, χt, and χυ are the dynamic shape factors (DSFs) in the continuum, transition, and free molecular regime, respectively. The values of the parameters used in this study are listed in Table 2; fm and fca are defined as the conversion factors for dm and dca, respectively. Additional details can be found in DeCarlo et al. (2004).
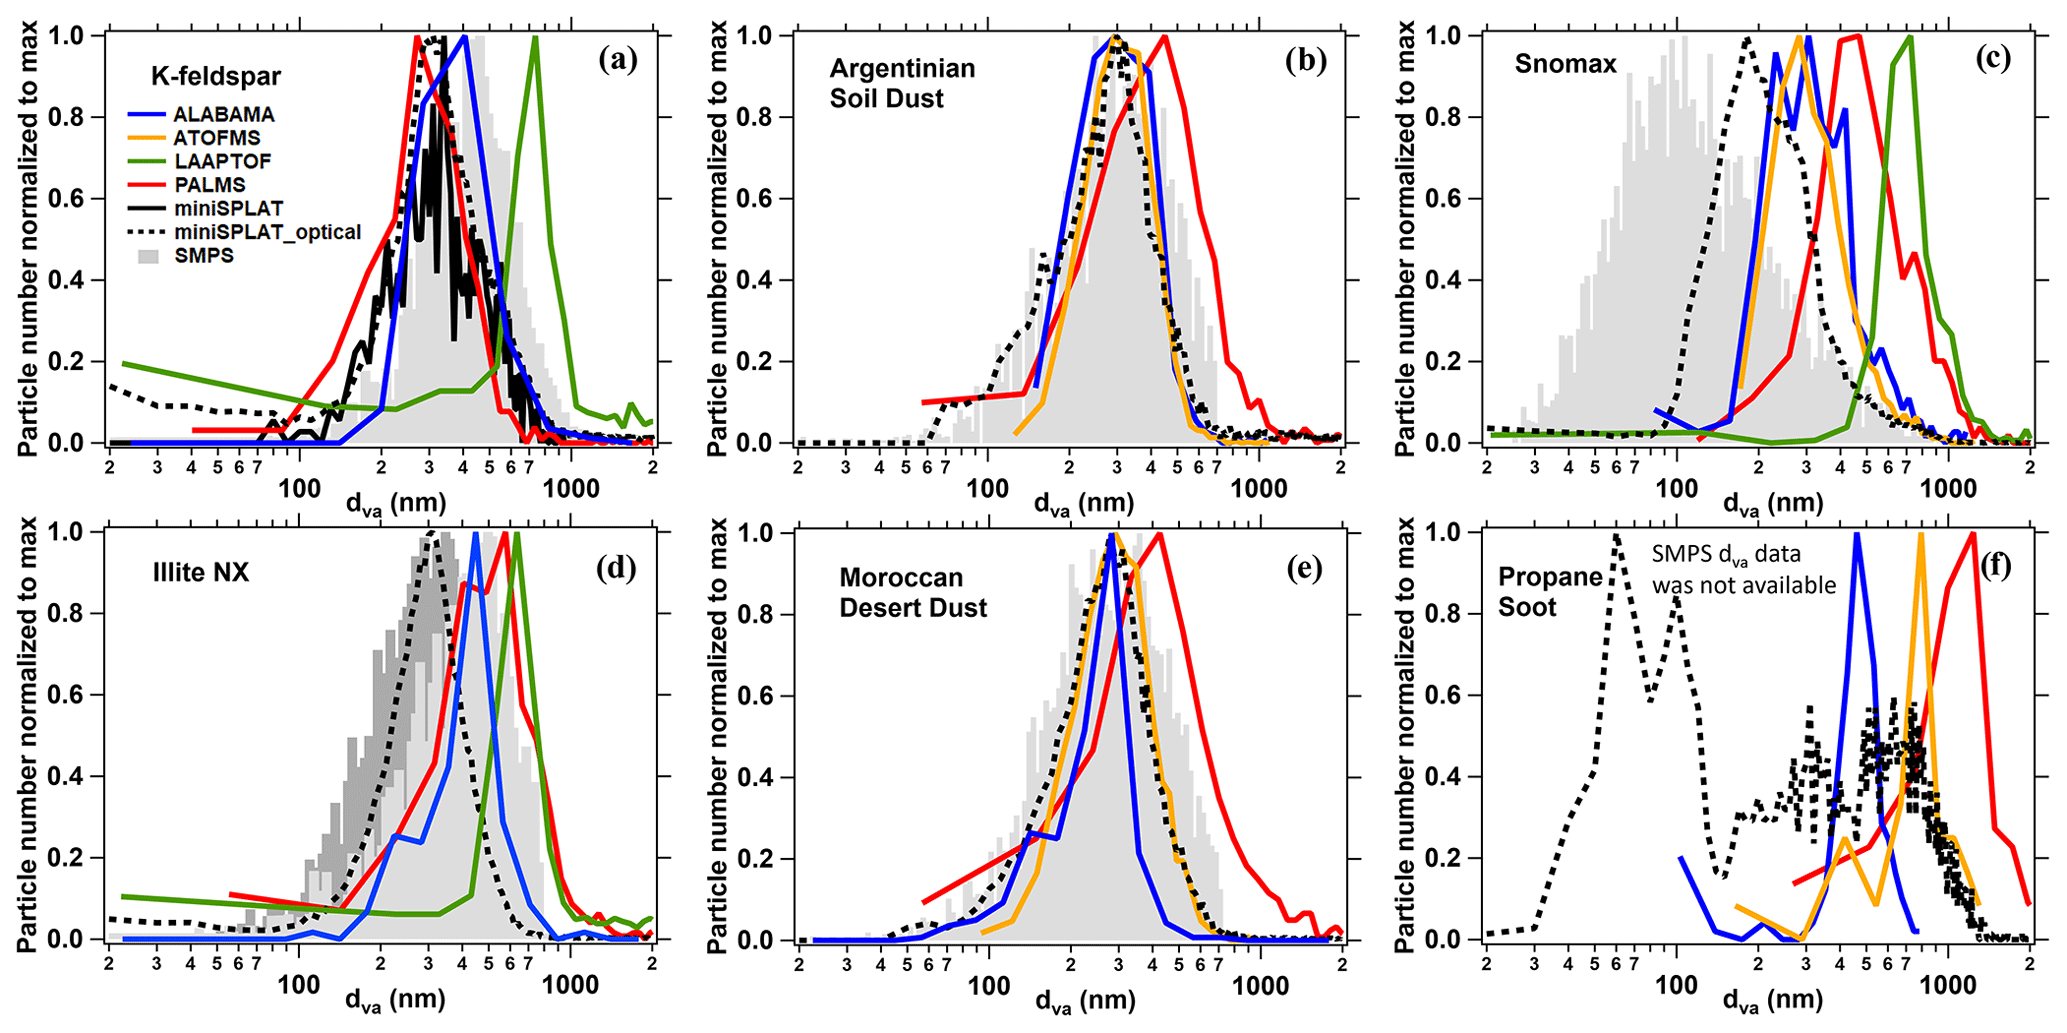
Figure 2SPMS size distributions (normalized to maximum particle number) for selected particle types, i.e., (a) K-feldspar, (b) Argentinian soil dust, (c) Snomax, (d) illite NX, (e) Moroccan desert dust, and (f) propane soot. Color codes correspond to dva measured by ALABAMA (blue), ATOFMS (orange), LAAPTOF (green), PALMS (red), and miniSPLAT (black). Note that the dashed black curves represent the DE of the size distribution measured by miniSPLAT, while in (a) the solid black curve represents DE consistent with the other SPMSs (see the text for details). Particle sizes measured by the SMPS over a scan range of 14–820 nm dm were converted to dva (grey) for comparison. For illite NX particles, two different SMPS size distributions from the APC13 and APC21 experiments are shown in light and dark, respectively (the miniSPLAT result was from only APC21, while the others were from APC13). For soot particles, the SMPS dva data were not available for these experiments (see the text for details). Dashed lines in (d) are used to emphasize the extent of the distributions. In most cases the particle numbers of each SPMS (used to derive the distribution curves) were hundreds to thousands. The exception is propane soot, for which most of SPMSs detected <100 particles due to the detection limit.
Figure 2 shows the normalized particle size distributions measured by the SPMSs for the different particle types. The SPMSs all measured a similar size range, spanning parts of the accumulation (∼0.1 to 1 µm) and coarse (>1 µm) modes. The similar lower and upper cutoff sizes of ∼100–200 nm and ∼1–3 µm, respectively, were due to similar focusing inlets and similar wavelengths of detection lasers. The exception is LAAPTOF, which measured particles in a size range of ∼450 nm to 2 µm dva during FIN-01, most likely due to non-optimal detection laser alignment. Detection reduction at small and large particle sizes is due to light scattering and focusing of the particle beam, respectively (Bohren and Huffman, 1998; Schreiner et al., 1999).
Overall, the particle size distributions of the minerals (K-feldspar and illite NX) and dusts (desert and soil) measured by the SPMSs agreed reasonably well with those measured by the SMPS. The size measurements by the SPMSs and SMPS were not always as consistent as for the minerals and dusts. For Snomax this was most likely because of the broader size range, with half of the particles smaller than 100 nm dva (i.e., beyond the typical lower size detection limit of SPMSs). Disagreement may also be attributed to the simplifications inherent in Eqs. (1) and (2) or assumptions about the dynamic shape factors and/or particle density.
Another exception was the experiment with propane soot, for which most of the particles were smaller than the optical detection limit of most of the SPMSs. The conversion of SMPS data from dm to dva using Eqs. (1) and (2) for propane soot was more uncertain than for the other particle types. Note that it is challenging to perform size conversions for aspherical particles; even for monodisperse (mass- or mobility-selected) particles, the dva size distributions are broad and asymmetric due to the presence of particles with different shapes and/or orientation-dependent DSF in the free molecular regime (Beranek et al., 2012; Zelenyuk et al., 2008a). The propane soot particles in the experiments with high O:C ratio were compact and non-spherical but not fractal, and for these a conversion from dm to dva would be possible, as discussed in previous studies (Naumann, 2003; Shapiro et al., 2012; Suski et al., 2021). Moreover, the size distribution of the soot particles evolved during the measurement due to aging, coagulation, or compaction (Bhandari et al., 2019; Corbin et al., 2023). Size conversion of soot is beyond the focus of this study. A comprehensive discussion of physical and morphological parameters of soot particles can be found in the literature (Schneider et al., 2006; Shapiro et al., 2012; Sorensen, 2011; Suski et al., 2021).
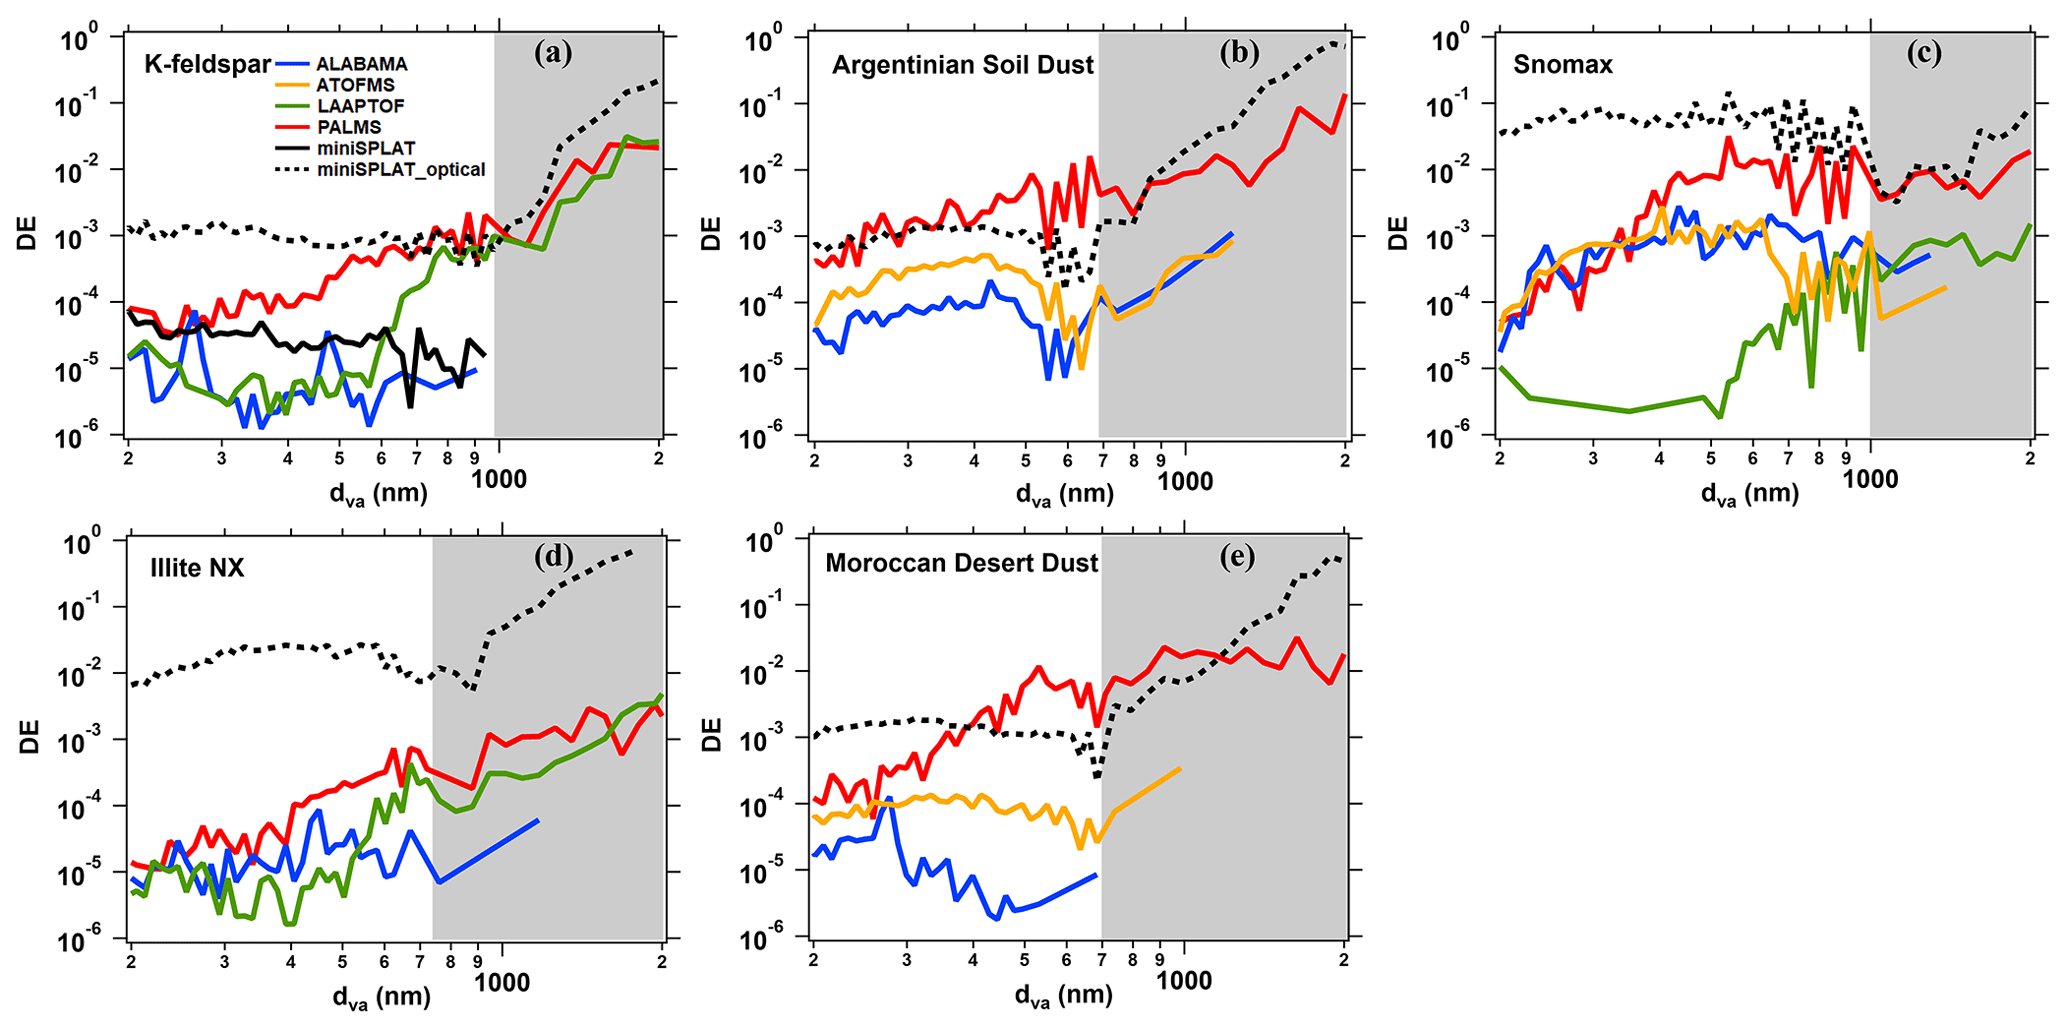
Figure 3Detection efficiencies of SPMSs for selected particle types, i.e., (a) K-feldspar, (b) Argentinian soil dust, (c) Snomax, (d) illite NX, and (e) Moroccan desert dust, as a function of the dva measured by ALABAMA (blue), ATOFMS (orange), LAAPTOF (green), PALMS (red), and miniSPLAT (black). Note that the uncertainty for super-micrometer particles is larger due to the low number concentration of these particles in the experiments. The DE curves in white and the shaded area are based on SMPS and APS results, respectively. There were overlap results between SMPS and APS for the sizes around 700 nm to 1 µm dva. In such an overlap range, we chose SMPS data as a reference to calculate DE. Given different shape factors and particle densities, the conversions of dm and dca to dva were different for different particle types. Therefore, the end point of SMPS-based result or shift point between white and shaded area varies from sample to sample. Note that the DE of miniSPLAT is defined differently from the other SPMSs. The size-distribution-derived DE (dashed black) and the hits-only-derived DE (solid black) for K-feldspar is shown to provide the upper and lower limits of miniSPLAT DE (see the text for details).
Figure 3 shows the DE as a function of aerosol particle size and separated for each particle type for the SPMSs. Given the different methodology applied for detection and mass spectral acquisition by miniSPLAT, we compare the results from the other SPMSs first. DE, a strong function of particle size, spans 2–3 orders of magnitude. PALMS exhibited the highest DE for all particle types, especially at the larger sizes (>400 nm dva). At sub-micrometer diameters, ALABAMA and ATOFMS exhibited comparable DE. This aligns with the respective size ranges corresponding to DEmax for PSL for each instrument (Table 1). As mentioned previously, LAAPTOF tended to measure relatively large particles (>500 nm) more effectively. Note that particle type also played a role in particle detection, most likely related to a composition-dependent shape factor and/or light scattering efficiency. DE for propane soot particles is not shown in Fig. 4 due to the aforementioned low Cn within the detectable size range of the SPMSs and the difficulty of size conversion. MiniSPLAT exhibited relatively high DE compared to the other SPMSs. As previously mentioned, miniSPLAT has defined DE and HR differently in the literature than for the other SPMSs. Using the same definitions as the other SPMSs, for the corresponding measurements by miniSPLAT in Fig. 4, DE was ∼38 % of the whole size distribution, while HR was ∼11 %. As an example in Fig. 4a, both whole-size-distribution- and mass-spectra-related DEs are shown to demonstrate the upper and lower limits of miniSPLAT DE.
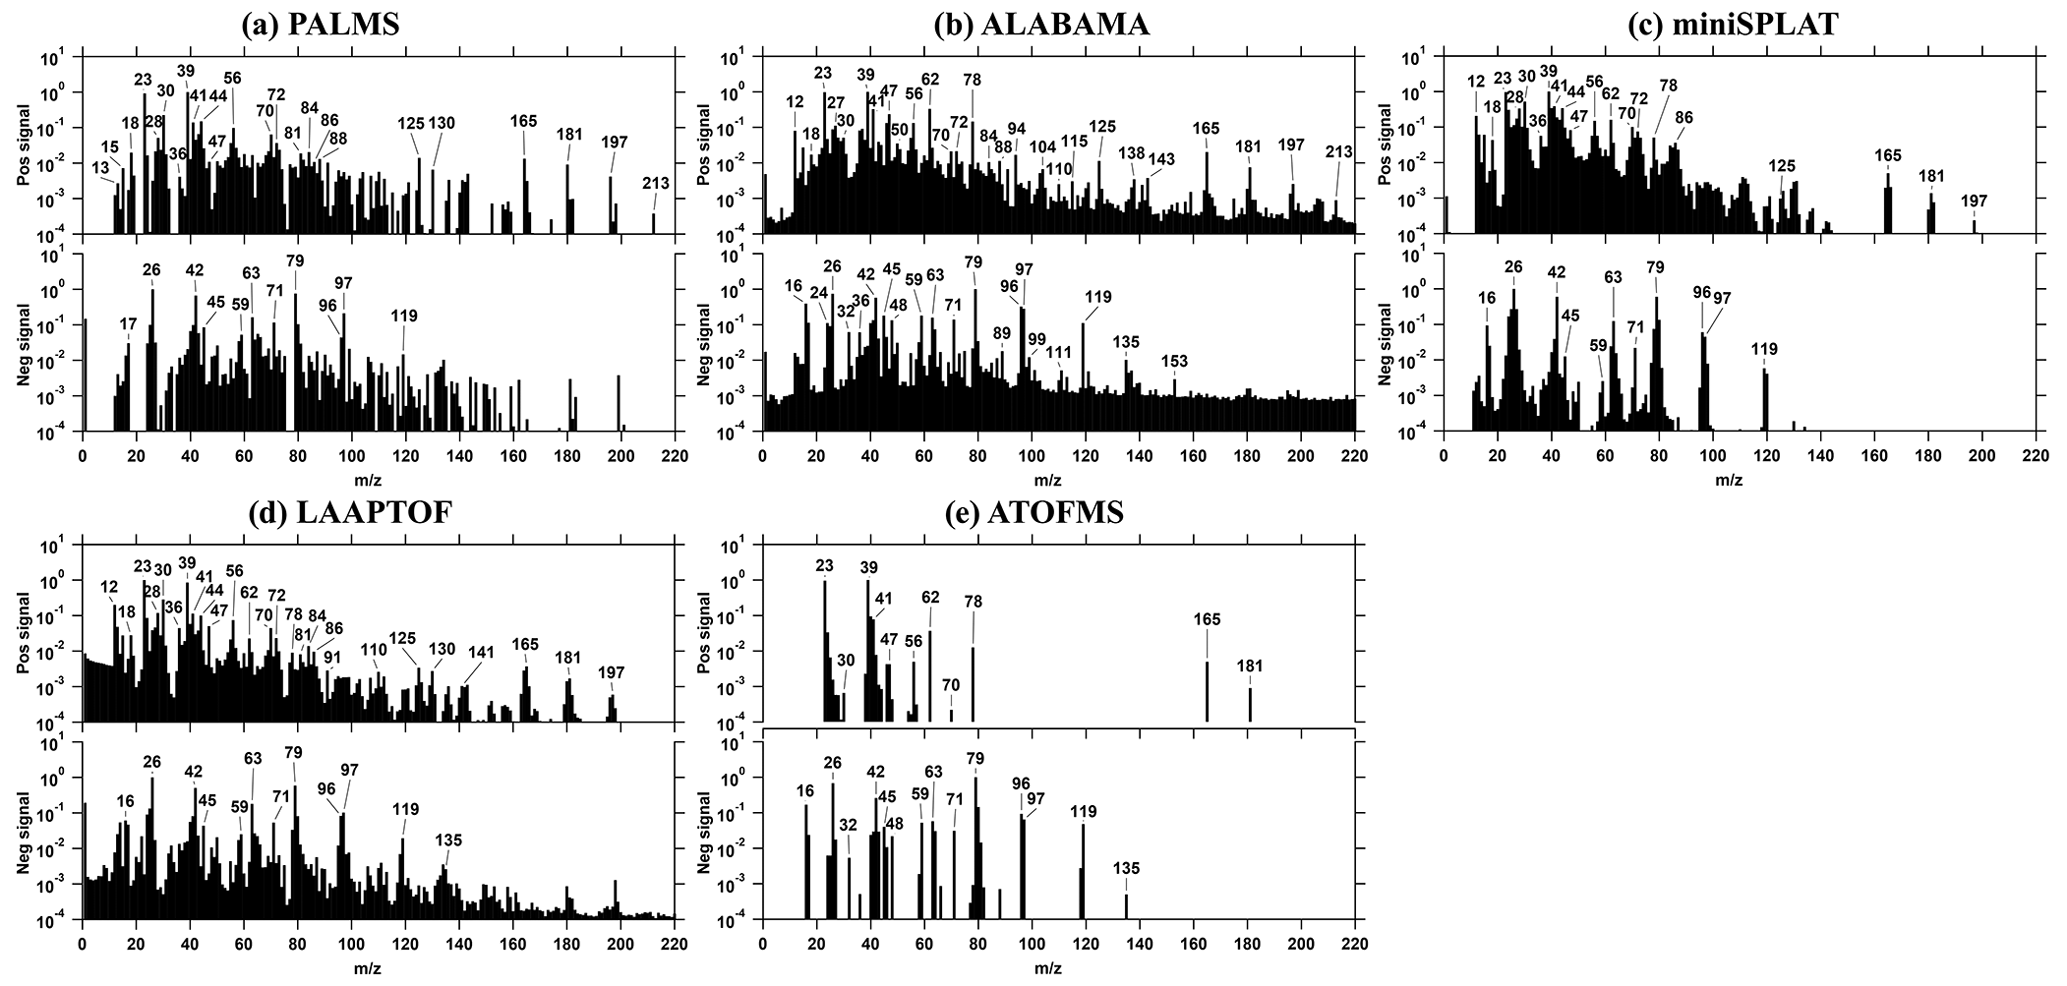
Figure 4Normalized average mass spectra of Snomax, measured by (a) PALMS, (b) ALABAMA, (c) miniSPLAT, (d) LAAPTOF, and (e) ATOFMS. The number of spectra averaged for each is 973 (a), 1018 (b), 2327 (c), 260 (d), and 1071 (e).
3.1.2 Mass spectra
Examples of average mass spectra, normalized to maximum ion signal (peak area), for the polydisperse aerosol samples are shown in Fig. 4 (Snomax) and Fig. 5 (Moroccan desert dust). These two aerosol types were chosen to illustrate the performance of the different instruments. Snomax is a chemically homogeneous aerosol (Kanji et al., 2017; Möhler et al., 2007; Murray and Liu, 2022). Thus, potential differences between the individual SPMSs due to composition-dependent ionization efficiency should be minimal. Desert dust particles, such as the Moroccan sample, are chemically more complex and diverse (Hoose and Möhler, 2012; Kandler et al., 2007; Kanji et al., 2017; Marsden et al., 2019; Murray et al., 2012; Murray and Liu, 2022). Average mass spectra for the other aerosol types are shown in Figs. S1–S5. In general, the SPMSs had common markers for specific particle types which are summarized in Table 3.
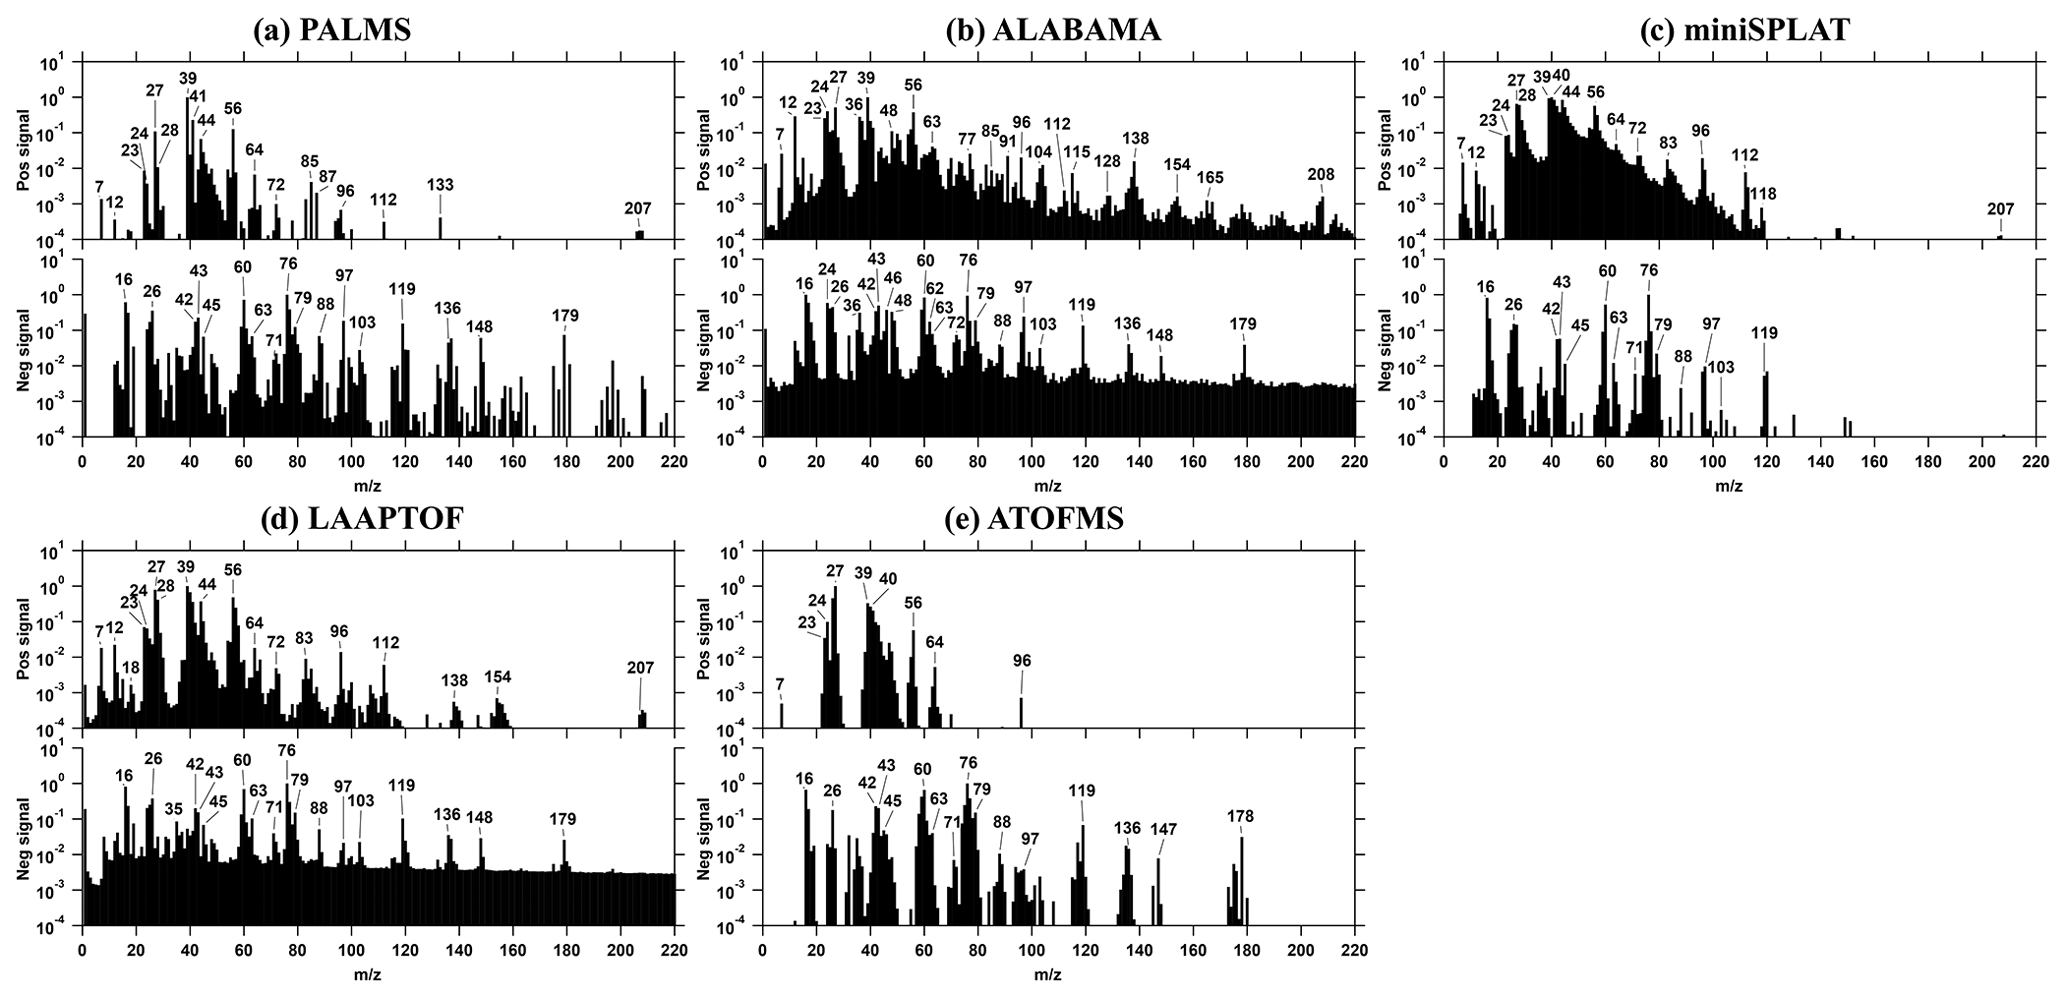
Figure 5Normalized average mass spectra of Moroccan desert dust by (a) PALMS, (b) ALABAMA, (c) miniSPLAT, (d) LAAPTOF, and (e) ATOFMS. The number of spectra averaged for each is 715 (a), 353 (b), 346 (c), 215 (d), and 1447 (e).
Table 3Particle types and the corresponding mass spectral markers.
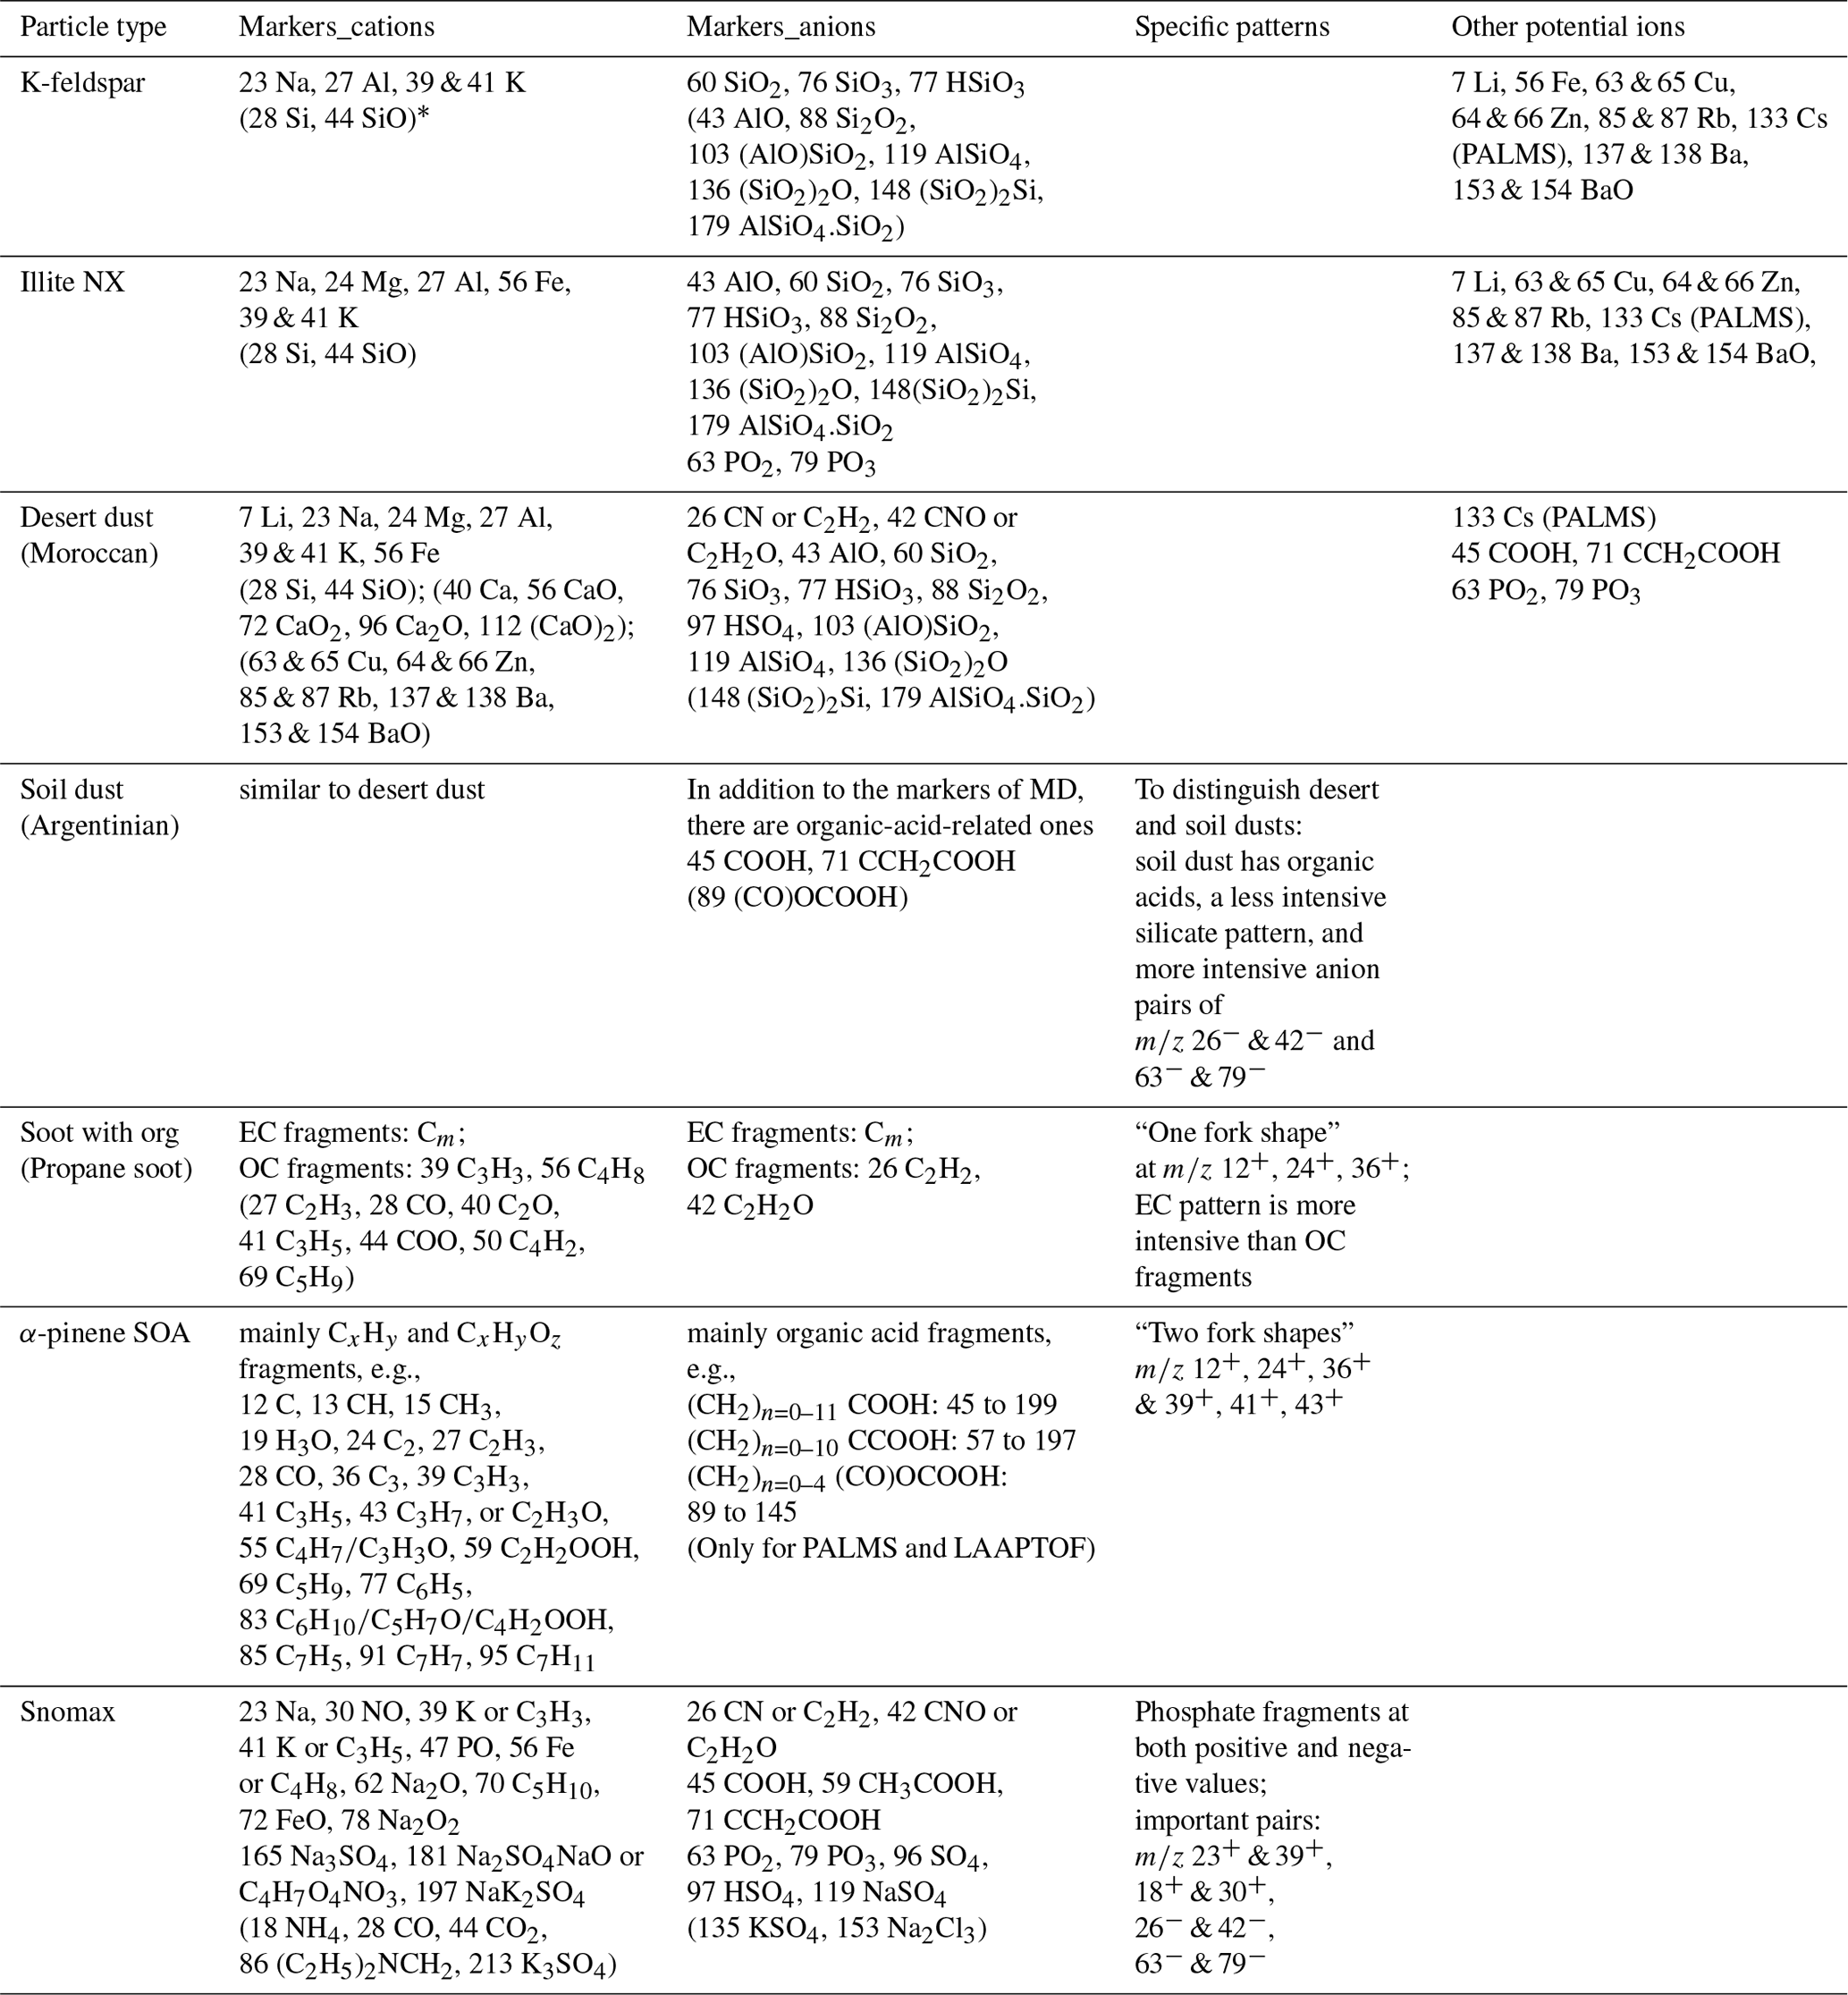
* Note that ions in parentheses are not observed in all SPMS mass spectra.
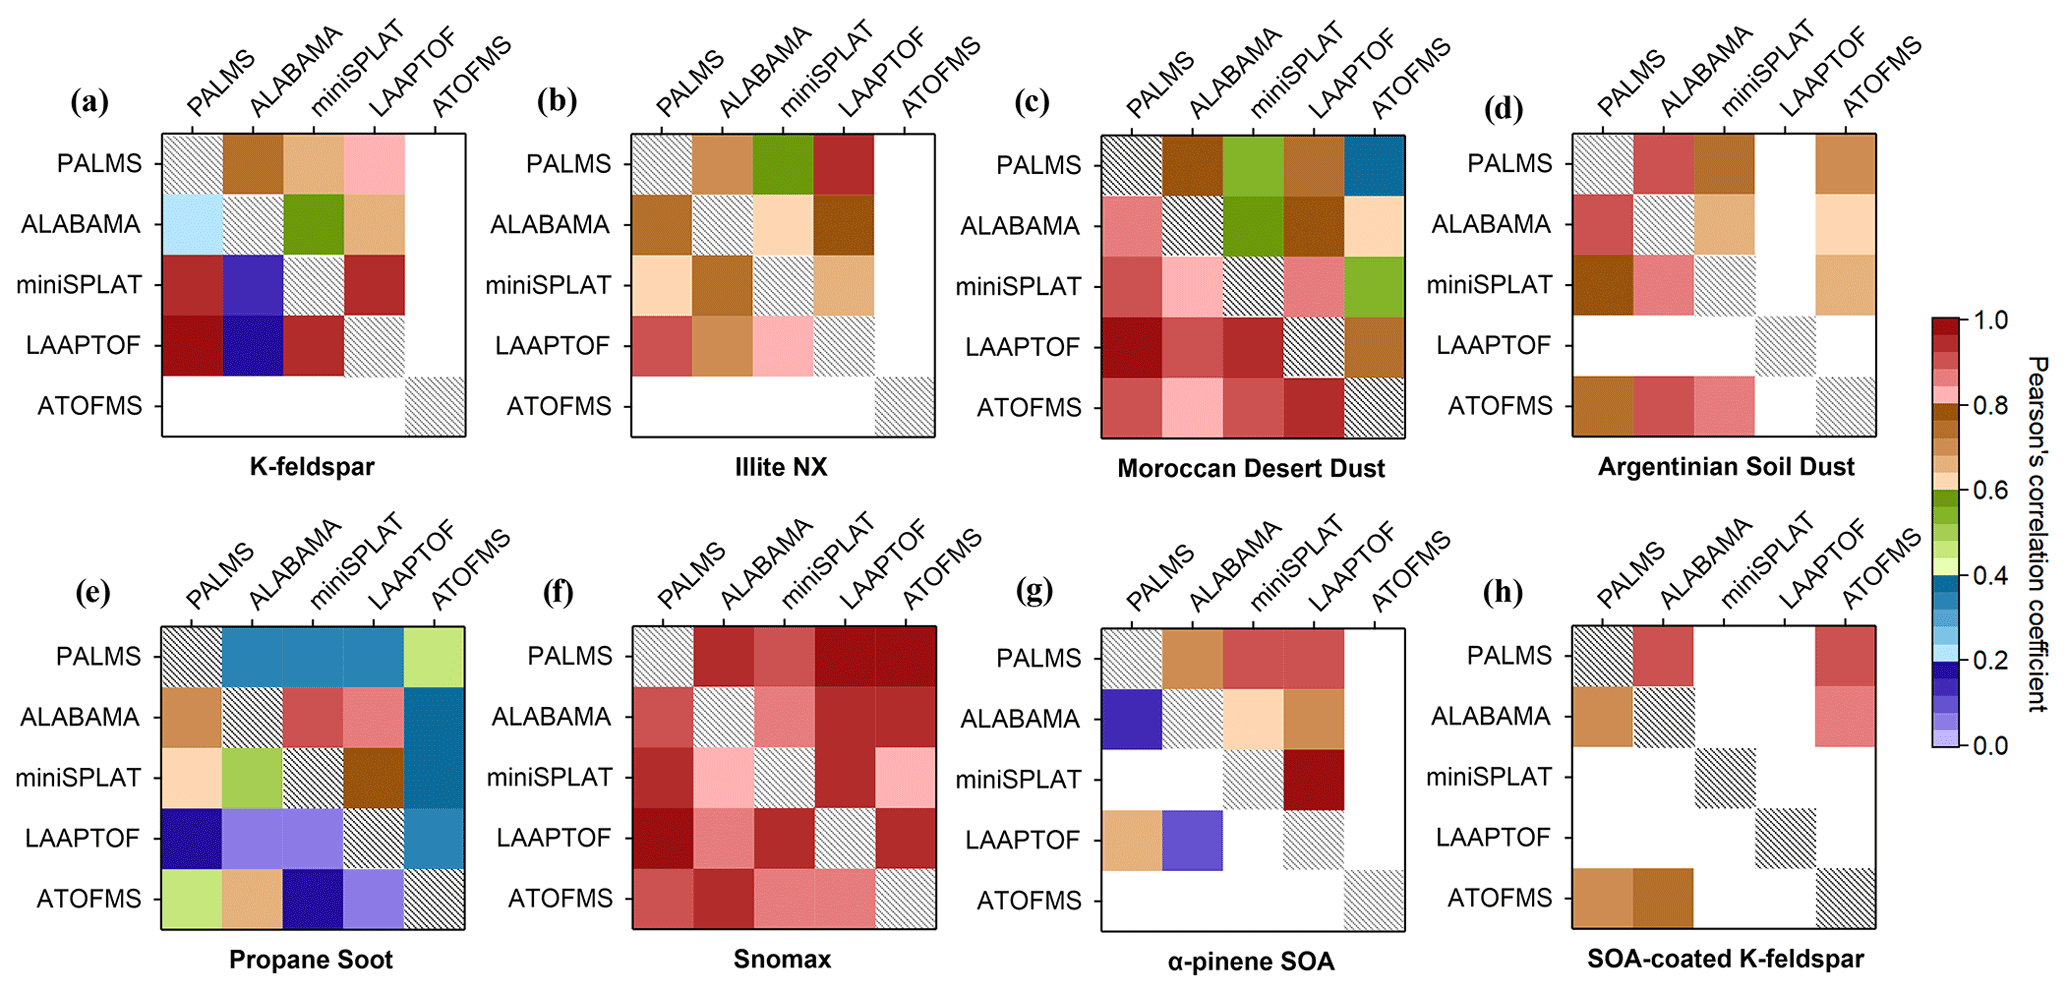
Figure 6Correlation plots of average spectra of the different particle samples (a) K-feldspar, (b) illite NX, (c) Moroccan desert dust, (c) Argentinian soil dust, (e) propane soot, (f) Snomax, (g) α-pinene SOA, and (h) SOA-coated K-feldspar, analyzed by the five SPMSs. Within each diagram correlation results for positive spectra are on the upper right, while negative spectra are on the bottom left. White cubes denote cases where no data are available.
To better compare the mass spectra and quantify commonalities and differences, we conducted a statistical analysis using Pearson's correlation coefficient, denoted hereafter as “r”. The coefficient measures the strength and direction of a linear relationship between two variables or data sets, e.g., two average mass spectra. A value of r=1 and −1 indicate a perfect positive and negative linear relationship, respectively, whereas r=0 indicates no linear correlation. The average r for the average positive and negative mass spectra of the different aerosol types between the different instruments can be found in Table S1 in the Supplement. The five instruments exhibited comparable markers and good correlation, defined here as a r>0.6 (greater than 60 % linear correlation). On average and across all samples, the r value for positive spectra was ravg-pos=0.74 ± 0.12, and for negative spectra it was ravg-neg=0.67 ± 0.22.
Figure 6 shows a detailed analysis where we compare the linear correlation coefficient of each SPMS with each other, differentiated by aerosol type. Among the sampled particle types, the strongest correlation was for Snomax, ravg-pos=0.92 ± 0.04 and ravg-neg=0.90 ± 0.05. This was a consequence of the aforementioned factors: (1) Snomax was chemically homogeneous; (2) all instruments exhibited common spectral markers with a similar pattern (Fig. 4); and (3) Snomax produced multiple ion markers, many of which were of high signal and intensity.
The second strongest correlation in negative spectra was found for the Moroccan desert dust (Fig. 6 and Table S1). The strong correlation was due to a strong silicate pattern ( 60 , 76 , and 77 ; Fig. 5). This was generally true for the desert (Fig. 5) and soil dusts (Fig. S2), which had many common markers in their mass spectra. Despite similar cation markers, the correlations for the positive spectra of the dusts were not as good as negative spectra (Fig. 6c and d). The major peaks, e.g., 27 Al+, 39 K+, and/or 56 Fe+ in soil dust had a higher average intensity than markers in desert dust. It is worth noting that soil dusts exhibited more diversity of signal, consistent with them being internal mixtures of minerals and organics and hence a more complex composition (Kögel-Knabner et al., 2008; O'Sullivan et al., 2014; Tobo et al., 2014). As an example, negative spectral organic acids makers, e.g., 45 COOH−, were found in soil dust but not in desert dust.
For the pure mineral samples, e.g., K-feldspar (Fig. S3) and illite NX (Fig. S4), all instruments had common markers at 23 Na+, 27 Al+, 39/41 K+, 56 Fe+, 60 , 76 , and 77 . Illite NX spectra also contained 24 Mg+. Nitrate and sulfate markers were found in the negative spectra measured by ALABAMA, especially for K-feldspar. They were identified as instrument-specific contamination from an unknown source. This resulted in poor linear correlations with the other instruments.
For α-pinene SOA, the instruments showed strong correlations in their positive and negative spectra (Fig. 6 and Table S1). Common features included 12 C+, 24 and 36 , 39 , 41 , and 43 (Fig. S5). For α-pinene SOA-coated K-feldspar, the spectra were similar to (uncoated) K-feldspar but with additional organic markers (Fig. S6). It is worth noting that the correlations for SOA-coated K-feldspar were better than SOA, especially in negative spectra (ravg-neg=0.73 ± 0.03 and 0.30 ± 0.29 for SOA coated K-feldspar and SOA, respectively). This was likely due to minerals having relatively stronger spectral patterns than organics.
Relatively poor correlations were found for propane soot (ravg-pos=0.51 ± 0.23 and ravg-neg=0.35 ± 0.26, average spectra in Fig. S7). This can be attributed to the small particle size and resulting low data quantity, e.g., only 30 and 73 spectra were collected by the ATOFMS and by the PALMS instrument, respectively. For the other particle types, thousands of spectra were typically used for averaging. Given multiple common spectral markers, i.e., pure carbon ions, and (the number of carbon atoms, m, can reach >7), better correlation would be expected for soot particles with dva>200 nm.
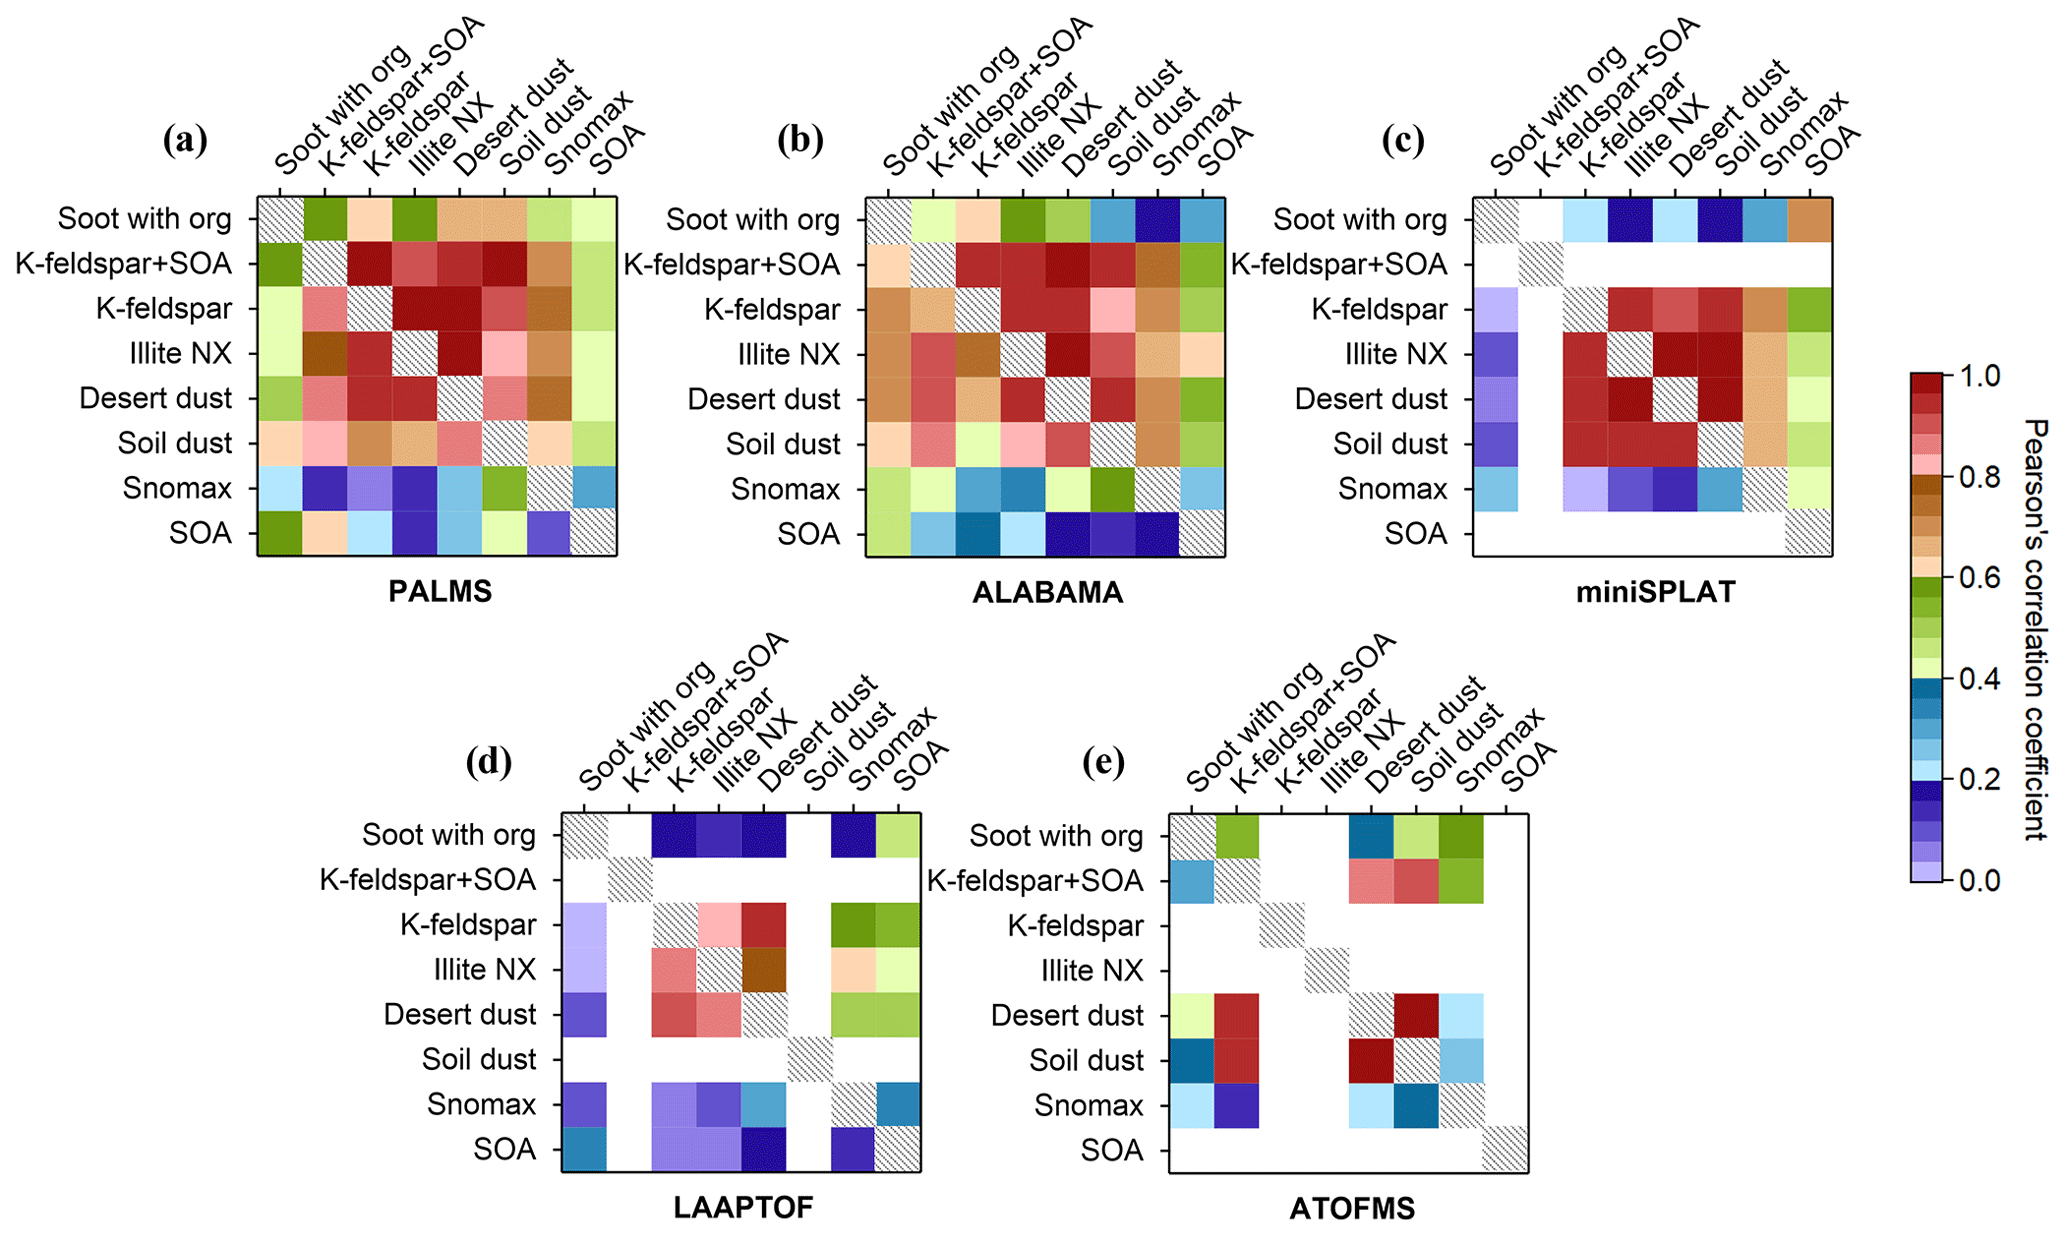
Figure 7Correlation plots of average spectra of different samples analyzed by (a) PALMS, (b) ALABAMA, (c) miniSPLAT, (d) LAAPTOF, and (e) ATOFMS. Correlation results for positive spectra are on the upper right, while negative spectra are on the bottom left. Note that the soot with organics and K-feldspar + SOA denote the propane soot and SOA-coated K-feldspar, respectively.
One conclusion of this intercomparison is that, in general, spectra were comparable across instrument types. Spectra of particle types with compounds that created distinct marker peaks compared better than particles of higher compositional diversity, which created spectra with less distinct patterns. There were cases where spectral patterns were instrument specific, which resulted in lower correlations, but in at least one case this appeared related to an instrument-specific contamination issue. Correlation was largely independent of ionization laser wavelength, but some differences were apparent; for example, mineral and desert dust samples in miniSPLAT and dust samples in ATOFMS did not produce similar positive spectra for the same particle types (Figs. 5, S2, and S3, and the correlation results for positive spectra in Fig. 6a–c).
Particle type cross-correlations are shown in Fig. 7 to demonstrate each SPMS's ability to distinguish particle types. Good correlations (r>0.8 for most cases) were observed between similar particle types, namely mineral samples (K-feldspar and illite NX) and dust samples (Moroccan desert dust and Argentinian soil dust). SOA was clearly separated, as was propane soot. Snomax was not clearly separated from minerals (such as K-feldspar and illite NX) and dusts in the positive spectra due to common marker peaks (e.g., 23 Na+ and 39 K+), whereas it was distinguishable in negative spectra due to silicate signatures, which were present for minerals and dusts but not for Snomax. This highlights the importance of simultaneous acquisition of spectra of both polarities (a significant limitation of monopolar instruments such as PALMS).
Another important aspect of mass spectra is dynamic range of ion signals and signal-to-noise ratio (SNR). A wider dynamic range allows detecting and distinguishing ion signals of varying intensities. This enables identification of trace species, providing useful information in tracking the source of particles (Murphy, 2007). In general, the SPMSs exhibited wide dynamic ranges and high SNRs in their mass spectra, but variations existed among different instruments. Taking Snomax as an example (Fig. 4), the dynamic ranges of the SPMSs were ∼103 and ∼102 in positive and negative spectra, respectively. SNR values were similar (∼104) in both positive and negative spectra of PALMS, miniSPLAT, and ATOFMS. Relatively low SNRs (∼103) were found for ALABAMA and LAAPTOF, with their positive spectra exhibiting higher SNRs than negative ones.
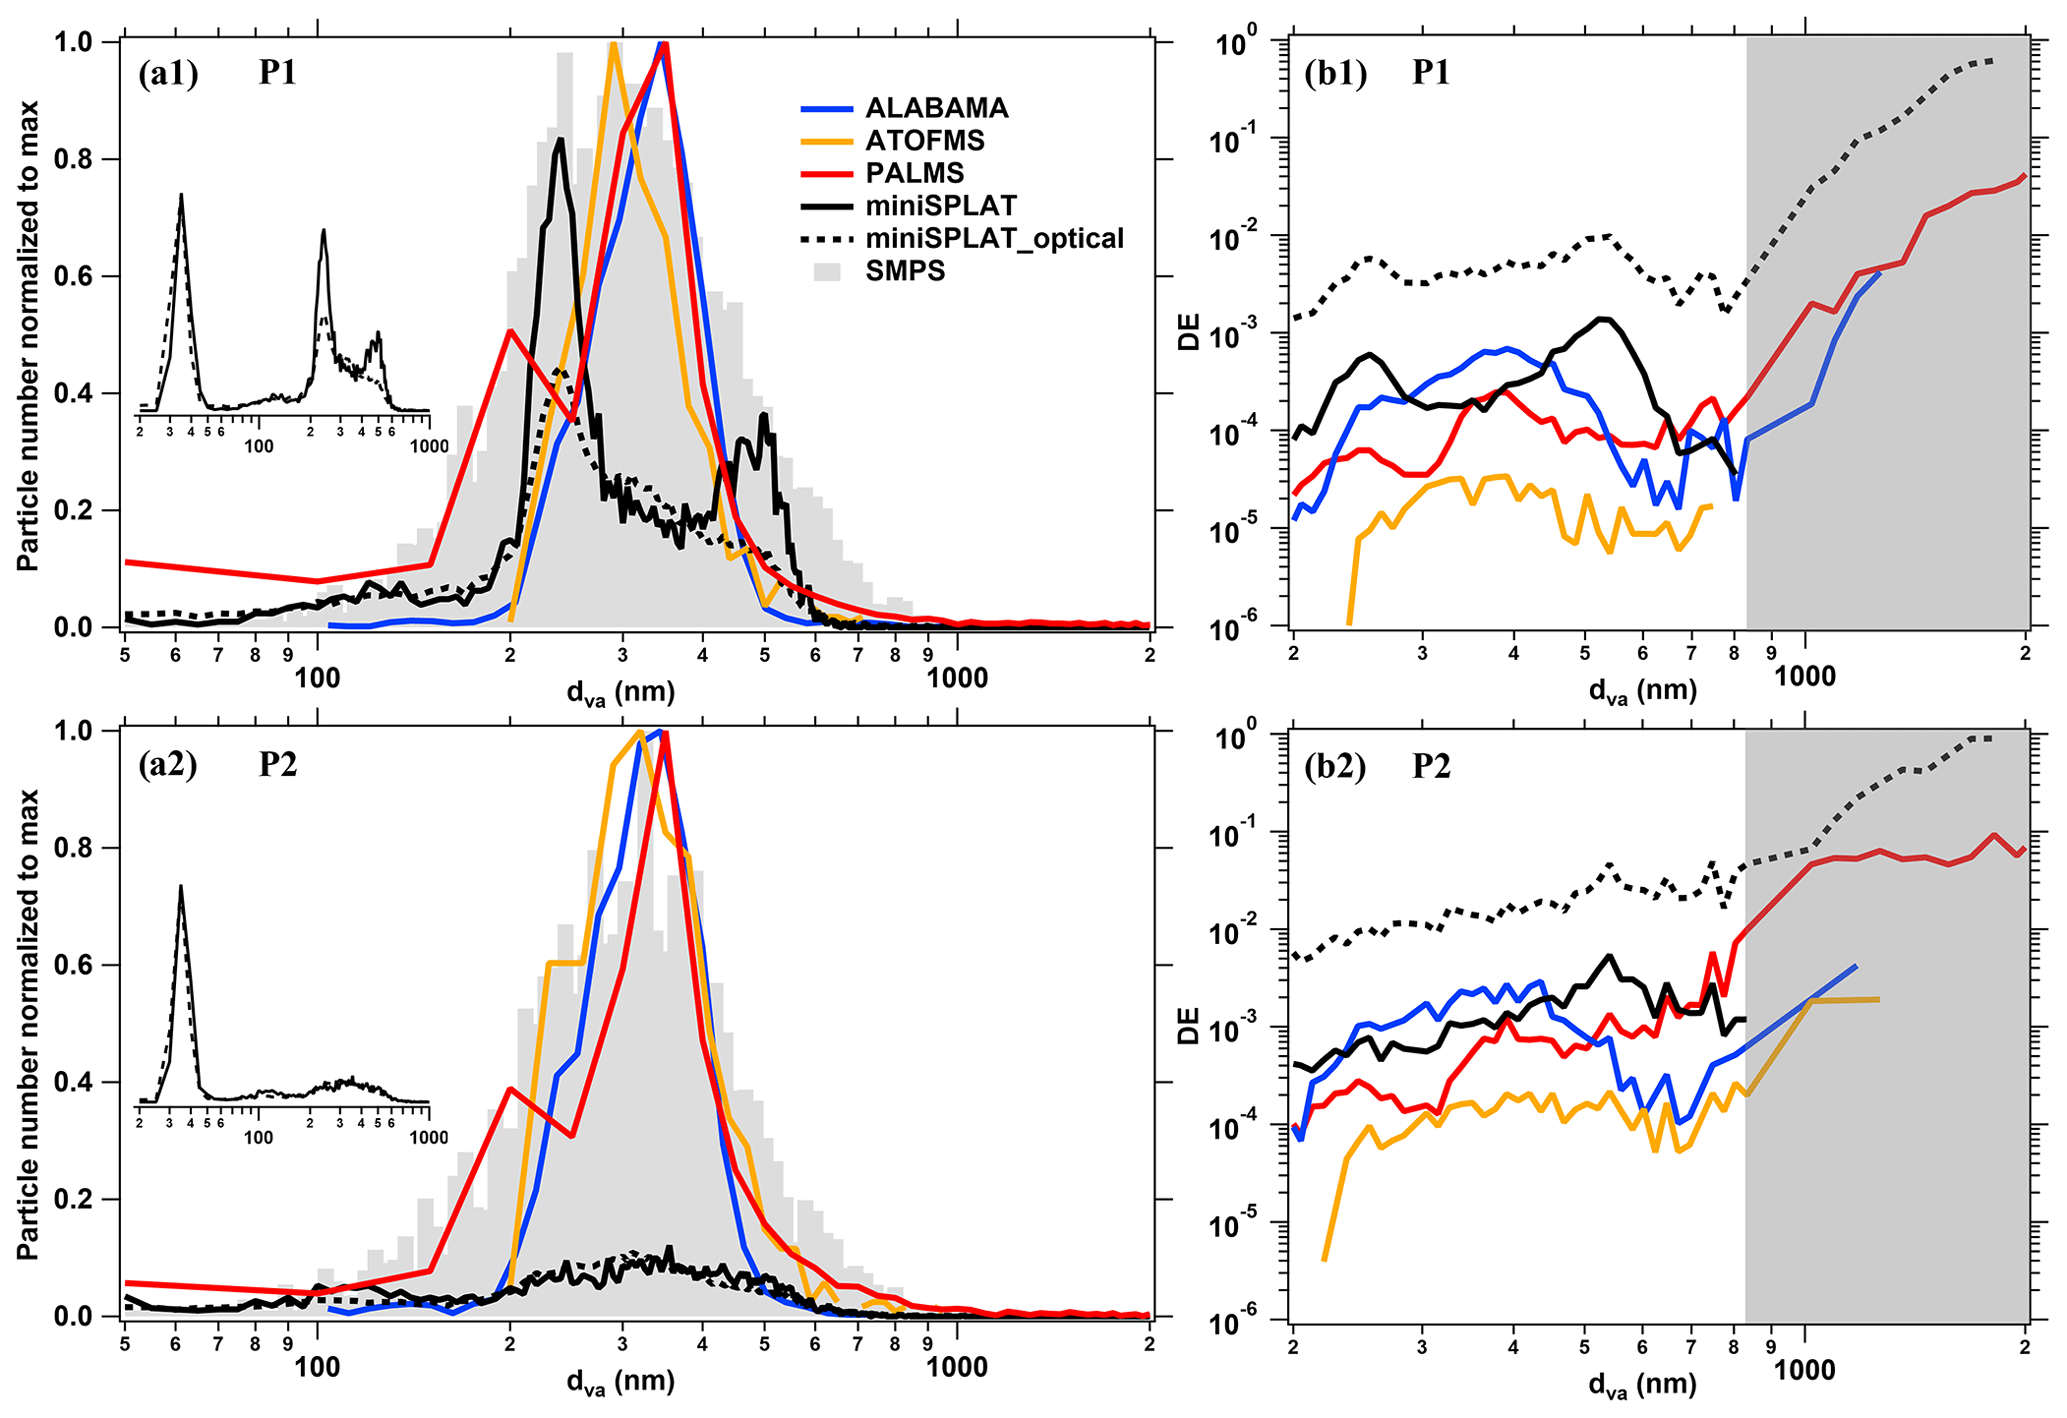
Figure 8Particle size distribution and DE of PALMS (red), ALABAMA (blue), ATOFMS (orange), and miniSPLAT (black) during two different time periods (P1 and P2) of the blind experiments. For miniSPLAT, the full-size ranges measured during P1 and P2 are inserted in (a1) and (a2), respectively (note that the smallest size mode appears large due to the lognormal mode on the x axis). Note that the dashed black curves represent the DE of the whole size distribution measured by miniSPLAT, while the solid black curves represent DE consistent with the other SPMSs (see the text for details); dm measured by SMPS (grey) was converted to dva for comparison. The DE curves in the white and shaded areas are based on SMPS and APS results, respectively. The number-weighted values derived from α-SOA and Argentinian soil dust (particle number ratio of 2:3), fm=1.13 and fca=1.06, were used in these experiments. Note that most of the soot particles were below the detection limit of SPMSs, with the exception of miniSPLAT (see the text for details).
3.2 Blind experiment comparisons
3.2.1 Particle detection and sizing
The two distinct measurement periods for the blind experiments, P1 and P2, were described previously. Unlike the propane soot used in the other experiments, the particles used in blind experiments were graphitic soot (Crawford et al., 2011). The total Cn during P1 was ∼2000 to 3000 cm−3 and decreased to ∼600 to 900 cm−3 during P2 after the dilution and soot addition described previously (Fig. 1).
As shown in Fig. 8a1 and a2, the size distributions measured by ALABAMA and the ATOFMS were most comparable. The smaller (<200 nm) and larger (>500 nm) particles were best resolved by miniSPLAT and PALMS. PALMS resolved dva>1.2 µm (based on a comparison with APS data; not shown). LAAPTOF utilized a “first laser mode” (i.e., the ionization laser was triggered immediately after particle detection by the first detection laser) during the blind experiments to obtain more spectra and, as a result, did not record size information. The other SPMS measurements all agreed in the dva range of ∼200 to 800 nm. Figure 8a1 and a2 show an increase in DE for most measurements as particle sizes increased (Fig. 8b1 and b2). With the exception of miniSPLAT, the normalized size distributions measured by the SPMSs in P1 and P2 do not have significant differences (Fig. 8a1 and a2). All the DEs were higher in P2 (Fig. 8b2) than P1 (Fig. 8b1). The dva size distributions measured by miniSPLAT extended to smaller sizes than the other instruments and exhibited a mode at ∼35 nm (see the insert in Fig. 8a1 and a2), which corresponded to fractal soot particles. As previously mentioned, the dva of fractal soot particles is nearly independent of mass, and dm and is instead determined by the size of primary spherules that comprise fractal agglomerates. The fractal graphitic soot particles used in the blind test were shown to be comprised of primary spherules with diameter of 6.6 ± 1.7 nm (Wenzel et al., 2003). The dva of the graphitic soot particles (∼35 nm) is smaller than the dm of these particles, which varied between 150 and 400 nm.
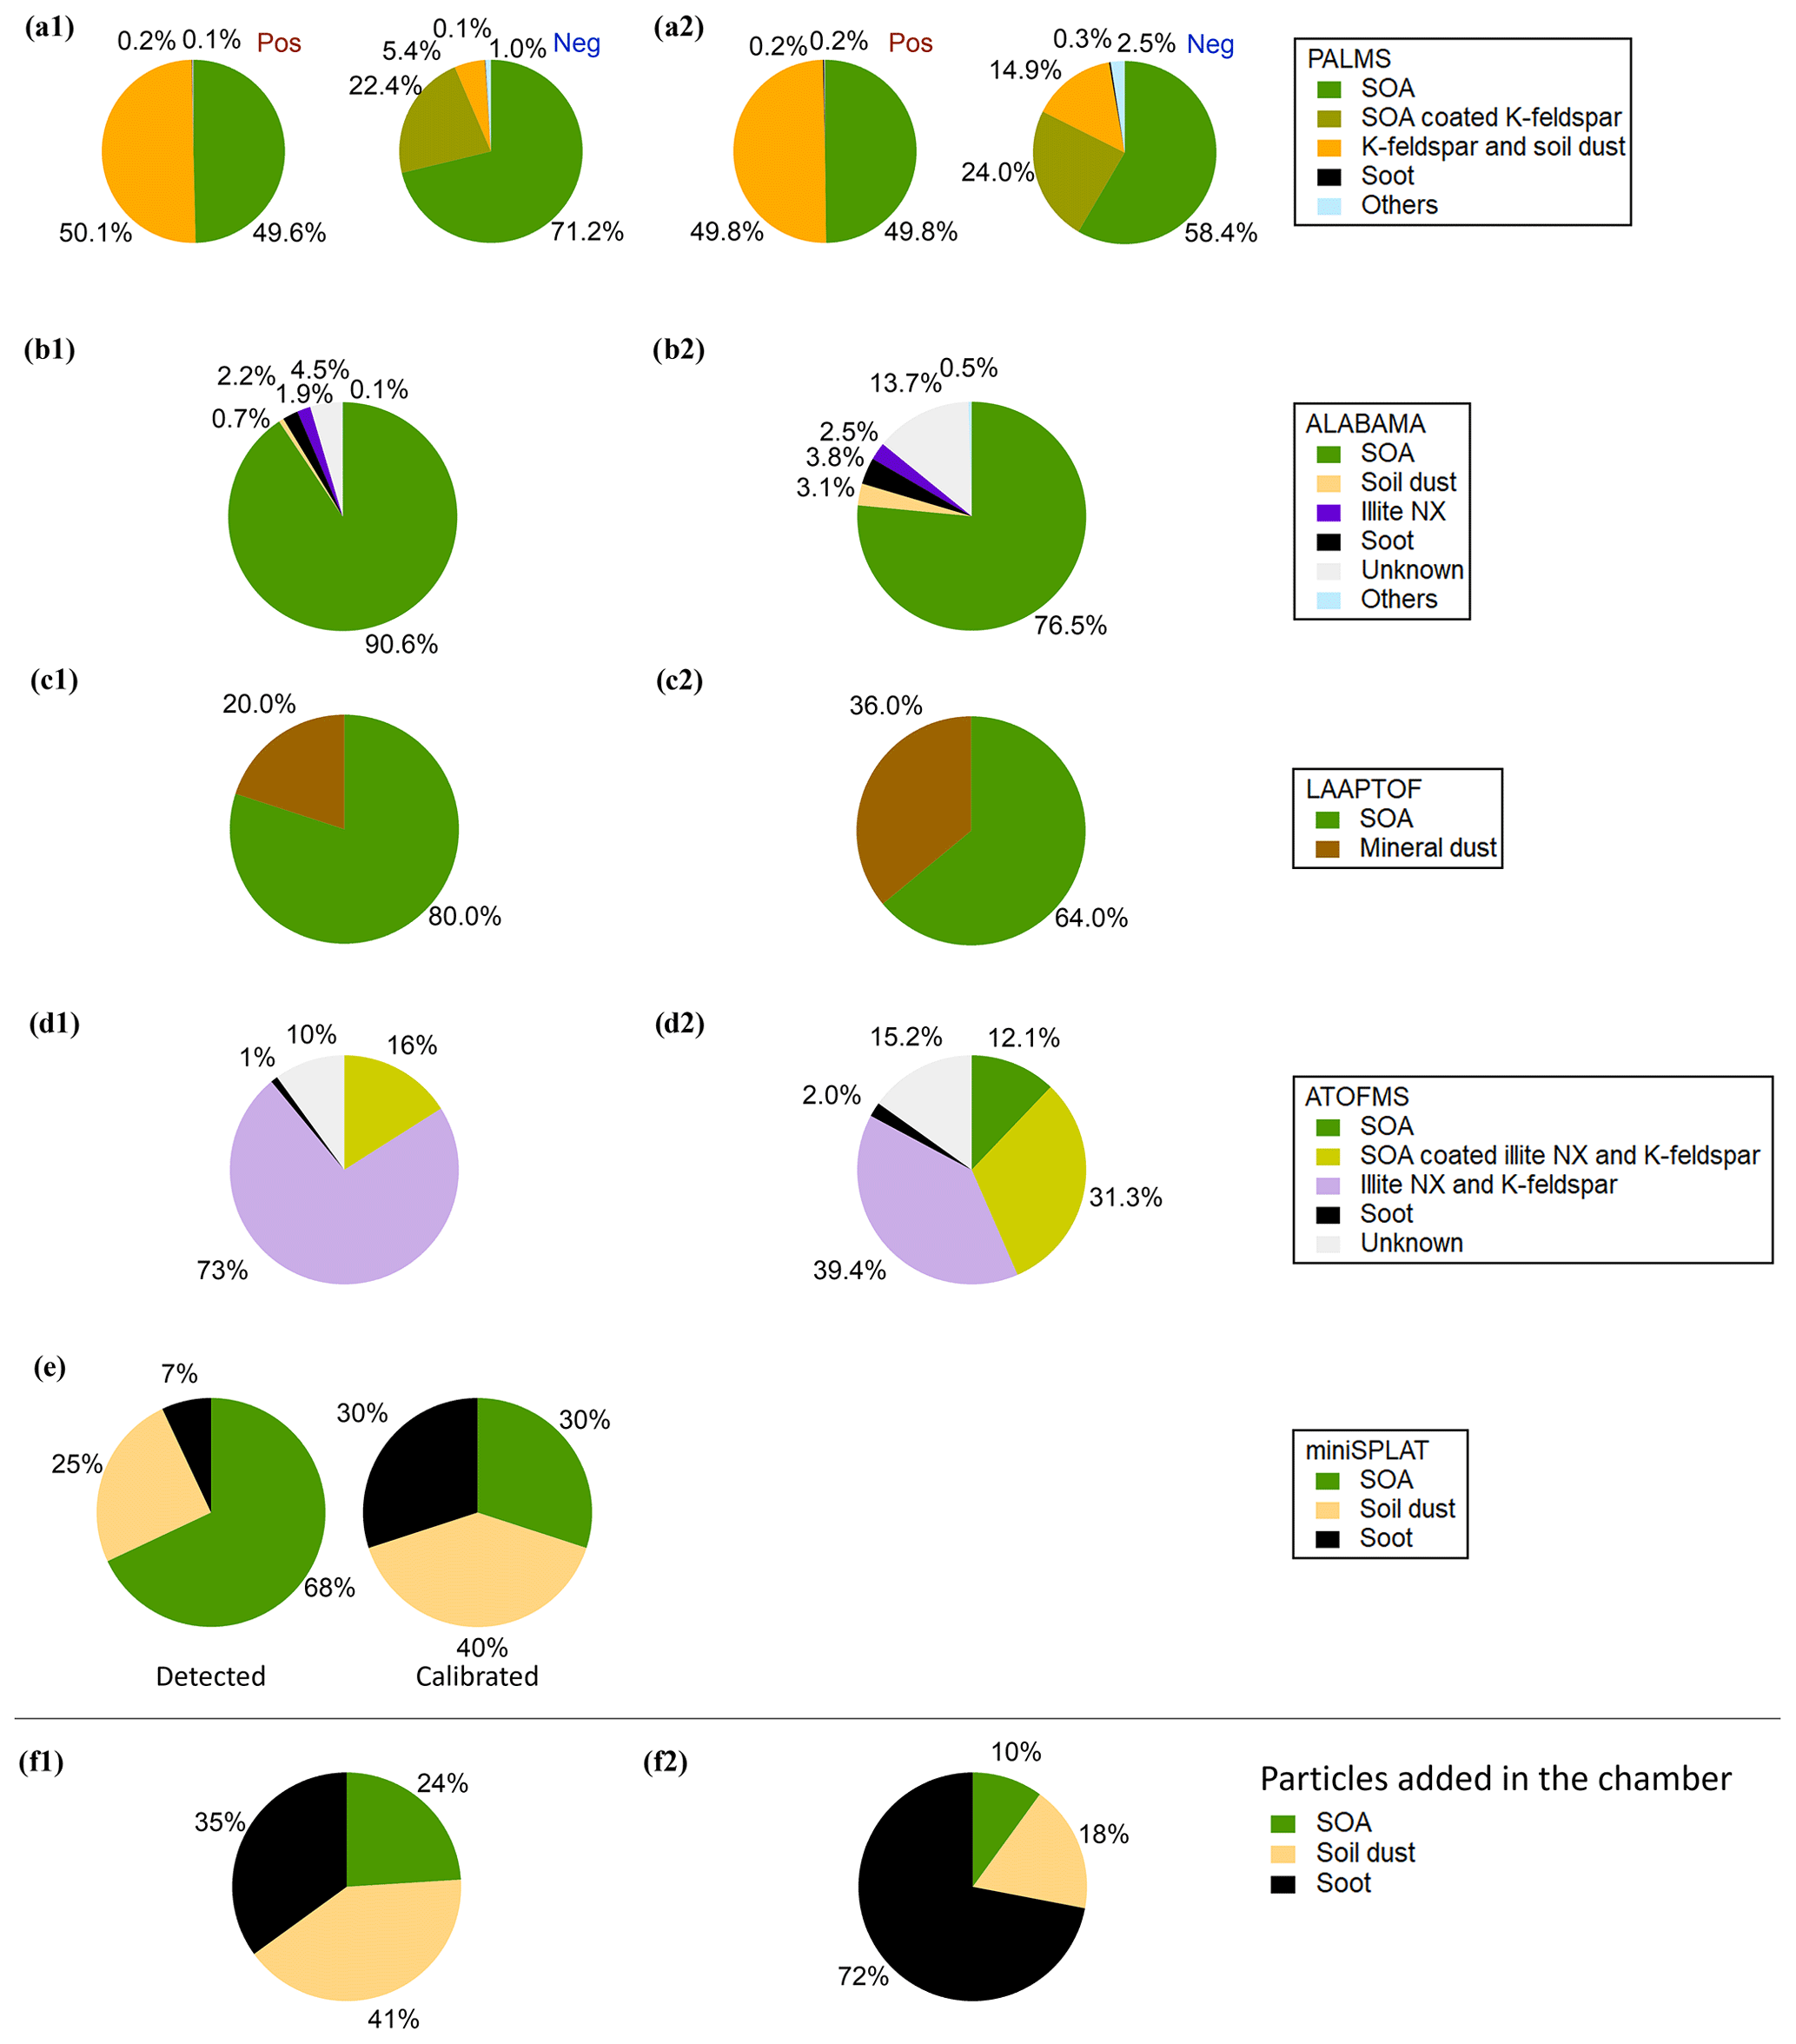
Figure 9Particle classes and their relative contributions for blind periods P1 and P2 for (a1–2) PALMS, (b1–2) ALABAMA, (c1–2) LAAPTOF, (d1–2) ATOFMS, and (e) miniSPLAT (which only reported data in P1). Panels (f1–2) are the same pie charts as those in Fig. 1. added here for better comparison. The plots shown here are the data provided to the referees after experiments (i.e., before participants knew the composition of the blind experiment). Note the left pie chart for miniSPLAT represents acquired mass spectra, consistent with what is presented for the other SPMSs. The right pie chart, provided to the referees after experiments, represents calibrated data (see the text for details). Particle clustering is shown for positive and negative spectra separately for the unipolar switchable PALMS instrument.
3.2.2 Identification of different particle types
Based on independent measurements and data analysis, the participants of the blind experiments identified different particle types in the unknown aerosol mixture. Participants were only told that particles in the blind experiments had been used in the prior FIN-01 experiments but not the number of types, size distributions, or number densities. The number fractions of the identified particle types reported are shown in Fig. 9. Five particle types, α-pinene SOA (C1), α-pinene SOA-coated minerals (C2), minerals (K-feldspar and/or illite NX) (C3), dust (soil or mineral) (C4), and soot (C5), were identified by the participants. Across both periods, all distinct particle types of the blind experiment, five were reported by PALMS, four by ALABAMA (C1, 3, 4 soil, and 5) and ATOFMS (C1, 2, 3, and 5), three by miniSPLAT (C1, 4 soil, and 5) and two by LAAPTOF (C1 and 4 mineral). SOA fractions measured by PALMS, ALABAMA, and LAAPTOF showed general good agreement.
3.2.3 Discussion of blind experiment results
Size distribution and the DE results in the blind experiments were consistent with the size and size-dependent DE discussion in Sect. 3.1.1. Some disagreement between SMPS and SPMSs could result from the simplifications inherent in Eqs. (1) and (2), and/or inaccurate assumptions about the dynamic shape factors and/or bulk density. The main difference between P1 and P2 was the addition of fresh soot particles (Fig. 1).
Of the different particle types present in the APC chamber during the blind experiments, all instruments identified α-pinene SOA. All instruments, with the exception of LAAPTOF, also identified soot. This is most likely due to the aforementioned LAAPTOF low HR at small sizes. The case of soil dust was more complicated. PALMS, ALABAMA, and miniSPLAT all identified different types of soil dust. LAAPTOF identified mineral dust but did not specify the type. ATOFMS identified a mixture of minerals (illite NX and K-feldspar). ALABAMA and PALMS also identified illite NX and K-feldspar, respectively. This highlights the ability of the SPMSs to generally identify minerals and dusts but shows their difficulty in accurately distinguishing specifically between dust and mineral types (see discussion in Sect. 3.1.2). PALMS and ATOFMS both identified SOA-coated minerals, although this type was not added to the chamber. Such internally mixed particles most likely resulted from coagulation of the external mixture of α-pinene SOA with soil dust in the chamber. The identification of such internally mixed particles is important because it demonstrates SPMSs' capability to investigate processes such as particle aging on a particle-by-particle level. Note that Fig. 9 shows two miniSPLAT-derived pie charts. The left pie chart corresponds to the same data presented by the other SPMSs, showing the total mass spectra acquired and assigned to various particle classes. The right pie chart, provided to the referees, uses the DE calibrations, determined by miniSPLAT for many particle types, including SOA, soot, and dust (Vaden et al., 2011). Such calibrations take into account particle beam divergence, which depends on particle composition, shape, and morphology. The applied DE calibrations yield the second pie chart (Fig. 9e right), which can be compared to the original particle mix (Figs. 1 and 9f1). Note that the other instrument groups did not produce a similar calibrated pie chart in this study; however, this can be achieved if similar calibration for multiple particle types was done by using the other SPMSs. Such calibration can also be achieved in the field but with larger uncertainties due to the chemical and morphology complexity of the ambient particles.
Note that caution should be utilized in the interpretations of the presented pie charts. For example, all the instruments except ATOFMS classified the majority of particles as SOA and identified less than 10 % soot particles. These results were in the context of certain size range, i.e., ∼100–200 nm to ∼2–3 µm dva. To obtain more accurate number fractions, composition and size-dependent DE need to be considered.
We present here an intercomparison of five different SPMSs during the FIN-01 workshop at the AIDA facility in November 2014. Due to the common fundamental components of the instruments, there was a general agreement in sizing of samples and the mass spectra they produced.
Similar size ranges, typically from ∼100–200 nm to ∼2–3 µm dva, were measured. Overall, DE was found to be instrument specific and more dependent on particle size than particle type. This highlights the importance of characterizing the size dependence of DE.
The SPMSs exhibited a wide dynamic range (up to ∼103) and high SNR (up to ∼104) in mass spectra. Good linear correlations of spectra measured by different instruments were found (ravg-pos=0.74 ± 0.12 and ravg-neg=0.67 ± 0.22), with the best correlations found for Snomax (ravg-pos=0.92 ± 0.04 and ravg-neg=0.90 ± 0.05). The lowest correlation was found for propane soot (ravg-pos=0.51 ± 0.23 and ravg-neg=0.35 ± 0.26) due to the low data quantity resulting from the size being below the typical SPMS detection limit. Particle identification favored the bipolar instruments.
The instrument-specific ability to differentiate particle type was evaluated using both cross-correlations and validation in blind experiments. It is shown that all SPMSs were able to differentiate between SOA, soot, and soil dust but had difficulties distinguishing between specific dusts and minerals. The results of the blind experiments show that SPMSs can detect changes in particle mixing state, which in our experiments likely resulted from coagulation of externally mixed particles. The results should help our community advance our understanding of such instruments and their potential for investigating atmospheric particles and processing.
Since the FIN-01 workshop, participants and other groups have been improving SPMS hardware, data analysis processes, and particle type retrievals. For example, the ALABAMA has been implemented with a newly developed ADL system, a delayed ion extraction, and better electric shielding, resulting in higher DE for a wider size range and intensities of cation signals that were 7 times higher (Clemen et al., 2020). The next generation of the PALMS (PALMS-NG) has been updated with better particle sampling and optical design, which both allow for the measurement of a wider size range (∼100 nm to >3 µm) and higher DE for the smaller particles (improvement of 1 to 3 orders of magnitude for the size <200 nm), and a bipolar s-shaped mass spectrometer with higher mass resolution (can reach >1000, formerly ∼200) (Jacquot et al., 2024). A method for distinguishing K-feldspar from illite has been developed by Marsden et al. (2018) and subsequently used in analyzing ambient data (Marsden et al., 2019). Since not all the minerals have the same properties, e.g., ice-nucleating ability (Atkinson et al., 2013), the capability to distinguish minerals is critical for the research field. Future investigations could consider improving our ability to further distinguish particles, minerals, and dusts specifically.
Particle mass quantification, unaddressed in this paper, is another important contemporary topic. At the time of FIN-01, SPMSs were qualitative. Since then, effort has been put into improving quantification. Froyd et al. (2019) is one example where particle type fractions measured by PALMS were propagated onto a size distribution obtained by a colocated optical particle spectrometer, thereby enabling the quantitation of particle number, surface area, volume, and mass concentrations. Such quantification techniques have been and can be used as a framework for other SPMSs. Since FIN-01, SPMS measurements are now generally considered quantitative with uncertainties. A future workshop could focus on quantification.
As new SPMSs, software, and data analysis methods are developed, we propose that intercomparison workshops in laboratory should continue and ideally should also include field activities due to the complexity of ambient particles.
All data used for the figures in this paper can be accessed at https://doi.org/10.35097/ZGLkxMLhgxxEHhkk (Shen et al., 2024).
The supplement related to this article is available online at: https://doi.org/10.5194/acp-24-10869-2024-supplement.
XS analyzed data, produced tables and figures, and was the lead manuscript writer. DJC participated in FIN-01, provided suggestions for the data interpretation and discussion, and reviewed and edited the manuscript. DMB, FM, NAM, JS, JW, MAZ, and AZ operated the SPMSs and did basic analysis of the data. HS contributed to the generation and coating of reference particles and particle size data and to the discussion. NH helped to coordinate the campaign. CM, DMM, and OM contributed as the referees in the blind experiments and provided scientific support for evaluation, interpretation, and discussion of the results. DJC, OM, and PJD organized the FIN-01 workshop. HC gave general comments on this paper. All authors contributed to the final text.
At least one of the (co-)authors is a member of the editorial board of Atmospheric Chemistry and Physics. The peer-review process was guided by an independent editor, and the authors also have no other competing interests to declare.
Publisher's note: Copernicus Publications remains neutral with regard to jurisdictional claims made in the text, published maps, institutional affiliations, or any other geographical representation in this paper. While Copernicus Publications makes every effort to include appropriate place names, the final responsibility lies with the authors.
Special thanks are given to the AIDA staff at KIT for operating the chambers and associated instrumentation and general technical support. We thank Susan Schmidt for work on operating the ALABAMA instrument and analyzing the data and Andreas Hünig for support during the measurements. We thank Berko Sierau and Ulrike Lohmann for their support with ATOFMS data analysis and employment. We also thank participants from other SPMS teams that participated in FIN-01 but did not provide data for this paper: the ATOFMS team at the University of California, San Diego (UCSD); the LAAPTOF team at Vienna University; the LAAPTOF team at Carnegie Mellon University (CMU); and the SPLAT team at the Max Planck Institute for Chemistry (MPIC).
The FIN-01 workshop was supported by the US National Science Foundation under grant no. AGS-1339264, by the US Department of Energy's Atmospheric System Research, an Office of Science, Office of Biological and Environmental Research program, under grant no. DE-SC0014487, and by the German Science Foundation (DFG, FOR 1525 “INUIT”).
This paper was edited by Hinrich Grothe and reviewed by Johannes Passig and one anonymous referee.
Alexander, J. M., Bell, D. M., Imre, D., Kleiber, P. D., Grassian, V. H., and Zelenyuk, A.: Measurement of size-dependent dynamic shape factors of quartz particles in two flow regimes, Aerosol Sci. Tech., 50, 870–879, https://doi.org/10.1080/02786826.2016.1200006, 2016.
Allen, J. O., Fergenson, D. P., Gard, E. E., Hughes, L. S., Morrical, B. D., Kleeman, M. J., Gross, D. S., Galli, M. E., Prather, K. A., and Cass, G. R.: Particle detection efficiencies of aerosol time of flight mass spectrometers under ambient sampling conditions, Environ. Sci. Technol., 34, 211–217, https://doi.org/10.1021/es9904179, 2000.
Allen, J. O., Bhave, P. V., Whiteaker, J. R., and Prather, K. A.: Instrument busy time and mass measurement using aerosol time-of-flight mass spectrometry, Aerosol Sci. Tech., 40, 615–626, https://doi.org/10.1080/02786820600754623, 2006.
Atkinson, J. D., Murray, B. J., Woodhouse, M. T., Whale, T. F., Baustian, K. J., Carslaw, K. S., Dobbie, S., O'Sullivan, D., and Malkin, T. L.: The importance of feldspar for ice nucleation by mineral dust in mixed-phase clouds, Nature, 498, 355–358, https://doi.org/10.1038/nature12278, 2013.
Bein, K. J., Zhao, Y. J., Pekney, N. J., Davidson, C. I., Johnston, M. V., and Wexler, A. S.: Identification of sources of atmospheric PM at the Pittsburgh Supersite – Part II: Quantitative comparisons of single particle, particle number, and particle mass measurements, Atmos. Environ., 40, S424–S444, https://doi.org/10.1016/j.atmosenv.2006.01.064, 2006.
Beranek, J., Imre, D., and Zelenyuk, A.: Real-Time Shape-Based Particle Separation and Detailed in Situ Particle Shape Characterization, Anal. Chem., 84, 1459–1465, https://doi.org/10.1021/ac202235z, 2012.
Bertozzi, B.: Ice nucleation ability of secondary aerosol particles at cirrus cloud conditions, Doctoral dissertation, Karlsruhe Institute of Technology, https://doi.org/10.5445/IR/1000146739, 2022.
Bertozzi, B., Wagner, R., Leisner, T., and Möhler, O.: Suppression of the heterogeneous ice nucleation ability of feldspar particles at cirrus formation conditions by atmospherically relevant coatings, in preparation, 2024.
Bhandari, J., China, S., Chandrakar, K. K., Kinney, G., Cantrell, W., Shaw, R. A., Mazzoleni, L. R., Girotto, G., Sharma, N., Gorkowski, K., Gilardoni, S., Decesari, S., Facchini, M. C., Zanca, N., Pavese, G., Esposito, F., Dubey, M. K., Aiken, A. C., Chakrabarty, R. K., Moosmüller, H., Onasch, T. B., Zaveri, R. A., Scarnato, B. V., Fialho, P., and Mazzoleni, C.: Extensive Soot Compaction by Cloud Processing from Laboratory and Field Observations, Sci. Rep.-UK, 9, 11824, https://doi.org/10.1038/s41598-019-48143-y, 2019.
Bohren, C. F. and Huffman, D. R.: Absorption and Scattering of Light by Small Particles, 1st edn., Wiley, https://doi.org/10.1002/9783527618156, 1998.
Brands, M., Kamphus, M., Böttger, T., Schneider, J., Drewnick, F., Roth, A., Curtius, J., Voigt, C., Borbon, A., Beekmann, M., Bourdon, A., Perrin, T., and Borrmann, S.: Characterization of a newly developed aircraft-based laser ablation aerosol mass spectrometer (ALABAMA) and first field deployment in urban pollution plumes over Paris during MEGAPOLI 2009, Aerosol Sci. Tech., 45, 46–64, https://doi.org/10.1080/02786826.2010.517813, 2011.
Cabalo, J., Zelenyuk, A., Baer, T., and Miller, R. E.: Two-Color Laser Induced Evaporation Dynamics of Liquid Aerosols Probed by Time-of-Flight Mass Spectrometry, Aerosol Sci. Tech., 33, 3–19, https://doi.org/10.1080/027868200410813, 2000.
Clemen, H.-C., Schneider, J., Klimach, T., Helleis, F., Köllner, F., Hünig, A., Rubach, F., Mertes, S., Wex, H., Stratmann, F., Welti, A., Kohl, R., Frank, F., and Borrmann, S.: Optimizing the detection, ablation, and ion extraction efficiency of a single-particle laser ablation mass spectrometer for application in environments with low aerosol particle concentrations, Atmos. Meas. Tech., 13, 5923–5953, https://doi.org/10.5194/amt-13-5923-2020, 2020.
Corbin, J. C., Modini, R. L., and Gysel-Beer, M.: Mechanisms of soot-aggregate restructuring and compaction, Aerosol Sci. Tech., 57, 89–111, https://doi.org/10.1080/02786826.2022.2137385, 2023.
Cornwell, G. C., McCluskey, C. S., Levin, E. J. T., Suski, K. J., DeMott, P. J., Kreidenweis, S. M., and Prather, K. A.: Direct Online Mass Spectrometry Measurements of Ice Nucleating Particles at a California Coastal Site, J. Geophys. Res.-Atmos., 124, 12157–12172, https://doi.org/10.1029/2019JD030466, 2019.
Crawford, I., Möhler, O., Schnaiter, M., Saathoff, H., Liu, D., McMeeking, G., Linke, C., Flynn, M., Bower, K. N., Connolly, P. J., Gallagher, M. W., and Coe, H.: Studies of propane flame soot acting as heterogeneous ice nuclei in conjunction with single particle soot photometer measurements, Atmos. Chem. Phys., 11, 9549–9561, https://doi.org/10.5194/acp-11-9549-2011, 2011.
Cziczo, D. J. and Froyd, K. D.: Sampling the composition of cirrus ice residuals, Atmos. Res., 142, 15–31, https://doi.org/10.1016/j.atmosres.2013.06.012, 2014.
Cziczo, D. J., DeMott, P. J., Brock, C., Hudson, P. K., Jesse, B., Kreidenweis, S. M., Prenni, A. J., Schreiner, J., Thomson, D. S., Murphy, D. M., and Tobias, H. J.: A method for single particle mass spectrometry of ice nuclei, Aerosol Sci. Tech., 37, 460–470, https://doi.org/10.1080/02786820300976, 2003.
Cziczo, D. J., Murphy, D. M., Hudson, P. K., and Thomson, D. S.: Single particle measurements of the chemical composition of cirrus ice residue during CRYSTAL-FACE, J. Geophys. Res.-Atmos., 109, 2003JD004032, https://doi.org/10.1029/2003JD004032, 2004.
Cziczo, D. J., Thomson, D. S., Thompson, T. L., DeMott, P. J., and Murphy, D. M.: Particle analysis by laser mass spectrometry (PALMS) studies of ice nuclei and other low number density particles, Int. J. Mass Spectrom., 258, 21–29, https://doi.org/10.1016/j.ijms.2006.05.013, 2006.
Cziczo, D. J., Froyd, K. D., Gallavardin, S. J., Moehler, O., Benz, S., Saathoff, H., and Murphy, D. M.: Deactivation of ice nuclei due to atmospherically relevant surface coatings, Environ. Res. Lett., 4, 044013, https://doi.org/10.1088/1748-9326/4/4/044013, 2009.
Cziczo, D. J., Froyd, K. D., Hoose, C., Jensen, E. J., Diao, M., Zondlo, M. A., Jessica, B. S., Twohy, C. H., and Murphy, D. M.: Clarifying the dominant sources and mechanisms of cirrus cloud formation, Science, 340, 1320–1324, https://doi.org/10.1126/science.1234145, 2013.
Cziczo, D. J., Ladino, L. A., Boose, Y., Kanji, Z. A., Kupiszewski, P., Lance, S., Mertes, S., and Wex H.: Measurements of ice nucleating particles and ice residuals, Meteor. Mon., 58, 8.1–8.13, https://doi.org/10.1175/AMSMONOGRAPHS-D-16-0008.1, 2017.
Davis, W. D.: Continuous mass spectrometric analysis of particulates by use of surface ionization, Environ. Sci. Technol., 11, 587–592, https://doi.org/10.1021/es60129a004, 1977.
DeCarlo, P. F., Slowik, J. G., Worsnop, D. R., Davidovits, P., and Jimenez, J. L.: Particle morphology and density characterization by combined mobility and aerodynamic diameter measurements. Part 1: Theory, Aerosol Sci. Tech., 38, 1185–1205, https://doi.org/10.1080/027868290903907, 2004.
DeCarlo, P. F., Kimmel, J. R., Trimborn, A., Northway, M. J., Jayne, J. T., Aiken, A. C., Gonin, M., Fuhrer, K., Horvath, T., Docherty, K. S., Worsnop, D. R., and Jimenez, J. L.: Field-deployable, high-resolution, time-of-flight aerosol mass spectrometer, Anal. Chem., 78, 8281–8289, https://doi.org/10.1021/ac061249n, 2006.
DeMott, P. J., Cziczo, D. J., Prenni, A. J., Murphy, D. M., Kreidenweis, S. M., Thomson, D. S., Borys, R., and Rogers, D. C.: Measurements of the concentration and composition of nuclei for cirrus formation, P. Natl. Acad. Sci. USA, 100, 14655–14660, https://doi.org/10.1073/pnas.2532677100, 2003.
DeMott, P. J., Mohler, O., Stetzer, O., Vali, G., Levin, Z., Petters, M. D., Murakami, M., Leisner, T., Bundke, U., Klein, H., Kanji, Z. A., Cotton, R., Jones, H., Benz, S., Brinkmann, M., Rzesanke, D., Saathoff, H., Nicolet, M., Saito, A., Nillius, B., Bingemer, H., Abbatt, J., Ardon, K., Ganor, E., Georgakopoulos, D. G., and Saunders, C.: Resurgence in Ice Nuclei Measurement Research, B. Am. Meteorol. Soc., 92, 1623–1635, https://doi.org/10.1175/2011BAMS3119.1, 2011.
DeMott, P. J., Möhler, O., Cziczo, D. J., Hiranuma, N., Petters, M. D., Petters, S. S., Belosi, F., Bingemer, H. G., Brooks, S. D., Budke, C., Burkert-Kohn, M., Collier, K. N., Danielczok, A., Eppers, O., Felgitsch, L., Garimella, S., Grothe, H., Herenz, P., Hill, T. C. J., Höhler, K., Kanji, Z. A., Kiselev, A., Koop, T., Kristensen, T. B., Krüger, K., Kulkarni, G., Levin, E. J. T., Murray, B. J., Nicosia, A., O'Sullivan, D., Peckhaus, A., Polen, M. J., Price, H. C., Reicher, N., Rothenberg, D. A., Rudich, Y., Santachiara, G., Schiebel, T., Schrod, J., Seifried, T. M., Stratmann, F., Sullivan, R. C., Suski, K. J., Szakáll, M., Taylor, H. P., Ullrich, R., Vergara-Temprado, J., Wagner, R., Whale, T. F., Weber, D., Welti, A., Wilson, T. W., Wolf, M. J., and Zenker, J.: The Fifth International Workshop on Ice Nucleation phase 2 (FIN-02): laboratory intercomparison of ice nucleation measurements, Atmos. Meas. Tech., 11, 6231–6257, https://doi.org/10.5194/amt-11-6231-2018, 2018.
Dragoneas, A., Molleker, S., Appel, O., Hünig, A., Böttger, T., Hermann, M., Drewnick, F., Schneider, J., Weigel, R., and Borrmann, S.: The realization of autonomous, aircraft-based, real-time aerosol mass spectrometry in the upper troposphere and lower stratosphere, Atmos. Meas. Tech., 15, 5719–5742, https://doi.org/10.5194/amt-15-5719-2022, 2022.
Du, X., Xie, Q., Huang, Q., Li, X., Yang, J., Hou, Z., Wang, J., Li, X., Zhou, Z., Huang, Z., Gao, W., and Li, L.: Development and characterization of a high-performance single-particle aerosol mass spectrometer (HP-SPAMS), Atmos. Meas. Tech., 17, 1037–1050, https://doi.org/10.5194/amt-17-1037-2024, 2024.
Erdmann, N., Dell'Acqua, A., Cavalli, P., Gruning, C., Omenetto, N., Putaud, J. P., Raes, F., and Van Dingenen, R.: Instrument characterization and first application of the single particle analysis and sizing system (SPASS) for atmospheric aerosols, Aerosol Sci. Tech., 39, 377–393, https://doi.org/10.1080/027868290935696, 2005.
Fergenson, D. P., Song, X. H., Ramadan, Z., Allen, J. O., Hughes, L. S., Cass, G. R., Hopke, P. K., and Prather, K. A.: Quantification of ATOFMS data by multivariate methods, Anal. Chem., 73, 3535–3541, https://doi.org/10.1021/ac010022j, 2001.
Friedman, B., Kulkarni, G., Beránek, J., Zelenyuk, A., Thornton, J. A., and Cziczo, D. J.: Ice nucleation and droplet formation by bare and coated soot particles, J. Geophys. Res., 116, D17203, https://doi.org/10.1029/2011JD015999, 2011.
Froyd, K. D., Murphy, D. M., Brock, C. A., Campuzano-Jost, P., Dibb, J. E., Jimenez, J.-L., Kupc, A., Middlebrook, A. M., Schill, G. P., Thornhill, K. L., Williamson, C. J., Wilson, J. C., and Ziemba, L. D.: A new method to quantify mineral dust and other aerosol species from aircraft platforms using single-particle mass spectrometry, Atmos. Meas. Tech., 12, 6209–6239, https://doi.org/10.5194/amt-12-6209-2019, 2019.
Fuzzi, S., Baltensperger, U., Carslaw, K., Decesari, S., Denier van der Gon, H., Facchini, M. C., Fowler, D., Koren, I., Langford, B., Lohmann, U., Nemitz, E., Pandis, S., Riipinen, I., Rudich, Y., Schaap, M., Slowik, J. G., Spracklen, D. V., Vignati, E., Wild, M., Williams, M., and Gilardoni, S.: Particulate matter, air quality and climate: lessons learned and future needs, Atmos. Chem. Phys., 15, 8217–8299, https://doi.org/10.5194/acp-15-8217-2015, 2015.
Gaie-Levrel, F., Perrier, S., Perraudin, E., Stoll, C., Grand, N., and Schwell, M.: Development and characterization of a single particle laser ablation mass spectrometer (SPLAM) for organic aerosol studies, Atmos. Meas. Tech., 5, 225–241, https://doi.org/10.5194/amt-5-225-2012, 2012.
Gallavardin, S., Lohmann, U., and Cziczo, D.: Analysis and differentiation of mineral dust by single particle laser mass spectrometry, Int. J. Mass Spectrom., 274, 56–63, https://doi.org/10.1016/j.ijms.2008.04.031, 2008.
Gard, E., Mayer, J. E., Morrical, B. D., Dienes, T., Fergenson, D. P., and Prather, K. A.: Real-time analysis of individual atmospheric aerosol particles: Design and performance of a portable ATOFMS, Anal. Chem., 69, 4083–4091, https://doi.org/10.1021/ac970540n, 1997.
Gemayel, R., Hellebust, S., Temime-Roussel, B., Hayeck, N., Van Elteren, J. T., Wortham, H., and Gligorovski, S.: The performance and the characterization of laser ablation aerosol particle time-of-flight mass spectrometry (LAAP-ToF-MS), Atmos. Meas. Tech., 9, 1947–1959, https://doi.org/10.5194/amt-9-1947-2016, 2016.
Gemayel, R., Temime-Roussel, B., Hayeck, N., Gandolfo, A., Hellebust, S., Gligorovski, S., and Wortham, H.: Development of an analytical methodology for obtaining quantitative mass concentrations from LAAP-ToF-MS measurements, Talanta, 174, 715–724, https://doi.org/10.1016/j.talanta.2017.06.050, 2017.
Gross, D. S., Gälli, M. E., Silva, P. J., and Prather, K. A.: Relative sensitivity factors for alkali metal and ammonium cations in single particle aerosol time-of-flight mass spectra, Anal. Chem., 72, 416–422, https://doi.org/10.1021/ac990434g, 2000.
Gross, D. S., Atlas, R., Rzeszotarski, J., Turetsky, E., Christensen, J., Benzaid, S., Olson, J., Smith, T., Steinberg, L., and Sulman, J.: Environmental chemistry through intelligent atmospheric data analysis, Environ. Modell. Softw., 25, 760–769, https://doi.org/10.1016/j.envsoft.2009.12.001, 2010.
Gunsch, M. J., May, N. W., Wen, M., Bottenus, C. L. H., Gardner, D. J., VanReken, T. M., Bertman, S. B., Hopke, P. K., Ault, A. P., and Pratt, K. A.: Ubiquitous influence of wildfire emissions and secondary organic aerosol on summertime atmospheric aerosol in the forested Great Lakes region, Atmos. Chem. Phys., 18, 3701–3715, https://doi.org/10.5194/acp-18-3701-2018, 2018.
Hatch, L. E., Pratt, K. A., Huffman, J. A., Jimenez, J. L., and Prather, K. A.: Impacts of aerosol aging on laser desorption/ionization in single-particle mass spectrometers, Aerosol Sci. Tech., 48, 1050–1058, https://doi.org/10.1080/02786826.2014.955907, 2014.
Healy, R. M., Sciare, J., Poulain, L., Crippa, M., Wiedensohler, A., Prévôt, A. S. H., Baltensperger, U., Sarda-Estève, R., McGuire, M. L., Jeong, C.-H., McGillicuddy, E., O'Connor, I. P., Sodeau, J. R., Evans, G. J., and Wenger, J. C.: Quantitative determination of carbonaceous particle mixing state in Paris using single-particle mass spectrometer and aerosol mass spectrometer measurements, Atmos. Chem. Phys., 13, 9479–9496, https://doi.org/10.5194/acp-13-9479-2013, 2013.
Hoose, C. and Möhler, O.: Heterogeneous ice nucleation on atmospheric aerosols: a review of results from laboratory experiments, Atmos. Chem. Phys., 12, 9817–9854, https://doi.org/10.5194/acp-12-9817-2012, 2012.
Hünig, A., Appel, O., Dragoneas, A., Molleker, S., Clemen, H.-C., Helleis, F., Klimach, T., Köllner, F., Böttger, T., Drewnick, F., Schneider, J., and Borrmann, S.: Design, characterization, and first field deployment of a novel aircraft-based aerosol mass spectrometer combining the laser ablation and flash vaporization techniques, Atmos. Meas. Tech., 15, 2889–2921, https://doi.org/10.5194/amt-15-2889-2022, 2022.
IPCC: Climate Change 2021 – The Physical Science Basis: Working Group I Contribution to the Sixth Assessment Report of the Intergovernmental Panel on Climate Change, 1st edn., edited by: Masson-Delmotte, V., Zhai, P., Pirani, A., Connors, S. L., Péan, C., Berger, S., Caud, N., Chen, Y., Goldfarb, L., Gomis, M. I., Huang, M., Leitzell, K., Lonnoy, E., Matthews, J. B. R., Maycock, T. K., Waterfield, T., Yelekçi, O., Yu, R., and Zhou, B., Cambridge University Press, Cambridge, UK and New York, NY, USA, https://doi.org/10.1017/9781009157896, 2021.
Jacquot, J. L., Shen, X., Abou-Ghanem, M., Froyd, K. D., Lawler, M., Schill, G. P., Slovacek, K., Thomson, D. S., Cziczo, D. J., and Murphy, D. M.: A new airborne single particle mass spectrometer: PALMS-NG, Aerosol Sci. Tech., 58, 991–1007, https://doi.org/10.1080/02786826.2024.2331549, 2024.
Jeong, C.-H., McGuire, M. L., Godri, K. J., Slowik, J. G., Rehbein, P. J. G., and Evans, G. J.: Quantification of aerosol chemical composition using continuous single particle measurements, Atmos. Chem. Phys., 11, 7027–7044, https://doi.org/10.5194/acp-11-7027-2011, 2011.
Kamphus, M., Ettner-Mahl, M., Klimach, T., Drewnick, F., Keller, L., Cziczo, D. J., Mertes, S., Borrmann, S., and Curtius, J.: Chemical composition of ambient aerosol, ice residues and cloud droplet residues in mixed-phase clouds: single particle analysis during the Cloud and Aerosol Characterization Experiment (CLACE 6), Atmos. Chem. Phys., 10, 8077–8095, https://doi.org/10.5194/acp-10-8077-2010, 2010.
Kandler, K., Benker, N., Bundke, U., Cuevas, E., Ebert, M., Knippertz, P., Rodríguez, S., Schütz, L., and Weinbruch, S.: Chemical composition and complex refractive index of Saharan Mineral Dust at Izaña, Tenerife (Spain) derived by electron microscopy, Atmos. Environ., 41, 8058–8074, https://doi.org/10.1016/j.atmosenv.2007.06.047, 2007.
Kanji, Z. A., Ladino, L. A., Wex, H., Boose, Y., Burkert-Kohn, M., Cziczo, D. J., and Krämer, M.: Overview of ice nucleating particles, Meteor. Mon., 58, 1.1–1.33, https://doi.org/10.1175/AMSMONOGRAPHS-D-16-0006.1, 2017.
Kögel-Knabner, I., Guggenberger, G., Kleber, M., Kandeler, E., Kalbitz, K., Scheu, S., Eusterhues, K., and Leinweber, P.: Organo-mineral associations in temperate soils: Integrating biology, mineralogy, and organic matter chemistry, Z. Pflanz. Bodenkunde, 171, 61–82, https://doi.org/10.1002/jpln.200700048, 2008.
Köllner, F., Schneider, J., Willis, M. D., Klimach, T., Helleis, F., Bozem, H., Kunkel, D., Hoor, P., Burkart, J., Leaitch, W. R., Aliabadi, A. A., Abbatt, J. P. D., Herber, A. B., and Borrmann, S.: Particulate trimethylamine in the summertime Canadian high Arctic lower troposphere, Atmos. Chem. Phys., 17, 13747–13766, https://doi.org/10.5194/acp-17-13747-2017, 2017.
Lacher, L., Clemen, H.-C., Shen, X., Mertes, S., Gysel-Beer, M., Moallemi, A., Steinbacher, M., Henne, S., Saathoff, H., Möhler, O., Höhler, K., Schiebel, T., Weber, D., Schrod, J., Schneider, J., and Kanji, Z. A.: Sources and nature of ice-nucleating particles in the free troposphere at Jungfraujoch in winter 2017, Atmos. Chem. Phys., 21, 16925–16953, https://doi.org/10.5194/acp-21-16925-2021, 2021.
Li, L., Huang, Z. X., Dong, J. G., Li, M., Gao, W., Nian, H. Q., Fu, Z., Zhang, G. H., Bi, X. H., Cheng, P., and Zhou, Z.: Real time bipolar time-of-flight mass spectrometer for analyzing single aerosol particles, Int. J. Mass. Spectrom., 303, 118–124, https://doi.org/10.1016/j.ijms.2011.01.017, 2011.
Lin, Q., Zhang, G., Peng, L., Bi, X., Wang, X., Brechtel, F. J., Li, M., Chen, D., Peng, P., Sheng, G., and Zhou, Z.: In situ chemical composition measurement of individual cloud residue particles at a mountain site, southern China, Atmos. Chem. Phys., 17, 8473–8488, https://doi.org/10.5194/acp-17-8473-2017, 2017.
Liu, P., Ziemann, P. J., Kittelson, D. B., and McMurry, P. H.: Generating particle beams of controlled dimensions and divergence: II. Experimental evaluation of particle motion in aerodynamic lenses and nozzle expansions, Aerosol Sci. Tech., 22, 314–324, https://doi.org/10.1080/02786829408959749, 1995.
Lohmann, U., Lüönd, F., and Mahrt, F.: An Introduction to Clouds: From the Microscale to Climate, 1st edn., Cambridge University Press, https://doi.org/10.1017/CBO9781139087513, 2016.
Lu, D. W., Liu, Q., Yu, M., Yang, X. Z., Fu, Q., Zhang, X. S., Mu, Y. J., and Jiang, G. B.: Natural silicon isotopic signatures reveal the sources of airborne fine particulate matter, Environ. Sci. Technol., 52, 1088–1095, https://doi.org/10.1021/acs.est.7b06317, 2018.
Marsden, N., Flynn, M. J., Taylor, J. W., Allan, J. D., and Coe, H.: Evaluating the influence of laser wavelength and detection stage geometry on optical detection efficiency in a single-particle mass spectrometer, Atmos. Meas. Tech., 9, 6051–6068, https://doi.org/10.5194/amt-9-6051-2016, 2016.
Marsden, N. A., Flynn, M. J., Allan, J. D., and Coe, H.: Online differentiation of mineral phase in aerosol particles by ion formation mechanism using a LAAP-TOF single-particle mass spectrometer, Atmos. Meas. Tech., 11, 195–213, https://doi.org/10.5194/amt-11-195-2018, 2018.
Marsden, N. A., Ullrich, R., Möhler, O., Eriksen Hammer, S., Kandler, K., Cui, Z., Williams, P. I., Flynn, M. J., Liu, D., Allan, J. D., and Coe, H.: Mineralogy and mixing state of north African mineral dust by online single-particle mass spectrometry, Atmos. Chem. Phys., 19, 2259–2281, https://doi.org/10.5194/acp-19-2259-2019, 2019.
May, N. W., Gunsch, M. J., Olson, N. E., Bondy, A. L., Kirpes, R. M., Bertman, S. B., China, S., Laskin, A., Hopke, P. K., Ault, A. P., and Pratt, K. A.: Unexpected contributions of sea spray and lake spray aerosol to inland particulate matter, Environ. Sci. Tech. Let., 5, 405–412, https://doi.org/10.1021/acs.estlett.8b00254, 2018.
McKeown, P. J., Johnston, M. V., and Murphy, D. M.: On-line single-particle analysis by laser desorption mass spectrometry, Anal. Chem., 63, 2069–2073, https://doi.org/10.1021/ac00018a033, 1991.
Middlebrook, A. M., Murphy, D. M., Lee, S. H., Thomson, D. S., Prather, K. A., Wenzel, R. J., Liu, D. Y., Phares, D. J., Rhoads, K. P., Wexler, A. S., Johnston, M. V., Jimenez, J. L., Jayne, J. T., Worsnop, D. R., Yourshaw, I., Seinfeld, J. H., and Flagan, R. C.: A comparison of particle mass spectrometers during the 1999 Atlanta Supersite Project, J. Geophys. Res.-Atmos., 108, D7, https://doi.org/10.1029/2001jd000660, 2003.
Möhler, O., Nink, A., Saathoff, H., Schaefers, S., Schnaiter, M., Schöck, W., and Schurath, U.: The Karlsruhe aerosol chamber facility AIDA: technical description and first results of homogeneous and heterogeneous ice nucleation experiments, CERN, https://doi.org/10.5170/CERN-2001-007.163, 2001.
Möhler, O., Stetzer, O., Schaefers, S., Linke, C., Schnaiter, M., Tiede, R., Saathoff, H., Krämer, M., Mangold, A., Budz, P., Zink, P., Schreiner, J., Mauersberger, K., Haag, W., Kärcher, B., and Schurath, U.: Experimental investigation of homogeneous freezing of sulphuric acid particles in the aerosol chamber AIDA, Atmos. Chem. Phys., 3, 211–223, https://doi.org/10.5194/acp-3-211-2003, 2003.
Möhler, O., DeMott, P. J., Vali, G., and Levin, Z.: Microbiology and atmospheric processes: the role of biological particles in cloud physics, Biogeosciences, 4, 1059–1071, https://doi.org/10.5194/bg-4-1059-2007, 2007.
Möhler, O., Benz, S., Saathoff, H., Schnaiter, M., Wagner, R., Schneider, J., Walter, S., Ebert, V., and Wagner, S.: The effect of organic coating on the heterogeneous ice nucleation efficiency of mineral dust aerosols, Environ. Res. Lett., 3, 025007, https://doi.org/10.1088/1748-9326/3/2/025007, 2008.
Morrical, B. D., Fergenson, D. P., and Prather, K. A.: Coupling two-step laser desorption/ionization with aerosol time-of-flight mass spectrometry for the analysis of individual organic particles, J. Am. Soc. Mass Spectr., 9, 1068–1073, https://doi.org/10.1016/S1044-0305(98)00074-9, 1998.
Murphy, D. M.: The design of single particle laser mass spectrometers, Mass Spectrom. Rev., 26, 150–165, https://doi.org/10.1002/mas.20113, 2007.
Murphy, D. M. and Thomson, D. S.: Laser ionization mass-spectroscopy of single aerosol-particles, Aerosol Sci. Tech., 22, 237–249, https://doi.org/10.1080/02786829408959743, 1995.
Murphy, D. M., Middlebrook, A. M., and Warshawsky, M.: Cluster analysis of data from the Particle Analysis by Laser Mass Spectrometry (PALMS) instrument, Aerosol Sci. Tech., 37, 382–391, https://doi.org/10.1080/02786820300971, 2003.
Murphy, D. M., Hudson, P. K., Cziczo, D. J., Gallavardin, S., Froyd, K. D., Johnston, M. V., Middlebrook, A. M., Reinard, M. S., Thomson, D. S., Thornberry, T., and Wexler, A. S.: Distribution of lead in single atmospheric particles, Atmos. Chem. Phys., 7, 3195–3210, https://doi.org/10.5194/acp-7-3195-2007, 2007.
Murray, B. J. and Liu, X.: Ice-nucleating particles and their effects on clouds and radiation, in: Aerosols and Climate, Elsevier, 619–649, https://doi.org/10.1016/B978-0-12-819766-0.00014-6, 2022.
Murray, B. J., O'Sullivan, D., Atkinson, J. D., and Webb, M. E.: Ice nucleation by particles immersed in supercooled cloud droplets, Chem. Soc. Rev., 41, 6519, https://doi.org/10.1039/c2cs35200a, 2012.
Naumann, K.-H.: COSIMA – a computer program simulating the dynamics of fractal aerosols, J. Aerosol Sci., 34, 1371–1397, https://doi.org/10.1016/S0021-8502(03)00367-7, 2003.
Noble, C. A. and Prather, K. A.: Real-time single particle mass spectrometry: A historical review of a quarter century of the chemical analysis of aerosols, Mass Spectrom. Rev., 19, 248–274, https://doi.org/10.1002/1098-2787(200007)19:4<248::AID-MAS3>3.0.CO;2-I, 2000.
O'Sullivan, D., Murray, B. J., Malkin, T. L., Whale, T. F., Umo, N. S., Atkinson, J. D., Price, H. C., Baustian, K. J., Browse, J., and Webb, M. E.: Ice nucleation by fertile soil dusts: relative importance of mineral and biogenic components, Atmos. Chem. Phys., 14, 1853–1867, https://doi.org/10.5194/acp-14-1853-2014, 2014.
Passig, J., Schade, J., Rosewig, E. I., Irsig, R., Kröger-Badge, T., Czech, H., Sklorz, M., Streibel, T., Li, L., Li, X., Zhou, Z., Fallgren, H., Moldanova, J., and Zimmermann, R.: Resonance-enhanced detection of metals in aerosols using single-particle mass spectrometry, Atmos. Chem. Phys., 20, 7139–7152, https://doi.org/10.5194/acp-20-7139-2020, 2020.
Passig, J., Schade, J., Irsig, R., Kröger-Badge, T., Czech, H., Adam, T., Fallgren, H., Moldanova, J., Sklorz, M., Streibel, T., and Zimmermann, R.: Single-particle characterization of polycyclic aromatic hydrocarbons in background air in northern Europe, Atmos. Chem. Phys., 22, 1495–1514, https://doi.org/10.5194/acp-22-1495-2022, 2022.
Prather, K. A., Nordmeyer, T., and Salt, K.: Real-time characterization of individual aerosol particles using time-of-flight mass spectrometry, Anal. Chem., 66, 1403–1407, https://doi.org/10.1021/ac00081a007, 1994.
Pratt, K. A. and Prather, K. A.: Real-time, single-particle volatility, size, and chemical composition measurements of aged urban aerosols, Environ. Sci. Technol., 43, 8276–8282, https://doi.org/10.1021/es902002t, 2009.
Pratt, K. A. and Prather, K. A.: Mass spectrometry of atmospheric aerosols-Recent developments and applications. Part II: On-line mass spectrometry techniques, Mass Spectrom. Rev., 31, 17–48, https://doi.org/10.1002/mas.20330, 2012.
Qin, X. Y., Bhave, P. V., and Prather, K. A.: Comparison of two methods for obtaining quantitative mass concentrations from aerosol time-of-flight mass spectrometry measurements, Anal. Chem., 78, 6169–6178, https://doi.org/10.1021/ac060395q, 2006.
Ramisetty, R., Abdelmonem, A., Shen, X., Saathoff, H., Leisner, T., and Mohr, C.: Exploring femtosecond laser ablation in single-particle aerosol mass spectrometry, Atmos. Meas. Tech., 11, 4345–4360, https://doi.org/10.5194/amt-11-4345-2018, 2018.
Reilly, P. T. A., Lazar, A. C., Gieray, R. A., Whitten, W. B., and Ramsey, J. M.: The elucidation of charge-transfer-induced matrix effects in environmental aerosols via real-time aerosol mass spectral analysis of individual airborne particles, Aerosol Sci. Tech., 33, 135–152, https://doi.org/10.1080/027868200410895, 2000.
Reinard, M. S. and Johnston, M. V.: Ion formation mechanism in laser desorption ionization of individual nanoparticles, J. Am. Soc. Mass Spectr., 19, 389–399, https://doi.org/10.1016/j.jasms.2007.11.017, 2008.
Reitz, P., Zorn, S. R., Trimborn, S. H., and Trimborn, A. M.: A new, powerful technique to analyze single particle aerosol mass spectra using a combination of OPTICS and the fuzzy c-means algorithm, J. Aerosol Sci., 98, 1–14, https://doi.org/10.1016/j.jaerosci.2016.04.003, 2016.
Riemer, N., Ault, A. P., West, M., Craig, R. L., and Curtis, J. H.: Aerosol Mixing State: Measurements, Modeling, and Impacts, Rev. Geophys., 57, 187–249, https://doi.org/10.1029/2018RG000615, 2019.
Rogers, D. C., DeMott, P. J., Kreidenweis, S. M., and Chen, Y.: Measurements of ice nucleating aerosols during SUCCESS, Geophys. Res. Lett., 25, 1383–1386, https://doi.org/10.1029/97GL03478, 1998.
Roth, A., Schneider, J., Klimach, T., Mertes, S., van Pinxteren, D., Herrmann, H., and Borrmann, S.: Aerosol properties, source identification, and cloud processing in orographic clouds measured by single particle mass spectrometry on a central European mountain site during HCCT-2010, Atmos. Chem. Phys., 16, 505–524, https://doi.org/10.5194/acp-16-505-2016, 2016.
Saathoff, H., Möhler, O., Schurath, U., Kamm, S., Dippel, B., and Mihelcic, D.: The AIDA soot aerosol characterisation campaign 1999, J. Aerosol Sci., 34, 1277–1296, https://doi.org/10.1016/S0021-8502(03)00363-X, 2003.
Saathoff, H., Naumann, K.-H., Möhler, O., Jonsson, Å. M., Hallquist, M., Kiendler-Scharr, A., Mentel, Th. F., Tillmann, R., and Schurath, U.: Temperature dependence of yields of secondary organic aerosols from the ozonolysis of α-pinene and limonene, Atmos. Chem. Phys., 9, 1551–1577, https://doi.org/10.5194/acp-9-1551-2009, 2009.
Schade, J., Passig, J., Irsig, R., Ehlert, S., Sklorz, M., Adam, T., Li, C., Rudich, Y., and Zimmermann, R.: Spatially Shaped Laser Pulses for the Simultaneous Detection of Polycyclic Aromatic Hydrocarbons as well as Positive and Negative Inorganic Ions in Single Particle Mass Spectrometry, Anal. Chem., 91, 10282–10288, https://doi.org/10.1021/acs.analchem.9b02477, 2019.
Schmidt, S., Schneider, J., Klimach, T., Mertes, S., Schenk, L. P., Kupiszewski, P., Curtius, J., and Borrmann, S.: Online single particle analysis of ice particle residuals from mountain-top mixed-phase clouds using laboratory derived particle type assignment, Atmos. Chem. Phys., 17, 575–594, https://doi.org/10.5194/acp-17-575-2017, 2017.
Schneider, J., Weimer, S., Drewnick, F., Borrmann, S., Helas, G., Gwaze, P., Schmid, O., Andreae, M. O., and Kirchner, U.: Mass spectrometric analysis and aerodynamic properties of various types of combustion-related aerosol particles, Int. J. Mass Spectrom., 258, 37–49, https://doi.org/10.1016/j.ijms.2006.07.008, 2006.
Schreiner, J., Schild, U., Voigt, C., and Mauersberger, K.: Focusing of aerosols into a particle beam at pressures from 10 to 150 Torr, Aerosol Sci. Tech., 31, 373–382, https://doi.org/10.1080/027868299304093, 1999.
Shapiro, M., Vainshtein, P., Dutcher, D., Emery, M., Stolzenburg, M., Kittelson, D. B., and McMurry, P. H.: Characterization of agglomerates by simultaneous measurement of mobility, vacuum aerodynamic diameter and mass, J. Aerosol Sci., 44, 24–45, https://doi.org/10.1016/j.jaerosci.2011.08.004, 2012.
Shen, X., Ramisetty, R., Mohr, C., Huang, W., Leisner, T., and Saathoff, H.: Laser ablation aerosol particle time-of-flight mass spectrometer (LAAPTOF): performance, reference spectra and classification of atmospheric samples, Atmos. Meas. Tech., 11, 2325–2343, https://doi.org/10.5194/amt-11-2325-2018, 2018.
Shen, X., Saathoff, H., Huang, W., Mohr, C., Ramisetty, R., and Leisner, T.: Understanding atmospheric aerosol particles with improved particle identification and quantification by single-particle mass spectrometry, Atmos. Meas. Tech., 12, 2219–2240, https://doi.org/10.5194/amt-12-2219-2019, 2019.
Shen, X., Bell, D. M., Coe, H., Hiranuma, N., Mahrt, F., Marsden, N. A., Mohr, C., Murphy, D. M., Saathoff, H., Schneider, J., Wilson, J., Zawadowicz, M. A., Zelenyuk, A., DeMott, P. J., Möhler, O., and Cziczo, D. J.: Dataset for the paper entitled “The Fifth International Workshop on Ice Nucleation Phase 1 (FIN-01): Intercomparison of Single Particle Mass Spectrometers”, https://doi.org/10.35097/ZGLkxMLhgxxEHhkk, 2024.
Sinha, M. P. and Friedlander, S. K.: Real-time measurement of sodium chloride in individual aerosol particles by mass spectrometry, Anal. Chem., 57, 1880–1883, https://doi.org/10.1021/ac00286a019, 1985.
Slowik, J. G., Stainken, K., Davidovits, P., Williams, L. R., Jayne, J. T., Kolb, C. E., Worsnop, D. R., Rudich, Y., DeCarlo, P. F., and Jimenez, J. L.: Particle Morphology and Density Characterization by Combined Mobility and Aerodynamic Diameter Measurements. Part 2: Application to Combustion-Generated Soot Aerosols as a Function of Fuel Equivalence Ratio, Aerosol Sci. Tech., 38, 1206–1222, https://doi.org/10.1080/027868290903916, 2004.
Sorensen, C. M.: The Mobility of Fractal Aggregates: A Review, Aerosol Sci. Tech., 45, 765–779, https://doi.org/10.1080/02786826.2011.560909, 2011.
Su, Y. X., Sipin, M. F., Furutani, H., and Prather, K. A.: Development and characterization of an aerosol time-of-flight mass spectrometer with increased detection efficiency, Anal. Chem., 76, 712–719, https://doi.org/10.1021/ac034797z, 2004.
Sullivan, R. C., Petters, M. D., DeMott, P. J., Kreidenweis, S. M., Wex, H., Niedermeier, D., Hartmann, S., Clauss, T., Stratmann, F., Reitz, P., Schneider, J., and Sierau, B.: Irreversible loss of ice nucleation active sites in mineral dust particles caused by sulphuric acid condensation, Atmos. Chem. Phys., 10, 11471–11487, https://doi.org/10.5194/acp-10-11471-2010, 2010.
Suski, K. J., Bell, D. M., Newburn, M. K., Alexander, M. L., Imre, D., Koppenaal, D. W., and Zelenyuk, A.: Real-time characterization of particles produced by laser ablation for analysis by inductively coupled plasma mass spectrometry, Spectrochim. Acta B, 179, 106092, https://doi.org/10.1016/j.sab.2021.106092, 2021.
Thomson, D. S., Middlebrook, A. M., and Murphy, D. M.: Thresholds for laser-induced ion formation from aerosols in a vacuum using ultraviolet and vacuum-ultraviolet laser wavelengths, Aerosol Sci. Tech., 26, 544–559, https://doi.org/10.1080/02786829708965452, 1997.
Thomson, D. S., Schein, M. E., and Murphy, D. M.: Particle analysis by laser mass spectrometry WB-57F instrument overview, Aerosol Sci. Tech., 33, 153–169, https://doi.org/10.1080/027868200410903, 2000.
Tobo, Y., DeMott, P. J., Hill, T. C. J., Prenni, A. J., Swoboda-Colberg, N. G., Franc, G. D., and Kreidenweis, S. M.: Organic matter matters for ice nuclei of agricultural soil origin, Atmos. Chem. Phys., 14, 8521–8531, https://doi.org/10.5194/acp-14-8521-2014, 2014.
Trimborn, A., Hinz, K.-P., and Spengler, B.: Online analysis of atmospheric particles with a transportable laser mass spectrometer, Aerosol Sci. Tech., 33, 191–201, https://doi.org/10.1080/027868200410921, 2000.
Vaden, T. D., Imre, D., Beranek, J., and Zelenyuk, A.: Extending the Capabilities of Single Particle Mass Spectrometry: II. Measurements of Aerosol Particle Density without DMA, Aerosol Sci. Tech., 45, 125–135, https://doi.org/10.1080/02786826.2010.526156, 2011.
Wenzel, R. J., Liu, D. Y., Edgerton, E. S., and Prather, K. A.: Aerosol time-of-flight mass spectrometry during the Atlanta Supersite Experiment: 2. Scaling procedures, J. Geophys. Res. Atmos., 108, 8427, https://doi.org/10.1029/2001jd001563, 2003.
Wex, H., Augustin-Bauditz, S., Boose, Y., Budke, C., Curtius, J., Diehl, K., Dreyer, A., Frank, F., Hartmann, S., Hiranuma, N., Jantsch, E., Kanji, Z. A., Kiselev, A., Koop, T., Möhler, O., Niedermeier, D., Nillius, B., Rösch, M., Rose, D., Schmidt, C., Steinke, I., and Stratmann, F.: Intercomparing different devices for the investigation of ice nucleating particles using Snomax® as test substance, Atmos. Chem. Phys., 15, 1463–1485, https://doi.org/10.5194/acp-15-1463-2015, 2015.
Woods, E., Smith, G. D., Dessiaterik, Y., Baer, T., and Miller, R. E.: Quantitative detection of aromatic compounds in single aerosol particle mass spectrometry, Anal. Chem., 73, 2317–2322, https://doi.org/10.1021/ac001166l, 2001.
Zawadowicz, M. A., Froyd, K. D., Murphy, D. M., and Cziczo, D. J.: Improved identification of primary biological aerosol particles using single-particle mass spectrometry, Atmos. Chem. Phys., 17, 7193–7212, https://doi.org/10.5194/acp-17-7193-2017, 2017.
Zawadowicz, M. A., Lance, S., Jayne, J. T., Croteau, P., Worsnop, D. R., Mahrt, F., Leisner, T., and Cziczo, D. J.: Quantifying and improving the optical performance of the Laser Ablation Aerosol Particle Time of Flight Mass Spectrometer (LAAPToF) instrument, Aerosol Sci. Tech., 54, 761–771, https://doi.org/10.1080/02786826.2020.1724867, 2020.
Zelenyuk, A. and Imre, D.: Single particle laser ablation time-of-flight mass spectrometer: An introduction to SPLAT, Aerosol Sci. Tech., 39, 554–568, https://doi.org/10.1080/027868291009242, 2005.
Zelenyuk, A., Cabalo, J., Baer, T., and Miller, R. E.: Mass Spectrometry of Liquid Aniline Aerosol Particles by IR/UV Laser Irradiation, Anal. Chem., 71, 1802–1808, https://doi.org/10.1021/ac980971l, 1999.
Zelenyuk, A., Imre, D., Cai, Y., Mueller, K., Han, Y. P., and Imrich, P.: SpectraMiner, an interactive data mining and visualization software for single particle mass spectroscopy: A laboratory test case, Int. J. Mass Spectrom., 258, 58–73, https://doi.org/10.1016/j.ijms.2006.06.015, 2006.
Zelenyuk, A., Yang, J., Song, C., Zaveri, R. A., and Imre, D.: A New Real-Time Method for Determining Particles' Sphericity and Density: Application to Secondary Organic Aerosol Formed by Ozonolysis of α-Pinene, Environ. Sci. Technol., 42, 8033–8038, https://doi.org/10.1021/es8013562, 2008a.
Zelenyuk, A., Imre, D., Nam, E. J., Han, Y., and Mueller, K.: ClusterSculptor: Software for expert-steered classification of single particle mass spectra, Int. J. Mass Spectrom., 275, 1–10, https://doi.org/10.1016/j.ijms.2008.04.033, 2008b.
Zelenyuk, A., Yang, J., Choi, E., and Imre, D.: SPLAT II: An aircraft compatible, ultra-sensitive, high precision instrument for in-situ characterization of the size and composition of fine and ultrafine particles, Aerosol Sci. Tech., 43, 411–424, https://doi.org/10.1080/02786820802709243, 2009a.
Zelenyuk, A., Yang, J., and Imre, D.: Comparison between mass spectra of individual organic particles generated by UV laser ablation and in the IR/UV two-step mode, Int. J. Mass Spectrom., 282, 6–12, https://doi.org/10.1016/j.ijms.2009.01.015, 2009b.
Zelenyuk, A., Imre, D., Wilson, J., Zhang, Z., Wang, J., and Mueller, K.: Airborne Single Particle Mass Spectrometers (SPLAT II & miniSPLAT) and New Software for Data Visualization and Analysis in a Geo-Spatial Context, J. Am. Soc. Mass Spectr., 26, 257–270, https://doi.org/10.1007/s13361-014-1043-4, 2015.
Zenobi, R. and Knochenmuss, R.: Ion formation in MALDI mass spectrometry, Mass Spectrom. Rev., 17, 337–366, https://doi.org/10.1002/(Sici)1098-2787(1998)17:5<337::Aid-Mas2>3.0.Co;2-S, 1998.
Zhou, Y., Huang, X. H. H., Griffith, S. M., Li, M., Li, L., Zhou, Z., Wu, C., Meng, J. W., Chan, C. K., Louie, P. K. K., and Yu, J. Z.: A field measurement based scaling approach for quantification of major ions, organic carbon, and elemental carbon using a single particle aerosol mass spectrometer, Atmos. Environ., 143, 300–312, https://doi.org/10.1016/j.atmosenv.2016.08.054, 2016.