the Creative Commons Attribution 4.0 License.
the Creative Commons Attribution 4.0 License.
 | 26 Sep 2024
Impact of meteorology and aerosol sources on PM2.5 and oxidative potential variability and levels in China
Jiemei Liu
Jesper H. Christensen
Zhuyun Ye
Shikui Dong
Camilla Geels
Jørgen Brandt
Athanasios Nenes
Yuan Yuan
China has long-term high PM2.5 levels, and its oxidative potential (OP) is worth studying as it may unravel the impacts of aerosol pollution on public health better than PM2.5 alone. OP refers to the ability of PM2.5 to induce oxidative stress (OS). OP and PM2.5 are influenced by meteorological factors, anthropogenic emission sources, and atmospheric aging. Although their impact on PM2.5 has been studied, OP measurements only recently became available and on a limited scale, as they require considerable technical expertise and resources. For this, the joint relationship between PM2.5 and OP for a wide range of meteorological conditions and emission profiles remain elusive. Towards this, we estimated PM2.5 and OP over China using the Danish Eulerian Hemispheric Model (DEHM) system with meteorological input from the Weather Research and Forecasting (WRF) model. It was found that higher values of PM2.5 and OP were primarily concentrated in urban agglomerations in the central and eastern regions of China, while lower values were found in the western and northeastern regions. Furthermore, the probability density function revealed that about 40 % of areas in China had annual average PM2.5 concentrations exceeding the Chinese concentration limit. For OP, 36 % of the regions have OP below 1 , 41 % have OP between 1 and 2 , and 23 % have OP above 2 , which are in line with previous measurement studies. Analysis of the simulations indicates that meteorological conditions contributed 46 % and 65 % to PM2.5 concentrations and OP variability, respectively, while anthropogenic emissions contributed 54 % and 35 % to PM2.5 concentrations and OP variability, respectively. The emission sensitivity analysis also highlighted the fact that PM2.5 and OP levels are mostly determined by secondary aerosol formation and biomass burning.
- Article
(2965 KB) - Full-text XML
-
Supplement
(1155 KB) - BibTeX
- EndNote


Fine particulate matter, with an aerodynamic diameter of less than 2.5 µm (PM2.5), is the primary atmospheric pollutant in China (Chen et al., 2021; Chen and Cao, 2021; J. Liu et al., 2023) with respect to human health. PM2.5 exposure in China for 2017 resulted in an estimated 1.8 (95 % CI: 1.6, 2.0) million premature deaths (M. Liu et al., 2021). Many recent studies have suggested that the oxidative potential (OP) of PM2.5 may better explain the negative impact of PM2.5 exposure on human health than the well-established metric of mass concentrations (Yu et al., 2019; Gao et al., 2020). OP refers to the ability of PM2.5 to induce oxidative stress (OS) (Yang et al., 2021). Liu et al. (2020) summarized OP measurements conducted in nine regions of China around 2014. The results showed that the average OP content in northern Beijing was highest during the winter of 2016 (∼ 14.0 ), while the average OP level in Shanghai during the spring of 2016 was lowest (∼ 0.15 ). However, there is currently no exact threshold division of OP values. Exposure to high levels of OP (from compounds such as quinones and soluble transitional metals) induces an excess production of reactive oxygen species (ROS) in cells and leads to OS effects that ultimately trigger inflammation and disease. Therefore, reducing PM2.5 pollution and its associated OP (the volume-normalized dithiothreitol activity) is critical to addressing China's environmental and environmental health issues.
Anthropogenic emissions, as the main source of PM2.5 pollution and environmental health risks, have been studied extensively (Chen et al., 2019; Liu et al., 2022a). Zhu et al. (2018) and Pui et al. (2014) summarized the studies on PM sources in China and reported that secondary inorganic aerosols (SIAs), industry, residential combustion, biomass burning, industry, and transportation are the main source categories in China in the historical and future business-as-usual scenarios. Due to the significant influence of various sectors on PM2.5 emissions and research (Liu et al., 2018; Liu et al., 2020) indicating a close association between PM2.5 and OP, the connection between OP, serving as a toxicity indicator for PM2.5, and its sources (Liu et al., 2020) is becoming increasingly crucial and the topic of numerous studies. For instance, Yu et al. (2019) used a dithiothreitol (DTT) assay to measure the PM2.5 samples in Beijing throughout the year and identified vehicle emissions as the main contributing source based on the source analysis of OP. However, studies conducted in three coastal cities of the Bohai Sea region (Liu et al., 2018) and in Nanjing (Zhang et al., 2023) using the same DTT assay indicated that coal combustion was the most active source of OP. Together, these studies suggest that obtaining the spatial distribution characteristics of PM2.5 and OP as well as their links to emission sources is of paramount importance for implementing region-specific control measures.
Apart from anthropogenic emissions, meteorological conditions (i.e., temperature, humidity, wind speed, precipitation) also play a crucial role in the formation, accumulation, transformation, and dispersion of PM2.5 (Liu et al., 2022a, b). Utilizing a multiple linear regression model, Gong et al. (2022) conducted an analysis of the trends of meteorological elements and PM2.5 levels across various regions in China from 2013 to 2020. Furthermore, they separated and quantified the impacts of meteorological factors and emissions on these trends. The findings indicate that meteorology alone can account for approximately 20 %–33 % of the variability in PM2.5 levels. Xing et al. (2023) conducted a study in the Shenzhen region using DTT, ascorbic acid (AA), and glutathione (GSH) OP assays. They analyzed meteorological conditions and PM2.5 chemical composition to understand how the prevalence of monsoons in winter (northern and northeastern winds) and summer (southern and southeastern winds) affected the sources and contributed to the seasonal variation in PM2.5 composition and OP (mass-normalized). Similarly, Molina et al. (2023) and Wang et al. (2019) revealed that meteorological conditions indirectly influence OP (volume-normalized and mass-normalized) through their impact on the chemical properties of the components. Ainur et al. (2023), employing a DTT assay, investigated outdoor health risks associated with atmospheric particulate matter in Xi'an and found a positive correlation between winter OP (volume-normalized) and relative humidity. Although several studies have identified linkages between meteorological conditions and PM2.5 and OP, quantitative assessment of meteorological conditions for both PM2.5 and OP variability is lacking.
As of the present, research on the influence of both meteorological conditions and anthropogenic emissions on OP primarily relies on measurement methods (Yu et al., 2019; Gao et al., 2020; Campbell et al., 2021), such as DTT, AA, and GSH, which are difficult and costly to test and make it hard to provide the spatial distribution of OP comprehensively. Although mechanistic models of OP do exist (Shahpoury et al., 2024), their links to experimental metrics of OP are qualitative. For this, we propose a hybrid approach combining existing observations of OP with a chemistry transport model (CTM). So, OP from assays and their observed links to sources and chemical constituents can then be parameterized and implemented in a CTM for a comprehensive assessment of OP exposure over large areas and time periods.
This study quantifies the contribution of meteorological and anthropogenic emission factors (i.e., coal combustion, biomass burning, secondary aerosol formation that originate from a series of atmospheric reactions, industry, and transportation sources) to OP and PM2.5 levels throughout China with the Danish Eulerian Hemispheric Model (DEHM). The study hence provides a method for calculating OP across China and using OP as an indicator to assess the impacts of anthropogenic emission sources on human health in China.
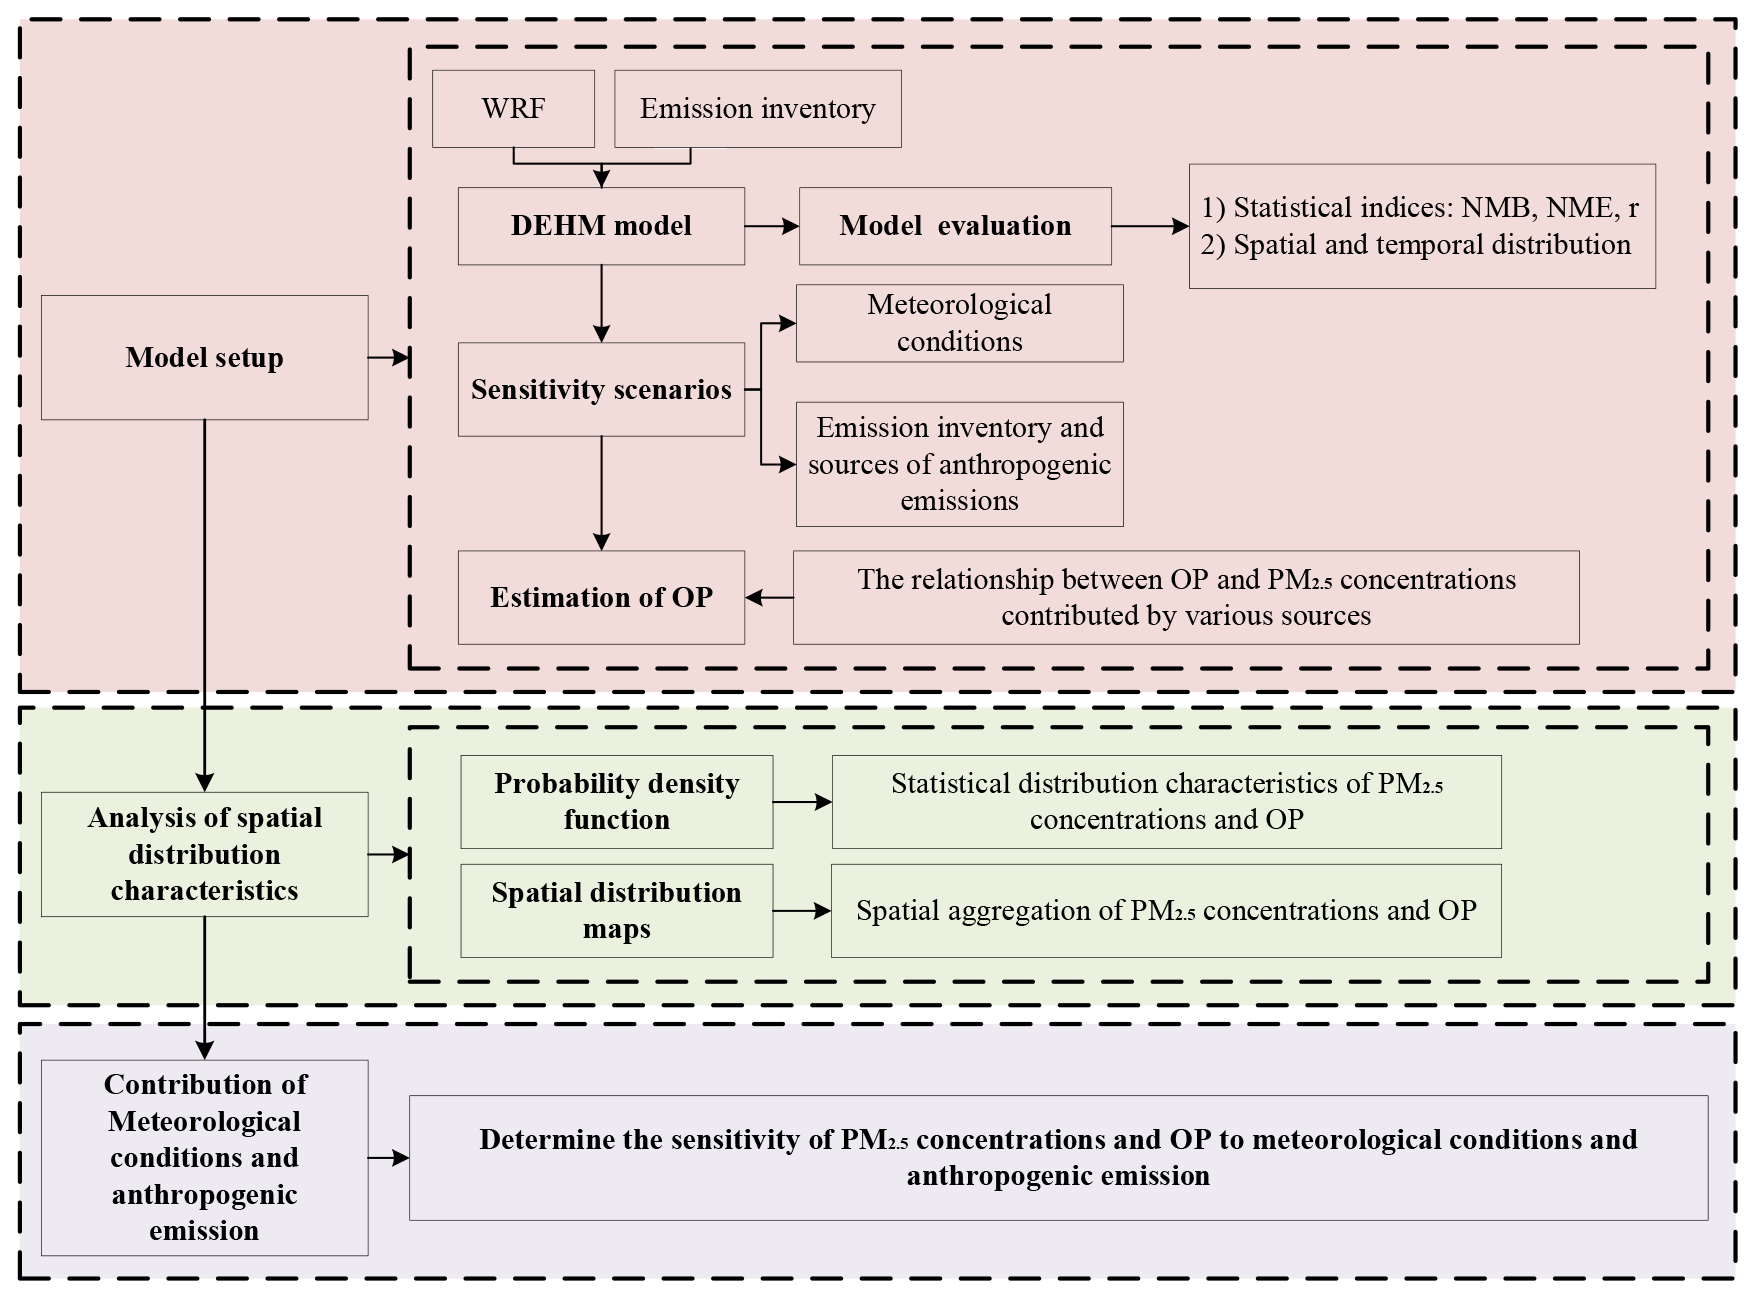
Figure 1Schematic diagram of the study strategy; NME, NMB, r, and OP are normalized mean error, normalized mean bias, correlation coefficient, and oxidative potential, respectively.
2.1 Methodological flow
The research strategy of this study consists of three main parts: model setup, spatial distribution characteristic analysis, and quantification of meteorological conditions and anthropogenic emission contributions (Fig. 1). In the first part, DEHM was employed to obtain hourly pollutant concentrations, followed by model evaluation, where the Weather Research and Forecasting (WRF) model v4.1 (Skamarock et al., 2008) driven by either ERA5 or global climate data from the Community Earth System Model (CESM) was used as meteorological input to DEHM and with exactly same spatial setup for China as in DEHM. Sensitivity experiments were designed for meteorological conditions, emission inventories, and anthropogenic emission sources. From these simulations, the spatial-scale estimation of OP was estimated by incorporating simulated values of primary and secondary PM2.5 concentrations from various anthropogenic sources into Eq. (1) (see Sect. 2.2 for details).
In the second part, the spatial distribution characteristics of PM2.5 and OP were determined using probability density functions (PDFs) and spatial distribution maps. In the third part, quantitative analysis was conducted based on the simulation results from the sensitivity experiments to determine the extent of the influence of meteorology and emissions on PM2.5 and OP, as well as the primary sources of PM2.5 and OP.
2.2 Estimation of OP
Most current data on OP of PM2.5 in China are obtained by means of measurement, and the research objects are basically limited to specific cities, which to some extent hinders conducting research on OP in a large-scale region. Considering that Liu et al. (2018) collected samples across four seasons from multiple representative locations in China, their developed OP prediction model (Eq. 1) can support us in estimating OP (with units of ) in China, thereby exploring the spatial distribution characteristics of OP and the contributions of different anthropogenic sources to OP. In the present study, we have used this relationship, in combination with the sensitivity simulations (Sect. 2.4), to calculate the OP.
Here, re, bi, in, and tr represent the primary PM2.5 concentrations (with units of µg m−3) for coal combustion, biomass burning, industry sources, and transportation sources, respectively. The notation se (secondary aerosol formation) refers to the concentrations of secondary organic and inorganic (SOA and SIA, respectively) components (with units of µg m−3). In this study, coal combustion refers to coal heating from the residential sector. Biomass burning includes open burning of agricultural biomass, domestic biomass burning for cooking and heating, and biomass burning from biomass power plants and coal-fired power plants. The industry source is mainly derived from specific industrial processes in iron and steel, metallurgical production plants for non-ferrous metals (e.g., titanium and molybdenum), and so on. The transportation source primarily comes from tailpipe emissions. It is worth mentioning that secondary aerosol formation originates from a series of atmospheric reactions. Some identified sources (i.e., coal combustion, biomass burning, industrial processes, and transportation) may generate secondary inorganic and organic aerosols through the emission of their precursor components. The coefficient (with units of ) reflects the intrinsic OP of each source.
2.3 Model setup
The DEHM can capture many features of PM well and its precursors' changes in large-scale space (Christensen, 1997; Brandt et al., 2012; Im et al., 2019). To date, the DEHM has been widely used in air pollution and health risk assessment research in Europe and Asia (Brandt et al., 2013a b; Zare et al., 2014; Geels et al., 2015, 2021; Im et al., 2018, 2019, 2023; Lehtomäki et al., 2020; Cramer et al., 2020; S. Liu et al., 2021; Thomas et al., 2022), but this will be the first time that DEHM is applied to estimate OP. Thus, the DEHM system was used to simulate the pollutant concentrations in 2014 by using a two-way nested domain in this study (Kumar et al., 2016). A parent domain with a resolution of 150 km × 150 km was employed on a polar stereographic projection, true at 60° N to cover the entire Northern Hemisphere. The nested domain covered the whole of China, consisting of 150 × 150 grid cells with a resolution of 50 km × 50 km, which was used for the analysis. The mother domain provided initial and boundary conditions for the nested domain. Vertically, there were 29 unevenly distributed layers, with the highest level reaching 100 hPa, and the lowest layer was approximately 20 m in height. The meteorological fields were simulated using the WRF model (Skamarock et al., 2008) with the same domain and resolution driven by global meteorological data obtained from the ERA5 dataset and the CESM global model, respectively. The simulations utilized the revised MM5 surface layer scheme, the Yonsei University (YSU) boundary layer parameterization scheme (Hong et al., 2006), the multi-scale Kain–Fritsch cumulus parameterization scheme (Zheng et al., 2016), the CAM longwave radiation scheme, and the CAM shortwave radiation scheme (Skamarock et al., 2021). The gas-phase chemistry module included 66 species, nine primary particles (including natural particles such as sea salt), and 138 chemical reactions and was based on the scheme by Strand and Hov (1994) (Brandt et al., 2012). The gas-phase species considered in this study included SO2, NO2, CH4, and C2H6. PM2.5 was formed by BC, OC, sea salt, ammonium (), nitrate (), sulfate (), and secondary organic aerosols (SOAs), among others (Frohn et al., 2022). Biogenic volatile organic compounds (BVOCs), such as isoprene, contributed to the formation of SOA (Zare et al., 2012). Further details on the configuration of the chemical scheme and the list of chemical reactions are in the literature (Zare et al., 2012; Brandt et al., 2012; Collin, 2020; Frohn et al., 2022). The SOAs were calculated using the volatility basis set (see details in Im et al., 2019). In addition to the anthropogenic emissions, DEHM also includes emissions from biogenic emissions, such as vegetation, sea salt, lightning, and soil. The current version of the DEHM does not include windblown resuspended dust emissions, road dust, or aerosol–radiation or radiation–cloud interactions. The time resolution of the DEHM output is 1 h.
In the current study, the DEHM used anthropogenic emissions from the Emissions Database for Global Atmospheric Research – Hemispheric Transport of Air Pollution (EDGAR-HTAP) and Eclipse V6. The biomass burning emissions are obtained from the Global Fire Assimilation System (GFAS) from ECMWF (Kaiser et al., 2012), which has a horizontal resolution of 0.1° × 0.1° on a daily time basis. Natural emissions for DEHM are based on the Global Emissions InitiAtive (GEIA, Zare et al., 2012; Frost et al., 2013) with monthly inventories for emissions of nitrogen oxides from soil and lightning and annual inventories for emissions of ammonia from natural sources. The production of sea salt (Soares et al., 2016) and biogenic volatile organic compounds (Zare et al., 2014) is calculated online in the model as a function of meteorological parameters like wind speed and temperature (Frohn et al., 2022).
2.4 Sensitivity scenarios
2.4.1 Relative contributions from meteorological conditions and emissions
Table 1 summarizes the scenarios for assessing the relative contributions of meteorological conditions and emissions to PM2.5 and OP variability in 2014. ERA5 (Hersbach et al., 2020; ERA, 2023) is a global reanalysis dataset that is based on the assimilation of historical observations and model data. Studies (Thomas et al., 2021; Xu et al., 2022) have demonstrated that ERA5 performs well relative to MERRA, NCEP, and ERA-Interim, with higher temporal and spatial resolutions. Therefore, scenarios C1 and C2 used ERA5 as input to WRF. Considering the robust representation of aerosol effective radiative forcing and good predictive capabilities for key surface variables in CESM (2023) (García-Martínez et al., 2020; Richter et al., 2022), scenario C3 utilized meteorological data based on CESM version 2.1.1 (Danabasoglu et al., 2020) as input for WRF. Scenarios C2 and C3 employed the Eclipse V6 emissions inventory, while scenario C1 used the EDGAR-HTAP inventory.
Table 1Emission inventory and meteorological datasets in three simulation scenarios.
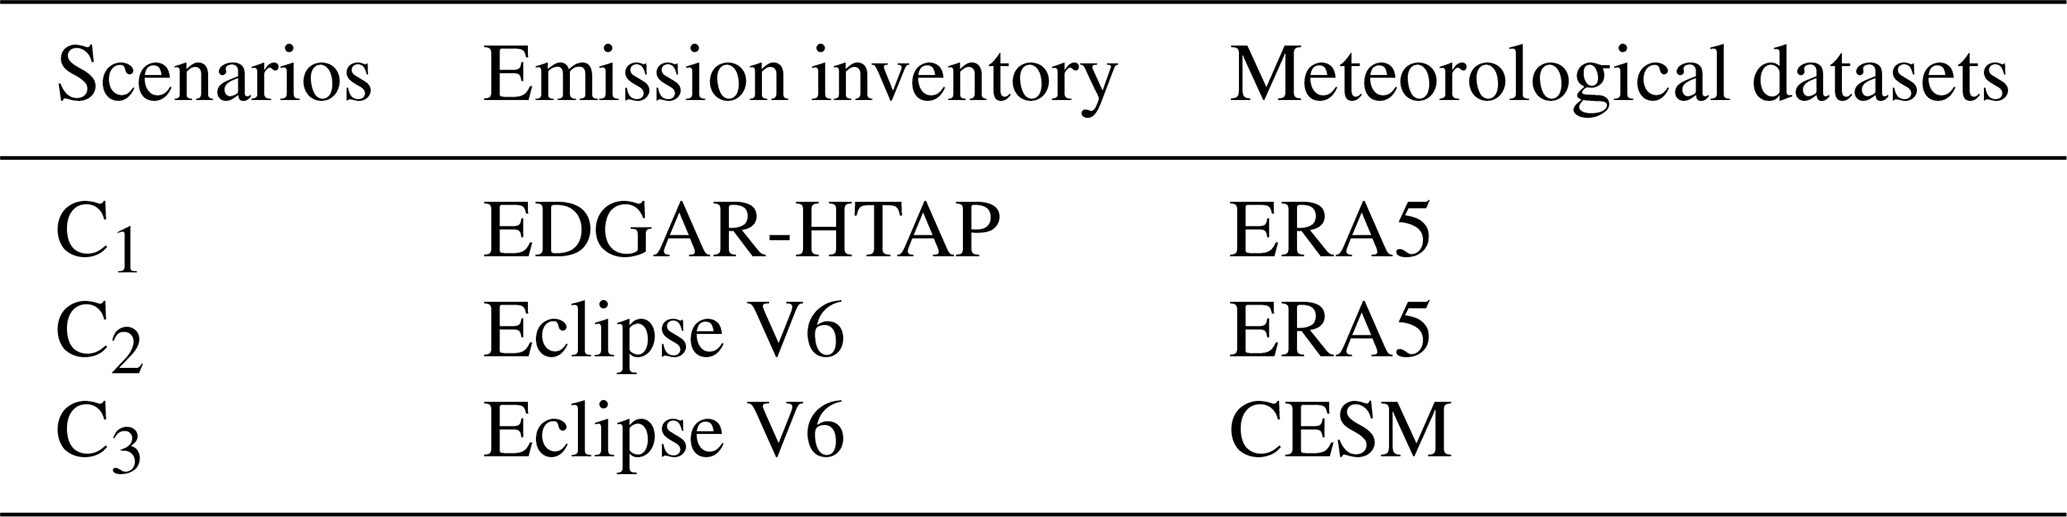
The ECLIPSE project by the International Institute for Applied Systems Analysis (IIASA) aims to generate a global gridded anthropogenic emission inventory for various emission scenarios. The Greenhouse Gas – Air Pollution Interactions and Synergies (GAINS) model has been employed to estimate emissions of air pollutants and GHGs (such as SO2, NOx, NH3, NMVOC, BC, OC, OM, PM2.5, PM10, CO, and CH4) using source characteristics and emission factors at a resolution of 0.5° × 0.5° latitude–longitude (Upadhyay et al., 2020; Eclipse, 2020). The following sectors are available: energy, industry, solvent use, transport, domestic combustion, agriculture, open burning of agricultural waste, and waste treatment. A number of scenarios are provided for which the key economic assumptions and energy use originate from the IEA World Energy Outlook (IEA, 2011), the POLES model, or Energy Technology Perspectives (IEA, 2012) for the period 2010–2050, while statistical data for the period 1990–2010 came from IEA. For agriculture the FAO databases and long-term global projections were used (Alexandratos and Bruinsma, 2012). It is noteworthy that this inventory considers China's 13th 5-year plan. The EDGAR-HTAP (Joint et al., 2011; Crippa et al., 2023) emission inventory endeavors to employ official or scientific inventories within a national or regional scale, with a spatial resolution of 0.1° × 0.1°. EDGAR-HTAP comprehensively accounts for all major emission sectors, including residential, transportation, industrial, energy, and agricultural sectors. EDGAR offers independent emission estimates for various pollutants, including CO, CH4, SO2, NOx, NMVOCs, NH3, PM2.5, PM10, BC, and OC. These estimates follow a standardized methodology provided by the Intergovernmental Panel on Climate Change (IPCC). The data from EDGAR allow for comparisons with emission reports published by European Member States or Parties under the United Nations Framework Convention on Climate Change (UNFCCC) (Kumar et al., 2023).
Equations (2)–(5) were used to quantitatively evaluate the contributions of meteorological conditions and emission inventories.
C1, C2, and C3 represent the PM2.5 concentrations and OP from scenarios C1, C2, and C3, respectively. Con(Met) represents the impact of changing meteorological datasets on changes in PM2.5 and OP. Con(Emi) represents the impact of changing emission inventory on changes in PM2.5 and OP. NCon(Met) and NCon(Emi) represent the normalized contributions of meteorology and emissions. In the equations, the abs function represents the absolute value of the quantity in parentheses.
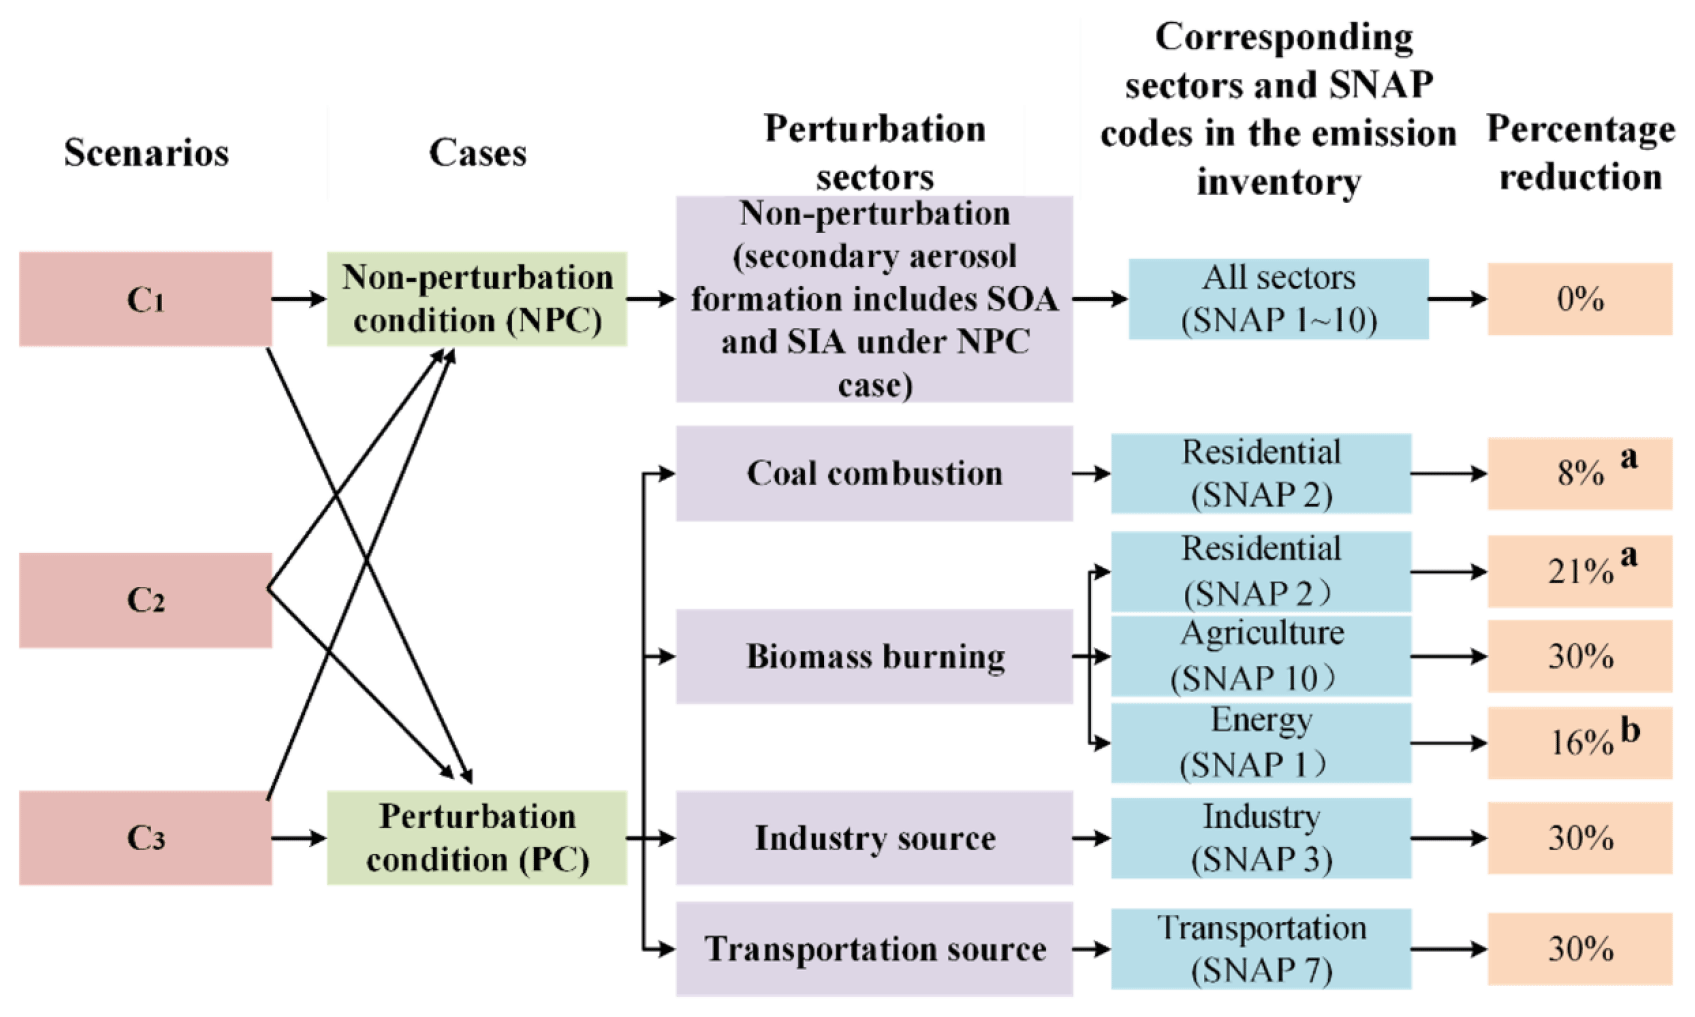
Figure 2Emission reduction design for perturbed emissions (a) obtained from Yun et al. (2020) and (b) obtained from additional literature (Zheng et al., 2018; Tong et al., 2018; Yun et al., 2020; MEE, 2020; Wang et al., 2020; Tang et al., 2020; Lin et al., 2021; Chen et al., 2022).
2.4.2 Relative contributions from individual emissions
As mentioned above, OP's main source contributions include five categories, i.e., coal combustion, biomass burning, secondary aerosol formation, industrial sources, and transportation sources (Eq. 1). We conducted perturbation experiments targeting these five sources to quantitatively assess their contributions to PM2.5 concentrations and OP (Fig. 2). These experiments were carried out within the three scenarios described in Sect. 2.4.1, and we performed a total of 15 runs. Under the non-perturbation condition (referred to as the NPC case), all aforementioned emission sources were considered. Under the perturbation condition (referred to as the PC case), reduction designs were implemented for emissions from coal combustion, biomass burning, industrial sources, and transportation sources. The emissions of both primary aerosols and trace gases from each individual source are reduced by 30 %. The choice of 30 % was motivated by the consideration that the perturbation would be large enough to produce a sizable impact (i.e., more than numerical noise) even at long distances while being small enough to be in the near-linear atmospheric chemistry regime (Galmarini et al., 2017; Im et al., 2019). Notably, the transportation sector in the DEHM only considers tailpipe emissions, excluding non-exhaust emissions from vehicles like road dust, brake dust, and tire wear. The contribution of tailpipe emissions in the transportation sector to OP is estimated by incorporating simulated values of primary PM2.5 concentrations from tailpipe emissions into Eq. (1). In this study, the transportation sector refers to road transport, excluding other transportation sources like ships and airplanes. Additionally, to estimate the PM2.5 concentrations and OP from coal and biomass burning, it is necessary to obtain the percentage contributions of PM2.5 emissions from coal combustion for residential heating; domestic biomass burning for cooking and heating to PM2.5 emissions of the residential sector, respectively; and the percentage contributions of PM2.5 emissions from biomass burning in power plants to the total PM2.5 emissions from the power sector. The percentage contributions of each anthropogenic source can be estimated using Eqs. (6)–(8).
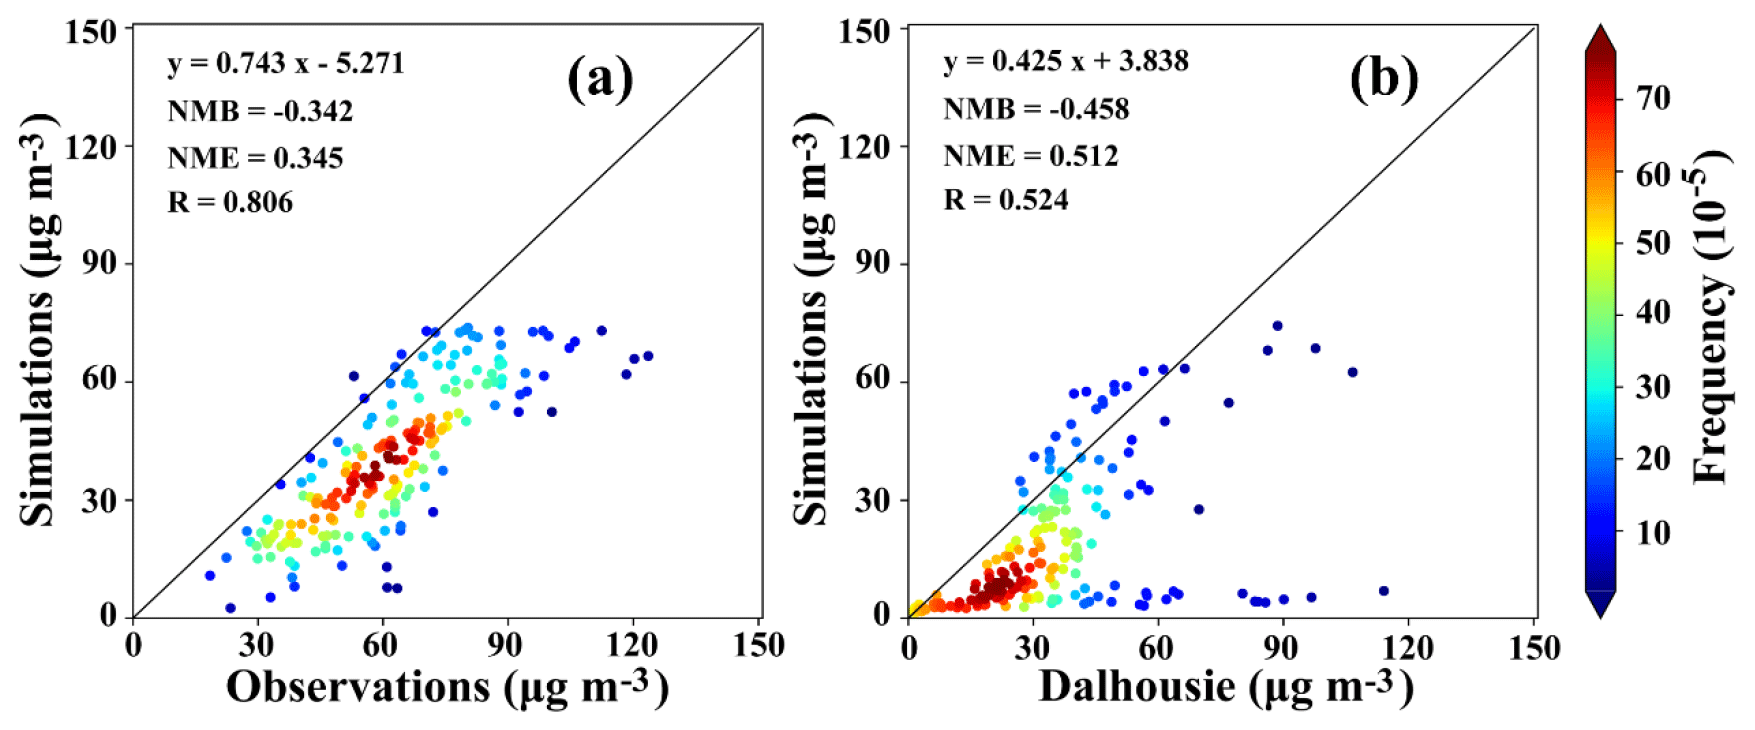
Figure 3Density scatterplots of model performance and validation for China in scenario C1 based on (a) annual mean PM2.5 observations from MEE and (b) annual mean PM2.5 derived from the Dalhousie dataset in 2014.
PCre_j denotes the percentage contribution of PM2.5 emissions from the residential subsector j (including coal cooking, coal heating, biomass cooking, biomass heating, clean energy, and nonresidential) to the total PM2.5 emissions from the residential sector. Ere_j represents the PM2.5 emissions from the residential subsector j, while Ere represents the total PM2.5 emissions from the residential sector. The values of Ere_j and Ere are obtained from the literature (Yun et al., 2020). After calculation, the values for , , , and are determined to be 21 %, 27 %, 33 %, and 19 %, respectively. Epp_bi refers to the PM2.5 emissions from biomass power plants, EF refers to the PM2.5 emission factor of biomass power plants, and FQ refers to the fuel quantity. PCpp_bi_cf refers to the percentage contribution of PM2.5 emissions from biomass power plants and coal-fired power plants to the PM2.5 emissions of the power plants. To accelerate carbon reduction in coal-fired power generation, the Chinese government has issued a series of policies supporting and encouraging the coupling of coal and biomass for power generation (Mao, 2017). This undoubtedly adds complexity to distinguishing between PM2.5 emissions from coal combustion and biomass fuel. Furthermore, in the energy strategy where biomass serves as a clean alternative to fossil fuels, the scale of biomass utilization and the biomass power generation industry in China continue to expand (Lin et al., 2021). Considering the aforementioned reasons, we include PM2.5 emissions from coal-fired power plants in our analysis. Epp_cf refers to the PM2.5 emissions from coal-fired power plants, and Epp refers to the PM2.5 emissions from power plants. EF, FQ, Epp_cf, and Epp are obtained from the literature (Zheng et al., 2018; Tong et al., 2018; Yun et al., 2020; MEE, 2020; Wang et al., 2020; Tang et al., 2020; Lin et al., 2021; Chen et al., 2022). After calculation, PCpp_bi_cf is determined to be 54 %. Previous studies (Hodan and Barnard, 2004; Chen et al., 2018; Zhang et al., 2022) showed that in China, the proportion of secondary and primary PM2.5 mass to the total PM2.5 mass is close, so we assume that they account for 50 %, respectively. Figure 2 shows the emission reduction design for perturbed emissions.
Furthermore, the PM2.5 concentrations for each sector are calculated using Eqs. (9)–(11).
Here, i refers to the type of pollutants, i.e., total PM2.5, SOA, SIA, and primary PM2.5. CNPC,i represents concentrations of the pollutant i in the NPC case. CPC,i represents concentrations of the pollutant i in the PC case. CP,i represents concentrations of the pollutant i by the specific emission sector P, which is perturbed (perturbation sectors P include coal combustion, biomass burning, industry, and traffic sources). represents concentrations of primary PM2.5 by the perturbation sector P. Csecondary represents PM2.5 concentrations from secondary aerosol formation.
2.5 Probability density function
Taking into account the substantial spatial heterogeneity of PM2.5 concentrations and OP, we employ PDF to characterize the statistical distribution characteristics of PM2.5 concentrations and OP across China. This offers a more generalized and robust probability for criteria limits. In this study, all three functional types (lognormal, exponential, and gamma) were tested for annual average PM2.5 concentrations and OP at the monitoring stations. To determine the representative distributions for the datasets, we further performed goodness-of-fit tests such as the sum of squared error (SSE) and the Kolmogorov–Smirnov (K-S) test (de Melo et al., 2000) using the fitter package in Python.
Table 2The results of the annual mean simulated minus annual mean observed values, as well as the results of the annual mean simulated values minus the Dalhousie dataset for China in 2014 under scenario C1.
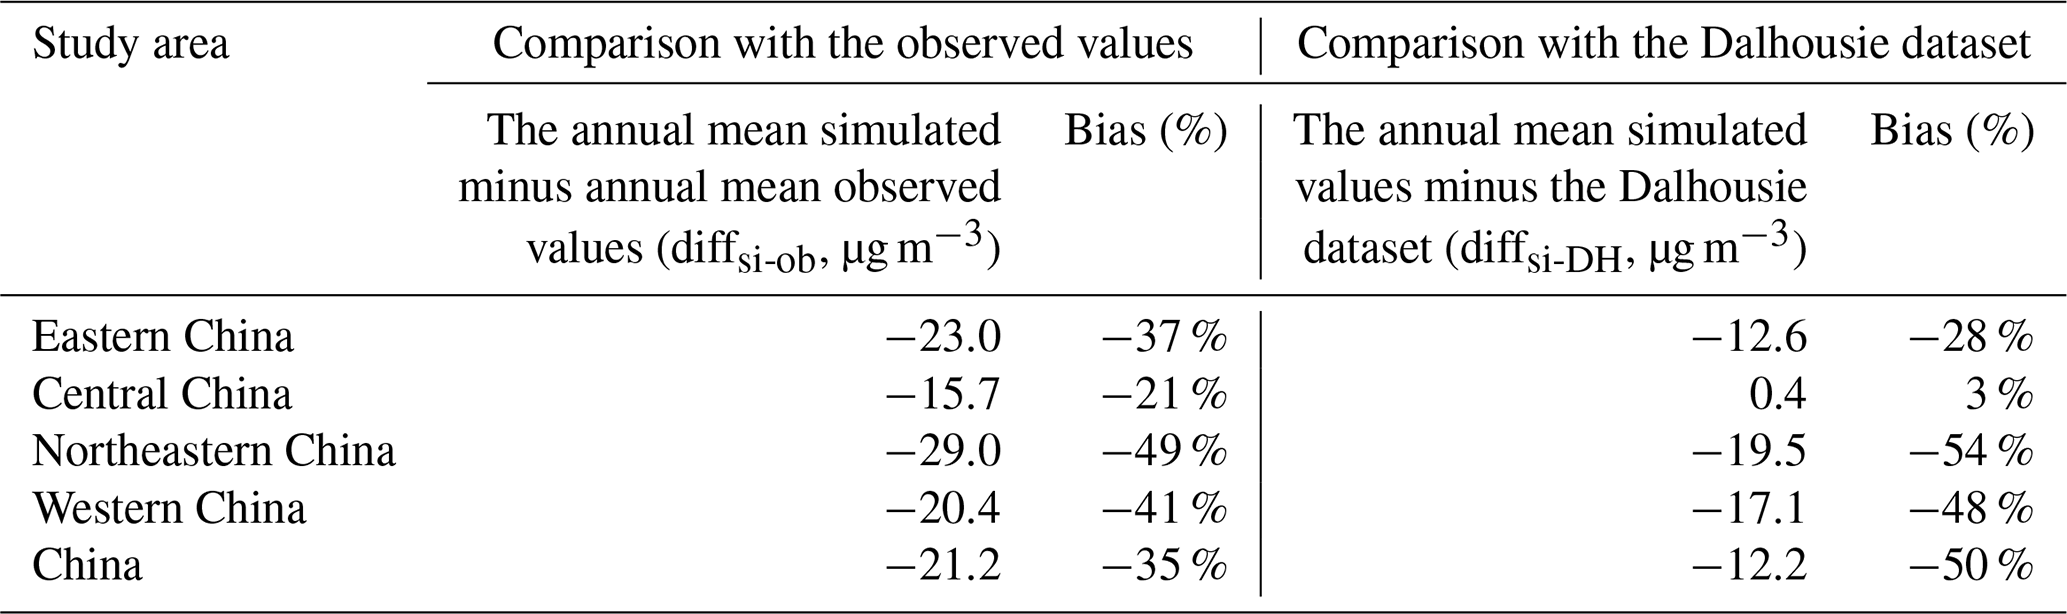
Note: The eastern region of China comprises Beijing, Tianjin, Hebei, Shanghai, Jiangsu, Zhejiang, Fujian, Shandong, Guangdong, Hainan, Hong Kong, Macao, and Taiwan. It should be noted that the eastern region in this study includes Hong Kong, Macao, and Taiwan. The central region of China comprises Shanxi, Anhui, Jiangxi, Henan, Hubei, and Hunan provinces. The northeastern region of China comprises Liaoning, Jilin, and Heilongjiang provinces. The western region of China consists of 12 provinces (autonomous regions and municipalities): Inner Mongolia, Guangxi, Chongqing, Sichuan, Guizhou, Yunnan, Tibet, Shaanxi, Gansu, Qinghai, Ningxia, and Xinjiang.
3.1 Model evaluation
The hourly observation data were obtained from the Ministry of Ecology and Environment of China (MEE, 2014). The MEE website first released PM2.5 measurement data in January 2013. In accordance with Chinese environmental protection standards, the hourly PM2.5 concentrations are measured using the micro-oscillation balance method and beta absorption method, with an uncertainty of less than 5 µg m−3 (Zeng et al., 2021). The PM2.5 monitoring stations are primarily distributed in urban areas, particularly in major metropolitan areas of China (Zeng et al., 2021). In 2014, the observation stations were mainly concentrated in eastern China, while stations in western China were limited. Therefore, in the present study, we also evaluated with the gridded annual mean global reanalysis Dalhousie surface PM2.5 dataset (van Donkelaar et al., 2021), which combines satellite retrievals of aerosol optical depth, chemical transport modeling, and ground-based measurements. The Dalhousie dataset compensated for the nonuniform distribution spatially of observation stations to comprehensively evaluate the performance of the DEHM. The density scatterplot of model performance and evaluation for China in scenario C1 based on annual mean PM2.5 observations from MEE and PM2.5 derived from the Dalhousie dataset are shown in Fig. 3. Overall, the model performance in terms of correlation coefficient (R) and normalized mean error (NME) calculated based on annual mean observations met the performance criteria suggested by Emery et al. (2017) (NME < 0.5, R > 0.4), and the normalized mean bias (NMB) was also close to the performance criteria suggested by Emery et al. (2017) (NMB < ± 0.3). Compared to the observations, the model performance in terms of R, NME, and NMB calculated based on the Dalhousie dataset was slightly poorer than but still close to the performance criteria suggested by Emery et al. (2017). Additionally, this study evaluated the model performance in scenarios C2 and C3 (Fig. S2 in the Supplement). It was found that under scenarios C2 and C3, the model performance in terms of R and NME, calculated based on both annual mean observations and the Dalhousie dataset, met the performance criteria suggested by Emery et al. (2017). The NMB under scenarios C2 and C3 calculated based on both annual mean observations and the Dalhousie dataset were also close to the performance criteria suggested by Emery et al. (2017). Therefore, the simulated annual mean PM2.5 concentrations in scenarios C1, C2, and C3 are considered reliable.
To verify the spatial accuracy, a comparison of simulated and observed PM2.5 from both MEE and Dalhousie was conducted. Table 2 shows the results of the annual mean simulated minus annual mean observed values (denoted as diffsi-ob), as well as the results of the annual mean simulated values minus the Dalhousie dataset (denoted as diffsi-DH). Table 2 indicates that the majority of regions (central and eastern China) exhibited differences ranging from −18 to 0 µg m−3, which is an underestimation of 37 % compared to the average annual observations. The simulated PM2.5 concentrations in eastern, central, northeastern, and western China were 37 %, 21 %, 49 %, and 41 % lower than the observations, respectively; the simulated values were 28 %, −3 %, 54 %, and 48 % lower than the Dalhousie dataset, respectively. The disparities in model performance across regions may be attributed to uncertainties in the simulation of meteorological fields, coupled with insufficient consideration of species in the reaction processes within the model. Considering the existing literature (Huang et al., 2021; Jia and Zhang, 2021), it is known that bias within approximately 50 % is acceptable. For example, the PM2.5 concentrations in eastern China in 2014 simulated by Jia and Zhang (2021) were overestimated by 48 %. Shi et al. (2021) also reported PM2.5 concentrations being overestimated or underestimated by 40 % compared to observed values. Hence, the simulated bias in this study falls within an acceptable range, meeting the research requirements.
Similarly, the model performance over timescales was also investigated. Density scatterplots and distribution characteristics of monthly average observations and simulations for all monitoring sites in 2014 are depicted in Fig. S1 in the Supplement and Fig. 4, respectively. From Fig. 4, it can be observed that the simulated values closely align with the observed values from April to September. However, in other months, there was a slightly poorer alignment between simulated and observed values. Nonetheless, considering the overall performance throughout the year, as analyzed in conjunction with Fig. S1, it can be deduced that both the correlation R and NME met the performance criteria suggested by Emery et al. (2017) for all months except December. Furthermore, the results in Table 2 indicate that the bias across various regions in DEHM is acceptable. Consequently, on an aggregate level for China, the model demonstrates acceptable performance in simulating monthly average PM2.5 concentrations.
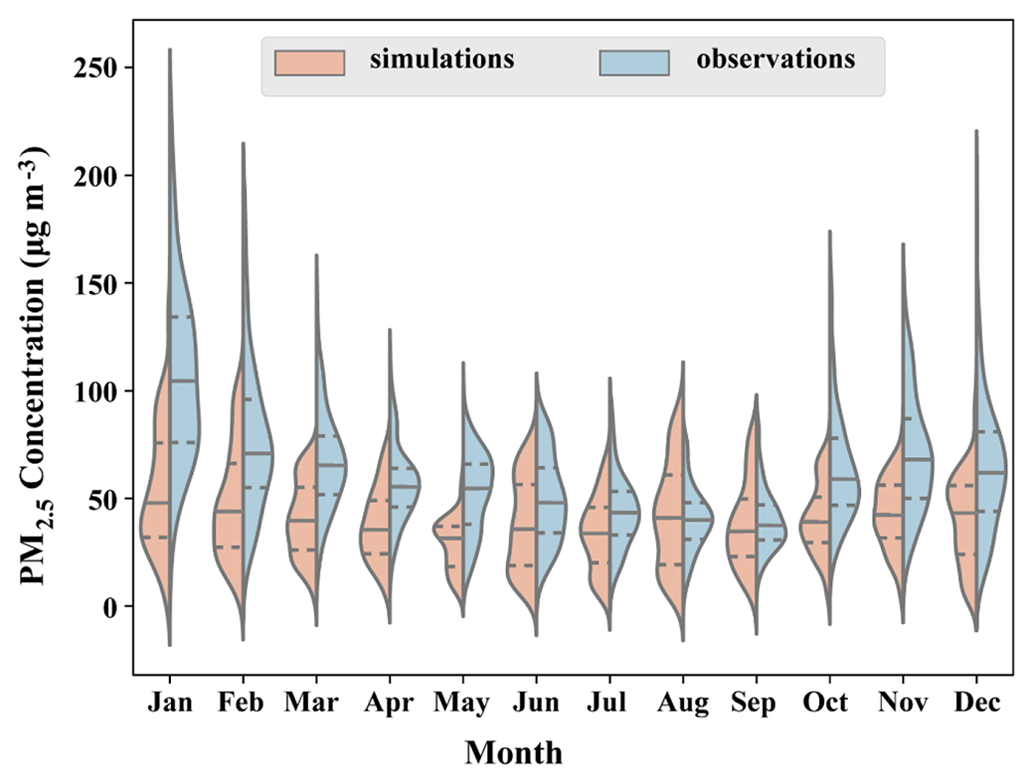
Figure 4Violin plots of the monthly average from MEE observations and simulations averaged over various observation stations for China in 2014 under scenario C1. Red and blue represent the statistical distribution of simulations and observations, respectively. The width of the violin represents the sample size, and the solid black line inside the violin indicates the median. The upper and lower dashed black lines within the violin indicate the upper quartile (the 75th percentile) and lower quartile (the 25th percentile), respectively.
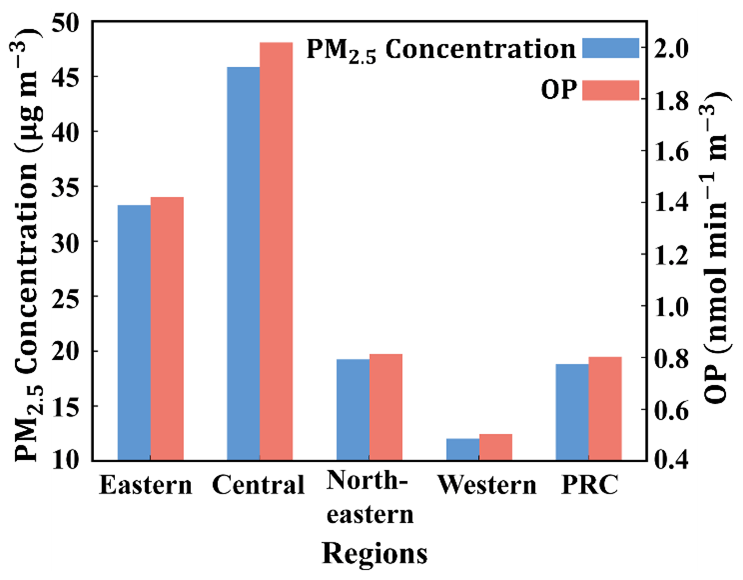
Figure 5Annual mean PM2.5 concentrations and annual mean OP in different regions of China in 2014 under scenario C1.
3.2 Spatial distribution characteristics of PM2.5 and OP
To learn about the spatial distributions of PM2.5 concentrations and OP, we quantified the average annual PM2.5 concentrations and OP across different regions of China (Fig. 5). High PM2.5 concentrations and high OP are mainly located in central and eastern urban clusters. Low PM2.5 concentrations and low OP are mainly distributed in northeastern and western China. The results in Fig. 5 indicate that the annual average PM2.5 concentrations and OP in eastern, central, northeastern, and western China are 33 µg m−3 and 1.4 , 46 µg m−3 and 2.0 , 19 µg m−3 and 0.8 , and 12 µg m−3 and 0.5 , respectively.
Due to differences in city types, pollutant emission intensities, and pollutant chemical components in different regions, there is significant spatial heterogeneity in PM2.5 concentrations and therefore in OP (see Sect. 3.4 and Fig. 9 for details). Due to high population density, socioeconomic activities, and winter heating needs, large quantities of anthropogenic emissions, especially from industry, transportation, coal burning, and biomass burning, exacerbate PM2.5 and redox-active component pollution.
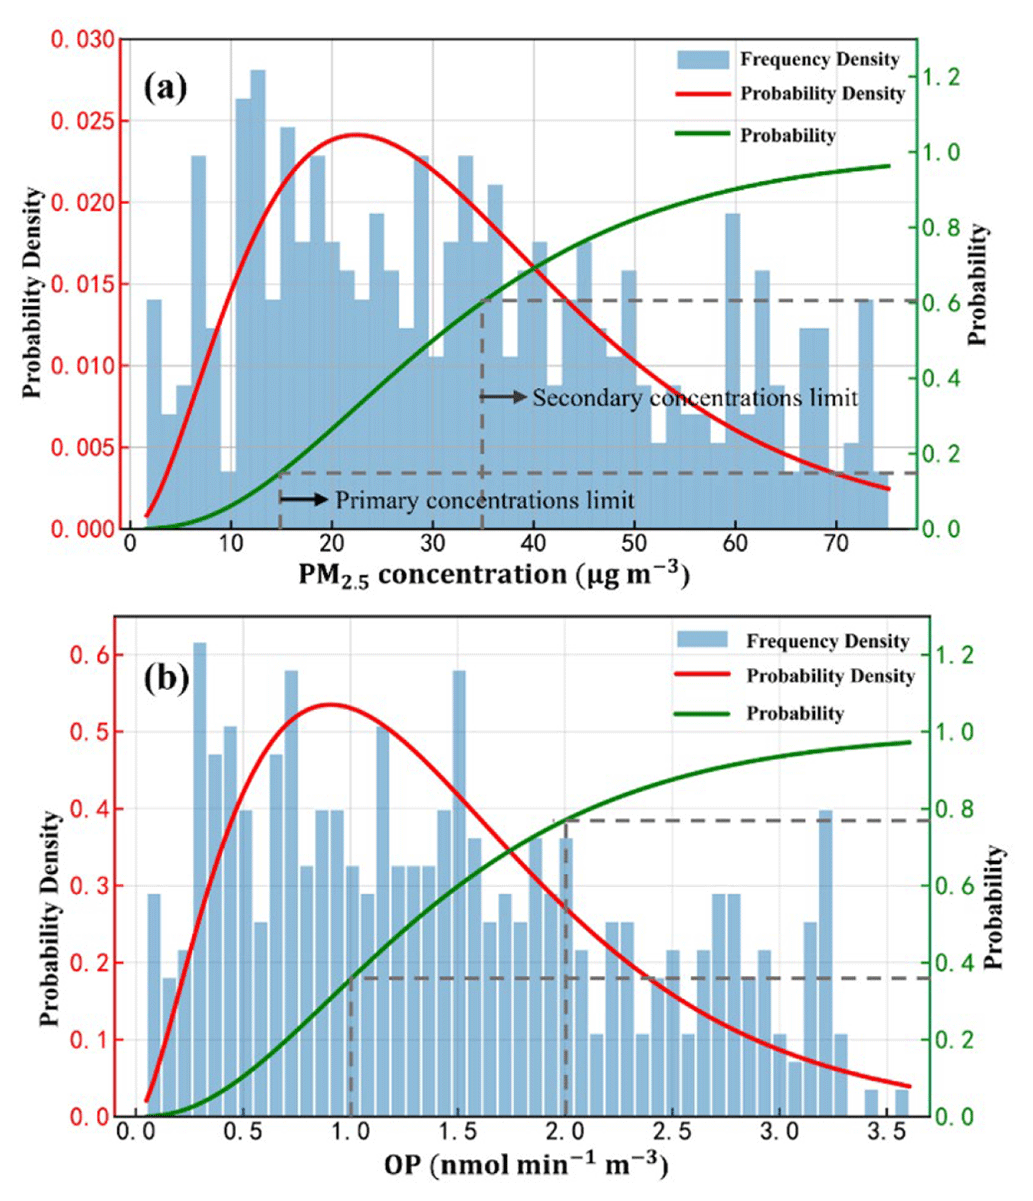
Figure 6Probability distribution of (a) annual mean PM2.5 concentrations and (b) annual mean OP for China in 2014 under scenario C1.
Table 3Goodness-of-fit test results for China in 2014 under scenario C1.
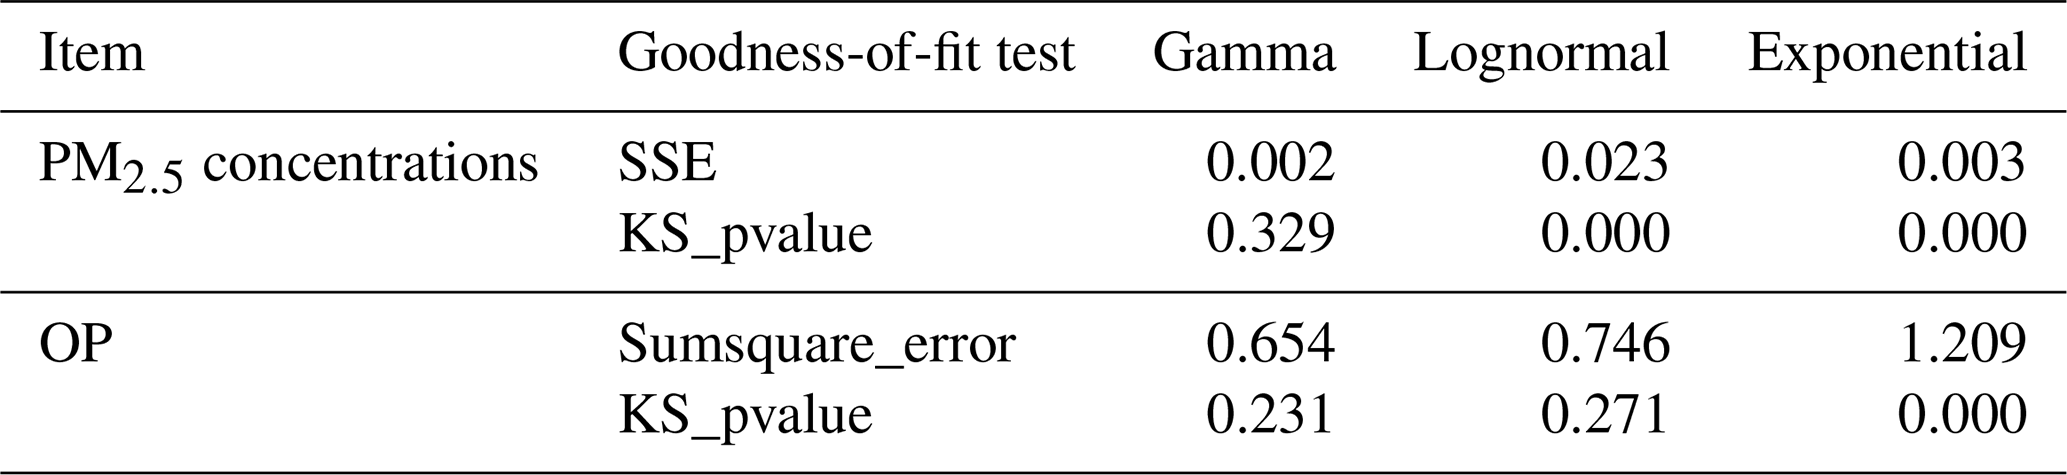
Note: SSE is the sum of squared error; KS_pvalue is the P value of the Kolmogorov–Smirnov test.
To quantitatively analyze the regional distribution characteristics of PM2.5 concentrations and OP in China, we determined the distribution function that is suitable for a specific dataset (Table 3), investigated the frequency histogram (FH) of PM2.5 concentrations and OP, fitted the PDF, and then obtained the cumulative distribution function (CDF) by integrating PDF, as shown in Fig. 6. It was found that the gamma distribution performed the best in fitting PM2.5 concentrations and OP from Table 3. Considering the test results, the gamma distribution was used to explore the spatial distribution characteristics of PM2.5 concentrations and OP. Figure 6a depicts the probability distribution of PM2.5 concentrations, while Fig. 6b depicts the probability distribution of OP. The wide distribution interval indicates that both PM2.5 concentrations and OP have a similar and large spatial heterogeneity. According to the FH, the highest frequency density of PM2.5 concentrations ranges from 10.5 to 12.9 µg m−3; the maximum frequency density of OP ranges from 0.26 to 0.34 . This reflects the overall pollution levels of PM2.5 and OP in the Chinese region. Taking into account the annual average PM2.5 concentration limits set out in China's ambient air quality standard (AAQS, 2012), we focused on primary (15 µg m−3) and secondary concentration (35 µg m−3) limits. The PDF and CDF results showed that 85 % of the total area was above the primary concentration limit and 40 % was above the secondary concentration limit. In addition, 36 % of regions in China have an OP below 1.00 , 41 % have an OP between 1.00 and 2.00 , and 23 % have an OP above 2.00 .
Table 4The annual mean PM2.5 concentrations (in µg m−3) and annual mean OP (in nmol min−1 m−3) in different regions of China in 2014 under different scenarios.
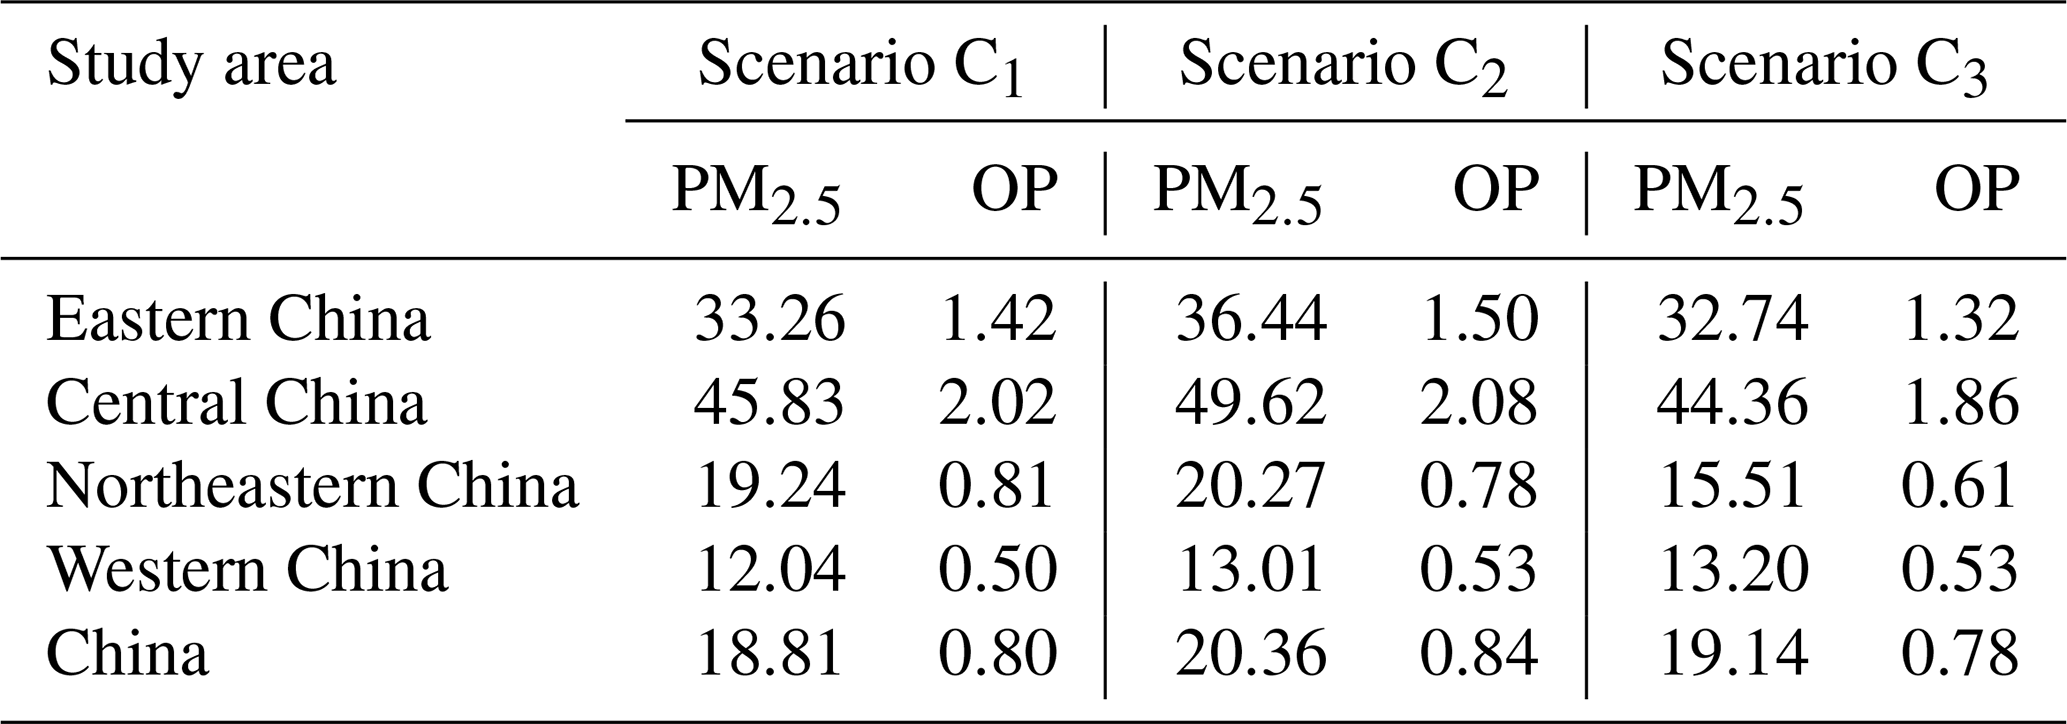
Note: the meteorological datasets (emission inventories) employed for scenarios C1, C2, and C3 are ERA5 (EDGAR-HTAP), ERA5 (Eclipse V6), and CESM (Eclipse V6), respectively.
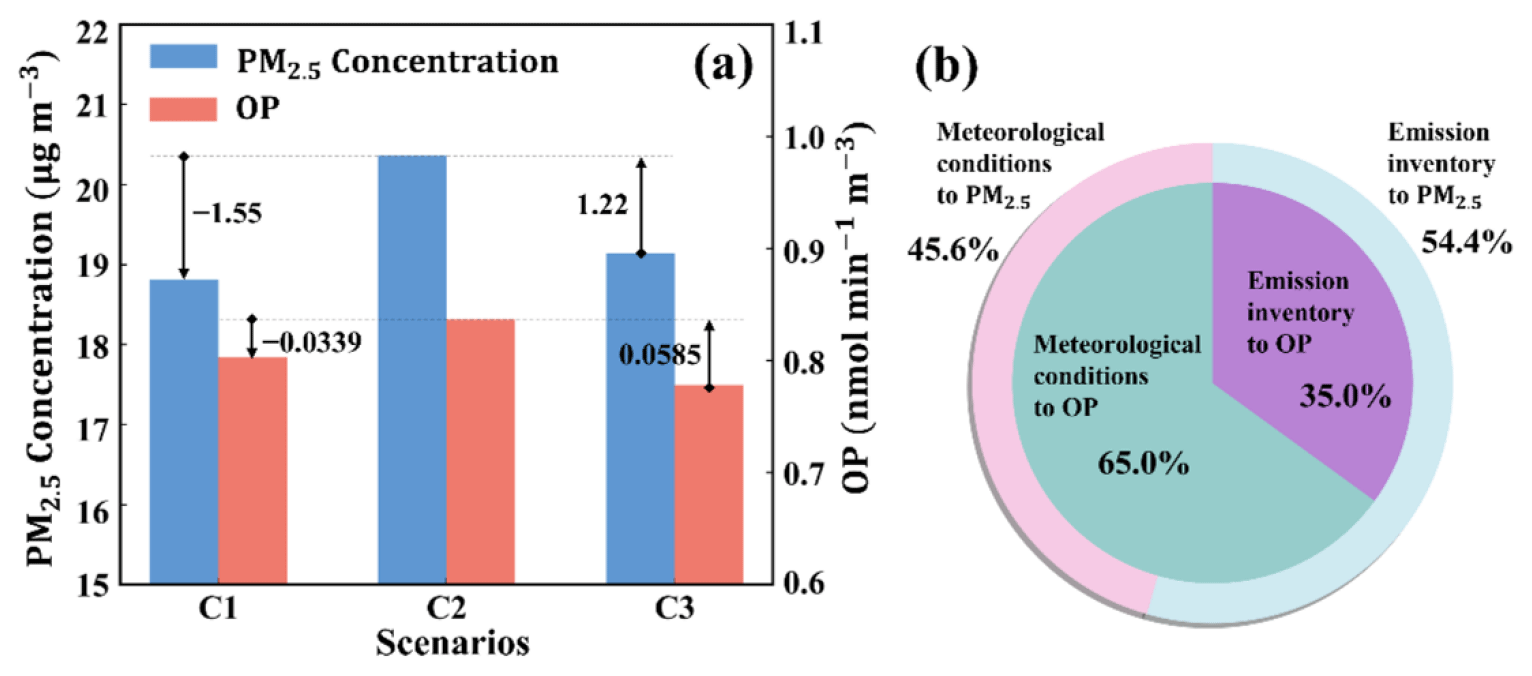
Figure 7(a) Average annual PM2.5 concentrations and average annual OP for China in 2014 under different scenarios. (b) The relative contribution of meteorological conditions and emission inventories to average annual PM2.5 and average annual OP for China in 2014, with the outer circle representing PM2.5 and the inner circle representing OP. The meteorological datasets (emission inventories) employed for scenarios C1, C2, and C3 are ERA5 (EDGAR-HTAP), ERA5 (Eclipse V6), and CESM (Eclipse V6), respectively.
3.3 Contributions of meteorological conditions and emission inventories to the variations in PM2.5 and OP
To determine the sensitivity of PM2.5 pollution and oxidation potential (OP) to meteorological conditions (emission inventories), this study compared scenarios C2 and C3 (C1) and investigated the impacts and contributions from ERA5 and CESM (HTAP and Eclipse V6 emission inventories) regarding PM2.5 and OP. Table 4 illustrates the PM2.5 concentrations and OP in different regions of China under scenarios C1, C2, and C3. Figure 7a presents the annual average PM2.5 concentrations and OP under different scenarios, and Fig. 7b shows the relative contributions of meteorological conditions and emission inventories. From Table 4 and Fig. 7, it can be observed that, compared to scenario C2, PM2.5 concentrations and OP are lower in the western region under scenario C1, primarily due to changes in emission inventories attributed to the inclusion or exclusion of specific local sources during the compilation process. Compared to scenario C3, PM2.5 concentrations are lower in the western region and higher in some eastern areas under scenario C2, primarily attributed to meteorological contributions. For the entire China region, the transition in emission inventories from Eclipse V6 to HTAP resulted in an overall decrease in PM2.5 concentrations of 1.55 µg m−3, which is approximately 7.61 %, and a decrease in OP of 0.0339 , which is approximately 4.05 %. The shift in meteorological data from CESM to ERA5 led to an increase in PM2.5 concentrations of 1.22 µg m−3, which is approximately 6.4 %, and an increase in OP of 0.0585 , which is approximately 7.5 %. According to the normalization process using Eqs. (4) and (5), meteorological conditions contributed approximately 45.6 % to the variations in PM2.5 and approximately 65.0 % to the variations in OP. Meanwhile, emission inventories contributed approximately 54.4 % to the variations in PM2.5 and approximately 35.0 % to the variations in OP. Our findings highlight the significance of the quality of model input data, including emission inventories and meteorological data, for model performance.
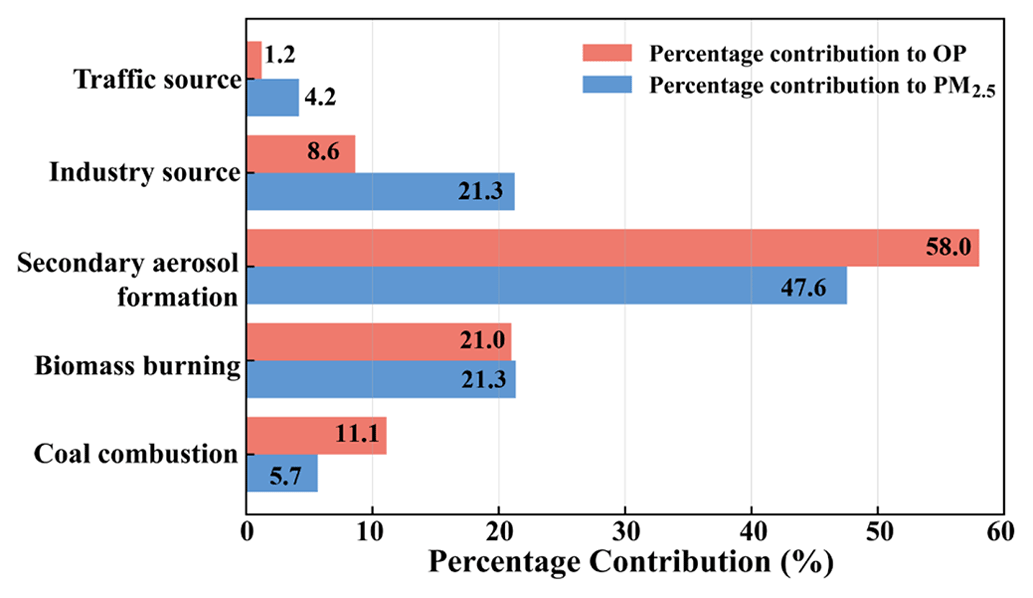
Figure 8Percentage contribution of different anthropogenic sources (coal combustion for residential heating, biomass burning, secondary aerosol formation, industry, and traffic) to total PM2.5 concentrations and OP for China in 2014 under scenario C1.
3.4 Contribution of anthropogenic emission sources to PM2.5 and OP
To determine the impact of anthropogenic emissions on PM2.5 and OP, we quantified their percent contribution (Fig. 8). Secondary aerosol formation, biomass burning, industrial, coal combustion for residential heating, and transportation sources contributed 48 %, 21 %, 21 %, 6 %, and 4 % to PM2.5, respectively. Secondary aerosol formation, biomass burning, coal combustion for residential heating, industrial sources, and transportation sources contributed 58 %, 21 %, 11 %, 9 %, and 1 % to OP, respectively. This means that secondary aerosol formation and biomass burning are the main sources of PM2.5 and OP.
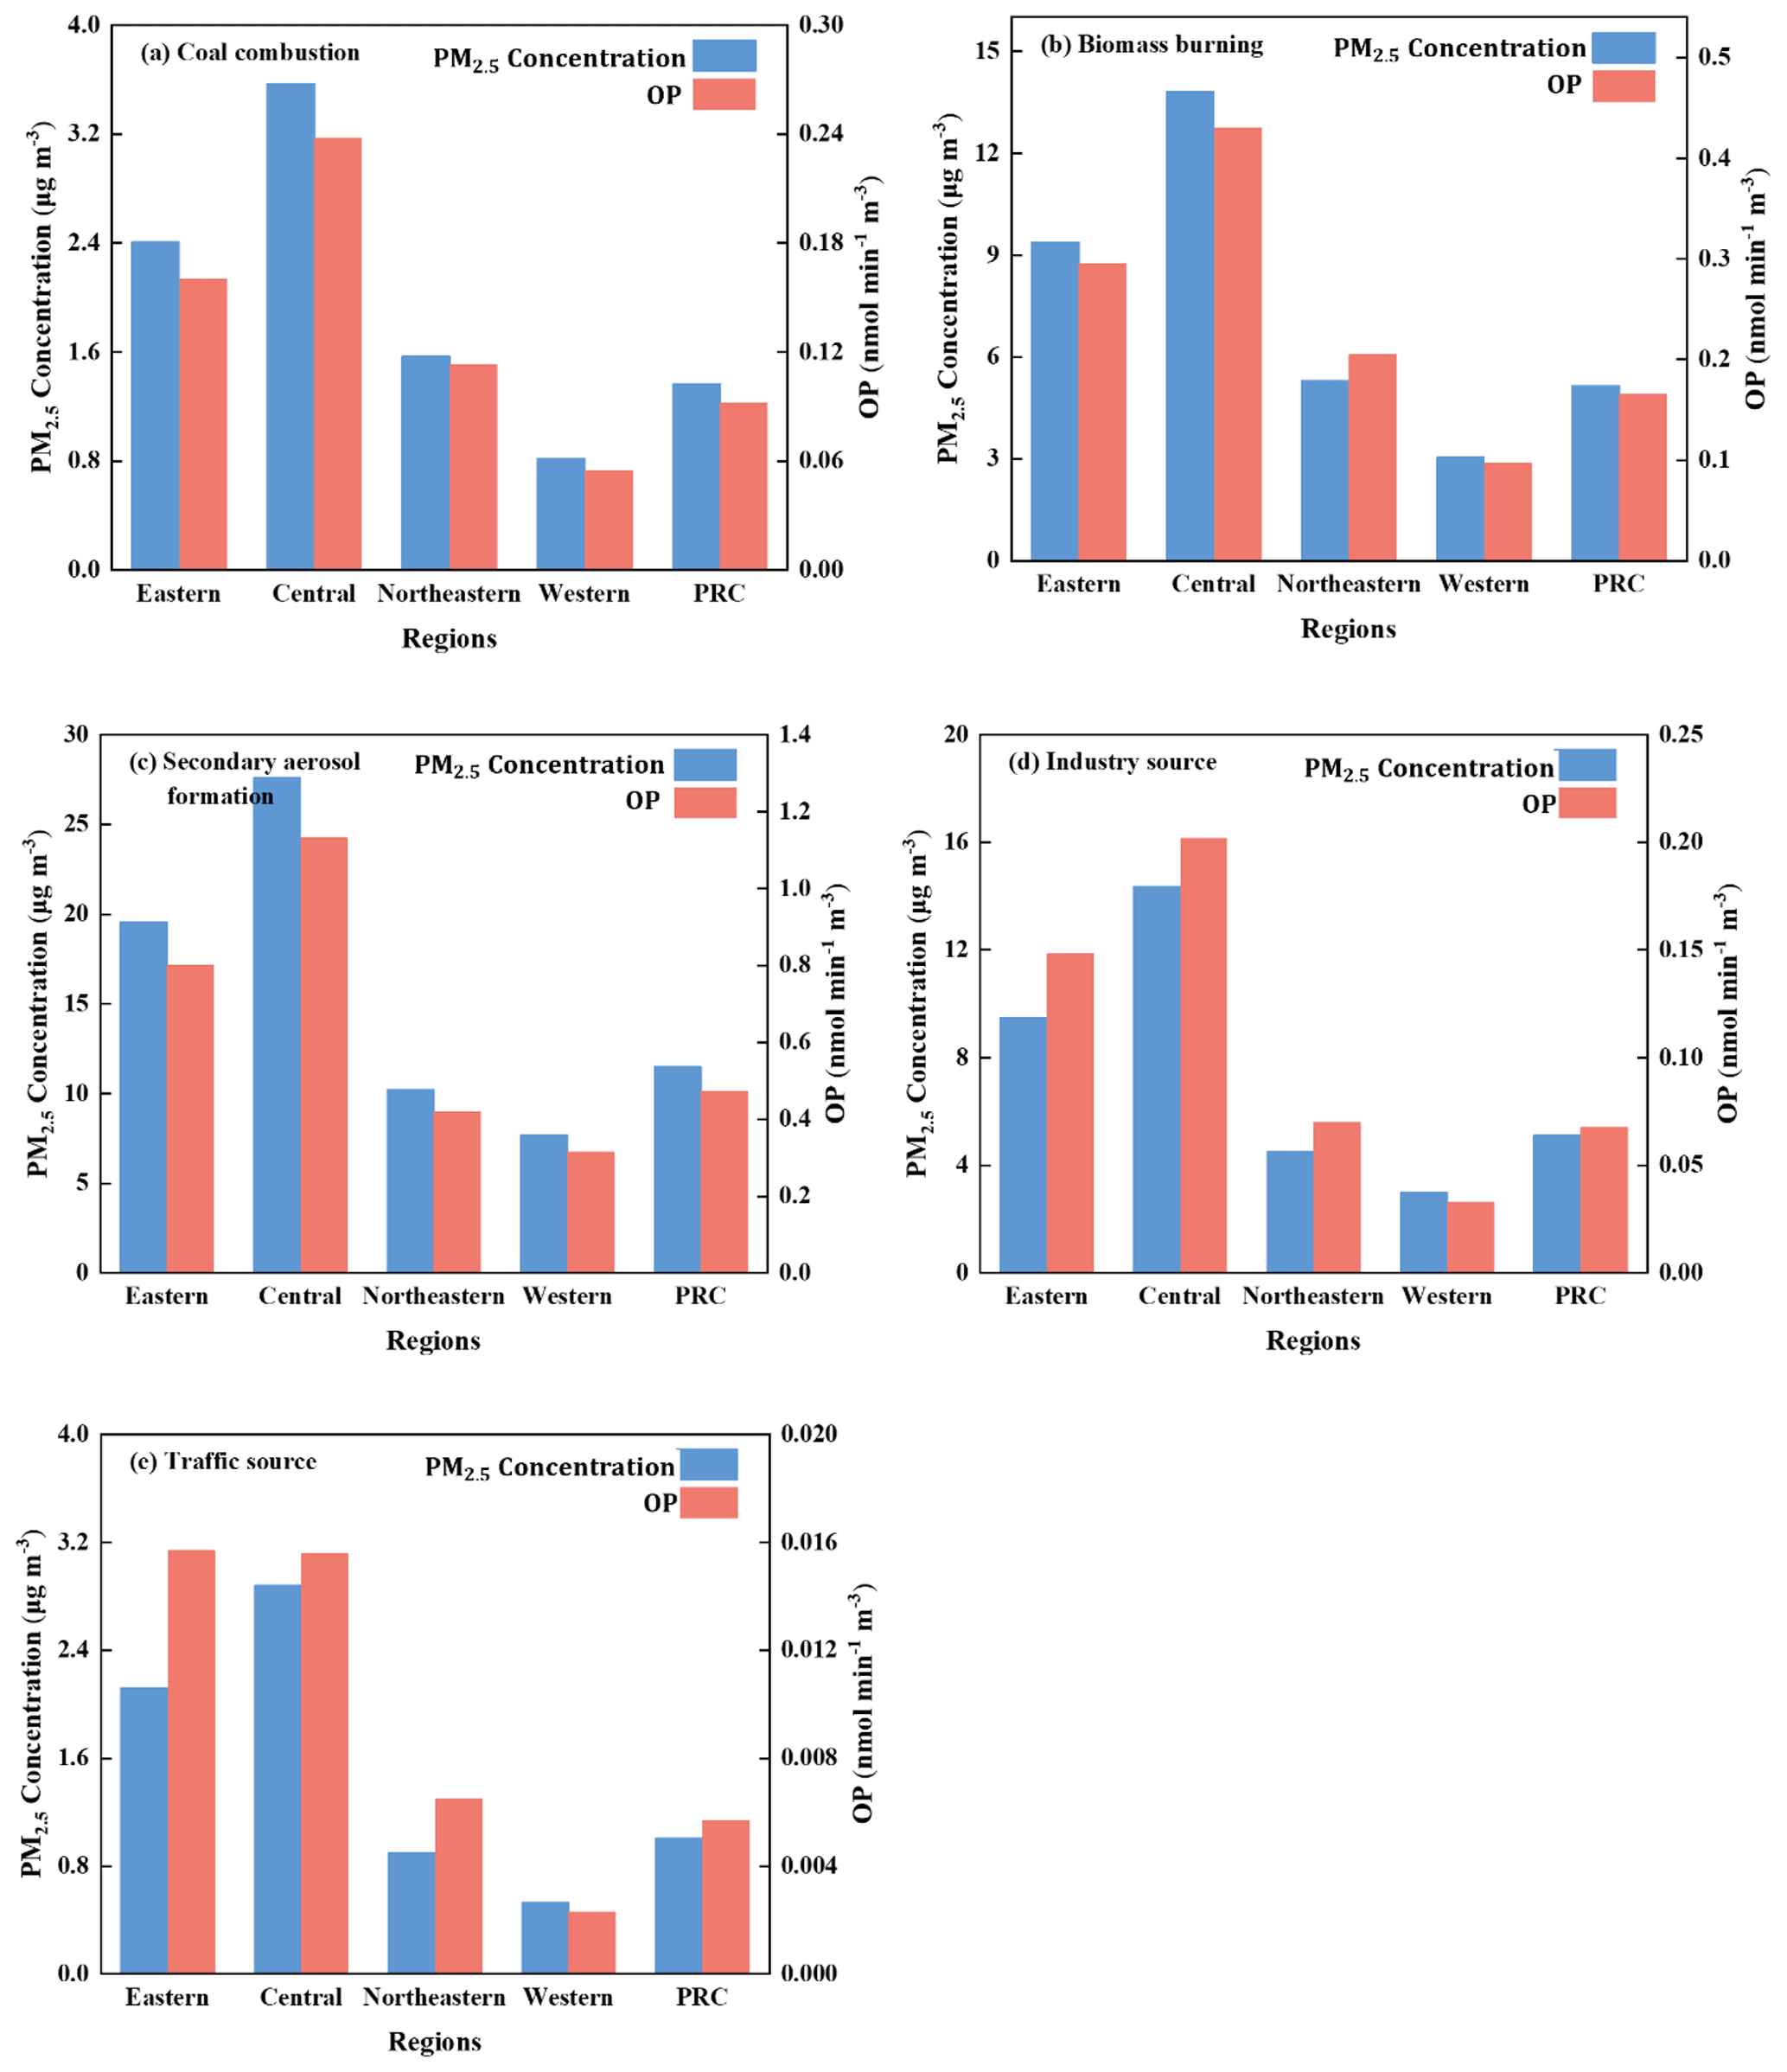
Figure 9The annual mean PM2.5 concentrations and annual mean OP from different anthropogenic sources in different regions of China in 2014 under scenario C1.
Thus, we explored the spatial distribution characteristics of PM2.5 and OP from different anthropogenic sources to reveal the spatial contributions of PM2.5 concentrations and OP, as shown in Fig. 9. It was observed that the spatial distribution features of PM2.5 concentrations and OP from each emission source are similar to those in Fig. 5, and they all adhere to the principle that the eastern region is higher than the western.
It can be seen from Fig. 9 that the main reason that secondary aerosol formation is the main anthropogenic source of both PM2.5 concentrations and OP in China is due to the higher pollution levels, more contributions to mass, and toxicity in the central and eastern regions. A relevant study (Molina et al., 2023) has highlighted the significant contribution of secondary aerosol formation to particle mass and intrinsic OP.
Chinese crops (especially corn straw), power plants mainly being concentrated in the central and eastern regions as well as the northeast and part of the western region, and the bigger intrinsic OP (Eq. 1) result in biomass burning becoming the second contribution.
In this study, coal combustion refers to coal heating from the residential sector. Coal burning increases secondary inorganic and organic aerosols in the air (Liu et al., 2018), which leads to stronger oxidative toxicity. Thus, due to greater heating demand in locations with a high population density and chilly winters (e.g., the northern part of central and eastern China), PM2.5 concentrations and OP linked to coal burning are higher.
Industrial emissions are mainly derived from specific industrial processes in iron and steel, metallurgical production plants for non-ferrous metals (e.g., titanium and molybdenum), and so on. This is one main source for metals. Due to the correlation between these transition metals and OP (Fang et al., 2017; Liu et al., 2018), China's four industrial zones (Liaozhong-South Heavy Industry Base, Beijing–Tianjin–Tangshan Industrial Base, Shanghai–Nanjing–Hangzhou Industrial Base, and Pearl River Delta Light Industry Base) are important contributors to PM2.5 and OP emissions from industrial sources.
The transportation sector in the DEHM only considers tailpipe emissions, excluding non-exhaust emissions from vehicles like road dust, brake dust, and tire wear, which is a main reason that the traffic sources exhibit the lowest contribution to PM2.5 concentrations and OP. Moreover, it can be observed from Fig. 9 that the contribution of this sector is mainly concentrated in the central and eastern regions, which is mainly due to the high transportation emissions in a small number of regions, such as Henan, Hebei, and Shandong. This is valid for the top three provinces in terms of vehicle particulate matter and nitrogen oxide emissions in 2014 according to the China Annual Vehicle Pollution Prevention and Control Report (MEE, 2015).
3.5 Uncertainty of OP estimates
OP is considered an important indicator of PM2.5 toxicity and is associated with adverse health effects. Linking the predicted health effects of aerosols to OP may be more relevant than considering PM2.5 mass alone (Alwadei et al., 2020). However, previous studies of OP in China have mainly focused on local areas, and OP and its sources are very different in space and time (Wen et al., 2023), which makes health research on OP challenging. At present, there are two kinds of methods for evaluating OP of PM2.5: the cellular method and non-cellular method. The reproducibility of cellular methods is poor, and it is difficult to achieve a large sample size analysis. And the choice of cell type or cell line can significantly affect the OP results (Xing et al., 2023). The non-cellular method has the advantages of fast speed, simple operation, high reproducibility, and low cost. The most common non-cellular methods are DTT, AA, GSH, and 2′, 7′-dichlorofluorescein (DCFH) assays (Pietrogrande et al., 2019). However, standardized experimental methods for evaluating OP have not been established (Song et al., 2021), and it is difficult to provide more consistent data on OP across samples at different locations and times. Moreover, each non-cellular OP assay is specific for ROS, meaning that none of the methods are used as a standard method for assessing the toxicity of environmental particles. Several studies have used a multi-measure approach to compensate for the specificity of a single-probe response to ROS (Calas et al., 2018; Puthussery et al., 2020; Yu et al., 2021; Xu et al., 2021). Xu et al. (2021) used three measurement methods (OPDTT, OPAA, and OPGSH) to estimate the Canadian annual mean OP and found that the sensitivity of the three methods to different components varied widely. Choosing a variety of methods for OP measurement can lead to more comprehensive results, but it can also lead to a significant increase in workload.
For this, we propose a hybrid approach combining existing observations of OP with a CTM. So, using OP from assays and their observed links to sources and chemical constituents can then be parameterized and implemented in a CTM for a comprehensive assessment of OP exposure over large areas and time periods. The method considers the seasonal characteristics of the chemical composition of PM2.5 and the DTT activity measurement of PM2.5. A positive matrix factorization (PMF) model and multiple linear regression (MLR) model were used to quantify the contribution of PM2.5 emission sources to OP (the volume-normalized DTT activity, DTTv). The normalized regression equation in this study provides the sensitivity of OP to each identified source. The advantage is that directly applying predicted and readily available PM2.5 data makes it easy to estimate the OP and assess health risks over large regions and across time and space. This approach enables the exploration of spatial and seasonal variations in aerosol OP across China, providing insight into the contribution of sources, atmospheric processes, and meteorological conditions. There are some main limitations to this study that may lead to uncertainty in predicting OP outcomes. Firstly, the OP prediction considered is incomplete and does not include all sources of OP. For example, the transportation sector refers only to road transport, excluding emissions from ships and other mobile sources. And the transportation sector only considers tailpipe emissions in traffic. These lead to some OP uncertainties. Additionally, this study only considers the intrinsic OP of total SOA due to limited long-term measurements of SOA. Different types of SOA may exhibit varied OP responses due to differences in their sources, formation pathways, and chemical compositions. Aging and fresh SOA may also exhibit varying toxicities (F. Liu et al., 2023). In future research, efforts should be made to comprehensively collect PM2.5 samples from various sources and fully explore the potential relationships between OP and PM2.5 components and sources to further improve OP prediction models and reduce prediction uncertainties. Secondly, the OP prediction model adopted in this paper is based on Liu et al. (2018). The data samples are from DTT experimental measurements conducted in various coastal cities and from different emission sources, with limited data samples. In this study, they are used to predict the OP of cities across the country, which inevitably leads to a slight error in the forecast results. However, due to the spatiotemporal and emission source differences of the data samples were considered, the three cities selected are representative, which reduces the errors caused by the data samples to a certain extent. Thirdly, a significant body of literature also indicates that vertical resolution can reflect atmospheric thermodynamic environments and the evolution processes of mesoscale systems, which are related to the diffusion and transport of PM2.5. Insufficient vertical resolution can hinder the accurate prediction of PM2.5 surface concentrations (Hara, 2011; Li et al., 2022; Li et al., 2023). Therefore, the configuration of the DEHM (e.g., vertical resolution) also introduces uncertainties to this study. In conclusion, the results calculated by the method proposed in this study are compared with existing measurement data (Liu et al., 2014; Liu et al., 2018; Wang et al., 2019), and good agreement is observed. For instance, through DTT measurements, Zhang et al. (2023) reported an average of 1.33 from January 2020 to June 2021 in downtown Nanjing, located in the Yangtze River Delta region of China, with a range of 0.82–2.08 . This is close to our estimated results (Liu et al., 2024) for the Yangtze River Delta region, where the annual mean OP during 2010–2014 was 1.56 , and the annual mean OP values for 2020 under two emission reduction scenarios were 1.36 and 1.25 , respectively. The relative errors for the two scenarios were 2.3 % and 6.0 %. Another study (Liu et al., 2020) investigating the OP of PM2.5 in Wuhan, located in the central China region, reported a mean of 1.8 for the summer of 2012 in downtown Wuhan. This aligns closely with our estimated results (Liu et al., 2024) for the central China region (1.73 ), with a relative error of 3.9 %. Therefore, the method proposed in this study is reliable. The proposed method provides a possibility to solve the difficulty and high cost of OP measurement.
This study established spatial modeling for PM2.5 concentrations and OP, provided a method for calculating OP across China, and quantitatively assessed the impacts of meteorological conditions and anthropogenic emissions on PM2.5 and OP variability and levels in China. The following conclusions can be drawn.
PM2.5 and OP exhibited spatial clustering characteristics, with higher values mainly located in the central and eastern urban areas. About 85 % and 40 % of the areas had PM2.5 annual average concentrations exceeding the primary concentration limit (15 µg m−3) and secondary concentration limit (35 µg m−3), respectively. Additionally, about 36 % of the areas had OP concentrations lower than 1 , while 23 % of the areas had OP concentrations higher than 2 .
Variability in both PM2.5 and OP is influenced by a combination of meteorological conditions and emission inventories. Meteorological conditions contributed about 46 % of PM2.5 variation and 65 % of OP variation. The emission inventory contributed about 54 % of the change in PM2.5 and about 35 % of the change in OP.
The percentage contributions of secondary aerosol formation, biomass burning, industry, coal combustion for residential heating, and traffic to PM2.5 were about 48 %, 21 %, 21 %, 6 %, and 4 %, respectively. The percentage contributions of secondary aerosol formation, biomass burning, coal combustion for residential heating, industry, and traffic to OP were approximately 58 %, 21 %, 11 %, 9 %, and 1 %, respectively.
A main finding of this study is that meteorological variability is the prime driver of OP variability, not emissions. Furthermore, secondary aerosol formation and biomass burning are the main sources of OP. Thus, air pollution strategies should focus more on biomass burning and the emissions of the precursors taking part in secondary aerosol formation, and it would be efficient to introduce special emissions controls during stagnation or other periods during which OP accumulates.
Data from all DEHM simulations and post-processing codes are available from the corresponding author on request. The hourly observation data were obtained from the Ministry of Ecology and Environment of China (MEE, 2014, https://www.mee.gov.cn/).
Density scatterplots of model performance and validation based on monthly mean observations (Fig. S1) are provided in the Supplement. The supplement related to this article is available online at: https://doi.org/10.5194/acp-24-10849-2024-supplement.
JL performed the simulation and its validation and worked on data analysis, investigation, and writing (original draft). JHC conducted investigation, worked on methodology, and performed validation. ZY conducted the investigation, data analysis, and methodology. SD provided suggestions for data analysis and manuscript feedback. CG conducted the investigation and provided suggestions on the simulation. JB conducted the investigation. AN conducted the investigation and provided manuscript feedback. YY provided manuscript feedback, supervision, and funding. UI provided the resources, supervised this work, provided manuscript feedback, and managed the project administration. All authors discussed the results and commented on the manuscript.
The contact author has declared that none of the authors has any competing interests.
Publisher's note: Copernicus Publications remains neutral with regard to jurisdictional claims made in the text, published maps, institutional affiliations, or any other geographical representation in this paper. While Copernicus Publications makes every effort to include appropriate place names, the final responsibility lies with the authors.
This study was supported by the National Natural Science Foundation of China (grant no. 52041601). The work of Liu Jiemei was also supported by the China Scholarship Council (CSC) under the State Scholarship Fund. Athanasios Nenes acknowledges support from the project PyroTRACH (ERC-2016-COG) (funded from H2020-EU.1.1. – Excellent Science – European Research Council – ERC, project ID 726165) and from the European Union project EASVOLEE funded from HORIZON-CL5-2022-D5-01 (project ID 101095457).
This research has been supported by the National Natural Science Foundation of China (grant no. 52041601), the China Scholarship Council (CSC, grant no. 202206120146), the project PyroTRACH (ERC-2016-COG) (funded from H2020-EU.1.1. – Excellent Science – European Research Council – ERC, project ID 726165), and the European Union project EASVOLEE funded from HORIZON-CL5-2022-D5-01 (project ID 101095457).
This paper was edited by Frank Keutsch and reviewed by two anonymous referees.
AAQS: National standard of the People's Republic of China GB3095-2012, AAQS, https://www.mee.gov.cn/ywgz/fgbz/bz/bzwb/dqhjbh/dqhjzlbz/201203/W020120410330232398521.pdf (last access: 11 January 2023), 2012.
Ainur, D., Chen, Q., Sha, T., Zarak, M., Dong, Z., Guo, W., Zhang, Z., Dina, K., and An, T.: Outdoor Health Risk of Atmospheric Particulate Matter at Night in Xi'an, Northwestern China, Environ. Sci. Technol., 57, 9252–9265, https://doi.org/10.1021/acs.est.3c02670, 2023.
Alexandratos, N. and Bruinsma, J.: World agriculture towards 2030/2050, the 2012 revision (No. 12-03), ESA Working Paper, World Food and Agricultural Organization, Rome, Italy, 2012.
Alwadei, M., Thomson, S., Kramer, L., Shi, Z., and Bloss, W.: Oxidative Potential of PM2.5 in Dammam, Saudi Arabia, and the effect of dust storms, EGU General Assembly 2020, Online, 4–8 May 2020, EGU2020-5727, https://doi.org/10.5194/egusphere-egu2020-5727, 2020.
Brandt, J., Silver, J. D., Frohn, L. M., Geels, C., Gross, A., Hansen, A. B., Hansen, K. M., Hedegaard, G. B., Skjøth, C. A., Villadsen, H., Zare, A., and Christensen, J. H.: An integrated model study for Europe and North America using the Danish Eulerian Hemispheric Model with focus on intercontinental transport of air pollution, Atmos. Environ., 53, 156–176, https://doi.org/10.1016/j.atmosenv.2012.01.011, 2012.
Brandt, J., Silver, J. D., Christensen, J. H., Andersen, M. S., Bønløkke, J. H., Sigsgaard, T., Geels, C., Gross, A., Hansen, A. B., Hansen, K. M., Hedegaard, G. B., Kaas, E., and Frohn, L. M.: Contribution from the ten major emission sectors in Europe and Denmark to the health-cost externalities of air pollution using the EVA model system – an integrated modelling approach, Atmos. Chem. Phys., 13, 7725–7746, https://doi.org/10.5194/acp-13-7725-2013, 2013a.
Brandt, J., Silver, J. D., Christensen, J. H., Andersen, M. S., Bønløkke, J. H., Sigsgaard, T., Geels, C., Gross, A., Hansen, A. B., Hansen, K. M., Hedegaard, G. B., Kaas, E., and Frohn, L. M.: Assessment of past, present and future health-cost externalities of air pollution in Europe and the contribution from international ship traffic using the EVA model system, Atmos. Chem. Phys., 13, 7747–7764, https://doi.org/10.5194/acp-13-7747-2013, 2013b.
Calas, A., Uzu, G., Kelly, F. J., Houdier, S., Martins, J. M. F., Thomas, F., Molton, F., Charron, A., Dunster, C., Oliete, A., Jacob, V., Besombes, J.-L., Chevrier, F., and Jaffrezo, J.-L.: Comparison between five acellular oxidative potential measurement assays performed with detailed chemistry on PM10 samples from the city of Chamonix (France), Atmos. Chem. Phys., 18, 7863–7875, https://doi.org/10.5194/acp-18-7863-2018, 2018.
Campbell, S. J., Wolfer, K., Utinger, B., Westwood, J., Zhang, Z.-H., Bukowiecki, N., Steimer, S. S., Vu, T. V., Xu, J., Straw, N., Thomson, S., Elzein, A., Sun, Y., Liu, D., Li, L., Fu, P., Lewis, A. C., Harrison, R. M., Bloss, W. J., Loh, M., Miller, M. R., Shi, Z., and Kalberer, M.: Atmospheric conditions and composition that influence PM2.5 oxidative potential in Beijing, China, Atmos. Chem. Phys., 21, 5549–5573, https://doi.org/10.5194/acp-21-5549-2021, 2021.
CESM: Community Earth System Model, National Center for Atmospheric Research [code, data set], https://www.cesm.ucar.edu/ (last access: 7 May 2023), 2023.
Chen, L., Wang, T., Bo, X., Zhuang, Z., Qu, J., Xue, X., Tian, J., Huang, M., Wang, P., and Sang, M.: Thermal Power Industry Emissions and Their Contribution to Air Quality on the Fen-Wei Plain, Atmosphere, 13, 652, https://doi.org/10.3390/atmos13050652, 2022.
Chen, P., Wang, T., Kasoar, M., Xie, M., Li, S., Zhuang, B., and Li, M.: Source Apportionment of PM2.5 during Haze and Non-Haze Episodes in Wuxi, China, Atmosphere, 9, 267, https://doi.org/10.3390/atmos9070267, 2018.
Chen, T. and Cao, S.: Numerical study on the integrated effects of supplied air velocity and exhaust velocity on particles removal for industrial buildings, Energy and Built Environment, 2, 380–391, https://doi.org/10.1016/j.enbenv.2020.09.006, 2021.
Chen, T., Cao, S., Wang, J., Nizamani, A. G., Feng, Z., and Kumar, P.: Influences of the optimized air curtain at subway entrance to reduce the ingress of outdoor airborne particles, Energy Build, 244, 111028, https://doi.org/10.1016/j.enbuild.2021.111028, 2021.
Chen, Z., Chen, D., Kwan, M.-P., Chen, B., Gao, B., Zhuang, Y., Li, R., and Xu, B.: The control of anthropogenic emissions contributed to 80 % of the decrease in PM2.5 concentrations in Beijing from 2013 to 2017, Atmos. Chem. Phys., 19, 13519–13533, https://doi.org/10.5194/acp-19-13519-2019, 2019.
Christensen, J. H.: The Danish eulerian hemispheric model – a three-dimensional air pollution model used for the arctic, Atmos. Environ., 31, 4169–4191, https://doi.org/10.1016/S1352-2310(97)00264-1, 1997.
Collin, G.: Regional Production, Updated documentation covering all Regional operational systems and the ENSEMBLE, METEO-FRANCE, https://atmosphere.copernicus.eu/sites/default/files/2020-01/CAMS50_2018SC1_D2.0.2-U1_Models_documentation_201910_v1.pdf (last access: 11 January 2023), 2020.
Cramer, J., Jorgensen, J. T., Hoffmann, B., Loft, S., Brauner, E. V., Prescott, E., Ketzel, M., Hertel, O., Brandt, J., Jensen, S. S., Backalarz, C., Simonsen, M. K., and Andersen, Z. J.: Long-Term Exposure to Air Pollution and Incidence of Myocardial Infarction: A Danish Nurse Cohort Study, Environ. Health Persp., 128, 057003, https://doi.org/10.1289/EHP5818, 2020.
Crippa, M., Guizzardi, D., Butler, T., Keating, T., Wu, R., Kaminski, J., Kuenen, J., Kurokawa, J., Chatani, S., Morikawa, T., Pouliot, G., Racine, J., Moran, M. D., Klimont, Z., Manseau, P. M., Mashayekhi, R., Henderson, B. H., Smith, S. J., Suchyta, H., Muntean, M., Solazzo, E., Banja, M., Schaaf, E., Pagani, F., Woo, J.-H., Kim, J., Monforti-Ferrario, F., Pisoni, E., Zhang, J., Niemi, D., Sassi, M., Ansari, T., and Foley, K.: The HTAP_v3 emission mosaic: merging regional and global monthly emissions (2000–2018) to support air quality modelling and policies, Earth Syst. Sci. Data, 15, 2667–2694, https://doi.org/10.5194/essd-15-2667-2023, 2023.
Danabasoglu, G., Lamarque, J. F., Bacmeister, J., Bailey, D. A., DuVivier, A. K., Edwards, J., Emmons, L. K., Fasullo, J., Garcia, R., Gettelman, A., Hannay, C., Holland, M. M., Large, W. G., Lauritzen, P. H., Lawrence, D. M., Lenaerts, J. T. M., Lindsay, K., Lipscomb, W. H., Mills, M. J., Neale, R., Oleson, K. W., Otto-Bliesner, B., Phillips, A. S., Sacks, W., Tilmes, S., van Kampenhout, L., Vertenstein, M., Bertini, A., Dennis, J., Deser, C., Fischer, C., Fox-Kemper, B., Kay, J. E., Kinnison, D., Kushner, P. J., Larson, V. E., Long, M. C., Mickelson, S., Moore, J. K., Nienhouse, E., Polvani, L., Rasch, P. J., and Strand, W. G.: The Community Earth System Model Version 2 (CESM2), J. Adv. Model. Earth Sy., 12, e2019MS001916, https://doi.org/10.1029/2019MS001916, 2020.
de Melo, J. E., Pellicane, P. J., and de Souza, M. R.: Goodness-of-fit analysis on wood properties data from six Brazilian tropical hardwoods, Wood Sci. Technol., 34, 83–97, https://doi.org/10.1007/s002260000033, 2000.
Eclipse: Global emission fields of air pollutants and GHGs, International Institute for Applied Systems Analysis [data set], https://iiasa.ac.at/models-tools-data/global-emission-fields-of-air-pollutants-and-ghgs (last access: 7 May 2023), 2020.
Emery, C., Liu, Z., Russell, A. G., Odman, M. T., Yarwood, G., and Kumar, N.: Recommendations on statistics and benchmarks to assess photochemical model performance, J. Air Waste Manage., 67, 582–598, https://doi.org/10.1080/10962247.2016.1265027, 2017.
ERA: ECMWF Reanalysis v5, European Centre for Medium-Range Weather Forecasts [data set], https://www.ecmwf.int/en/forecasts/dataset/ecmwf-reanalysis-v5 (last access: 22 May 2023), 2023.
Fang, T., Guo, H., Zeng, L., Verma, V., Nenes, A., and Weber, R. J.: Highly Acidic Ambient Particles, Soluble Metals, and Oxidative Potential: A Link between Sulfate and Aerosol Toxicity, Environ. Sci. Technol., 51, 2611–2620, https://doi.org/10.1021/acs.est.6b06151, 2017.
Frohn, L. M., Geels, C., Andersen, C., Andersson, C., Bennet, C., Christensen, J. H., Im, U., Karvosenoja, N., Kindler, P. A., Kukkonen, J., Lopez-Aparicio, S., Nielsen, O., Palamarchuk, Y., Paunu, V., Plejdrup, M. S., Segersson, D., Sofiev, M., and Brandt, J.: Evaluation of multidecadal high-resolution atmospheric chemistry-transport modelling for exposure assessments in the continental Nordic countries, Atmos. Environ., 290, 119334, https://doi.org/10.1016/j.atmosenv.2022.119334, 2022.
Frost, G. J., Middleton, P., Tarrasón, L., Granier, C., Guenther, A., Cardenas, B., Denier Van Der Gon, H., Janssens-Maenhout, G., Kaiser, J. W., Keating, T., Klimont, Z., Lamarque, J., Liousse, C., Nickovic, S., Ohara, T., Schultz, M. G., Skiba, U., van Aardenne, J., and Wang, Y.: New Directions: GEIA's 2020 vision for better air emissions information, Atmos. Environ., 81, 710–712, https://doi.org/10.1016/j.atmosenv.2013.08.063, 2013.
Galmarini, S., Koffi, B., Solazzo, E., Keating, T., Hogrefe, C., Schulz, M., Benedictow, A., Griesfeller, J. J., Janssens-Maenhout, G., Carmichael, G., Fu, J., and Dentener, F.: Technical note: Coordination and harmonization of the multi-scale, multi-model activities HTAP2, AQMEII3, and MICS-Asia3: simulations, emission inventories, boundary conditions, and model output formats, Atmos. Chem. Phys., 17, 1543–1555, https://doi.org/10.5194/acp-17-1543-2017, 2017.
Gao, D., Godri Pollitt, K. J., Mulholland, J. A., Russell, A. G., and Weber, R. J.: Characterization and comparison of PM2.5 oxidative potential assessed by two acellular assays, Atmos. Chem. Phys., 20, 5197–5210, https://doi.org/10.5194/acp-20-5197-2020, 2020.
García-Martínez, I. M., Bollasina, M. A., and Undorf, S.: Strong large-scale climate response to North American sulphate aerosols in CESM, Environ. Res. Lett., 15, 114051, https://doi.org/10.1088/1748-9326/abbe45, 2020.
Geels, C., Andersson, C., Hänninen, O., Lansø, A. S., Schwarze, P. E., Skjøth, C. A., and Brandt, J.: Future Premature Mortality Due to O3, Secondary Inorganic Aerosols and Primary PM in Europe — Sensitivity to Changes in Climate, Anthropogenic Emissions, Population and Building Stock, Int. J. Envi. Res. Pub. He., 12, 2837–2869, https://doi.org/10.3390/ijerph120302837, 2015.
Geels, C., Winther, M., Andersson, C., Jalkanen, J.-P., Brandt, J., Frohn, L. M., Im, U., Leung, W., and Christensen, J. H.: Projections of shipping emissions and the related impact on air pollution and human health in the Nordic region, Atmos. Chem. Phys., 21, 12495–12519, https://doi.org/10.5194/acp-21-12495-2021, 2021.
Gong, S., Zhang, L., Liu, C., Lu, S., Pan, W., and Zhang, Y.: Multi-scale analysis of the impacts of meteorology and emissions on PM2.5 and O3 trends at various regions in China from 2013 to 2020 2. Key weather elements and emissions, Sci. Total Environ., 824, 153847, https://doi.org/10.1016/j.scitotenv.2022.153847, 2022.
Hara, T.: Vertical resolution dependency of boundary layer schemes, World Climate Research Programme, https://www.wcrp-climate.org/WGNE/BlueBook/2011/individual-articles/04_Tabito_Hara_04_hara_tabito_vertical_resolution_dependency.pdf (last access: 22 May 2023), 2011.
Hersbach, H., Bell, B., Berrisford, P., Hirahara, S., Horányi, A., Muñoz-Sabater, J., Nicolas, J., Peubey, C., Radu, R., Schepers, D., Simmons, A., Soci, C., Abdalla, S., Abellan, X., Balsamo, G., Bechtold, P., Biavati, G., Bidlot, J., Bonavita, M., De Chiara, G., Dahlgren, P., Dee, D., Diamantakis, M., Dragani, R., Flemming, J., Forbes, R., Fuentes, M., Geer, A., Haimberger, L., Healy, S., Hogan, R. J., Hólm, E., Janisková, M., Keeley, S., Laloyaux, P., Lopez, P., Lupu, C., Radnoti, G., de Rosnay, P., Rozum, I., Vamborg, F., Villaume, S., and Thépaut, J.: The ERA5 global reanalysis, Q. J. Roy. Meteor. Soc., 146, 1999–2049, https://doi.org/10.1002/qj.3803, 2020.
Hodan, W. M. and Barnard, W. R.: Evaluating the contribution of PM2.5 precursor gases and re-entrained road emissions to mobile source PM2.5 particulate matter emissions, MACTEC Federal Programs, Research Triangle Park, NC, https://www3.epa.gov/ttnchie1/conference/ei13/mobile/hodan.pdf (last access: 22 May 2023), 2004.
Hong, S., Noh, Y., and Dudhia, J.: A New Vertical Diffusion Package with an Explicit Treatment of Entrainment Processes, Mon. Weather Rev., 134, 2318–2341, https://doi.org/10.1175/MWR3199.1, 2006.
Huang, L., Zhu, Y., Zhai, H., Xue, S., Zhu, T., Shao, Y., Liu, Z., Emery, C., Yarwood, G., Wang, Y., Fu, J., Zhang, K., and Li, L.: Recommendations on benchmarks for numerical air quality model applications in China – Part 1: PM2.5 and chemical species, Atmos. Chem. Phys., 21, 2725–2743, https://doi.org/10.5194/acp-21-2725-2021, 2021.
IEA: World Energy Outlook 2011, International Energy Agency, Paris, France, 2011.
IEA: Energy Technology Perspectives. 2012 – Pathways to a Clean Energy System, OECD/IEA, International Energy Agency, Paris, 2012.
Im, U., Brandt, J., Geels, C., Hansen, K. M., Christensen, J. H., Andersen, M. S., Solazzo, E., Kioutsioukis, I., Alyuz, U., Balzarini, A., Baro, R., Bellasio, R., Bianconi, R., Bieser, J., Colette, A., Curci, G., Farrow, A., Flemming, J., Fraser, A., Jimenez-Guerrero, P., Kitwiroon, N., Liang, C.-K., Nopmongcol, U., Pirovano, G., Pozzoli, L., Prank, M., Rose, R., Sokhi, R., Tuccella, P., Unal, A., Vivanco, M. G., West, J., Yarwood, G., Hogrefe, C., and Galmarini, S.: Assessment and economic valuation of air pollution impacts on human health over Europe and the United States as calculated by a multi-model ensemble in the framework of AQMEII3, Atmos. Chem. Phys., 18, 5967–5989, https://doi.org/10.5194/acp-18-5967-2018, 2018.
Im, U., Christensen, J. H., Nielsen, O.-K., Sand, M., Makkonen, R., Geels, C., Anderson, C., Kukkonen, J., Lopez-Aparicio, S., and Brandt, J.: Contributions of Nordic anthropogenic emissions on air pollution and premature mortality over the Nordic region and the Arctic, Atmos. Chem. Phys., 19, 12975–12992, https://doi.org/10.5194/acp-19-12975-2019, 2019.
Im, U., Bauer, S. E., Frohn, L. M., Geels, C., Tsigaridis, K., and Brandt, J.: Present-day and future PM2.5 and O3-related global and regional premature mortality in the EVAv6.0 health impact assessment model, Environ. Res., 216, 114702, https://doi.org/10.1016/j.envres.2022.114702, 2023.
Jia, W. and Zhang, X.: Impact of modified turbulent diffusion of PM2.5 aerosol in WRF-Chem simulations in eastern China, Atmos. Chem. Phys., 21, 16827–16841, https://doi.org/10.5194/acp-21-16827-2021, 2021.
Joint, R. C., Institute, F. E. A. S., Orlandini, L., Kurokawa, J., Monni, S., Akimoto, H., Grano, D., Battye, B., Zuber, A., Pagliari, V., Janssens-Maenhout, G., Van Aardenne, J., Dentener, F., Keating, T., Klimont, Z., Wankmüller, R., and Ohara, T.: EDGAR-HTAP – A harmonized gridded air pollution emission dataset based on national inventories, Publications Office of the European Union [data set], https://pure.iiasa.ac.at/id/eprint/10114/ (last access: 22 May 2023), 2011.
Kaiser, J. W., Heil, A., Andreae, M. O., Benedetti, A., Chubarova, N., Jones, L., Morcrette, J.-J., Razinger, M., Schultz, M. G., Suttie, M., and van der Werf, G. R.: Biomass burning emissions estimated with a global fire assimilation system based on observed fire radiative power, Biogeosciences, 9, 527–554, https://doi.org/10.5194/bg-9-527-2012, 2012.
Kumar, A., Patil, R. S., Dikshit, A. K., Kumar, R., Brandt, J., and Hertel, O.: Assessment of impact of unaccounted emission on ambient concentration using DEHM and AERMOD in combination with WRF, Atmos. Environ., 142, 406–413, https://doi.org/10.1016/j.atmosenv.2016.08.024, 2016.
Kumar, P., Beig, G., Singh, V., Sahu, S. K., Siingh, D., and Bamniya, B. R.: Model simulation of carbonaceous fine particulate matter using SAFAR emission inventory and comparison with EDGAR-HTAP simulations, Atmos. Environ., 315, 120147, https://doi.org/10.1016/j.atmosenv.2023.120147, 2023.
Lehtomäki, H., Geels, C., Brandt, J., Rao, S., Yaramenka, K., Åström, S., Andersen, M. S., Frohn, L. M., Im, U., and Hänninen, O.: Deaths Attributable to Air Pollution in Nordic Countries: Disparities in the Estimates, Atmosphere, 11, 467, https://doi.org/10.3390/atmos11050467, 2020.
Li, D., Wu, Y., Gross, B., and Moshary, F.: Dynamics of Mixing Layer Height and Homogeneity from Ceilometer-Measured Aerosol Profiles and Correlation to Ground Level PM2.5 in New York City, Remote Sens., 14, 6370, https://doi.org/10.3390/rs14246370, 2022.
Li, S., Li, X., Deng, Z., Xia, X., Ren, G., An, D., Ayikan, M., and Zhong, Y.: Characteristics of atmospheric boundary layer and its relation with PM2.5 during winter in Shihezi, an Oasis city in Northwest China, Atmos. Pollut. Res., 14, 101902, https://doi.org/10.1016/j.apr.2023.101902, 2023.
Lin, S., Tian, H., Hao, Y., Wu, B., Liu, S., Luo, L., Bai, X., Liu, W., Zhao, S., Hao, J., Guo, Z., and Lv, Y.: Atmospheric emission inventory of hazardous air pollutants from biomass direct-fired power plants in China: Historical trends, spatial variation characteristics, and future perspectives, Sci. Total Environ., 767, 144636, https://doi.org/10.1016/j.scitotenv.2020.144636, 2021.
Liu, F., Joo, T., Ditto, J. C., Saavedra, M. G., Takeuchi, M., Boris, A. J., Yang, Y., Weber, R. J., Dillner, A. M., Gentner, D. R., and Ng, N. L.: Oxidized and Unsaturated: Key Organic Aerosol Traits Associated with Cellular Reactive Oxygen Species Production in the Southeastern United States, Environ. Sci. Technol., 57, 14150–14161, https://doi.org/10.1021/acs.est.3c03641, 2023.
Liu, J., Gao, X., Ruan, Z., Yuan, Y., and Dong, S.: Analysis of spatial and temporal distribution and influencing factors of fine particles in Heilongjiang Province, Urban Clim., 41, 101070, https://doi.org/10.1016/j.uclim.2021.101070, 2022a.
Liu, J., Ruan, Z., Gao, X., Yuan, Y., and Dong, S.: Quantifying contribution of weather patterns to PM2.5 concentrations based on spatial effects and health risk assessment, Sustain. Cities Soc., 83, 103980, https://doi.org/10.1016/j.scs.2022.103980, 2022b.
Liu, J., Ruan, Z., Gao, X., Yuan, Y., Dong, S., Li, X., and Liu, X.: Investigating the cumulative lag effects of environmental exposure under urban differences on COVID-19, J. Infect. Public Heal., https://doi.org/10.1016/j.jiph.2023.06.002, 2023.
Liu, J., Ye, Z., Christensen, J. H., Dong, S., Geels, C., Brandt, J., Nenes, A., Yuan, Y., and Im, U.: Impact of anthropogenic emission control in reducing future PM2.5 concentrations and the related oxidative potential across different regions of China, Sci. Total Environ., 918, 170638, https://doi.org/10.1016/j.scitotenv.2024.170638, 2024.
Liu, M., Saari, R. K., Zhou, G., Li, J., Han, L., and Liu, X.: Recent trends in premature mortality and health disparities attributable to ambient PM2.5 exposure in China: 2005–2017, Environ. Pollut., 279, 116882, https://doi.org/10.1016/j.envpol.2021.116882, 2021.
Liu, Q., Baumgartner, J., Zhang, Y., Liu, Y., Sun, Y., and Zhang, M.: Oxidative Potential and Inflammatory Impacts of Source Apportioned Ambient Air Pollution in Beijing, Environ. Sci. Technol., 48, 12920–12929, https://doi.org/10.1021/es5029876, 2014.
Liu, Q., Lu, Z., Xiong, Y., Huang, F., Zhou, J., and Schauer, J. J.: Oxidative potential of ambient PM2.5 in Wuhan and its comparisons with eight areas of China, Sci. Total Environ., 701, 134844, https://doi.org/10.1016/j.scitotenv.2019.134844, 2020.
Liu, S., Lim, Y., Pedersen, M., Jørgensen, J. T., Amini, H., Cole-Hunter, T., Mehta, A. J., So, R., Mortensen, L. H., Westendorp, R. G. J., Loft, S., Bräuner, E. V., Ketzel, M., Hertel, O., Brandt, J., Jensen, S. S., Christensen, J. H., Sigsgaard, T., Geels, C., Frohn, L. M., Brborić, M., Radonić, J., Sekulic, M. T., Bønnelykke, K., Backalarz, C., Simonsen, M. K., and Andersen, Z. J.: Long-term exposure to ambient air pollution and road traffic noise and asthma incidence in adults: The Danish Nurse cohort, Environ. Int., 152, 106464, https://doi.org/10.1016/j.envint.2021.106464, 2021.
Liu, W., Xu, Y., Liu, W., Liu, Q., Yu, S., Liu, Y., Wang, X., and Tao, S.: Oxidative potential of ambient PM2.5 in the coastal cities of the Bohai Sea, northern China: Seasonal variation and source apportionment, Environ. Pollut., 236, 514–528, https://doi.org/10.1016/j.envpol.2018.01.116, 2018.
Mao, J.: Co-firing Biomass With Coal for Power Generation, Distributed Energy, 2, 47–54, https://doi.org/10.16513/j.cnki.10-1427/tk.2017.05.008, 2017.
MEE: Ministry of Ecology and Environment, Ministry of Ecology and Environment of the People’s Republic of China [data set], https://www.mee.gov.cn/ (last access: 11 January 2023), 2014.
MEE: China Vehicle Emission Control Annual Report, Ministry of Environmental Protection of the People’s Republic of China, https://www.mee.gov.cn/hjzl/sthjzk/ydyhjgl/201605/P020160513584304398771.pdf (last access: 11 January 2023), 2015.
MEE: Bulletin of the second National Survey of pollution sources, Ministry of Ecology and Environment of the People’s Republic of China, http://www.gov.cn/xinwen/2020-06/10/content_5518391.htm (last access: 11 January 2023), 2020.
Molina, C., Manzano, C. A., Toro A., R., and Leiva G, M. A.: The oxidative potential of airborne particulate matter in two urban areas of Chile: More than meets the eye, Environ. Int., 173, 107866, https://doi.org/10.1016/j.envint.2023.107866, 2023.
Pietrogrande, M. C., Russo, M., and Zagatti, E.: Review of PM Oxidative Potential Measured with Acellular Assays in Urban and Rural Sites across Italy, Atmosphere, 10, 626, https://doi.org/10.3390/atmos10100626, 2019.
Pui, D. Y. H., Chen, S., and Zuo, Z.: PM2.5 in China: Measurements, sources, visibility and health effects, and mitigation, Particuology, 13, 1–26, https://doi.org/10.1016/j.partic.2013.11.001, 2014.
Puthussery, J. V., Singh, A., Rai, P., Bhattu, D., Kumar, V., Vats, P., Furger, M., Rastogi, N., Slowik, J. G., Ganguly, D., Prevot, A. S. H., Tripathi, S. N., and Verma, V.: Real-Time Measurements of PM2.5 Oxidative Potential Using a Dithiothreitol Assay in Delhi, India, Environ. Sci. Tech. Let., 7, 504–510, https://doi.org/10.1021/acs.estlett.0c00342, 2020.
Richter, J. H., Glanville, A. A., Edwards, J., Kauffman, B., Davis, N. A., Jaye, A., Kim, H., Pedatella, N. M., Sun, L., Berner, J., Kim, W. M., Yeager, S. G., Danabasoglu, G., Caron, J. M., and Oleson, K. W.: Subseasonal Earth System Prediction with CESM2, Weather Forecast, 37, 797–815, https://doi.org/10.1175/WAF-D-21-0163.1, 2022.
Shahpoury, P., Lelieveld, S., Johannessen, C., Berkemeier, T., Celo, V., Dabek-Zlotorzynska, E., Harner, T., Lammel, G., and Nenes, A.: Influence of aerosol acidity and organic ligands on transition metal solubility and oxidative potential of fine particulate matter in urban environments, Sci. Total Environ., 906, 167405, https://doi.org/10.1016/j.scitotenv.2023.167405, 2024.
Shi, X., Zheng, Y., Lei, Y., Xue, W., Yan, G., Liu, X., Cai, B., Tong, D., and Wang, J.: Air quality benefits of achieving carbon neutrality in China, Sci. Total Environ., 795, 148784, https://doi.org/10.1016/j.scitotenv.2021.148784, 2021.
Skamarock, W. C., Klemp, J. B., Dudhia, J., Gill, D. O., Barker, D. M., Duda, M. G., Huang, X., Wang, W., and Powers, J. G.: A description of the advanced research WRF version 3, NCAR technical note, 475, 113, https://doi.org/10.5065/D68S4MVH, 2008.
Skamarock, W. C., Klemp, J. B., Dudhia, J., Gill, D. O., Liu, Z., Berner, J., and Huang, X. Y.: A Description of the Advanced Research WRF Model Version 4.3 (No. NCAR/TN-556+STR), https://doi.org/10.5065/1dfh-6p97, 2021.
Soares, J., Sofiev, M., Geels, C., Christensen, J. H., Andersson, C., Tsyro, S., and Langner, J.: Impact of climate change on the production and transport of sea salt aerosol on European seas, Atmos. Chem. Phys., 16, 13081–13104, https://doi.org/10.5194/acp-16-13081-2016, 2016.
Song, M., Oh, S., Park, C., and Bae, M.: analytical procedure for dithiothreitol-based oxidative potential of PM2.5, Asian J. Atmos. Environ., 15, 2021015, https://doi.org/10.5572/ajae.2021.015, 2021.
Strand, A. and Hov, Ø.: A two-dimensional global study of tropospheric ozone production, J. Geophys. Res.-Atmos., 99, 22877–22895, https://doi.org/10.1029/94JD01945, 1994.
Tang, L., Xue, X., Qu, J., Mi, Z., Bo, X., Chang, X., Wang, S., Li, S., Cui, W., and Dong, G.: Air pollution emissions from Chinese power plants based on the continuous emission monitoring systems network, Sci. Data, 7, 325, https://doi.org/10.1038/s41597-020-00665-1, 2020.
Thomas, D. C., Christensen, J. H., Massling, A., Pernov, J. B., and Skov, H.: The effect of the 2020 COVID-19 lockdown on atmospheric black carbon levels in northeastern Greenland, Atmos. Environ., 269, 118853, https://doi.org/10.1016/j.atmosenv.2021.118853, 2022.
Thomas, S. R., Nicolau, S., Martínez-Alvarado, O., Drew, D. J., and Bloomfield, H. C.: How well do atmospheric reanalyses reproduce observed winds in coastal regions of Mexico?, Meteorol. Appl., 28, e2023, https://doi.org/10.1002/met.2023, 2021.
Tong, D., Zhang, Q., Liu, F., Geng, G., Zheng, Y., Xue, T., Hong, C., Wu, R., Qin, Y., Zhao, H., Yan, L., and He, K.: Current Emissions and Future Mitigation Pathways of Coal-Fired Power Plants in China from 2010 to 2030, Environ. Sci. Technol., 52, 12905–12914, https://doi.org/10.1021/acs.est.8b02919, 2018.
Upadhyay, A., Dey, S., and Goyal, P.: A comparative assessment of regional representativeness of EDGAR and ECLIPSE emission inventories for air quality studies in India, Atmos. Environ., 223, 117182, https://doi.org/10.1016/j.atmosenv.2019.117182, 2020.
van Donkelaar, A., Hammer, M. S., Bindle, L., Brauer, M., Brook, J. R., Garay, M. J., Hsu, N. C., Kalashnikova, O. V., Kahn, R. A., Lee, C., Levy, R. C., Lyapustin, A., Sayer, A. M., and Martin, R. V.: Monthly Global Estimates of Fine Particulate Matter and Their Uncertainty, Environ. Sci. Technol., 55, 15287–15300, https://doi.org/10.1021/acs.est.1c05309, 2021.
Wang, G., Deng, J., Zhang, Y., Zhang, Q., Duan, L., Hao, J., and Jiang, J.: Air pollutant emissions from coal-fired power plants in China over the past two decades, Sci. Total Environ., 741, 140326, https://doi.org/10.1016/j.scitotenv.2020.140326, 2020.
Wang, J., Lin, X., Lu, L., Wu, Y., Zhang, H., Lv, Q., Liu, W., Zhang, Y., and Zhuang, S.: Temporal variation of oxidative potential of water soluble components of ambient PM2.5 measured by dithiothreitol (DTT) assay, Sci. Total Environ., 649, 969–978, https://doi.org/10.1016/j.scitotenv.2018.08.375, 2019.
Wen, W., Hua, T., Liu, L., Liu, X., Ma, X., Shen, S., and Deng, Z.: Oxidative Potential Characterization of Different PM2.5 Sources and Components in Beijing and the Surrounding Region, Int. J. Environ. Res. Pu., 20, 5109, https://doi.org/10.3390/ijerph20065109, 2023.
Xing, C., Wang, Y., Yang, X., Zeng, Y., Zhai, J., Cai, B., Zhang, A., Fu, T., Zhu, L., Li, Y., Wang, X., and Zhang, Y.: Seasonal variation of driving factors of ambient PM2.5 oxidative potential in Shenzhen, China, Sci. Total Environ., 862, 160771, https://doi.org/10.1016/j.scitotenv.2022.160771, 2023.
Xu, J., Martin, R. V., Evans, G. J., Umbrio, D., Traub, A., Meng, J., van Donkelaar, A., You, H., Kulka, R., Burnett, R. T., Godri Pollitt, K. J., and Weichenthal, S.: Predicting Spatial Variations in Multiple Measures of Oxidative Burden for Outdoor Fine Particulate Air Pollution across Canada, Environ. Sci. Technol., 55, 9750–9760, https://doi.org/10.1021/acs.est.1c01210, 2021.
Xu, X., Frey, S. K., and Ma, D.: Hydrological performance of ERA5 and MERRA-2 precipitation products over the Great Lakes Basin, Journal of Hydrology: Regional Studies, 39, 100982, https://doi.org/10.1016/j.ejrh.2021.100982, 2022.
Yang, F., Liu, C., and Qian, H.: Comparison of indoor and outdoor oxidative potential of PM2.5: pollution levels, temporal patterns, and key constituents, Environ. Int., 155, 106684, https://doi.org/10.1016/j.envint.2021.106684, 2021.
Yu, H., Puthussery, J. V., Wang, Y., and Verma, V.: Spatiotemporal variability in the oxidative potential of ambient fine particulate matter in the Midwestern United States, Atmos. Chem. Phys., 21, 16363–16386, https://doi.org/10.5194/acp-21-16363-2021, 2021.
Yu, S., Liu, W., Xu, Y., Yi, K., Zhou, M., Tao, S., and Liu, W.: Characteristics and oxidative potential of atmospheric PM2.5 in Beijing: Source apportionment and seasonal variation, Sci. Total Environ., 650, 277–287, https://doi.org/10.1016/j.scitotenv.2018.09.021, 2019.
Yun, X., Shen, G. F., Shen, H. Z., Meng, W. J., Chen, Y. L., Xu, H. R., Ren, Y., Zhong, Q. R., Du, W., Ma, J. M., Cheng, H. F., Wang, X. L., Liu, J. F., Wang, X. J., Li, B. G., Hu, J. Y., Wan, Y., and Tao, S.: Residential solid fuel emissions contribute significantly to air pollution and associated health impacts in China, Sci. Adv., 6, eaba7621, https://doi.org/10.1126/sciadv.aba7621, 2020.
Zare, A., Christensen, J. H., Irannejad, P., and Brandt, J.: Evaluation of two isoprene emission models for use in a long-range air pollution model, Atmos. Chem. Phys., 12, 7399–7412, https://doi.org/10.5194/acp-12-7399-2012, 2012.
Zare, A., Christensen, J. H., Gross, A., Irannejad, P., Glasius, M., and Brandt, J.: Quantifying the contributions of natural emissions to ozone and total fine PM concentrations in the Northern Hemisphere, Atmos. Chem. Phys., 14, 2735–2756, https://doi.org/10.5194/acp-14-2735-2014, 2014.
Zeng, Z., Gui, K., Wang, Z., Luo, M., Geng, H., Ge, E., An, J., Song, X., Ning, G., Zhai, S., and Liu, H.: Estimating hourly surface PM2.5 concentrations across China from high-density meteorological observations by machine learning, Atmos. Res., 254, 105516, https://doi.org/10.1016/j.atmosres.2021.105516, 2021.
Zhang, H., Li, N., Tang, K., Liao, H., Shi, C., Huang, C., Wang, H., Guo, S., Hu, M., Ge, X., Chen, M., Liu, Z., Yu, H., and Hu, J.: Estimation of secondary PM2.5 in China and the United States using a multi-tracer approach, Atmos. Chem. Phys., 22, 5495–5514, https://doi.org/10.5194/acp-22-5495-2022, 2022.
Zhang, L., Hu, X., Chen, S., Chen, Y., and Lian, H.: Characterization and source apportionment of oxidative potential of ambient PM2.5 in Nanjing, a megacity of Eastern China, Env. Pollut. Bioavail., 35, 2175728, https://doi.org/10.1080/26395940.2023.2175728, 2023.
Zheng, B., Tong, D., Li, M., Liu, F., Hong, C., Geng, G., Li, H., Li, X., Peng, L., Qi, J., Yan, L., Zhang, Y., Zhao, H., Zheng, Y., He, K., and Zhang, Q.: Trends in China's anthropogenic emissions since 2010 as the consequence of clean air actions, Atmos. Chem. Phys., 18, 14095–14111, https://doi.org/10.5194/acp-18-14095-2018, 2018.
Zheng, Y., Alapaty, K., Herwehe, J. A., Del Genio, A. D., and Niyogi, D.: Improving High-Resolution Weather Forecasts Using the Weather Research and Forecasting (WRF) Model with an Updated Kain–Fritsch Scheme, Mon. Weather Rev., 144, 833–860, https://doi.org/10.1175/MWR-D-15-0005.1, 2016.
Zhu, Y., Huang, L., Li, J., Ying, Q., Zhang, H., Liu, X., Liao, H., Li, N., Liu, Z., Mao, Y., Fang, H., and Hu, J.: Sources of particulate matter in China: Insights from source apportionment studies published in 1987–2017, Environ. Int., 115, 343–357, https://doi.org/10.1016/j.envint.2018.03.037, 2018.