the Creative Commons Attribution 4.0 License.
the Creative Commons Attribution 4.0 License.
 | 25 Sep 2024
Assessing the effectiveness of SO2, NOx, and NH3 emission reductions in mitigating winter PM2.5 in Taiwan using CMAQ
Ping-Chieh Huang
Hsin-Chih Lai
Charles C.-K. Chou
Taiwan experiences higher air pollution in winter when fine particulate matter (PM2.5) levels frequently surpass national standards. This study employs the Community Multiscale Air Quality model to assess the effectiveness of reducing SO2, NOx, and NH3 emissions on PM2.5 secondary inorganic species (i.e., SO, NO, and NH). For sulfate, ∼ 43.7 % is derived from the chemical reactions of local SO2 emission, emphasizing the substantial contribution of regionally transported sulfate. In contrast, nitrate and ammonium are predominantly influenced by local NOx and NH3 emissions. Reducing SO2 emissions decreases sulfate levels, which in turn leads to more NH3 remaining in the gas phase, resulting in lower ammonium concentrations. Similarly, reducing NOx emissions lowers HNO3 formation, impacting nitrate and ammonium concentrations by decreasing the available HNO3 and leaving more NH3 in the gas phase. A significant finding is that reducing NH3 emissions decreases not only ammonium and nitrate but also sulfate by altering cloud droplet pH and SO2 oxidation processes. While the impact of SO2 reduction on PM2.5 is less than that of NOx and NH3, it emphasizes the complexity of regional sensitivities. Most of western Taiwan is NOx-sensitive, so reducing NOx emissions has a more substantial impact on lowering PM2.5 levels. However, given the higher mass emissions of NOx than NH3 in Taiwan, NH3 has a more significant consequence in mitigating PM2.5 per unit mass emission reduction (i.e., 2.43 × 10⁻⁵ and 0.85 × 10⁻⁵ µg m−3 (t yr−1)−1 for NH3 and NOx, respectively, under current emission reduction). The cost-effectiveness analysis suggests that NH3 reduction outperforms SO2 and NOx reduction (i.e., USD 0.06 billion yr−1 µg−1 m3, USD 0.1 billion yr−1 µg−1 m3, and USD 1 billion yr−1 µg−1 m3 for NH3, SO2, and NOx, respectively, under the current emission reduction). Nevertheless, the costs of emission reduction vary due to differences in methodology and regional emission sources. Overall, this study considers both the efficiency and costs, highlighting NH3 emissions reduction as a promising strategy for PM2.5 mitigation in the studied environment in Taiwan.
- Article
(1442 KB) - Full-text XML
-
Supplement
(2988 KB) - BibTeX
- EndNote


Aerosol particles in the atmosphere have become a significant concern due to their adverse health effects (Maynard and Maynard, 2002; Shiraiwa et al., 2017; Sugiyama et al., 2020) and their role in affecting global radiation budgets (Ramanathan et al., 2001; IPCC, 2021). Long-term exposure to air pollutants such as particulate matter (PM) and ozone (O3) has been linked to millions of premature deaths annually on a global scale (Vohra et al., 2022; WHO, 2021). These findings emphasize the critical need for a comprehensive understanding of air pollution and effective management strategies to protect public health and mitigate environmental consequences.
PM can enter the atmosphere through direct emissions of primary aerosols, such as black carbon, sea salt, dust, and certain organic substances. Alternatively, PM can be formed via chemical reactions of gas-phase precursors, creating secondary aerosols such as sulfate (SO), nitrate (NO), and ammonium (NH) (Seinfeld and Pandis, 2006). The composition of PM varies globally, with organic and inorganic components representing major categories. Inorganic aerosol components, including sulfate, nitrate, ammonium, and chloride, constitute 35 % to 77 % of PM1 worldwide (Schroder et al., 2018). The significant proportion of this secondary inorganic composition can influence the pH value of PM, further impacting the formation of secondary organic matter (Zhang et al., 2007).
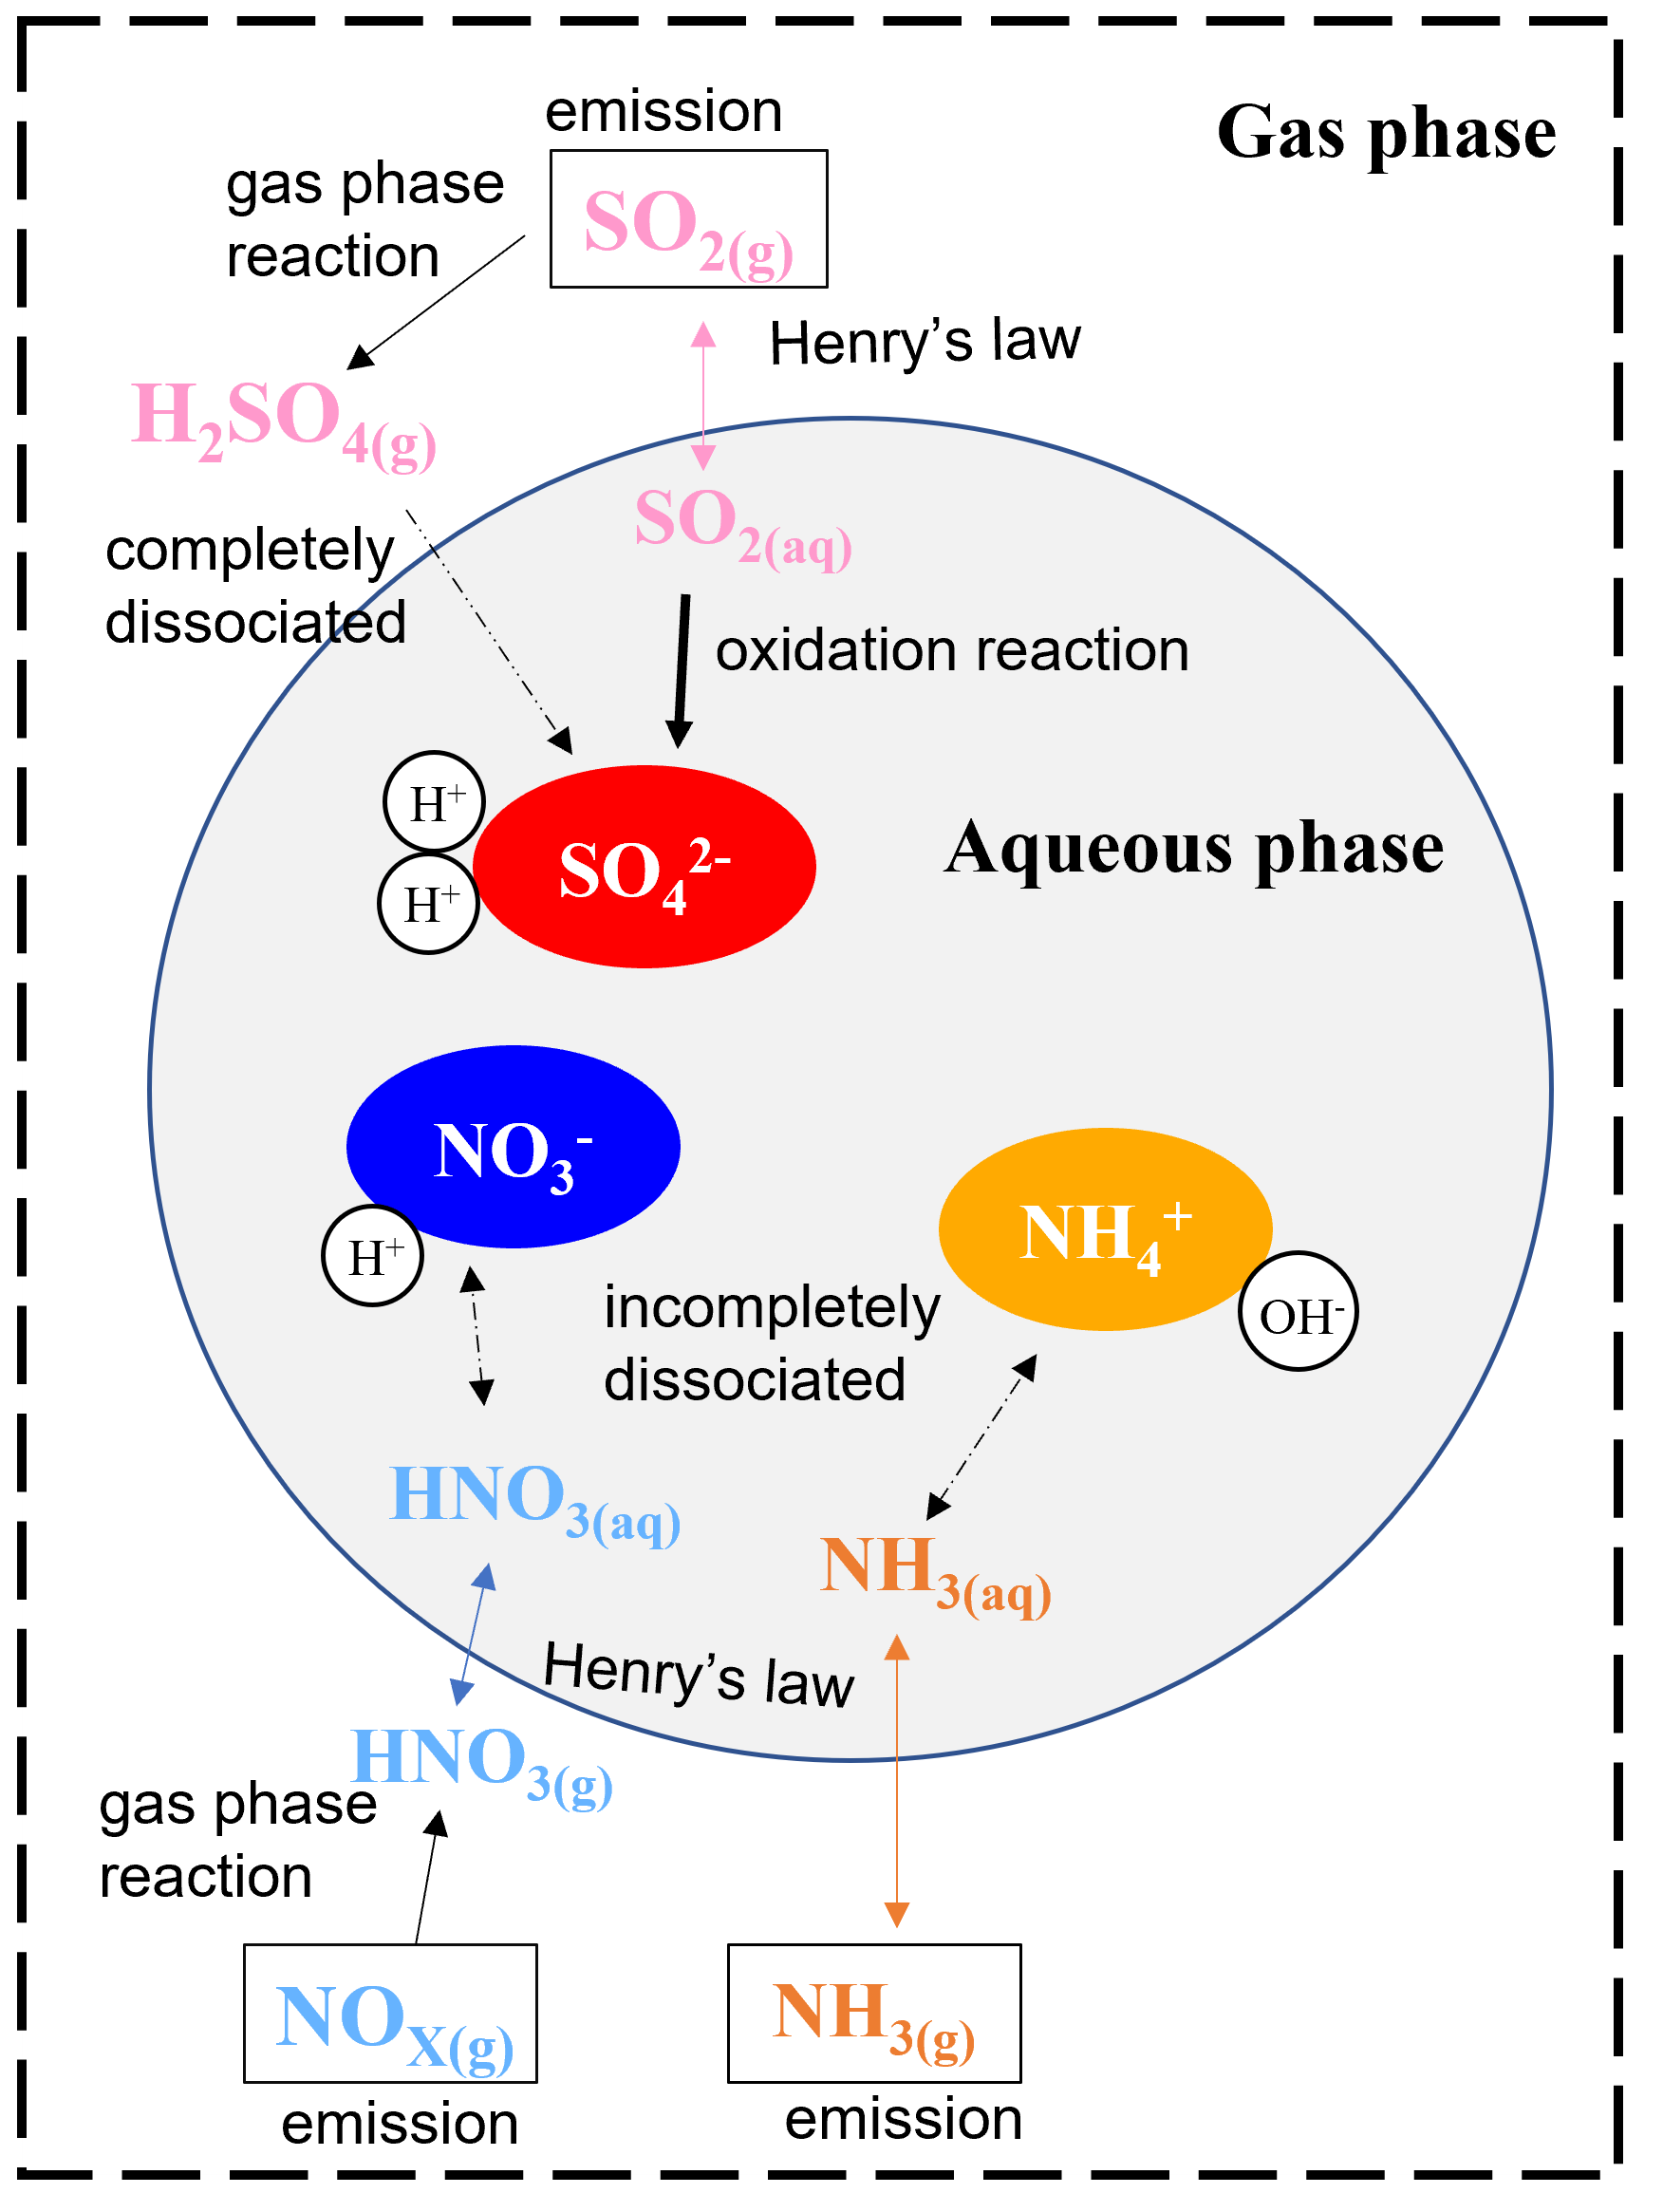
Sulfate is formed through gas-phase and aqueous oxidation of sulfur dioxide (SO2) emitted from sources like coal power plants and industrial processes, while nitrate is produced via the oxidation of nitrogen oxides (NOx), mainly emitted from traffic. Ammonium can be formed through the partitioning between the aqueous and gas phases of ammonia (NH3) emitted from agricultural and industrial sources. The overall sulfate–nitrate–ammonium formation processes are illustrated in Fig. 1. In addition to the gas-phase reaction with OH radicals, SO2 can also be oxidized by oxidants, such as hydrogen peroxide (H2O2) or ozone (O3) in the aqueous phase. Due to the low-volatility and high-dissociation constant of sulfuric acid, most sulfuric acid is in the condensed phase and dissociates in aqueous particles. Ammonia and nitric acid are semi-volatile, so their dissolution in particles is determined by their Henry's law constant and dissociation constants. The presence of acid for ammonia or base for nitric acid can promote individual dissolution (Seinfeld and Pandis, 2006). The interaction of sulfate, nitrate, and ammonium is vital in determining the quantity of PM.
Human activities and natural sources are responsible for releasing the inorganic aerosol precursors, i.e., SO2, NOx, and NH3. Reducing these emissions might mitigate PM2.5 levels, thus improving air quality. Numerous studies have investigated emission reduction strategies, with a focus on NH3 reductions showing promise in decreasing PM2.5 levels (Chen et al., 2019; Gu et al., 2021). Liu et al. (2019) used the Weather Research and Forecasting (WRF) model coupled with Chemistry (WRF-Chem) model to investigate emission reduction strategies in China and found that reducing SO2 and NOx emissions alone does not significantly reduce total PM2.5 levels. However, including controls for NH3 emissions can reduce PM2.5 by approximately 11 %–17 % but with the potential risk of exacerbating acid rain. Derwent et al. (2009) employed a photochemical trajectory model to simulate PM concentrations in the UK with 30 % reduction in NH3, SO2, NOx, volatile organic compounds (VOCs), and CO emissions. In an ammonium-limited environment (southern UK), NH3 emissions reductions had the most significant impact on PM reduction, exhibiting a non-linear dynamic effect.
In Taiwan, secondary inorganic aerosol constitutes 30 %–53 % of PM2.5, with sulfate, nitrate, and ammonium contributing significantly (16 %–32 %, 2 %–24 %, and 6 %–12 %, respectively) (Chuang et al., 2021). PM2.5 concentrations in Taiwan are usually higher in winter than in summer due to the meteorological conditions and the planetary boundary layer height. This effect is especially pronounced on the leeward side of the prevailing northeast monsoon in winter (i.e., western Taiwan), where PM2.5 concentration accumulation is more significant (Hsieh et al., 2022; Hsu and Cheng, 2016; Lai and Lin, 2020). Even though PM2.5 concentration has decreased over the past 2 decades (Cheng and Hsu, 2019; Chuang et al., 2021), the current PM2.5 reduction effort might not efficiently meet the standard set by the Taiwan Ministry of Environment (TW-MOENV), namely a 24 h standard of 35 µg m−3 and annual level of 15 µg m−3. Given the complex interactions among secondary inorganic components and their substantial contribution to total PM in Taiwan, further research is imperative.
To study air pollution in Taiwan, we employed the Community Multiscale Air Quality (CMAQ) model, which is recognized for its comprehensiveness in simulating atmospheric chemical processes. The CMAQ model incorporates various chemical processes, including photolysis, multiphase chemistry, aerosol microphysics, aqueous chemistry in clouds, and cloud formation on particles (Byun and Schere, 2006). It is widely used to assess air pollutants on a regional scale and helps us understand the changes in and mechanisms of pollutants under different scenarios. This study focuses on investigating the formation of secondary inorganic species, specifically sulfate, nitrate, and ammonium, during winter in Taiwan. By understanding the contribution of each composition contribution from different processes and their interaction, the reduction efficiency and cost of each aerosol precursor (i.e., SO2, NOx, and NH3) in mitigating PM2.5 are evaluated.
2.1 CMAQ model
The Community Multiscale Air Quality (CMAQ) model, using the WRF model for meteorological conditions, was applied to simulate the concentrations of various chemical species over Taiwan. The WRF model version 3.7.1 (Skamarock et al., 2008) was initialized using a cold start and simulated the period from 28 November to 31 December 2018, with the analysis focusing on December only. Four nested domains, as shown in Fig. S1a in the Supplement, were creased with horizontal resolutions of 81, 27, 9, and 3 km and a total of 45 vertical layers. The outer domain covers most of East Asia and the western Pacific, while the inner domain was dedicated to Taiwan.
The CMAQ model version 5.2.1 (Byun and Schere, 2006; Wyat Appel et al., 2018) was set up using the same horizontal grid structure as WRF but with 15 vertical layers that reflect 7 layers under 1500 m and the top layer ∼ 17 km above the ground. The inner domain of CMAQ consists of 135 × 90 grid cells. The chemical mechanism used in the simulations was the Carbon Bond Mechanism, version 6, and the aerosol module, version 6, with aqueous chemistry (cb6r3_ae6_aq). Emission data for Taiwan were from the Taiwan Emission Data System (TEDS9.0), based on 2013 data. TEDS9.0 provides comprehensive information on various sources of pollutants in Taiwan, including industrial processes, transport, energy production, and residential activities. Hourly model output data allowed for detailed temporal analysis. Additional details on the model configuration, including physical and chemical mechanisms, are summarized in Tables S1 and S2.
2.2 Observation data in Taiwan
The simulated data of the control run were compared with observations from ground-based monitoring stations to validate the model outputs. Hourly meteorological parameter (air temperature, relative humidity, and wind field) and pollutant (CO, O3, and PM2.5) data were collected from the TW-MOENV air quality monitoring stations. Four stations along the western coast of Taiwan (Fig. S1b), including Tamsui (25.16° N, 121.45° E), Shalu (24.23° N, 120.57° E), Taixi (23.72° N, 102.20° E), and Qianzhen (22.61° N, 120.31° E) stations, were selected for comparisons of wind fields and PM2.5 concentrations. Additionally, intensive observation data using filter sampling were obtained from Shalu (24.24° N, 120.57° E), Chung Shan Medical University (24.12° N, 120.65° E; CSMU), Zhushan (23.76° N, 120.68° E), and Xitou (23.67° N, 120.80° E) in central Taiwan from 1 to 21 December 2018. These data provided further insights into PM2.5 and its components. Sampling occurs from 09:00 to 18:00 LT for daytime samples and from 21:00 to 06:00 LT (next day) for nighttime samples. Inorganic ions were analyzed using ion chromatography (IC). More details on the analytical methodology can be found in Chen et al. (2021) and Lee et al. (2019).
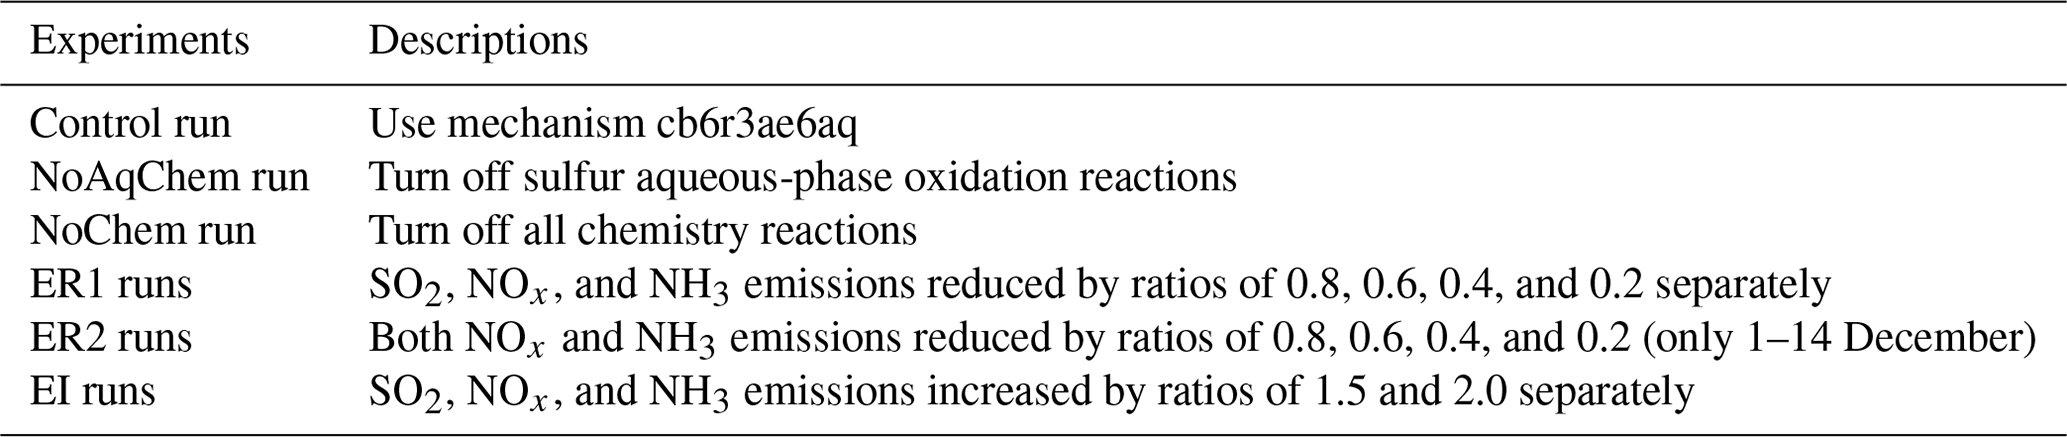
2.3 CMAQ experimental design
To evaluate the contribution of the sulfate pathway and the impact of aerosol precursor emission reduction on mitigating PM2.5 levels, we designed the following two series of experiments.
2.3.1 Sulfate sources
The local sulfate in PM2.5 (PM-sulfate) can be contributed from transport and local gas-phase and aqueous-phase chemical reactions. To assess the contribution of each source to the local PM-sulfate within the inner domain, adjustments were made to the chemical reaction module within the CMAQ chemistry–transport model (CCTM). This analysis involved two simulations: the “NoAqChem run” and “NoChem run”. In the NoAqChem run, sulfur aqueous-phase oxidation reactions, including S(IV) oxidation by O3, H2O2, organic peroxides, and metal ion catalysis (Jacobson, 1997), were turned off. In the NoChem run, all chemical reactions in CMAQ were disabled. By comparing the PM-sulfate of these simulations with the control run, the contribution fractions of gas-phase (Fgas) and aqueous-phase (Faq) reactions to local PM-sulfate were evaluated using the following equations:
2.3.2 Emission reduction efficiency
Our study assessed variations in PM2.5 and major inorganic composition concentrations resulting from emissions reductions. Specifically, we focused on modifying SO2, NOx, and NH3 emissions proportionally, as these are key aerosol precursors forming sulfate, nitrate, and ammonium in aerosols. The emissions of SO2, NOx, and NH3 are 1.18 × 10⁶, 4.61 × 10⁶, and 1.77 × 10⁶ t yr−1, respectively, based on the applied emission inventory. Emissions were reduced individually at intervals of 0.2 (i.e., 0.8 ×, 0.6 ×, 0.4 ×, and 0.2 × of the control-run emissions) in the inner domain, labeled as the “ER1 runs”. Additionally, the effects of potential earlier emission quantities were explored by increasing emissions at 0.5 intervals (i.e., at 1.5 × and 2.0 × of the control-run emissions), referred to as “EI runs”. Considering the interplay between nitrate and ammonium due to the acid–base balance, we conducted “ER2 runs”, reducing both NOx and NH3 emissions at 0.2 intervals. Notably, “ER2 runs” cover the first half of December (from 1 to 14 December) to save computing resources, while other simulations encompassed the entire month. Table 1 provides a summary of all simulation settings.
The variation in aerosol composition and PM quantity based on emission adjustment is evaluated to assess the sensitivity and effectiveness of emission reduction. Following Takahama et al. (2004), a dimensionless sensitivity coefficient (SX,Y) was introduced to evaluate the potential impacts of X emission reduction on Y (nitrate or PM2.5) as follows:
where EX represents the specific emission of SO2, NOx, and NH3. Δ(var) is the difference between vari and vari−1, i.e., two adjacent points. For Y = nitrate, the sensitivity is sensitive to NOx or NH3. A higher response among the given emission reductions indicated the properties of the environment, such as NOx-sensitive or NH3-sensitive (Petetin et al., 2016). This framework can also assess the potential sensitivity of emission reductions in the PM2.5 concentration (i.e., Y = PM2.5) for each emission. A higher sensitivity under EX reduction indicates that more significant PM2.5 mitigation can be achieved by controlling this emission.
2.4 Box model
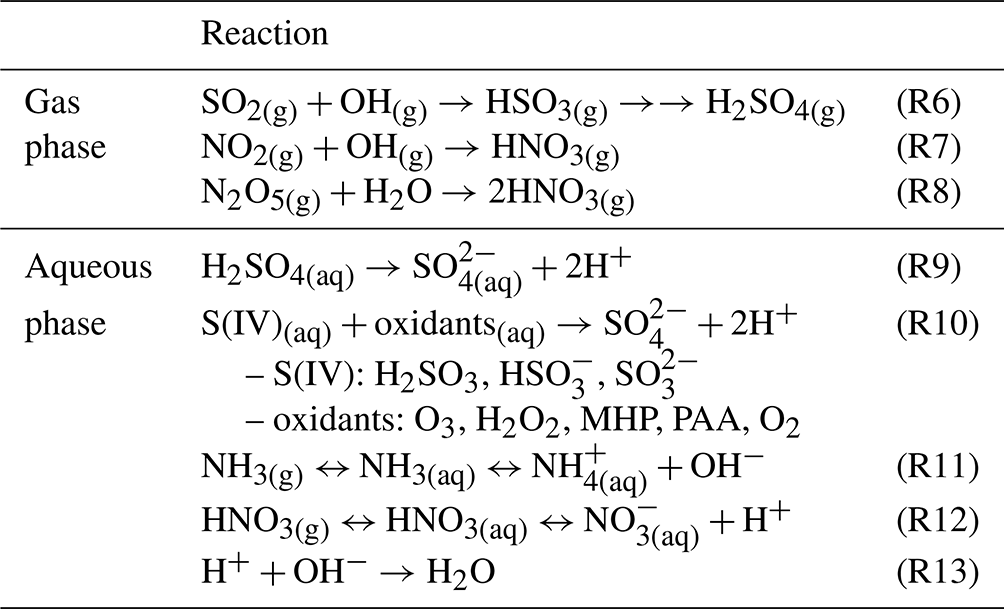
A simplified box model, constructed using Python, was developed to study the influence of NH3 emissions on sulfate formation, focusing specifically on the chemical reactions occurring in the aqueous phase. These reactions include the dissolution, oxidation, and dissociation processes (Reactions R10–R13 in Table 2). The model aimed to assess the impact of the ammonia emission reduction on sulfate formation, considering only chemical processes with fixed meteorological conditions and no physical transport. The box model conditions were adapted from a grid point of CMAQ within the planetary boundary layer that exhibited sufficient liquid water content (LWC). To retrieve the initial concentrations of reactants, the maximum concentrations of oxidants (O3 and H2O2) along the ammonia reduction profile were applied, with an equal amount of sulfate reverted to SO2. The input parameters, including air temperature (T), liquid water content, and concentrations of SO2, carbon dioxide (CO2), total nitric acid (HNO3), total NH3, H2O2, O3, S(IV), iron (Fe(III)), and manganese (Mn(II)), were from CMAQ and are summarized in Table S3. Similar to the aqueous-phase reactions in CMAQ, the dissolution of chemical components in water follows the equilibrium between the gas and aqueous phases controlled by Henry's constants. The initial pH value was calculated based on the acid–base balance and charge balance of the system, ensuring the consideration of different chemical species and their influence on the overall pH in the following equation:
At each time step, the model-calculated concentration changes based on the oxidation reactions, and the pH value was recalculated at the new equilibrium state. The oxidation reactions considered in the box model are as follows (Seinfeld and Pandis, 2006):
The rate constants for these reactions are summarized in Table S4.
Table 2The applied chemical reactions related to the formation of sulfate, nitrate, and ammonium.
Two sets of experiments were conducted to compare the results with those from the CMAQ simulations. These experiments were conducted by gradually reducing NH3 emissions in 0.1 × intervals. The first set exclusively considered the oxidation reactions of S(IV) by O3 and H2O2 (i.e., Reactions R1 to R4), while the second set included additional oxidation reactions of S(IV) by O2, catalyzed by iron and manganese (i.e., Reaction R5). The time step of these experiments was set to 0.05 s, and results from a 10 min run were analyzed. The oxidation reaction levels ranged from 65.1 % to 99.9 % of the 1 h reaction, depending on the emission reduction ratio. The box model results reflect the impact of the ammonia emission on sulfate formation under specific conditions. However, the composition of a grid box in CMAQ is influenced by chemical processes and transport, so the overall results between the box model and CMAQ may not match precisely.
2.5 Mitigation efficiency and cost estimation
To evaluate the effectiveness of PM2.5 reduction, we employed an exponential function to fit PM2.5 concentration as a function of the emission adjustment ratios ranging from 0.2 × to 2.0 × of control-run emissions. The derivative of PM2.5 concentration or the quantity of a specific component (Y) with respect to emissions was applied to assess the emission reduction efficiency of X (where X can be SO2, NOx, or NH3), which is denoted as follows:
The cost of the PM2.5 reduction is evaluated by dividing the marginal abatement cost (MAC) by the PM2.5 reduction efficiency (obtained from Eq. 5 with Y as PM2.5) as follows:
The applied MAC values are USD 421–1630 t−1, USD 8152–9570 t−1, and USD 1318–1400 t−1 for SO2, NOx, and NH3, respectively, based on the studies of Gu et al. (2021) and Kaminski (2003).
3.1 Model performance
3.1.1 Meteorology
The comparison between WRF model results and TW-MOENV observations is presented in Tables 3 and S5, providing a comprehensive overview of monthly mean values, correlation coefficients (r), mean bias errors, the mean absolute error, the mean fractional bias, and mean fractional errors. Notably, the correlation coefficients for air temperature consistently exceed 0.8 across all four stations, showcasing a robust agreement. For relative humidity, the correlation coefficients range from 0.71 to 0.86, indicating a good alignment between observation and model results. For wind speed, the correlation coefficients range from 0.42 to 0.85 at these stations. The mean bias error at Shalu and Qianzhen meets the criteria suggested by Hu et al. (2016), while the mean absolute error at Tamsui, Shalu, and Qianzhen also meets the criteria. At Taixi, the model tends to be underestimated, resulting in a higher mean absolute error. Overall, these findings demonstrate satisfactory model performance.
Table 3Statistic of wind and PM2.5 of MOENV observation and model simulation for four stations.
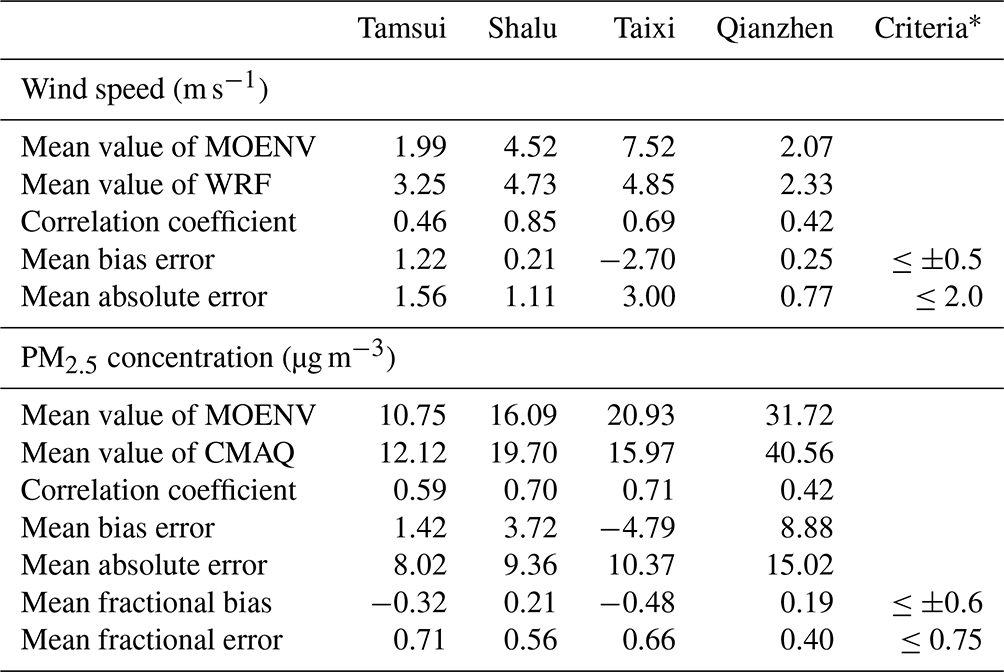
∗ The criteria are suggested by Hu et al. (2016). Correlation coefficient = . Mean bias error = . Mean absolute error = . Mean fractional bias = . Mean fractional error = , where mi and oi are the wind speed or concentrations of model and observation at time i, respectively, and and are the average values over December 2018.
Wind fields play a critical role in the dispersion of air pollutants, affecting their transport and spatial distribution, not only for wind speed but also for wind direction. Figure S2 illustrates that the model reasonably captures the prevailing winter wind patterns, characterized by predominant winds blowing from the northeast. Although discrepancies in wind speed exist, with slight underestimations in Taixi and overestimations in Tamsui, Shalu, and Qianzhen, the overall trend of strong and weak winds is consistent between the model and observations.
3.1.2 Air pollutants
Table S5 also provides statistical results for pollutants. The correlation coefficients between the observation and model range from 0.46 to 0.62 for CO and from 0.58 to 0.84 for O3. The mean bias errors are higher for both CO and O3, likely due to a significant underestimation of CO and an overestimation of O3 in the model results. For PM2.5, the model exhibits good agreement with observations, capturing similar concentration patterns. Specifically, lower PM2.5 concentrations were observed under more vital northeasterly wind conditions, while weaker northeasterly winds or winds from other directions corresponded to higher pollutant concentrations. The correlation coefficients for the PM2.5 concentration range from 0.42 to 0.71, and the mean fractional bias and mean fractional error for PM2.5 are within the acceptable criteria (Table 3), affirming the model's reliability (Fig. S2).
For the spatial distribution of PM2.5, high-pollution levels are primarily concentrated in western regions, corresponding to densely populated areas (Fig. S3a). The PM2.5 concentration gradually increases from north to south, mainly over flat land areas. To assess the regional distribution, we used the area average concentration and partitioning of PM2.5, based on TW-MOENV's pollutant zone classification (Fig. S3b), focusing on areas with elevations that are less than 200 m above sea level (a.s.l.) to avoid complexities in terrain. The partitioning of PM2.5 is similar across regions, with secondary inorganic components constituting more than half of the PM2.5.
This study focuses on central Taiwan, specifically the marked red area on the map (Fig. S3b). In the control run, the surface layer mean PM2.5 in central Taiwan shows a similar pattern to nitrate and ammonium, while sulfate has some slight differences (Fig. S4). The correlation coefficient between PM2.5 and sulfate, nitrate, and ammonium is 0.65, 0.96, and 0.95, respectively. Given the high correlation between nitrate and ammonium (r = 0.98) and the significant contribution of nitrate to PM2.5 concentrations in Taiwan, nitrate emerges as a major contributor to PM2.5. Additionally, we observe that pollutant concentrations are related to the wind strength. Combined with Shalu's wind field time series, representing the environmental wind in central Taiwan, nitrate, ammonium, PM2.5, and wind speed show a certain negative correlation, while sulfate is less affected. This suggests that gaseous HNO3 and NH3 accumulate locally during weak wind conditions, facilitating the transformation of nitrate and ammonium into aerosol particles.
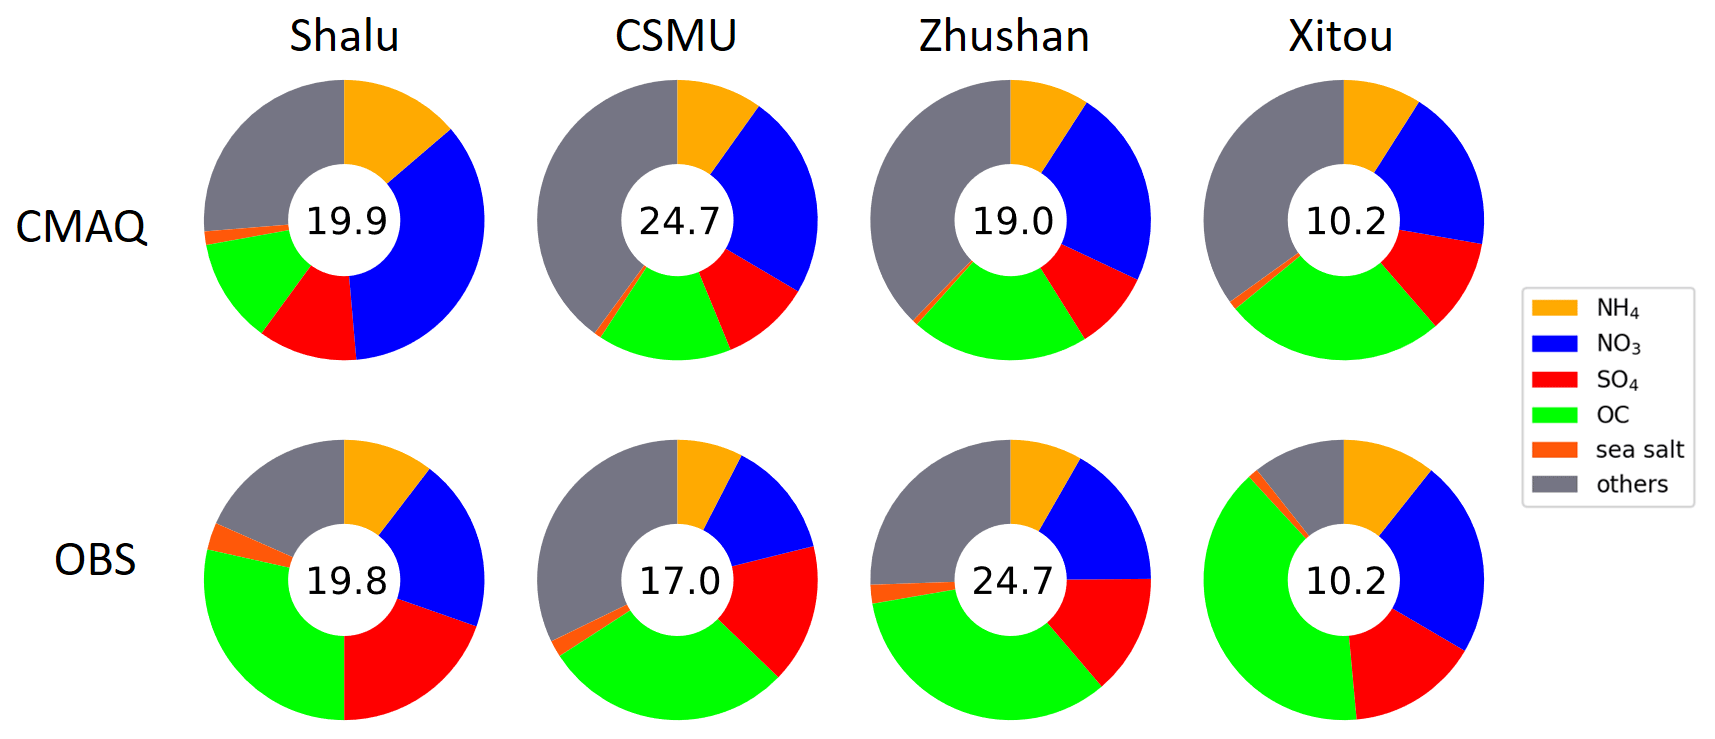
Figure 2Comparison of PM2.5 components between intensive observation data and CMAQ surface layer data for four sites (PM2.5 concentration indicated inside the circle in µg m−3). Individual components are shown in the legend, with colors arranged in a clockwise direction from the top. Conditions shown are the mean values from 1 to 21 December 2018 for each station (OBS) or grid point (CMAQ).
The correlation coefficients of PM2.5 between the observation and model at Shalu and CSMU are 0.76 and 0.65, respectively, demonstrating the consistency of model results for the concentration and change trend at these two stations (Fig. S5). However, the correlation between observation and model at Zhushan and Xitou is poor, likely due to the influence of the complex topography at these two places. Further analysis in Fig. S6 presents the trends and correlation coefficients for PM-sulfate, PM-nitrate, and PM-ammonium across the four stations. The data reveal a slight underestimation trend for PM-sulfate, particularly at Shalu and Zhushan. The simulation for PM-ammonium appears reasonably accurate, whereas PM-nitrate shows a tendency for overestimation. The simulated proportions of PM-sulfate, PM-nitrate, and PM-ammonium formation by CMAQ are 9.1 %–11.4 %, 18.7 %–34.9 %, and 9 %–13.7 %, respectively. In contrast, the observation data indicate that the proportions of PM-sulfate, PM-nitrate, and PM-ammonium formation are 13.9 %–19.6 %, 16.6 %–22.8 %, and 7.6 %–10.7 %, respectively (Fig. 2). Considering the spatial heterogeneity of PM2.5, our analysis focuses on examining the composition of PM2.5 rather than emphasizing the differences between the model outputs and observational data. Overall, in central Taiwan's average model data and single-point observation data, secondary inorganic aerosols account for approximately half of the concentration of PM2.5, with nitrate being the highest contributor.
3.2 Sulfate formation pathways
With the analysis of NoAqChem and NoChem runs, the mean contributions to sulfate in central Taiwan are as follows: 13.2 % from gas reactions, 30.5 % from aqueous reactions, and 56.3 % from other processes. These other processes include transport from the domain boundary, locally emitted primary sulfate (constituting less than 5 % of the SO2 emissions), and alterations of deposition. The analysis for other areas is summarized in Table S6, with all chemical processes accounting for less than 50 % of the contributions. The major aqueous reactions occur in the cloud, typically with higher cloud water content (QC). Comparing the time series of the average cloud water content in the boundary layer (Fig. S7a) shows that high QC corresponds to dominant aqueous chemical processes in sulfate formation. The correlation coefficient between QC and the sulfate difference (control run – NoAqChem run) is 0.65, indicating the significant contribution of aqueous-phase chemical processes. Additional correlation coefficients of the PM composition and meteorological parameters are detailed in Table 4. Nitrate and ammonium concentrations exhibit a stronger relationship with the wind field, while the sulfate concentration is more influenced by the occurrence of aqueous-phase chemistry, specifically the amount of cloud water content in the atmosphere. In addition, the contribution of aqueous chemical processes is highly correlated with sulfate concentration in the control run, particularly during periods of elevated sulfate levels. However, these changes in sulfate have an insignificant impact on nitrate, ammonium, and PM2.5 (Fig. S4). Given that nitrate constitutes a significant proportion of PM2.5 during the winter in Taiwan, our results suggest that the overall trend of total PM2.5 is more closely associated with the wind patterns (ventilation efficiency with nitrate formation) rather than solely the contributions from sulfate formed via aqueous-phase chemistry.
Table 4Correlation coefficients of PM2.5, sulfate, nitrate, ammonium, and meteorological parameters (WS and QC) of the control run for central Taiwan.
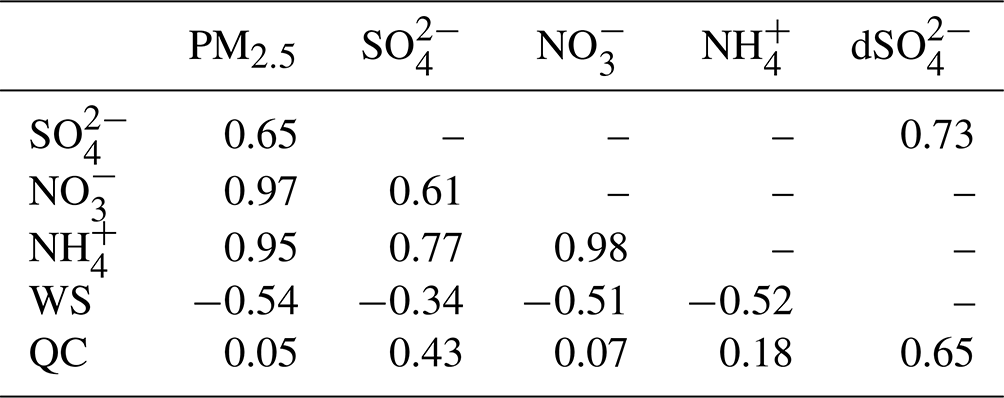
WS is the single-point wind speed of the surface layer in Shalu. QC is the average cloud water within the planetary boundary layer in central Taiwan. dSO is the sulfate difference concentration (control run – NoAqChem run).
3.3 Emission effects on surface layer PM2.5
3.3.1 Trends in concentration
The impact of the emission adjustments on PM2.5 and its components in central Taiwan is shown in Fig. 3. PM2.5 and secondary inorganic components show a decreasing trend as the emission ratio is reduced. When the emission ratio exceeds 1, the variation in PM2.5 is relatively flat compared to when the emission ratio is below 1. This indicates a higher PM2.5 mitigation efficiency for future emission reduction. Reductions in SO2 primarily decrease sulfate and ammonium, while NOx reductions affect nitrate and ammonium. Conversely, NH3 reductions decrease ammonium, nitrate, and sulfate levels. Since SO2 is a precursor to sulfate, reducing SO2 decreases sulfate formation, consequently modifying the ammonia partition and decreasing ammonium concentration (Tsimpidi et al., 2007). The negligible impact on nitrate can be attributed to nitric acid partition processes, which are affected by particle acidity and available aerosol water content. With decreased ammonium and sulfate, the available water content in aerosols decreases, adversely influencing nitric acid partitioning to aerosols. Although reduced sulfate formation promotes more nitric acid partitioning, thermodynamic calculations indicate that the reduced water content leads to a decline in the dissolved nitrate.
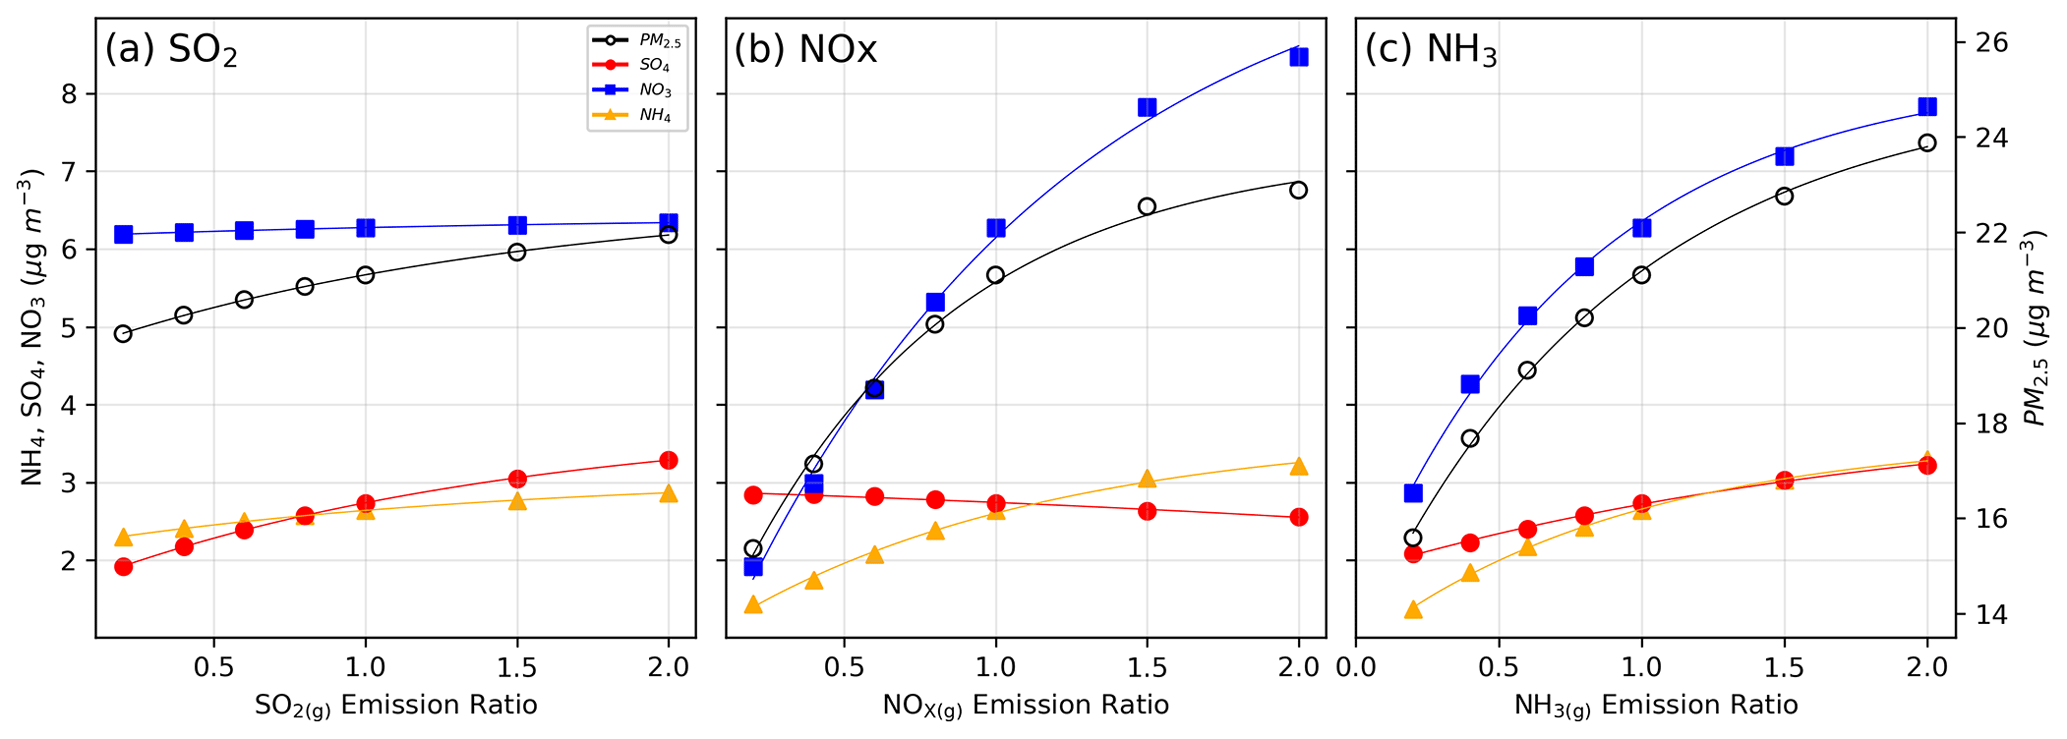
Figure 3The response of PM2.5 and major secondary inorganic components (sulfate, nitrate, and ammonium) to the emission ratio of (a) SO2, (b) NOx, and (c) NH3. Lines are the fitting results using an exponential function. Conditions shown are the average data for December 2018 at the surface layer of central Taiwan.
For NOx, reducing NOx emissions results in a lower HNO3 formation, leading to a significant reduction in PM-nitrate. The decreased acidity contribution from nitric acid alters the partition of ammonia, causing a decrease in ammonium. In contrast, the slight increase in sulfate formation may be attributed to enhanced chemical processes under lower NOx conditions. Reducing NOx emissions consumes less OH, a major pathway for HNO3 formation during the daytime, as depicted in Reaction (R7) of Table 2. The increased availability of OH can enhance the oxidation of SO2 to form sulfuric acid through Reaction (R6) in Table 2 (Derwent et al., 2009).
Regarding NH3 emission reduction, NH3 primarily acts as a base, influencing the dissolution of volatile acids such as HNO3. Since nitrate has a higher molecular weight than ammonium, the most significant decrease in mass concentration is observed for nitrate. Sulfuric acid, with negligible volatility, predominantly remains in the aerosol phase. The observed decrease in sulfate is likely due to altered chemical processes influenced by NH3, particularly the aqueous reactions. The interplay between NH3 reduction and sulfate formation will be discussed in more detail in Sect. 3.4.
With the significant PM2.5 mitigation attributed to NOx or NH3, the response of PM2.5, sulfate, ammonium, and nitrate at various levels of NOx and NH3 reduction is shown in Fig. S8. For a given reduction in NOx (or NH3), the trends of interested species as a function of NH3 (or NOx) are consistent with the case discussed in Fig. 3. When both emissions are reduced, the contour of PM2.5 is concave upward, indicating that the mitigation efficiency is less than the linear combination of individual influence on PM2.5. A similar pattern is observed for PM-nitrate and PM-ammonium, while PM-sulfate exhibits relatively smaller and different changes. These results suggest that changes in PM2.5 concentration are mainly dominated by nitrate and ammonium, with sulfate having a minor effect on the studied environment. The deviation from the linear combination of individual contributions might be due to the variation in the partitioning between gas and aerosol phases under different acidity levels. For example, NH3 might have an increased portion in the gas phase as NOx is decreased, while HNO3 would have a higher portion in the gas phase as NH3 is reduced. Further reduction in the other species would then reflect a higher portion reduction in gas-phase concentration and a lower portion reduction in PM-related species. Therefore, it can be inferred that as emission reductions reach a certain level, the available nitric acid or ammonia is continuously reduced to low-enough levels, potentially leading to a decline in the efficiency of the PM2.5 emission reduction (Veratti et al., 2023).
3.3.2 Sensitivity analysis
The sensitivity evaluation for different emission species on PM-nitrate and PM2.5 is shown in Fig. 4. In the case of PM-nitrate sensitivity, increases as the emission ratio decreases and reaches a maximum value of 0.83 at an emission ratio around 0.4–0.8 (using the control run as a base value). Subsequently, gradually decreases as the emission ratio continues to decrease. This transition is likely due to the available quantity of NO2 for HNO3 formation via the NO2 + OH reaction. In addition to being produced by chemical reactions, HNO3 concentration is also affected by the transported HNO3 from the domain boundaries. While the transported HNO3 concentration is relatively low compared to HNO3 produced by local NOx emissions in Taiwan, its proportion gradually increases as NOx emissions decrease. When the HNO3 concentration produced by the local chemical reaction is comparable to the transported concentration, the sensitivity coefficient decreases (detailed mathematical verification is provided in Sect. S1).
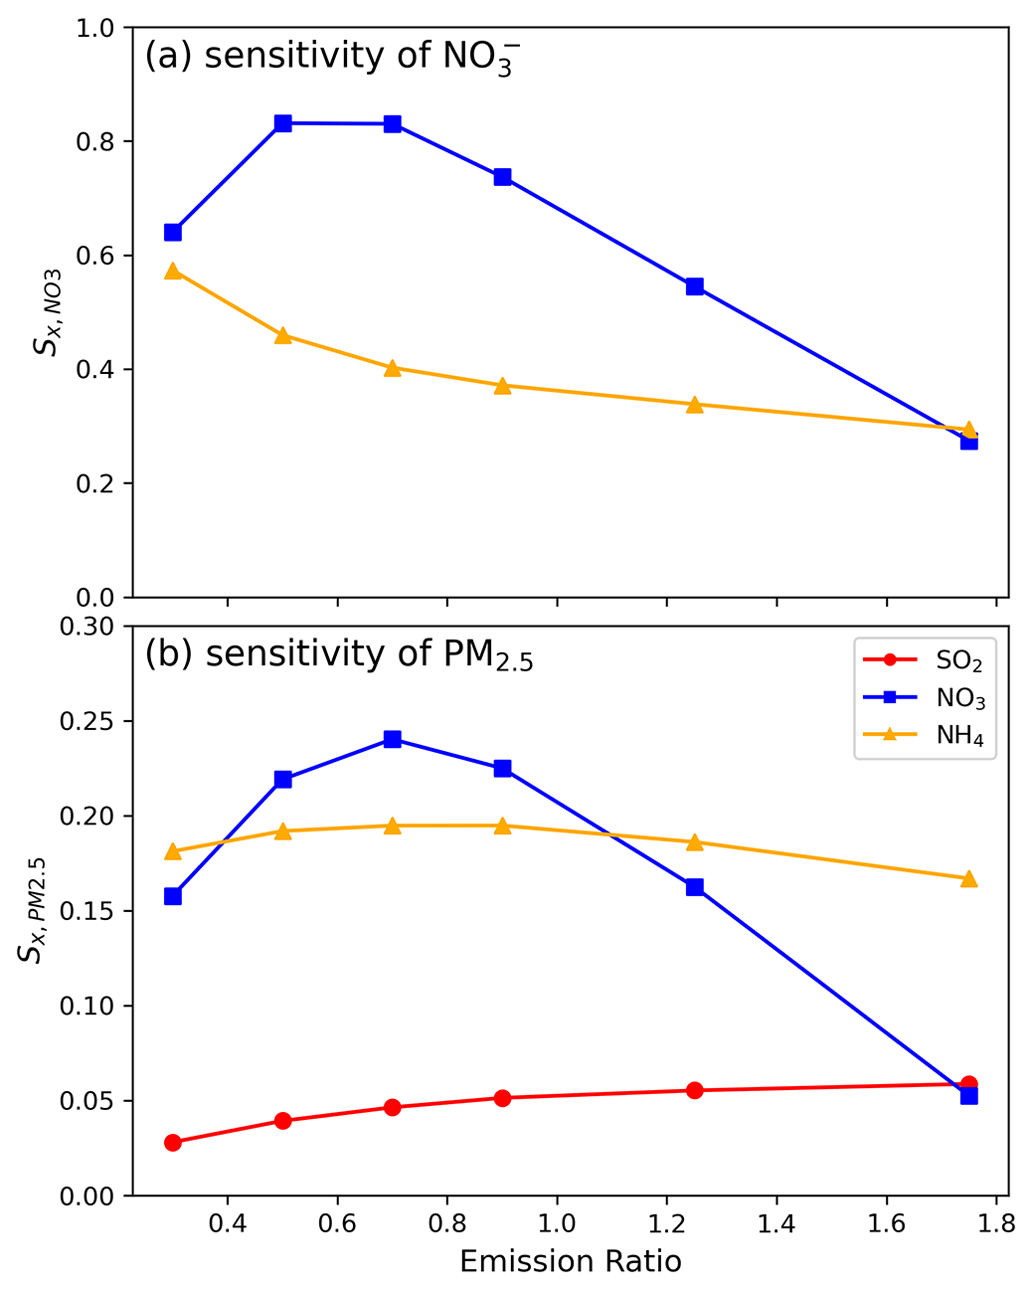
Figure 4(a) Nitrate sensitivity as a function of the emission ratio for NOx () and NH3 () and (b) PM2.5 sensitivity as a function of emission ratio for SO2 (), NOx (), and NH3 (). Data are calculated using the first-order difference, with the x axis representing the mean values of the two points involved in the differencing process. Conditions shown are the average data for December 2018 at the surface layer of central Taiwan.
In contrast, increases monotonically as the emission ratio decreases within the studied range, showing the significant influence of local NH3 emissions on PM-nitrate quantity. In the studied environmental context, a higher than indicates that the PM-nitrate is more sensitive to NOx emissions in central Taiwan. The sensitivity of PM-nitrate in the spatial distribution (Fig. S9a) shows that the major cities in western Taiwan and the southwest offshore are in a NOx-sensitive environment, while only the eastern region is biased toward NH3-sensitive, likely due to relatively low NH3 and NOx emissions.
As to the sensitivity on PM2.5, the influence of NOx emissions reduction () is similar to , as a reduction in NOx emissions primarily leads to a decrease in nitrate, exerting a dominant influence on PM2.5 concentration. and are relatively stable. gradually declines as the emission ratio decreases, while first increases as the emission ratio > 0.8 and then slightly decreases. For the overall emission ratio range studied, is around 0.19 ± 0.01, while has a wider range from 0.05 to 0.24, and is 0.05 ± 0.01. Under the studied condition (at the emission ratio of 0.9 in Fig. 4b), (∼ 0.05) is the lowest, while (∼ 0.23) and (∼ 0.2) are relatively higher, indicating that reducing NOx or NH3 emissions results in a more significant reduction in PM2.5 compared to reducing SO2 emissions. The sensitivity on PM2.5 in the spatial distribution (Fig. S9b) and the statistical data for each area (Table S7) show that is greater than in each air pollution zone, emphasizing the importance of the NOx reduction in improving PM2.5. However, in the northern, Chu-Miao, and central areas, and values are relatively similar. These areas have some white shading, indicating neutrality, and suggest that the reduction in NOx and NH3 emissions is equally important.
3.4 Emission effects on sulfate formation
3.4.1 Composite results in cloud
The observed decrease in sulfate levels with a lower NH3 emission ratio (Figs. 3c and S8b) is likely attributed to the modified cloud pH affecting aqueous-phase sulfate production (Redington et al., 2009), as NH3 emissions do not directly impact the gas-phase chemistry of SO2. To capture the critical features, composite results from grid points containing clouds with significant SO2 (i.e., a cloud water content ≥ 0.1 g kg−1 and SO2 concentration ≥ 1 ppbv when NH3 is at 0.2 ×) are depicted in Figs. S10 and S11 for land and sea regions, respectively. This categorization takes into account variations in pollutant levels between these two regions. The statistical summaries, including the mean, 25th percentile, and 75th percentile of cloud pH values and gaseous components, are provided in Table 5. While the mean pH values are higher over land than at sea, most grid points have a pH of 5, slightly below the average. Notably, grid points with lower pH values are predominantly characterized by NH3 deficiency, especially at sea, where the concentrations of NH3 are lower than on land.
Table 5Statistics of pH in cloud droplets and the concentration of gaseous components in both land (32 130 grid points) and sea (122 316 grid points) regions.
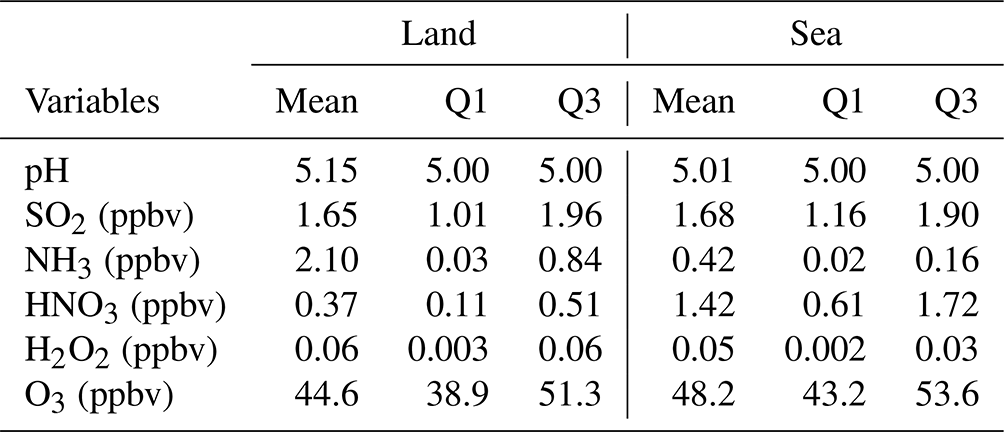
Mean is the arithmetic mean, Q1 is the 25th percentile, and Q3 is the 75th percentile.
The changes in chemical substances for both land and sea show consistent trends with emission reduction, featuring higher concentrations of sulfate at sea compared to on land. The pattern of sulfate formation in clouds (Figs. S10b and S11b) is consistent with the average concentrations in the surface layer (Fig. S8b), increasing with NOx emission reduction and decreasing with NH3 emission reduction. Conversely, the concentration change in SO2 is opposite that of sulfate due to the conservation of sulfur. A decrease in sulfate concentration implies that more sulfur remains as SO2 in the atmosphere, indicating weaker oxidation reactions. Furthermore, the reduction in NH3 also impacts primary oxidants involved in sulfur oxidation, namely H2O2 and O3. Intriguingly, the changes in H2O2 and O3 exhibit opposite trends in response to the NH3 emission reduction (Fig. S10c and d), suggesting a potential influence on their oxidation rates. The aqueous oxidation pathways of SO2 are strongly pH-dependent. The oxidation rate by H2O2 increases with pH < 3 and remains fairly constant at pH > 3 (Seinfeld and Pandis, 2006). The other three reactions (O3 and O2 catalysis by Fe(III) and Mn(II)) are pH-dependent and increase with pH. Overall, H2O2 oxidation is usually a major process. However, with an increase in pH, the oxidation rates of O3 and O2 catalysis via Fe(III) or Mn(II) might surpass that of H2O2 if high-enough Fe(III) or Mn(II) relative to H2O2 presents.
3.4.2 Case analysis of a single grid point
The condition of a grid point along the coast of Taichung (24.203° N, 120.5053° E; the second layer ∼ 68.5 m a.s.l.) at 08:00 LT on 3 December 2018 from CMAQ was selected for further analysis. This grid point fulfills our desired criteria, featuring a cloud water content of 0.376 g kg−1 and an SO2 concentration of 7.13 ppbv. Figure 5 shows the concentrations of SO2, H2O2, O3, and acidity (i.e., [H+] in cloud water, calculated from CMAQ output data) at this grid point as a function of NH3 and NOx emission ratios. With NH3 emission reduction, SO2 concentration increases significantly, especially when the NH3 emission ratio falls below 0.4, while the concentration decreases slightly as the NOx emission decreases. The pattern for acidity is similar to that of SO2, showing an increase as NH3 emissions decrease and a smooth decrease as NOx emissions decrease. This suggests a strong correlation between SO2 and acidity, likely due to a common influencing factor, NH3. As NOx emission decreases, the concentrations of both H2O2 and O3 increase due to changes in gaseous chemical reactions that reduce the consumption of OH and O3. When NH3 emissions decrease, O3 increases and H2O2 decreases. The trend might indicate that efficient SO2 oxidation via the O3 reaction dominates at a high NH3 emission ratio. With O3 in excess of SO2, all SO2 is completely reacted. As NH3 emission is reduced to less than 0.6 ×, the increased acidity significantly slows SO2 oxidation via the O3 reaction, causing the system to switch to H2O2 oxidation. Therefore, the initial conditions for the box model can be derived using H2O2 concentration from the control run, the O3 concentration from the NH3_02x run, and SO2 concentration as SO2 in the NH3_02x run, adjusted by adding H2O2 difference between the control run and the NH3_02x run to account for the consumed SO2 by the H2O2 oxidation reaction. The initial value of SO4 is calculated by subtracting the applied SO2 initial concentration from the total S (PM-sulfate + SO2 in the control run). A summary of the initial conditions is provided in Table S3.
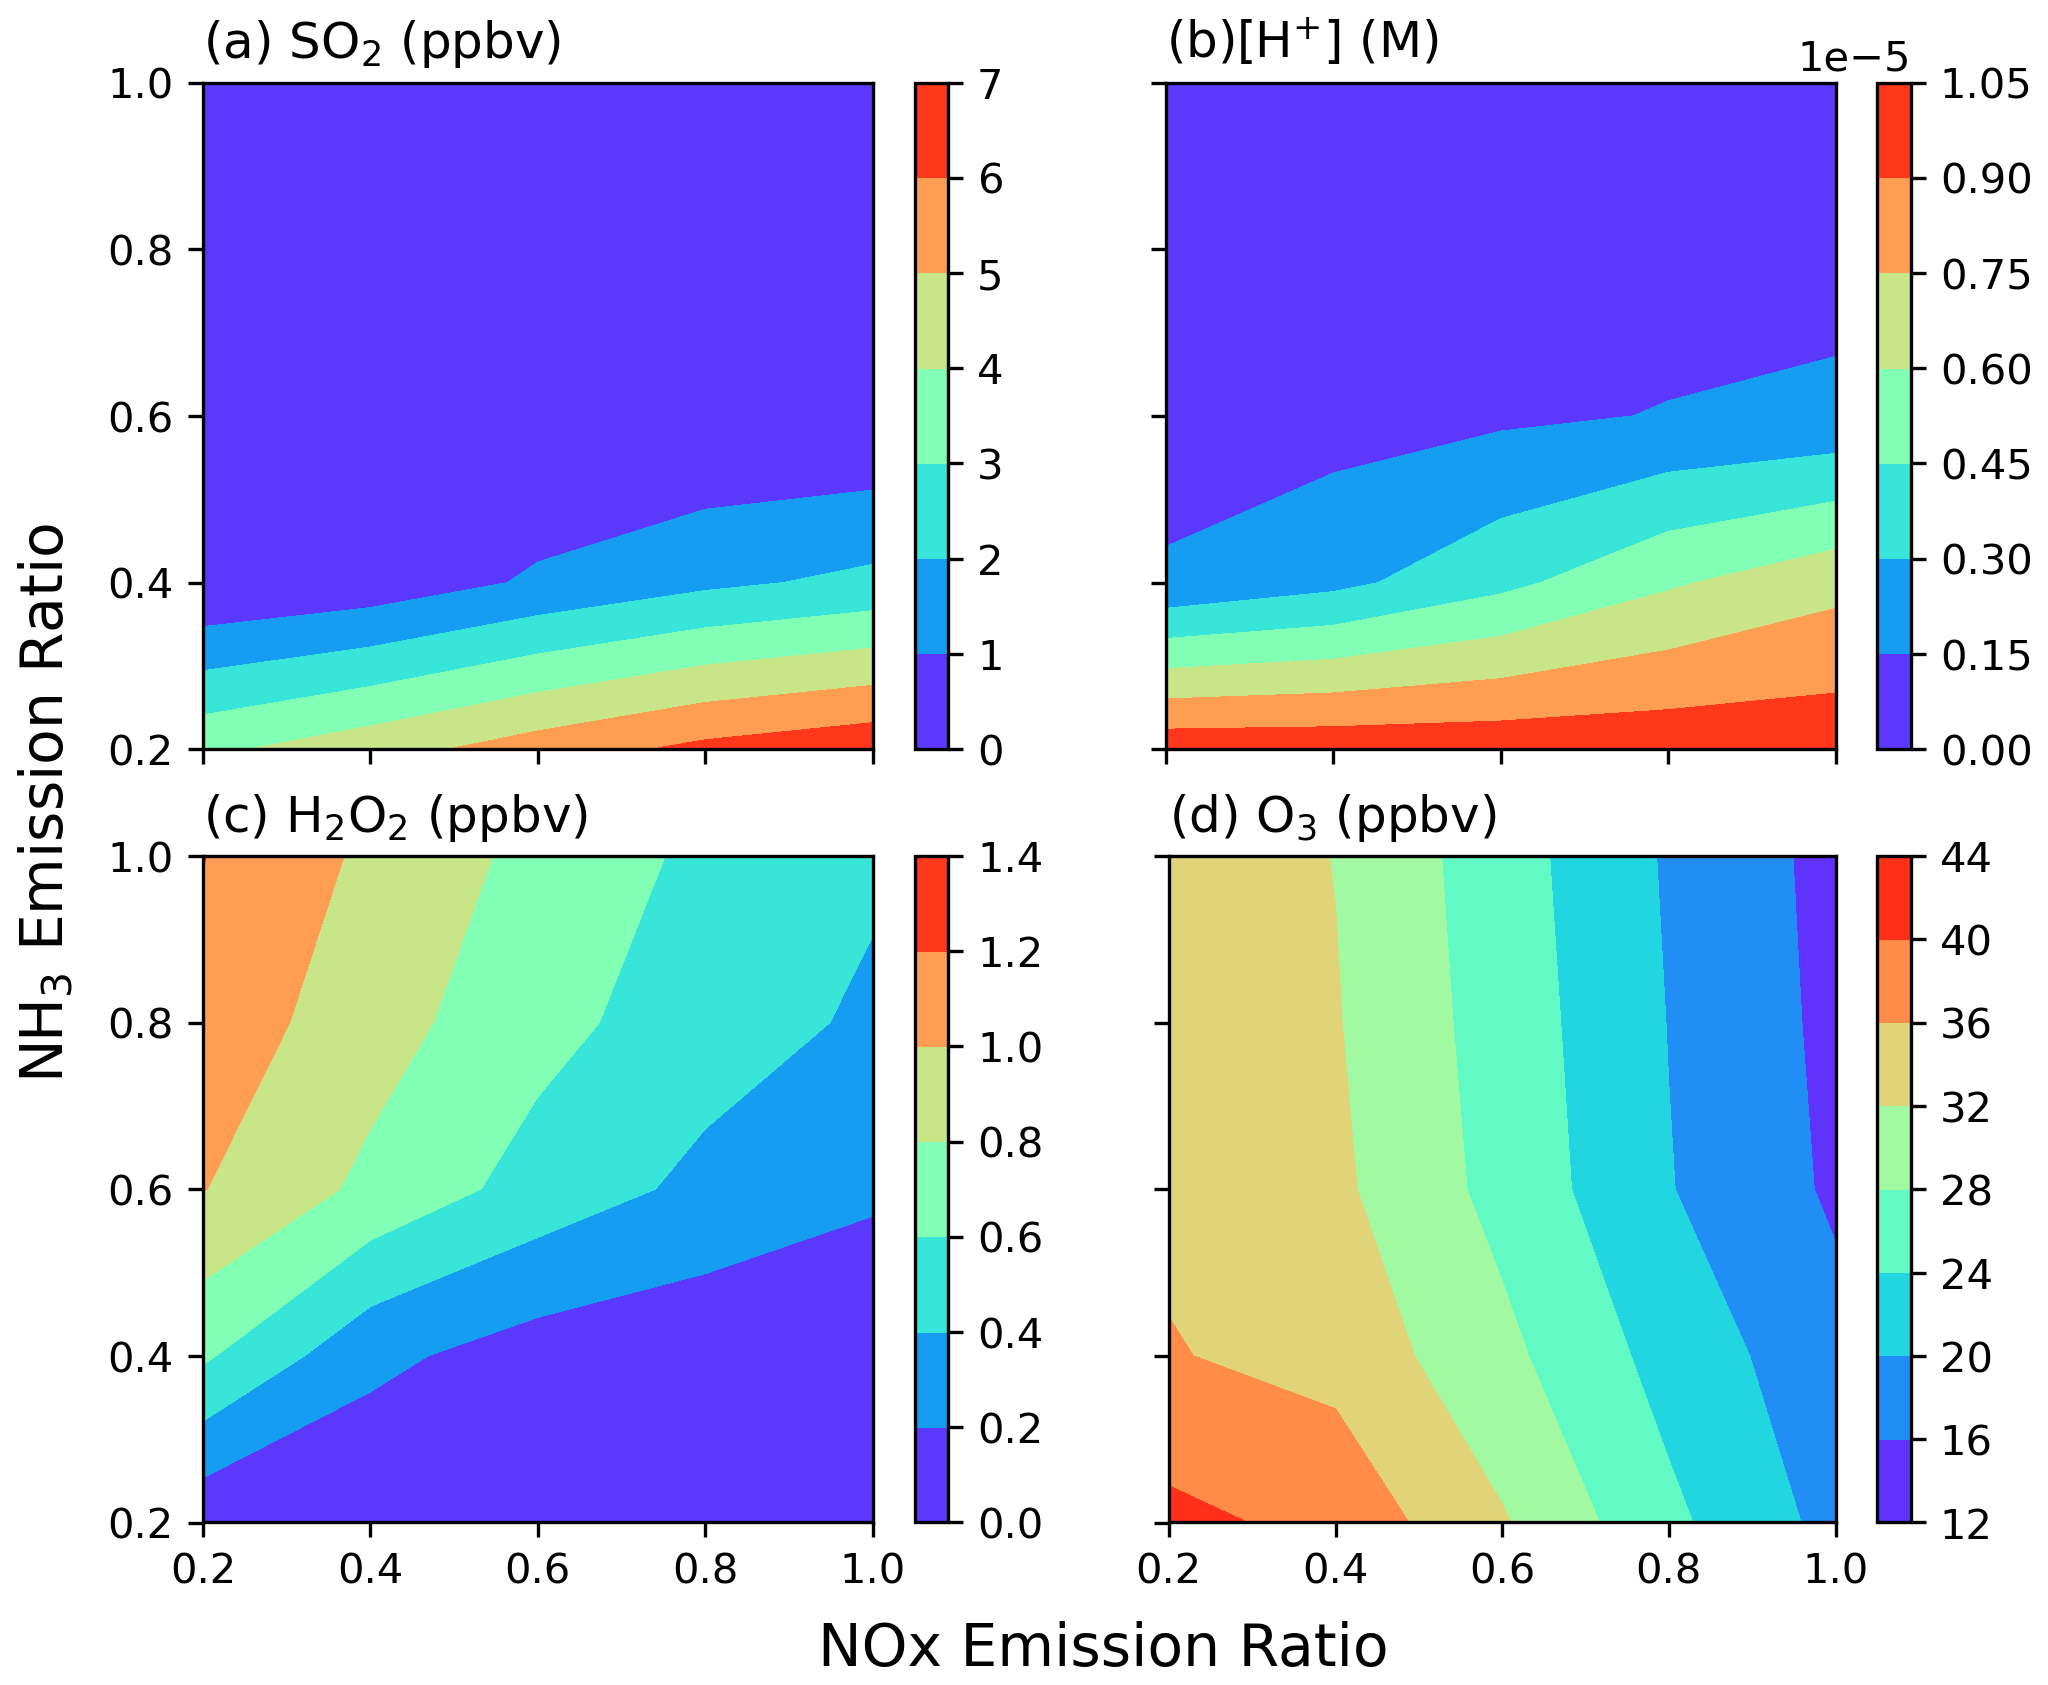
Figure 5(a) SO2, (b) H+, (c) H2O2, and (d) O3 concentrations as a function of NOx (x axis) and NH3 (y axis) emission ratios for a single grid point. Conditions shown are the data for 08:00 LT on 3 December 2018 at an altitude of 68.5 m a.s.l. (for the location of 24.2° N, 120.5° E).
Figure 6 shows the comparison between the box model results and corresponding CMAQ results. Considering the main aqueous-phase reactions involving O3 and H2O2, the box model findings demonstrate that as the initial total NH3 concentration decreases, the pH and H2O2 also decrease, while SO2 and O3 increase. These trends are consistent with the pattern observed in CMAQ but with some discrepancies. Specifically, in the box model, the concentration of SO2 tends to be slightly higher at lower NH3 emission ratios, whereas the concentrations of H2O2 and O3 are lower than CMAQ results. Introducing additional oxidation reactions, i.e., the oxidation of tetravalent sulfur by O2 with Fe(III) and Mn(II) catalysis in the system, brings the box model results closer to those of CMAQ. The box model demonstrates that higher NH3 concentrations lead to higher pH values, resulting in O3-dominated chemistry. The reduction in NH3 emissions can increase environmental acidity, slow O3 oxidation reactions, and gradually transition to an H2O2-dominated condition. However, in the studied environment, the concentration of H2O2 is lower than that of SO2, resulting in residual SO2 once H2O2 is depleted but causing a reduction in PM-sulfate.
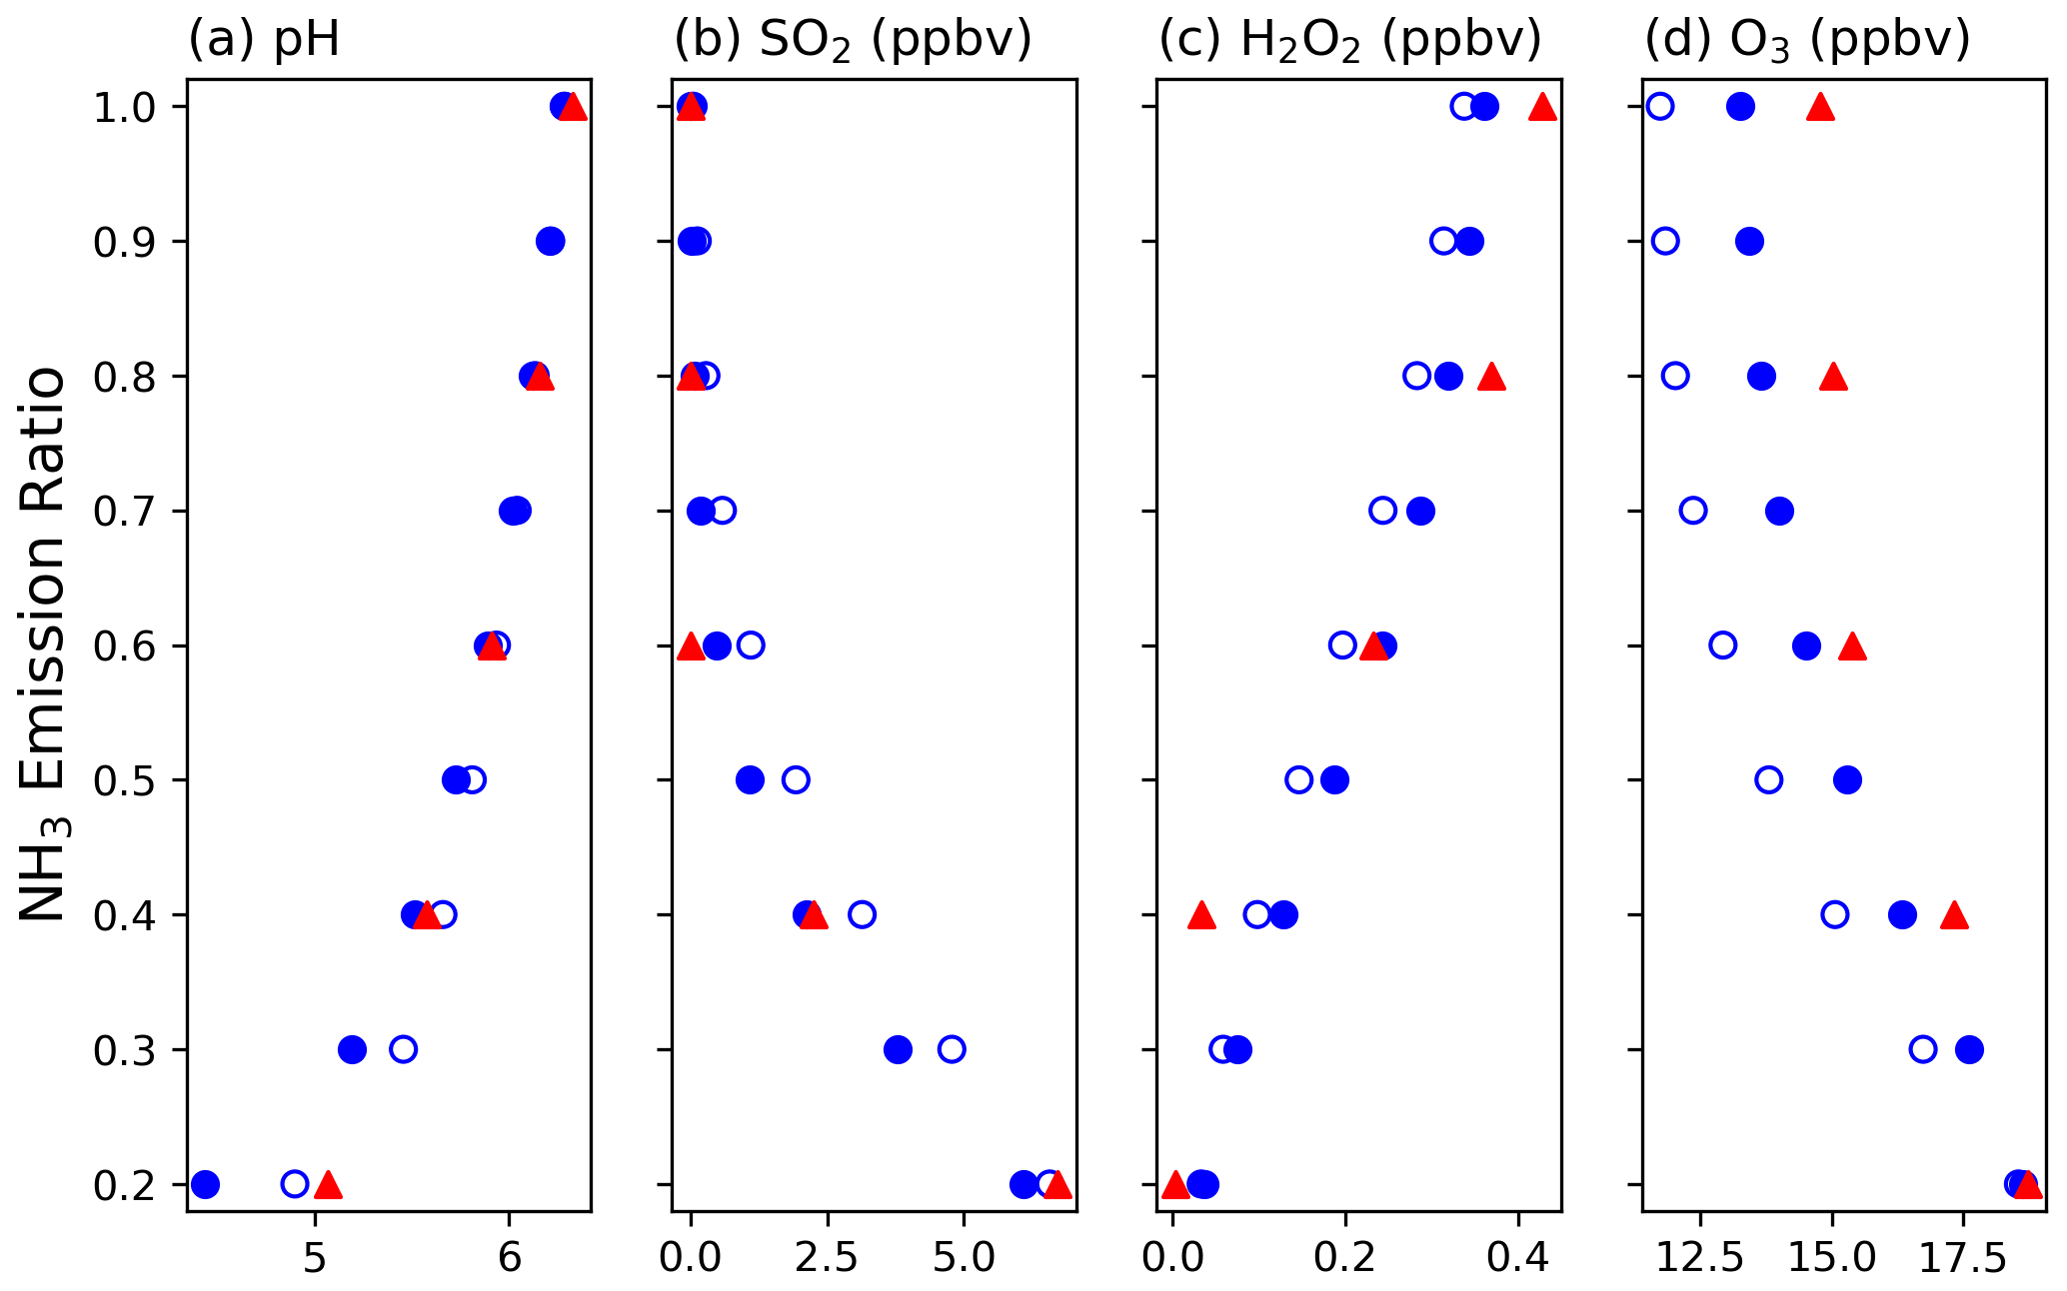
Figure 6The comparison between CMAQ and box model results for (a) pH and the concentrations of (b) SO2, (c) H2O2, and (d) O3 as a function of NH3 emission ratio. Red triangles show the CMAQ model results; open blue circles show the box model with H2O2 and O3 reactions; and solid blue circles show the box model with H2O2, O3, and O2 catalyzed by Fe(III) and Mn(II) reactions.
3.5 Cost of emission reduction
The PM2.5 reduction efficiency (Fig. 7a), based on the trend fitted in Fig. 3, increases as the emission ratio decreases across the three emission adjustment scenarios. Under the studied emission condition (i.e., emission ratio = 1), NH3 reduction shows the highest efficiency, followed by SO2, with NOx having the lowest (i.e., 2.43 × 10⁻⁵, 0.96 × 10⁻⁵, and 0.85 × 10⁻⁵ µg m−3 t−1 yr for NH3, SO2, and NOx, respectively). The increasing trend with the reduction ratio suggests a higher PM2.5 reduction efficiency as the emission control policies continue. However, as discussed in Sect. 3.3, reducing SO2 emissions has the least significant improvement in the PM2.5 levels. When the emission ratio is <0.8, the reduction efficiency of SO2 emissions is exceeded by that of NOx emissions, indicating that the reduction capacity of SO2 is the lowest. Additionally, the PM2.5 reduction efficiency during the relatively clean and high-pollution periods is presented in Figs. S12a and S13a, respectively. During the clean period (6 to 12 December), NH3 reduction maintains the highest efficiency, followed by SO2 and NOx. However, during the high-pollution period (16 to 22 December), NH3 reduction still has the highest efficiency, but NOx is higher than SO2. This indicates that during high-pollution periods, reducing SO2 emission has a limited effect on the total amount of PM2.5 concentration, and a continued reduction in the SO2 emission does not improve efficiency. The average results of these two different conditions explain the crossover pattern observed for SO2 and NOx emission reduction in Fig. 7a.
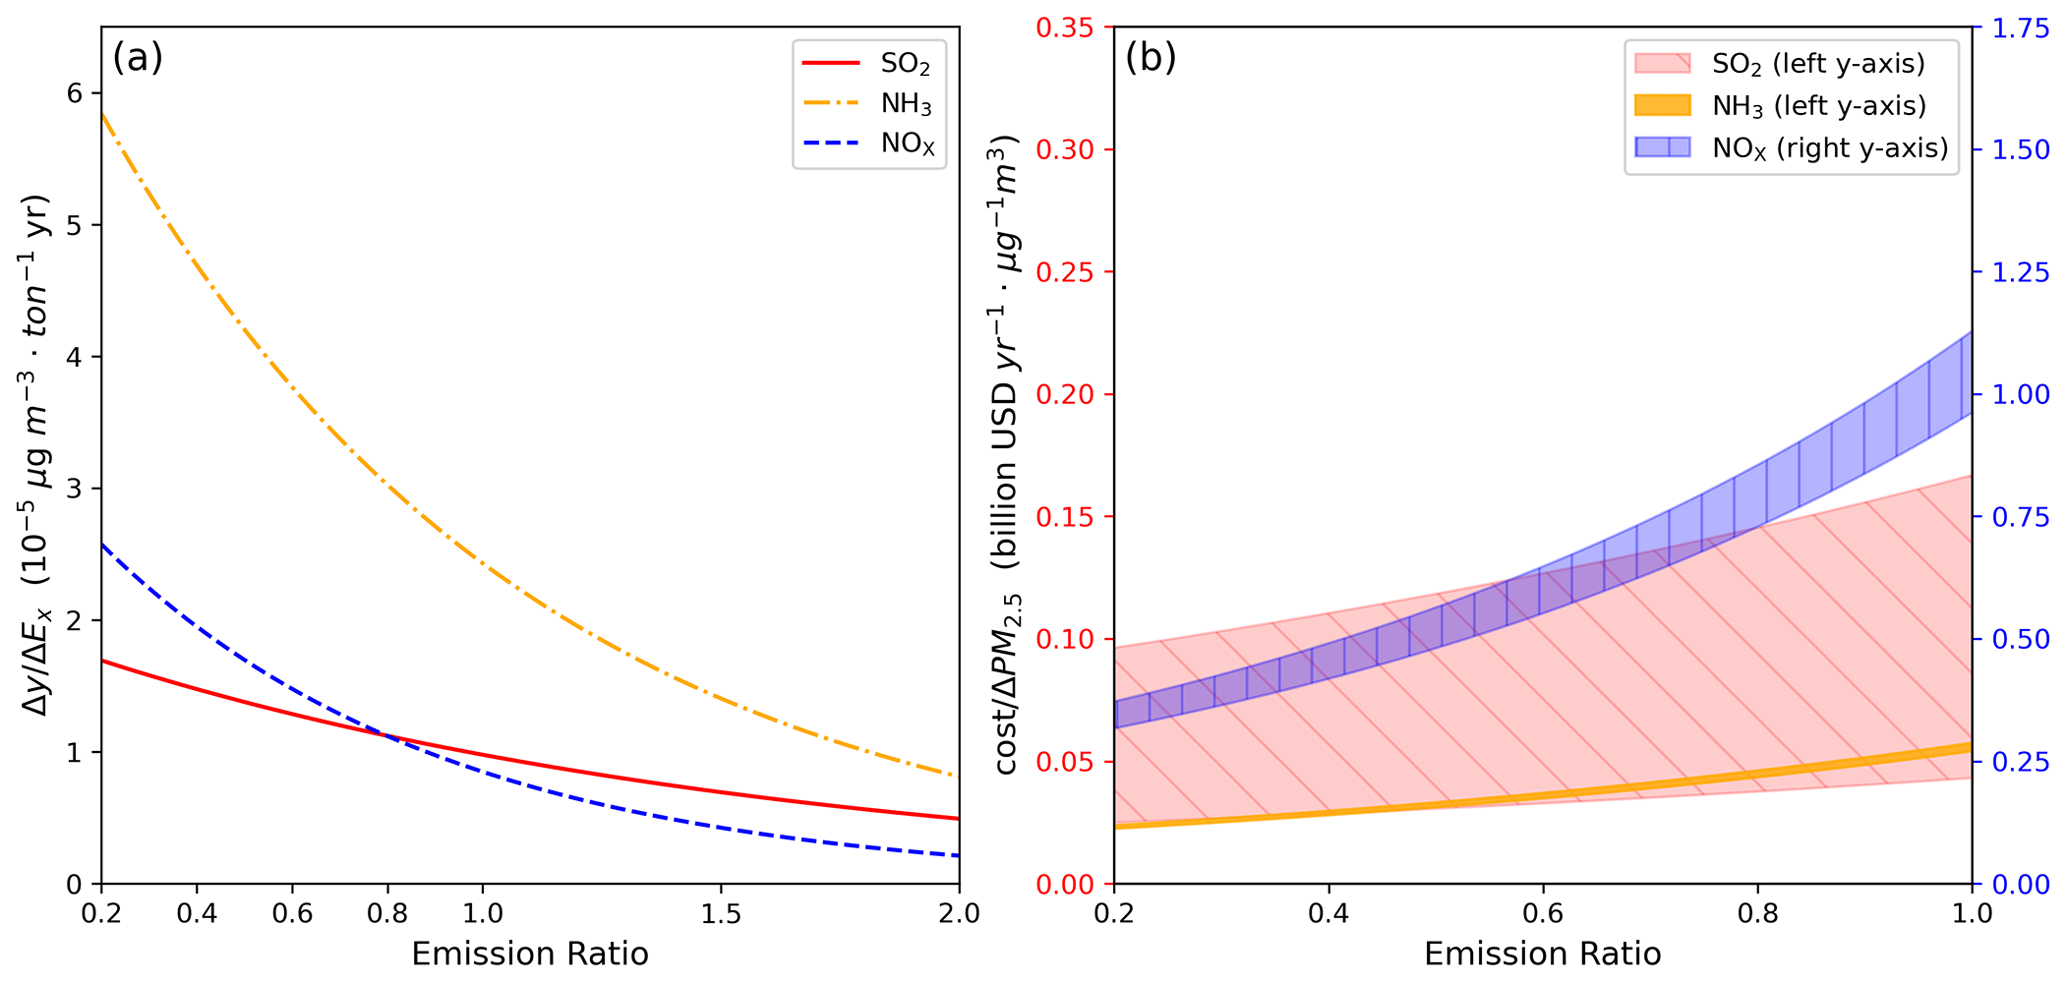
Figure 7(a) PM2.5 reduction efficiency and (b) reduction cost as a function of emission ratio for SO2, NH3, and NOx.
Regarding policy considerations, cost becomes a crucial factor. Figures 7b, S12b, and S13b illustrate the PM2.5 reduction costs associated with these emission reduction experiments. We focus on the average results for December (Fig. 7b), the reduction in NOx emissions incurs the highest cost, amounting to approximately USD 1 billion yr−1, to achieve a 1 µg m−3 reduction in PM2.5 concentration. In comparison, the cost of SO2 emission reduction ranges from tens of millions of US dollars to USD 100 million yr−1, while the NH3 emission reduction costs are around USD 50 million yr−1. The mean costs are USD 0.06 billion yr−1 µg−1 m3, USD 0.1 billion yr−1 µg−1 m3, and USD 1 billion yr−1 µg−1 m3 for NH3, SO2, and NOx, respectively. Therefore, performing NH3 and SO2 emission reductions would be more cost-efficient for achieving PM2.5 reduction. However, a cost evaluation involves uncertainties. The Kaminski (2003) approach to estimating MAC of SO2 focuses on power plants, discussing costs tied to emission control through alternative energy sources or equipment enhancements. On the other hand, Gu et al. (2021) employed the online Greenhouse Gas and Air Pollution Interactions and Synergies (GAINS) model to comprehensively assess the MAC of reducing NOx and NH3 emissions across five continents and globally. Applying these methods to Taiwan may encounter uncertainties due to varying energy mixes, industrial structures, and environmental conditions in different regions. These distinctions could diverge from previous study assumptions, affecting the cost-effectiveness of emission reduction strategies. Additional factors, including meteorological patterns and technological landscapes, may introduce uncertainties in cost estimations. Furthermore, our study assumed a constant MAC value. In reality, MAC may vary as emissions decrease, usually becoming more expensive. Varied emission reduction approaches could result in substantial cost disparities, demanding careful consideration for regional applications. Therefore, a more comprehensive cost–benefit analysis, accounting for regional variations and potential changes in MAC with emission reduction, is crucial to devise effective and economically viable air pollution control strategies.
This study investigates the impacts of emission reduction on PM2.5 and the secondary inorganic components (sulfate, nitrate, and ammonium), while assessing the effectiveness of emission reduction strategies in central Taiwan using the CMAQ model for December 2018. In our simulations, the mean PM2.5 concentration in central Taiwan was 21.1 µg m−3, comprising 2.7 µg m−3 of sulfate, 6.3 µg m−3 of nitrate, 2.6 µg m−3 of ammonium, and other species, including organics. For sulfate, 43.7 % comes from chemical processes, with 30.5 % from aqueous reactions and 13.2 % from gas-phase reactions.
In evaluating emission reduction strategies, it was observed that reducing the SO2 emission has a less significant impact on mitigating PM2.5 compared to reductions in NOx and NH3 emissions. This is attributed to the fact that SO2 emission reduction primarily affects sulfate, which constitutes only 12 % of PM2.5 in this study. On the other hand, reductions in NOx or NH3 emission led to substantial decreases in nitrate and ammonium, effectively mitigating PM2.5. However, a non-linear effect was noted between the reductions in NOx and NH3 emissions, indicating that the mitigating effects of these two emissions are not linearly additive. Through sensitivity analysis, the impact of NOx or NH3 emission reduction on PM2.5 is relatively similar in northern Taiwan, the Chu-Miao area, and central Taiwan, while the Yun–Chia–Nan area and Kao-Ping area show a preference for NOx emission reduction. Notably, NH3 emission reduction affects sulfur chemical reactions in the aqueous-phase through changing pH values in cloud droplets, shifting the primary oxidant from ozone to H2O2, which is a limited agent in this study. The sensitivity of the S(IV) to S(VI) oxidation reaction to acidity was verified using a box model. The oxidations by O2 catalyzed via Fe(III) and Mn(II) were also found to significantly contribute to the sulfur oxidation, as demonstrated by the box model. Other research has highlighted the importance of metal-ion-catalyzed sulfur oxidation reactions in sulfate formation, with this pathway contributing up to 19 % of sulfate formation in China during winter (Huang et al., 2014).
Emission reduction strategies to combat PM2.5 are crucial but entail considerable costs. Our comprehensive analysis shows that, considering both efficiency and cost, reducing NH3 emissions is the most effective strategy for the studied environmental conditions in Taiwan. However, it is imperative to acknowledge that NH3 emissions are mainly associated with industrial, agricultural, and livestock activities. Industrial ammonia manufacturing has historically boosted global food production and population (Erisman et al., 2008), and green ammonia may also play a significant role in future carbon-free energy endeavors (Chehade and Dincer, 2021; Kang and Holbrook, 2015). Therefore, exploring large-scale emission reduction strategies and carefully assessing potential issues, such as aerosol pH changes leading to increased acid rain (Liu et al., 2019), are vital areas for further research. Overall, this study provides valuable insights into the intricate interactions among air pollutants and their impacts on PM2.5, highlighting the ongoing need for continued efforts to reduce emissions and improve air quality in Taiwan.
The code is not publicly accessible, but readers can contact Hui-Ming Hung (hmhung@ntu.edu.tw) for more information.
The CMAQ model output and TW-MOENV observation data used in this study can be accessed online at https://doi.org/10.5281/zenodo.10623526 (Huang et al., 2024).
The supplement related to this article is available online at: https://doi.org/10.5194/acp-24-10759-2024-supplement.
PCH set up and ran the experiments and prepared the draft. HMH supervised the project, including data discussion and editing the paper. HCL provided the control run of the WRF and CMAQ models. CCKC provided the IC analysis of PM2.5.
The contact author has declared that none of the authors has any competing interests.
Publisher's note: Copernicus Publications remains neutral with regard to jurisdictional claims made in the text, published maps, institutional affiliations, or any other geographical representation in this paper. While Copernicus Publications makes every effort to include appropriate place names, the final responsibility lies with the authors.
We would like to thank the anonymous reviewers for their constructive and valuable comments. Additionally, we acknowledge the valuable insights from Ruijun Dang at Harvard University and Jen-Ping Chen at the National Taiwan University regarding the sensitivity analysis discussion.
This research has been supported by the National Science and Technology Council (grant nos. 111-2111-M-002-009 and 112-2111-M-002-014) and the Academia Sinica (grant no. AS-GC-110-01).
This paper was edited by Fangqun Yu and reviewed by two anonymous referees.
Byun, D. and Schere, K. L.: Review of the Governing Equations, Computational Algorithms, and Other Components of the Models-3 Community Multiscale Air Quality (CMAQ) Modeling System, Appl. Mech. Rev., 59, 51–77, https://doi.org/10.1115/1.2128636, 2006.
Chehade, G. and Dincer, I.: Progress in green ammonia production as potential carbon-free fuel, Fuel, 299, 120845, https://doi.org/10.1016/j.fuel.2021.120845, 2021.
Chen, C.-L., Chen, T.-Y., Hung, H.-M., Tsai, P.-W., Chou, C. C. K., and Chen, W.-N.: The influence of upslope fog on hygroscopicity and chemical composition of aerosols at a forest site in Taiwan, Atmos. Environ., 246, 118150, https://doi.org/10.1016/j.atmosenv.2020.118150, 2021.
Chen, Y., Shen, H., and Russell, A. G.: Current and Future Responses of Aerosol pH and Composition in the U.S. to Declining SO2 Emissions and Increasing NH3 Emissions, Environ. Sci. Technol., 53, 9646–9655, https://doi.org/10.1021/acs.est.9b02005, 2019.
Cheng, F.-Y. and Hsu, C.-H.: Long-term variations in PM2.5 concentrations under changing meteorological conditions in Taiwan, Sci. Rep., 9, 6635, https://doi.org/10.1038/s41598-019-43104-x, 2019.
Chuang, M.-T., Chou, C. C. K., Hsiao, T.-C., Lin, K.-Y., Lin, N.-H., Lin, W.-Y., Wang, S.-H., Pani, S. K., and Lee, C.-T.: Analyzing the increasing importance of nitrate in Taiwan from long-term trend of measurements, Atmos. Environ., 267, 118749, https://doi.org/10.1016/j.atmosenv.2021.118749, 2021.
Derwent, R., Witham, C., Redington, A., Jenkin, M., Stedman, J., Yardley, R., and Hayman, G.: Particulate matter at a rural location in southern England during 2006: Model sensitivities to precursor emissions, Atmos. Environ., 43, 689–696, https://doi.org/10.1016/j.atmosenv.2008.09.077, 2009.
Erisman, J. W., Sutton, M. A., Galloway, J., Klimont, Z., and Winiwarter, W.: How a century of ammonia synthesis changed the world, Nat. Geosci., 1, 636–639, https://doi.org/10.1038/ngeo325, 2008.
Gu, B., Zhang, L., Van Dingenen, R., Vieno, M., Van Grinsven, H. J. M., Zhang, X., Zhang, S., Chen, Y., Wang, S., Ren, C., Rao, S., Holland, M., Winiwarter, W., Chen, D., Xu, J., and Sutton, M. A.: Abating ammonia is more cost-effective than nitrogen oxides for mitigating PM2.5 air pollution, Science, 374, 758–762, https://doi.org/10.1126/science.abf8623, 2021.
Hsieh, M.-K., Chen, Y.-W., Chen, Y.-C., and Wu, C.-M.: The Roles of Local Circulation and Boundary Layer Development in Tracer Transport over Complex Topography in Central Taiwan, J. Meteorol. Soc. Jpn. Ser. II, 100, 555–573, https://doi.org/10.2151/jmsj.2022-028, 2022.
Hsu, C.-H. and Cheng, F.-Y.: Classification of weather patterns to study the influence of meteorological characteristics on PM2.5 concentrations in Yunlin County, Taiwan, Atmos. Environ., 144, 397–408, https://doi.org/10.1016/j.atmosenv.2016.09.001, 2016.
Hu, J., Chen, J., Ying, Q., and Zhang, H.: One-year simulation of ozone and particulate matter in China using WRF/CMAQ modeling system, Atmos. Chem. Phys., 16, 10333–10350, https://doi.org/10.5194/acp-16-10333-2016, 2016.
Huang, P.-C., Hung, H.-M., and Lai, H.-C.: CMAQ_dataset_2018_Dec, Zenodo [data set], https://doi.org/10.5281/zenodo.10623526, 2024.
Huang, X., Song, Y., Zhao, C., Li, M., Zhu, T., Zhang, Q., and Zhang, X.: Pathways of sulfate enhancement by natural and anthropogenic mineral aerosols in China, J. Geophys. Res.-Atmos., 119, 14165–14179, https://doi.org/10.1002/2014JD022301, 2014.
IPCC: Climate Change 2021: The Physical Science Basis. Contribution of Working Group I to the Sixth Assessment Report of the Intergovernmental Panel on Climate Change, edited by: Masson-Delmotte, V., Zhai, P., Pirani, A., Connors, S. L., Péan, C., Berger, S., Caud, N., Chen, Y., Goldfarb, L., Gomis, M. I., Huang, M., Leitzell, K., Lonnoy, E., Matthews, J. B. R., Maycock, T. K., Waterfield, T., Yelekçi, O., Yu, R., and Zhou, B., Cambridge University Press, Cambridge, United Kingdom and New York, NY, USA, https://doi.org/10.1017/9781009157896, 2021.
Jacobson, M. Z.: Development and application of a new air pollution modeling system – II. Aerosol module structure and design, Atmos. Environ., 31, 131–144, https://doi.org/10.1016/1352-2310(96)00202-6, 1997.
Kaminski, J.: Technologies and costs of SO2-emissions reduction for the energy sector, Appl. Energy, 75, 165–172, https://doi.org/10.1016/S0306-2619(03)00029-1, 2003.
Kang, D. W. and Holbrook, J. H.: Use of NH3 fuel to achieve deep greenhouse gas reductions from US transportation, Energy Reports, 1, 164–168, https://doi.org/10.1016/j.egyr.2015.08.001, 2015.
Lai, H.-C. and Lin, M.-C.: Characteristics of the upstream flow patterns during PM2.5 pollution events over a complex island topography, Atmos. Environ., 227, 117418, https://doi.org/10.1016/j.atmosenv.2020.117418, 2020.
Lee, C. S. L., Chou, C. C. K., Cheung, H. C., Tsai, C. Y., Huang, W. R., Huang, S. H., Chen, M. J., Liao, H. T., Wu, C. F., Tsao, T. M., Tsai, M. J., and Su, T. C.: Seasonal variation of chemical characteristics of fine particulate matter at a high-elevation subtropical forest in East Asia, Environ. Pollut., 246, 668–677, https://doi.org/10.1016/j.envpol.2018.11.033, 2019.
Liu, M., Huang, X., Song, Y., Tang, J., Cao, J., Zhang, X., Zhang, Q., Wang, S., Xu, T., Kang, L., Cai, X., Zhang, H., Yang, F., Wang, H., Yu, J. Z., Lau, A. K. H., He, L., Huang, X., Duan, L., Ding, A., Xue, L., Gao, J., Liu, B., and Zhu, T.: Ammonia emission control in China would mitigate haze pollution and nitrogen deposition, but worsen acid rain, P. Natl. Acad. Sci. USA, 116, 7760–7765, https://doi.org/10.1073/pnas.1814880116, 2019.
Maynard, A. D. and Maynard, R. L.: A derived association between ambient aerosol surface area and excess mortality using historic time series data, Atmos. Environ., 36, 5561–5567, https://doi.org/10.1016/S1352-2310(02)00743-4, 2002.
Petetin, H., Sciare, J., Bressi, M., Gros, V., Rosso, A., Sanchez, O., Sarda-Estève, R., Petit, J.-E., and Beekmann, M.: Assessing the ammonium nitrate formation regime in the Paris megacity and its representation in the CHIMERE model, Atmos. Chem. Phys., 16, 10419–10440, https://doi.org/10.5194/acp-16-10419-2016, 2016.
Ramanathan, V., Crutzen, P. J., Kiehl, J. T., and Rosenfeld, D.: Aerosols, Climate, and the Hydrological Cycle, Science, 294, 2119–2124, https://doi.org/10.1126/science.1064034, 2001.
Redington, A. L., Derwent, R. G., Witham, C. S., and Manning, A. J.: Sensitivity of modelled sulphate and nitrate aerosol to cloud, pH and ammonia emissions, Atmos. Environ., 43, 3227–3234, https://doi.org/10.1016/j.atmosenv.2009.03.041, 2009.
Schroder, J., Campuzano-Jost, P., Day, D., Shah, V., Sullivan, A., Campos, T., Reeves, J., Hills, A., Guo, H., Fibiger, D., McDuffie, E., Weber, R., Apel, E., Jaeglé, L., Brown, S., Thornton, J., and Jimenez, J.: Sources and Secondary Production of Organic Aerosols in the Northeastern United States during WINTER, J. Geophys. Res.-Atmos., 123, 7771–7796, https://doi.org/10.1029/2018JD028475, 2018.
Seinfeld, J. H. and Pandis, S. N.: Atmospheric Chemistry and Physics: From Air Pollution to Climate Change, Wiley, ISBN 978-0-471-72018-8, 2006.
Shiraiwa, M., Ueda, K., Pozzer, A., Lammel, G., Kampf, C. J., Fushimi, A., Enami, S., Arangio, A. M., Fröhlich-Nowoisky, J., Fujitani, Y., Furuyama, A., Lakey, P. S. J., Lelieveld, J., Lucas, K., Morino, Y., Pöschl, U., Takahama, S., Takami, A., Tong, H., Weber, B., Yoshino, A., and Sato, K.: Aerosol Health Effects from Molecular to Global Scales, Environ. Sci. Technol., 51, 13545–13567, https://doi.org/10.1021/acs.est.7b04417, 2017.
Skamarock, W. C., Klemp, J. B., Dudhia, J., Gill, D. O., Barker, D. M., Duda, M. G., Huang, X., Wang, W., and Powers, J. G.: A Description of the Advanced Research WRF Version 3, U.S. National Center for Atmospheric Research, Boulder, Colorado, NCAR/TN–475+STR, 2008.
Sugiyama, T., Ueda, K., Seposo, X. T., Nakashima, A., Kinoshita, M., Matsumoto, H., Ikemori, F., Honda, A., Takano, H., Michikawa, T., and Nitta, H.: Health effects of PM2.5 sources on children's allergic and respiratory symptoms in Fukuoka, Japan, Sci. Total Environ., 709, 136023, https://doi.org/10.1016/j.scitotenv.2019.136023, 2020.
Takahama, S., Wittig, A. E., Vayenas, D. V., Davidson, C. I., and Pandis, S. N.: Modeling the diurnal variation of nitrate during the Pittsburgh Air Quality Study, J. Geophys. Res.-Atmos., 109, D16S06, https://doi.org/10.1029/2003JD004149, 2004.
Tsimpidi, A. P., Karydis, V. A., and Pandis, S. N.: Response of Inorganic Fine Particulate Matter to Emission Changes of Sulfur Dioxide and Ammonia: The Eastern United States as a Case Study, J. Air Waste Manage. Assoc., 57, 1489–1498, https://doi.org/10.3155/1047-3289.57.12.1489, 2007.
Veratti, G., Stortini, M., Amorati, R., Bressan, L., Giovannini, G., Bande, S., Bissardella, F., Ghigo, S., Angelino, E., Colombo, L., Fossati, G., Malvestiti, G., Marongiu, A., Dalla Fontana, A., Intini, B., and Pillon, S.: Impact of NOx and NH3 Emission Reduction on Particulate Matter across Po Valley: A LIFE-IP-PREPAIR Study, Atmosphere, 14, 762, https://doi.org/10.3390/atmos14050762, 2023.
Vohra, K., Marais, E. A., Bloss, W. J., Schwartz, J., Mickley, L. J., Van Damme, M., Clarisse, L., and Coheur, P.-F.: Rapid rise in premature mortality due to anthropogenic air pollution in fast-growing tropical cities from 2005 to 2018, Science Advances, 8, eabm4435, https://doi.org/10.1126/sciadv.abm4435, 2022.
WHO: Review of evidence on health aspects of air pollution: REVIHAAP project: technical report, World Health Organization, Regional Office for Europe, Copenhagen, https://iris.who.int/handle/10665/341712 (last access: 17 September 2024), 2021.
Wyat Appel, K., Napelenok, S., Hogrefe, C., Pouliot, G., Foley, K. M., Roselle, S. J., Pleim, J. E., Bash, J., Pye, H. O. T., Heath, N., Murphy, B., and Mathur, R.: Overview and Evaluation of the Community Multiscale Air Quality (CMAQ) Modeling System Version 5.2, Air Pollution Modeling and its Application XXV, Cham, https://doi.org/10.1007/978-3-319-57645-9_11, 2018.
Zhang, Q., Jimenez, J. L., Worsnop, D. R., and Canagaratna, M.: A Case Study of Urban Particle Acidity and Its Influence on Secondary Organic Aerosol, Environ. Sci. Technol., 41, 3213–3219, https://doi.org/10.1021/es061812j, 2007.