the Creative Commons Attribution 4.0 License.
the Creative Commons Attribution 4.0 License.
 | 25 Sep 2024
Unraveling the discrepancies between Eulerian and Lagrangian moisture tracking models in monsoon- and westerly-dominated basins of the Tibetan Plateau
Chenghao Wang
Qiuhong Tang
Shibo Yao
Bo Sun
Hui Peng
Shangbin Xiao
Eulerian and Lagrangian numerical moisture tracking models, which are primarily used to quantify moisture contributions from global sources to specific regions, play a crucial role in hydrology and (paleo)climatology studies on the Tibetan Plateau (TP). Despite their widespread applications in the TP region, potential discrepancies in their moisture tracking results and their underlying causes remain unexplored. In this study, we compare the most widely used Eulerian and Lagrangian moisture tracking models over the TP, i.e., WAM2layers (the Water Accounting Model – 2 layers) and FLEXPART-WaterSip (the FLEXible PARTicle dispersion model coupled with the “WaterSip” moisture source diagnostic method), specifically focusing on a basin governed by the Indian summer monsoon (Yarlung Zangbo River basin, YB) and a westerly-dominated basin (upper Tarim River basin, UTB). Compared to the bias-corrected FLEXPART-WaterSip, WAM2layers generally estimates higher moisture contributions from westerly-dominated and distant sources but lower contributions from local recycling and nearby sources downwind of the westerlies. These differences become smaller with higher spatial and temporal resolutions of forcing data in WAM2layers. A notable advantage of WAM2layers over FLEXPART-WaterSip is its closer alignment of estimated moisture sources with actual evaporation, particularly in source regions with complex land–sea distributions. However, the evaporation biases in FLEXPART-WaterSip can be partly corrected through calibration with actual surface fluxes. For moisture tracking over the TP, we recommend using high-resolution forcing datasets, prioritizing temporal resolution over spatial resolution for WAM2layers, while for FLEXPART-WaterSip, we suggest applying bias corrections to optimize the filtering of precipitation particles and adjust evaporation estimates.
- Article
(10431 KB) - Full-text XML
-
Supplement
(3048 KB) - BibTeX
- EndNote


Moisture tracking through numerical models plays a pivotal role in advancing our quantitative understanding of the global and regional atmospheric water cycle and is crucial for a variety of applications in meteorology, hydrology, and climate science (Gimeno et al., 2012, 2020). The Tibetan Plateau (TP) region, often referred to as the “Asia water tower”, encompasses the world's highest plateau and has been experiencing a rapid retreat of glaciers and permafrost, accompanied by shifts in precipitation patterns and a pronounced warming trend, in recent decades (Yao et al., 2018, 2022). Numerous research efforts based on meteorological analyses and climate proxy indicators (e.g., precipitation and ice-core isotopes) have comprehensively investigated the hydrological cycle in this region (Yao et al., 2013; Yang et al., 2014; Y. Liu et al., 2020). Recent advancements in numerical moisture tracking models have further facilitated the quantitative diagnosis of moisture source–receptor relationships across the TP region (Chen et al., 2012; Zhang et al., 2017; Li et al., 2022a). In recent years, numerical moisture tracking has been widely used to analyze precipitation and water resource changes over the TP (Li et al., 2019; Ayantobo et al., 2022; Q. Zhang et al., 2023), interpret the characteristics of the TP's climate proxy indicators (Shao et al., 2021; Li et al., 2022b; Wang et al., 2022), and investigate the impacts of the TP's climatic conditions on downstream areas (C. Zhang et al., 2023).
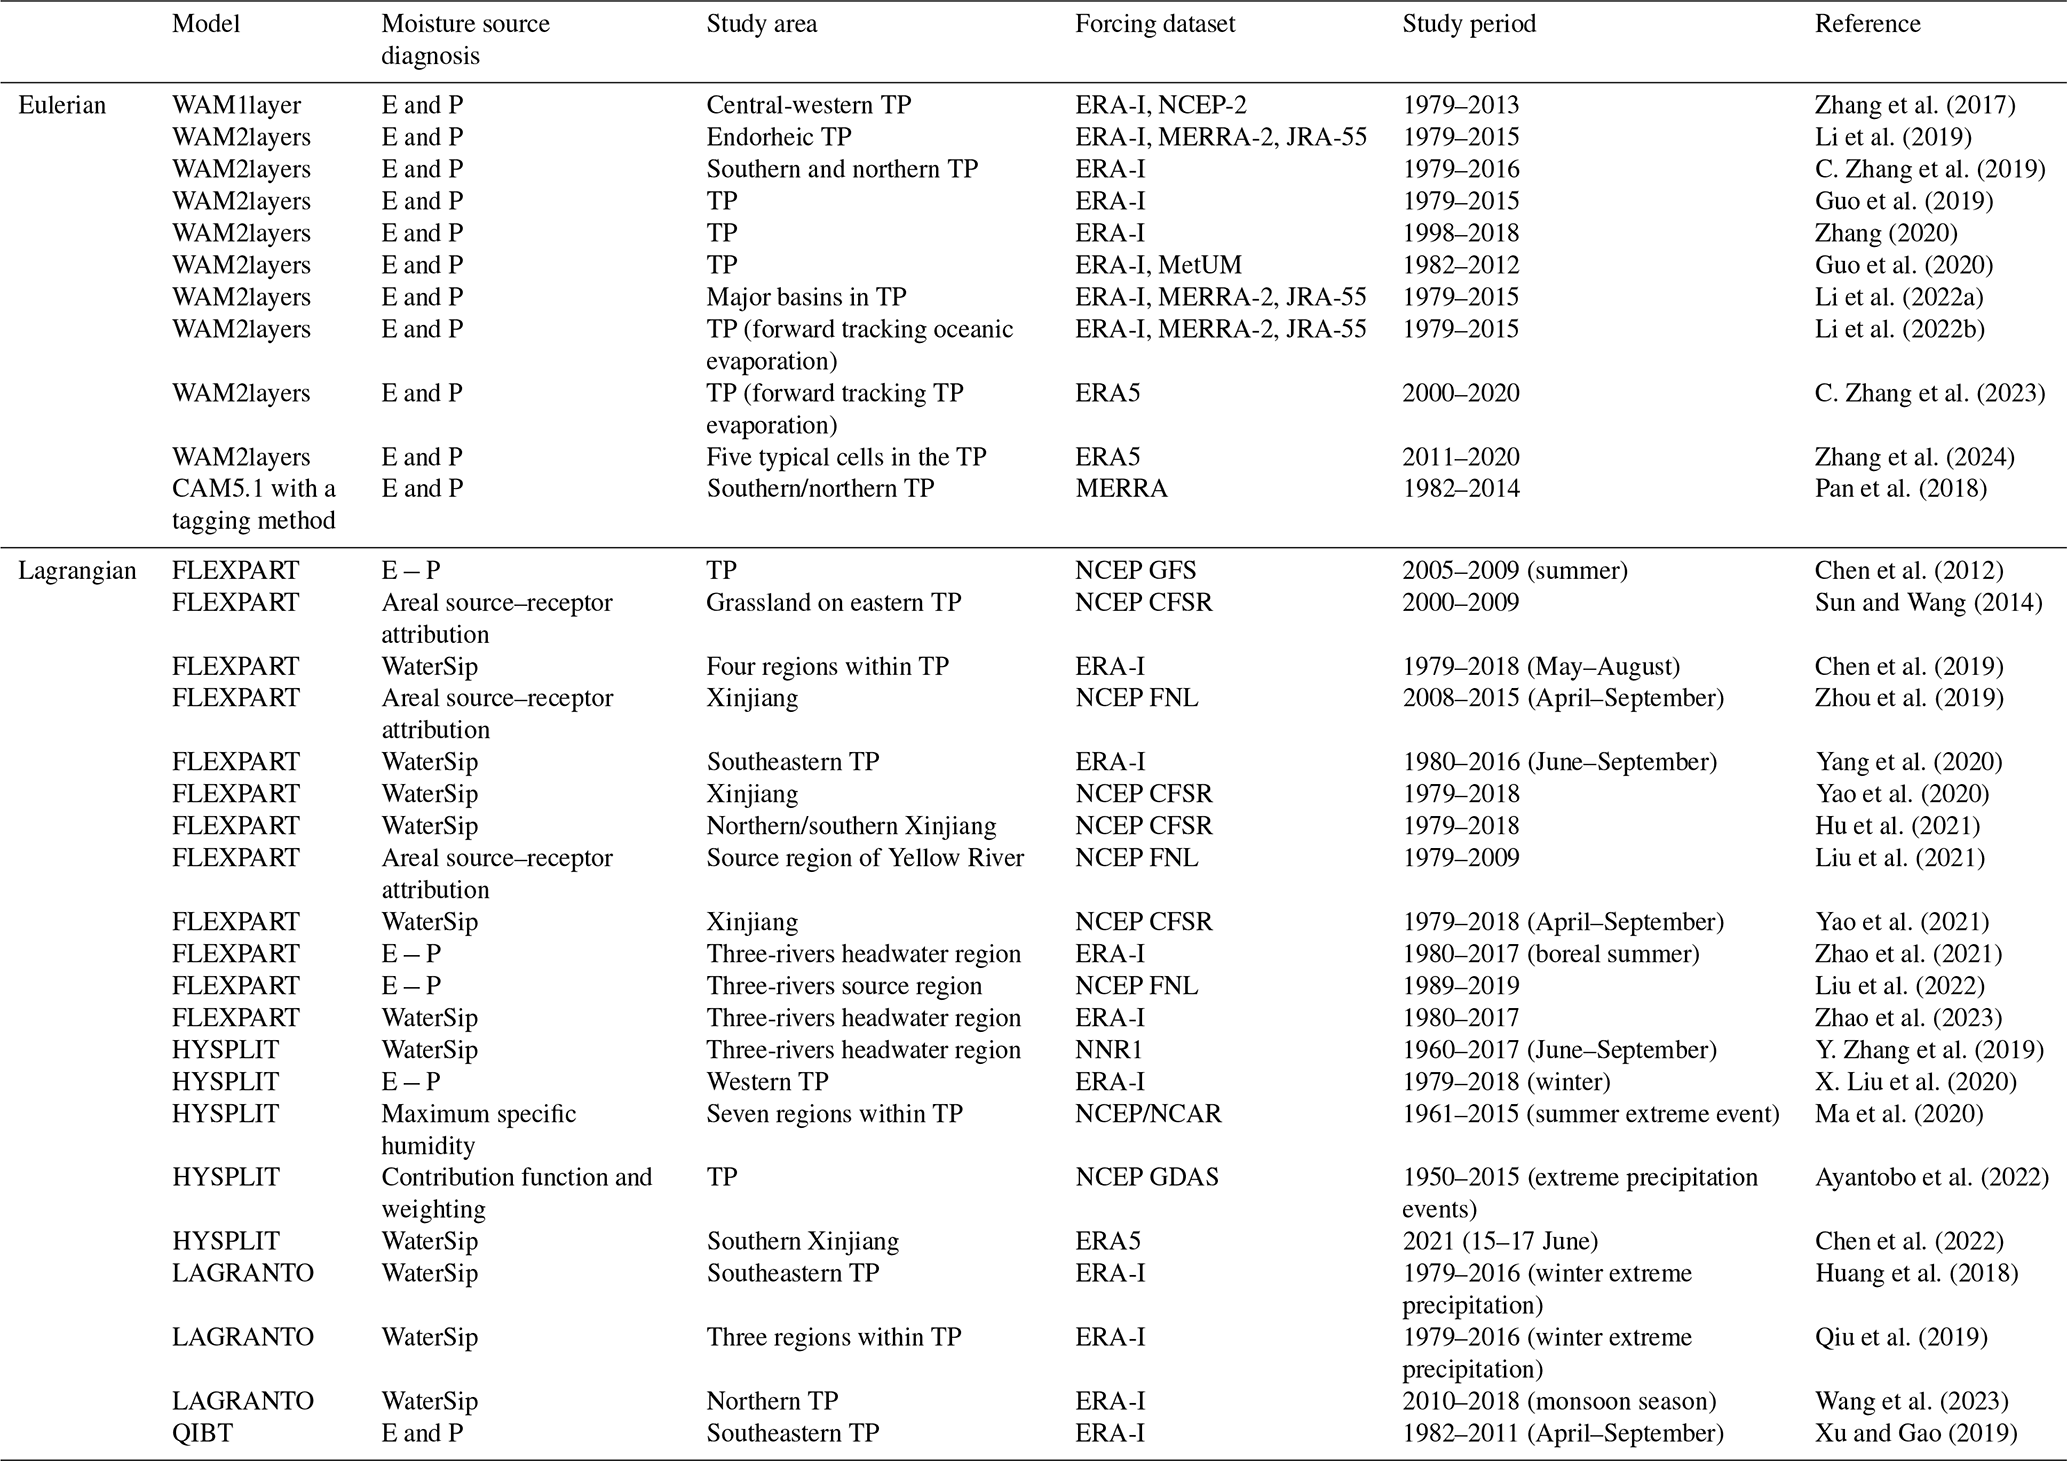
Table 1 summarizes the numerical moisture tracking studies over the TP for the past 20 years; the utilized models can be broadly classified into two categories: Eulerian and Lagrangian models. The Eulerian moisture tracking approach typically employs a fixed-spatial-grid system and primarily focuses on averaged physical quantities with predefined grid spacings, while Lagrangian models use a particle tracking approach to infer the movement of moisture through diagnosing source–receptor relationships. Among these models, the Water Accounting Model – 2 layers (WAM2layers or WAM-2layers) and the FLEXible PARTicle dispersion model (FLEXPART) coupled with the “WaterSip” moisture source diagnostic method (FLEXPART-WaterSip) are the most widely use Eulerian and Lagrangian moisture tracking models, respectively. As suggested in Table 1, existing studies have mainly used either Eulerian or Lagrangian moisture tracking models driven by very diverse forcing datasets, covering various study periods and regions across the TP. This diversity largely hinders the quantitative comparison of moisture tracking results from different models and the attribution of their discrepancies. Nevertheless, two general patterns can be observed through a quantitative comparison of the long-term moisture tracking results in these studies. First, moisture sources tracked by Eulerian models tend to cover a large part of the western Eurasian continent and can stretch southward to the southern Indian Ocean (Zhang et al., 2017, 2024; Li et al., 2019, 2022a). In contrast, moisture sources tracked by Lagrangian models predominantly extend southward (Chen et al., 2012, 2019; Sun and Wang, 2014; Yang et al., 2020), with broader westward extensions observed in the moisture tracking for the westernmost TP and Xinjiang region (Zhou et al., 2019; X. Liu et al., 2020; Yao et al., 2020; Hu et al., 2021). Second, areas with higher evaporation rates, such as the ocean surface, in general contribute more moisture compared to surrounding land areas. While the moisture sources simulated by Eulerian models align well with the land–sea distribution (Zhang et al., 2017, 2024; Li et al., 2019, 2022a), this alignment is less pronounced for Lagrangian models (Chen et al., 2012, 2019; Sun and Wang, 2014; Zhou et al., 2019; X. Liu et al., 2020; Yang et al., 2020; Yao et al., 2020; Hu et al., 2021). In this context, we speculate that different moisture tracking methods (both Eulerian and Lagrangian ones) may involve certain unrecognized uncertainties or errors when applied to the TP region. This underscores the pressing need for further exploration to examine the discrepancies among these models to better characterize the complex hydrological processes of the TP.
Table 1A non-exhaustive overview of moisture tracking studies with Eulerian and Lagrangian models in the TP and its vicinity. “E and P” means the model diagnoses evaporation and precipitation separately, while “E − P” means the model diagnoses contributions through the water budget (i.e., evaporation minus precipitation).
It is noteworthy that several studies have employed both Eulerian and Lagrangian models to diagnose moisture sources and perform comparative analyses in other regions. For example, a comparison among RCM-tag (coupled with MM5), WAM, and 3D-T (a modification of QIBT) models in western Africa revealed that the number of vertical layers and the mixing assumption for evaporation significantly influence simulations, especially in regions with strong wind shear (van der Ent et al., 2013). Another comparison between Eulerian and Lagrangian approaches (implemented in the COSMO model) in Europe found that the linkage of moisture uptake in the atmospheric boundary layer to evaporation in the Lagrangian approach is mostly consistent with the advanced Eulerian model (Winschall et al., 2014). Tuinenburg and Staal (2020) compared a set of moisture tracking models for seven source locations globally and concluded that the three-dimensional Lagrangian models were most accurate and suitable for areas with relatively complex terrain, as they can better track moisture with strong vertical variability in horizontal transport. Using the Eulerian WRF-WVT model as a benchmark for moisture tracking over the Mediterranean region, Cloux et al. (2021) considered the Lagrangian FLEXPART-WRF model appropriate for a qualitative description of moisture origin rather than a precise estimation of source contributions. These comparative studies emphasize that the most suitable moisture tracking model depends on the specific case, including but not limited to the research question, spatial extent, and computing resource available. Despite these existing efforts, it remains unclear whether their conclusions are applicable to moisture tracking over the TP, especially concerning the widely used models in the region. Moreover, studies on the underlying mechanisms of model uncertainties through moisture tracking intercomparison are still lacking.
The overall objective of this study is to investigate potential errors/uncertainties in numerical moisture tracking models and the underlying mechanisms of their discrepancies over the TP. This is achieved through a comparison between the most commonly used Eulerian and Lagrangian models in the region, specifically WAM2layers and FLEXPART-WaterSip. Given that the TP's climate is mainly influenced by the interactions between the Indian summer monsoon (ISM) and mid-latitude westerlies, we selected two representative basins for our comparative analysis: the ISM-dominated Yarlung Zangbo River basin (YB) and the westerly-dominated upper Tarim River basin (UTB) (Fig. S1 in the Supplement). Section 2 describes the mechanisms, forcing data, and numerical settings for both moisture tracking models. Section 3 provides a comprehensive comparison of the moisture tracking results for both basins. Section 4 delves into the intermediate processes of moisture tracking in the two models: moisture fluxes in WAM2layers and particle trajectories in FLEXPART. To further illustrate the differences between these two models, Sect. 5 examines the relationship between the simulated moisture contributions and actual evaporation from various source regions. Section 6 introduces a two-step bias correction method for FLEXPART-WaterSip simulations based on a comparison between actual and simulated surface fluxes. Section 7 further investigates the potential determinants of the observed discrepancies between the two approaches through a series of carefully designed numerical experiments.
In this study, WAM2layers V3.0.0b5 is adopted for Eulerian moisture tracking. This two-layer version, designed to deal with wind shear in the upper air, is an update to an earlier single-layer version (van der Ent et al., 2010). As illustrated in the conceptual diagram (Fig. 1a), the underlying principle of WAM2layers is the water balance equation (van der Ent et al., 2014), which in the lower layer is given by
where subscript g denotes the tagged moisture; S is the moisture content in the atmosphere; t is time; u and v are the zonal (x) and meridional (y) wind fields, respectively; E is evaporation (which only occurs in the bottom layer); P is precipitation; and Fv is the vertical moisture transport between the two layers. The model prescribes a two-layer structure, with the division typically at approximately 810 hPa with a standard surface pressure. Modifications to Fv (4Fv in the net flux direction and 3Fv in the opposite direction) are implemented to account for turbulent moisture exchange. Note that the division between the two layers varies with topography and decreases to ∼520 hPa over the TP (∼4000 m).
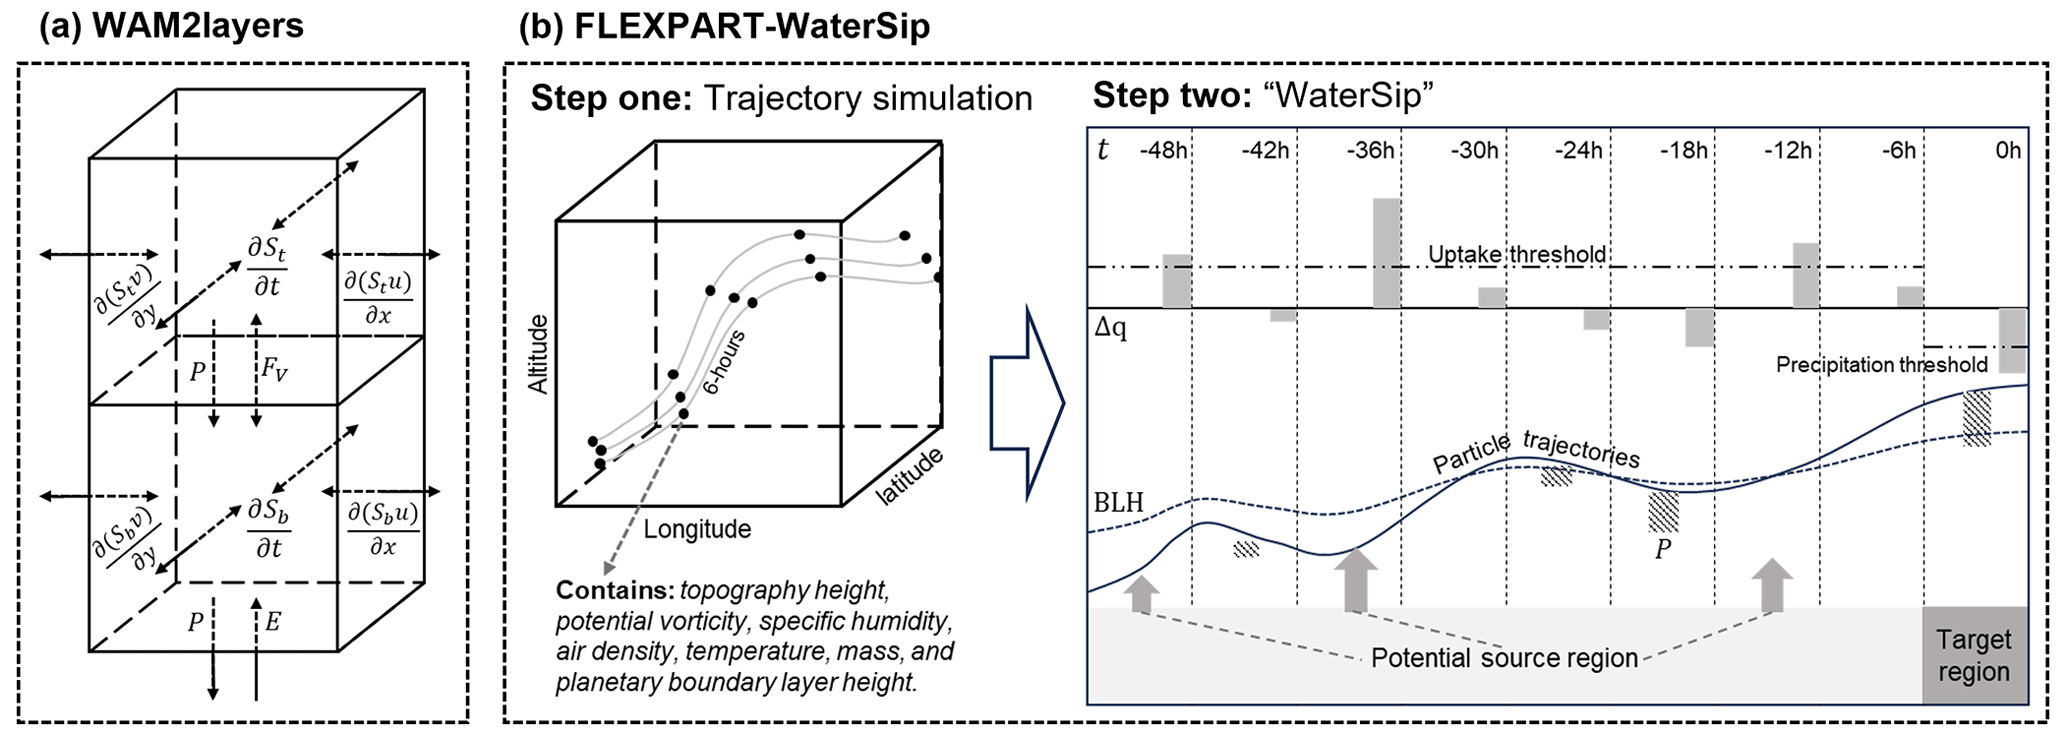
Figure 1Mechanisms of (a) WAM2layers and (b) FLEXPART-WaterSip. “Step two” in (b) is adapted from Sodemann et al. (2008).
The Lagrangian particle trajectory simulation in this study is conducted using FLEXPART V10.4, a versatile model widely employed to simulate the transport and turbulent mixing of gases and aerosols in the atmosphere (Pisso et al., 2019). FLEXPART can operate in domain-filling mode to represent the entire atmosphere using uniformly distributed particles with equal mass. It is independent of a computational grid, which enables effective descriptions of atmospheric transport at a theoretically infinitesimal spatial resolution. For this study, 5 million particles were released across the entire tracking domain. The outputs from FLEXPART include the detailed three-dimensional position, topography height, potential vorticity, specific humidity, air density, temperature, mass, and planetary boundary layer height (BLH) of each particle/parcel at 6-hourly intervals (Fig. 1b). Similarly to other Lagrangian models such as HYSPLIT (Stein et al., 2016) and LAGRANTO (Sprenger and Wernli, 2015), FLEXPART on its own does not identify potential moisture sources for precipitation in the target region or quantify their contributions. To address this limitation, we adopted the WaterSip method proposed by Sodemann et al. (2008). This method identifies moisture sources using humidity information along particle trajectories simulated by FLEXPART and involves key processes such as filtering trajectories that lead to precipitation, calculating specific humidity changes and their attributed fractions, and determining potential moisture sources based on moisture uptake thresholds and BLH (Fig. 1b). A more detailed description of this method can be found in Sodemann et al. (2008). Default screening thresholds in this study are set at 0.2 g kg−1 for specific humidity change, 80 % for relative humidity, and 1.5 times the BLH for particle height, although adjustments were made for sensitivity experiments detailed in Sects. 6 and 7. In summary, the FLEXPART-WaterSip approach adopted here integrates the particle trajectory simulated by FLEXPART with the moisture source–receptor diagnostics of WaterSip.
Both WAM2layers and FLEXPART-WaterSip operate as offline models that rely on meteorological fields as forcing inputs. Here we used the fifth-generation atmospheric reanalysis product from the European Centre for Medium-Range Weather Forecasts (ERA5) as the forcing dataset, which benefits from decades of advancements in data assimilation, core dynamics, and model physics (Hersbach et al., 2020). The moisture tracking simulations specifically target July 2022, a month significantly influenced by the ISM in the TP region (Yao et al., 2013; Curio and Scherer, 2016). The moisture tracking domain spans 30° S to 80° N and 40° W to 140° E, covering nearly all potential oceanic and terrestrial source regions of precipitation over the TP (Chen et al., 2012; Li et al., 2022a). In the simulations, the two representative basins are represented with gridded boundaries as shown in Fig. S1. Considering the number of particles released, data size, and computational resources needed, both models are driven by 1°×1° and 3-hourly ERA5 data, although some specific variables used in the two models are different due to their distinct physical mechanisms.
In WAM2layers, tagged moisture is continuously released into Eulerian grids and tracked as it progressively accumulates and diffuses across grids over time. The tagged moisture was released throughout the entire month of July (from 31 July to 1 July in backward mode), with the backward-tracking period extending back to 1 June. A previous study in the TP region demonstrated that a ∼30 d tracking period can ensure that approximately 95 % of the tagged moisture returns to the ground (Zhang et al., 2017), which is consistent with our numerical experiments in the YB and UTB (Fig. 2a). In comparison, FLEXPART-WaterSip tracks atmospheric particles released at each step independently, thereby avoiding interference between particles released at different times. This differs from WAM2layers, which ensures that, in FLEXPART-WaterSip, moisture released at various times does not converge into the same set of Eulerian grids. Typically, the average residence time of moisture in the atmosphere (∼10 d) is used as the tracking period for a single release of particles in FLEXPART-WaterSip. To align the tracking duration and maximize the tracking of tagged moisture in both models (Fig. 2), the backward-tracking time in FLEXPART-WaterSip was extended to 30 d. For FLEXPART-WaterSip, although large deviations in actual air parcel movements may occur beyond the average 10 d residence time, the associated uncertainties in trajectories beyond this period are unlikely to substantially impact the results, as the majority of moisture uptake occurs within the first 10 d (Sodemann et al., 2008). Our numerical experiments, as illustrated in Fig. 2b, indicate that within the first 10 d (20 d), we traced 89 % (99 %) of the precipitation moisture in the YB and 97 % (99 %) in the UTB. Detailed configurations of WAM2layers and FLEXPART can be found in Sect. S2 of the Supplement.
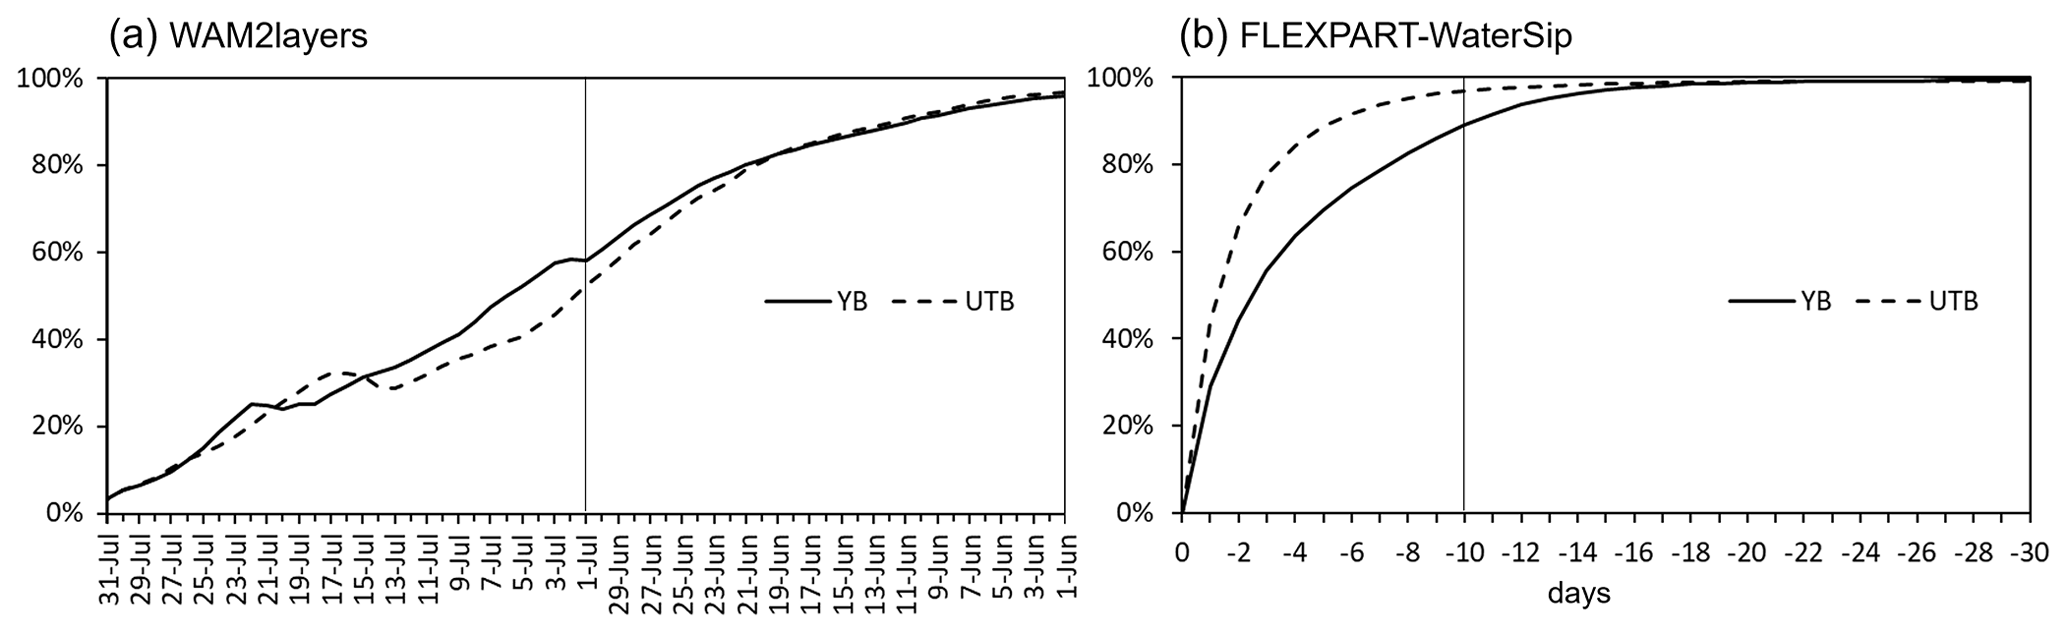
Figure 2Backward-moisture-tracking periods and accumulated moisture uptake from all source regions in (a) WAM2layers and (b) FLEXPART-WaterSip. Solid lines represent the YB, and dashed lines represent the UTB.
Figure 3 shows the simulated moisture sources for precipitation in July 2022 over the YB and UTB based on WAM2layers and FLEXPART-WaterSip. Moisture contributions are quantified as equivalent water height (mm) over the source regions. For the YB, in addition to significant local recycling, the distribution of most moisture sources aligns with the path of the ISM, extending from the southern slopes of the Himalayas through the Bay of Bengal (BB) and the Indian subcontinent to the Arabian Sea (AS) and reaching as far as the southern Indian Ocean (SIO) (Fig. 3a and c). Moisture sources for the UTB mainly stretch along the westerlies to the Central Asia region (Fig. 3b and d). Generally, WAM2layers simulations suggest a broader range of distant moisture sources (including both the westerly-dominated and ISM-dominated regions) when compared to those identified by FLEXPART-WaterSip.
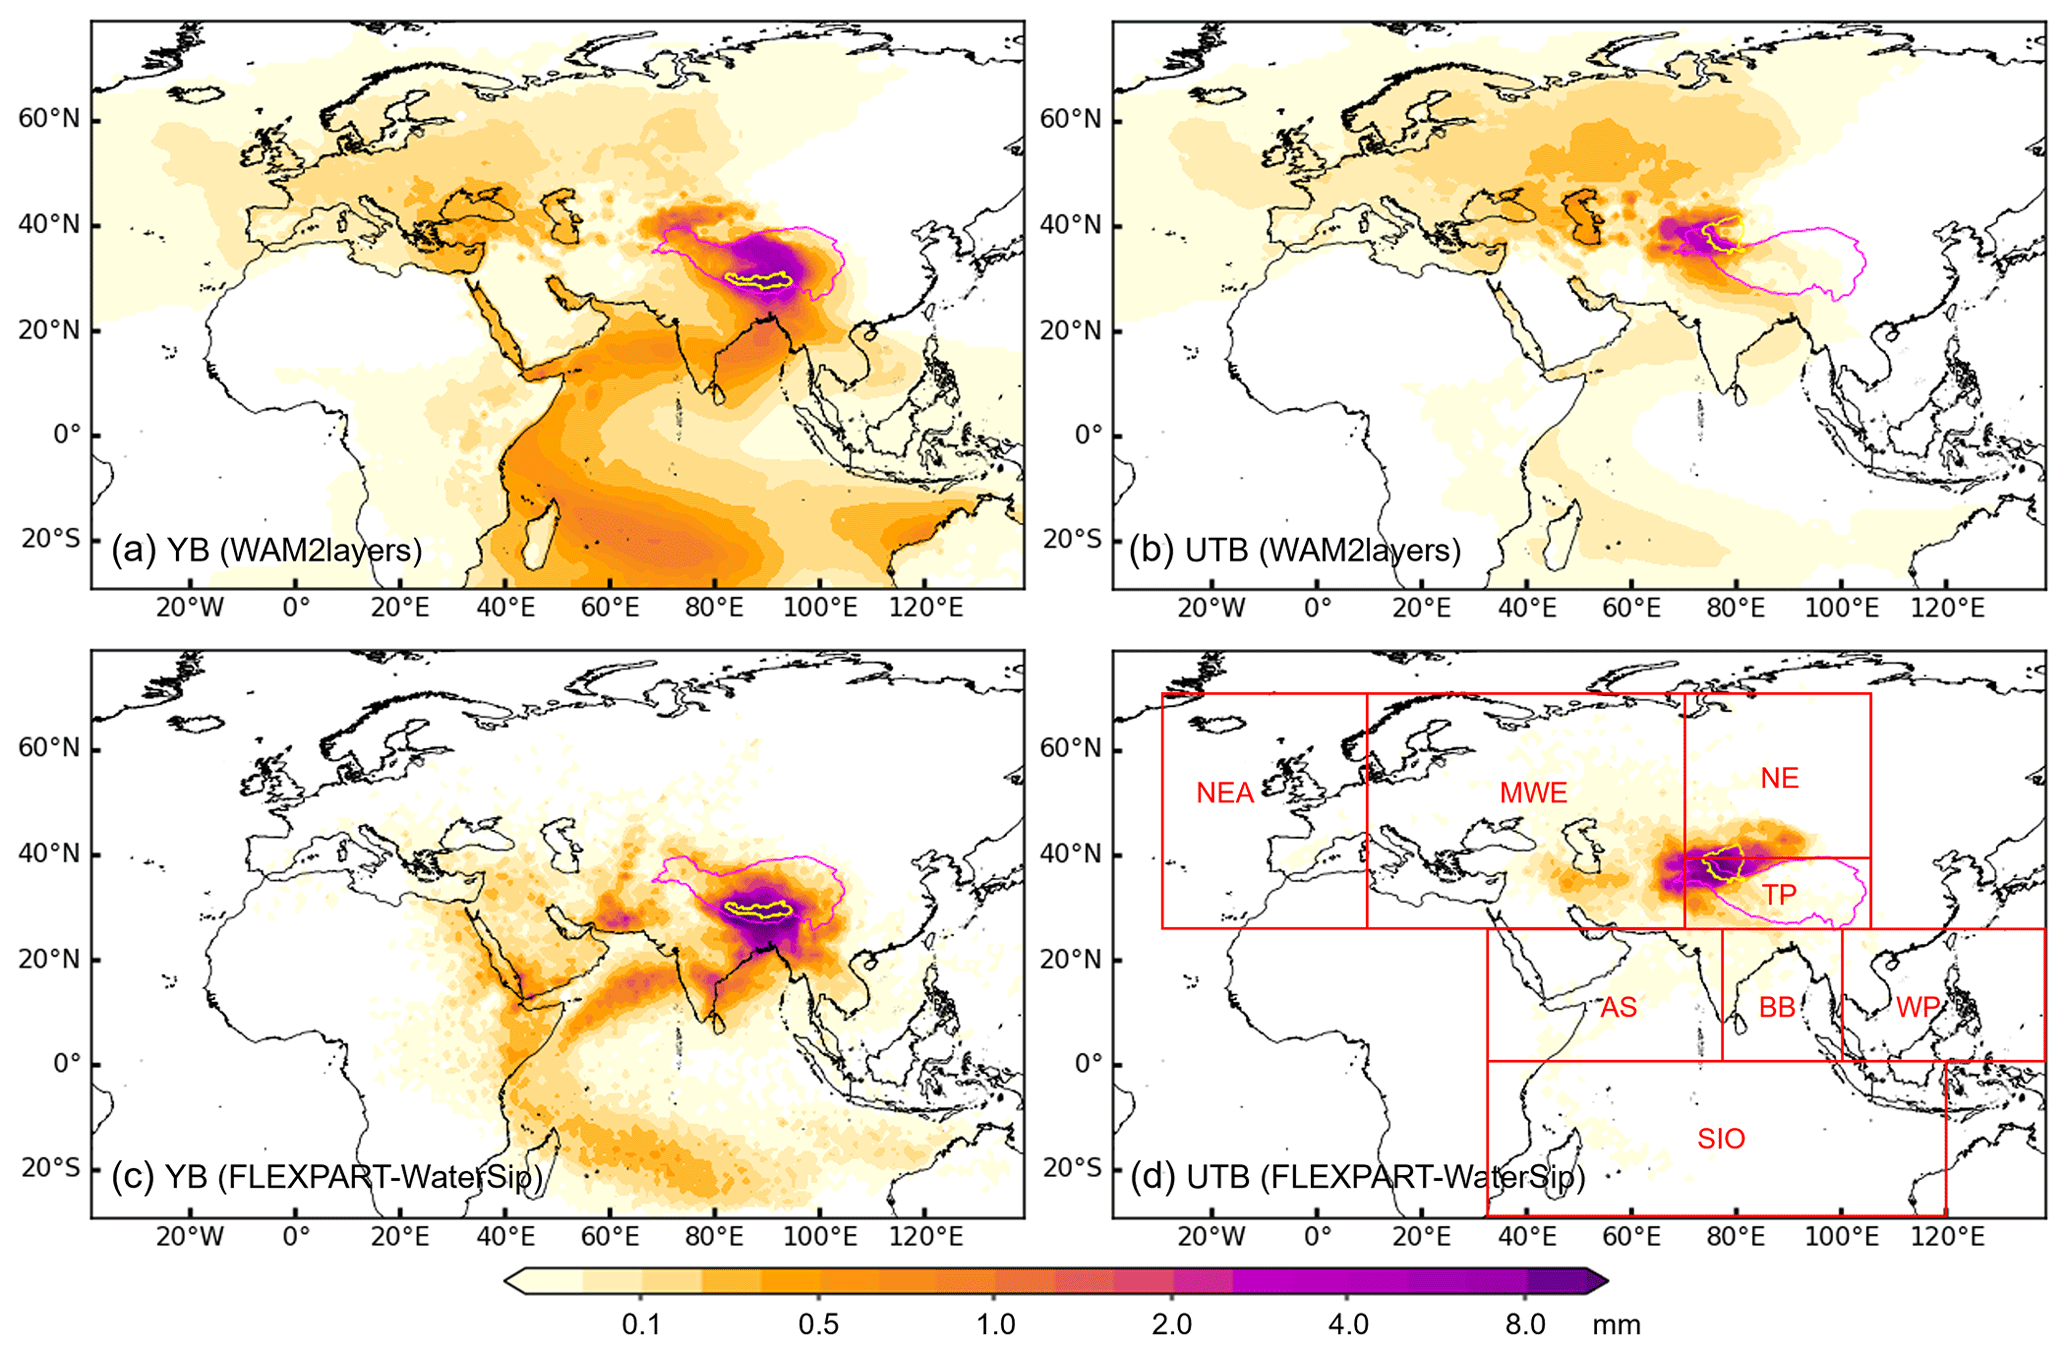
Figure 3Spatial distributions of moisture contributions (equivalent water height over source regions; mm) to precipitation in July 2022 in the (a, c) YB and (b, d) UTB simulated by (a, b) WAM2layers and (c, d) FLEXPART-WaterSip. Purple lines represent the TP boundary, and yellow lines represent the boundaries of the two representative basins. Red boxes in (d) delineate the eight source regions: northeastern Atlantic (NEA), midwestern Eurasia (MWE), northern Eurasia (NE), TP, Arabian Sea (AS), Bay of Bengal (BB), western Pacific (WP), and southern Indian Ocean (SIO).
The differences between the moisture tracking results from the two models are shown in Fig. 4 (WAM2layers minus FLEXPART-WaterSip). Compared to FLEXPART-WaterSip, WAM2layers tends to estimate a higher moisture contribution from the westerly-dominated northwestern source regions for both basins, spanning an area that extends from nearby sources northwest of the YB and west of the UTB to distant sources across the entire northwestern Eurasian continent and northeastern Atlantic. Additionally, WAM2layers estimates greater moisture contributions from large parts of the Indian Ocean, particularly the distant southern Indian Ocean in the YB simulation. In contrast, lower contributions estimated by WAM2layers are mainly from local and nearby source regions downwind of the westerlies, specifically around the southern slopes of the Himalayas in the YB simulation and the entire Tarim Basin in the UTB simulation. Notably, over the Red Sea and Persian Gulf regions, WAM2layers indicates higher moisture contributions from the oceans but lower moisture contributions from the surrounding lands than FLEXPART-WaterSip, especially in the YB simulation (Fig. 4a). These discrepancies between the two moisture tracking models are consistent in both absolute and relative terms (Figs. 4 and S2 in the Supplement).
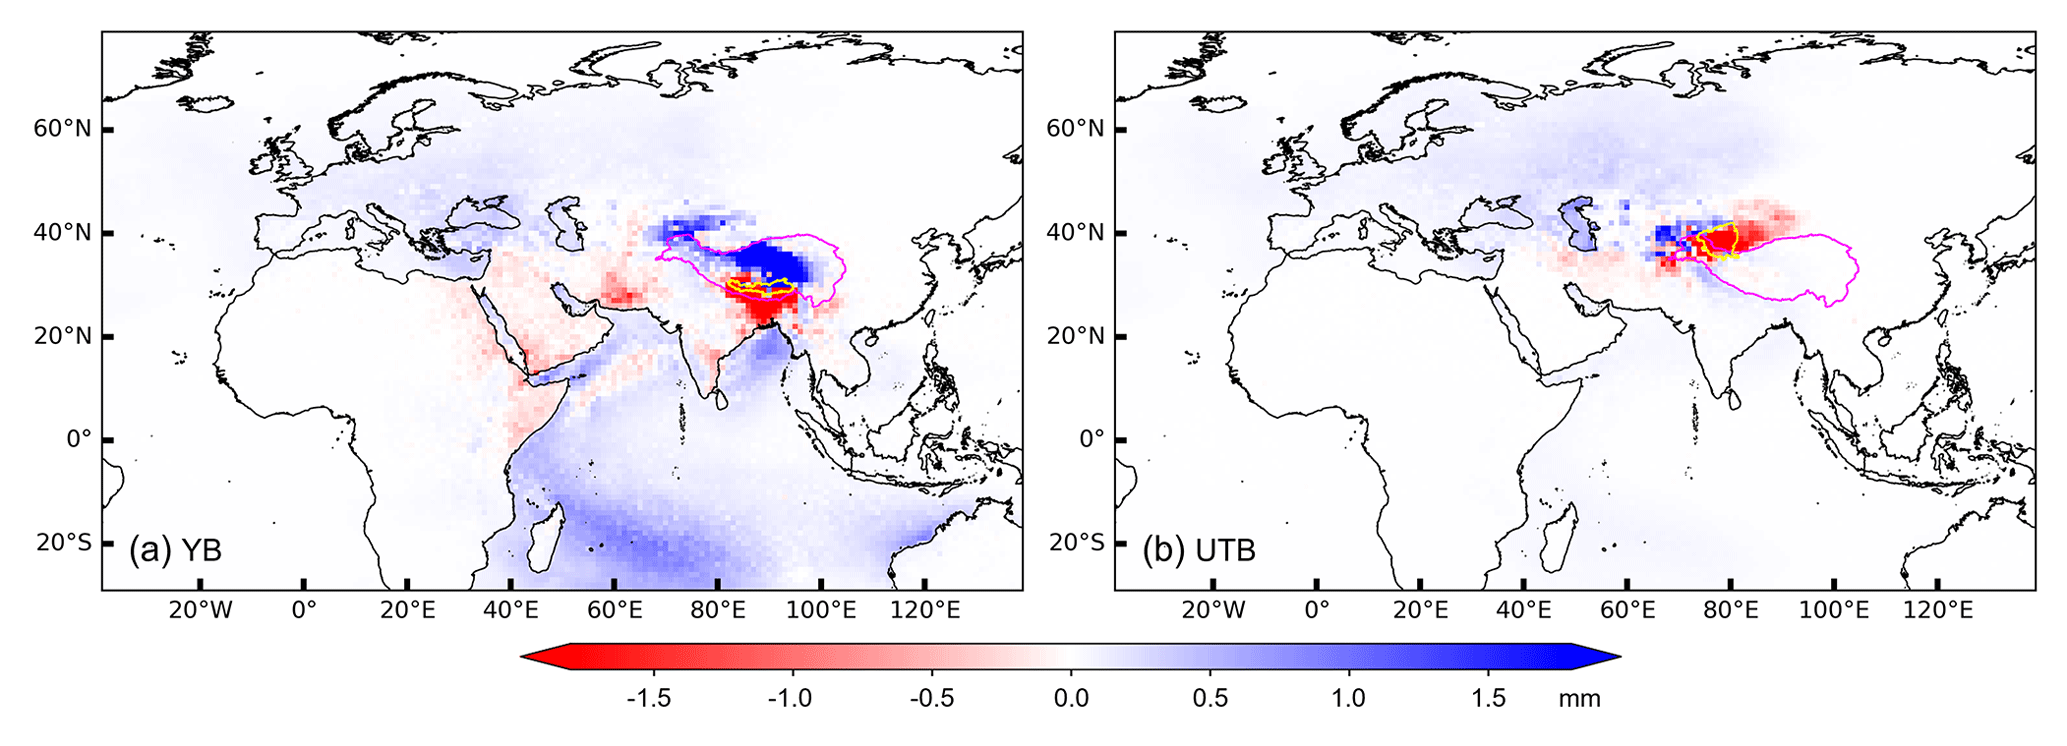
Figure 4Absolute differences in moisture contributions to precipitation in July 2022 between WAM2layers and FLEXPART-WaterSip (WAM2layers minus FLEXPART-WaterSip) for the (a) YB and (b) UTB simulations.
Considering the distribution of moisture sources, eight critical source regions (see the red boxes in Fig. 3d) are selected for further quantitative analysis. Figure 5 shows the relative contributions from the eight critical regions and remaining regions to precipitation in the YB and UTB. Both models indicate that the major moisture sources for the YB are local recycling and the ISM regions (TP, AS, BB, and SIO), whereas for the UTB, the primary sources are local recycling and westerly-influenced regions (TP, NE, and MWE). Specifically, WAM2layers estimates that the TP contributes 32 % of the moisture to the YB, which is about two-thirds of the estimate by FLEXPART-WaterSip (53 %). An even greater discrepancy is observed for the contribution of the TP to the UTB, for which WAM2layers estimates 28 % compared to FLEXPART-WaterSip's 72 %. For distant sources, the SIO is the most representative one for the YB, with WAM2layers estimating its contribution at 30 %, compared to only 11 % by FLEXPART-WaterSip. For the UTB, MWE is a key distant source, with WAM2layers estimating a 36 % contribution, a doubling of that calculated by FLEXPART-WaterSip (15 %). In summary, compared to FLEXPART-WaterSip, WAM2layers generally estimates higher moisture contributions from the westerly-dominated sources as well as distant sources but lower contributions from local recycling and nearby sources downwind of the westerlies.
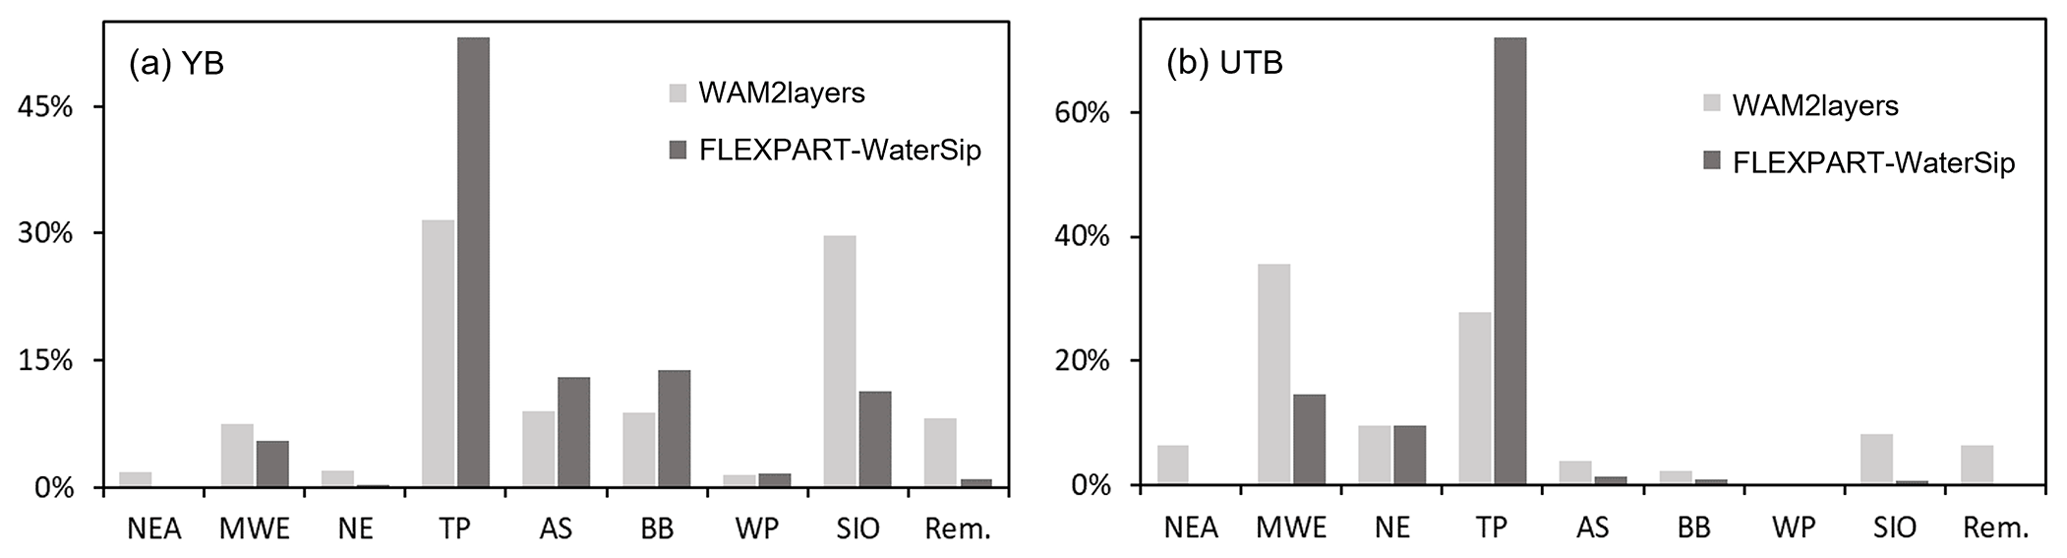
Figure 5Relative moisture contributions (%) to precipitation in July 2022 over the (a) YB and (b) UTB from the eight selected source regions (NEA, MWE, NE, TP, AS, BB, WP, and SIO) and the remaining (Rem.) source regions simulated by WAM2layers and FLEXPART-WaterSip.
When tracing moisture sources, WAM2layers primarily utilizes horizontal moisture fluxes in the upper and lower atmospheric layers to determine the water vapor transport from global sources to the target region in backward mode. Figure 6 illustrates the average moisture transport fluxes in the two layers during the entire simulation period as estimated by WAM2layers. The ISM-dominated moisture transport to the TP region primarily occurs in the lower layer, whereas the westerly-dominated moisture transport to the region is mainly from the north in the lower layer and from the west in the upper layer, a phenomenon particularly pronounced in the northwest vicinity of the UTB.
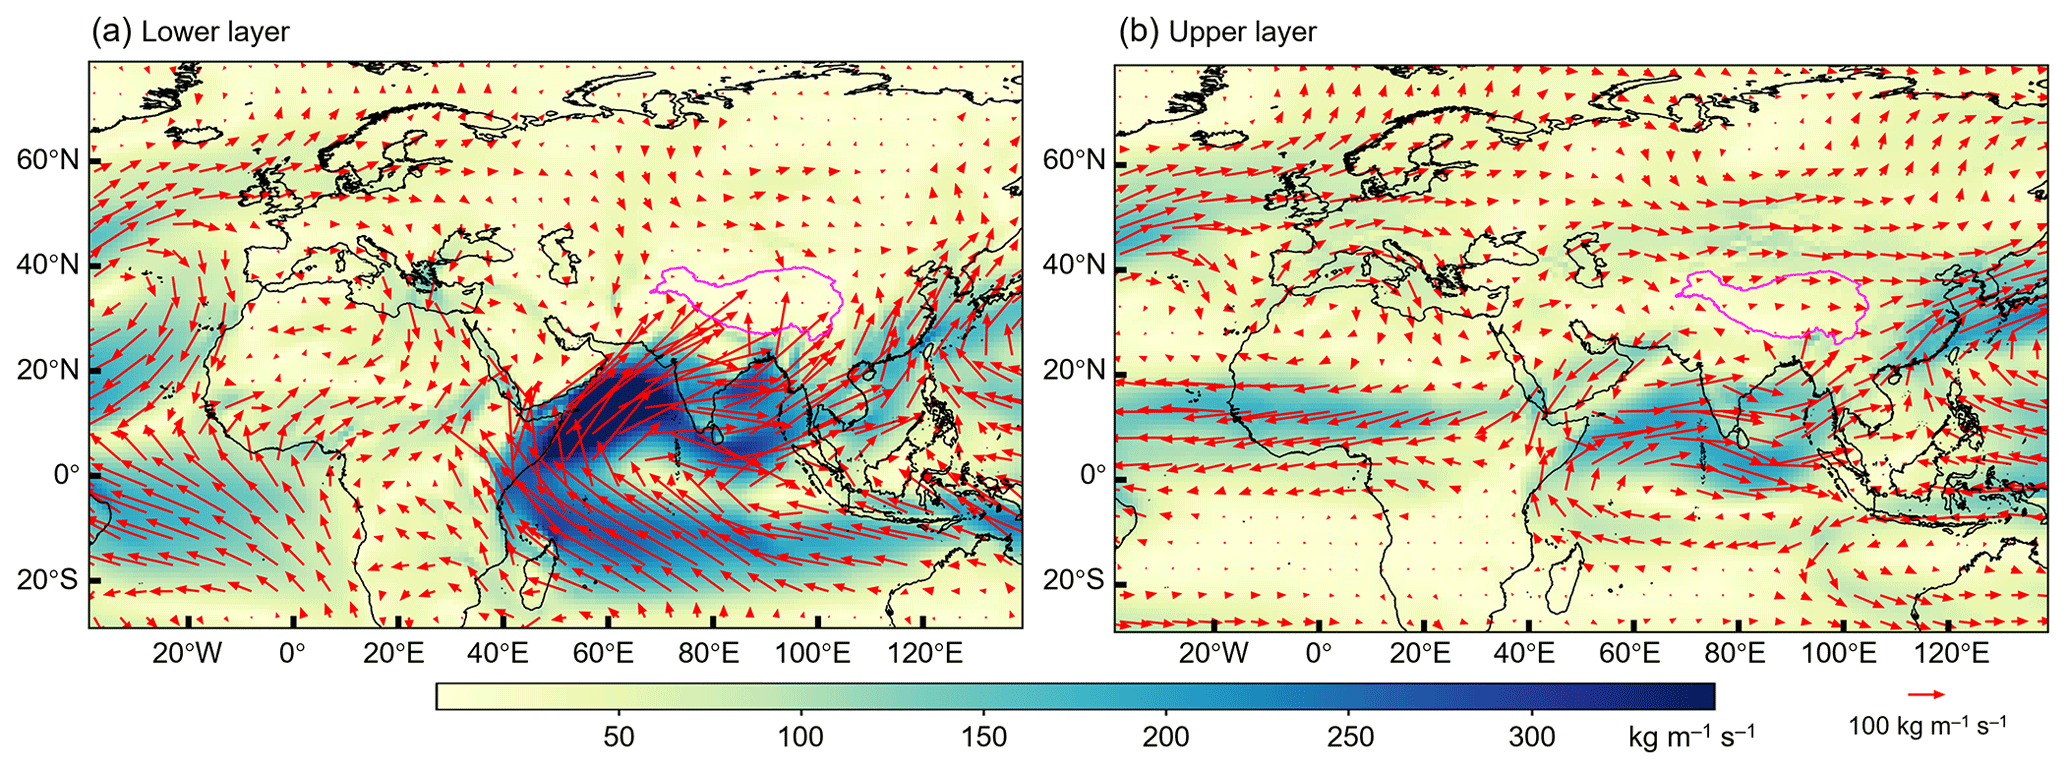
Figure 6Average moisture transport fluxes () in the (a) lower and (b) upper layers in WAM2layers during the entire simulation period (June–July 2022).
In comparison, FLEXPART outputs detailed information on air particles and trajectories that is critical to diagnosing moisture sources. Figure 7 shows the spatial distributions of particles and trajectories contributing to precipitation over the YB and UTB in the FLEXPART-WaterSip simulation. It should be noted that the particles and trajectories in Fig. 7 are clustered results using the k-means clustering method for clearer graphical representation, reducing the number of particles by a factor of 100 and the number of trajectories by a factor of 150. This treatment may have filtered out some chaotic and distant particles and trajectories. In Lagrangian backward simulations, particles released from the YB predominantly travel southwestward, while those from the UTB primarily spread westward (Fig. 7a and b). Within about 15 d, the traced particles can reach the farthest source regions. The results of backward-tracking days suggest approximately three distinct fastest moisture transport paths to the YB: the northwestern route from MWE, the southwestern route from the AS, and the southeastern route from the WP. The most pronounced moisture transport path to the UTB is confined to western routes. Additionally, there is a notable rapid northeastward transport of tracked particles in the UTB over a short period after release (Figs. 7b and 3d), a phenomenon that is indiscernible in WAM2layers simulations (Figs. 3b and d and 6). This phenomenon may be associated with the complex and variable convective activities as well as the simulation biases in the region, as indicated by the vertical wind patterns at different pressure levels across the study domain (Fig. S3) and the overestimated local evaporation in FLEXPART-WaterSip (see Sects. 5 and 6).
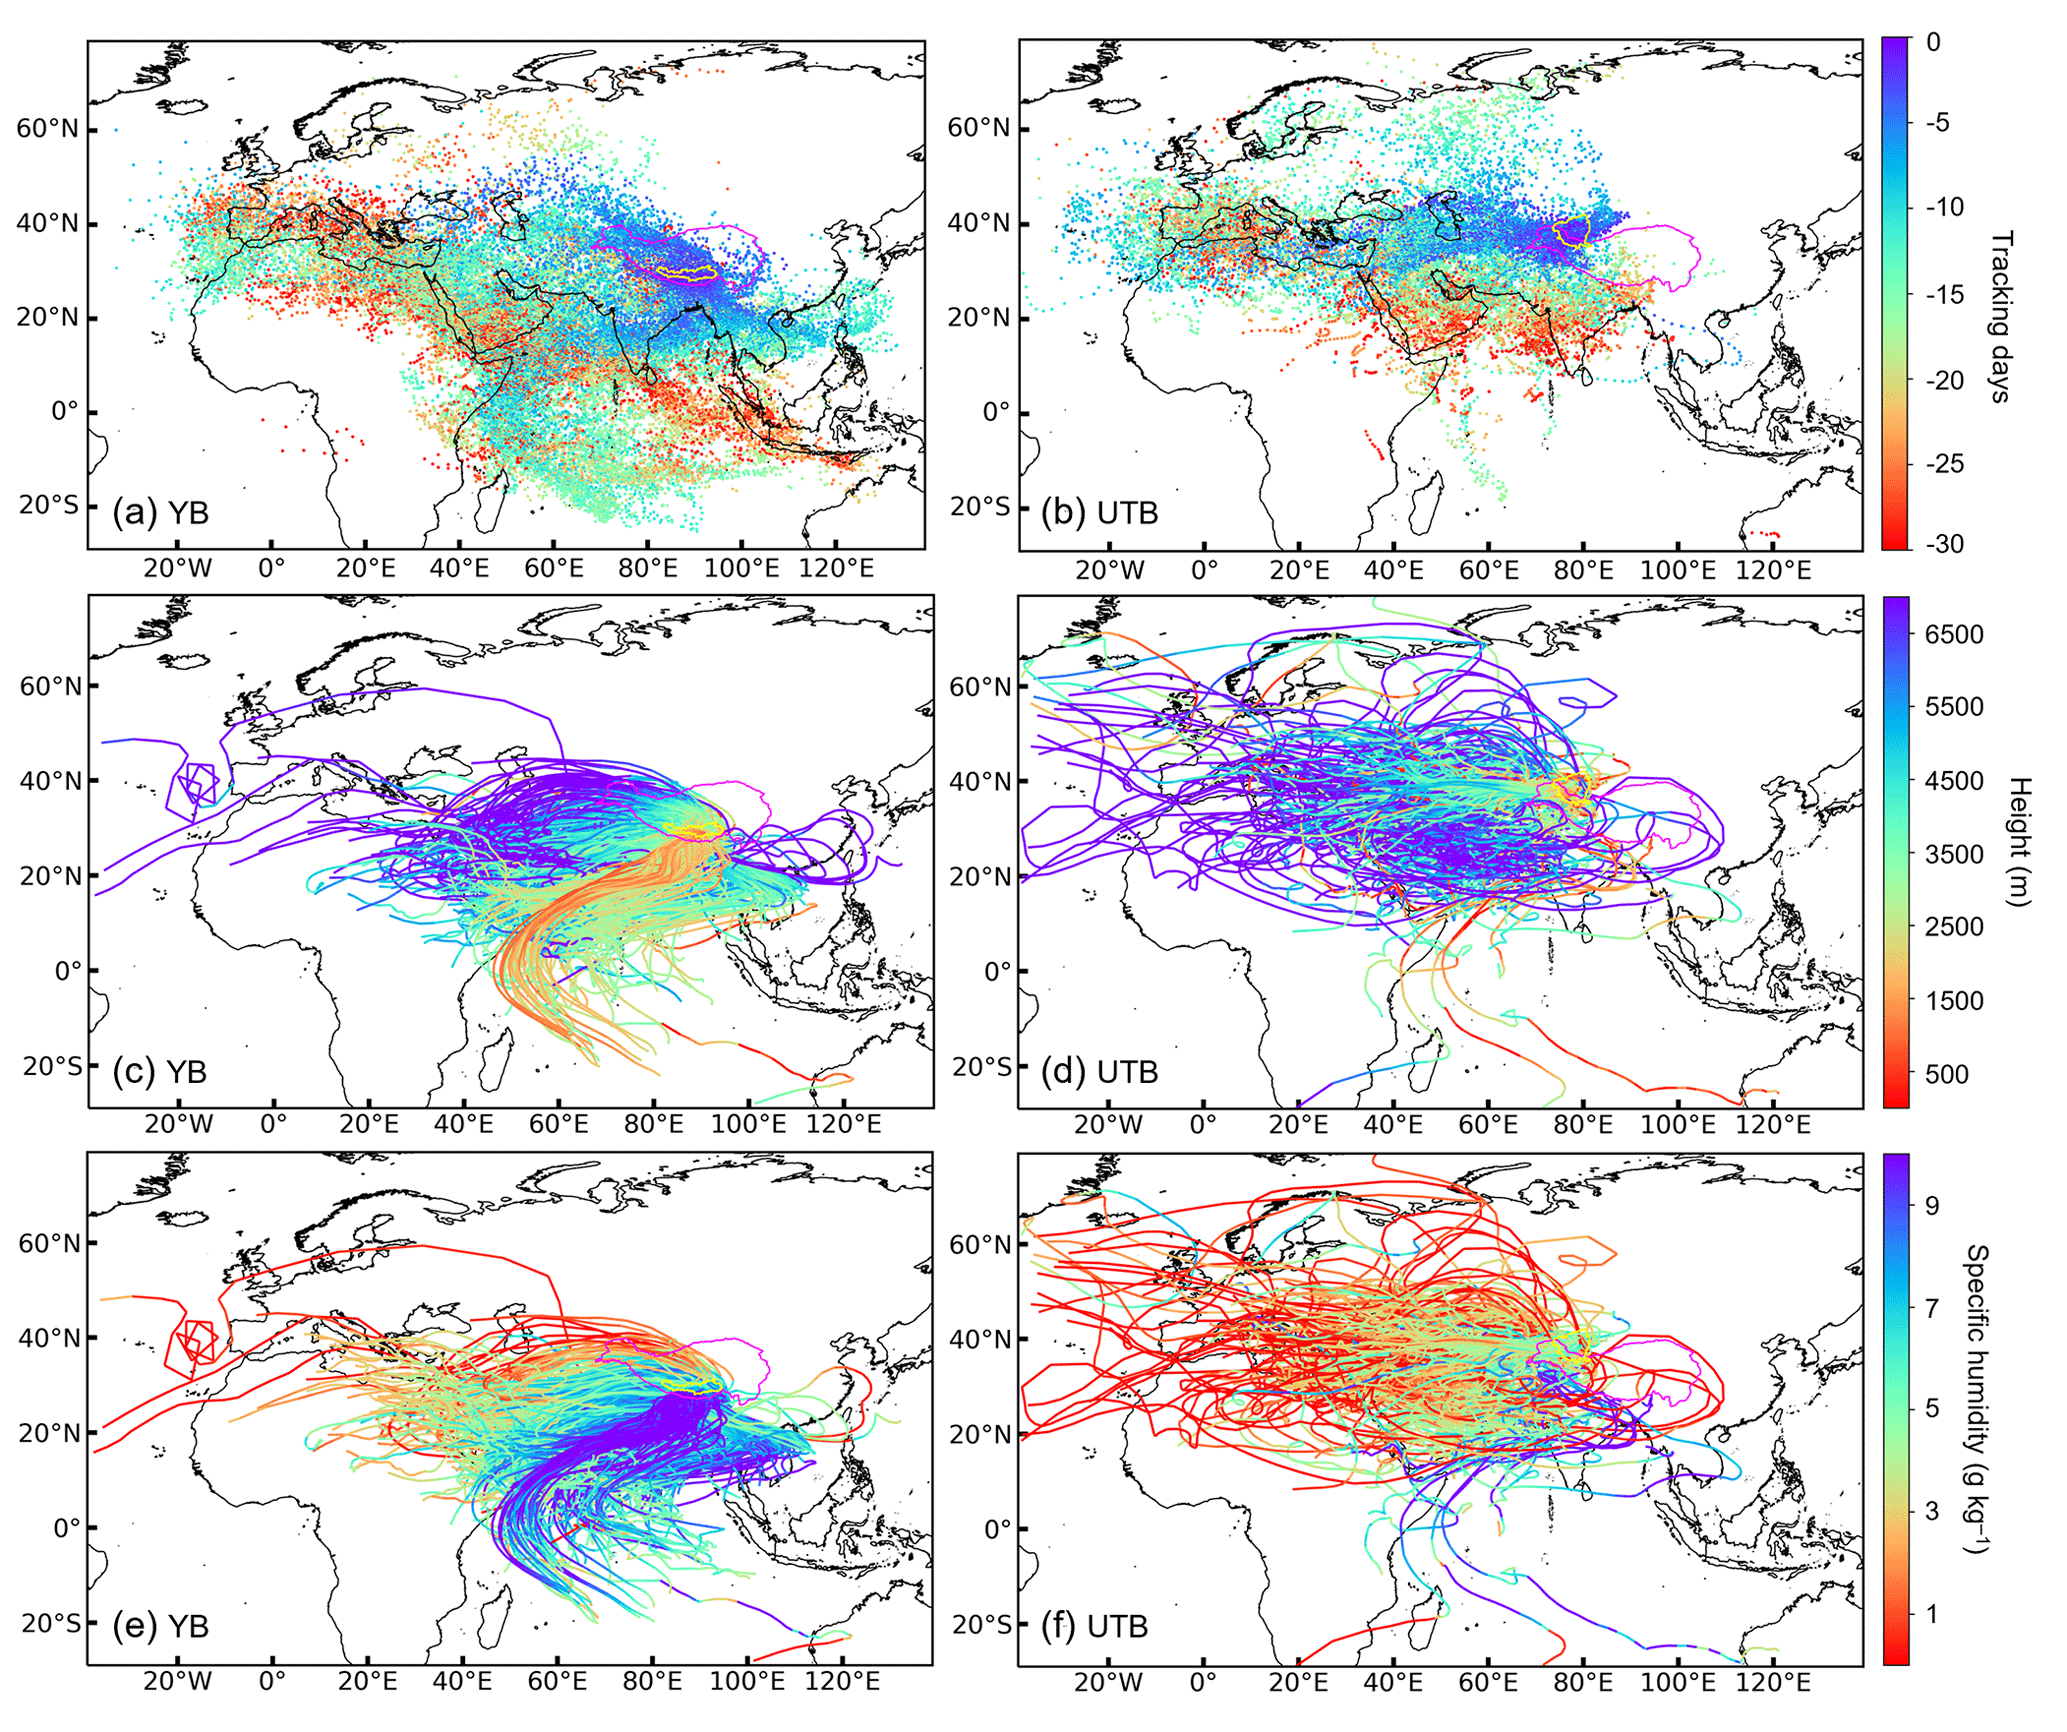
Figure 7Spatial distributions of (a, b) particles and (c–f) trajectories that transport moisture to the (a, c, e) YB and (b, d, f) UTB as simulated in FLEXPART: (a, b) particles color-coded by backward-tracking days (0–30 d), (c, d) trajectories color-coded by height (meters above ground) at each numerical step, and (e, f) trajectories color-coded by specific humidity (g kg−1) at each numerical step.
As suggested in Fig. 7c and d, trajectories originating from the western sources are typically at higher altitudes, some even exceeding 6000 m, but they notably descend before reaching the target region, forming a strip-like lower-atmospheric transport channel in the western part of the target region. This is in general consistent with WAM2layers simulations, in which the upper-layer horizontal transport of moisture originating from northwestern Eurasia is higher than that in the lower layer (Fig. 6). In comparison, trajectories from the ISM-dominated sources are at relatively low altitudes, with some originating from the SIO even descending below 1000 m. Generally, the moisture-carrying capacity of these trajectories correlates with both their altitude and the moisture conditions in their source regions. As shown in Fig. 7e and f, trajectories from the ISM-dominated regions and lower altitudes exhibit higher moisture content, whereas those from the westerly-dominated regions and higher altitudes are characterized by lower moisture content.
A notable difference between WAM2layers and FLEXPART-WaterSip simulations, as illustrated in Fig. 4, is that the spatial extent of source regions identified in FLEXPART-WaterSip is much smaller than in WAM2layers, especially in distant regions such as northwestern Eurasia. Particle trajectories simulated by FLEXPART are only sparsely distributed across northwestern Eurasia, particularly for the YB (Fig. 7). This inconsistency is also evident when comparing previous studies using WAM2layers (Zhang et al., 2017; Li et al., 2022a) and FLEXPART-WaterSip (Chen et al., 2019; Yao et al., 2020). This indicates that the underestimated moisture contributions from these distant sources in FLEXPART-WaterSip, as compared to WAM2layers, are largely due to a lower proportion of particles originating from these source regions reaching the target region.
In general, for moisture source–receptor diagnostics within a specific source region, areas with higher evaporation rates contribute more moisture to the target region than areas with lower rates, especially where the contrast between oceanic and terrestrial evaporation is pronounced. To further investigate the relationship between evaporation and simulated moisture contributions from various source regions, we employ evaporation data from ERA5 as the benchmark (“actual evaporation”; Fig. 8a) for the entire tracking period (June–July 2022). As shown in Figs. 3 and 8a, the distribution of moisture sources simulated by WAM2layers aligns more closely than FLEXPART-WaterSip with global evaporation patterns from ERA5 (oceanic evaporation rates exceed those of surrounding terrestrial areas). This alignment is particularly evident in the Red Sea and Persian Gulf regions, where one of the most pronounced discrepancies between the two models is observed (Fig. 4a).
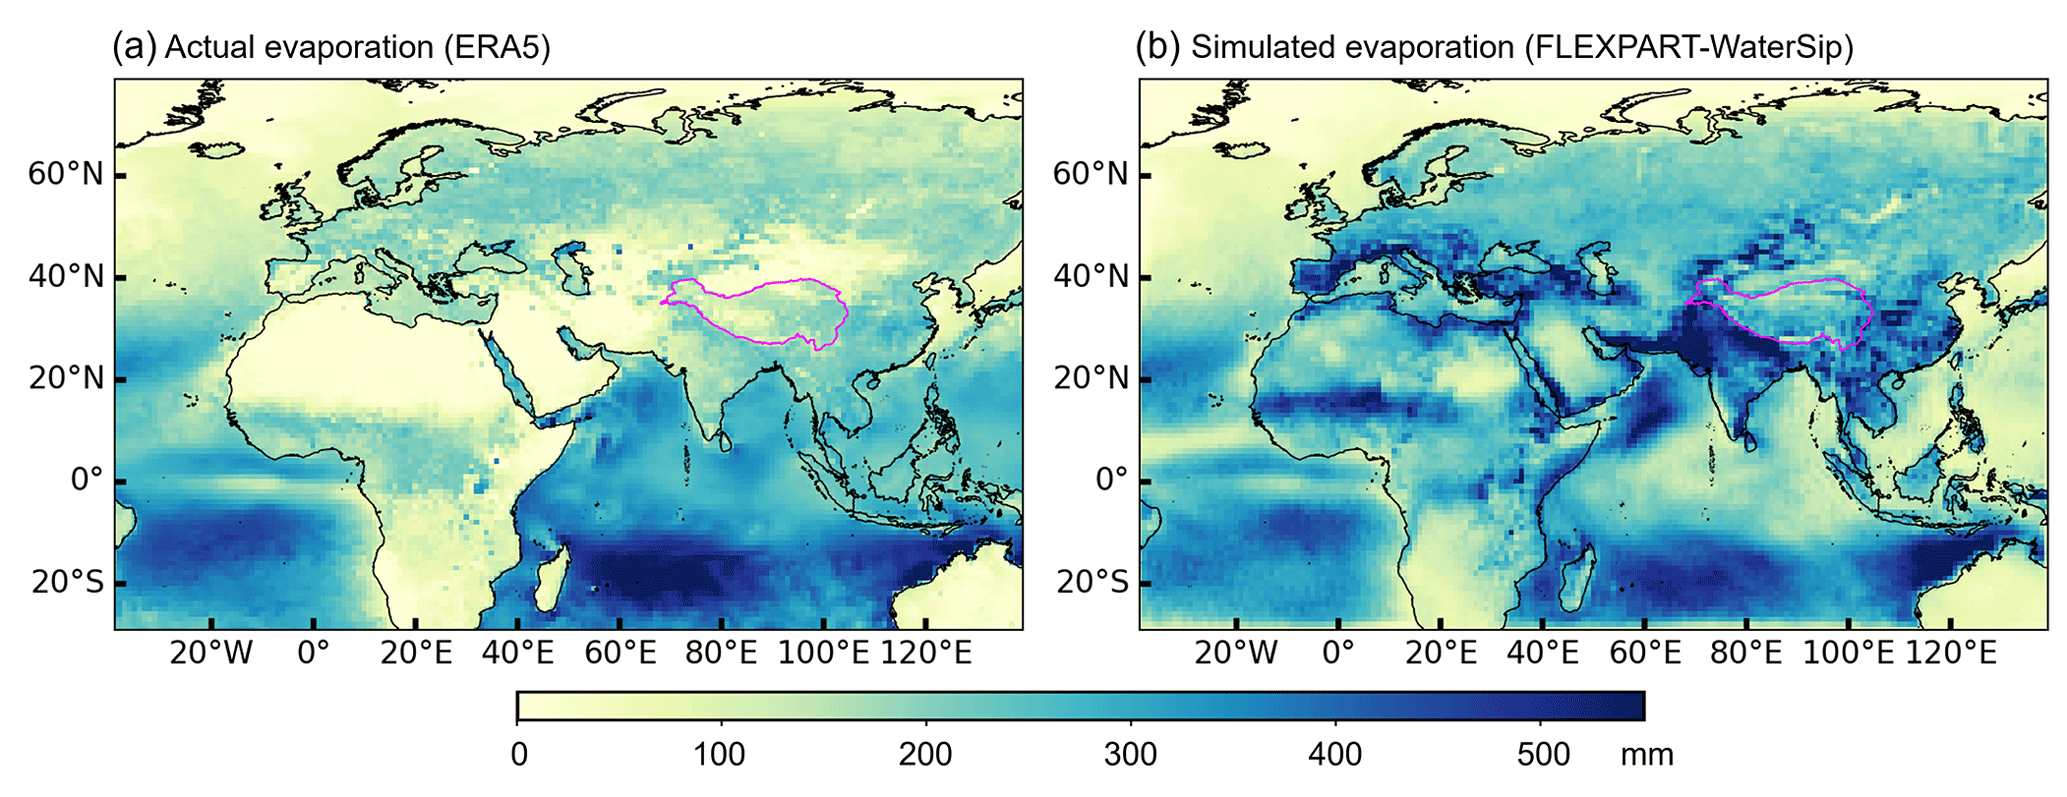
Figure 8(a) Evaporation from ERA5 and (b) simulated evaporation from FLEXPART-WaterSip during June–July 2022.
We then examine the relationship between actual evaporation and simulated moisture contributions across all grid cells in the eight selected source regions (Fig. S4). It is clear that, for both basins, positive correlations between actual evaporation and moisture contributions mainly appear in WAM2layers simulations, especially in the westerly-dominated NEA and MWE as well as the ISM-dominated AS and SIO regions, where the correlation coefficients all exceed 0.3. In contrast, FLEXPART-WaterSip simulations rarely show strong positive correlations between actual evaporation and moisture contributions. A striking example is the Red Sea and Persian Gulf regions, where oceanic evaporation is notably higher than terrestrial evaporation (Fig. 8a). As mentioned above, FLEXPART-WaterSip appears to inadequately capture the relatively high evaporation over the Red Sea, Persian Gulf, and eastern Mediterranean (see Fig. 3c), despite a high number of tracking particles in these regions (see Fig. 7a). We speculate that the complex atmospheric activities in these regions, as partially evidenced by vertical velocities in Fig. S3, may contribute to these issues in moisture source diagnosis using the WaterSip method. Some earlier studies have also indicated that this method is prone to misidentifying the convergence–divergence processes (Winschall et al., 2014; Cloux et al., 2021); in particular, a study over the Sahara has emphasized the importance of cloud microphysical processes as well as dry and moist convection embedded in the heat low (Dahinden et al., 2023). To further illustrate the underlying mechanisms, we randomly selected two representative trajectories: one from the SIO to the YB and the other from the NEA to the UTB (Fig. S5). Comparisons between model outputs and ERA5 data, as shown in Fig. S6, suggest that the modeled changes in specific humidity for particles may not fully reflect the actual processes of precipitation and evaporation during the moisture transport. Relying solely on specific humidity changes and particle height to assess evaporation, precipitation, and moisture transport can be quite challenging. Although the WaterSip method employs thresholds (e.g., 1.5 BLH and 0.2 every 6 h for specific humidity changes) to exclude a large number of potential misdiagnoses over the source regions, further advancements in diagnostic and correction methods are still needed.
Similarly to the moisture source–receptor diagnosis for precipitation particles in the target area, computing all released particles in the atmosphere would provide simulated evaporation over the entire tracking domain. Therefore, Fig. 8b displays the FLEXPART-WaterSip-simulated evaporation over the tracking domain during the entire tracking period. In comparison with actual evaporation, FLEXPART-WaterSip generally captures the spatial pattern of evaporation across oceanic regions but largely overestimates terrestrial evaporation from middle and low latitudes (e.g., surrounding the Mediterranean, the Middle East, and the Indian subcontinent, all of which are critical source regions for the two basins in the TP). These findings are consistent with a previous long-term, global-scale study by Keune et al. (2022). Although FLEXPART-WaterSip demonstrates potential in capturing complex local atmospheric activities, the bias in simulated evaporation can inevitably affect the quantification of moisture source–receptor dynamics.
Keune et al. (2022) introduced the Heat And MoiSture Tracking framEwoRk (HAMSTER), a unified framework designed to correct biases in moisture source–receptor diagnostics based on particle trajectories from Lagrangian models. This framework leverages the relationships between actual and simulated surface fluxes (evaporation and precipitation). The first step, in line with WaterSip, is to use specific thresholds for specific humidity changes, relative humidity, and particle height to quantify moisture source–receptor relationships for precipitation in the target region (a “random attribution” method was also introduced). Subsequently, a first round of corrections is conducted by comparing actual and simulated evaporation across all source regions (i.e., bias correction of source variables). A second round of corrections then focuses on comparing actual and simulated precipitation in the target region (i.e., bias correction of receptor variables). These processes aim to achieve reasonable, bias-corrected moisture source contributions. It is noteworthy that the HAMSTER method does not include calibration for the filtering thresholds of precipitation particles in the target region, potentially leading to certain deviations in the spatiotemporal distribution of tracked particle trajectories. If actual precipitation data in the target region were used to calibrate the filtering thresholds of precipitation particles, the steps of “bias correction of receptor variables” in HAMSTER could be optimized. Inspired by the HAMSTER method, here we develop a simplified two-step approach to correct moisture tracking results from FLEXPART-WaterSip.
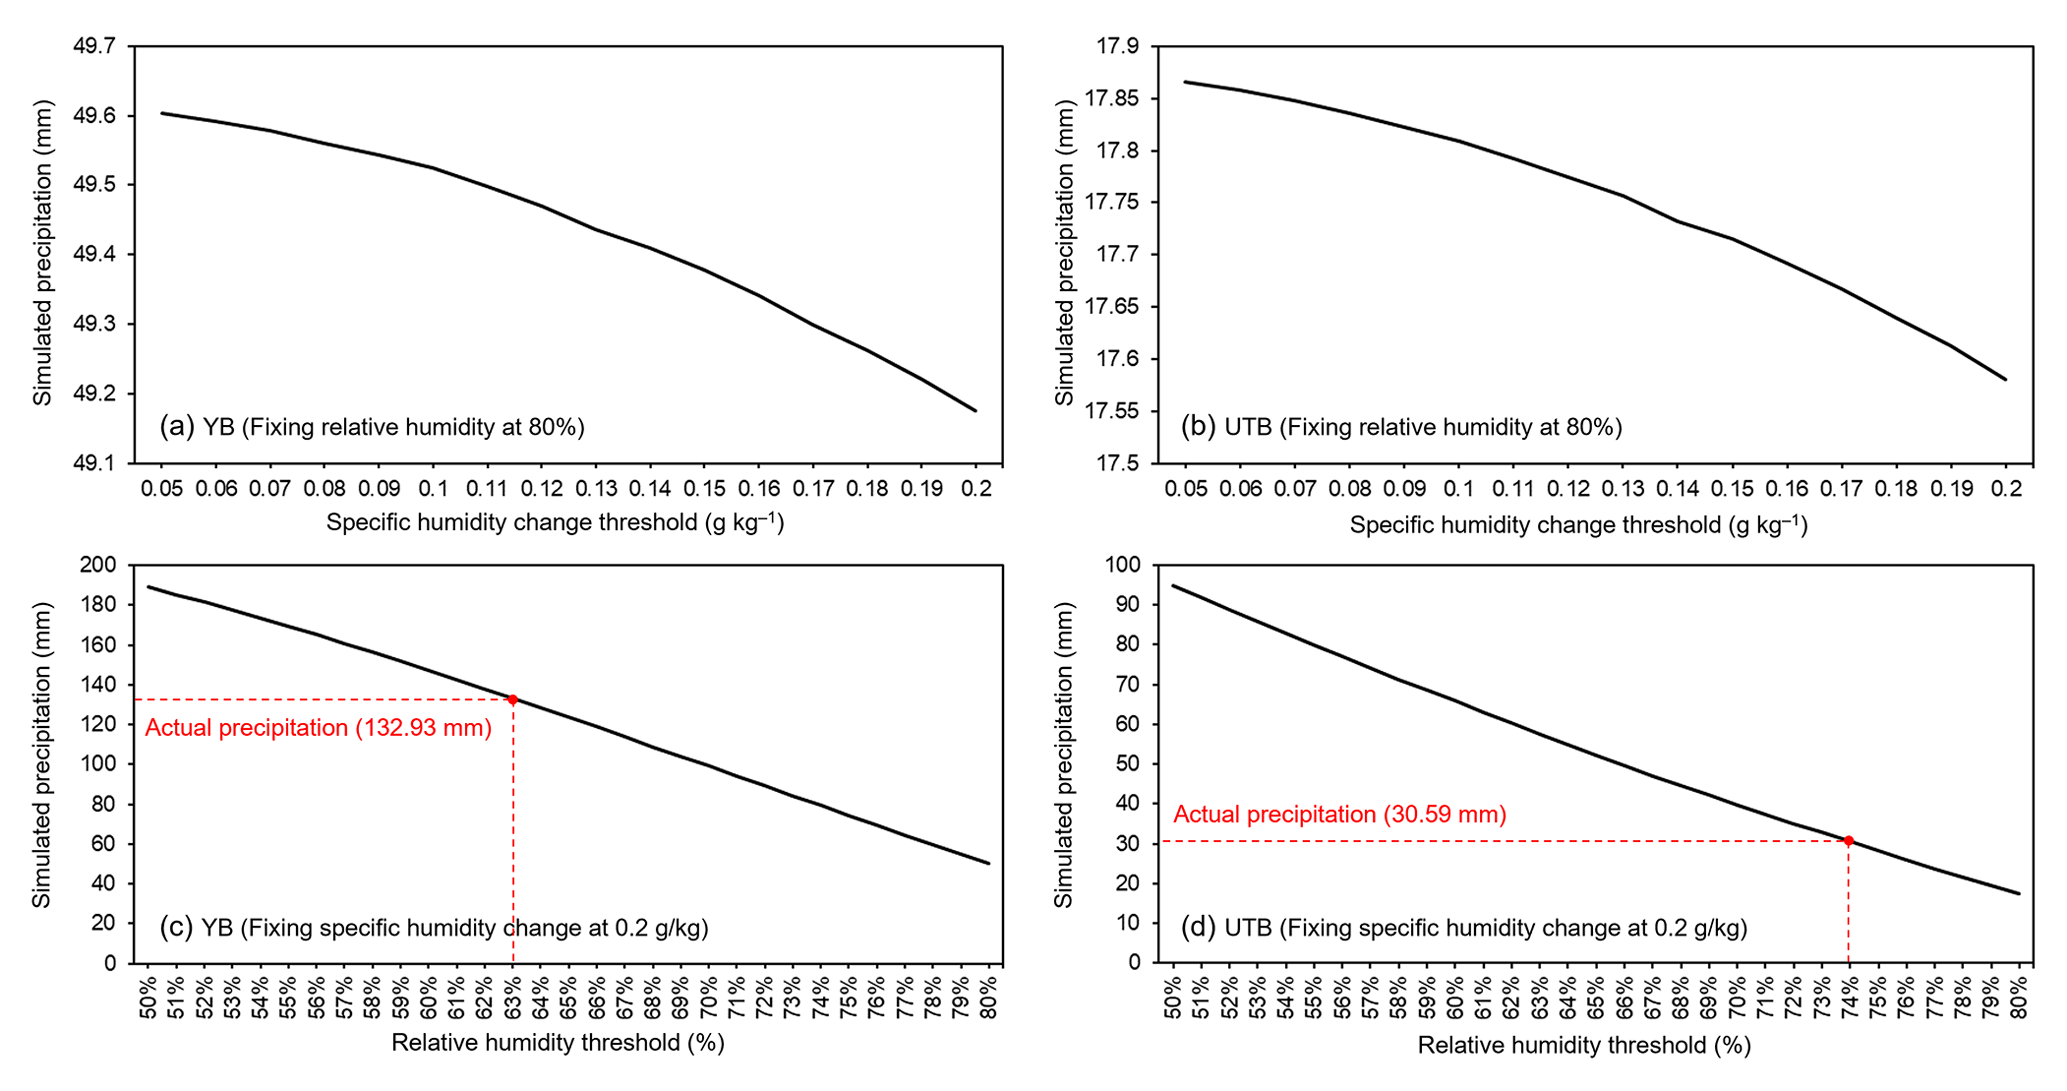
Figure 9Sensitivity of the simulated precipitation in the (a, c) YB and (b, d) UTB to (a, b) the threshold of specific humidity change and (c, d) the threshold of relative humidity.
Step 1. Optimize the filtering thresholds of precipitation particles in the target region. Using the default precipitation particle filtering thresholds for specific humidity change (0.2 g kg−1) and relative humidity (80 %), we conducted numerical experiments to examine how adjustments to these thresholds impact simulated precipitation. As shown in Fig. 9a and b, maintaining a constant relative humidity threshold at 80 % while varying the specific humidity change threshold from 0.05 to 0.2 g kg−1 results in a minimal decrease in simulated precipitation (less than 1 mm for both basins). In contrast, fixing the specific humidity change threshold at 0.2 g kg−1 while changing the relative humidity threshold leads to substantial changes in simulated precipitation (Fig. 9c and d). Our experiments indicate that precipitation simulation is more sensitive to changes in the relative humidity threshold, with optimal values of 63 % for the YB and 74 % for the UTB. This step ensures a more accurate selection of precipitation particles for subsequent moisture source diagnosis.
Step 2. Correct biases in simulated evaporation over the source regions. First, use the optimized thresholds from Step 1 to quantify moisture source contributions. Next, calculate grid-scale correction factors by dividing actual evaporation by simulated evaporation for each grid cell over the entire moisture tracking period (Fig. S7). These correction factors are then applied to correct moisture source contributions. This step addresses the simulation biases in evaporation across the moisture tracking domain when using the WaterSip method. It is important to note that although these correction factors are likely to vary over time, this variability was not accounted for in this study due to the relatively short simulation period. For long-term moisture source diagnosis corrections, implementing time-varying correction factors would be more appropriate.
The bias-corrected FLEXPART-WaterSip simulations for the YB and UTB, based on the proposed two-step bias correction approach, are shown in Fig. 10a and b. The bias correction aligns the FLEXPART-WaterSip simulation results more closely with the global pattern of terrestrial and oceanic evaporation, especially around the Red Sea and Persian Gulf regions. Additionally, it enhances the moisture contributions from the high-latitude Eurasian continent and the Indian Ocean while reducing contributions from the western land areas in the middle and low latitudes (Fig. S7). We further compare these bias-corrected simulations with the original WAM2layers and FLEXPART-WaterSip simulations, as shown in Fig. 10c–f. The differences depicted in Fig. 10c and d are generally consistent with those in Fig. 4, indicating that WAM2layers tends to estimate higher moisture contributions from the westerly-dominated sources and distant sources but lower contributions from local recycling and nearby sources downwind of the westerlies for both the YB and the UTB. Compared to the bias-corrected results, the original (uncorrected) FLEXPART-WaterSip simulations for the YB estimate lower moisture contributions from areas surrounding the target region and oceanic source regions but higher contributions from the western land areas (Fig. 10e). For the UTB, the uncorrected FLEXPART-WaterSip simulations mainly estimate higher moisture contributions from the target region and its surrounding areas (Fig. 10f), including the northeastward stretch of moisture sources observed in Fig. 3d. These comparisons demonstrate that through bias correction, the original discrepancies in reflecting actual evaporation between WAM2layers and FLEXPART-WaterSip simulations can be significantly mitigated.
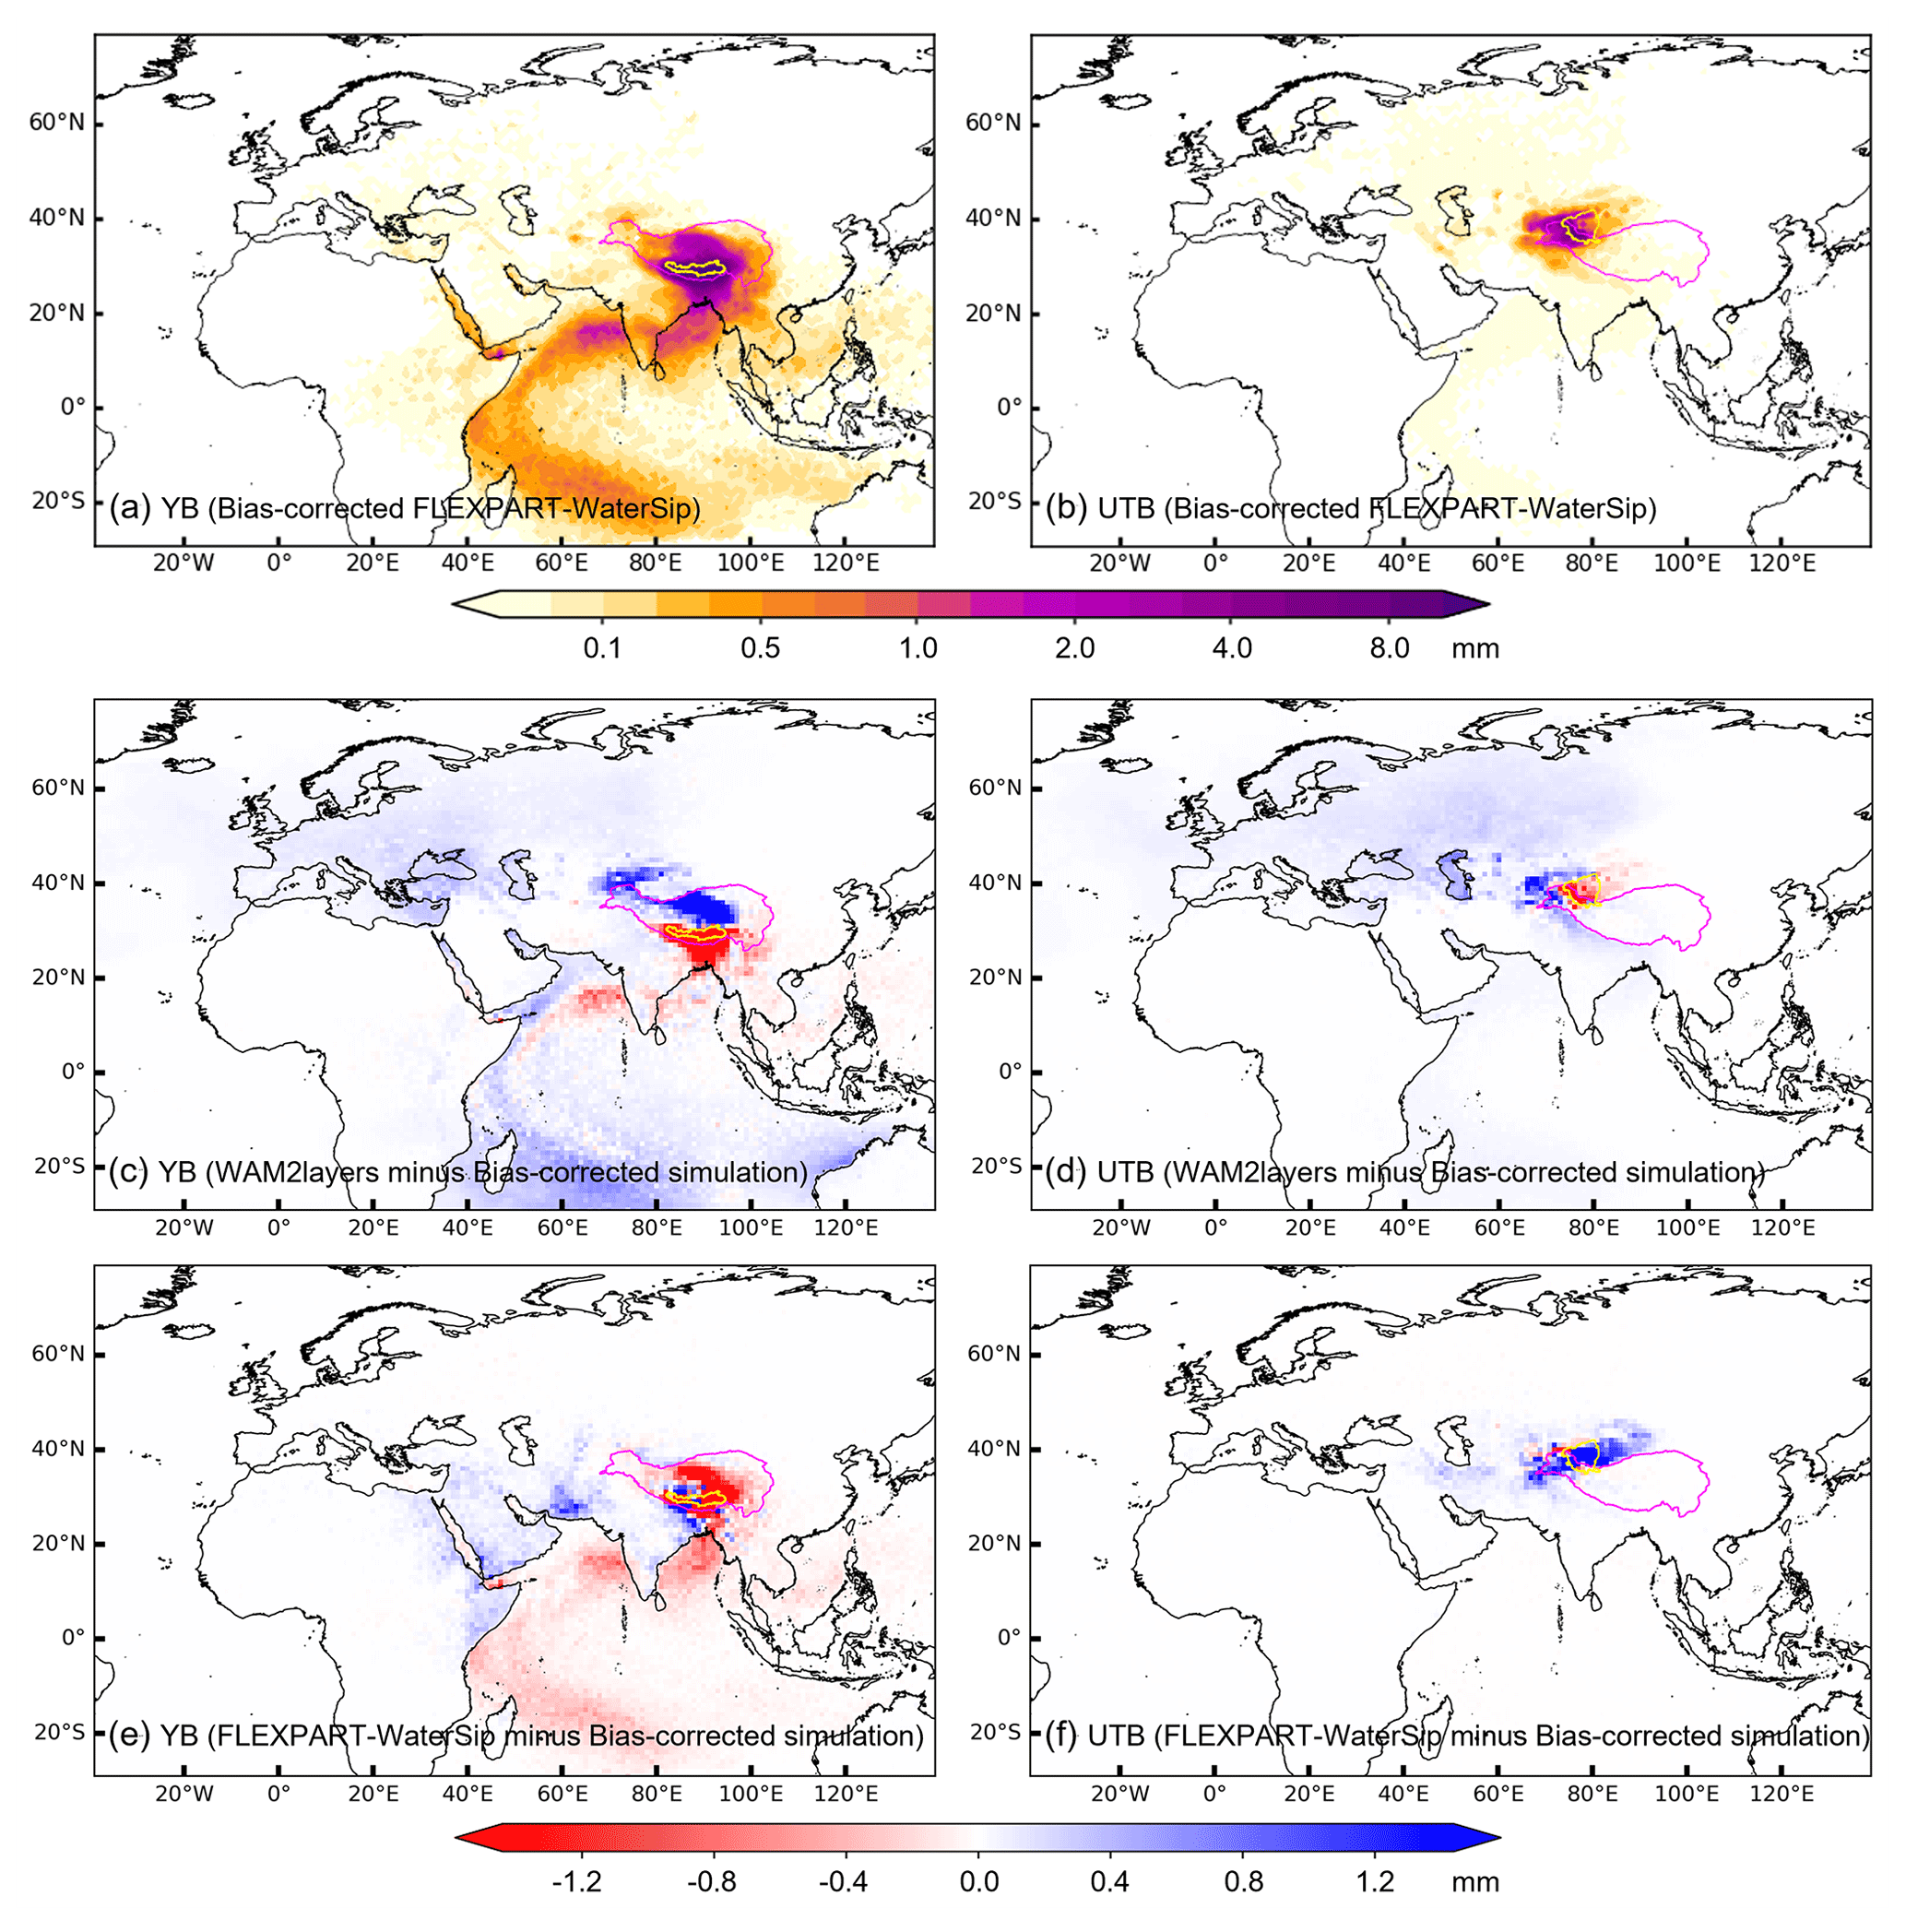
Figure 10(a, b) Spatial distributions of bias-corrected moisture contributions (equivalent water height over source regions; mm) to precipitation in July 2022 in the (a) YB and (b) UTB simulated by FLEXPART-WaterSip. (c–f) Absolute differences in moisture contributions between original WAM2layers/FLEXPART-WaterSip simulations and bias-corrected FLEXPART-WaterSip simulations for the (c, e) YB and (d, f) UTB.
We now turn to a more comprehensive examination of the discrepancies observed in the original WAM2layers and FLEXPART-WaterSip simulations. Considering the underlying physics of the models, forcing datasets, parameter selections, and our computational resources, we designed four sets of numerical experiments to investigate potential factors contributing to the discrepancies in different simulations.
Experiment 1 – model resolution. Simulation of moisture sources using WAM2layers is essentially a dynamic reproduction of moisture transport conditions based upon forcing datasets, which means that the accuracy heavily depends on the spatial and temporal resolutions of input data. In addition to the original settings (1°×1° at 3-hourly resolution), we introduce three additional configurations of ERA5 data to determine whether improved spatial and/or temporal resolutions in forcing data could provide more accurate moisture source attributions: 1°×1° at hourly resolution, 0.25°×0.25° at 3-hourly resolution, and 0.25°×0.25° at hourly resolution. The results from these additional simulations are summarized in Fig. S8.
Experiment 2 – moisture source diagnosis thresholds. Quantifying moisture source–receptor relationships in FLEXPART-WaterSip hinges on the diagnosis of potential precipitation particles and evaporation sources, which in turn depend on a set of threshold settings. Previous studies have suggested that optimal configurations for these thresholds may vary globally (Sodemann et al., 2008; Fremme and Sodemann, 2019; Keune et al., 2022). In addition to the original setting (a relative humidity threshold of 80 % and a specific humidity change threshold of 0.2 g kg−1), we introduce one additional configuration for precipitation particle selection using the optimized relative humidity threshold for the YB and UTB (63 % and 74 %, respectively) and two additional configurations for evaporation source identification with the specific humidity change threshold set at 0.1 and 0 g kg−1. The results from these additional simulations are summarized in Fig. S9.
Experiment 3 – number of particles. Using particle trajectories for source diagnostics inevitably limits the identified moisture sources that contribute to these trajectories. Consequently, a lower number of trajectories may result in potential inaccuracies, particularly when representing small- to medium-scale atmospheric processes. This numerical experiment is designed to determine whether the relatively sparse particle trajectories over distant source regions could introduce substantial uncertainties when estimating moisture contributions in FLEXPART-WaterSip. In this experiment, we reduce the number of particles initially released in FLEXPART from 5 million to 1 million. The results of this experiment are summarized in Fig. S10.
Experiment 4 – areal source–receptor attribution method. In contrast to the WaterSip method proposed by Sodemann et al. (2008), which attributes precipitation at a specific point within the target region to moisture uptake from multiple points along the trajectories, Sun and Wang (2014) introduced the “areal source–receptor attribution” method, focusing on a regional rather than a point scale. The areal source–receptor attribution method calculates the total moisture contribution from an examined source to precipitation across the entire target region instead of at specific points. It facilitates the differentiation of moisture contributions from within and outside the examined sources along the trajectories. The basic framework of the areal source–receptor attribution method is shown in Fig. S11, and its detailed methodology can be found in Sun and Wang (2014). In this numerical experiment, we apply the areal source–receptor attribution method to quantify moisture contributions from the eight source regions.
Figure 11 shows the relative moisture contributions from the eight selected source regions and the remaining source regions to the YB and UTB in the four sets of numerical experiments and the bias-corrected FLEXPART-WaterSip simulations. The result for each source region includes 11 sets of simulations, including original simulations described in Sect. 3 and the bias-corrected simulations described in Sect. 6. In Experiment 1, increasing the spatial and temporal resolutions of the forcing dataset in general aligns WAM2layers simulations more closely with the bias-corrected FLEXPART-WaterSip (e.g., see results with 0.25°×0.25° at hourly resolution in Fig. S8e and f), particularly for the YB. For nearby sources, moisture contributions from the TP to the YB (UTB) increase from 32 % (28 %) to 51 % (44 %). For distant sources, contributions from the SIO and MWE to the YB (UTB) decrease from 30 % (8 %) to 13 % (2 %) and from 7 % (36 %) to 5 % (34 %), respectively. Our sensitivity experiments for temporal and spatial resolutions reveal that increasing temporal resolution (from 3 to 1 h) substantially enhances the reliability of moisture source simulations (Fig. S8a and b). This aligns with prior knowledge that models with finer temporal resolution are better at capturing atmospheric perturbations, which could be of significant importance for moisture tagging (van der Ent et al., 2013). In contrast, solely increasing spatial resolution (from 1° to 0.25°) may lead to a stronger eastward extension of moisture sources for both basins (Fig. S8c and d), which is inconsistent with WAM2layers (0.25°, 1 h) and bias-corrected FLEXPART-WaterSip results. In addition to spatiotemporal resolutions, van der Ent et al. (2013) previously concluded that the two primary factors affecting the WAM2layers simulations are the moisture-weighted well-mixed assumption and the method used to handle wind shear and turbulence. However, addressing these issues is beyond the scope of this work. Moreover, Tuinenburg and Staal (2020) advised caution regarding the large moisture fluxes relative to Eulerian grid cells as well as the use of smaller time steps to mitigate numerical dispersion. Overall, Experiment 1 demonstrates that improving the spatiotemporal resolutions of forcing data in WAM2layers can mitigate the underestimation of nearby sources and overestimation of distant sources for both basins, particularly for the YB.
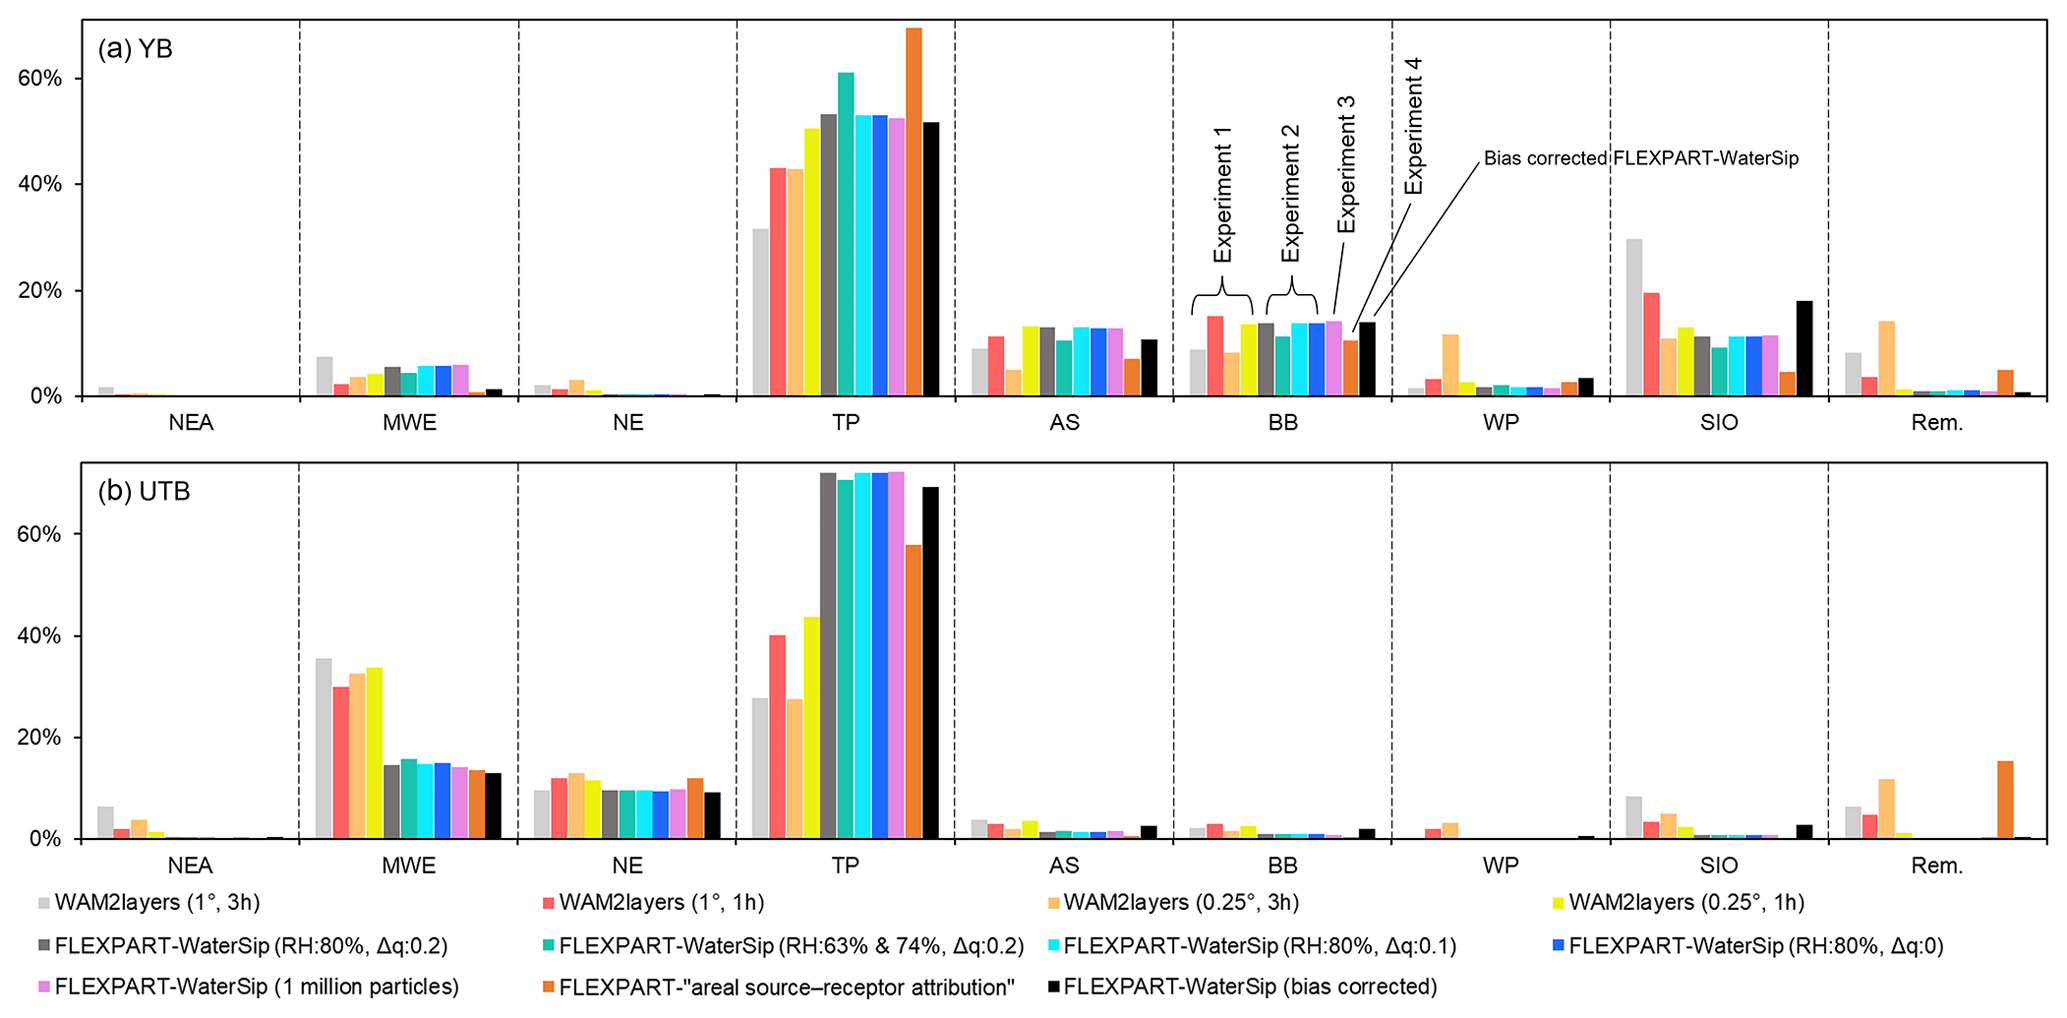
Figure 11Relative moisture contributions (%) to precipitation over the (a) YB and (b) UTB from the eight selected source regions and the remaining (Rem.) source regions simulated by four sets of numerical experiments (including different configurations in WAM2layers and FLEXPART-WaterSip and FLEXPART–areal source–receptor attribution) as well as the bias-corrected FLEXPART-WaterSip simulations. Black histograms represent the bias-corrected FLEXPART-WaterSip simulations. RH and Δq represent the relative humidity threshold and specific humidity change threshold (g kg−1), respectively. Experiments 1–4 correspond to numerical experiments focusing on model resolution, moisture source diagnosis thresholds, number of particles, and areal source–receptor attribution method, respectively.
In Experiment 2, adjusting the thresholds of relative humidity substantially enhances the overall moisture contributions from the source regions to both basins of the TP, yet it has a minimal effect on the spatial patterns of moisture sources (Fig. S9a and b). Sensitivity experiments on the specific humidity change threshold show only a slight impact on moisture source simulations for the two basins (Fig. S9c–f). Generally, modifying the thresholds of moisture source–receptor diagnostics does not seem to reduce the potential biases in the spatial distributions of moisture sources when compared to the bias-corrected FLEXPART-WaterSip. In Experiment 3, reducing the number of released particles somewhat limits our ability to discern finer details in the spatial distribution of moisture sources (Fig. S10), although the quantified moisture contributions closely resemble those in the original FLEXPART-WaterSip simulations with 5 million particles. This is in line with a previous study showing that the Lagrangian model is not very sensitive to the number of particles once a certain threshold is reached (Tuinenburg and Staal, 2020). In Experiment 4, unlike the WaterSip method, the areal source–receptor attribution method utilizes all simulated trajectories for moisture source diagnosis, which may cause errors to accumulate in trajectories that do not result in precipitation in the target region. Reapplying the areal source–receptor attribution method with trajectories filtered by the WaterSip method can produce moisture contributions that more closely align with the FLEXPART-WaterSip estimates (results not shown). Overall, these sensitivity experiments underscore the fact that current approaches to diagnosing moisture sources for the TP using numerical moisture tracking models still hold substantial potential for improvement and refinement.
Over the past few decades, considerable efforts have been made to identify and quantify the contributions of moisture sources to precipitation over the TP. A synthesis of these studies indicates that the most commonly used Eulerian and Lagrangian moisture tracking models are WAM2layers and FLEXPART-WaterSip, respectively. However, the suitability and reliability of these models for moisture tracking over the TP, especially the potential discrepancies in moisture tracking results, have not yet been thoroughly examined. This study addresses this gap by focusing on two representative basins of the TP: the YB (representing the ISM-dominated regions) and the UTB (representing the westerly-dominated regions). Moisture source contributions to precipitation over these two basins were tracked using both WAM2layers and FLEXPART-WaterSip. We then investigated the discrepancies in moisture tracking results between these two models and their potential determinants through comparisons with actual evaporation, bias correction, and a set of sensitivity experiments.
WAM2layers, designed for moisture tracking based on the water balance equation at a spatial–temporal resolution constrained by the forcing dataset, may face challenges in accurately capturing moisture transport to target regions through smaller-scale atmospheric processes. Compared with FLEXPART-WaterSip, the application of WAM2layers over the TP is more computationally efficient. A notable pattern in WAM2layers, when compared to the bias-corrected FLEXPART-WaterSip, is its tendency to estimate higher moisture contributions from westerly-dominated sources and distant sources but lower contributions from local recycling and nearby sources downwind of the westerlies. However, this can be mitigated by utilizing higher spatial and temporal resolutions for the forcing dataset in WAM2layers, with a priority of improving temporal resolution, particularly in the ISM-dominated YB region. In addition, WAM2layers offers one notable advantage over FLEXPART-WaterSip: its simulated spatial distribution of moisture sources is more consistent with the pattern of actual evaporation, particularly around the Red Sea and Persian Gulf regions where the contrast between terrestrial and oceanic evaporation is strong.
FLEXPART, designed to track air particles in the atmosphere based on well-established physical mechanisms, is complemented by the WaterSip method to diagnose moisture source–receptor relationships with information from simulated trajectories. FLEXPART-WaterSip enables us to investigate the movement of air particles transporting moisture in a detailed three-dimensional space. We investigated the potential impact of different filtering thresholds applied to the WaterSip method and of varying the numbers of released particles on moisture source–receptor diagnostics. The simulation of precipitation in the two basins is more sensitive to changes in relative humidity thresholds, while adjusting the specific humidity change threshold does not significantly improve the estimated moisture source contributions. Nevertheless, the WaterSip method facilitates calibration of simulation biases by comparing results with observations (such as precipitation and evaporation). Therefore, if possible, we recommend bias-correcting the simulations from FLEXPART-WaterSip (through, for example, the method proposed by Keune et al., 2022, or the simplified two-step approach proposed in this study). The corrected results substantially reduce the evaporation biases over the source regions, particularly addressing the discrepancies arising from land–sea contrast in evaporation.
This study serves as a valuable reference for future numerical simulations aimed at tracking moisture sources across the TP region, including several crucial aspects such as model selection, error and uncertainty analysis, and strategies for improving simulation reliability. While recognizing that each model is best suited to specific scenarios, this study highlights the critical need to account for the distinct characteristics of different models and the potential uncertainties in diagnosing moisture sources. Although this investigation is confined to short-term simulations using WAM2layers and FLEXPART-WaterSip in two typical basins over the TP, it is anticipated that future research will extend such intercomparisons to other regions and even to a continental or global scale. Furthermore, in the field of numerical moisture tracking, it would be highly beneficial to explore the reliability of forcing data, incorporate additional physical moisture tracers (such as hydrogen and oxygen isotopes), and develop improved bias correction methods for moisture source–receptor diagnosis.
Code for WAM2layers (v3.0.0-beta.5) is available at its GitHub repository (https://github.com/WAM2layers/WAM2layers, van der Ent et al., 2023). Code for FLEXPART (Version 10.4) is available on its official website (https://www.flexpart.eu/, ZAMG, 2024) (for details please refer to Pisso et al., 2019). The WaterSip source code we developed in this study is available at https://doi.org/10.5281/zenodo.12780143 (Li, 2024). All additional algorithms are available on request from the corresponding authors.
ERA5 data are publicly available at the Climate Data Store (CDS) (https://doi.org/10.24381/cds.adbb2d47, Hersbach et al., 2023). The input data of WAM2layers were downloaded according to the example code at the GitHub repository (https://github.com/WAM2layers/WAM2layers, van der Ent et al., 2023). The forcing data of FLEXPART were downloaded and pre-processed using flex_extract v7.1.2, which is available at the official FLEXPART website (https://www.flexpart.eu/, ZAMG, 2024) (for details please refer to Tipka et al., 2020). All simulation results in this study are available at https://doi.org/10.5281/zenodo.12780143 (Li, 2024).
The supplement related to this article is available online at: https://doi.org/10.5194/acp-24-10741-2024-supplement.
YL conceptualized the study, carried out numerical simulations, conducted formal analysis, prepared figures, and wrote the initial draft. CW contributed to editing, discussion, and interpretation. QT, SY, and BS provided comments on the manuscript. HP and SX provided supervision during the simulations and writing.
The contact author has declared that none of the authors has any competing interests.
Publisher's note: Copernicus Publications remains neutral with regard to jurisdictional claims made in the text, published maps, institutional affiliations, or any other geographical representation in this paper. While Copernicus Publications makes every effort to include appropriate place names, the final responsibility lies with the authors.
We thank Ruud van der Ent and Harald Sodemann for their invaluable and constructive feedback on this paper. We also thank the editor, Franziska Aemisegger, for her efficient handling and insightful feedback throughout the review process.
This work was financially supported by the National Natural Science Foundation of China (grant no. 42471030), the Second Tibetan Plateau Scientific Expedition and Research Program (grant no. 2019QZKK0207-02), and the Natural Science Foundation of Hubei Province of China (grant no. 2022CFB785). Qiuhong Tang was supported by the Third Xinjiang Scientific Expedition Program (grant no. 2021xjkk0805).
This paper was edited by Franziska Aemisegger and reviewed by Ruud van der Ent and Harald Sodemann.
Ayantobo, O. O., Wei, J., Hou, M., Xu, J., and Wang, G.: Characterizing potential sources and transport pathways of intense moisture during extreme precipitation events over the Tibetan Plateau, J. Hydrol., 615, 128734, https://doi.org/10.1016/j.jhydrol.2022.128734, 2022.
Chen, B., Xu, X. D., Yang, S., and Zhang, W.: On the origin and destination of atmospheric moisture and air mass over the Tibetan Plateau, Theor. Appl. Climatol., 110, 423–435, https://doi.org/10.1007/s00704-012-0641-y, 2012.
Chen, B., Zhang, W., Yang, S., and Xu, X. D.: Identifying and contrasting the sources of the water vapor reaching the subregions of the Tibetan Plateau during the wet season, Clim. Dynam., 53, 6891–6907, https://doi.org/10.1007/s00382-019-04963-2, 2019.
Chen, Y., Liu, B., Cai, X., Zhou, T., and He, Q.: Moisture transport and sources of an extreme rainfall event of June 2021 in southern Xinjiang, China, Adv. Clim. Change Res., 13, 843–850, https://doi.org/10.1016/j.accre.2022.11.010, 2022.
Cloux, S., Garaboa-Paz, D., Insua-Costa, D., Miguez-Macho, G., and Pérez-Muñuzuri, V.: Extreme precipitation events in the Mediterranean area: contrasting two different models for moisture source identification, Hydrol. Earth Syst. Sci., 25, 6465–6477, https://doi.org/10.5194/hess-25-6465-2021, 2021.
Curio, J. and Scherer, D.: Seasonality and spatial variability of dynamic precipitation controls on the Tibetan Plateau, Earth Syst. Dynam., 7, 767–782, https://doi.org/10.5194/esd-7-767-2016, 2016.
Dahinden, F., Aemisegger, F., Wernli, H., and Pfahl, S.: Unravelling the transport of moisture into the Saharan Air Layer using passive tracers and isotopes, Atmos. Sci. Lett., 24, e1187, https://doi.org/10.1002/asl.1187, 2023.
Fremme, A. and Sodemann, H.: The role of land and ocean evaporation on the variability of precipitation in the Yangtze River valley, Hydrol. Earth Syst. Sci., 23, 2525–2540, https://doi.org/10.5194/hess-23-2525-2019, 2019.
Gimeno, L., Stohl, A., Trigo, R. M., Dominguez, F., Yoshimura, K., Yu, L., Drumond, A., Durán-Quesada, A. M., and Nieto, R.: Oceanic and terrestrial sources of continental precipitation, Rev. Geophys., 50, RG4003, https://doi.org/10.1029/2012RG000389, 2012.
Gimeno, L., Vazquez, M., Eiras-Barca, J., Sori, R., Stojanovic, M., Algarra, I., Nieto, R., Ramos, A. M., Duran-Quesada, A. M., and Dominguez, F.: Recent progress on the sources of continental precipitation as revealed by moisture transport analysis, Earth-Sci. Rev., 201, 103070, https://doi.org/10.1016/j.earscirev.2019.103070, 2020.
Guo, L., van der Ent, R. J., Klingaman, N. P., Demory, M.-E., Vidale, P. L., Turner, A. G., Stephan, C. C., and Chevuturi, A.: Moisture Sources for East Asian Precipitation: Mean Seasonal Cycle and Interannual Variability, J. Hydrometeorol., 20, 657–672, https://doi.org/10.1175/JHM-D-18-0188.1, 2019.
Guo, L., van der Ent, R. J., Klingaman, N. P., Demory, M.-E., Vidale, P. L., Turner, A. G., Stephan, C. C., and Chevuturi, A.: Effects of horizontal resolution and air–sea coupling on simulated moisture source for East Asian precipitation in MetUM GA6/GC2, Geosci. Model Dev., 13, 6011–6028, https://doi.org/10.5194/gmd-13-6011-2020, 2020.
Hersbach, H., Bell, B., Berrisford, P., Hirahara, S., Horanyi, A., Munoz-Sabater, J., Nicolas, J., Peubey, C., Radu, R., Schepers, D., Simmons, A., Soci, C., Abdalla, S., Abellan, X., Balsamo, G., Bechtold, P., Biavati, G., Bidlot, J., Bonavita, M., De Chiara, G., Dahlgren, P., Dee, D., Diamantakis, M., Dragani, R., Flemming, J., Forbes, R., Fuentes, M., Geer, A., Haimberger, L., Healy, S., Hogan, R. J., Holm, E., Janiskova, M., Keeley, S., Laloyaux, P., Lopez, P., Lupu, C., Radnoti, G., de Rosnay, P., Rozum, I., Vamborg, F., Villaume, S., and Thepaut, J.-N.: The ERA5 global reanalysis, Q. J. Roy. Meteor. Soc., 146, 1999–2049, https://doi.org/10.1002/qj.3803, 2020.
Hersbach, H., Bell, B., Berrisford, P., Biavati, G., Horányi, A., Muñoz Sabater, J., Nicolas, J., Peubey, C., Radu, R., Rozum, I., Schepers, D., Simmons, A., Soci, C., Dee, D., and Thépaut, J.-N.: ERA5 hourly data on single levels from 1940 to present, Copernicus Climate Change Service (C3S) Climate Data Store (CDS) [data set], https://doi.org/10.24381/cds.adbb2d47, 2023.
Hu, Q., Zhao, Y., Huang, A., Ma, P., and Ming, J.: Moisture Transport and Sources of the Extreme Precipitation Over Northern and Southern Xinjiang in the Summer Half-Year During 1979–2018, Front. Earth Sci., 9, 770877, https://doi.org/10.3389/feart.2021.770877, 2021.
Huang, W., Qiu, T., Yang, Z., Lin, D., Wright, J. S., Wang, B., and He, X.: On the formation mechanism for wintertime extreme precipitation events over the southeastern Tibetan Plateau, J. Geophys. Res.-Atmos., 123, 12692–12714, https://doi.org/10.1029/2018JD028921, 2018.
Keune, J., Schumacher, D. L., and Miralles, D. G.: A unified framework to estimate the origins of atmospheric moisture and heat using Lagrangian models, Geosci. Model Dev., 15, 1875–1898, https://doi.org/10.5194/gmd-15-1875-2022, 2022.
Li, Y., Su, F., Chen, D., and Tang, Q.: Atmospheric Water Transport to the Endorheic Tibetan Plateau and Its Effect on the Hydrological Status in the Region, J. Geophys. Res.-Atmos., 124, 12864–12881, https://doi.org/10.1029/2019jd031297, 2019.
Li, Y., Su, F., Tang, Q., Gao, H., Yan, D., Peng, H., and Xiao, S.: Contributions of moisture sources to precipitation in the major drainage basins in the Tibetan Plateau, Sci. China Earth Sci., 65, 1088, https://doi.org/10.1007/s11430-021-9890-6, 2022a.
Li, Y., Wang, C., Huang, R., Yan, D., Peng, H., and Xiao, S.: Spatial distribution of oceanic moisture contributions to precipitation over the Tibetan Plateau, Hydrol. Earth Syst. Sci., 26, 6413–6426, https://doi.org/10.5194/hess-26-6413-2022, 2022b.
Li, Y.: Data and scripts for “Unraveling the discrepancies between Eulerian and Lagrangian moisture tracking models in monsoon- and westerly-dominated basins of the Tibetan Plateau”, Zenodo [code] and [data set], https://doi.org/10.5281/zenodo.12780143, 2024.
Liu, R., Wen, J., Wang, X., Wang, Z., and Liu, Y.: Case studies of atmospheric moisture sources in the source region of the Yellow River from a Lagrangian perspective, Int. J. Climatol., 42, 1516–1530, https://doi.org/10.1002/joc.7317, 2021.
Liu, R., Wang, X., and Wang, Z.: Atmospheric moisture sources of drought and wet events during 1979–2019 in the Three-River Source Region, Qinghai-Tibetan Plateau, Theor. Appl. Climatol., 149, 487–499, https://doi.org/10.1007/s00704-022-04058-9, 2022.
Liu, X., Liu, Y., Wang, X., and Wu, G.: Large-Scale Dynamics and Moisture Sources of the Precipitation Over the Western Tibetan Plateau in Boreal Winter, J. Geophys. Res.-Atmos., 125, e2019JD032133, https://doi.org/10.1029/2019JD032133, 2020.
Liu, Y., Lu, M., Yang, H., Duan, A., He, B., Yang, S., and Wu, G.: Land–atmosphere–ocean coupling associated with the Tibetan Plateau and its climate impacts, Natl. Sci. Rev., 7, 534–552, https://doi.org/10.1093/nsr/nwaa011, 2020.
Ma, Y., Lu, M., Bracken, C., and Chen, H.: Spatially coherent clusters of summer precipitation extremes in the Tibetan Plateau: Where is the moisture from?, Atmos. Res., 237, 104841, https://doi.org/10.1016/j.atmosres.2020.104841, 2020.
Pan, C., Zhu, B., Gao, J., Kang, H., and Zhu, T.: Quantitative identification of moisture sources over the Tibetan Plateau and the relationship between thermal forcing and moisture transport, Clim. Dynam., 52, 181–196, https://doi.org/10.1007/s00382-018-4130-6, 2018.
Pisso, I., Sollum, E., Grythe, H., Kristiansen, N. I., Cassiani, M., Eckhardt, S., Arnold, D., Morton, D., Thompson, R. L., Groot Zwaaftink, C. D., Evangeliou, N., Sodemann, H., Haimberger, L., Henne, S., Brunner, D., Burkhart, J. F., Fouilloux, A., Brioude, J., Philipp, A., Seibert, P., and Stohl, A.: The Lagrangian particle dispersion model FLEXPART version 10.4, Geosci. Model Dev., 12, 4955–4997, https://doi.org/10.5194/gmd-12-4955-2019, 2019.
Qiu, T., Huang, W., Wright, J. S., Lin, Y., Lu, P., He, X., Yang, Z., Dong, W., Lu, H., and Wang, B.: Moisture Sources for Wintertime Intense Precipitation Events Over the Three Snowy Subregions of the Tibetan Plateau, J. Geophys. Res.-Atmos., 124, 12708–12725, https://doi.org/10.1029/2019jd031110, 2019.
Shao, L., Tian, L., Cai, Z., Wang, C., and Li, Y.: Large-scale atmospheric circulation influences the ice core d-excess record from the central Tibetan Plateau, Clim. Dynam., 57, 1805–1816, https://doi.org/10.1007/s00382-021-05779-9, 2021.
Sodemann, H., Schwierz, C., and Wernli, H.: Interannual variability of Greenland winter precipitation sources: Lagrangian moisture diagnostic and North Atlantic Oscillation influence, J. Geophys. Res.-Atmos., 113, D03107, https://doi.org/10.1029/2007JD008503, 2008.
Sprenger, M. and Wernli, H.: The LAGRANTO Lagrangian analysis tool – version 2.0, Geosci. Model Dev., 8, 2569–2586, https://doi.org/10.5194/gmd-8-2569-2015, 2015.
Stein, A. F., Draxler, R. R., Rolph, G. D., Stunder, B. J. B., Cohen, M. D., and Ngan, F.: NOAA's HYSPLIT Atmospheric Transport and Dispersion Modeling System, B. Am. Meteorol. Soc., 96, 2059–2078, https://doi.org/10.1175/BAMS-D-14-00110.1, 2016.
Sun, B. and Wang, H.: Moisture sources of semiarid grassland in China using the Lagrangian particle model FLEXPART, J. Climate, 27, 2457–2474, https://doi.org/10.1175/JCLI-D-13-00517.1, 2014.
Tipka, A., Haimberger, L., and Seibert, P.: Flex_extract v7.1.2 – a software package to retrieve and prepare ECMWF data for use in FLEXPART, Geosci. Model Dev., 13, 5277–5310, https://doi.org/10.5194/gmd-13-5277-2020, 2020.
Tuinenburg, O. A. and Staal, A.: Tracking the global flows of atmospheric moisture and associated uncertainties, Hydrol. Earth Syst. Sci., 24, 2419–2435, https://doi.org/10.5194/hess-24-2419-2020, 2020.
van der Ent, R. J., Savenije, H. H., Schaefli, B., and Steele-Dunne, S. C.: Origin and fate of atmospheric moisture over continents, Water Resour. Res., 46, W09525, https://doi.org/10.1029/2010WR009127, 2010.
van der Ent, R. J., Tuinenburg, O. A., Knoche, H.-R., Kunstmann, H., and Savenije, H. H. G.: Should we use a simple or complex model for moisture recycling and atmospheric moisture tracking?, Hydrol. Earth Syst. Sci., 17, 4869–4884, https://doi.org/10.5194/hess-17-4869-2013, 2013.
van der Ent, R. J., Wang-Erlandsson, L., Keys, P. W., and Savenije, H. H. G.: Contrasting roles of interception and transpiration in the hydrological cycle – Part 2: Moisture recycling, Earth Syst. Dynam., 5, 471–489, https://doi.org/10.5194/esd-5-471-2014, 2014.
van der Ent, R. J., Benedict, I. B., Weijenborg, C., Cömert, T., van de Koppel, N., Guo, L., de Feiter, V., and Kalverla, P.: WAM2layers (Version v3.0.0-beta.5), GitHub [code], https://github.com/WAM2layers/WAM2layers, (last access: 14 September 2024), 2023.
Wang, L., Liu, W., Xu, Z., and Zhang, J.: Water sources and recharge mechanisms of the Yarlung Zangbo River in the Tibetan Plateau: Constraints from hydrogen and oxygen stable isotopes, J. Hydrol., 614, 128585, https://doi.org/10.1016/j.jhydrol.2022.128585, 2022.
Wang, Y., Yang, K., Huang, W., Qiu, T., and Wang, B.: Dominant Contribution of South Asia Monsoon to External Moisture for Extreme Precipitation Events in Northern Tibetan Plateau, Remote Sens.-Basel, 15, 735, https://doi.org/10.3390/rs15030735, 2023.
Winschall, A., Pfahl, S., Sodemann, H., and Wernli, H.: Comparison of Eulerian and Lagrangian moisture source diagnostics – the flood event in eastern Europe in May 2010, Atmos. Chem. Phys., 14, 6605–6619, https://doi.org/10.5194/acp-14-6605-2014, 2014.
Xu, Y. and Gao, Y.: Quantification of Evaporative Sources of Precipitation and Its Changes in the Southeastern Tibetan Plateau and Middle Yangtze River Basin, Atmosphere, 10, 428, https://doi.org/10.3390/atmos10080428, 2019.
Yang, K., Wu, H., Qin, J., Lin, C., Tang, W., and Chen, Y.: Recent climate changes over the Tibetan Plateau and their impacts on energy and water cycle: A review, Global Planet. Change, 112, 79–91, https://doi.org/10.1016/j.gloplacha.2013.12.001, 2014.
Yang, S., Zhang, W., Chen, B., Xu, X., and Zhao, R.: Remote moisture sources for 6 h summer precipitation over the Southeastern Tibetan Plateau and its effects on precipitation intensity, Atmos. Res., 236, 104803, https://doi.org/10.1016/j.atmosres.2019.104803, 2020.
Yao, S., Jiang, D., and Zhang, Z.: Lagrangian simulations of moisture sources for Chinese Xinjiang precipitation during 1979–2018, Int. J. Climatol., 41, E216–E232, https://doi.org/10.1002/joc.6679, 2020.
Yao, S., Jiang, D., and Zhang, Z.: Moisture Sources of Heavy Precipitation in Xinjiang Characterized by Meteorological Patterns, J. Hydrometeorol., 22, 2213–2225, https://doi.org/10.1175/JHM-D-20-0236.1, 2021.
Yao, T., Masson-Delmotte, V., Gao, J., Yu, W., Yang, X., Risi, C., Sturm, C., Werner, M., Zhao, H., and He, Y.: A review of climatic controls on δ18O in precipitation over the Tibetan Plateau: Observations and simulations, Rev. Geophys., 51, 525–548, https://doi.org/10.1002/rog.20023, 2013.
Yao, T., Xue, Y., Chen, D., Chen, F., Thompson, L., Cui, P., Koike, T., Lau, W. K.-M., Lettenmaier, D., and Mosbrugger, V.: Recent Third Pole's rapid warming accompanies cryospheric melt and water cycle intensification and interactions between monsoon and environment: multi-disciplinary approach with observation, modeling and analysis, B. Am. Meteorol. Soc., 100, 423–444, https://doi.org/10.1175/BAMS-D-17-0057.1, 2018.
Yao, T., Bolch, T., Chen, D., Gao, J., Immerzeel, W., Piao, S., Su, F., Thompson, L., Wada, Y., Wang, L., Wang, T., Wu, G., Xu, B., Yang, W., Zhang, G., and Zhao, P.: The imbalance of the Asian water tower, Nature Reviews Earth & Environment, 3, 618–632, https://doi.org/10.1038/s43017-022-00299-4, 2022.
ZAMG: Flexpart, Welcome to the official FLEXPART web site, ZAMG, https://www.flexpart.eu/ (last access: 14 September 2024), 2024.
Zhang, C.: Moisture source assessment and the varying characteristics for the Tibetan Plateau precipitation using TRMM, Environ. Res. Lett., 15, 104003, https://doi.org/10.1088/1748-9326/abac78, 2020.
Zhang, C., Tang, Q., and Chen, D.: Recent changes in the moisture source of precipitation over the Tibetan Plateau, J. Climate, 30, 1807–1819, https://doi.org/10.1175/JCLI-D-15-0842.1, 2017.
Zhang, C., Tang, Q. H., Chen, D. L., van der Ent, R. J., Liu, X. C., Li, W. H., and Haile, G. G.: Moisture Source Changes Contributed to Different Precipitation Changes over the Northern and Southern Tibetan Plateau, J. Hydrometeorol., 20, 217–229, https://doi.org/10.1175/Jhm-D-18-0094.1, 2019.
Zhang, C., Chen, D., Tang, Q., and Huang, J.: Fate and Changes in Moisture Evaporated From the Tibetan Plateau (2000–2020), Water Resour. Res., 59, e2022WR034165, https://doi.org/10.1029/2022WR034165, 2023.
Zhang, C., Zhang, X., Tang, Q., Chen, D., Huang, J., Wu, S., and Liu, Y.: Quantifying precipitation moisture contributed by different atmospheric circulations across the Tibetan Plateau, J. Hydrol., 628, 130517, https://doi.org/10.1016/j.jhydrol.2023.130517, 2024.
Zhang, Q., Shen, Z., Pokhrel, Y., Farinotti, D., Singh, V. P., Xu, C., Wu, W., and Wang, G.: Oceanic climate changes threaten the sustainability of Asia's water tower, Nature, 615, 87–93, https://doi.org/10.1038/s41586-022-05643-8, 2023.
Zhang, Y., Huang, W., and Zhong, D.: Major Moisture Pathways and Their Importance to Rainy Season Precipitation over the Sanjiangyuan Region of the Tibetan Plateau, J. Climate, 32, 6837–6857, https://doi.org/10.1175/jcli-d-19-0196.1, 2019.
Zhao, R., Chen, B., and Xu, X.: Intensified Moisture Sources of Heavy Precipitation Events Contributed to Interannual Trend in Precipitation Over the Three-Rivers-Headwater Region in China, Front. Earth Sci., 9, 674037, https://doi.org/10.3389/feart.2021.674037, 2021.
Zhao, R., Chen, B., Zhang, W., Yang, S., and Xu, X.: Moisture source anomalies connected to flood-drought changes over the three-rivers headwater region of Tibetan Plateau, Int. J. Climatol., 43, 5303–5316, https://doi.org/10.1002/joc.8147, 2023.
Zhou, Y., Xie, Z., and Liu, X.: An Analysis of Moisture Sources of Torrential Rainfall Events over Xinjiang, China, J. Hydrometeorol., 20, 2109–2122, https://doi.org/10.1175/JHM-D-19-0010.1, 2019.
- Abstract
- Introduction
- Eulerian and Lagrangian approaches for moisture tracking: WAM2layers and FLEXPART-WaterSip
- Moisture tracking in two representative basins
- Moisture fluxes in WAM2layers and particle trajectories in FLEXPART-WaterSip simulations
- Relationship between actual evaporation and simulated moisture contributions
- Bias correction of FLEXPART-WaterSip simulations
- Potential determinants of discrepancies in moisture tracking
- Discussion and conclusions
- Code availability
- Data availability
- Author contributions
- Competing interests
- Disclaimer
- Acknowledgements
- Financial support
- Review statement
- References
- Supplement