the Creative Commons Attribution 4.0 License.
the Creative Commons Attribution 4.0 License.
 | 25 Sep 2024
Synergistic effects of the winter North Atlantic Oscillation (NAO) and El Niño–Southern Oscillation (ENSO) on dust activities in North China during the following spring
Falei Xu
Shuang Wang
Yan Li
Juan Feng
Dust significantly influences global weather and climate by impacting the Earth's radiative balance. Based on reanalysis datasets, this study explores how the North Atlantic Oscillation (NAO) and El Niño–Southern Oscillation (ENSO) during winter impact dust activities in North China in the following spring. It is found that both the NAO and the ENSO significantly affect dust activities in North China, especially during their negative phases. When both are in their negative phases, their combined impact on dust activities exceeds that of each factor individually. The previous winter's NAO notably affects sea surface temperatures (SSTs) in the North Atlantic, associated with an anomalous tripole SST pattern. These SST anomalies persist into the following spring due to their inherent persistence, inducing an anomalous atmospheric teleconnection wave train that influences dust activities in North China. The ENSO, on the one hand, directly impacts dust activities in North China by modulating circulation over the western North Pacific. Moreover, the ENSO enhances the NAO's effect on North Atlantic SST, which explains the synergistic effects of the ENSO and NAO on dust activities in North China. This study elucidates the combined role of the NAO and ENSO in influencing dust activities in North China, providing one-season-ahead signals for predicting spring dust activities in North China.
- Article
(16040 KB) - Full-text XML
- BibTeX
- EndNote


Dust, one of the most significant natural aerosols in the atmosphere, is of great importance to the global radiative balance due to its light-absorbing properties, playing a crucial role in climate change (Lou et al., 2017; Kok et al., 2023). Additionally, dust not only impacts its source regions, but also extends its influence across oceans through teleconnections driven by atmospheric circulation. This transboundary transport affects ocean–atmosphere interactions and profoundly impacts the Earth's climate system (Huang et al., 2015). Dust activities resulting from regional dust surges pose formidable threats to socio-economic development, natural ecosystems, and human health and safety (Zhao et al., 2020; Li et al., 2023). The Gobi Desert in East Asia, specifically the Mongolian Plateau and North China, is a major source of dust (Chen et al., 2023), accounting for approximately 70 % of Asia's total dust emissions (Zhang et al., 2003). Given that China is profoundly impacted by dust activities (Fan et al., 2018), exploring the variations in dust activities over China is of great scientific and practical significance.
Besides the dust source regions across China (mainly Xinjiang and Inner Mongolia), dust content over North China also exhibits high values and strong interannual variability (Liu et al., 2004; Ji and Fan, 2019). Additionally, as North China (30–40° N, 105–120° E) is a crucial center of politics, economy, and population, it is meaningful to investigate the variations in dust activities over this region and explore the relevant physical mechanisms. Previous studies have shown that the frequency of dust events in China exhibits strong variations, with high frequency from the 1950s to 1970s, low frequency from the 1980s to 1990s, and a notable increase after 2000 (Zhu et al., 2008; Ji and Fan, 2019). On interdecadal timescales, climate oscillations, such as the Atlantic Multidecadal Oscillation (AMO), Pacific Decadal Oscillation (PDO), and Antarctic Oscillation (AAO), can influence dust activities by affecting the climatic background. For instance, the positive phase of the PDO reduces dust activities by influencing the mid-latitude westerly regime, leading to weaker dust activities (uplift and deposition) in the Asian region (Gong et al., 2006). The AMO affects the global aridification process by altering thermal properties between land and sea (Huang et al., 2017). Additionally, the AAO may substantially regulate dust activities in China by influencing the interaction of meridional circulations between the Northern and Southern hemispheres (Ji and Fan, 2019).
On an interannual scale, a weaker East Asian winter monsoon is associated with anomalous circulation over the Gobi and Taklamakan deserts, facilitating the transport of dust and thereby increasing dust content in China (Lou et al., 2016). Variations in sea ice coverage in the Barents Sea significantly influence the intensity and frequency of dust activities in China by affecting cyclone generation and thermal instability in North China (Fan et al., 2018). The North Atlantic Oscillation (NAO) substantially impacts spring dust activities in North China by modulating the zonal wave train from the Atlantic to the Pacific at mid-latitudes in the Northern Hemisphere and the sea-level-pressure (SLP) gradient in the Tarim Basin in China (Zhao et al., 2013). On a synoptic scale, the NAO influences the emergence and evolution of dust activities in North China by impacting transient wave flux transport and atmospheric circulation (Li et al., 2023). Beyond extratropical signals, tropical variabilities, such as the El Niño–Southern Oscillation (ENSO), also significantly modulate dust activities by regulating large-scale circulation, precipitation, and temperature variations over East Asia (Yang et al., 2022), Saudi Arabia (Yu et al., 2015), and North America (Achakulwisut et al., 2017).
From the aforementioned studies on dust activities in China, it is evident that the NAO and ENSO are two important factors, with the focus of these studies placed on their individual effects on dust activities in China. However, as the NAO and ENSO are significant climate variables in extratropical and tropical regions, respectively, they often co-occur and have complex interactions (López-Parages et al., 2015). It has been found that the ENSO can influence the climate near the North Atlantic through atmospheric forcing of the Pacific–North American teleconnection pattern (Wallace and Gutzler, 1981). During the early winter of El Niño events, strong convective anomalies in the tropical Indian Ocean and western Pacific (Abid et al., 2021), as well as in the Gulf of Mexico and Caribbean Sea (Ayarzagüena et al., 2018), can trigger Rossby wave trains, which then reach the North Atlantic, leading to positive NAO signals. Furthermore, the stratosphere, serving as an energy transmission channel, may also be an important pathway for the ENSO to influence the NAO (Jiménez-Esteve and Domeisen, 2018). Moreover, observations and numerical simulations have demonstrated that the NAO can induce a Gill–Matsuno pattern in the tropical region, strengthening the connection between the East Asian summer monsoon and ENSO (Wu et al., 2012). When the NAO is in its positive phase, intensified northeasterlies over the tropical North Atlantic are observed, increasing low-level moisture content and precipitation in the tropical North Atlantic, which, in turn, enhances the ENSO's impact (Ding et al., 2023). These studies emphasize the connections and interactions between the NAO and ENSO, underscoring the necessity of considering their synergistic effects on dust activities in North China.
These synergistic effects refer to the phenomenon where the combined impact of two or more factors is significantly greater than the sum of their individual impacts (Li et al., 2019). It has been found that there are synergistic effects in the impact of the NAO and ENSO on the weather and climate in China. The NAO can facilitate the development of the subpolar teleconnection across northern Eurasia downstream, leading to anomalies in the high-pressure systems over the Ural Mountains and the Sea of Okhotsk, which, in turn, affect the East Asian summer monsoon (Wang et al., 2000). Meanwhile, the ENSO exerts a significant impact on the convective activities in the central Pacific and induces alterations in equatorial circulation via the Pacific–East Asian teleconnection, further affecting atmospheric circulation and sea surface temperature (SST) in the western North Pacific (WNP) and ultimately influencing the intensity of the East Asian summer monsoon (Wang et al., 2000). Therefore, the synergistic effects of the NAO and ENSO can result in pronounced impacts on the East Asian summer monsoon. During El Niño events, SST in the central and eastern regions of the equatorial Pacific rises, enhancing convective activity near the Equator, which brings more moisture to North China and increases the likelihood of precipitation. Simultaneously, the positive phase of the NAO can alter atmospheric pressure over the North Atlantic, influencing atmospheric circulation over the Eurasian continent. The influences of the NAO and ENSO synergistically regulate the distribution of precipitation in North China (Guo et al., 2012).
The synergistic effects of the NAO and ENSO significantly influence the climate in China, but their combined impact on spring dust activities over North China and the mechanisms involved remain unclear. This study will investigate such effects on dust activities over North China, providing a scientific foundation for predicting dust activities in China. The structure of this paper is as follows. Section 2 outlines the datasets and methods employed in this study. Section 3 presents the analysis and findings. Section 4 contains the conclusions and discussions.
2.1 Datasets
The dust dataset for the second version of the Modern-Era Retrospective analysis for Research and Applications (MERRA-2) was obtained from NASA's Global Modeling and Assimilation Office (GMAO), incorporating assimilated observations from both satellites and ground stations (Gelaro et al., 2017). In this study, the dust column mass density (DCMD) of the MERRA-2 tavgM_2d_aer_Nx product (0.5° × 0.625° resolution) was utilized to represent dust content from 1980–2022. Previous studies have demonstrated the applicability of MERRA-2 reanalysis data in representing the spatiotemporal distribution characteristics of dust content in China (Kang et al., 2016; Wang et al., 2021). It is reported that the results based on MERRA-2 are similar to those obtained from Moderate Resolution Imaging Spectroradiometer (MODIS), Ozone Mapping and Profiler Suite (OMPS), Cloud-Aerosol Lidar and Infrared Pathfinder Satellite Observations (CALIPSO), and Himawari-8 datasets (Kang et al., 2016; Wang et al., 2021). Additionally, we further employed datasets from 1980–2018 from the National Meteorological Centre in China, which include observations of floating dust, blowing dust, and dust storms, to validate the reliability of the MERRA-2 reanalysis dataset. The frequency of dust activities recorded at these stations has been converted into a dust index (DI; Wang et al., 2008; Eq. 1), effectively representing dust content, which is expressed as
where DS, BD, and FD represent the frequency of dust storms, blowing dust, and floating dust, respectively. Additionally, the DI denotes the dust content at each station. It is worth noting that the value of 1 represents the normalized mass weight of dust content with respect to FD, while 3 and 9 represent the relative mass weight of dust content for BD and DS, respectively (Wang et al., 2008). Therefore, the DI is an index used to indicate dust content, which does not correspond to a unit. In order to better compare the DI with the reanalysis, we first interpolate the site data onto grid points, following Cressman (1959), to obtain the gridded DI. We found that the distributions of the DI and MERRA-2 dust content for all four seasons show similar spatial characteristics (Fig. 1). The above results indicate that the MERRA-2 reanalysis data can capture the spatiotemporal characteristics of dust content in China, making this dataset useful for understanding variations in dust content in China.
Additionally, the SST dataset was derived from the Met Office Hadley Centre (UK) on a 1° × 1° grid (Rayner et al., 2003). The atmospheric-reanalysis datasets employed herein were provided by the fifth-generation atmospheric reanalysis (ERA5) from the European Centre for Medium-Range Weather Forecasts (ECMWF), with a resolution of 0.25° × 0.25° on 37 vertical levels (Hersbach et al., 2020). The period of the SST and atmospheric-reanalysis datasets corresponded to 1979–2022. Winter was defined as the average of December–February (DJF), with the winter of 1979 (2021) corresponding to the averages of December 1979 (2021), January 1980, and February 1980 (2022). The spring seasonal mean corresponded to the averages of March, April, and May. Thus, the “previous winter” is defined in this study as spanning the winters from 1979 to 2021, and the “following spring” is defined as spanning the springs from 1980 to 2022. To focus the investigation on interannual variability, the linear trends of all variables were removed.
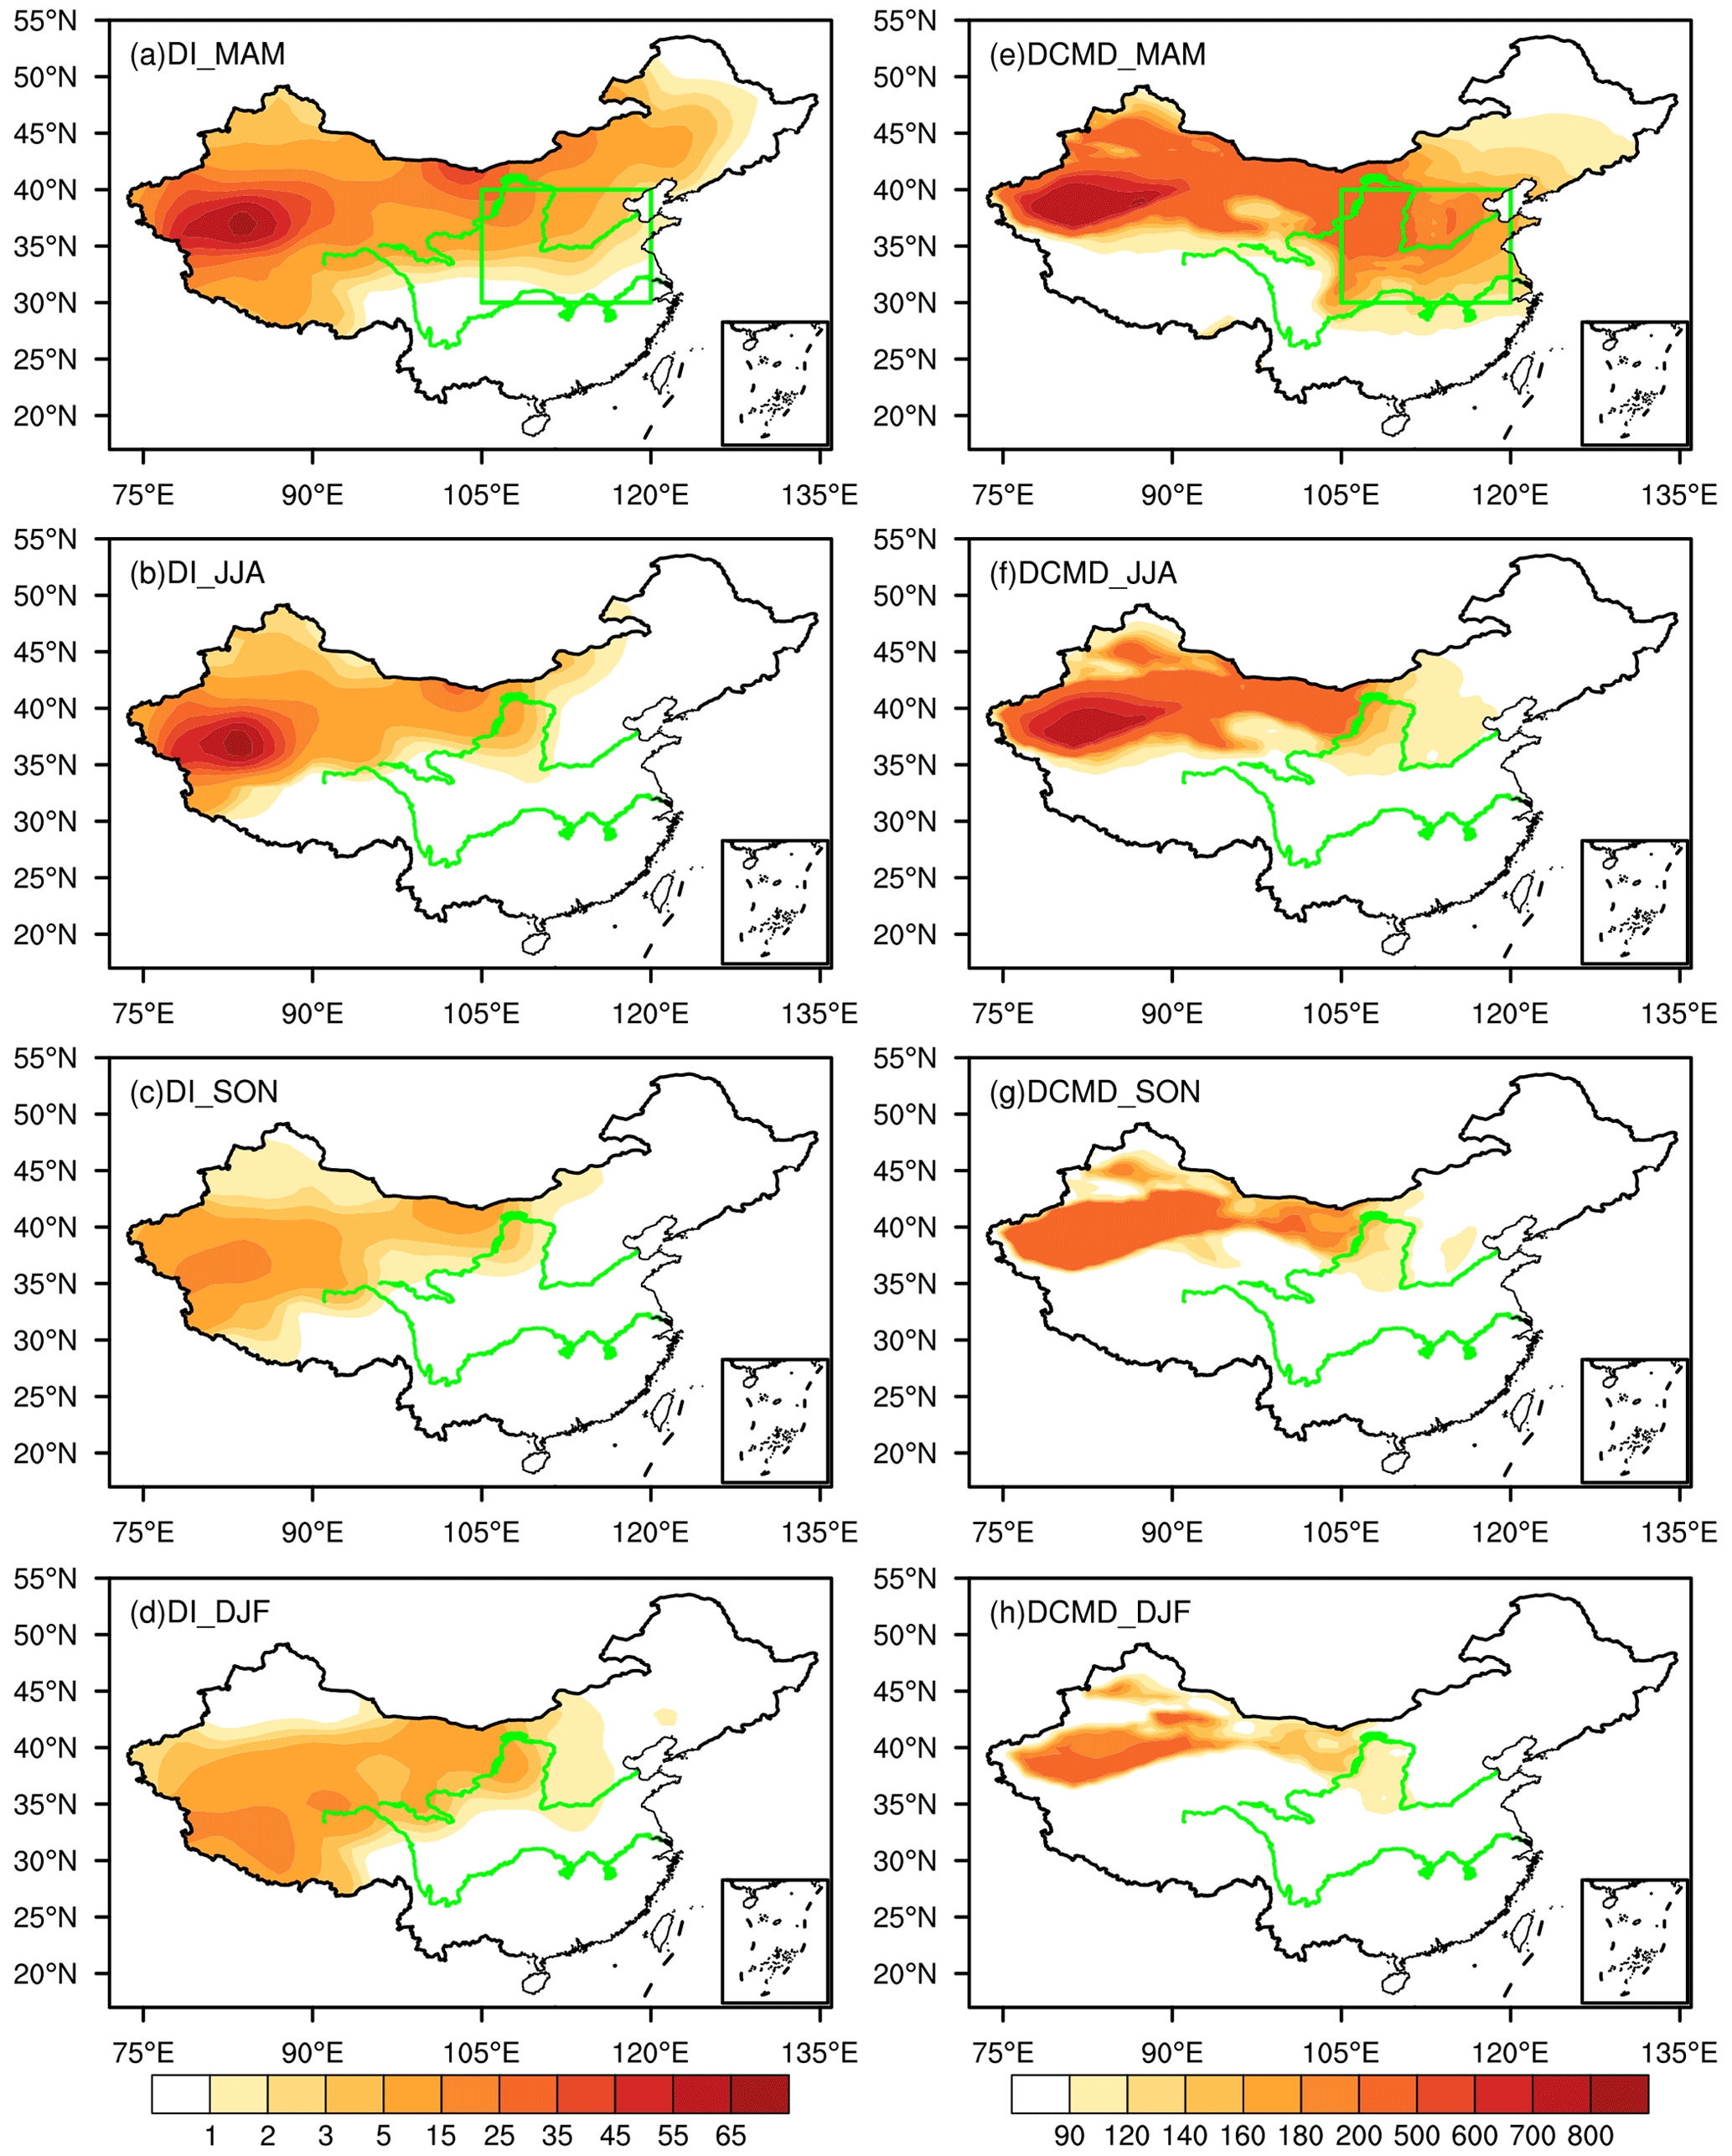
Figure 1(a–d) Spatial distributions of seasonal mean DIs based on station data. (e–h) Spatial distributions are the same as in panels (a–d), but they illustrate dust column mass density based on MERRA-2 (units are given in mg m−2). The green box in panels (a) and (e) represents North China. The top green line represents the Yellow River, and the bottom green line represents the Yangtze River. MAM: March–May. JJA: June–August. SON: September–November. DJF: December–February.
2.2 Methods
The NAO index (NAOI) used follows Li and Wang (2003) and is quantified by the difference in normalized monthly SLP zonally averaged over the North Atlantic between 35–65° N and 80° W–30° E. This definition effectively captures the large-scale circulation characteristics associated with the NAO, essentially measuring the intensity of zonal winds covering the entire North Atlantic. We also employed the NAOIs from Hurrell (1995) and Jones et al. (1997) to validate the NAOI by Li and Wang (2003). Good agreement was found, with correlation coefficients of 0.96 and 0.94 between these two indices and the NAOI defined by Li and Wang (2003). Furthermore, the ENSO is characterized by the Niño 3.4 index, with SST anomalies averaged over 5° S–5° N and 170–120° W (Trenberth, 1997).
In this study, seasonal standardized values exceeding 0.5 standard deviations are identified as anomalous years. A correlation analysis is used to examine the relationship between the NAO, ENSO, and dust content over North China, while a composite analysis is used to investigate the synergistic effects of these climatic variables on dust activities over North China. The statistical significance of the correlation, regression, and composite values is assessed using a two-sided Student's t test. Unless otherwise noted, all reported statistically significant levels are at the 0.1 level.
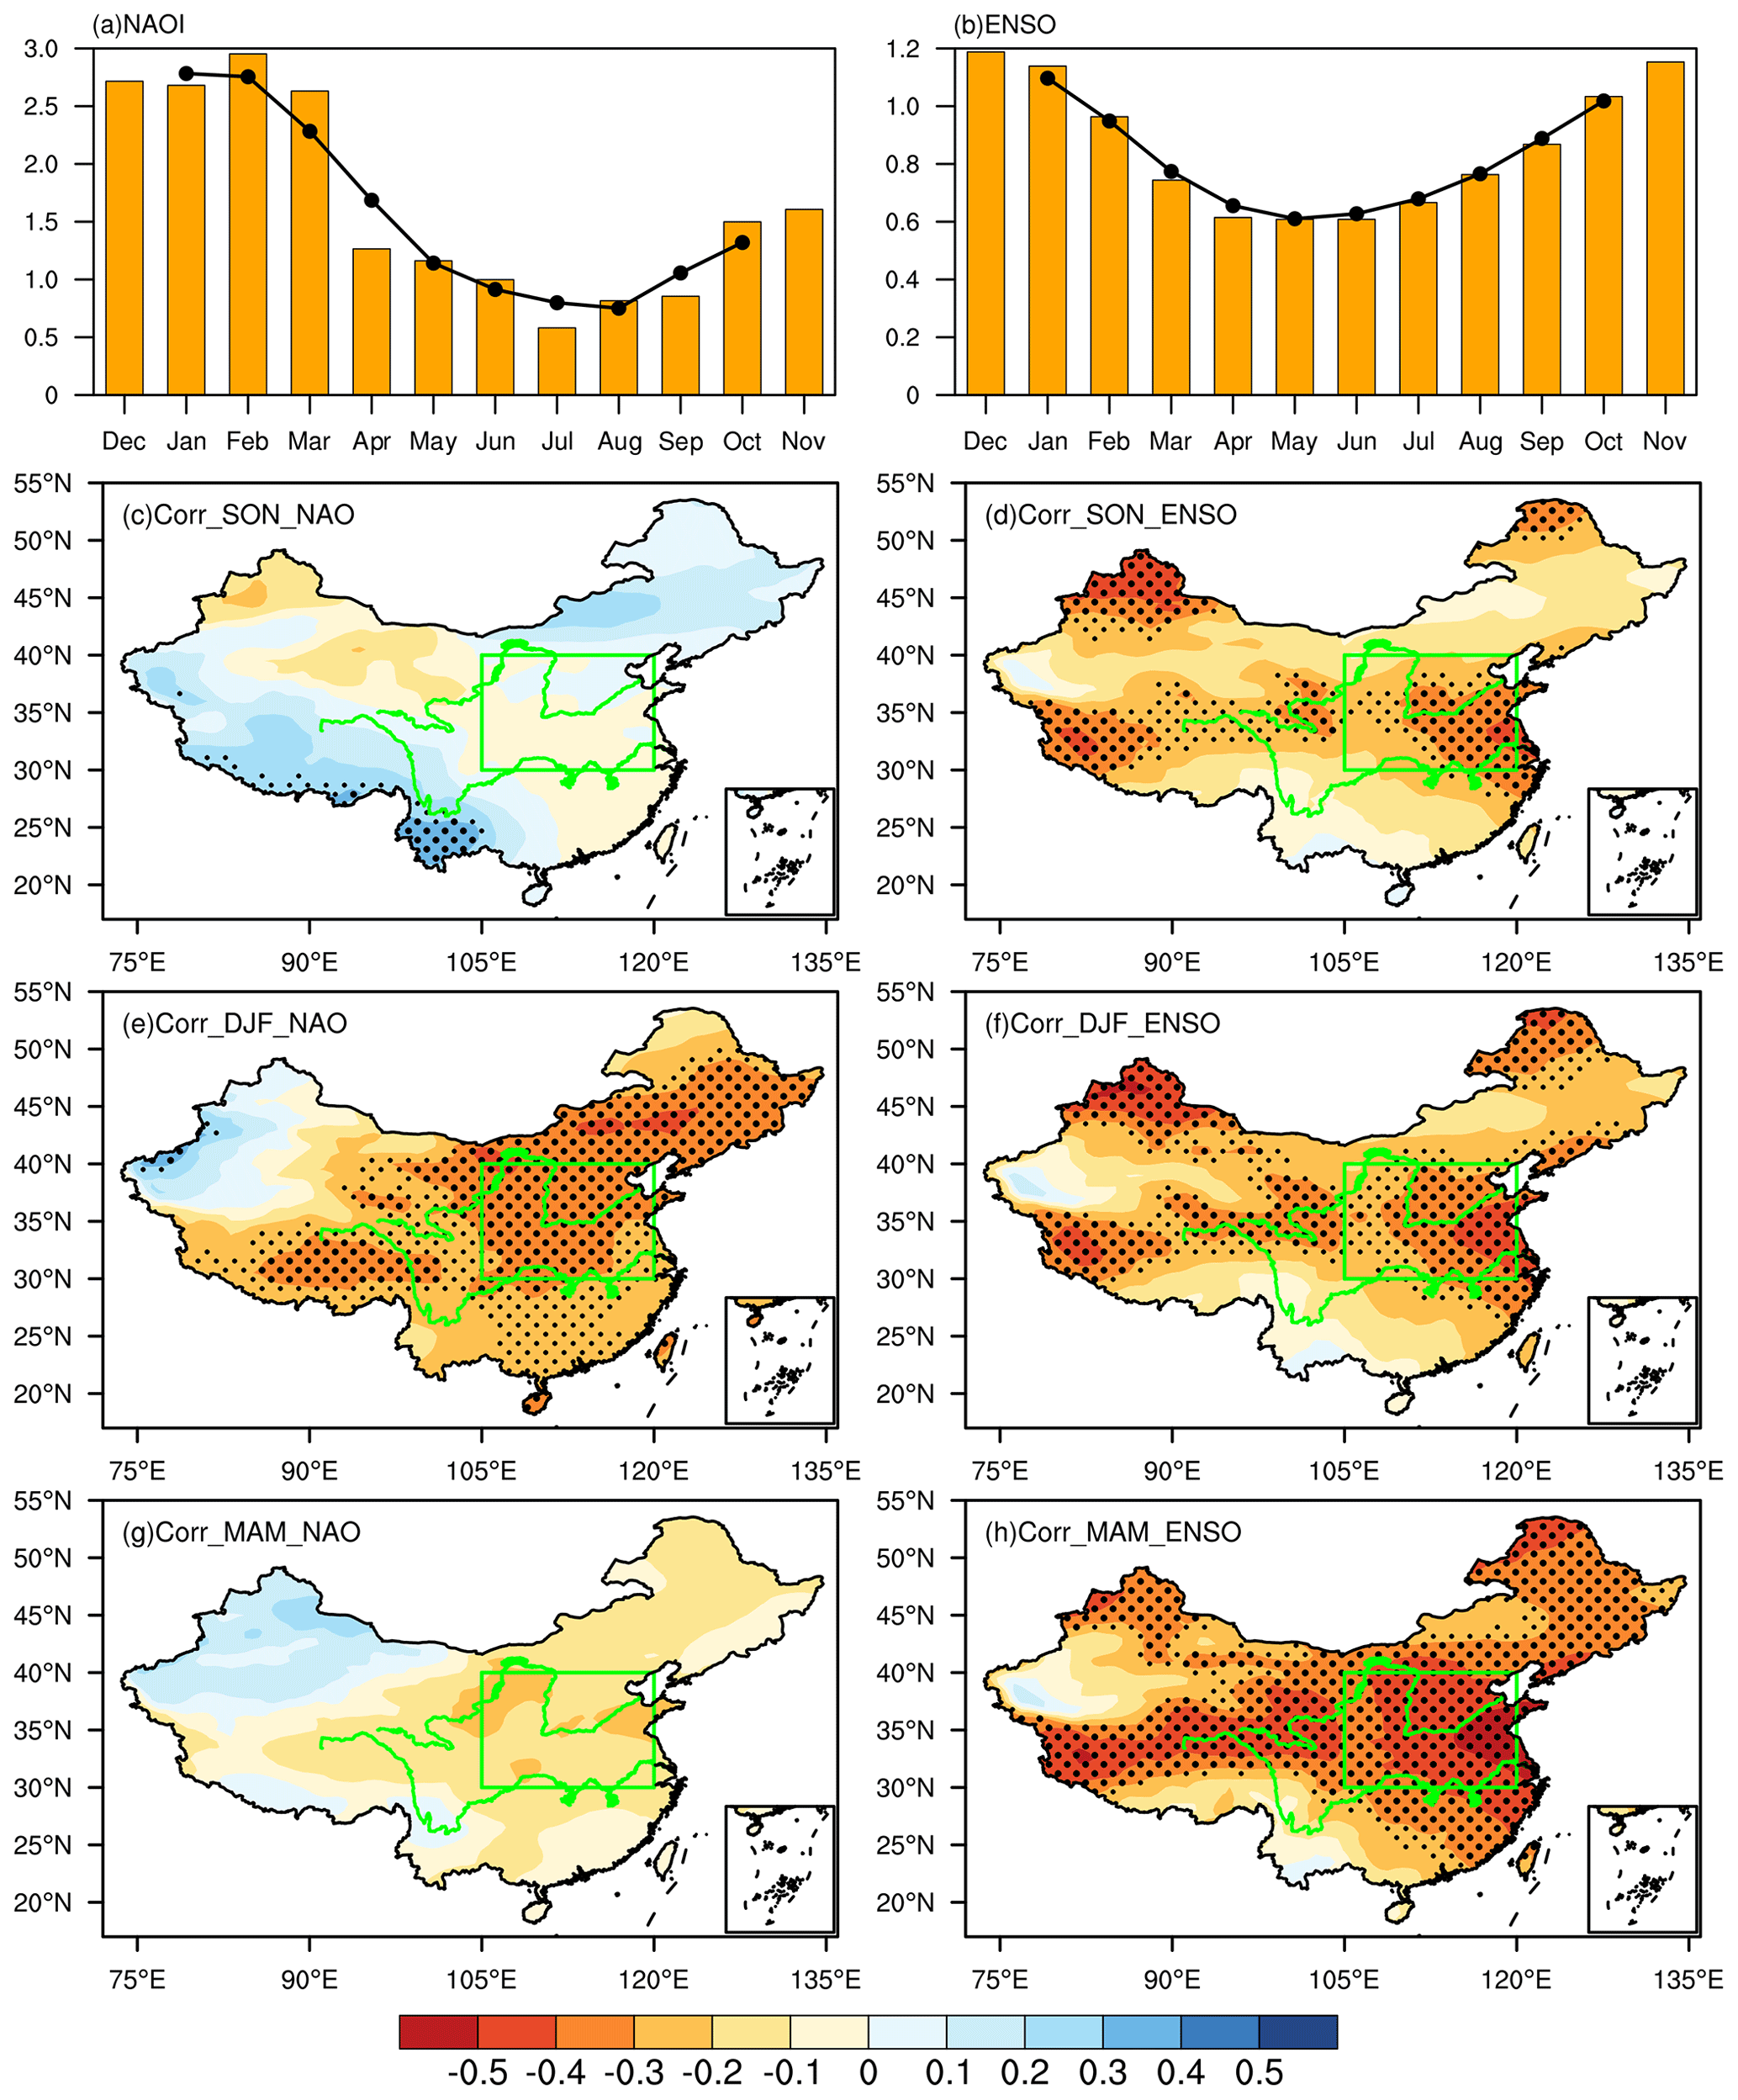
Figure 2The monthly standard deviation of (a) the NAOI (hectopascals) and (b) the Niño 3.4 index (degrees). The black line represents the 3-month running average of the standard deviation. (c) Spatial distribution of the correlation (Corr) coefficients between the previous fall's NAOI and spring dust content. (d) Spatial distribution is the same as in panel (c) but uses the Niño 3.4 index. Panels (e–f) and (g–h) show the same information as panels (c–d), but they illustrate the correlations between the previous winter's and concurrent spring's NAOI and Niño 3.4 index, respectively. The green box represents North China. Thickly and finely stippled areas represent statistical significance at the 0.05 and 0.1 levels, respectively. In panels (c–h), the top green line represents the Yellow River, and the bottom green line represents the Yangtze River.
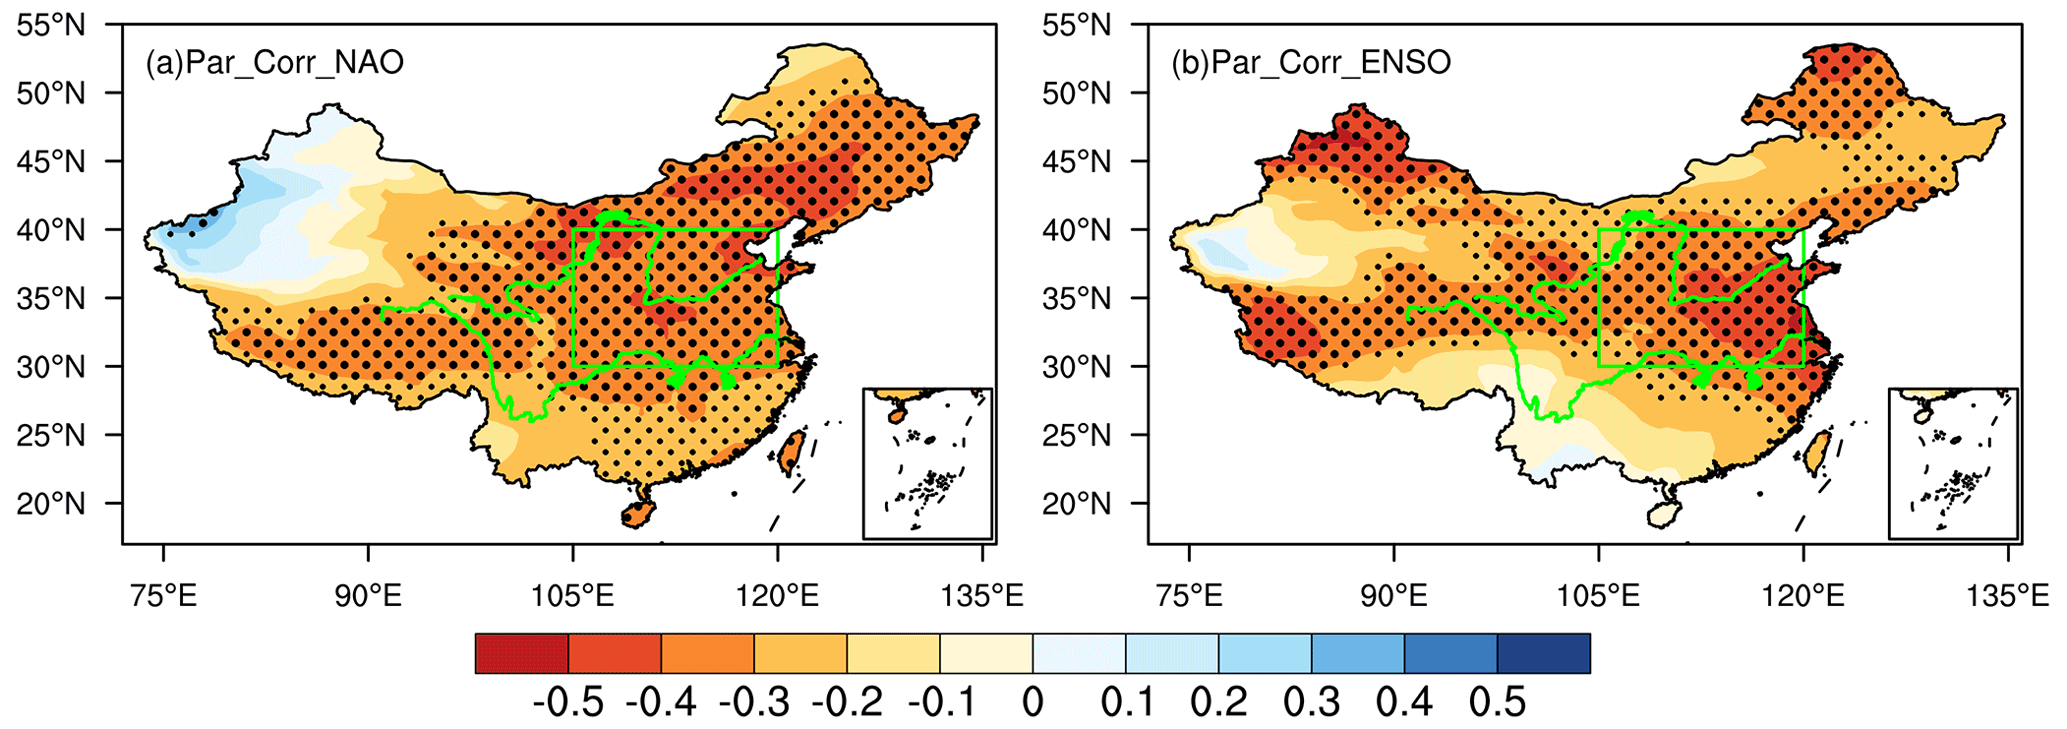
Figure 3(a) Spatial distribution of the partial correlation (Par_Corr) coefficients between the previous winter's NAOI and spring dust content after removing the effect of the ENSO. (b) Spatial distribution is the same as in panel (a), but it illustrates the correlation between the Niño 3.4 index and dust content after removing the effect of the NAO. The green box represents North China. Thickly and finely stippled areas represent statistical significance at the 0.05 and 0.1 levels, respectively. The top green line represents the Yellow River, and the bottom green line represents the Yangtze River.
The memory effect of SST can be elucidated by the SST persistence component (SSTp), as delineated in Eq. (2) (Pan, 2005).
Here, SSTp represents the memory effect of the previous SST (t; previous winter) on the following SST (t+1; spring), where SST(t) and SST(t+1) denote the previous winter's SST and the spring SST, respectively. denotes the covariance between the previous winter's SST and the spring SST, while Var[SST(t)] signifies the variance of the previous winter's SST. Consequently, represents the connection between the SST variations in the previous winter and the following spring. A greater value of SSTp indicates that variation in SST(t+1) more closely aligns with variation in SST(t).
The T–N wave activity flux (WAF), formulated by Takaya and Nakamura (2001), represents a three-dimensional wave action flux that describes the energy dispersion characteristics of stationary Rossby waves, thereby reflecting the direction of Rossby wave energy dispersion. The WAF is suitable for application in middle–high-latitude regions, where background circulation deviates from uniform zonality as it obviates the need for the assumption that the basic flow field must be zonally averaged and can accommodate zonally non-uniform wind fields. The convergence and divergence characteristics of the WAF reveal the source and dissipation areas of wave energy, with the transmission direction indicating the direction of energy transport. The three-dimensional formulation of the WAF is given as follows:
In this expression, p, φ, λ, f0, and a represent the atmospheric pressure, latitude, longitude, Coriolis parameter, and Earth's radius, respectively. Moreover, (where Φ represents geopotential height) denotes the disturbance of the quasi-geostrophic stream function relative to the climatology. N represents the buoyancy frequency, calculated as , where H denotes a constant scale height (H=8 km). The basic flow field denotes the climatic field, where Z represents the selected level and U and V indicate the zonal and meridional velocities, respectively.
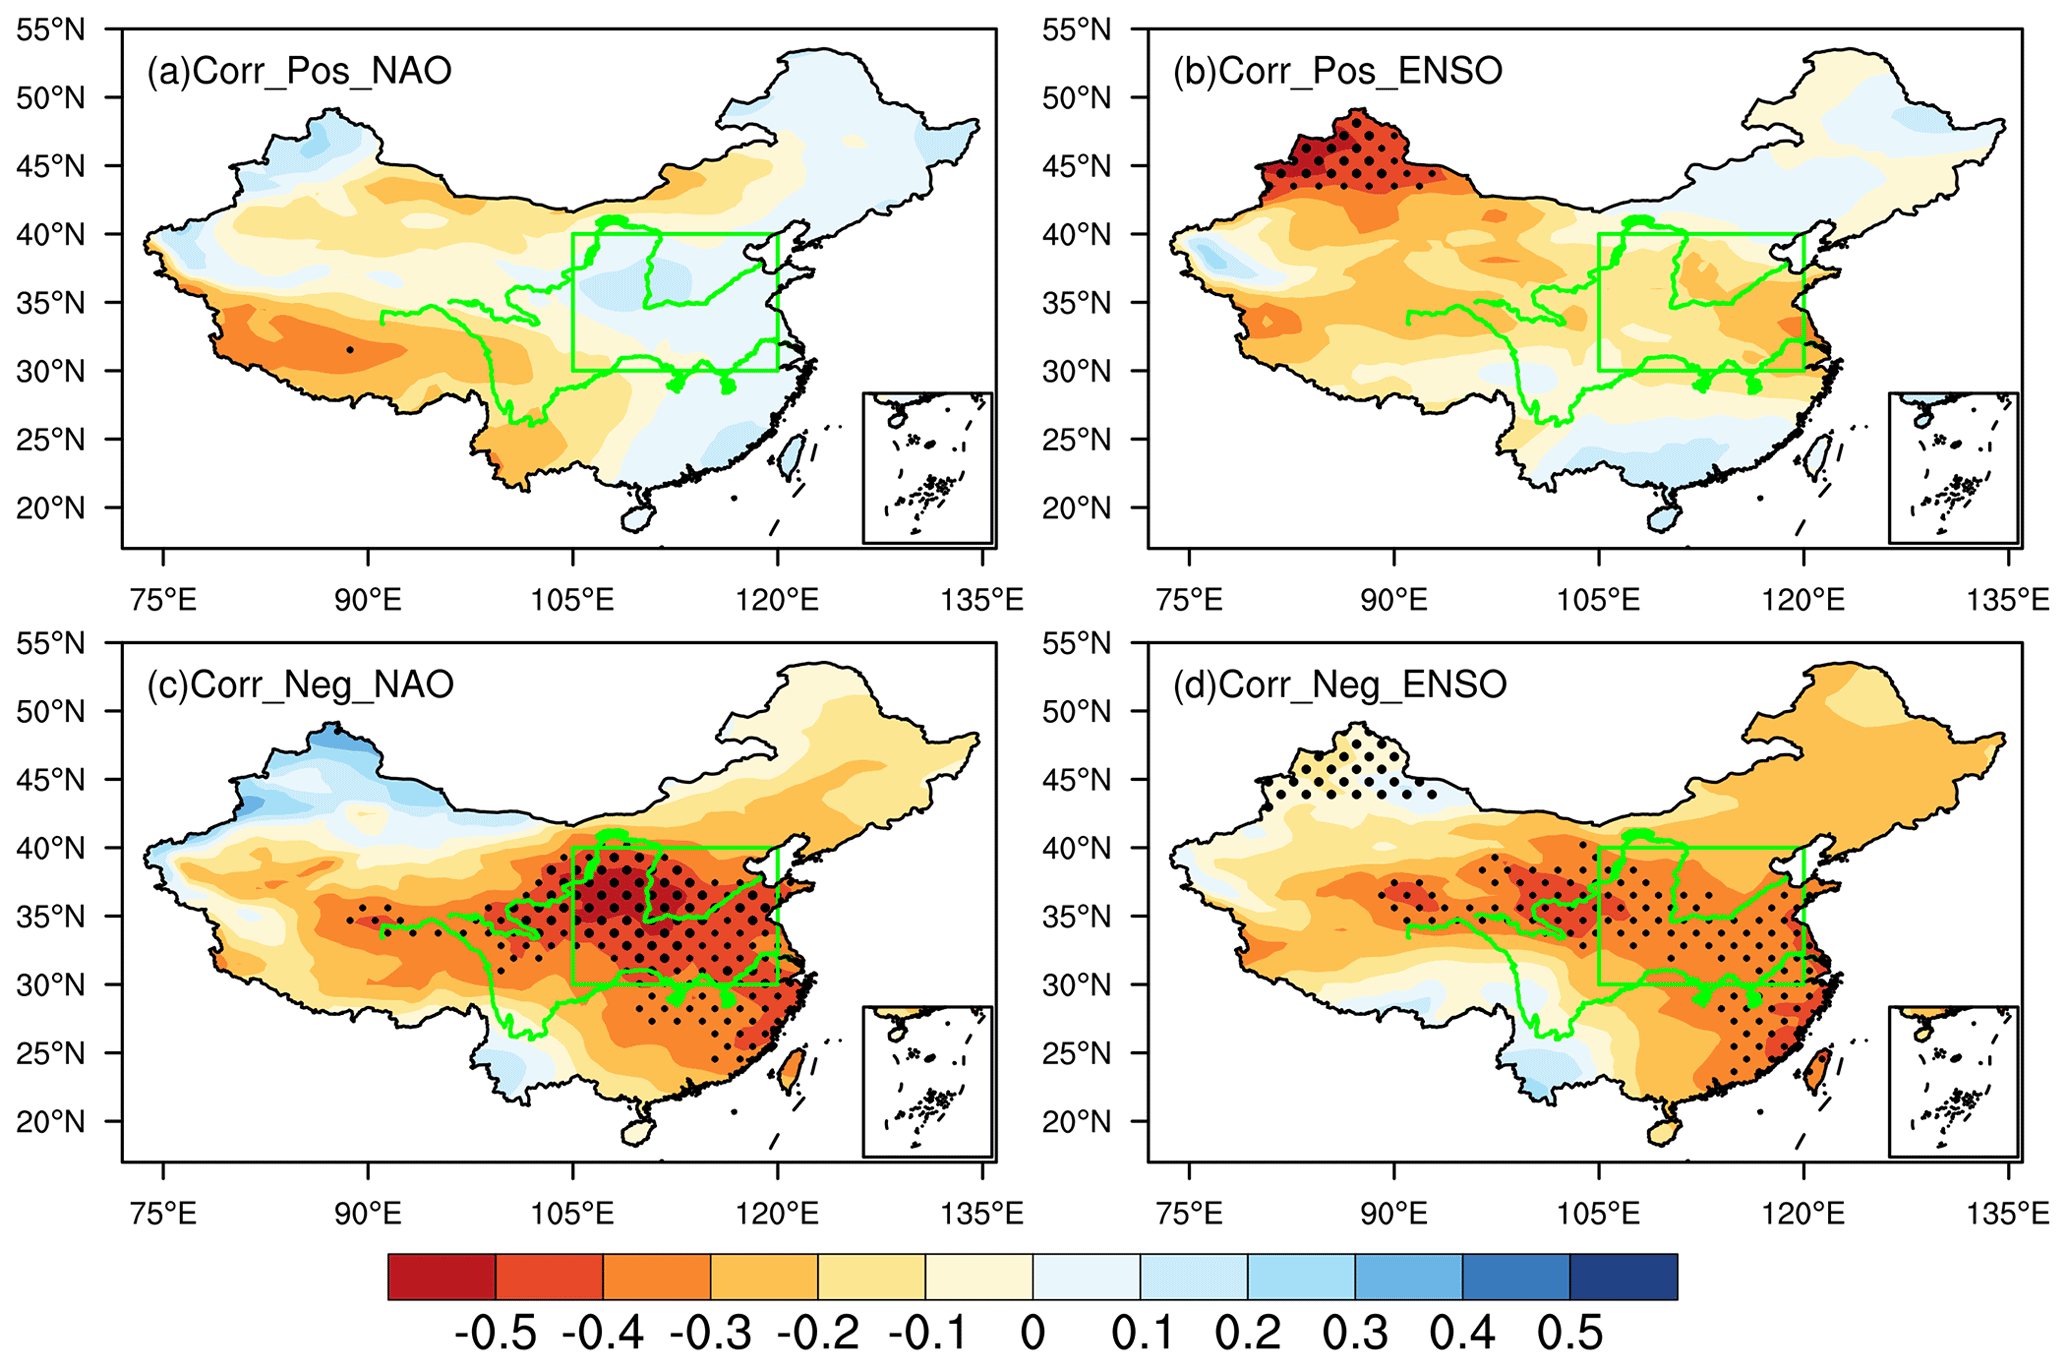
Figure 4Spatial distribution of the correlation coefficients between (a) positive (Pos) or (c) negative (Neg) NAO phases and dust content. (b, d) Spatial distributions are the same as in panels (a) and (c), but they correspond to the Niño 3.4 index. The green box represents North China. Thickly and finely stippled areas represent statistical significance at the 0.05 and 0.1 levels, respectively. The top green line represents the Yellow River, and the bottom green line represents the Yangtze River
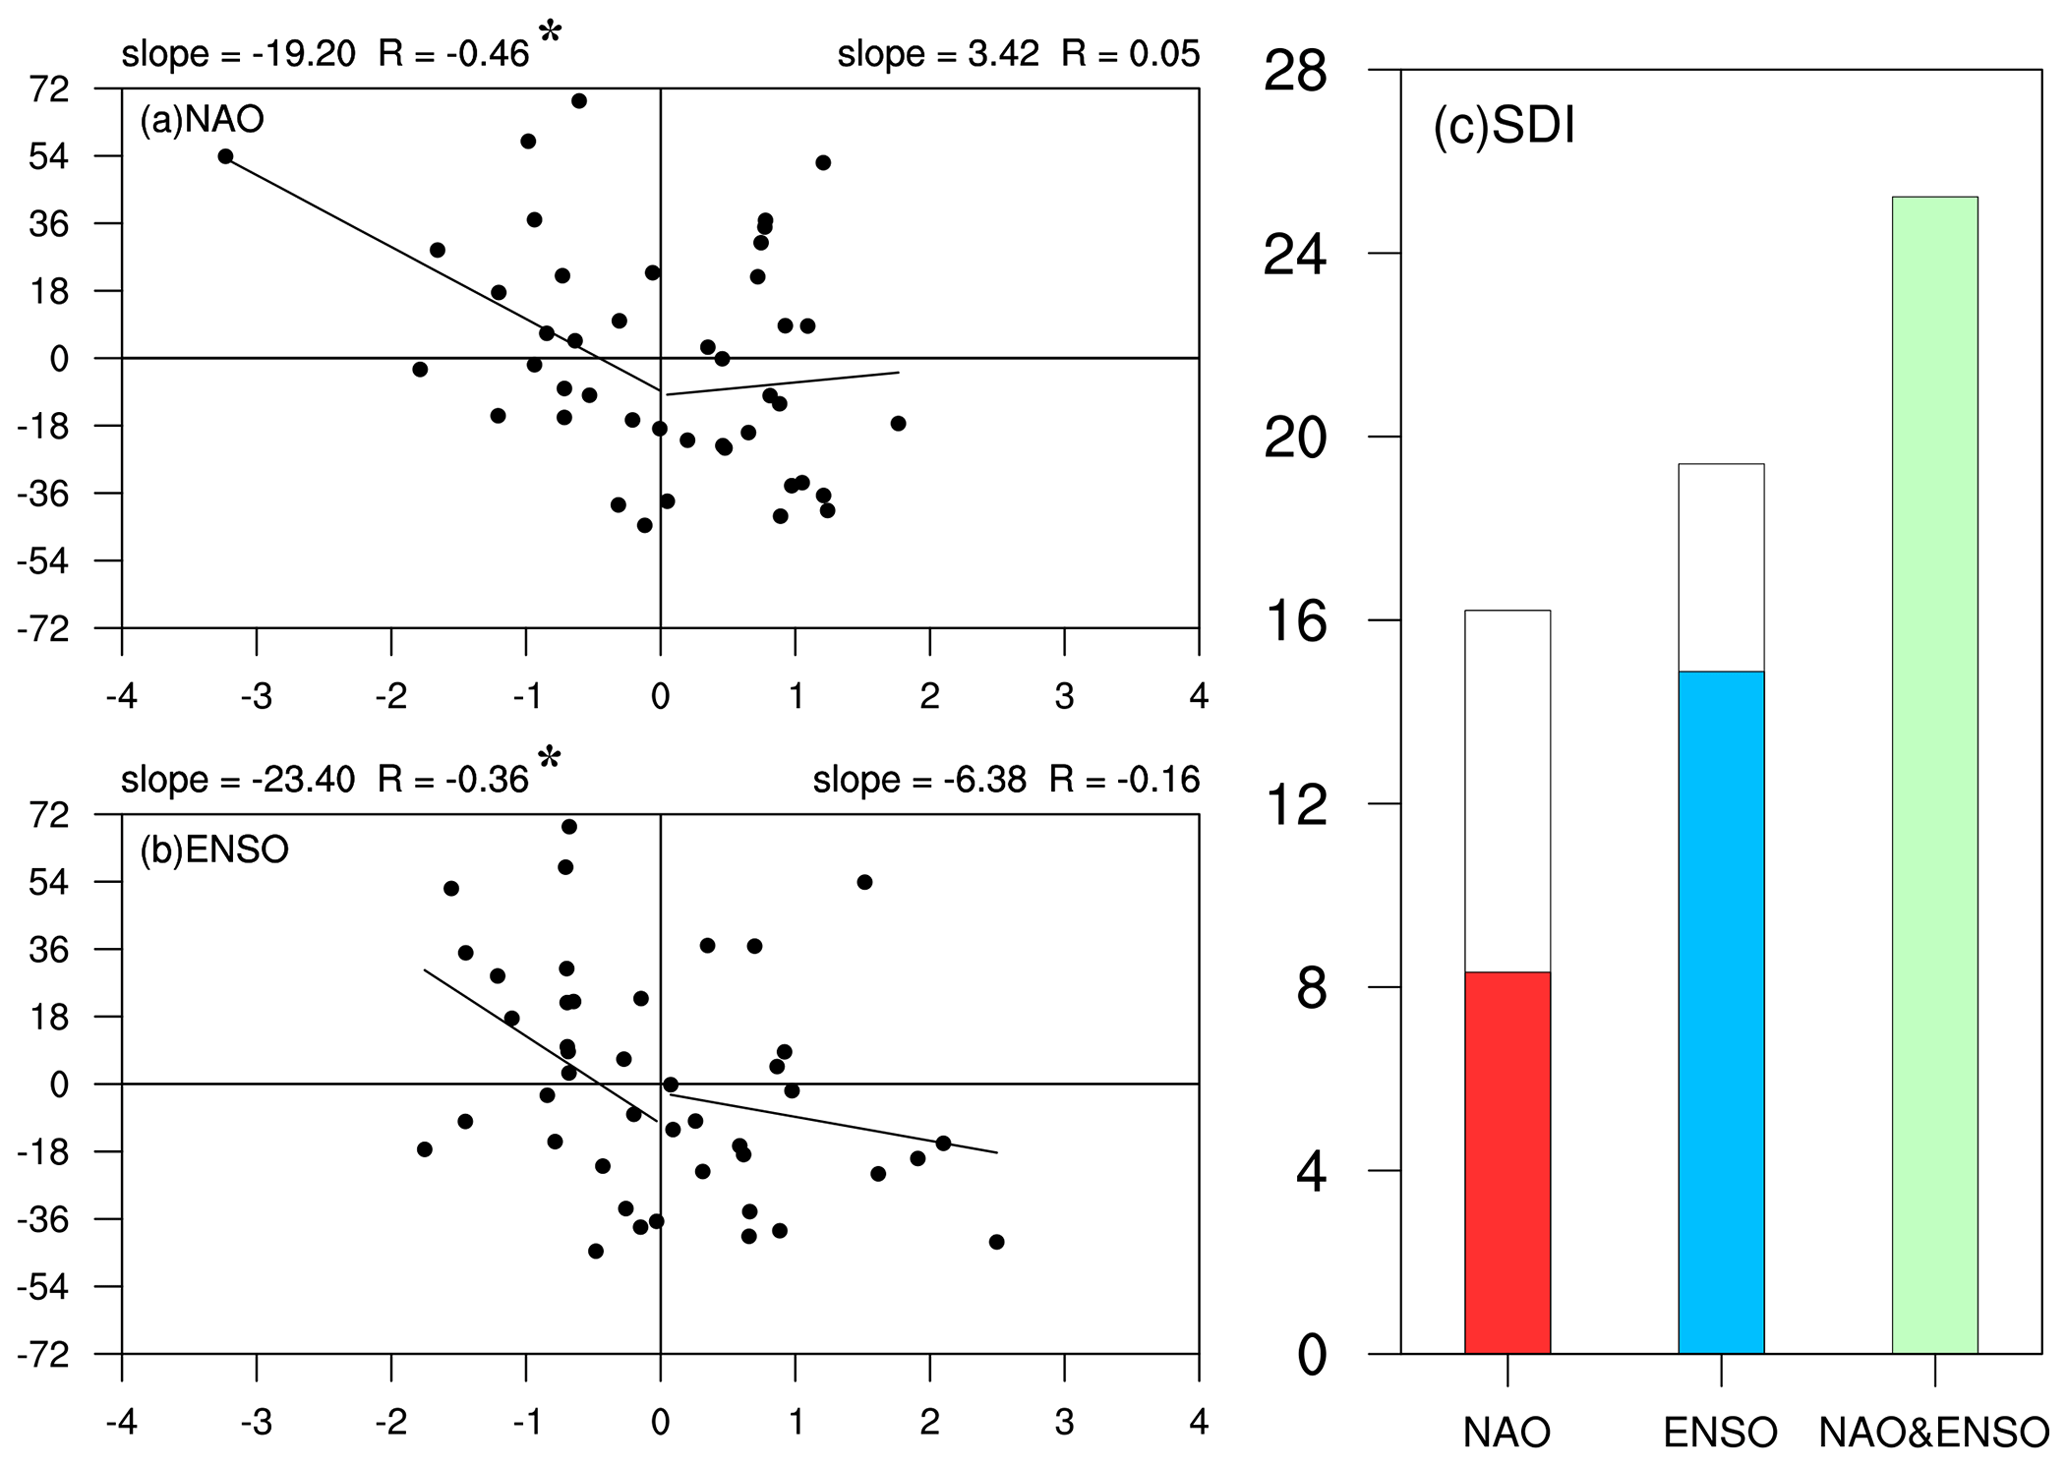
Figure 5Scatterplots of spring dust content in North China against the previous winter's (a) NAOI and (b) Niño 3.4 index. Also shown are lines of best fit for positive and negative NAOI and Niño 3.4 index values, as well as correlation coefficients (R) and slopes. Asterisks (∗) indicate statistical significance at the 0.1 level. (c) Spring dust content over North China during negative NAO phases, negative ENSO phases, and concurrent negative phases of the NAO and ENSO (units are given in mg m−2). The white bars represent the negative phases of the NAO and ENSO; the red and blue bars indicate individual years with negative NAO and ENSO, respectively; and the green bar represents co-occurring years with negative NAO and ENSO.
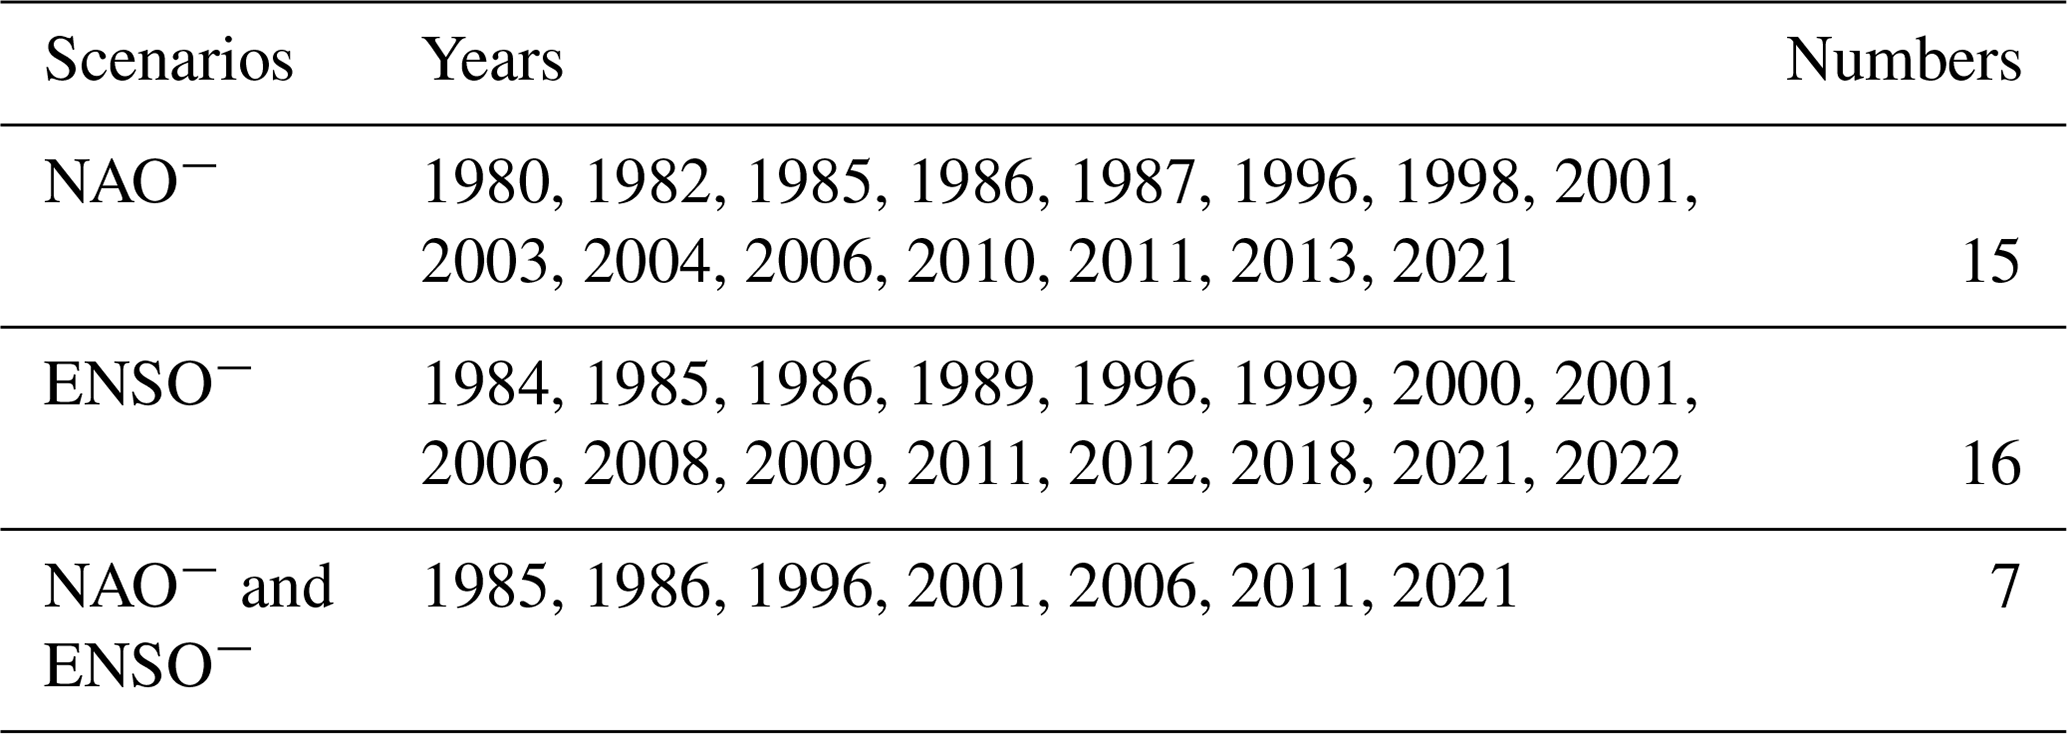
Table 1The events of the NAO and ENSO are classified into three categories.
3.1 Impacts of the NAO and ENSO on spring dust in North China
The NAO shows the strongest variability during the winter months, with the maximum standard deviation observed in February (Fig. 2a). Similarly, the ENSO shows larger variation during winter (Fig. 2b). Previous studies have found that previous instances of the NAO and ENSO significantly impact the subsequent climate over North China, particularly in terms of cross-seasonal effects (Zheng et al., 2016a; Feng et al., 2019). We examined the roles of the NAO and ENSO from the previous fall, winter, and concurrent spring in spring dust over North China. Our findings indicate that the most significant influences on spring dust occur when the NAO and ENSO lead by one season (Fig. 2c–h). Therefore, the impacts of the previous winter's NAO and ENSO on spring dust over North China are discussed in this study.
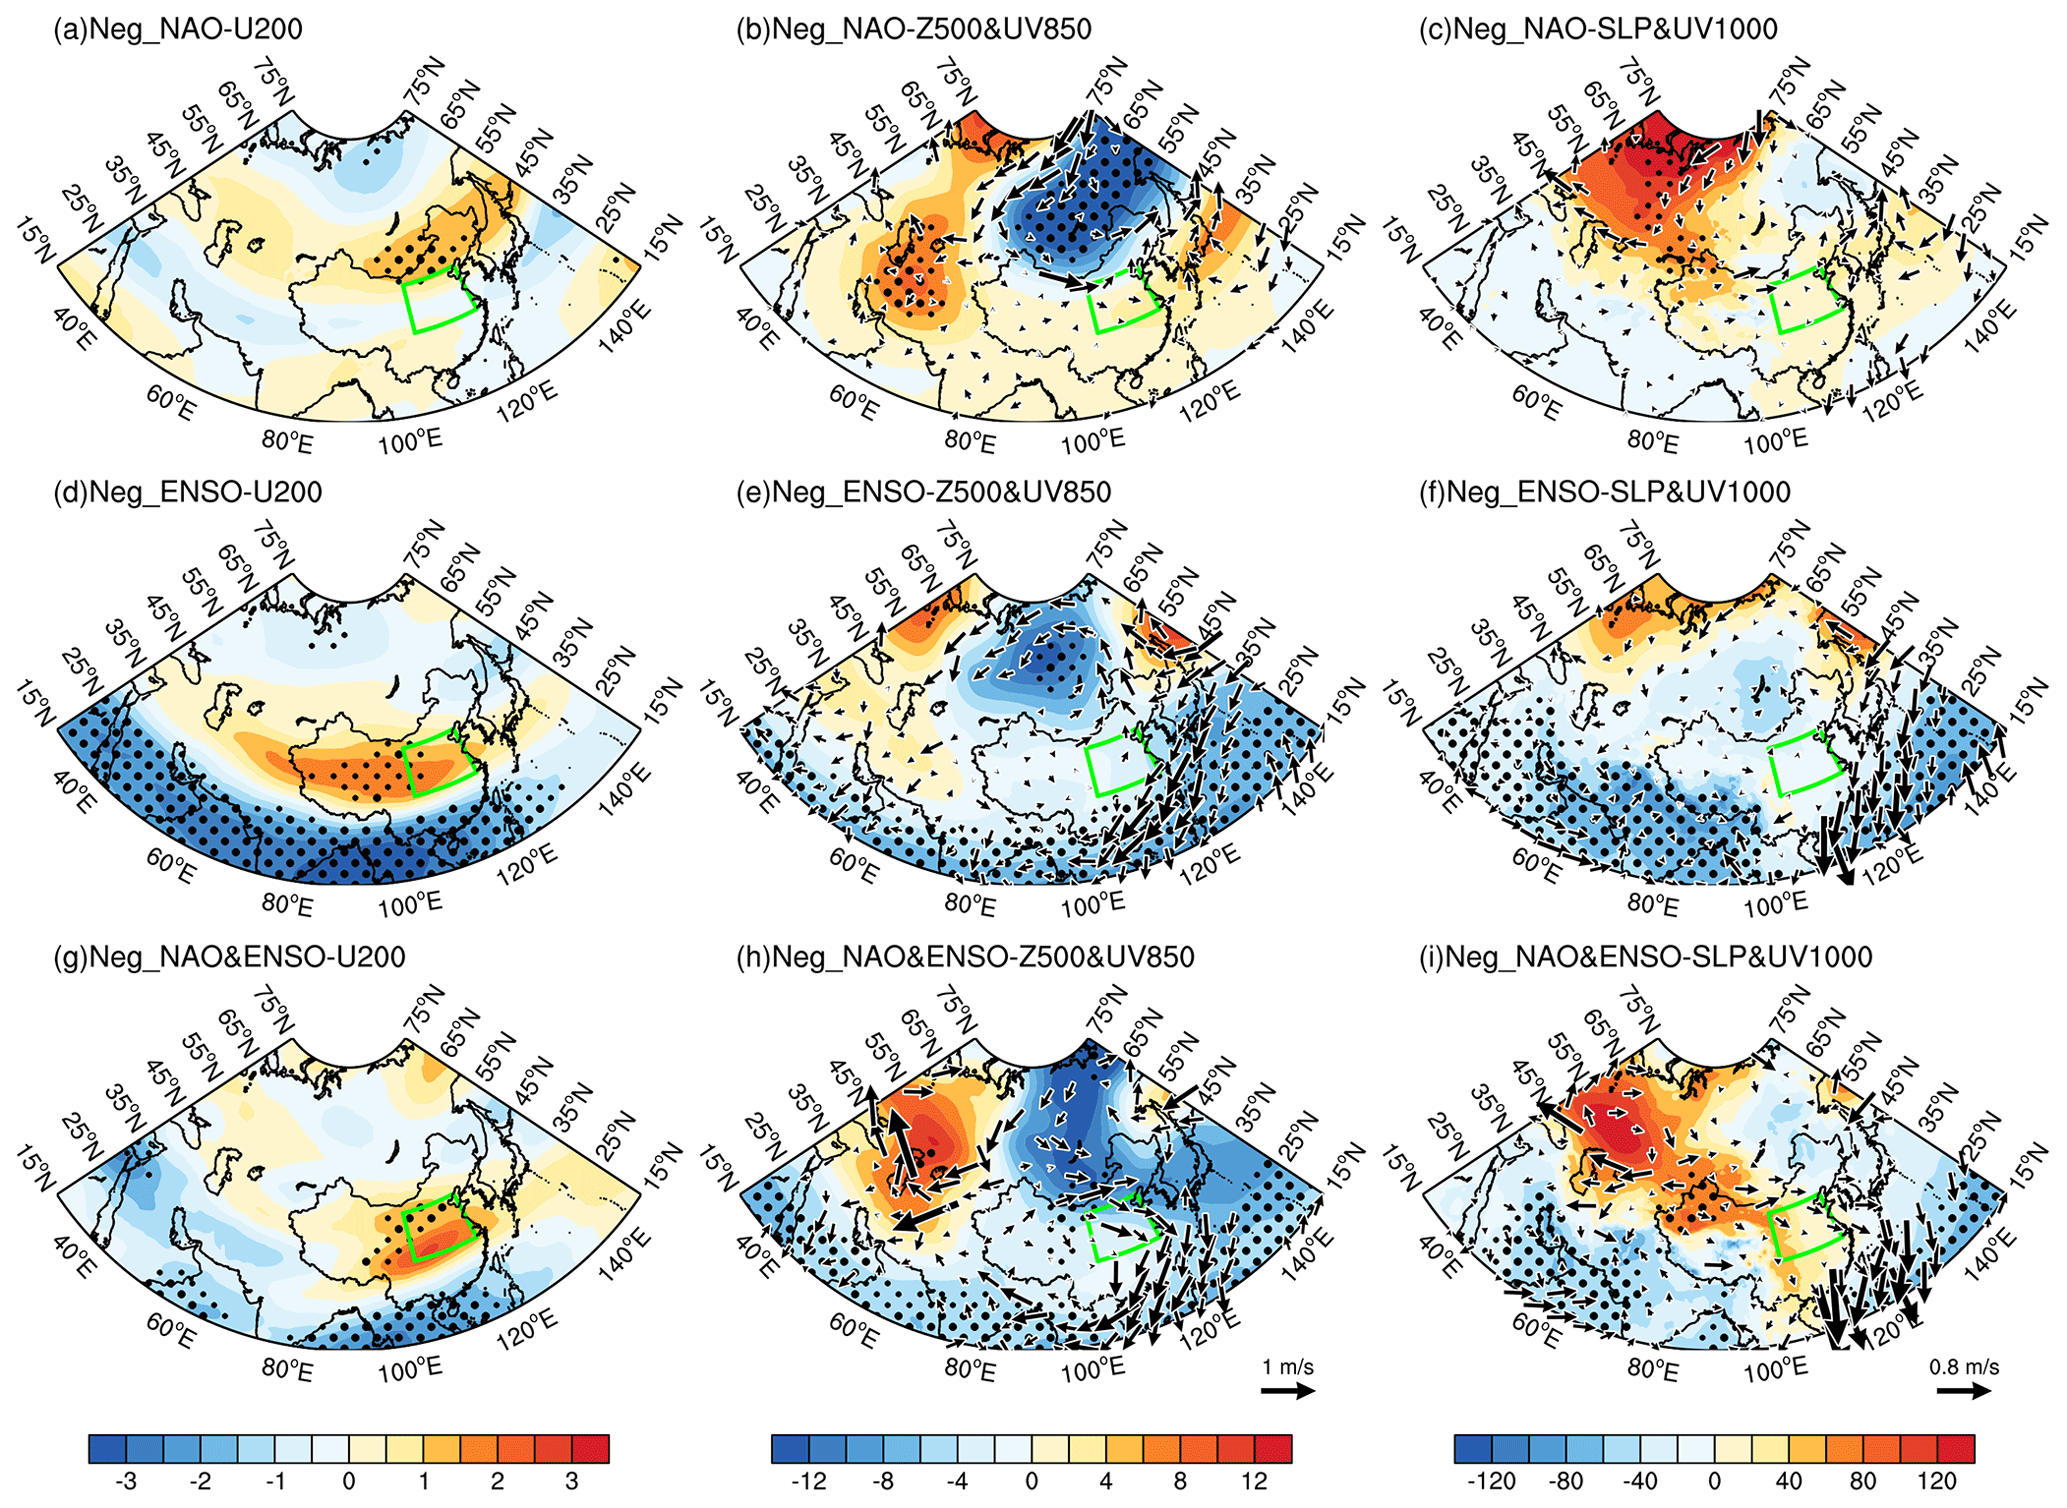
Figure 6The upper row shows the composite anomalies of (a) 200 hPa zonal wind (shading; units are given in m s−1), (b) 500 hPa geopotential height (shading; units are given in geopotential meters (gpm)) and the 850 hPa wind field (arrows; units are given in m s−1), and (c) sea-level pressure (shading; units are given in pascals) and the 1000 hPa wind field (arrows; units are given in m s−1) during the negative NAO phases. The middle and lower rows show the same information as the upper row, but they correspond to (d–f) the negative ENSO phase and (g–i) the co-occurring negative phases of the NAO and ENSO. The green box represents North China. Only wind anomalies that are statistically significant at the 0.1 level are shown. Thickly and finely stippled areas represent statistical significance at the 0.05 and 0.1 levels, respectively.
The results indicate that lower (higher) dust content is expected when the NAO and ENSO are in their positive (negative) phases (Fig. 2e–f). Meanwhile, the NAOI and Niño 3.4 index are significantly correlated with area-averaged spring dust content over North China (SDI), with correlation coefficients of −0.36 and −0.35, respectively, indicating statistical significance at the 0.1 level. Considering the significant relationship between the NAO and ENSO (López-Parages et al., 2015; Zhang et al., 2015), we assess their independent effects on dust content by providing the partial correlation between the NAO (ENSO) and dust content after removing the influence of the ENSO (NAO) (Fig. 3a–b). The results indicate that the significant correlation regions between dust content and either the NAO or the ENSO show little change after removing the influence of the other factor. These findings suggest a stable and significant connection between the previous winter's NAO and ENSO and the SDI.
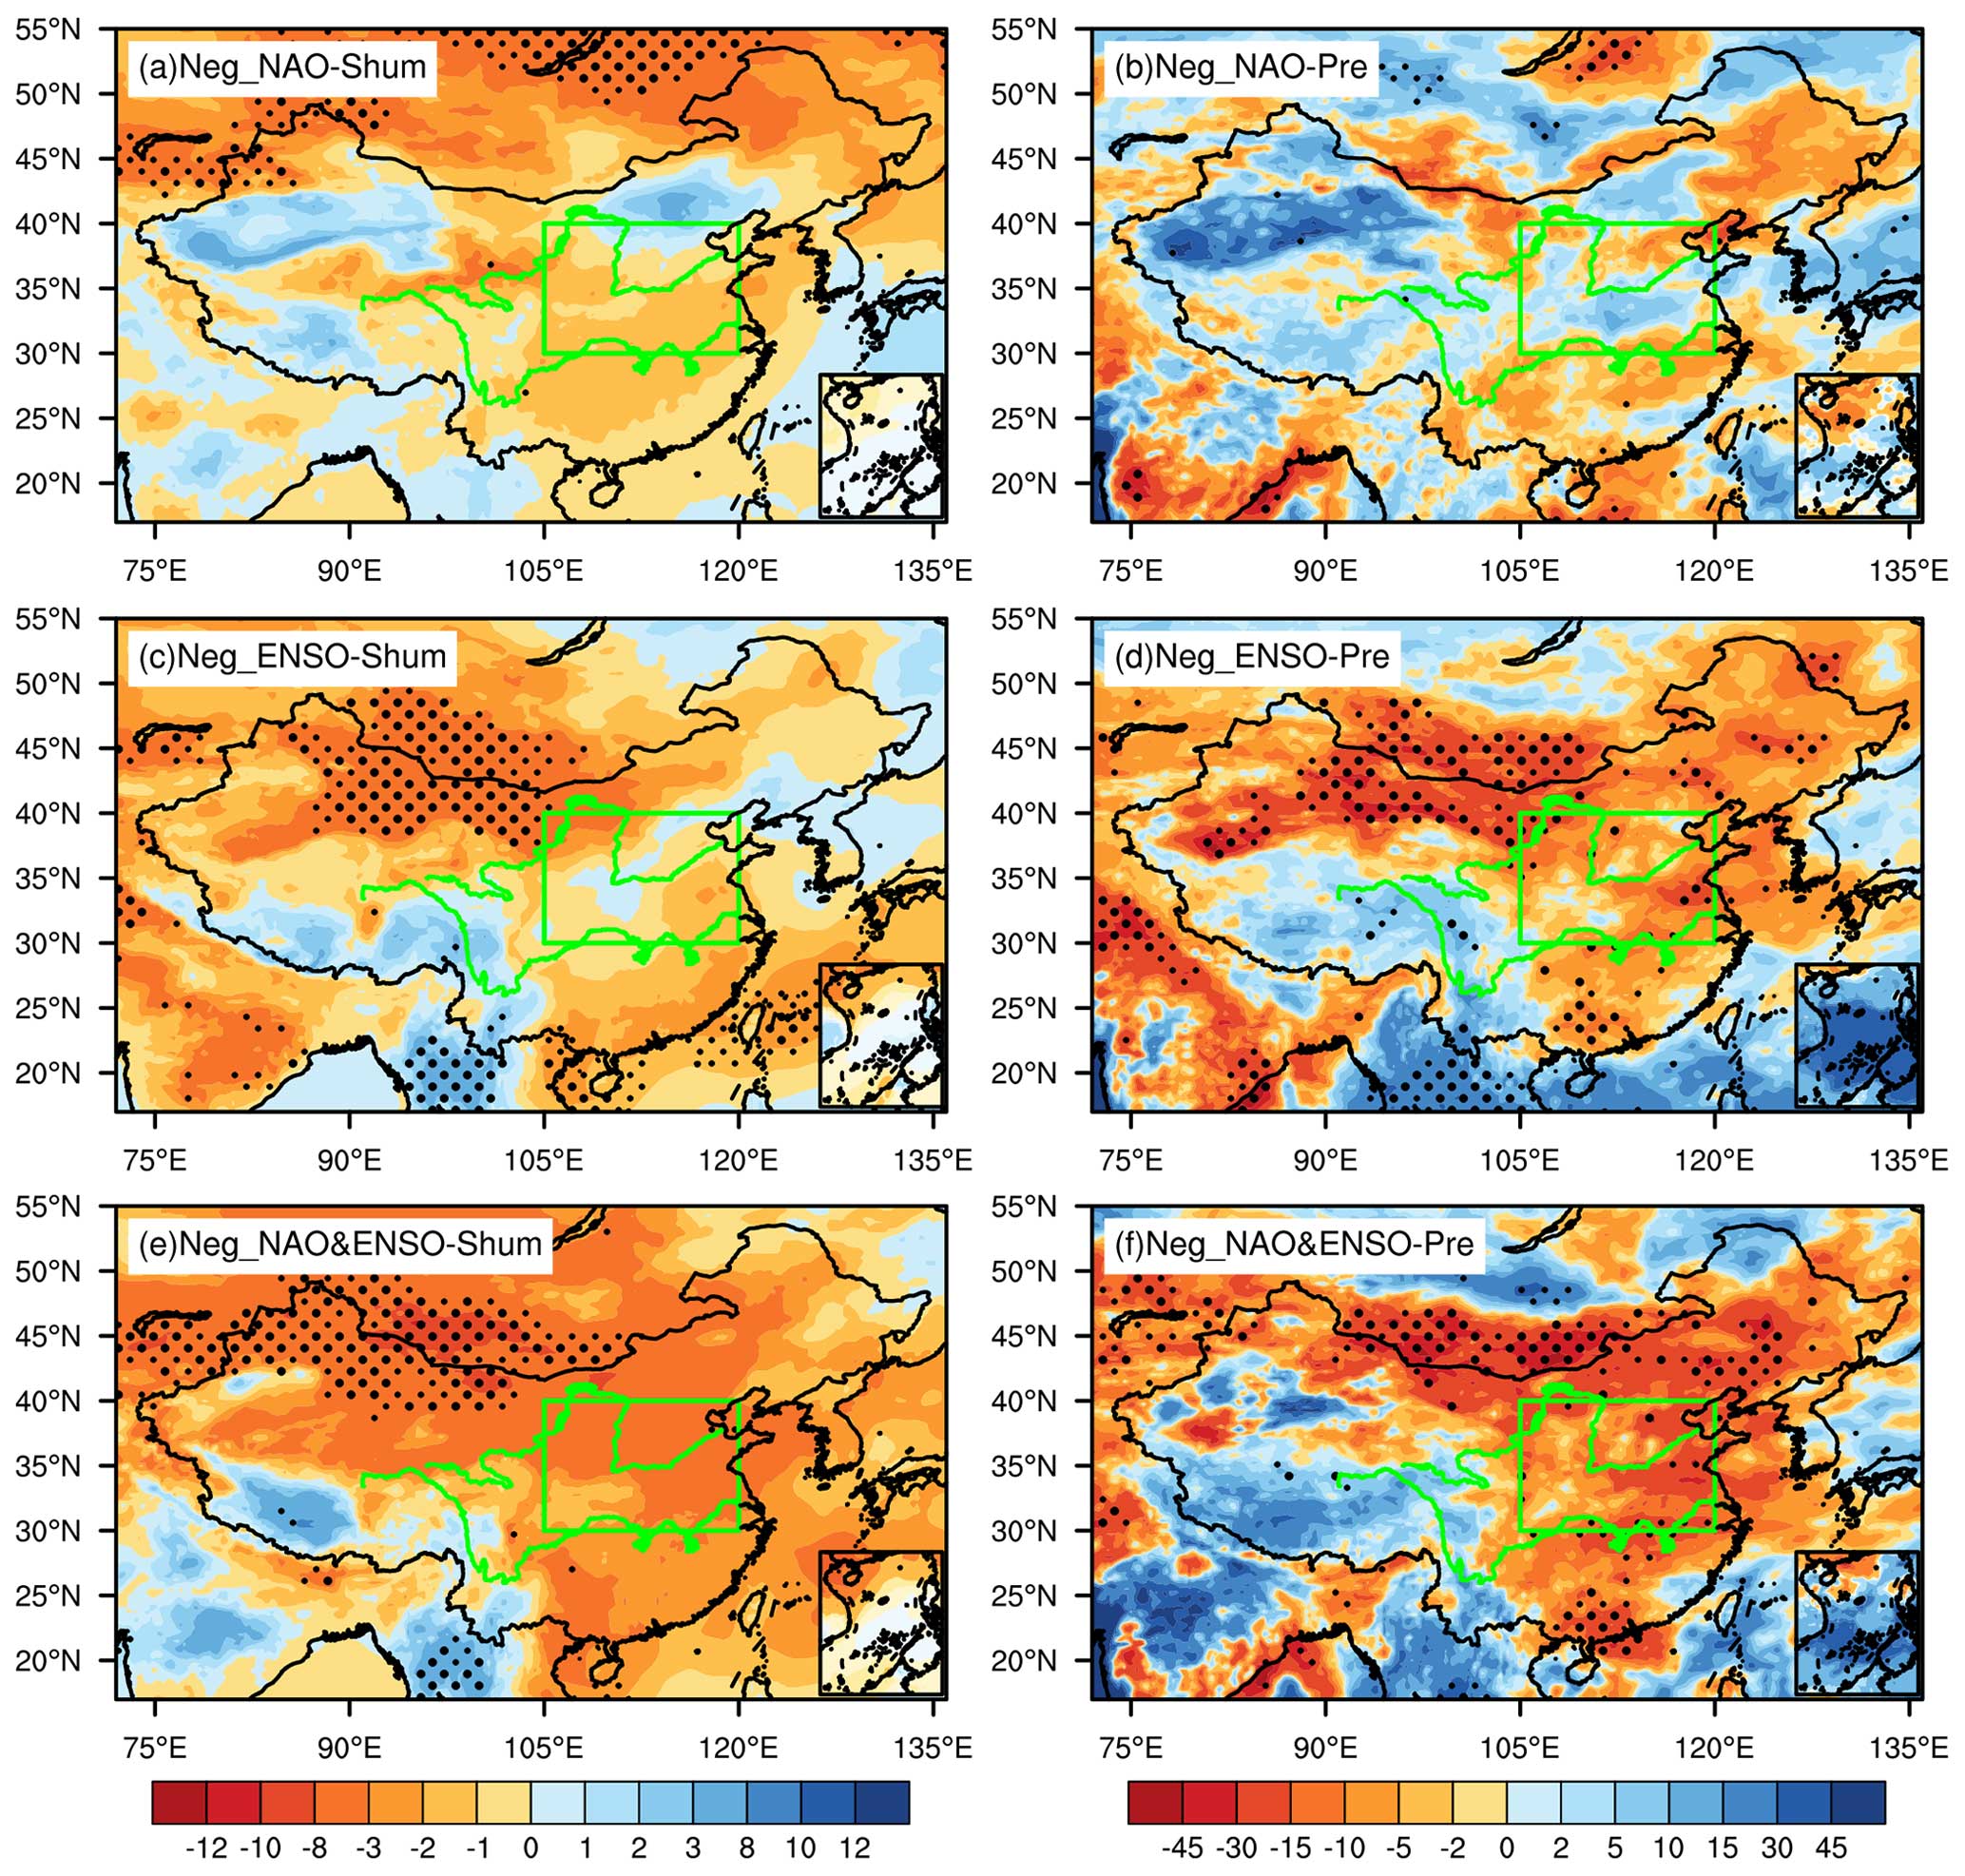
Figure 7Same as in Fig. 6 but for the composite percentage anomalies of (a, c, e) special humidity (Shum) and (b, d, f) precipitation (Pre).
Previous studies have indicated that the development rate, intensity variations, and spatial structure of the NAO exhibit distinct asymmetries between different phases (Feldstein, 2003; Jia et al., 2007), and the influence of the NAO on the East Asian winter monsoon is more pronounced during its negative phase (Sung et al., 2010). In addition, it has been shown that El Niño and La Niña, i.e., the positive and negative phases of the ENSO, are not simply mirror images of each other. The SST anomalies in the tropical Pacific associated with the ENSO exhibit significant asymmetries in meridional range (Zhang et al., 2009), amplitude (Su et al., 2010), zonal propagation (McPhaden and Zhang, 2009), and impacts (Feng and Li, 2011; Feng et al., 2020) under El Niño and La Niña conditions. To further explore these asymmetries, we analyzed the connection between the NAO, ENSO, and SDI during different phases. The results indicate that the relationship between the NAO, ENSO, and SDI also exhibits significant asymmetry, i.e., weaker (stronger) correlations during their positive (negative) phases (Fig. 4). Based on the scatter distribution of the SDI in different phases of the NAO and ENSO, it is noted that the correlation coefficients between the NAOI and SDI during the positive and negative phases of the NAO correspond to −0.05 (statistically insignificant) and −0.46 (statistically significant), indicating that the significant influence of the NAO on the SDI mainly occurs during its negative phase (Fig. 5a). Similarly, the correlation coefficients between the ENSO and SDI also show that the influence of the ENSO is more pronounced during its negative phase, with the correlation coefficients for the positive and negative phases corresponding to -0.16 (statistically insignificant) and −0.36 (statistically significant), respectively (Fig. 5b). These results demonstrate that the impacts of the previous winter's NAO and ENSO on the SDI exhibit asymmetrical characteristics, with significant effects primarily manifesting during their negative phases.
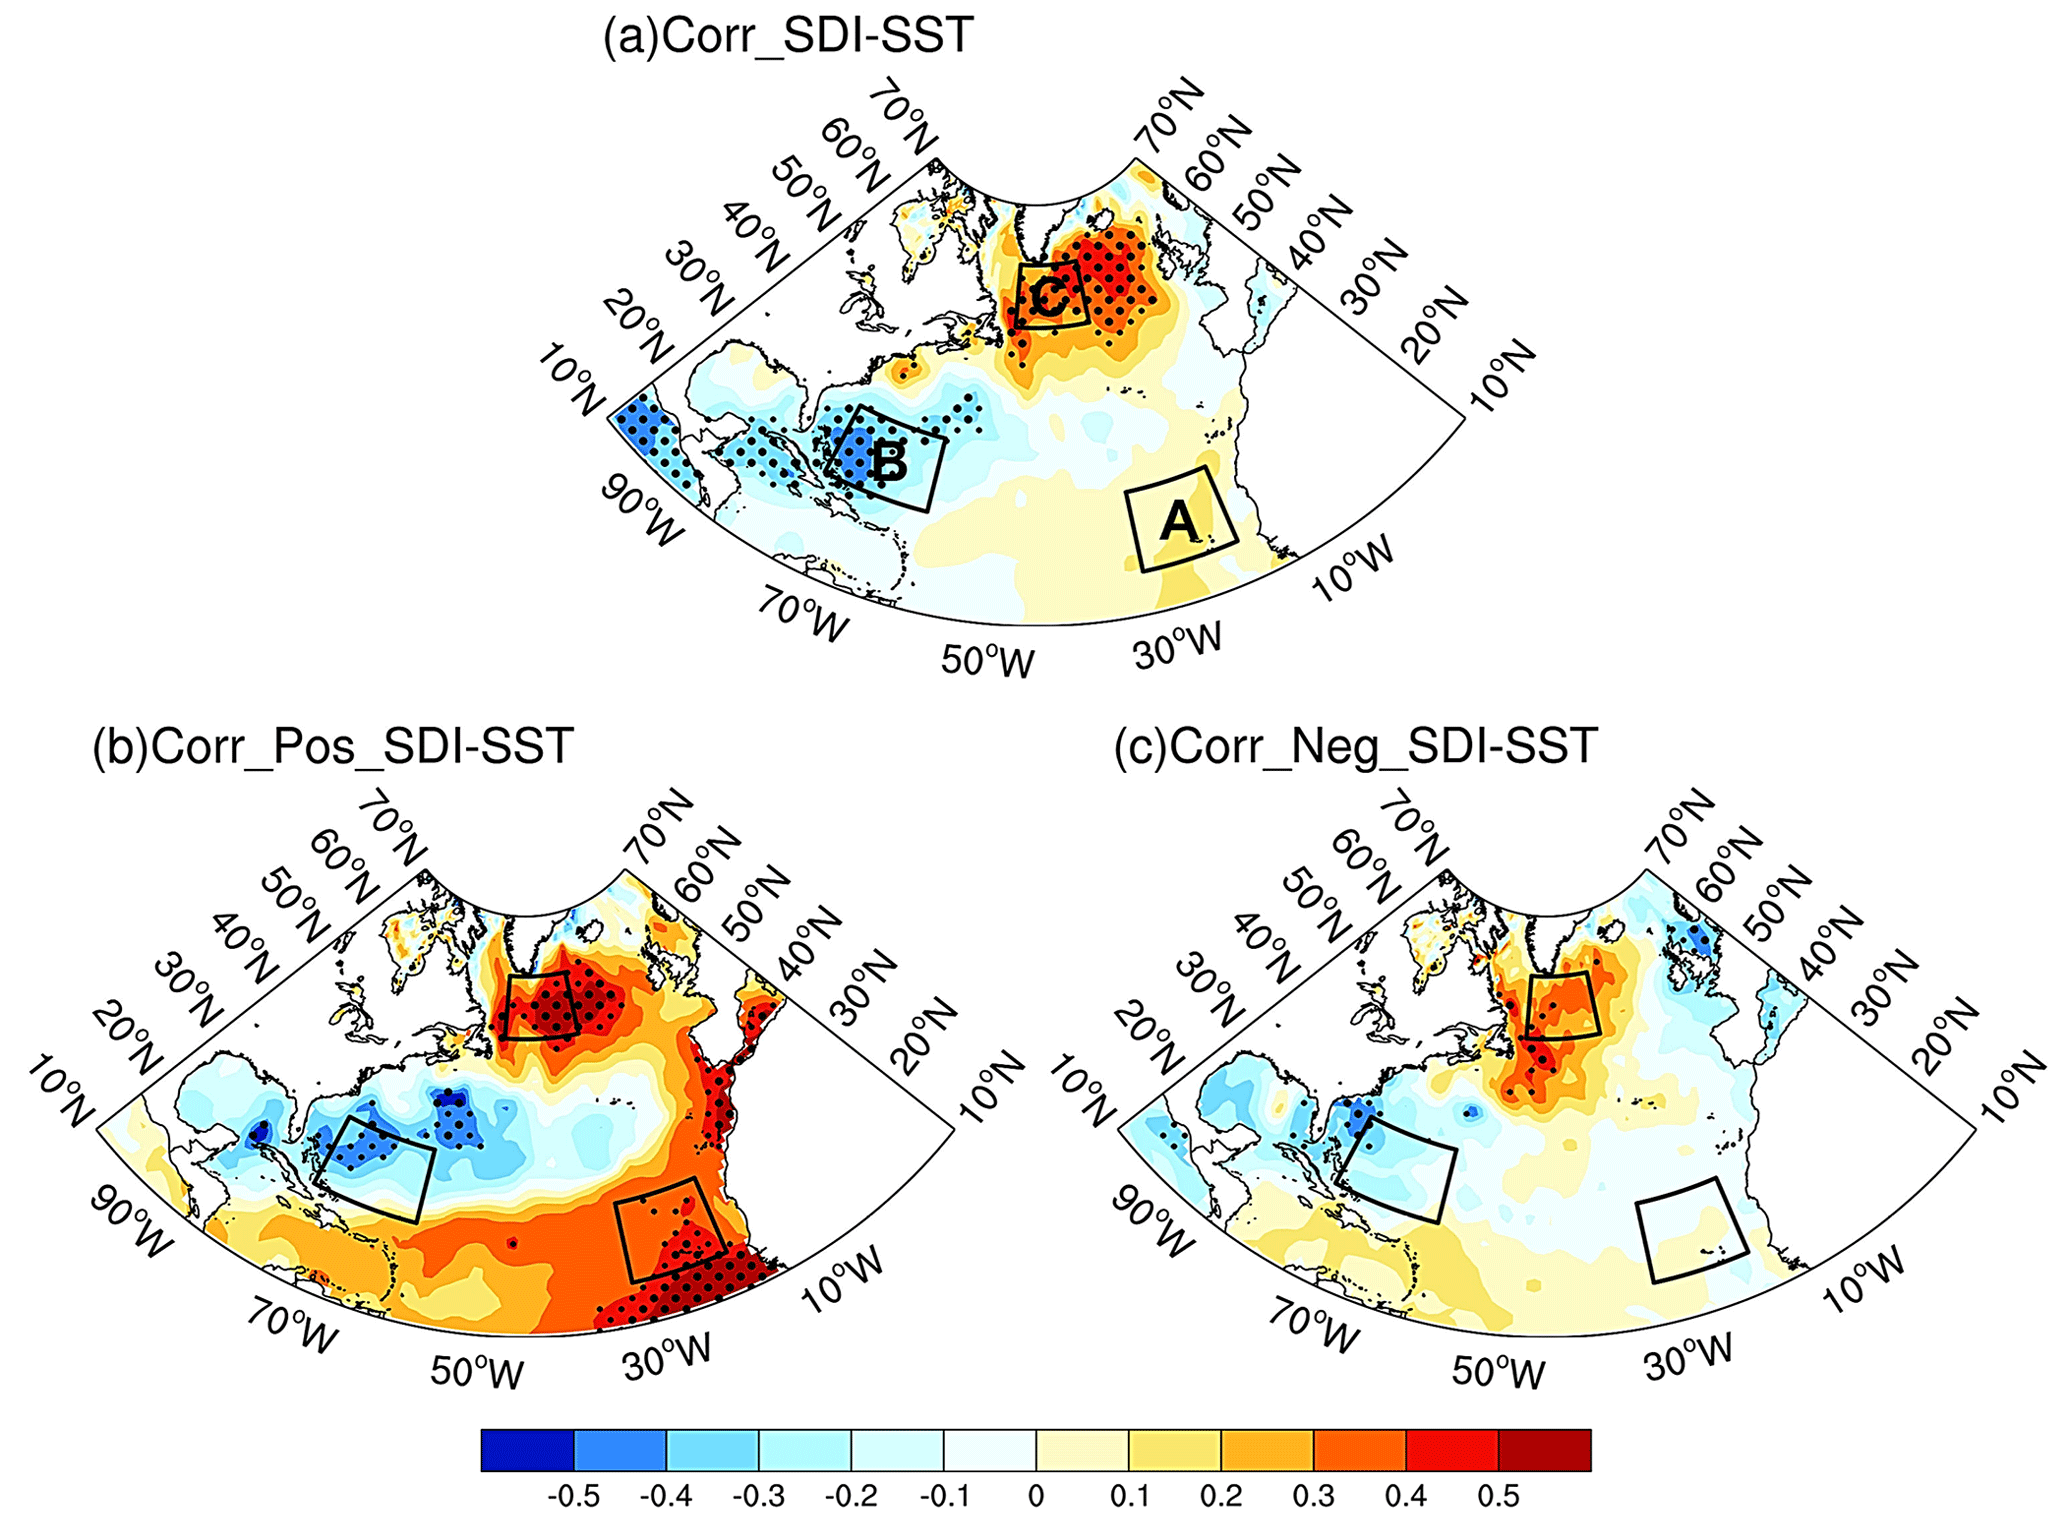
Figure 8(a) Spatial distribution of the correlation coefficients between the SDI and simultaneous SST. (b, c) Spatial distribution is the same as in panel (a), but it corresponds to the positive and negative phases of the SDI. Thickly and finely stippled areas represent statistical significance at the 0.05 and 0.1 levels, respectively. The black box represents the NATI.
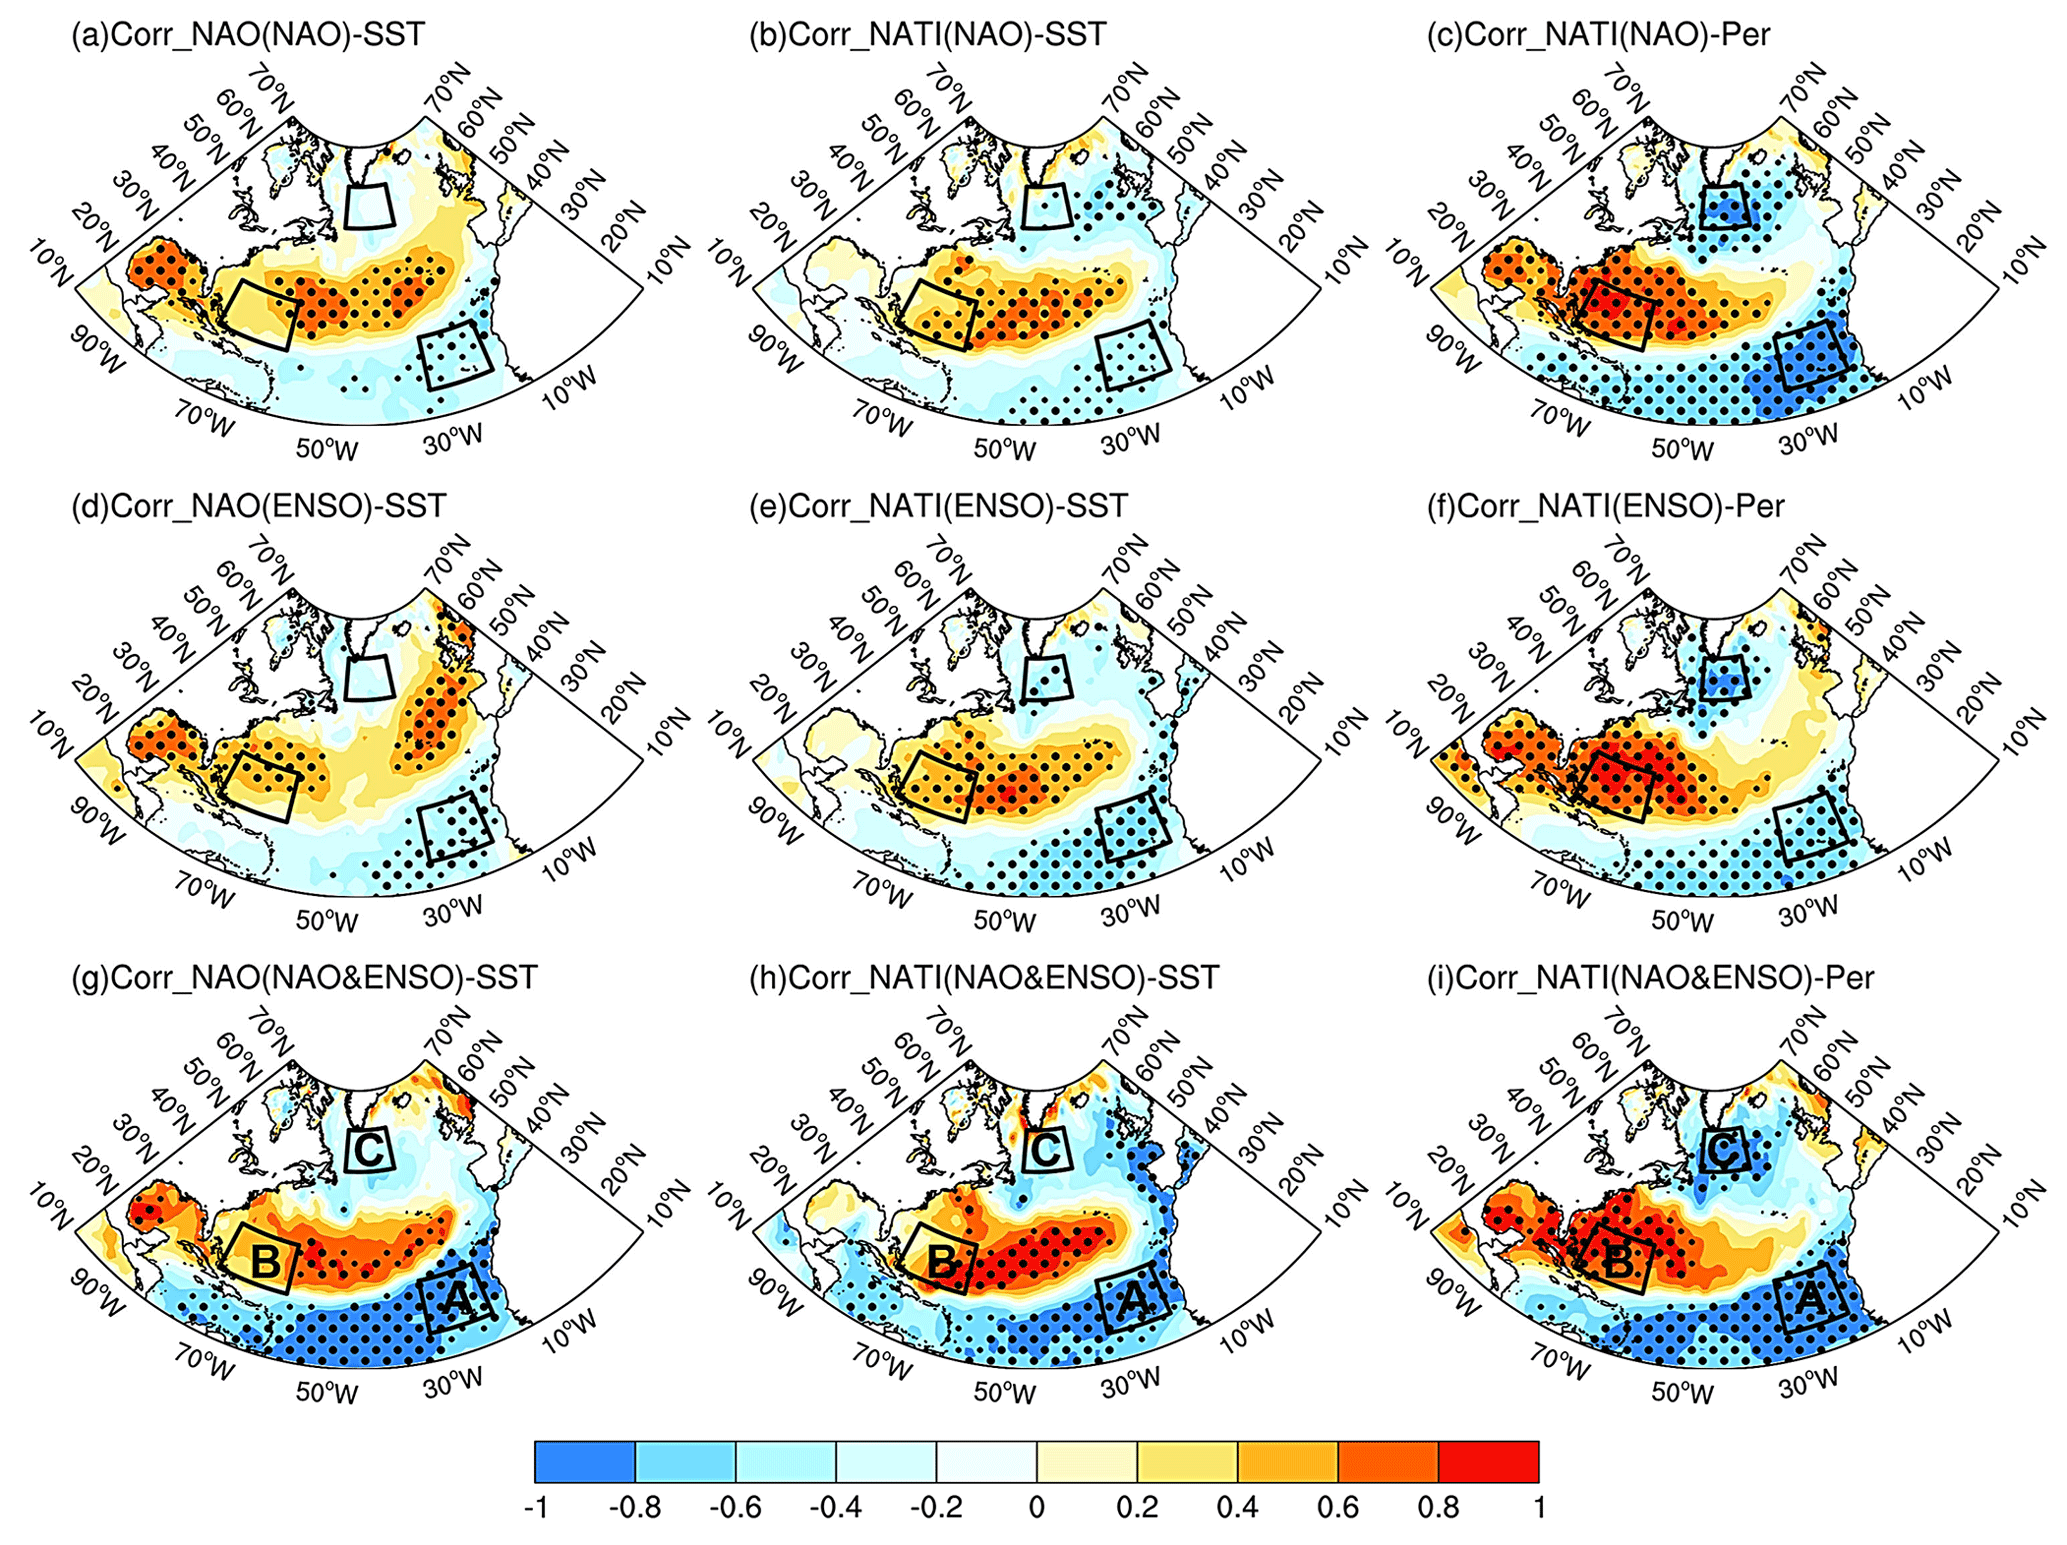
Figure 9The upper row shows the correlation distributions of (a) the winter NAOI with winter SST, (b) the winter NATI with spring SST, and (c) the winter NATI with SSTp during negative NAO phases. The middle and lower rows show the same information as the upper row, but they correspond to (d–f) the negative ENSO phase and (g–i) the co-occurring negative phases of the NAO and ENSO. Thickly and finely stippled areas represent statistical significance at the 0.05 and 0.1 levels, respectively. The black box represents the NATI.
Table 2Correlation coefficients between the NAOI and NATI across different categories.
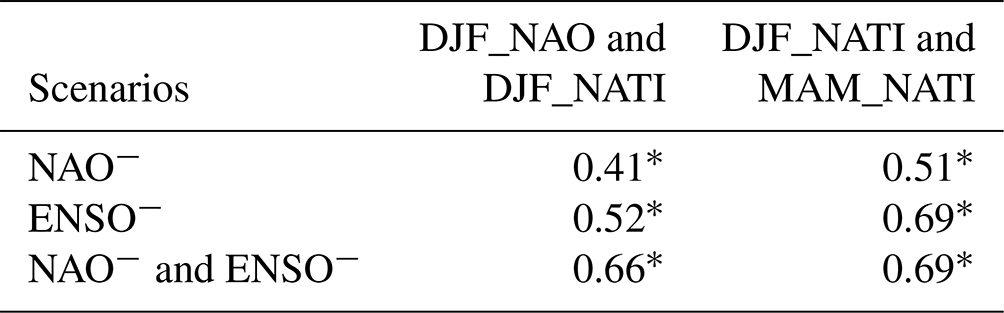
The asterisk (∗) indicates statistical significance at the 0.1 level.
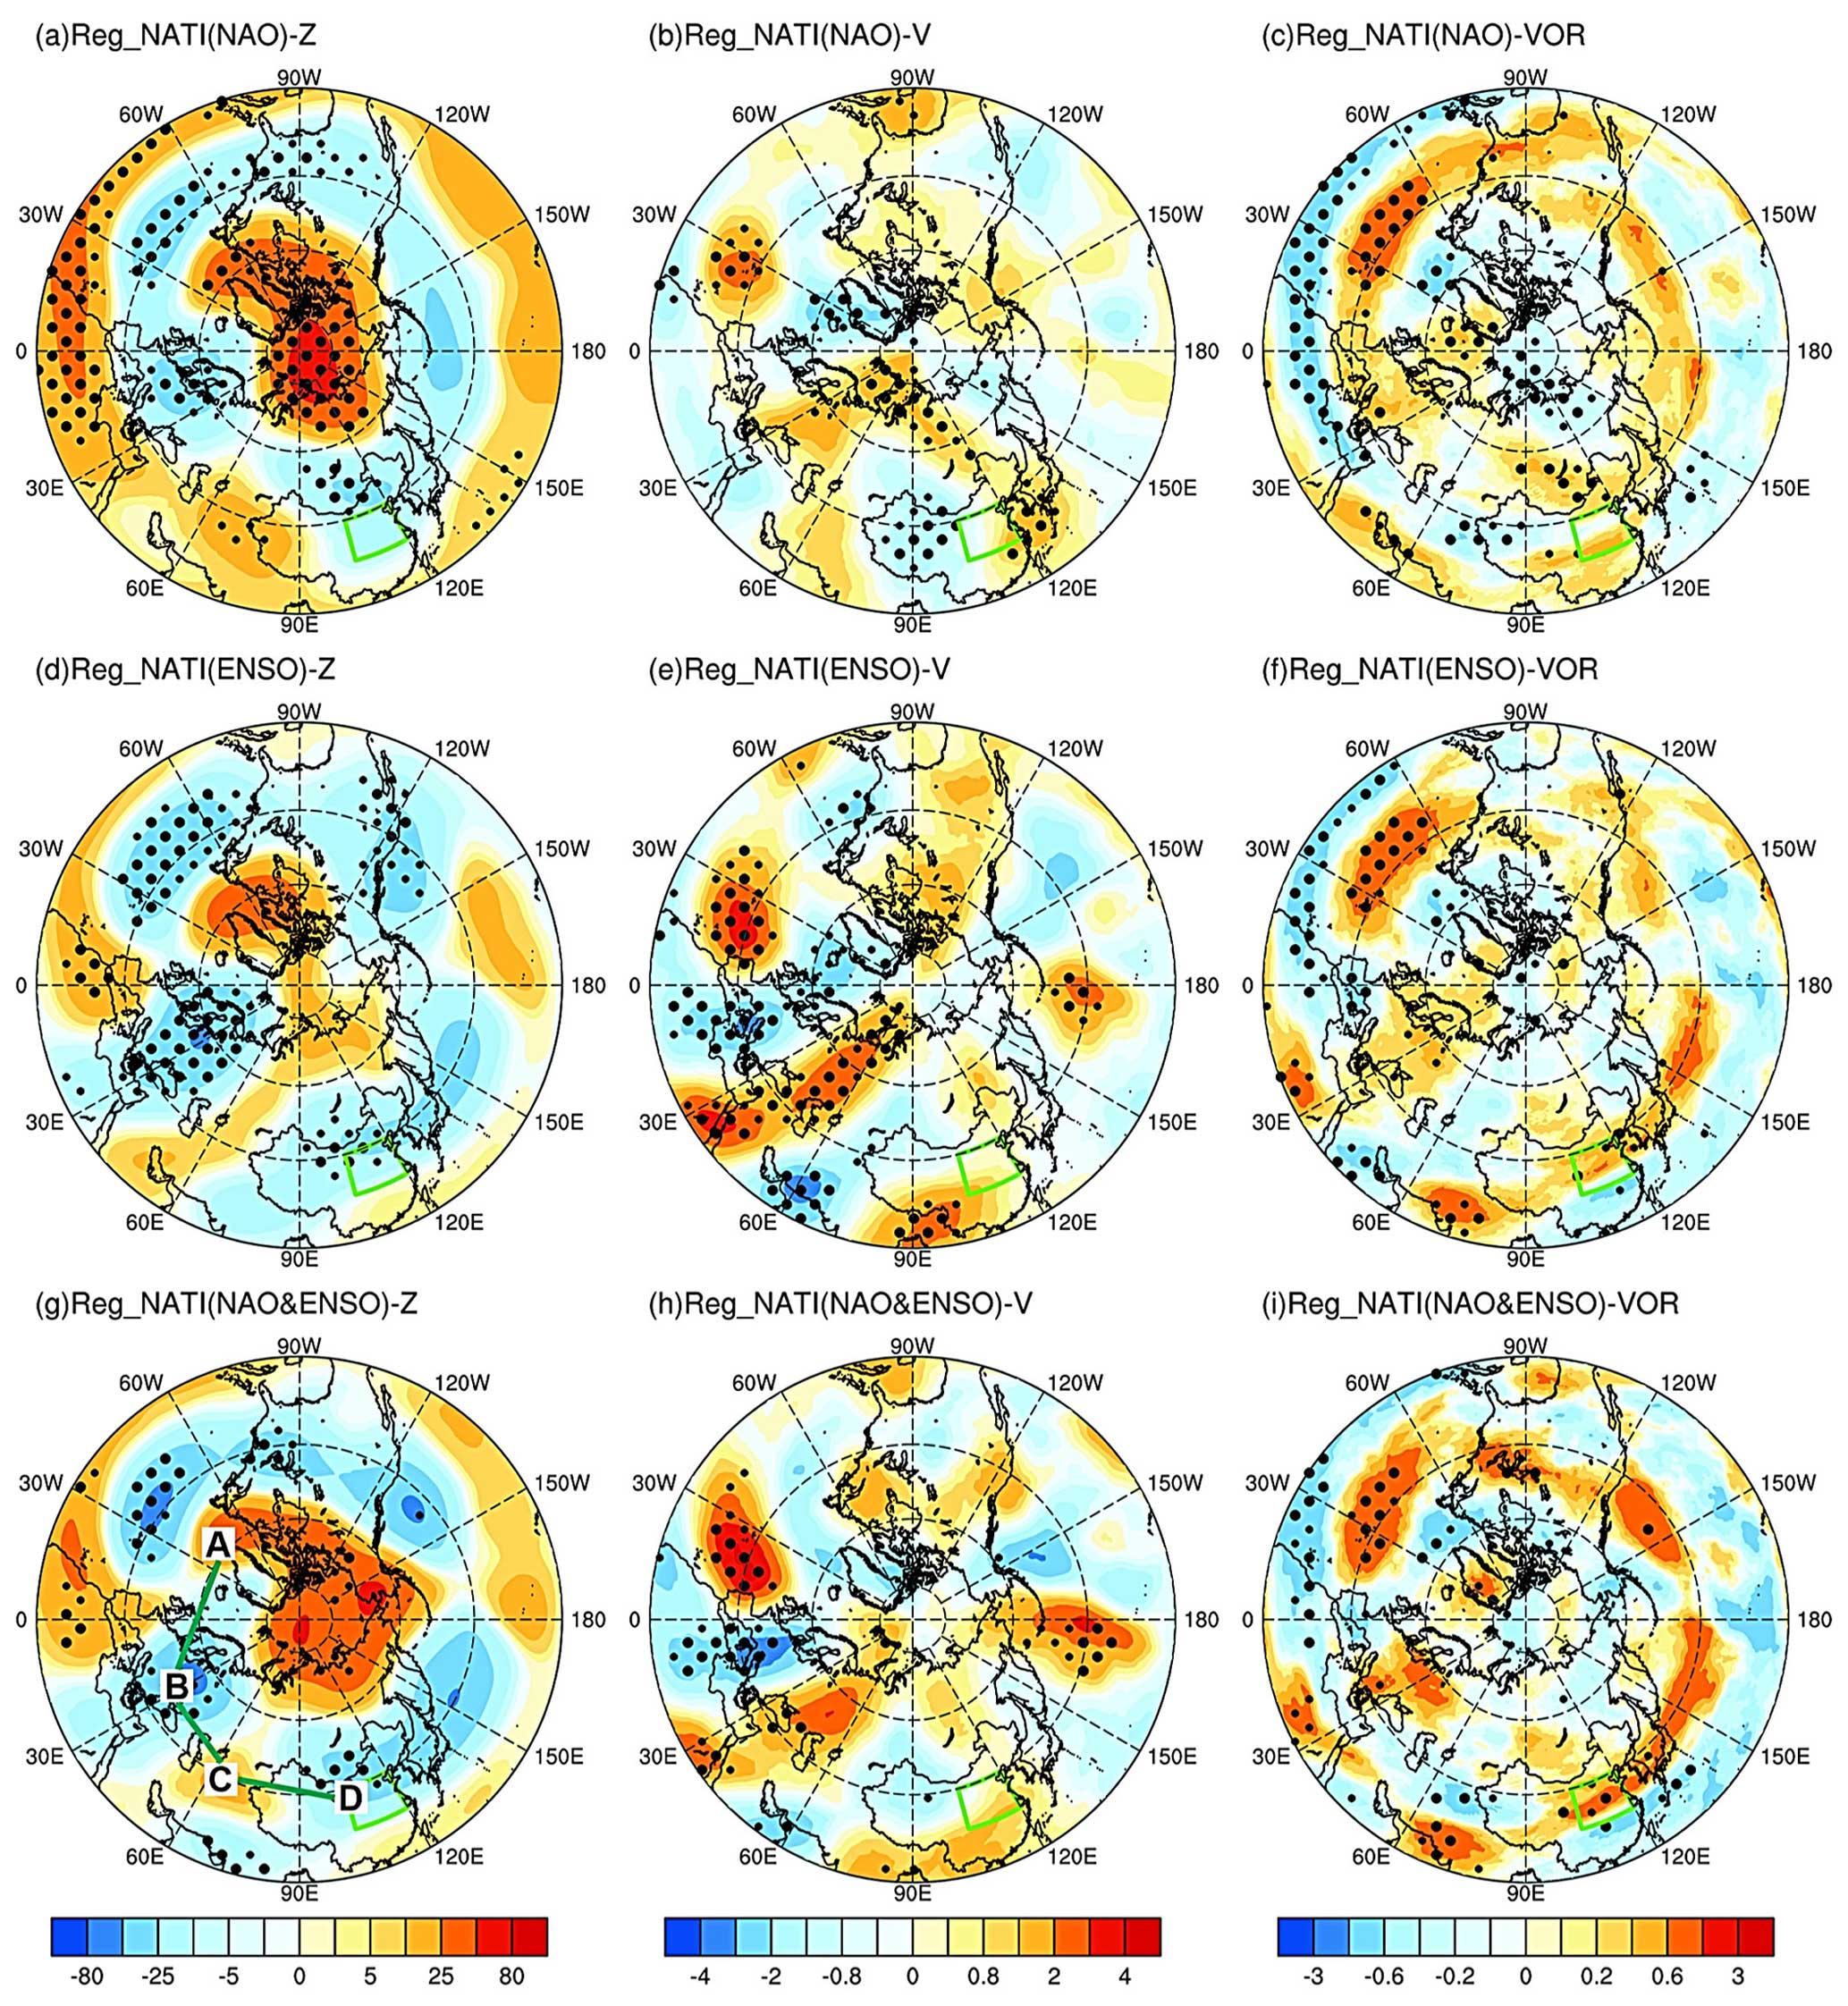
Figure 10The upper row shows the regression (Reg) distribution of the spring NATI against spring (a) geopotential height (units are given in gpm), (b) meridional wind (units are given in m s−1), and (c) vorticity (VOR; expressed in terms of 10−5 m s−1) at 200 hPa during the negative NAO phase. The middle and lower rows show the same information as the upper row, but they correspond to (d–f) the negative ENSO phase and (g–i) the concurrent negative phases of the NAO and ENSO. The green box represents North China. Regression fields have been multiplied by −1 to facilitate direct comparison between the circulation anomalies associated with the NAO and ENSO and the climatology. Thickly and finely stippled areas represent statistical significance at the 0.05 and 0.1 levels, respectively.
The synergistic effects of climate variabilities from middle to high latitudes and the tropics are pivotal mechanisms affecting the weather and climate in East Asia (Feng et al., 2019; Li et al., 2019). Accordingly, we will examine whether the negative phases of the previous winter's NAO and ENSO exert synergistic effects on dust content over North China. As shown in Fig. 5c, when the NAO is in its negative phase (Table 1; white part of the “NAO” bar in Fig. 5c), the value of the anomalous SDI is +16.21 mg m−2 (statistically significant), whereas it is +8.32 mg m−2 (statistically insignificant) when the negative NAO occurs alone (red part of the “NAO” bar in Fig. 5c). Similarly, the value of the anomalous SDI during the negative ENSO phase is greater than the value obtained when the negative ENSO occurred alone (+19.40 mg m−2 (statistically significant) vs. + 14.88 mg m−2 (statistically insignificant)). When both the NAO and the ENSO are in their negative phases (Table 1), the value of the anomalous SDI (+25.23 mg m−2; statistically significant) is much greater than the value obtained when only one of them is in its negative phase (green bar in Fig. 5c). This indicates that the negative phases of the previous winter's NAO and ENSO demonstrate synergistic effects on dust content over North China. Therefore, three categories, i.e., the NAO is in its negative phase, the ENSO in its negative phase, and both the NAO and the ENSO in their negative phases (Table 1), are discussed in context to elucidate the relevant processes of the synergistic effects of the NAO and ENSO on dust content over North China.
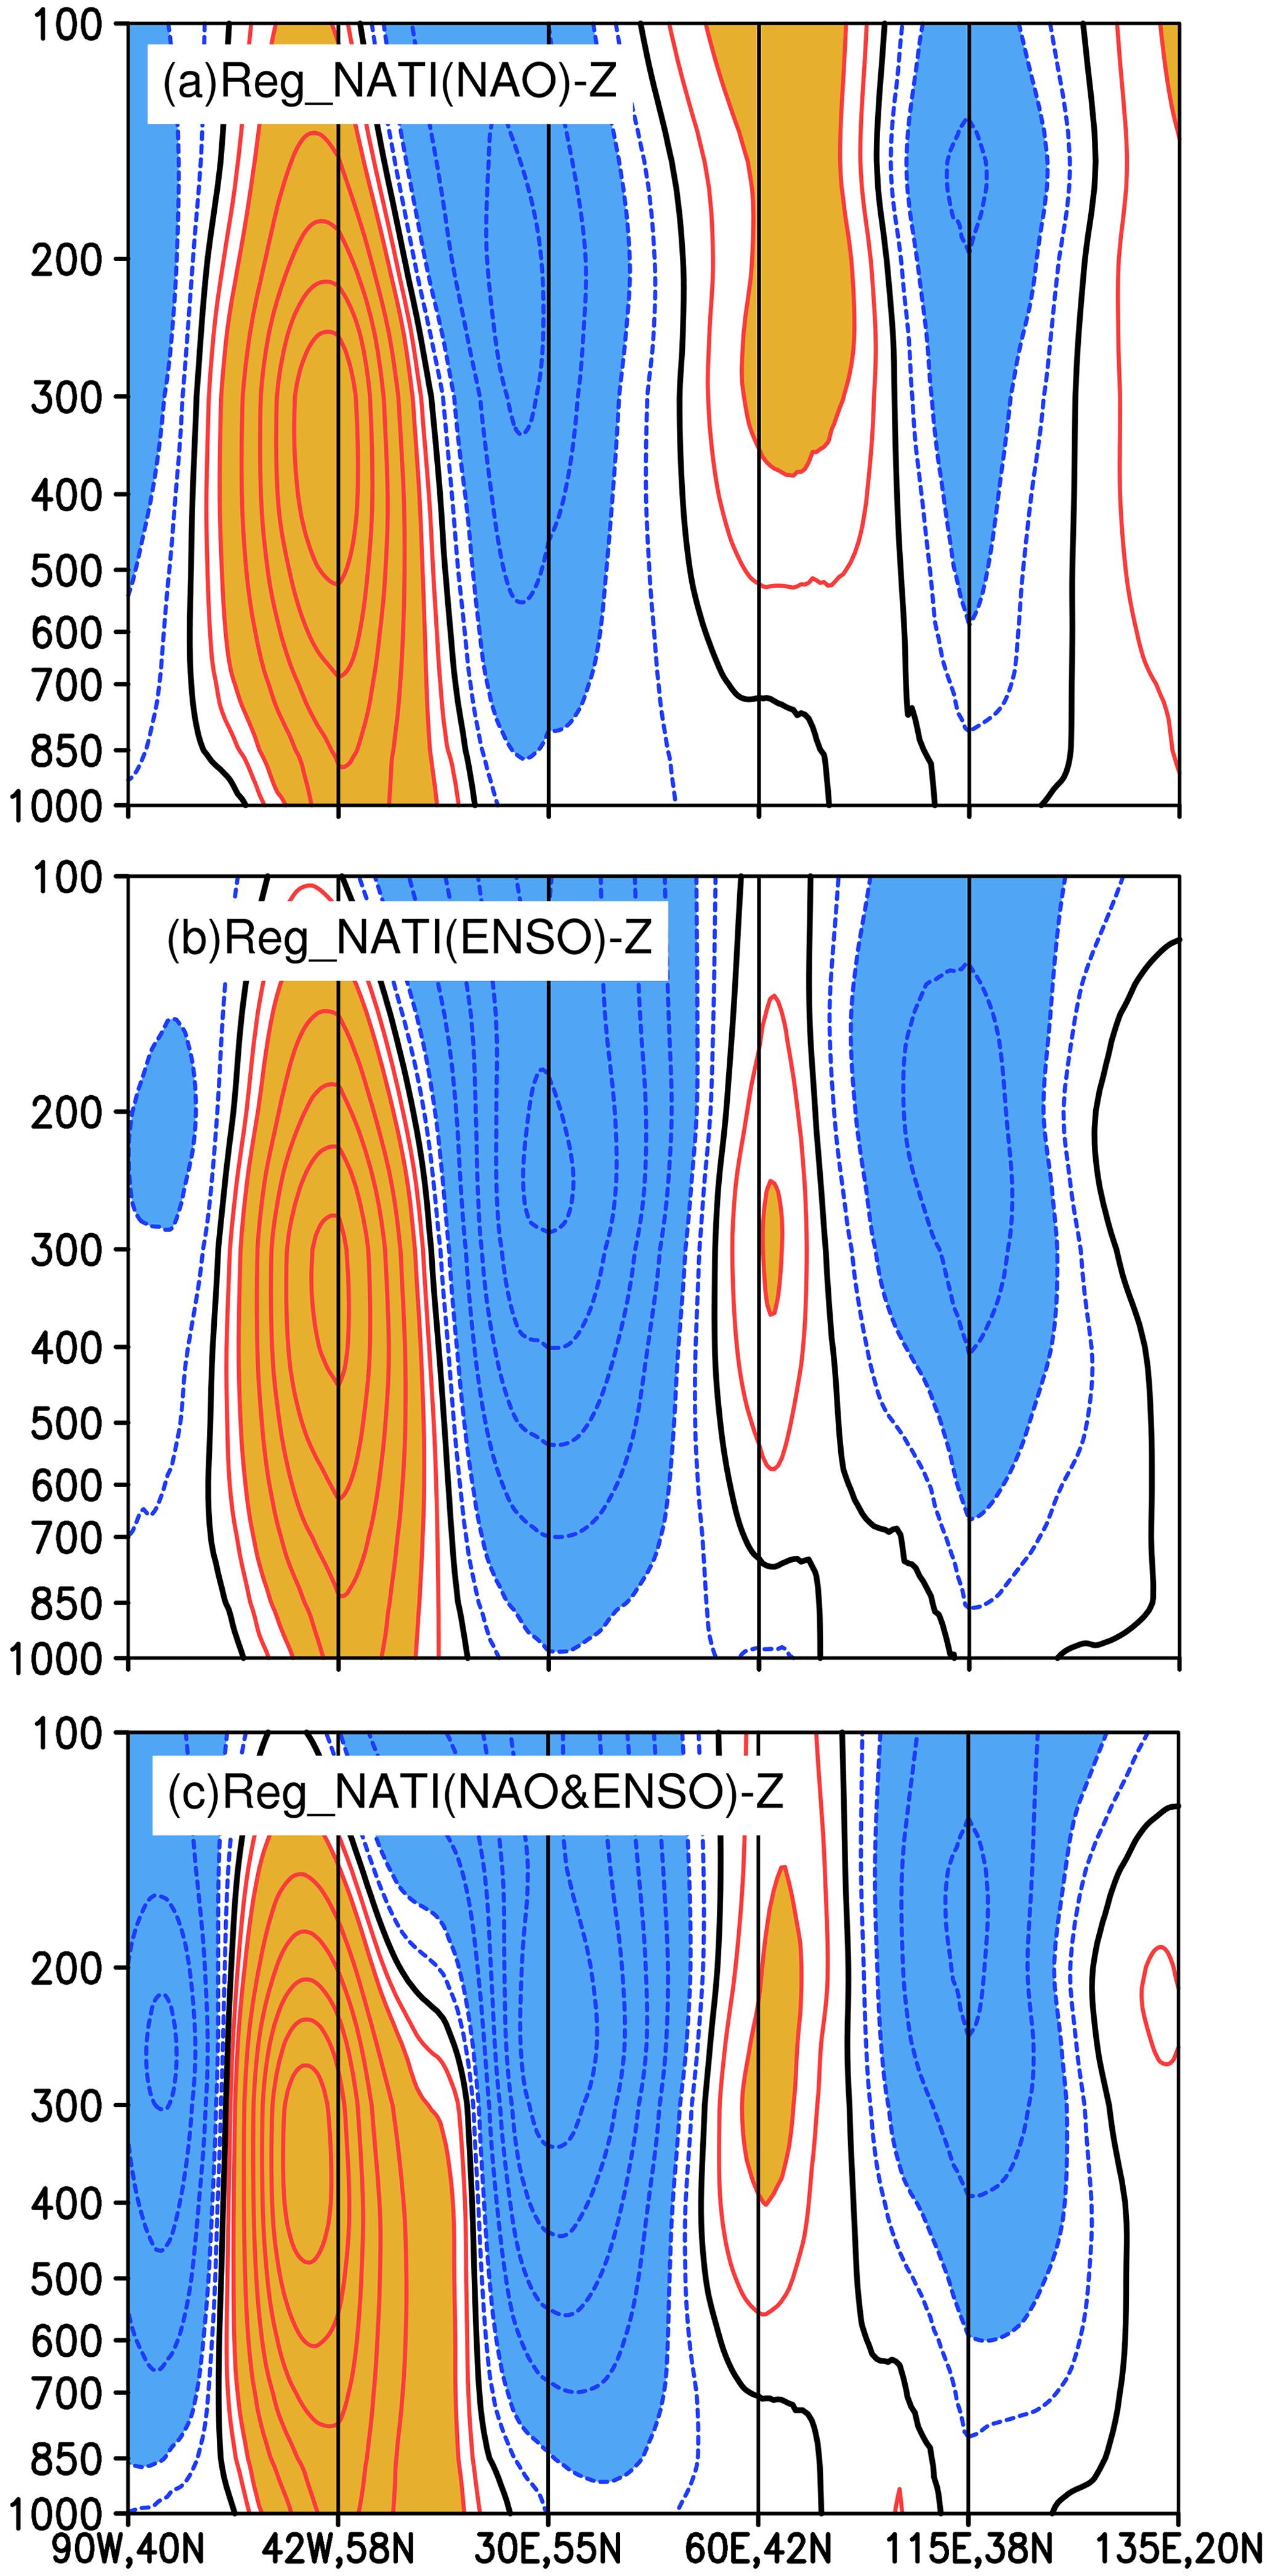
Figure 11Vertical sections illustrating the regression of the spring NATI against geopotential height, corresponding to the solid lines labeled A (58° N, 42° W), B (55° N, 30° E), C (42° N, 60° E), and D (38° N, 115° E) in Fig. 10g for (a) the negative NAO situation in the previous winter. (b)–(c) Same as in panel (a) but for the negative ENSO phase and the co-occurring negative phases of the NAO and ENSO, respectively (units are given in gpm). Regression fields have been multiplied by −1 to facilitate direct comparison between the circulation anomalies associated with the NAO and ENSO and the climatology. Shading indicates that the absolute value is greater than 10 gpm.
3.2 Impacts of the NAO and ENSO on environmental variables
To examine the anomalous characteristics associated with the NAO and ENSO, circulation anomalies in their individual negative phases, as well as in their co-occurring negative phases (Table 1), are analyzed. In the upper troposphere (200 hPa), zonal wind intensifies over northwest China and Mongolia during the negative NAO phase (Fig. 6a), with significant positive anomalies centered over Mongolia. In the negative ENSO phase, intensified zonal winds over northwest China and Mongolia are observed in the upper level (Fig. 6d). The intensification of upper-level zonal wind boosts upper-level momentum, which is transferred downward to the middle–lower troposphere through vertical circulation (Wu et al., 2016; Li et al., 2023), causing windy weather in the dust source regions, facilitating dust lifting and transport activities, and thereby promoting the occurrence of dust activities in downstream North China. When both the NAO and the ENSO are in their negative phases, a primary positive anomaly center appears over the northern part of North China, facilitating dust transport to North China. This result implies the synergistic effects of the NAO and ENSO on upper-level zonal wind, enhancing dust transport from source regions to North China and thereby favoring dust activities in North China (Fig. 6g).
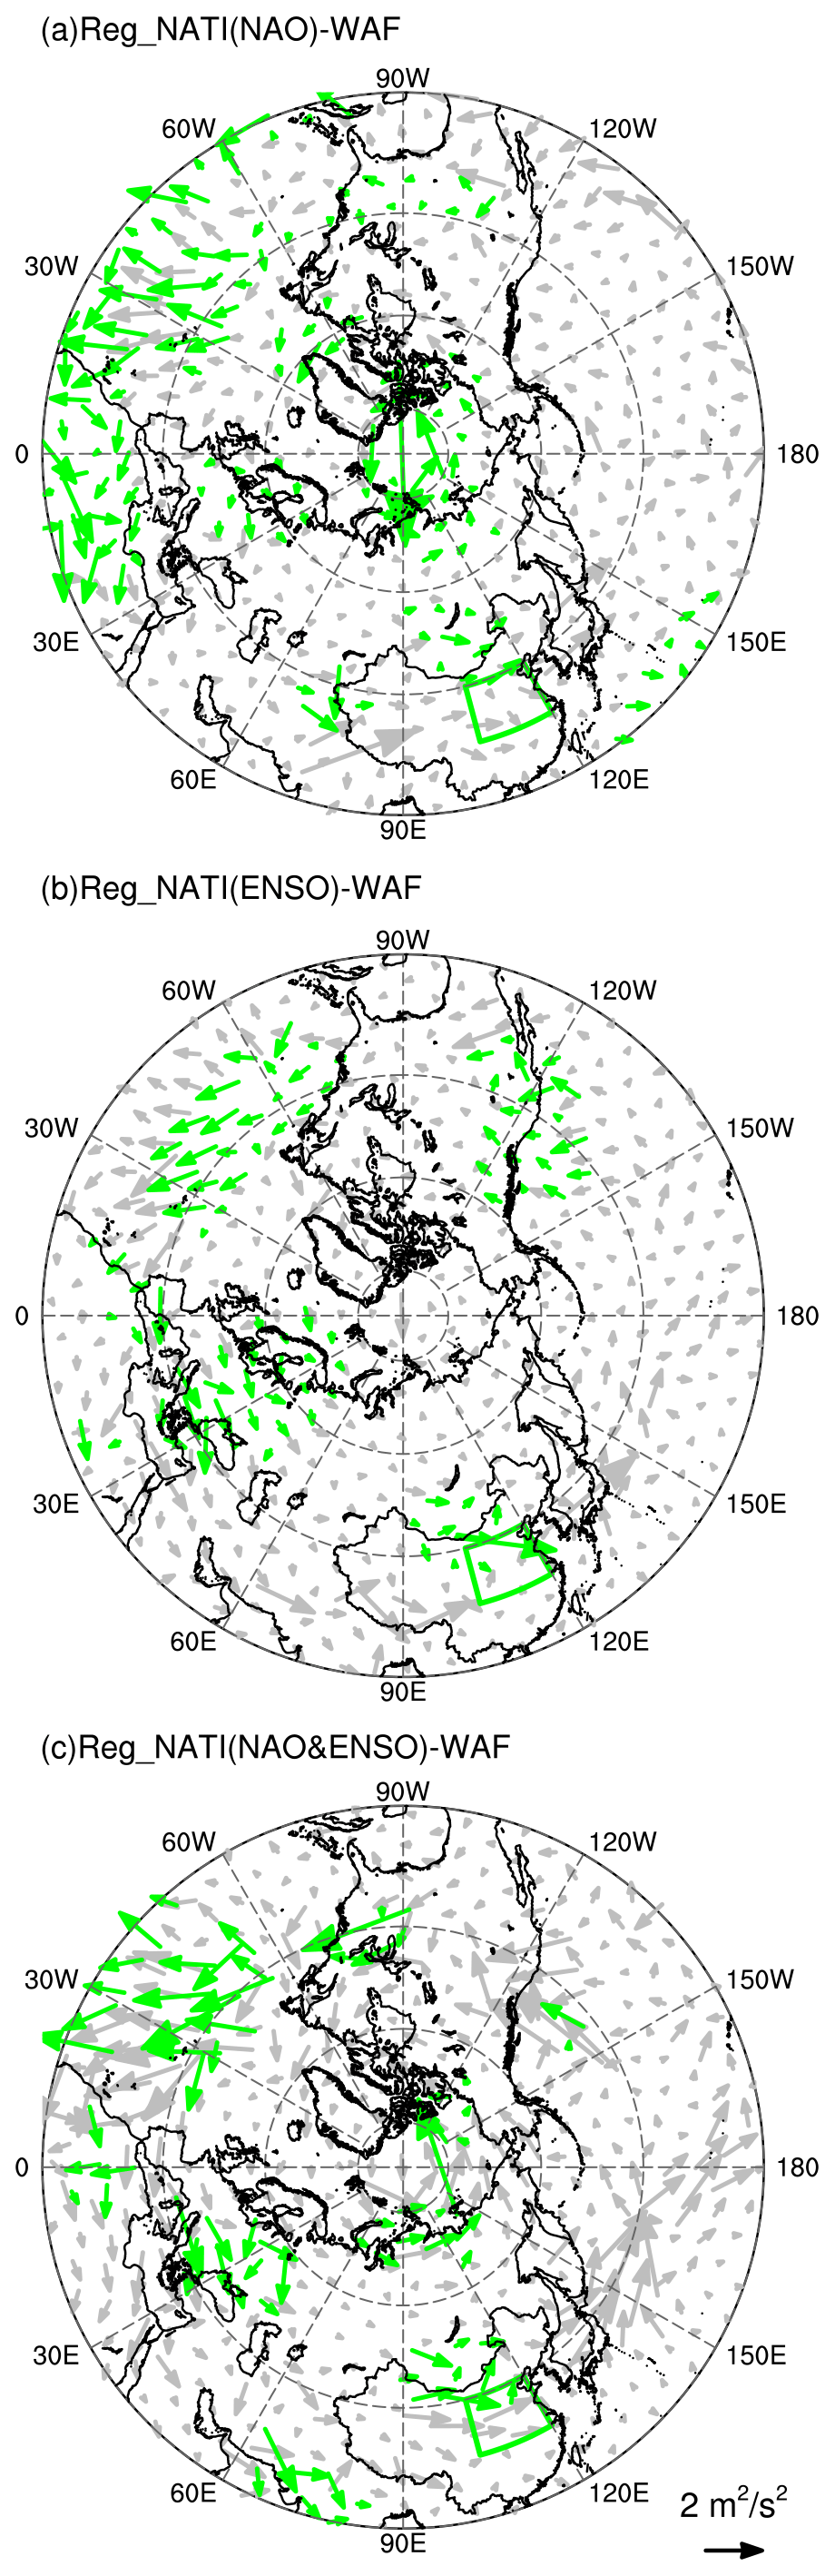
Figure 12Same as in Fig. 10 but for the regression distribution of the spring NATI against the T–N wave activity flux (units are given in m s2). The green box represents North China. Regression fields have been multiplied by −1 to facilitate direct comparison between the circulation anomalies associated with the NAO and ENSO and the climatology. Green arrows represent statistical significance at the 0.1 level.
Subsequent analysis delved into the anomalous distribution of the circulation field in the middle–lower troposphere. In the negative NAO situation, a pronounced trough–ridge anomaly pattern emerges in the mid-latitude region, characterized by a trough in Siberia and a ridge in the Middle East (Fig. 6b). This atmospheric configuration fosters dominant meridional circulation in the middle–high-latitude region, enhancing the southward transport of cold air from the north. This incursion of cold air strengthens surface wind speeds, promoting the uplift and transport of dust from source regions. In the negative ENSO situation, a similar trough–ridge pattern is observed at mid-latitudes; however, it exhibits more pronounced circulation anomalies over the WNP. The region is predominantly under the influence of northeasterly winds on its western flank, manifesting cyclonic-circulation anomalies (Fig. 6e). This abnormal circulation hinders the northward transport of warm and moist air from the South China Sea and the Bay of Bengal, diminishing the likelihood of interactions with cold air from the north and thereby reducing the likelihood of the formation of stationary fronts and precipitation. The decrease in precipitation weakens the wet deposition (Zheng et al., 2016b; Huang et al., 2021), favoring the occurrence of dust activities in North China. When both the NAO and the ENSO are in their negative phases, meridional circulation in the mid-latitude region is enhanced (Fig. 6h). The southward shift in the trough–ridge pattern significantly increases wind speeds in the upstream dust source regions of North China, providing a substantial source of dust for North China. Additionally, the presence of cyclonic-circulation anomalies over the WNP reduces the transport of warm and moist air from the south, which is unfavorable for precipitation. This reduction in precipitation suppresses wet deposition, favoring the occurrence and intensification of dust activities in North China.
As for SLP, significant positive anomalies appear in eastern Europe and Russia during the negative NAO situation, indicating that the Siberian High (SH) is intensified and has extended southward to the dust source regions upstream of North China (Fig. 6c). The intensification of the SH is typically accompanied by strong northerlies and dry conditions, which favor the transport of dust, thereby providing abundant material sources for dust activities in North China. In the negative ENSO case, although the high-latitude region exhibits a weaker SH signal, significant circulation anomalies occur over the WNP. These cyclonic-circulation anomalies inhibit the northward transport of warm and moist air from the south, leading to unfavorable precipitation conditions in North China (Fig. 6f). When both the NAO and the ENSO are in their negative phases, the intensity and extent of the SH are more pronounced compared to when only the NAO is in its negative phase. Additionally, cyclonic-circulation anomalies persist over the WNP, which is conducive to the occurrence of dust activities in North China (Fig. 6i).
The results suggest that when both the NAO and the ENSO are in their negative phases, synergistic effects emerge, making the atmospheric-circulation anomalies in the troposphere more conducive to dust activities in North China. The synergistic effects likely result from the superposition and interaction of various atmospheric levels modulated by the NAO and ENSO, forming favorable circulation conditions for dust activities in North China.
Dust activities are not only impacted by large-scale circulation patterns, but also influenced by local surface conditions and meteorological processes. Surface properties and local meteorological factors play important roles in the initiation, development, and dissipation of dust activities (Liu et al., 2004; Huang et al., 2021). In particular, humidity and precipitation are decisive factors in determining the frequency and intensity of dust activities (Prospero et al., 1987; Kim and Choi, 2015). Low humidity leads to drier soil conditions in dust source regions, reducing soil particle cohesion and facilitating dust lifting and transport (Csavina et al., 2014). Similarly, less precipitation weakens wet deposition, resulting in higher dust content (Zheng et al., 2016b). Therefore, we further analyzed the potential impacts of the NAO and ENSO on humidity and precipitation. During the negative NAO phase, humidity and precipitation slightly decrease in the northern part of northwest China, impacting dust lifting and transport in the dust source regions (Fig. 7a–b). In the negative ENSO phase, variations in humidity and precipitation are similar to those observed in the negative NAO phase but exhibit greater amplitudes (Fig. 7c–d). When both the NAO and the ENSO are in their negative phases, the humidity and precipitation anomalies in the dust source regions are more intense than those caused by the individual factors (Fig. 7e–h). The NAO and ENSO modulate humidity and precipitation by affecting atmospheric-circulation anomalies, ultimately affecting dust activities in North China. During the negative NAO situation, the diminished atmospheric-pressure gradient in the middle–high-latitude regions of the North Atlantic causes the intensification of and southward shift in the SH (Zhou et al., 2023), which are accompanied by strong wind, making the environment drier and more conducive to dust lifting and transport in dust source regions. In the negative ENSO situation, the upper atmosphere over the WNP is dominated by significant negative anomalies in geopotential height and northeasterly winds (Zhang et al., 2015), reducing moist air transport. When both the NAO and the ENSO are in their negative phases, their influence on atmospheric circulation produces synergistic effects, further promoting the occurrence of dust activities in North China.
3.3 Impact of the physical mechanisms of the NAO and ENSO on dust activities
The above results demonstrate that the previous winter's NAO and ENSO significantly impact spring dust activities in North China. Consequently, an examination of the underlying physical mechanisms is warranted. The previous ENSO signal can alter atmospheric circulation over the WNP through the persistent impact of SST, affecting the subsequent weather and climate in China (Kim and Kug, 2018; Jiang et al., 2019). Given the relatively short memory of the NAO as an atmospheric phenomenon, we employ the theory of ocean–atmosphere coupling to elucidate the involved processes. The tripole configuration of SST is the leading mode of SST variation in the North Atlantic, and its variabilities are closely associated with the NAO (Wu et al., 2009). This association allows the previous NAO signal to exert a long-term influence on the subsequent weather and climate in China (e.g., Chen et al., 2020; Wu and Chen, 2020; Song et al., 2022). The variation in the SDI is linked to an anomalous tripole SST in the North Atlantic (Fig. 8a), paralleling the SST anomalies associated with the negative phase of the NAO. Therefore, the North Atlantic tripole index (NATI) is defined as depicting the characteristics of SST anomalies (Eqs. 4–7). A correlation analysis between the high and low years of the SDI and SST reveals a pronounced difference, indicating an asymmetric correlation (Fig. 8b-c). Specifically, the significant relationship between the SDI and NATI only exists in the years with a positive SDI, with a significant correlation coefficient of −0.47, implying that the occurrence of the NATI is associated with increased dust activities over North China.
Moreover, the relationship between the previous winter's NAOI and the spring NATI is only manifested during the negative phase of the NAO, with a statistically significant correlation coefficient of 0.41 (figures not shown). This elucidates why the significant impact of the NAO on dust activities in North China only exists during its negative phase. The correlations between the previous winter's NAO and North Atlantic SST reveal that the NAO is linked to an anomalous tripole SST pattern during the negative NAO situation (Fig. 9a). Similar findings are observed during the negative ENSO situation (Fig. 9d). When both the NAO and the ENSO are in their negative phases, the anomalous tripole SST pattern is more pronounced (Fig. 9g). This suggests that the ENSO enhances the connection between the negative NAO and the NATI, providing an explanation for the synergistic effects of the NAO and ENSO on dust activities in North China.
In the negative NAO phase, there is a notable correlation between the previous winter's NATI and the spring SST and SSTp (Fig. 9b–c), indicating that the previous winter's NATI can persist into spring, with the self-persistence of SST playing an important role. Similar findings are observed during the negative ENSO phase (Fig. 9e–f) and when both the NAO and the ENSO are in their negative phases (Fig. 9h–i). Additionally, the correlation coefficients between the NAOI and NATI in different scenarios can illustrate the synergistic influence of the NAO and ENSO on the persistence of SST anomalies (Table 2). Specifically, when the negative phases of the NAO and ENSO co-occur, the correlation coefficients between the NAOI and NATI are greater than those influenced by a single factor alone. The impacts of the previous winter's NAO on spring dust activities over North China mainly include the following points. (1) The previous winter's NAO can stimulate the anomalous North Atlantic tripole (NAT) SST pattern. (2) The NAT can persist from the previous winter to the following spring due to the thermal persistence of the SST. (3) The spring NAT can significantly modulate the circulation pattern over North China through a teleconnection wave train, influencing spring dust activities over North China. It is shown in Table 2 that the correlation coefficients of the previous winter's NATI and the spring NATI are the same during the ENSO phase alone as during the concurrent NAO and ENSO phases. However, the correlations between the NAOI and NATI are higher during the concurrent NAO and ENSO phases (0.66) than during the ENSO phase alone (0.52), highlighting the more significant role of the NAO in influencing the NAT during the concurrent NAO and ENSO phases.
Given the distance across the Eurasian continent between the North Atlantic and North China, the role of teleconnection wave trains is particularly important in influencing dust activities over North China. Figure 10a presents the geopotential height field at 200 hPa, regressed onto the spring NATI for the negative NAO situation. This reveals a pronounced north–south reversed dipole pattern in the North Atlantic, with negative values over the Azores and positive values over Iceland, representing a typical negative-NAO-based structure (Wallace and Gutzler, 1981; Li and Wang, 2003). Additionally, a negative–positive–negative teleconnection wave train structure centered around eastern Europe, the Middle East, and North China is observed, suggesting that disturbance energy propagates downstream from the North Atlantic through waveguide effects. The teleconnection wave train characteristics are also observed in the meridional wind and vorticity fields at 200 hPa (Fig. 10b–c). In the negative ENSO case, modulated by the NATI, similar teleconnection structures are also seen in the circulation field (Fig. 10d–f). Notably, when both the NAO and the ENSO are in their negative phases, the correlation patterns of the teleconnection structure are similar; however, the anomalies over North China are enhanced, with significant anomalies observed in the vorticity field (Fig. 10g–i), confirming the synergistic effects of the NAO and ENSO on circulation processes affecting dust activities in North China.
To further examine the impact of the mechanisms of the NAO and ENSO on spring dust activities in North China, a cross-section distribution of the geopotential height field is presented (Fig. 11), based on the propagation characteristics of the teleconnection wave train shown in Fig. 10. In scenarios where either the NAO or the ENSO is in its negative phase, the NATI anomalies correspond to a teleconnection wave train extending from the upper troposphere to the lower troposphere, which is specifically characterized by a negative–positive–negative teleconnection pattern centered around eastern Europe, the Middle East, and North China (Fig. 11a–b). This wave train propagates across the Eurasian continent, ultimately influencing dust activities over North China. Furthermore, an analysis of the cross-section at different levels of the troposphere reveals that in negative NAO and ENSO situations, the teleconnection wave train excited by the NATI exhibits quasi-barotropic features, with the anomalous structure primarily concentrated in the middle–upper troposphere. When both the NAO and the ENSO are in their negative phases, the intensity and scope of the teleconnection wave train are enhanced and expanded compared to when this wave train is under the influence of a single factor (Fig. 11c), demonstrating synergistic effects.
To provide a more comprehensive analysis of the transport process of disturbance energy in the atmosphere, the horizontal distribution of the WAF associated with spring NATI variations is examined. In scenarios where either the NAO or the ENSO is in its negative phase, the WAF can be clearly observed as originating from the North Atlantic, traversing the Eurasian continent, and extending to North China (Fig. 12a–b). When both factors occur simultaneously, the transport intensity of the WAF is enhanced, and its range of impact on dust activities in North China is broadened (Fig. 12c). Through the analysis of the teleconnection wave train and the WAF, it can be determined that the synergistic effects not only enhance the disturbance intensity in the atmosphere, but also expand the extent of the impact, thereby promoting the occurrence of spring dust activities in North China. The enhancement and expansion of atmospheric disturbances may be related to large-scale circulation anomalies and local climate condition variations induced by the synergistic effects of the NAO and ENSO, which, in turn, affect the transport and deposition processes of dust.
Although North China is not a primary dust source, dust activities are notably high during spring in this region. This study highlights that the previous winter's NAO and ENSO exert essential influences on the following spring's dust activities in North China. These impacts are asymmetric, manifesting only when both of these factors are in their negative phases. Furthermore, the results indicate that the NAO and ENSO in their negative phases have synergistic effects on spring dust activities in North China, promoting dust activities with a greater impact than either factor alone.
Under the influence of the negative phases of the NAO and ENSO, atmospheric circulation in the troposphere, from the lower to upper layers, exhibits significant anomalies. These include variations in upper-level zonal winds, mid-latitude trough–ridge systems, and atmospheric circulation at SLP. These variations promote the occurrence of dust activities in North China. Simultaneously, accompanying anomalies in the atmospheric-circulation pattern also affect local meteorological factors, including humidity and precipitation, which impact dust activities in North China. Notably, when both the NAO and the ENSO are in their negative phases, synergistic effects occur, making the anomalies in atmospheric circulation from the lower to upper layers, as well as local meteorological factors, more conducive to the occurrence of dust events in North China. The impact of the NAO on the underlying SST pattern is predominantly observed during its negative phase, elucidating why the NAO significantly influences dust activities in North China only during this phase. Furthermore, when both the NAO and the ENSO are in their negative phases, the teleconnection wave train and WAF stimulated by the North Atlantic are more intense and thus influence dust activities in North China more effectively. This indicates the synergistic effects of these two variabilities on dust activities over North China.
In the process where the previous winter's NAO influences the following spring's dust activities in North China, the NAT plays a crucial role. The NAO signal from the previous winter can be stored in the NAT and can persist into spring. In spring, the NAT regulates the circulation pattern in North China through the teleconnection wave train, ultimately affecting dust activities in North China. The signal of the previous winter's ENSO can persist into spring, affecting dust activities in North China mainly through two pathways – (1) directly influencing dust activities by affecting the circulation anomalies over the WNP and (2) facilitating the process by which the NAO excites the NAT, thereby affecting dust activities in North China. This provides a plausible explanation for why the previous winter's NAO and ENSO exert synergistic effects on the following spring's dust activities in North China.
This study investigated the impacts of the NAO and ENSO on dust activities in North China, as well as the associated physical processes, indicating that one-season-ahead signals serve as useful predictors of spring dust activities in North China. Future work will focus on developing a prediction model that uses the NAO and ENSO as predictors and on validating its effectiveness. The present work mainly focuses on the interannual modulation of the NAO and ENSO with respect to dust activities over North China; however, the NAO and ENSO (Woollings et al., 2015; Feng et al., 2024), as well as dust activities over North China, bear strong interdecadal variations, and long-term datasets are needed to further explore their impacts on dust activities. The present study focuses on the period from 1979–2022 due to the longevity of the MERRA-2 dust content dataset. There are only 7 years of co-occurrence between the negative NAO and ENSO, accounting for 17 % of the entire study period. It is noted that there are fewer co-occurring events compared to events for the negative NAO or ENSO alone; thus, a significance level of 0.1 is displayed. It would be valuable to examine their joint impacts by employing longer datasets or model outputs to further explore their synergistic effects and any possible variations in their modulations. Moreover, while it has been reported that state-of-the-art models can reproduce the individual impacts of the NAO and ENSO on dust activities in North China (Yang et al., 2022), whether their synergistic effects on dust activities could be simulated well requires further research. Additionally, the potential impacts of interdecadal signals, such as the AMO, on dust activities in China have not been discussed. Future work will need to investigate interdecadal variations in dust activities in China and their connection to interdecadal climatic variabilities. Previous studies have indicated that uncertainty in ENSO variability is likely to increase in the context of global warming (Cai et al., 2021; Chen et al., 2024). Therefore, it is crucial to investigate future changes in the ENSO and its synergistic effects with the NAO on dust activities over China to better understand potential trends in future dust activities in North China.
The MERRA-2 dust content dataset can be downloaded from the NASA Goddard Earth Sciences Data and Information Services Center at https://doi.org/10.5067/FH9A0MLJPC7N (Global Modeling and Assimilation Office, 2015). The atmospheric-reanalysis datasets can be downloaded from the ECMWF at https://doi.org/10.24381/cds.6860a573 (Huang et al., 2023). The oceanic-reanalysis data can be downloaded from https://www.metoffice.gov.uk/hadobs/hadisst (Rayner et al., 2003, last access: 22 July 2024). The NAO indices defined by Li and Wang (2003) can be downloaded from http://lijianping.cn/dct/page/65610 (Li and Wang, 2003, last access: 22 July 2024). The NAO indices produced by Hurrell (1995) and Jones et al. (1997) can be downloaded from https://climatedataguide.ucar.edu/climate-data/hurrell-north-atlantic-oscillation-nao-index-pc-based (NCAR, 2003, last access: 22 July 2024) and https://crudata.uea.ac.uk/cru/data/nao (Jones et al., 1997, last access: 22 July 2024), respectively. The ENSO indices can be downloaded from https://psl.noaa.gov/data/timeseries/monthly/NINO34 (Rayner et al., 2003, last access: 22 July 2024). Our results can be made available upon request.
JF and FLX conceptualized and designed the research. FLX and JF synthesized and analyzed the data. FLX, SW, YL, and JF produced the figures. FLX and SW contributed to the dataset retrievals. All authors discussed the results and wrote the paper.
The contact author has declared that none of the authors has any competing interests.
Publisher's note: Copernicus Publications remains neutral with regard to jurisdictional claims made in the text, published maps, institutional affiliations, or any other geographical representation in this paper. While Copernicus Publications makes every effort to include appropriate place names, the final responsibility lies with the authors. Regarding the maps used in this paper, please note that Figs. 1, 2, 3, 4, 5, 6, 7, 10, and 12 contain disputed territories.
The authors would like to thank the editor, Marco Gaetani, and the two anonymous reviewers for their useful comments and suggestions, which contributed to improving the paper. This work was jointly supported by the National Natural Science Foundation of China (grant nos. 42222501 and 42475021) and the BNU-FGS Global Environmental Change Program (grant no. 2023-GC-ZYTS-03). This work was also supported by the National Key Scientific and Technological Infrastructure project “Earth System Numerical Simulation Facility” (EarthLab).
This research has been supported by the National Natural Science Foundation of China (grant nos. 42222501 and 42475021) and the BNU-FGS Global Environmental Change Program (grant no. 2023-GC-ZYTS-03).
This paper was edited by Marco Gaetani and reviewed by two anonymous referees.
Abid, M. A., Kucharski, F., Molteni, F., Kang, I.-S., Tompkins, A. M., and Almazroui, M.: Separating the Indian and Pacific Ocean Impacts on the Euro-Atlantic Response to ENSO and Its Transition from Early to Late Winter, J. Climate, 34, 1531–1548, https://doi.org/10.1175/JCLI-D-20-0075.1, 2021.
Achakulwisut, P., Shen, L., and Mickley, L. J.: What Controls Springtime Fine Dust Variability in the Western United States? Investigating the 2002–2015 Increase in Fine Dust in the U.S. Southwest, J. Geophys. Res.-Atmos., 122, 12449–12467, https://doi.org/10.1002/2017JD027208, 2017.
Ayarzagüena, B., Ineson, S., Dunstone, N. J., Baldwin, M. P., and Scaife, A. A.: Intraseasonal Effects of El Niño–Southern Oscillation on North Atlantic Climate, J. Climate, 31, 8861–8873, https://doi.org/10.1175/JCLI-D-18-0097.1, 2018.
Cai, W. J., Santoso, A., Collins, M., Dewitte, B., Karamperidou, C., Kug, J.-S., Lengaigne, M., McPhaden, M. J., Stuecker, M. F., Taschetto, A. S., Timmermann, A., Wu, L. X., Yeh, S.-W., Wang, G. J., Ng, B., Jia, F., Yang, Y., Ying, J., Zheng, X. T., Bayr, T., Brown, J. R., Capotondi, A., Cobb, K. M., Gan, B. L., Geng, T., Ham, Y.-G., Jin, F. F., Jo, H.-S., Li, X. C., Lin, X. P., McGregor, S., Park, J.-H., Stein, K., Yang, K., Zhang, L., and Zhong, W. X.: Changing El Niño–Southern Oscillation in a warming climate, Nat. Rev.-Earth Environ., 2, 628–644, https://doi.org/10.1038/s43017-021-00199-z, 2021.
Chen, S. F., Wu, R. G., and Chen, W.: Strengthened Connection between Springtime North Atlantic Oscillation and North Atlantic Tripole SST Pattern since the Late 1980s, J. Climate, 35, 2007–2022, https://doi.org/10.1175/JCLI-D-19-0628.1, 2020.
Chen, S. F., Chen W., Xie, S. P., Yu, B., Wu, R. G., Wang, Z. B., Lan, X. Q., and Graf. H.: Strengthened impact of boreal winter North Pacific Oscillation on ENSO development in warming climate, npj Clim. Atmos. Sci., 7, 69, https://doi.org/10.1038/s41612-024-00615-3, 2024.
Chen, S. Y., Zhao, D., Huang, J. P., He, J. Q., Chen, Y., Chen, J. Y., Bi, H. R., Lou, G. T., Du, S. K., Zhang, Y., and Yang, F.: Mongolia Contributed More than 42 % of the Dust Concentrations in Northern China in March and April 2023, Adv. Atmos. Sci., 40, 1549–1557, https://doi.org/10.1007/s00376-023-3062-1, 2023.
Cressman, G. P.: An operational objective analysis system, Mon. Weather Rev., 87, 367–374, https://doi.org/10.1175/1520-0493(1959)087<0367:AOOAS>2.0.CO;2, 1959.
Csavina, J., Field, J., Félix, O., Corral-Avitia, A. Y., Sáez, A. E., and Betterton, E. A.: Effect of wind speed and relative humidity on atmospheric dust concentrations in semi-arid climates, Sci. Total Environ., 487, 82–90, https://doi.org/10.1016/j.scitotenv.2014.03.138, 2014.
Ding, R. Q., Nnamchi, H. C., Yu, J. Y., Li, T., Sun, C., Li, J. P., Tseng, Y., Li, X. C., Xie, F., Feng, J., Ji, K., and Li, X. M.: North Atlantic oscillation controls multidecadal changes in the North Tropical Atlantic−Pacific connection, Nat. Commun., 14, 862, https://doi.org/10.1038/s41467-023-36564-3, 2023.
Fan, K., Xie, Z. M., Wang, H. J., Xu, Z. Q., and Liu, J. P.: Frequency of spring dust weather in North China linked to sea ice variability in the Barents Sea, Clim. Dynam., 51, 4439–4450, https://doi.org/10.1007/s00382-016-3515-7, 2018.
Feldstein, S. B.: The dynamics of NAO teleconnection pattern growth and decay, Q. J. Roy. Meteor. Soc., 129, 901–924, https://doi.org/10.1256/qj.02.76, 2003.
Feng, J. and Li, J. P.: Influence of El Niño Modoki on spring rainfall over south China, J. Geophys. Res.-Atmos., 116, D13102, https://doi.org/10.1029/2010JD015160, 2011.
Feng, J., Li, J., Liao, H., and Zhu, J.: Simulated coordinated impacts of the previous autumn North Atlantic Oscillation (NAO) and winter El Niño on winter aerosol concentrations over eastern China, Atmos. Chem. Phys., 19, 10787–10800, https://doi.org/10.5194/acp-19-10787-2019, 2019.
Feng, J., Zhu, J., Li, J., and Liao, H.: Aerosol concentrations variability over China: two distinct leading modes, Atmos. Chem. Phys., 20, 9883–9893, https://doi.org/10.5194/acp-20-9883-2020, 2020.
Feng, J., Wang, S., and Li, J. P.: Strengthened ENSO amplitude contributed to regime shift in the Hadley circulation. Geophys. Res. Lett., 51, e2023GL106006, https://doi.org/10.1029/2023GL106006, 2024.
Gelaro, R., McCarty, W., Suárez, M. J., Todling, R., Molod, A., Takacs, L., Randles, C. A., Darmenov, A., Bosilovich, M. G., Reichle, R., Wargan, K., Coy, L., Cullather, R., Draper, C., Akella, S., Buchard, V., Conaty, A., Da Silva, A. M., Gu, W., Kim, G.-K., Koster, R., Lucchesi, R., Merkova, D., Nielsen, J. E., Partyka, G., Pawson, S., Putman, W., Rienecker, M., Schubert, S. D., Sienkiewicz, M., and Zhao, B.: The Modern-Era Retrospective Analysis for Research and Applications, Version 2 (MERRA-2), J. Climate, 30, 5419–5454, https://doi.org/10.1175/JCLI-D-16-0758.1, 2017.
Global Modeling and Assimilation Office (GMAO): MERRA2 tavgM_2d_aer_Nx: 2d, Monthly mean, Time-averaged, Single-Level, Assimilation, Aerosol Diagnostics V5.12.4, Greenbelt, MD, USA, Goddard Earth Sciences Data and Information Services Center (GES DISC) [data set], https://doi.org/10.5067/FH9A0MLJPC7N, 2015.
Gong, S. L., Zhang, X. Y., Zhao, T. L., Zhang, X. B., Barrie, L. A., McKendry, I. G., and Zhao, C. S.: A Simulated Climatology of Asian Dust Aerosol and Its Trans-Pacific Transport. Part II: Interannual Variability and Climate Connections, J. Climate, 19, 104–122, https://doi.org/10.1175/JCLI3606.1, 2006.
Guo, Y., Li, J. P., and Li, Y.: A Time-Scale Decomposition Approach to Statistically Downscale Summer Rainfall over North China, J. Climate, 25, 572–591, https://doi.org/10.1175/JCLI-D-11-00014.1, 2012.
Hersbach, H., Bell, B., Berrisford, P., Hirahara, S., Horányi, A., Muñoz-Sabater, J., Nicolas, J., Peubey, C., Radu, R., Schepers, D., Simmons, A., Soci, C., Abdalla, S., Abellan, X., Balsamo, G., Bechtold, P., Biavati, G., Bidlot, J., Bonavita, M., De Chiara, G., Dahlgren, P., Dee, D., Diamantakis, M., Dragani, R., Flemming, J., Forbes, R., Fuentes, M., Geer, A., Haimberger, L., Healy, S., Hogan, R. J., Hólm, E., Janisková, M., Keeley, S., Laloyaux, P., Lopez, P., Lupu, C., Radnoti, G., De Rosnay, P., Rozum, I., Vamborg, F., Villaume, S., and Thépaut, J.: The ERA5 global reanalysis, Q. J. Roy. Meteor. Soc., 146, 1999–2049, https://doi.org/10.1002/qj.3803, 2020.
Hersbach, H., Bell, B., Berrisford, P., Biavati, G., Horányi, A., Muñoz Sabater, J., Nicolas, J., Peubey, C., Radu, R., Rozum, I., Schepers, D., Simmons, A., Soci, C., Dee, D., and Thépaut, J.-N.: ERA5 monthly averaged data on pressure levels from 1940 to present, Copernicus Climate Change Service (C3S) Climate Data Store (CDS) [data set], https://doi.org/10.24381/cds.6860a573, 2023.
Huang, J., Li, Y., Fu, C., Chen, F., Fu, Q., Dai, A., Shinoda, M., Ma, Z., Guo, W., Li, Z., Zhang, L., Liu, Y., Yu, H., He, Y., Xie, Y., Guan, X., Ji, M., Lin, L., Wang, S., Yan, H., and Wang, G.: Dryland climate change: Recent progress and challenges, Rev. Geophys., 55, 719–778, https://doi.org/10.1002/2016RG000550, 2017.
Huang, J. P., Liu, J. J., Chen, B., and Nasiri, S. L.: Detection of anthropogenic dust using CALIPSO lidar measurements, Atmos. Chem. Phys., 15, 11653–11665, https://doi.org/10.5194/acp-15-11653-2015, 2015.
Huang, Y. H., Liu, X. D., Yin, Z., and An, Z. S.: Global Impact of ENSO on Dust Activities with Emphasis on the Key Region from the Arabian Peninsula to Central Asia, J. Geophys. Res.-Atmos., 126, e2020JD034068, https://doi.org/10.1029/2020JD034068, 2021.
Hurrell, J. W.: Decadal Trends in the North Atlantic Oscillation: Regional Temperatures and Precipitation, Science, 269, 676–679, https://doi.org/10.1126/science.269.5224.676, 1995.
Ji, L. Q. and Fan, K.: Climate prediction of dust weather frequency over northern China based on sea-ice cover and vegetation variability, Clim. Dynam., 53, 687–705, https://doi.org/10.1007/s00382-018-04608-w, 2019.
Jia, X. J., Derome, J., and Lin, H.: Comparison of the Life Cycles of the NAO Using Different Definitions, J. Climate, 20, 5992–6011, https://doi.org/10.1175/2007JCLI1408.1, 2007.
Jiang, W. P., Huang, G., Huang, P., Wu, R. G., Hu, K. M., and Chen, W.: Northwest Pacific Anticyclonic Anomalies during Post–El Niño Summers Determined by the Pace of El Niño Decay, J. Climate, 32, 3487–3503, https://doi.org/10.1175/JCLI-D-18-0793.1, 2019.
Jiménez-Esteve, B. and Domeisen, D. I. V.: The Tropospheric Pathway of the ENSO–North Atlantic Teleconnection, J. Climate, 31, 4563–4584, https://doi.org/10.1175/JCLI-D-17-0716.1, 2018.
Jones, P. D., Jonsson, T., and Wheeler, D.: Extension to the North AtlanticOscillation using early instrumental pressure observations from Gibraltar and South-West Iceland, Int. J. Climatol., 17, 1433–1450, https://doi.org/10.1002/(SICI)1097-0088(19971115)17:13<1433::AID-JOC203>3.0.CO;2-P, 1997 (data available at: https://crudata.uea.ac.uk/cru/data/nao/, last access: 22 July 2024).
Kang, L. T., Huang, J. P., Chen, S. Y., and Wang, X.: Long-term trends of dust events over Tibetan Plateau during 1961-2010, Atmos. Environ., 125, 188-198, https://doi.org/10.1016/j.atmosenv.2015.10.085, 2016.
Kim, H. and Choi, M.: Impact of soil moisture on dust outbreaks in East Asia: Using satellite and assimilation data, Geophys. Res. Lett., 42, 2789–2796, https://doi.org/10.1002/2015GL063325, 2015.
Kim, S. and Kug, J.: What Controls ENSO Teleconnection to East Asia? Role of Western North Pacific Precipitation in ENSO Teleconnection to East Asia, J. Geophys. Res.-Atmos., 123, 10406–10422, https://doi.org/10.1029/2018JD028935, 2018.
Kok, J. F., Storelvmo, T., Karydis, V. A., Adebiyi, A. A., Mahowald, N. M., Evan, A. T., He, C. L., and Leung, D. M.: Mineral dust aerosol impacts on global climate and climate change, Nat. Rev.-Earth Environ., 4, 71–86, https://doi.org/10.1038/s43017-022-00379-5, 2023.
Li, J. P. and Wang, J. X. L.: A new North Atlantic Oscillation index and its variability, Adv. Atmos. Sci., 20, 661–676, https://doi.org/10.1007/BF02915394, 2003 (data available at: http://dataset.de, last access: 22 July 2024).
Li, J. P., Zheng, F., Sun, C., Feng, J., and Wang, J.: Pathways of Influence of the Northern Hemisphere Mid-high Latitudes on East Asian Climate: A Review, Adv. Atmos. Sci., 36, 902–921, https://doi.org/10.1007/s00376-019-8236-5, 2019.
Li, Y., Xu, F., Feng, J., Du, M., Song, W., Li, C., and Zhao, W.: Influence of the previous North Atlantic Oscillation (NAO) on the spring dust aerosols over North China, Atmos. Chem. Phys., 23, 6021–6042, https://doi.org/10.5194/acp-23-6021-2023, 2023.
Liu, X. D., Yin, Z., Zhang, X. Y., and Yang, X. C.: Analyses of the spring dust storm frequency of northern China in relation to antecedent and concurrent wind, precipitation, vegetation, and soil moisture conditions, J. Geophys. Res.-Atmos., 109, 2004JD004615, https://doi.org/10.1029/2004JD004615, 2004.
López-Parages, J., Rodríguez-Fonseca, B., and Terray, L.: A mechanism for the multidecadal modulation of ENSO teleconnection with Europe, Clim. Dynam., 45, 867–880, https://doi.org/10.1007/s00382-014-2319-x, 2015.
Lou, S. J., Russell, L. M., Yang, Y., Xu, L., Lamjiri, M. A., DeFlorio, M. J., Miller, A. J., Ghan, S. J., Liu, Y., and Singh, B.: Impacts of the East Asian Monsoon on springtime dust concentrations over China, J. Geophys. Res.-Atmos., 121, 8137–8152, https://doi.org/10.1002/2016JD024758, 2016.
Lou, S. J., Russell, L. M., Yang, Y., Liu, Y., Singh, B., and Ghan, S. J.: Impacts of interactive dust and its direct radiative forcing on interannual variations of temperature and precipitation in winter over East Asia, J. Geophys. Res.-Atmos., 122, 8761–8780, https://doi.org/10.1002/2017JD027267, 2017.
McPhaden, M. J. and Zhang, X. B.: Asymmetry in zonal phase propagation of ENSO sea surface temperature anomalies, Geophys. Res. Lett., 36, 2009GL038774, https://doi.org/10.1029/2009GL038774, 2009.
NCAR: NAO Index Data provided by the Climate Analysis Section, NCAR, Boulder, USA, Hurrell, updated regularly, NCAR [data set], https://climatedataguide.ucar.edu/climate-data/hurrell-north-atlantic-oscillation-nao-index-pc-based (last access: 22 July 2024), 2003.
Pan, L. L.: Observed positive feedback between the NAO and the North Atlantic SSTA tripole, Geophys. Res. Lett., 32, 2005GL022427, https://doi.org/10.1029/2005GL022427, 2005.
Prospero, J. M., Nees, R. T., and Uematsu, M.: Deposition rate of particulate and dissolved aluminum derived from saharan dust in precipitation at Miami, Florida, J. Geophys. Res.-Atmos., 92, 14723–14731, https://doi.org/10.1029/JD092iD12p14723, 1987.
Rayner, N. A., Parker, D. E., Horton, E. B., Folland, C. K., Alexander, L. V., Rowell, D. P., Kent, E. C., and Kaplan, A.: Global analyses of sea surface temperature, sea ice, and night marine air temperature since the late nineteenth century, J. Geophys. Res.-Atmos., 108, 2002JD002670, https://doi.org/10.1029/2002JD002670, 2003 (data available at: https://www.metoffice.gov.uk/hadobs/hadisst/, last access: 22 July 2024).
Song, L., Chen, S., Chen, W., Guo, J., Cheng, C., and Wang, Y.: Distinct evolutions of haze pollution from winter to the following spring over the North China Plain: role of the North Atlantic sea surface temperature anomalies, Atmos. Chem. Phys., 22, 1669–1688, https://doi.org/10.5194/acp-22-1669-2022, 2022.
Su, J. Z., Zhang, R. H., Li, T., Rong, X. Y., Kug, J., and Hong, C.: Causes of the El Niño and La Niña Amplitude Asymmetry in the Equatorial Eastern Pacific, J. Climate, 23, 605–617, https://doi.org/10.1175/2009JCLI2894.1, 2010.
Sung, M., Lim, G., and Kug, J.: Phase asymmetric downstream development of the North Atlantic Oscillation and its impact on the East Asian winter monsoon, J. Geophys. Res.-Atmos., 115, 2009JD013153, https://doi.org/10.1029/2009JD013153, 2010.
Takaya, K. and Nakamura, H.: A Formulation of a Phase-Independent Wave-Activity Flux for Stationary and Migratory Quasigeostrophic Eddies on a Zonally Varying Basic Flow, J. Atmos. Sci., 58, 608–627, https://doi.org/10.1175/1520-0469(2001)058<0608:AFOAPI>2.0.CO;2, 2001.
Trenberth, K. E.: The Definition of El Niño, B. Am. Meteorol. Soc., 78, 2771–2777, https://doi.org/10.1175/1520-0477(1997)078<2771:TDOENO>2.0.CO;2, 1997.
Wallace, J. M. and Gutzler, D. S.: Teleconnections in the Geopotential Height Field during the Northern Hemisphere Winter, Mon. Weather Rev., 109, 784–812, https://doi.org/10.1175/1520-0493(1981)109<0784:TITGHF>2.0.CO;2, 1981.
Wang, B., Wu, R. G., and Fu, X. H.: Pacific–East Asian Teleconnection: How Does ENSO Affect East Asian Climate?, J. Climate, 13, 1517–1536, https://doi.org/10.1175/1520-0442(2000)013<1517:PEATHD>2.0.CO;2, 2000.
Wang, T. H., Tang, J. Y., Sun, M. X., Liu, X. W., Huang, Y. X., Huang, J. P., Han, Y., Cheng, Y. F., Huang, Z. W., and Li, J. M.: Identifying a transport mechanism of dust aerosols over South Asia to the Tibetan Plateau: A case study, Sci. Total Environ., 758, 11, https://doi.org/10.1016/j.scitotenv.2020.143714, 2021.
Wang, X., Huang, J. P., Ji, M. X., and Higuchi, K.: Variability of East Asia dust events and their long-term trend, Atmos. Environ., 42, 3156–3165, https://doi.org/10.1016/j.atmosenv.2007.07.046, 2008
Woollings, T., Franzke, C., Hodson, D. L. R., Dong, B., Barnes, E. A., Raible, C. C., and Pinto, J. G.: Contrasting interannual and multidecadal NAO variability, Clim. Dynam., 45, 539–556, https://doi.org/10.1007/s00382-014-2237-y, 2015.
Wu, J., Kurosaki, Y., Shinoda, M., and Kai, K.: Regional Characteristics of Recent Dust Occurrence and Its Controlling Factors in East Asia, Sola, 12, 187–191, https://doi.org/10.2151/sola.2016-038, 2016.
Wu, R. G. and Chen, S. F.: What Leads to Persisting Surface Air Temperature Anomalies from Winter to Following Spring over Mid- to High-Latitude Eurasia? J. Climate, 33, 5861–5883, https://doi.org/10.1175/JCLI-D-19-0819.1, 2020.
Wu, Z. W., Wang, B., Li, J. P., and Jin, F. F.: An empirical seasonal prediction model of the east Asian summer monsoon using ENSO and NAO, J. Geophys. Res.-Atmos., 114, 2009JD011733, https://doi.org/10.1029/2009JD011733, 2009.
Wu, Z. W., Li, J. P., Jiang, Z. H., He, J. H., and Zhu, X. Y.: Possible effects of the North Atlantic Oscillation on the strengthening relationship between the East Asian Summer monsoon and ENSO, Int. J. Climatol., 32, 794–800, https://doi.org/10.1002/joc.2309, 2012.
Yang, Y., Zeng, L., Wang, H., Wang, P., and Liao, H.: Dust pollution in China affected by different spatial and temporal types of El Niño, Atmos. Chem. Phys., 22, 14489–14502, https://doi.org/10.5194/acp-22-14489-2022, 2022.
Yu, Y., Notaro, M., Liu, Z. Y., Wang, F. Y., Alkolibi, F., Fadda, E., and Bakhrjy, F.: Climatic controls on the interannual to decadal variability in Saudi Arabian dust activity: Toward the development of a seasonal dust prediction model, J. Geophys. Res.-Atmos., 120, 1739–1758, https://doi.org/10.1002/2014JD022611, 2015.
Zhang, R. H., Li, T. R., Wen, M., and Liu, L. K.: Role of intraseasonal oscillation in asymmetric impacts of El Niño and La Niña on the rainfall over southern China in boreal winter, Clim. Dynam., 45, 559–567, https://doi.org/10.1007/s00382-014-2207-4, 2015.
Zhang, W. J., Li, J. P., and Jin, F. F.: Spatial and temporal features of ENSO meridional scales, Geophys. Res. Lett., 36, 2009GL038672, https://doi.org/10.1029/2009GL038672, 2009.
Zhang, X. Y., Gong, S. L., Zhao, T. L., Arimoto, R., Wang, Y. Q., and Zhou, Z. J.: Sources of Asian dust and role of climate change versus desertification in Asian dust emission, Geophys. Res. Lett., 30, 2003GL018206, https://doi.org/10.1029/2003GL018206, 2003.
Zhao, C. F., Yang, Y. K., Fan, H., Huang, J. P., Fu, Y. F., Zhang, X. Y., Kang, S. C., Cong, Z. Y., Letu, H., and Menenti, M.: Aerosol characteristics and impacts on weather and climate over the Tibetan Plateau, Natl. Sci. Rev., 7, 492–495, https://doi.org/10.1093/nsr/nwz184, 2020.
Zhao, Y., Huang, A. N., Zhu, X. S., Zhou, Y., and Huang, Y.: The impact of the winter North Atlantic Oscillation on the frequency of spring dust storms over Tarim Basin in northwest China in the past half-century, Environ. Res. Lett., 8, 024026, https://doi.org/10.1088/1748-9326/8/2/024026, 2013.
Zheng, F., Li, J. P., Li, Y. J., Zhao, S., and Deng, D. F.: Influence of the Summer NAO on the Spring-NAO-Based Predictability of the East Asian Summer Monsoon, J. Appl. Meteorol. Clim., 55, 1459–1476, https://doi.org/10.1175/JAMC-D-15-0199.1, 2016a.
Zheng, Y., Zhao, T. L., Che, H. Z., Liu, Y., Han, Y. X., Liu, C., Xiong, J., Liu, J. H., and Zhou, Y. K.: A 20-year simulated climatology of global dust aerosol deposition, Sci. Total Environ., 557–558, 861–868, https://doi.org/10.1016/j.scitotenv.2016.03.086, 2016b.
Zhou, F., Shi, J., Liu, M. H., and Ren, H. C.: Linkage between the NAO and Siberian high events on the intraseasonal timescale, Atmos. Res., 281, 106478, https://doi.org/10.1016/j.atmosres.2022.106478, 2023.
Zhu, C. W., Wang, B., and Qian, W. H.: Why do dust storms decrease in northern China concurrently with the recent global warming?, Geophys. Res. Lett., 35, 2008GL034886, https://doi.org/10.1029/2008GL034886, 2008.