the Creative Commons Attribution 4.0 License.
the Creative Commons Attribution 4.0 License.
 | 23 Sep 2024
Modelling of atmospheric concentrations of fungal spores: a 2-year simulation over France using CHIMERE
Matthieu Vida
Gilles Foret
Guillaume Siour
Florian Couvidat
Olivier Favez
Arineh Cholakian
Sébastien Conil
Matthias Beekmann
Jean-Luc Jaffrezo
Fungal spore organic aerosol emissions have been recognised as a significant source of particulate matter as PM10; however, they are not widely considered in current air quality models. In this work, we have implemented the parameterisation of fungal spore organic aerosol (OA) emissions introduced by Heald and Spracklen (2009) (H&S) and further modified by Hoose et al. (2010) in the CHIMERE regional chemistry-transport model. This simple parameterisation is based on two variables, leaf area index (LAI) and specific humidity. We have validated the geographical and temporal representativeness of this parameterisation on a large scale by using yearly polyol observations and primary biogenic organic aerosol factors from positive matrix factorisation (PMF) analysis at 11 French measurement sites. For a group of sites in northern and eastern France, the seasonal variation of fungal spore emissions, displaying large summer and small winter values, is correctly depicted. However, the H&S parameterisation fails to capture fungal spore concentrations for a smaller group of Mediterranean sites with less data availability in terms of both absolute values and seasonal variability, leading to strong negative biases, especially during the autumn and winter seasons. Two years of CHIMERE simulations with the H&S parameterisation have shown a significant contribution of fungal spore OA to PM10 mass, which is lower than 10 % during winter and reaches up to 20 % during summer in high-emission zones, especially over large forested areas. In terms of contributions to organic matter (OM) concentrations, the simulated fungal spore contribution in autumn is as high as 40 % and reaches at most 30 % of the OM for the other seasons. As a conclusion, the fungal spore OA contribution to the total OM concentrations is shown to be substantial enough to be considered a major PM10 fraction and should then be included in state-of-the-art chemistry-transport models.
- Article
(4822 KB) - Full-text XML
-
Supplement
(1375 KB) - BibTeX
- EndNote


Modelling of the organic matter (OM) fraction of PM10 with chemistry-transport models can be complex due to the varied composition of organic matter (which is not yet fully known), incomplete emission inventories or their inherent uncertainties, and poorly parameterised atmospheric chemical transformations.
It is therefore important to assess whether the primary source of organic aerosol, currently not considered in many models, can help to improve atmospheric aerosol modelling. Primary biogenic organic aerosols (PBOAs) are mainly composed of microorganisms such as bacteria, fungi, fungal or bacterial spores, pollens or viruses, and biological fragments such as plant debris or microbes (Després et al., 2012; Fröhlich-Nowoisky et al., 2016; Jaenicke et al., 2007). Their sizes vary from less than 0.3 µm for viruses to about 100 µm for pollens (Després et al., 2012; Jones and Harrison, 2004; Shaffer and Lighthart, 1997). When looking at atmospheric particles with an aerodynamic diameter of less than 2.5 or 10 µm (which are the fractions routinely measured and studied for health risk assessment), it is possible to find viruses, bacteria (agglomerated or not), and spores. However, spores, when produced by fungi, represent the major fraction in terms of mass (Elbert et al., 2007).
More specifically, fungal spores are emitted directly into the atmosphere during the fungal reproduction process when temperature and humidity conditions are favourable, but their emission can also be triggered by wind and rain (Elbert et al., 2007; Huffman et al., 2013; Jones and Harrison, 2004). Previous studies estimated that fungal spores can contribute around 5 % and 10 % of the mass of PM10 and organic carbon in urban and suburban areas (Bauer et al., 2002, 2008b). In specific environments such as tropical forests, the contribution of fungal spores can represent 45 % of the PM10 mass (Elbert et al., 2007).
Fungal spores are known to cause major health problems such as asthma, pulmonary obstruction, tuberculosis, meningitis, and legionellosis (Douwes et al., 2003; Eduard et al., 2012; Fröhlich-Nowoisky et al., 2016; Ghosh et al., 2015; Pearson et al., 2015; Samaké et al., 2017). Some studies on PBOAs have shown that aerosols emitted directly by fungi in the form of spores contribute significantly to the oxidative potential of aerosols (Samaké et al., 2017). Moreover, based on a positive matrix factorisation (PMF) analysis, Weber et al. (2021) derived a primary biogenic factor based on a large dataset of speciated PM10 aerosol measurements over France, including polyol measurements as a tracer for fungal spores. They found a high intrinsic oxidative potential of dithiothreitol (DTT) for this factor that was equal to that of biomass burning but lower than that of primary traffic emissions.
A literature review shows several parameterisations suitable for modelling primary biogenic aerosol emissions from fungal spores in the PM10 size range in chemistry-transport models. Samaké et al. (2019a) identified the parameters responsible for up to 82 % of the annual variability of polyols as a tracer of fungal spores for a temperate-latitude site in an Alpine environment, using multi-linear approaches. These variations were mainly explained by the mean nighttime temperature (54 %) and leaf area index (LAI) (37 %) and, to a lesser extent, the atmospheric humidity (3 %) and wind speed (2 %). The combined factor of LAI and wind speed explains the remaining variability (4 %). The first parameterisation for the treatment of fungal spores in atmospheric models was proposed by Heald and Spracklen (2009) (H&S) and modified by Hoose et al. (2010). It estimates fungal spore emissions as a linear function of LAI and specific humidity. In this formulation, LAI is a proxy for the vegetation density and specific humidity is a proxy for the water availability, but this is also related to temperature. The parameterisation proposed by Sesartic and Dallafior (2011) (S&D) suggests a different approach by varying emissions as a function of soil types, not relying on LAI, and therefore removing the seasonality inherently present in the H&S parameterisation. Hummel et al. (2015) compared these parameterisations across Europe and developed a new statistical model, based on the H&S parameterisation using LAI and specific humidity, to also include a linear dependence on temperature and a threshold below which emissions are assumed to be zero.
In Hummel et al. (2015), the concentrations simulated with the three parameterisations of H&S, S&D, and Hummel were compared to measurements of fluorescent biological aerosol particles (FBAPs) at four sites in several parts of Europe (Germany, Finland, the UK, and Ireland) for almost weekly time periods in July, August, and October of 2010. This comparison was carried out using 1536 hourly data points, most of which came from the German (600) and Finnish (600) stations. At these two sites, 1 week in July, 1 week in August, and 10 d in September were measured, unlike the UK and Irish sites, where the data were only taken for August 2010. FBAP measurements were taken as a proxy for fungal spore emissions. By construction, the S&D parameterisation does not reproduce the observed daily and seasonal variability, while it is known that fungal spore emissions show a general summer maximum across Europe (Samaké et al., 2019a, b). By contrast, the H&S and Hummel parameterisations include these temporal variations and therefore show better correlations with measured concentrations (R = 0.43) compared to the S&D approach (R = −0.05). The parameterisation by Hummel et al. (2015) showed a lower normalised mean bias (NMB = −43 %) compared to the H&S one (NMB = −44 %).
As fungal spores make a significant contribution to PM10 and are rarely included in chemistry-transport models (CTMs), the aim of our study is to integrate them into the state-of-the-art chemistry-transport model CHIMERE (Menut et al., 2021) to evaluate the model performance with field measurements and to infer the spatio-temporal variability of their occurrence. This could lead to improved modelling of PM10 concentrations, organic matter, and other pollutants such as secondary biogenic compounds or even oxidative potential. This study will focus on France, which has one of the largest databases of chemically speciated PM measurements in Europe (Favez et al., 2021). Interestingly, France has a wide range of climatic variability (oceanic, semi-oceanic, continental, mountainous, and Mediterranean), making it possible to compare fungal spore modelling results under various climatic conditions. To assess the modelling of fungal spores, measurements of polyols were used, specifically mannitol and arabitol, since many studies indicate that they are specific tracers of this PBOA fraction (Bauer et al., 2008a; Gosselin et al., 2016; Samaké et al., 2019a). Furthermore, we compared our CTM results to the concentrations of organic matter ascribed to this primary biogenic source using the receptor model's PMF in previous work.
2.1 Observations
2.1.1 PM10 and organic matter measurements
The PM10 mass concentration data have been obtained from continuous measurements performed by a French regional air quality monitoring network (AQMN). These observations were made by AQMN using two types of automated analysers during this period: a tapered element oscillating microbalance equipped with a filter dynamic measurement system (TEOM-FDMS, Thermo Scientific) and beta radiation absorption analysers (Met One BAM 1020 and ENVEA MP101M). These measurements were taken in accordance with standard procedures described in CSN EN 16450. As described by Favez et al. (2021), the aim of the aerosol characterisation programme (CARA) is to develop knowledge of the chemical composition and contribution of atmospheric particle sources. This work is enriched by research programmes, with data from some of them being used in this study. In CARA and other programmes, the chemical analysis of (PM10) filter samples has been performed following relevant European standard methods. Briefly, for the datasets used here, organic carbon was measured by thermo-optical analysis using the EUSAAR2 protocol (Cavalli et al., 2010). Sugars were measured by liquid chromatography using pulsed amperometric detection (Verlhac et al., 2013; Yttri et al., 2015). The measurement protocols have been detailed in previous studies (Samaké et al., 2017, 2019a, b; Weber et al., 2021). The analysed species include mannitol and arabitol, which currently make up a large fraction of organic sugars (Elbert et al., 2007) and are used as a tracer for fungal spore emissions.
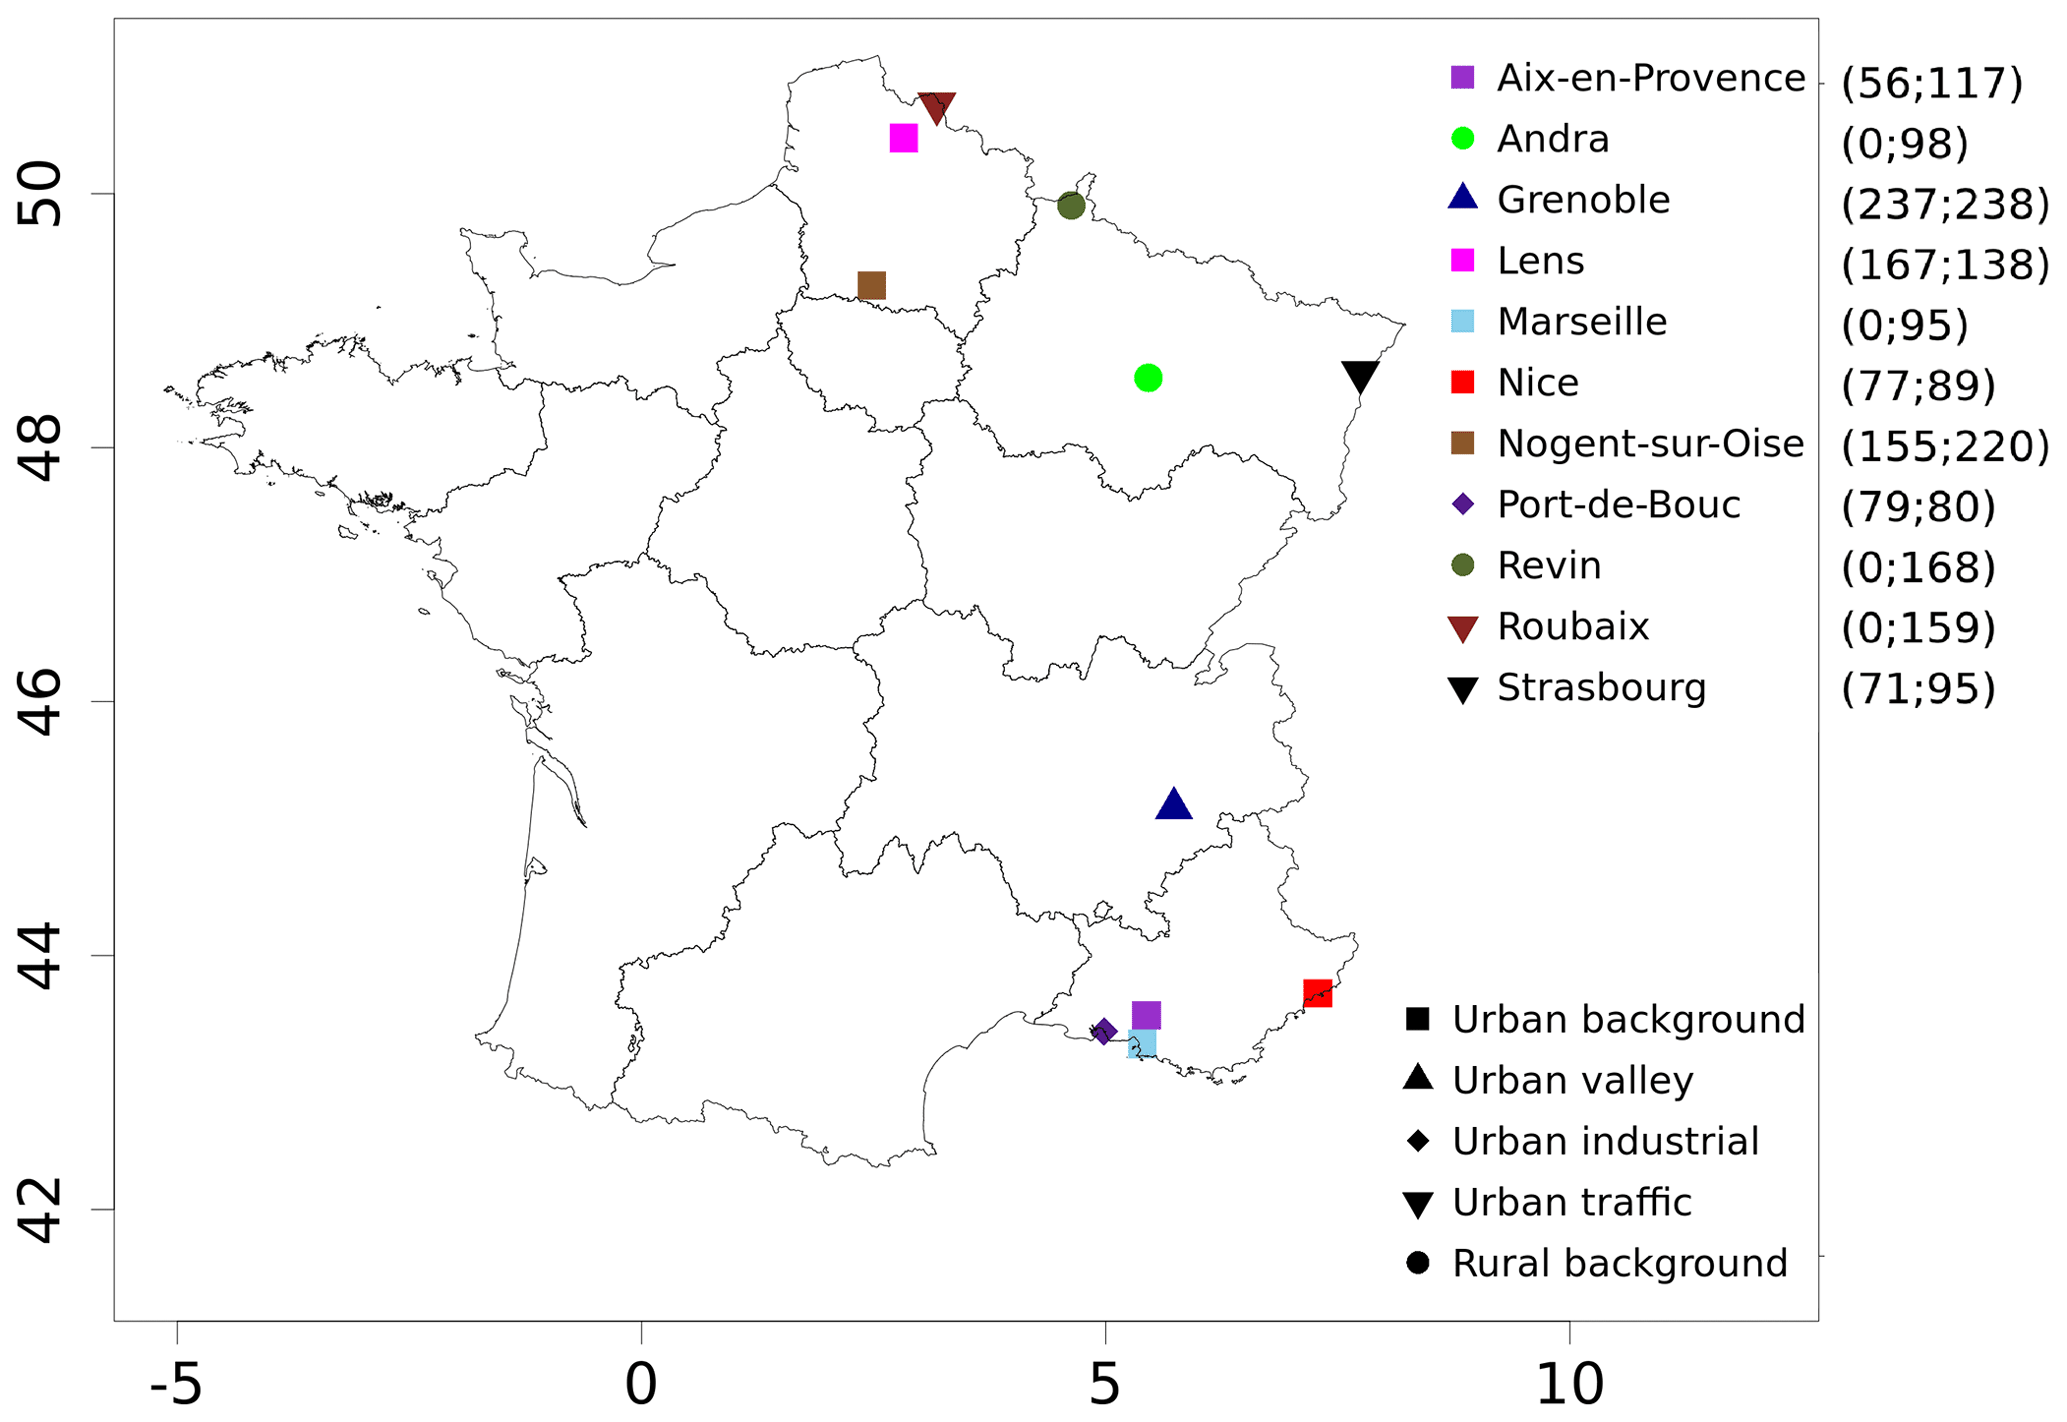
Figure 1Locations and types of sites for PM10 polyol measurements from filters as well as organic matter from the primary biogenic PMF factor (OMpb) over the years 2013 and 2014. The daily data uses at each site are given in brackets, starting with the number of data for OMpb and then for polyols.
Table 1Summary of the number of daily filters analysed for polyols and OM from primary biogenic factors derived from PMF analysis (OMpb) available for this study over the years 2013 and 2014 at different French sites (within the PM10 fraction). The measurement period and geographical coordinates (latitude, longitude, and altitude) are also indicated. “/”: no data.
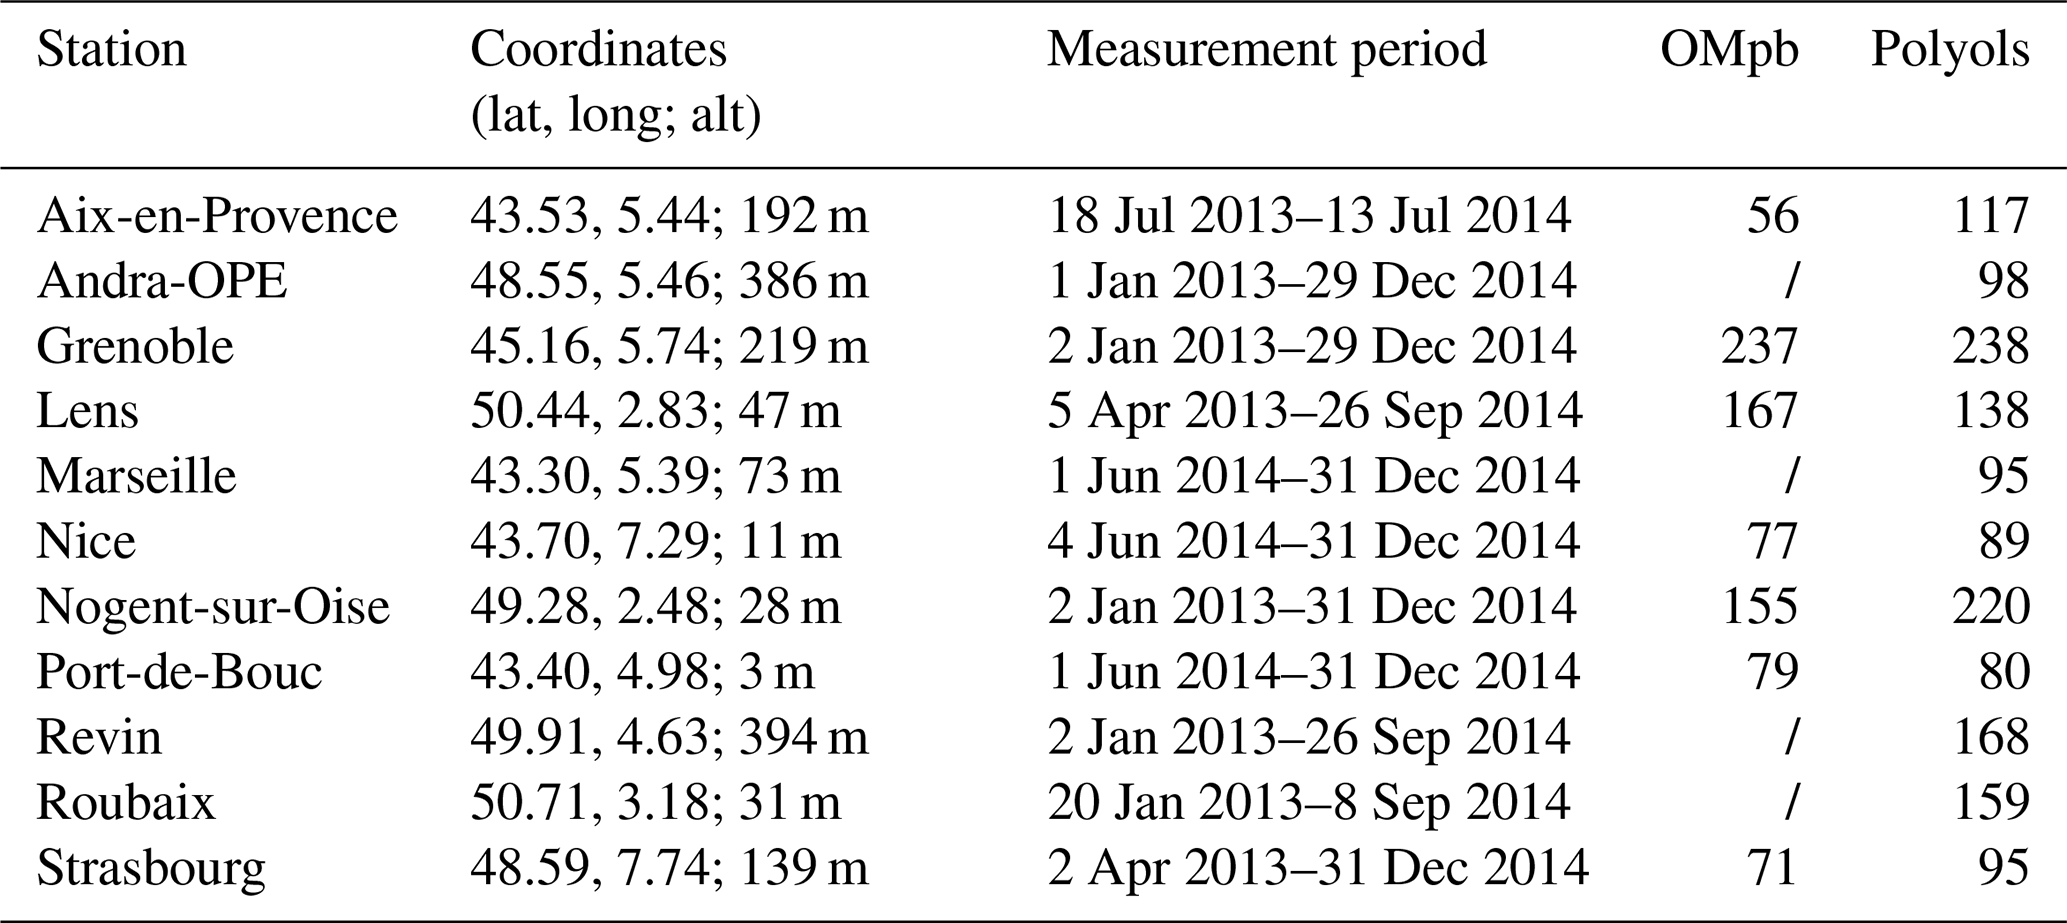
In summary, for the datasets used in the present study, PM10 organic matter observations were made at 13 different stations for a total of 2227 daily filter samples, including 1497 data on polyols at 11 sites. The locations of these sites are illustrated in Fig. 1, while Table 1 provides details on the number of data points available per station and their temporality.
2.1.2 Organic carbon apportionment based on filter samples
PMF is one of the most widely used techniques for identifying factors contributing to aerosol concentrations using online and offline measurement data (Belis et al., 2020; Hopke et al., 2020; Karagulian et al., 2015; Paatero and Tapper, 1994). This receptor model commonly uses offline chemical speciation measured on filters and factor-specific tracers as input data. The correlation matrices allow the identification of the species co-emitted with the tracers and thus determine the contribution of the factors to the PM10 concentrations. For this study, PMF analysis was previously performed with a harmonised methodology (Weber et al., 2021), providing source apportionment results for a total number of 842 daily data at seven French sites from early 2013 to the end of 2014. PMF results at all the sites include a factor which can be attributed to PBOA because of the high concentrations of the two polyols in this factor, representing more than 90 % of the total polyol mass in this factor (Samaké et al., 2019a). The organic carbon of the primary biogenic PMF was multiplied by a factor of 1.8 to obtain the OM concentrations of this PMF factor (OMpb) (Favez et al., 2010; Petit et al., 2015). However, this PBOA factor may also contain biogenic secondary organic aerosol (BSOA) since it is sometimes associated with BSOA tracers, such as 3-MBTCA (resulting from α-pinene oxidation) or 2-MTs (resulting from oxidation of isoprene) (Borlaza et al., 2021). Therefore, here we propose using the PBOA factor as an upper boundary for fungal spore concentrations (see Sect. 3.2).
The sites are distributed over different geographical areas (Fig. 1) in the north-east and south-east of France, including cities from the Channel region (Lens, Roubaix, and Nogent-sur-Oise) to the German border (Strasbourg), remote rural sites located in between (Revin and Andra-OPE), sites such as an Alpine urban station (Grenoble), and sites near the Mediterranean Sea (Aix-en-Provence, Marseille, Nice, and Port-de-Bouc). These sites are classified as rural background (Andra-OPE and Revin), urban background (Aix-en-Provence, Grenoble, Lens, Marseille, Nogent-sur-Oise, Nice, Petit Quevilly, and Talence), traffic (Roubaix and Strasbourg), and urban industrial (Port-de-Bouc). It is thought that the varied characteristics of the observational sites can give us an unprecedented possibility of evaluation of the simulated spore emissions and concentrations.
2.2 Regional modelling
2.2.1 The chemistry-transport model CHIMERE
CHIMERE is an Eulerian state-of-the-art regional chemistry-transport model (Menut et al., 2021). It is used operationally by the French platform PREV'AIR (Rouil et al., 2009) and the Copernicus Atmospheric Modelling System (CAMS) (Marécal et al., 2015) to forecast and monitor air quality. Version v2020r3 of CHIMERE has been used in this work (Menut et al., 2021).
The EMEP anthropogenic emission inventory with a resolution of 10 km2 provides input data for anthropogenic emissions based on the methodology described in Vestreng (2003). Biogenic volatile organic compound (VOC) emissions are computed by CHIMERE based on the Model of Emissions and Gases and Aerosols from Nature (MEGAN 2.1) algorithm (Guenther et al., 2012). The gas-phase chemistry is provided by the MELCHIOR2 mechanism (Derognat et al., 2003). The ISORROPIA II thermodynamic model is used to compute the formation of inorganic aerosols based on the approach described in Fountoukis and Nenes (2007). For organic aerosol formation and the volatilisation of primary organic aerosol, the volatility basis set (VBS) for the organic species as described in Cholakian et al. (2018) was activated.
The chemical boundary conditions with a 3 h temporal resolution are from the CAMS project (Marécal et al., 2015), together with the chemical fields for the model's upper boundary at the 500 hPa level. The WRF 3.7.1 model (Skamarock et al., 2008) is used for meteorological simulation coupled to CHIMERE with no aerosol effect. The spectral nudging (Von Storch et al., 2000) is used with NCEP temperature, wind, humidity, and pressure for wavelengths longer than 2000 km, whereas in the boundary layer the WRF 3.7.1 model freely generates its own dynamics. For the emissions of biogenic VOCs as well as for the parameterisation of the emissions of primary organic aerosols, we use the LAI obtained from the observations of the MODIS instrument with a frequency of 8 h and a native resolution of 30 s for each year (Sindelarova et al., 2014). The simulation was carried out during the years 2013 and 2014 in the western European domain, with a 9 km × 9 km horizontal resolution without nesting. It is run on nine vertical hybrid levels from the ground to an upper height of 500 hPa, the height of the first layer being around 20 m.
2.2.2 Parameterisation of fungal spore OA emissions
In the Introduction section, we presented several parameterisations of fungal spores. Of the three of them (H&S, S&D, and Hummel) compared by Hummel et al. (2015) to observations, the S&D parameterisation showed the worst statistical agreement and is also based on seasonally fixed land use parameters. It was therefore discarded. Of the two better-performing parameterisations, we preferred the H&S parameterisation. This is because our tests over the summer of 2014 with the Hummel approach show that the inclusion of temperature-dependent and vegetation-independent terms leads to significant fungal spore emissions under high-temperature conditions, even at places where LAI is small and therefore no large emissions are expected (sea and oceans, arid and desert soils). Finally, two recent parameterisations by Janssen et al. (2021) were developed over the eastern United States using measurements of spore concentrations to consider LAI, specific humidity, and wind friction velocity in the first case and a spore population model in the second. Comparisons with annual measurements of fluorescent primary organic aerosols at German, Finnish, and Coloradan sites show similar correlations between these two parameterisations and the parameterisation of H&S (Janssen et al., 2021). With respect to these simulations, we preferred the simpler H&S parameterisation. This parameterisation was integrated in our simulations for its robustness at different sites, and it has been set up specifically for temperate-latitude European conditions.
Equation (1) shows the fungal spore emission flux FH & S (number of spores per square metre per second) varying as a function of LAI and specific humidity qv. The constant c, equal to 2315 and introduced by Hoose et al. (2010), accounts for fungal spore emission fluxes with an aerodynamic diameter of 3 µm instead of 5 µm (which was initially estimated).
Fungal spore number concentrations are transformed into mass using an aerosol relative density of 1 kg kg−1, which is used as the reference relative density for the definition of aerodynamic diameter. All mass is attributed to organic matter. Within CHIMERE, fungal spore OAs are prescribed as a new species considered to be chemically inert in our simulation, but they can influence the condensation of semi-volatile secondary organic compounds (as part of the organic aerosol phase) and act as cloud condensation nuclei (Patade et al., 2021). However, no conclusive laboratory data are available to include such processes in a model. Other processes considered in the model apart from emissions are transport and size-resolved dry and wet deposition with characteristics like those of primary anthropogenic aerosols. Fungal spores are treated as non-soluble particles and are considered mono-dispersed with a diameter of 3 µm in a model size class closest to 3 µm. In the model configuration with 10 size bins, spores are included in the size bin of 8 corresponding to sizes between 2.5 and 5 µm, with an average diameter of 3.5 µm.
Here we will present the results of the 2-year-long simulations containing fungal spores' organic aerosol. Our initial analysis delves into the variability of simulated emissions and concentration patterns, along with their impact on the simulated PM10 levels. We will then present an assessment of the simulated concentration fields with respect to polyol observations and primary biogenic organic burden as determined by the source apportionment studies.
3.1 Two years of simulated fungal spore primary organic aerosol
Figure 2 presents the average seasonal variation in emissions and concentrations of fungal spore primary organic aerosol for the years 2013 and 2014, together with that of LAI and specific humidity, obtained from our simulations. As parameterised, emissions are largely driven by vegetation density (represented here by LAI) with emission structures that follow the distribution of the main French forest areas. Major forested areas and emission hotspots are seen over the Massif Central (centred at 45.5° N, 2° E), the Jura (47° N, 6° E), the lower parts of the Alps (46° N, 7° E) and the Pyrenees (43° N, 0° E), and the Landes forest (45° N, 1° W). Specific humidity, which is the other parameter used explicitly in the flux calculation (Eq. 1), is more homogeneous and its signature on the fluxes of spore emissions less easily identifiable. LAI and specific humidity show the same seasonal cycles, with higher values in summer and lower values in winter, when the vegetation density and water content of the colder atmosphere are lowest. We can therefore hypothesise that LAI and specific humidity are responsible for much greater fungal spore emissions in summer than in winter.
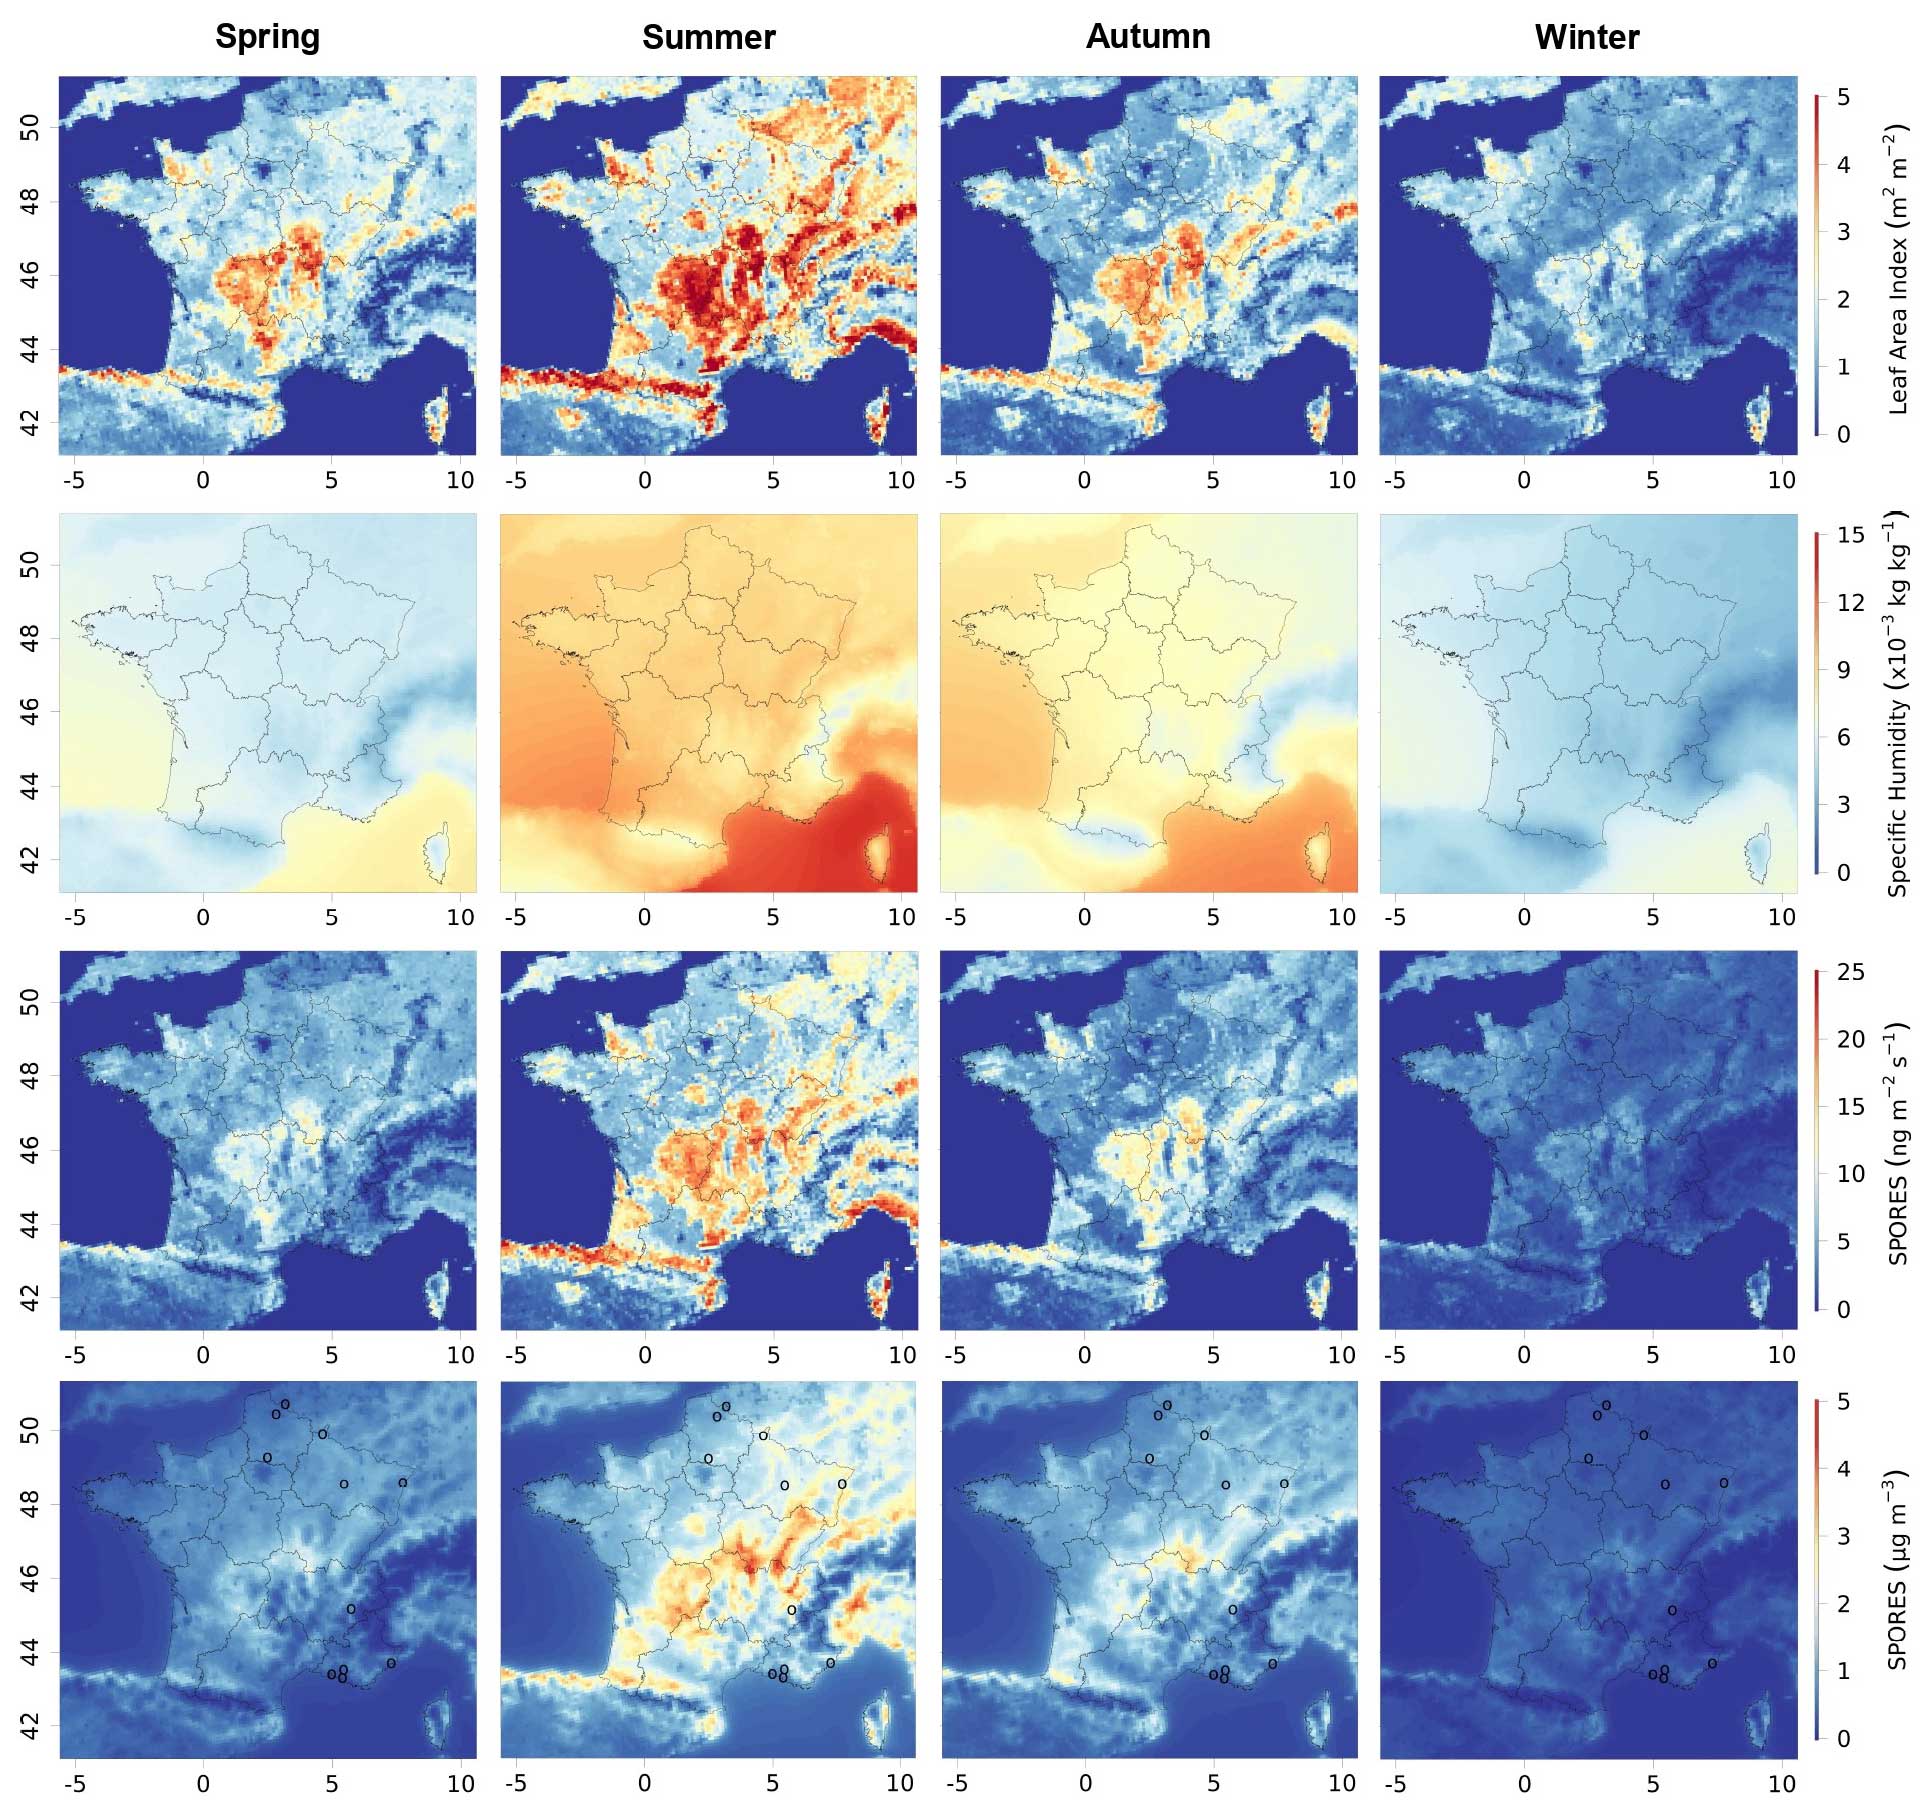
Figure 2Seasonal mean leaf area index (LAI), specific humidity, emissions, and concentrations of fungal spores modelled with CHIMERE for 2013 and 2014 in France, from top to bottom. Their seasonal variations for spring (March to May), summer (June to August), autumn (September to November), and winter (December to February) are illustrated from left to right. The circles represent the locations of the measurement sites. The same maps are shown in the Supplement (Fig. S1).
Concentrations of atmospheric spores are found to be highly correlated with emissions, both spatially and on a seasonal scale. Small differences can be explained by transport and deposition processes. For instance, due to advection, contrasts in concentrations are less pronounced than those in emissions. Hummel et al. (2015) assumed that the lifetime of fungal spores is about 5 h in the atmospheric boundary layer. This short lifetime means that there is a small chance of long-distance transport, which explains the closeness of local concentrations to emission sources. Moreover, in our simulations, the total deposition flux of fungal spores is fairly rapid and can reach a maximum of 10 on average over the 2 years, with 8 for dry deposition and 5 for wet deposition. In summer, this total spore deposition reaches maxima of 20 in France and around 12 in the Massif Central, while spore emissions peak in this area at 25 on average over the summer period. The difference in emissions and deposition is therefore significant, also confirming partial transport out of the source regions. Since only the transport and deposition of fungal spores are taken into account, without interactions with other species, the conditions are similar to those of Hummel et al. (2015), who estimated a lifetime of the same order of magnitude (5 h), further confirming the low transport of spores.
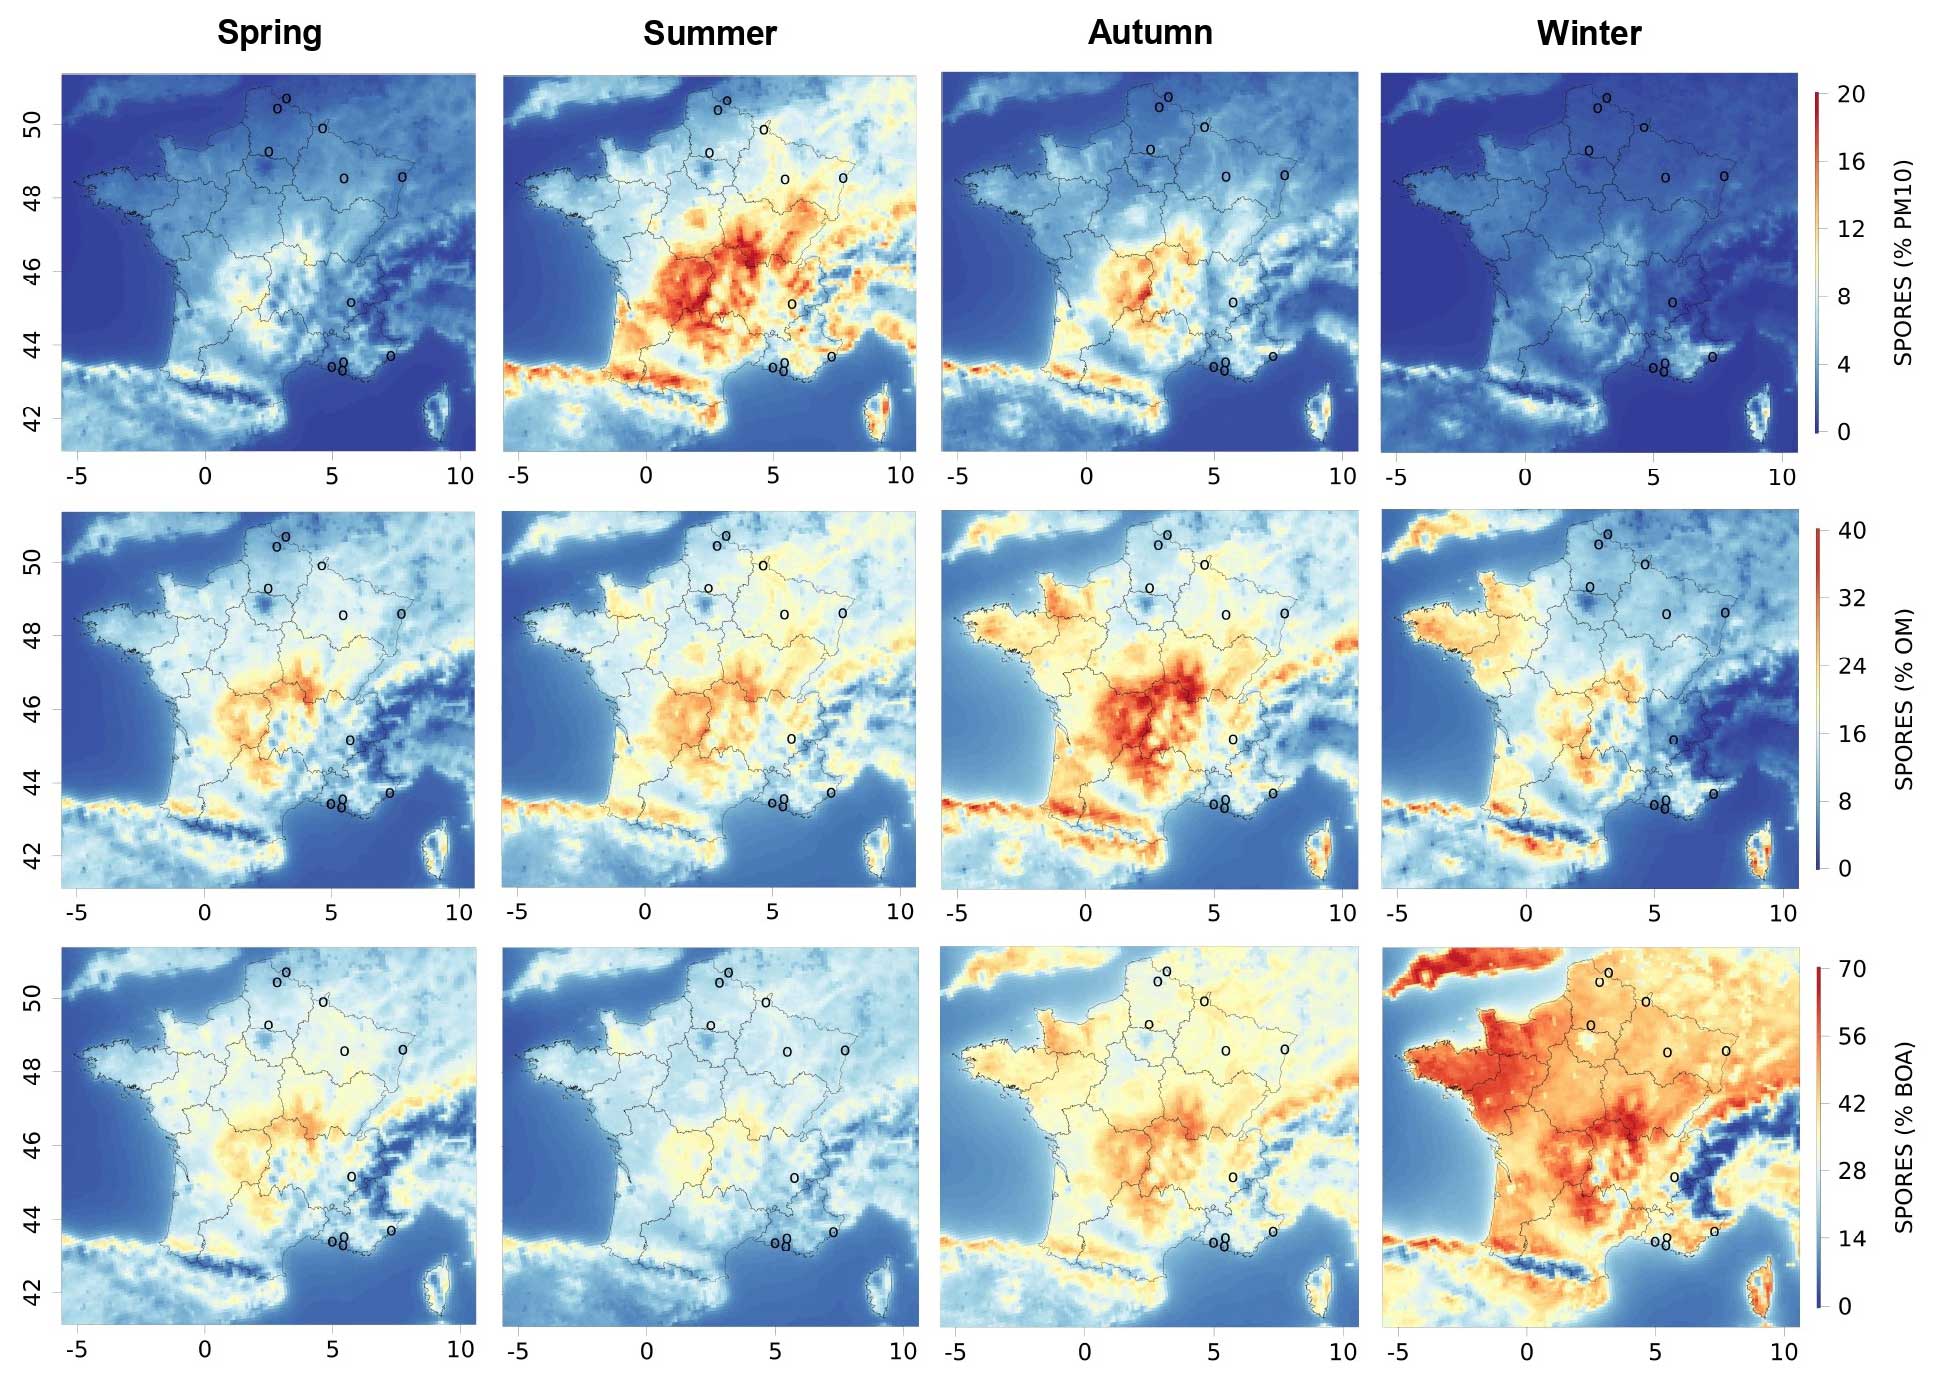
Figure 3Seasonal contributions of fungal spore organic aerosols to PM10, OM, and biogenic organic aerosols (BOAs) modelled with CHIMERE for 2013 and 2014 in France, from top to bottom. The seasonal variations for spring (March to May), summer (June to August), autumn (September to November), and winter (December to February) are illustrated from left to right. The circles represent the locations of the measurement sites. The same maps are shown in the Supplement (Fig. S2).
Despite these conditions of transport and deposition, spore concentrations at locations up to a few hundred kilometres away can be similar in mass and temporal variation, which is explained by similar meteorological conditions and leaf area indexes leading to simultaneous emissions (Samaké et al., 2019b). Seasonal averages of fungal spore concentrations can reach values of several micrograms per cubic metre over large geographical areas, especially over the forested areas in southern France (Massif Central). This is significant in view of the PM10 concentration there and is consistent with previous studies (Heald and Spracklen, 2009). For instance, fungal spore OA contributes about 20 % of the PM10 mass in summer averaged over the Massif Central (Fig. 3). By contrast, during winter, fungal spore concentrations always remain below 0.5 µg m−3 and do not contribute much to PM10, with a value always below a few percent. Spring and autumn are intermediate in terms of both fungal spore OA concentrations and contributions to PM10. With the lower formation of BSOA compared to summer, the contribution of fungal spores to OM is largest in autumn, when it can reach around 40 %. It can reach about 30 % in the other seasons, with some geographical disparities. Despite low emissions and concentrations, the contributions of spores to concentrations of biogenic organic aerosol (BOA) are greatest in winter, reaching up to 70 %, which is due to the very low contribution of secondary biogenic organic aerosols during this period, in contrast to the summer period.
3.2 Comparison of fungal spore simulations to observations
3.2.1 General comparison for the entire dataset
In order to compare simulations with observations, we can rely on two types of datasets available for several sites (as described in Sects. 2.1.1 and 2.1.2): first the polyol concentrations and second the total OMpb derived from PMF analysis of PM10 filter samples. For these comparisons to be meaningful, we need to convert the simulated fungal spore organic aerosol concentrations into polyol ones. Bauer et al. (2008b) derived a conversion factor for this purpose for the temperate-latitude continental urban site of Vienna. For the sum of arabitol and mannitol, which are the two sugar alcohol species measured in our database, these authors found an average mass of 2.9 (2–4.2) pg per fungal spore. Elbert et al. (2007) assumed an average mass of a fungal spore of 65 pg. Combining these values yields a percentage of polyols per mass of a fungal spore of 4.5 % (3.1 %–6.5 %), which will be used for the comparisons that follow. This is consistent with the work of Heald and Spracklen (2009), who used this same combination of values in order to derive their initial estimation of the mass of fungal spore emissions from multi-site polyol measurements.
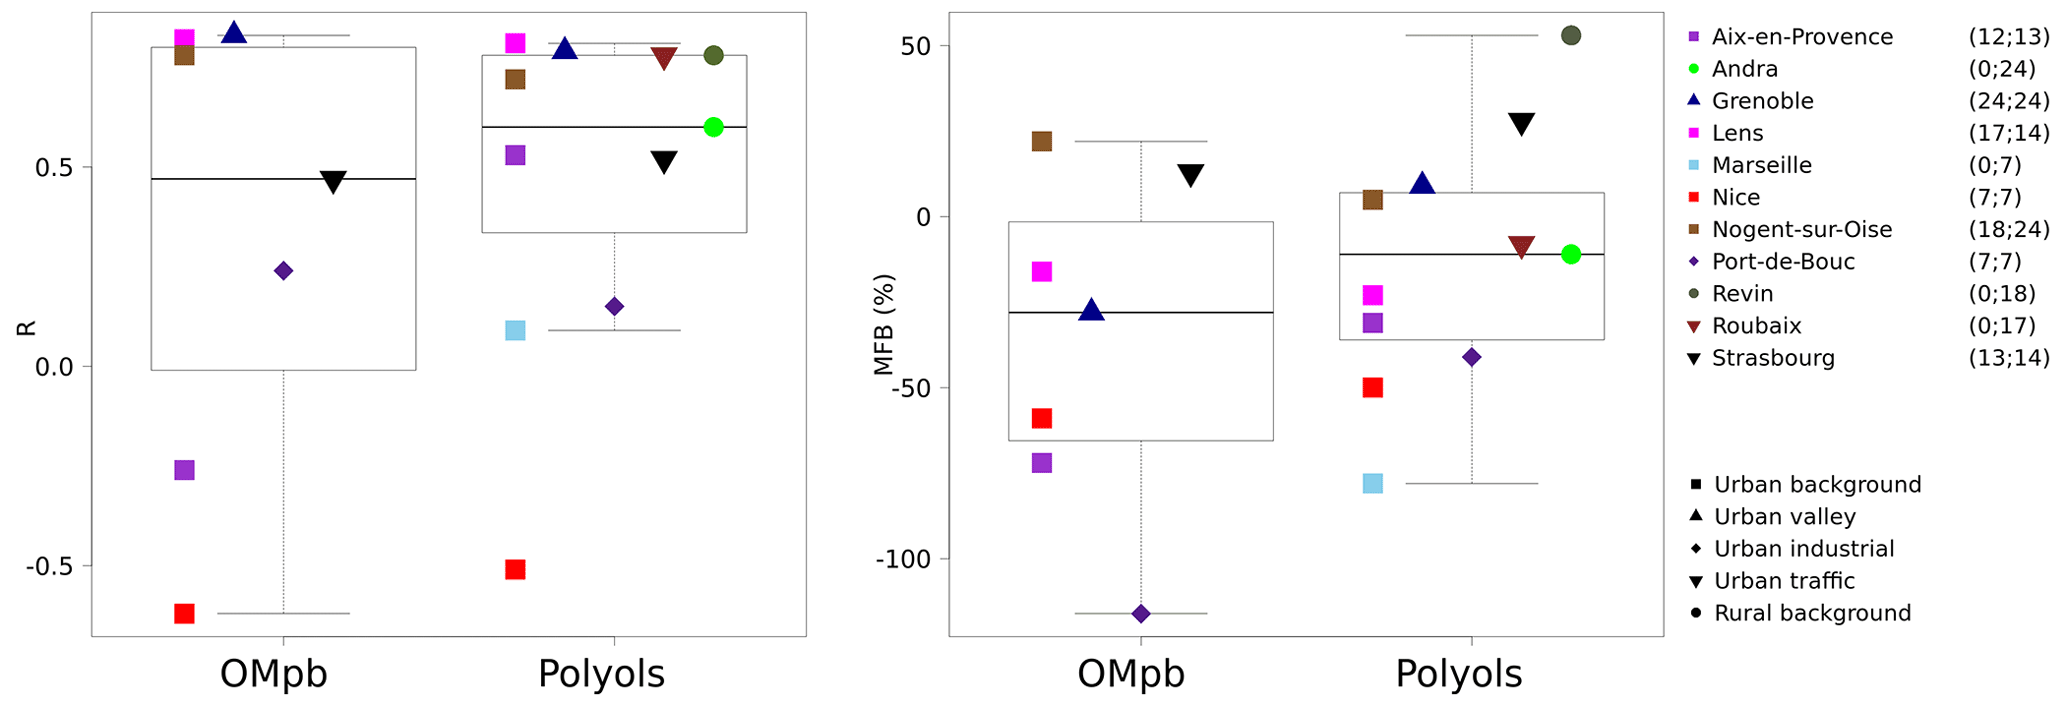
Figure 4Comparisons of simulated monthly mean concentrations of fungal spore OA to OM from PMF OMpb and polyol measurements (sum of mannitol and arabitol). Correlations and mean fractional bias (MFB) boxplots are obtained using the scores for each site (one point per site) and are illustrated on the left- and right-hand sides. The points corresponding to the sites represent the scores obtained for all the data for the site. The ranges between minimal and maximal values and medians are for 7 and 11 sites, respectively. The number of monthly data for OMpb and polyols are noted next to the station list out of totals of 98 and 169 monthly data, respectively. The same figure with daily data is shown in the Supplement (Fig. S3).
We can first obtain a general picture of the performances of the model by studying the correlations and biases of all of the sites with polyol measurements. For the 169 polyol monthly averages from 11 sites, the median mean fractional bias (MFB) is slightly negative (−11 %) but with a large range of values for individual sites from −78 % to +53 % (Fig. 4, Table S1 in the Supplement)1. Using the lower and upper boundaries for the conversion factor between the mass of spores and the mass of polyols (3.1 and 6.5, respectively), the corresponding median MFB values would be −47 % and +26 %. In conclusion, within the range of quantified uncertainties, the median MFB for monthly polyol means of −11 % is statistically close to zero. A bias calculation performed directly with the 1497 daily means shows very similar results, with a median MFB of −11 % (range of −81 % to +49 %). This is not surprising, since the comparison of monthly means has only been based on days for which observations were available. The complicated results observed at stations on the Mediterranean coast (Aix-en-Provence, Marseille, Nice, and Port-de-Bouc) will be discussed in the next section.
Next, simulated fungal spore OA is compared to OMpb (see Sect. 2.1.2). Our simulations show an MFB of −28 % and a range from −116 % to +22 % for the different sites (Fig. 4, data from 98 monthly means for seven sites). A negative bias is expected for this comparison, since the PMF factor is likely to include OM contributions from BSOA in addition to that from fungal spores (see Sect. 2.1.2). As a result of this bias analysis with two different types of observations (polyols, OMpb), we do not observe the presence of a systematic bias for our fungal spore OA simulations for the ensemble of French sites. This agrees with Hummel et al. (2015), who also could not conclude a significant bias of the H&S parameterisation.
The datasets were also used to assess whether the H&S parameterisation is able to reproduce the daily and monthly average time variation (Figs. 4 and S3, Table S1). For daily polyol averages, the median correlation between simulations and measurements is 0.43, with a range from −0.19 to 0.57 for the 11 sites. The median correlation increases to 0.60 when looking at monthly averages with a large range from −0.51 to 0.83. As expected for many but not all of the sites, the parameterisation better depicts the seasonal variation (with larger summer and lower winter values) compared to the daily variations (Fig. S3). We will discuss this result further on a site-by-site basis in Sect. 3.2.2. Finally, for comparison with the same polyol dataset, the daily and monthly MFBs are −11 % and −11 % at all the sites (Table S1, Fig. S3). The root mean square error (RMSE) and the mean fractional error (MFE) were also calculated to estimate the error (Table S1, Fig. S4 in the Supplement). The daily and monthly MFEs are 79 % and 56 % at all the sites; for the median RMSE the results are 0.04 µg m−3 and 0.03 µg m−3.
3.2.2 Comparison of time series at selected sites
In this section, we evaluate the robustness of our simulations as a function of the time of the year. To do so, comparisons are made between model outputs and polyol observations, which are available for more measurement sites than for sites with PMF results. These comparisons aim especially at understanding the large ranges of biases and correlations encountered in the previous section. Figure 5 shows observed and estimated monthly mean polyols (sum of arabitol and mannitol concentrations) at the sites with the most data (> 130 daily data) during the years 2013 and 2014, i.e. Grenoble, Lens, Nogent-sur-Oise, Revin, and Roubaix. These sites also have the advantage of being of different types, i.e. urban background in an Alpine valley, urban background, urban background, rural background, and road traffic. The time series for the other sites are shown in Figs. S5–S7 in the Supplement. We indicate the simulated monthly means using data from all the days and only for days for which filter samples are available.
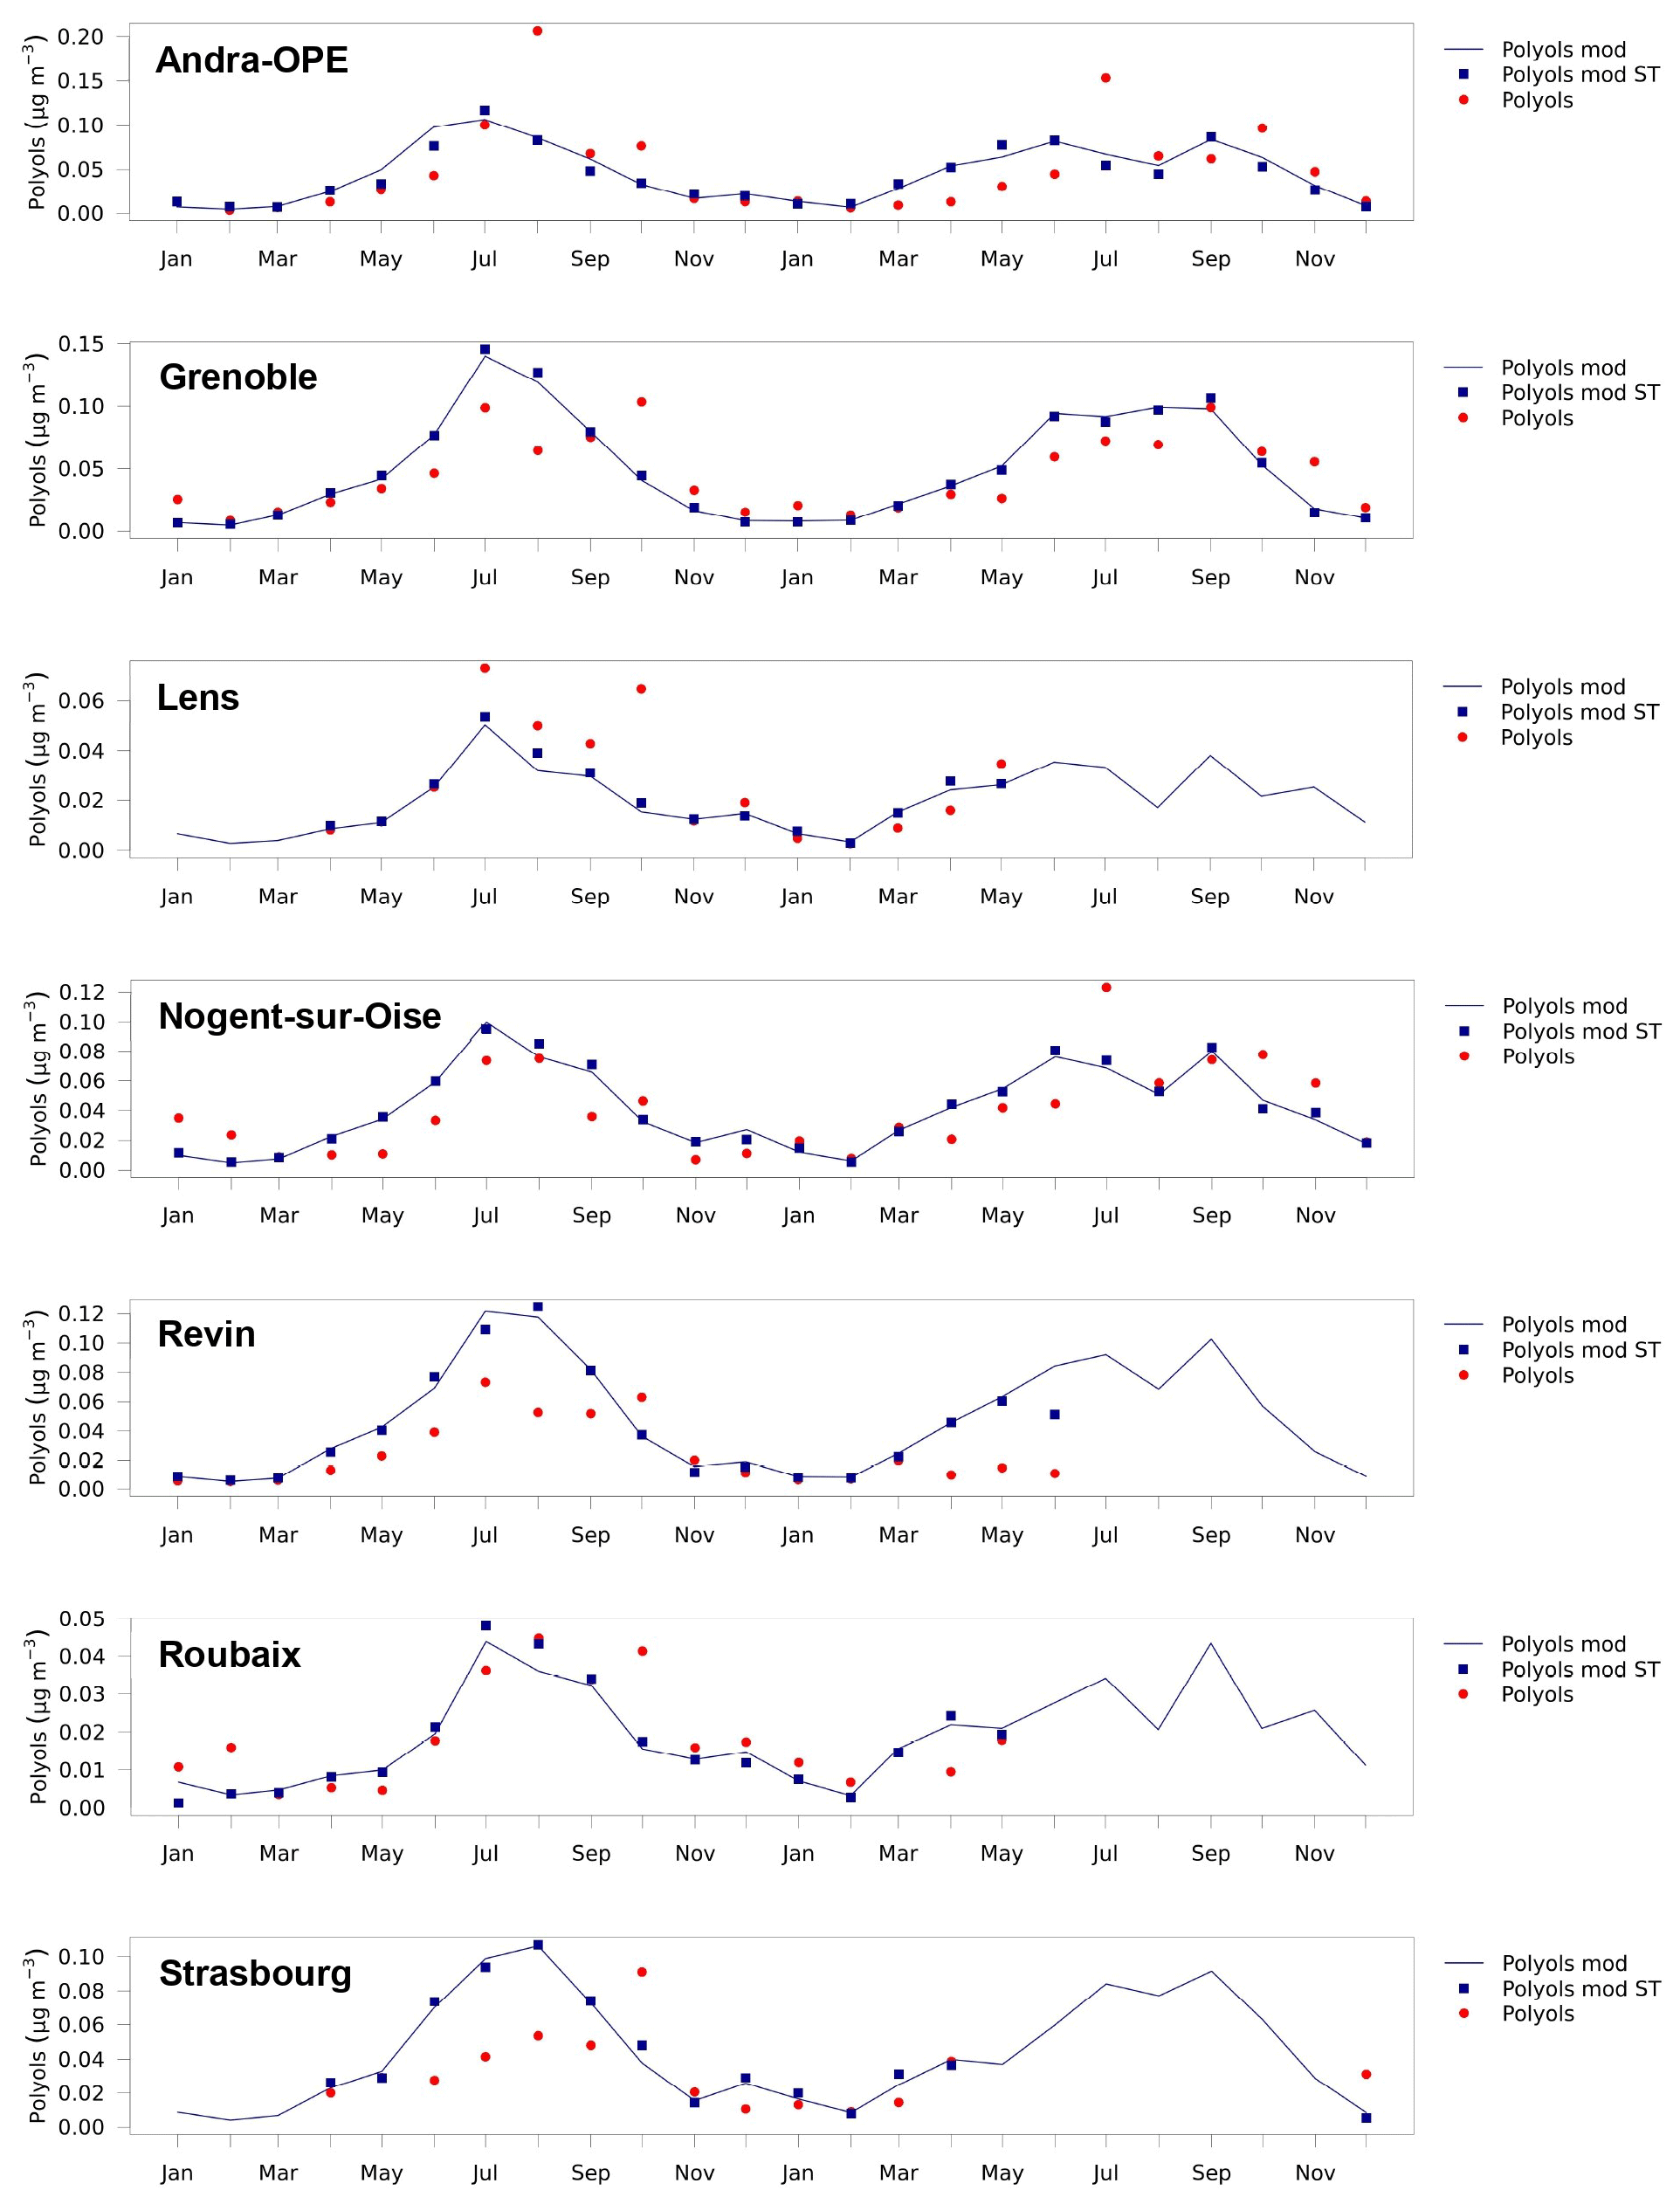
Figure 5Time series of monthly mean polyol concentrations over 2013 and 2014 modelled by CHIMERE (blue line), measured at the sites (red dots), and modelled by CHIMERE using the same time base as the measurements (blue squares). The simulated polyol values have been obtained by multiplying spore concentrations from CHIMERE by 4.5 %. Only the sites outside the Mediterranean area are shown. The same figures for OMpb and other sites are shown in the Supplement (Figs. S5–S7).
The differences between the simulations and measurements are small (< 10 %) for most of the values, which underlines the robustness of the model for monthly averages. Figure 5 shows simulated seasonal cycles consistent with those in Fig. 2, which reflects the dependence of the simulated emissions on LAI. We observe the maximum monthly values for the summer months with a difference in structure between 2013 and 2014: while in 2013 the simulated maximum occurs in July for all of the sites, in 2014 it occurs in September, at least for the sites in northern France (Roubaix, Lens, Nogent-sur-Oise, Andra-OPE, and Strasbourg). The highest summer measurement values of polyols (0.1–0.15 µg m−3, corresponding to 2–3 µg m−3 of OMpb for monthly averages) are of course simulated at the sites where the regional LAI is strongest (e.g. Grenoble, Andra-OPE, Revin, Strasbourg, and Nogent-sur-Oise), as opposed to Lens, Roubaix, Marseille, Aix-en-Provence, and Port-de-Bouc, for which the LAI of the adjacent regions is lower. However, none of the measurement sites is located within the area of large simulated fungal spore OA concentrations over the Massif Central. Comparisons between simulations and observations show remarkable agreement, especially in the seasonal variation for the stations in the northern part of France (Lens, Roubaix, Revin, and Nogent-sur-Oise), resulting in monthly correlation coefficients (R) of 0.78, 0.83, 0.78, and 0.72. Specifically, the gradual increase in polyols (and the related fungal spore OM) from March to July is simulated very well, except for Revin, for which summer concentrations are overestimated. MFB values vary between −23 % for Lens and +53 % for Revin.
Correlations for the eastern French sites are a bit lower, 0.60 for Andra-OPE and 0.52 for Strasbourg with MFBs of −11 % and +28 %. For Grenoble, a city in south-eastern France in the Alps, the correlation is good (R = 0.79) and the bias is small (MFB = +9 %). For a group of sites in the south of France (Port-de-Bouc, Marseille, and Nice) located less than 10 km from the Mediterranean Sea, the situation is singularly different, with strong underestimations in the simulation. It should also be noted that we have fewer observations at these sites (only seven monthly mean observations from June to December 2014), meaning that a full seasonal cycle was not obtained. Still, the simulated decline in autumn and winter (October to December) compared with summer (June to August) was not observed at these sites, resulting in low or even negative correlations for monthly means between −0.51 and 0.15 and negative biases (MFB values between −41 % and −78 %). Similarly, for Aix-en-Provence, some 30 km inland, winter polyol levels were strongly underestimated, resulting in an MFB of −31 % and a correlation of 0.53.
Overall, the results obtained in this study demonstrate that the H&S parameterisation implemented in the CHIMERE model works remarkably well in reproducing the concentrations of fungal spore OA (or at least a proxy of these concentrations with the polyol measurements) observed at sites located in the northern (Lens, Roubaix, Revin, and Nogent-sur-Oise) and eastern (Andra-OPE, Strasbourg, and Grenoble) parts of France. Indeed, the seasonal cycles observed at these sites and the intensity of the concentrations are simulated remarkably well by the model for the monthly averages. This gives great confidence in the ability of the H&S parameterisation to reproduce the fungal spore OA source over large parts of France. This extends the results from the earlier work of Hummel et al. (2015), based on evaluations of four sites located in more northerly parts of Europe (Finland, Ireland, UK, and Germany) and limited to 1 week at the end of August, to more southerly regions, but they still have temperate vegetation and full seasonal cycles. For Europe, this also extends the results of Janssen et al. (2021), who implemented the H&S parameterisation in the global GEOS-Chem model. They compared the model output to yearly FBAP observations at the same sites in Finland and Germany and found rather similar seasonal variations with summer maxima and winter minima, although the simulated maximum occurred in June (2010), while it was observed in August. Note that Janssen et al. (2021) showed that the H&S parameterisation shows a high overestimation of fungal spore numbers with respect to observations in the United States.
Another remarkable fact is that positive results in our study have been obtained from sites with very different land use typologies, ranging from traffic (Roubaix and Strasbourg) and urban background (Lens and Nogent-sur-Oise) to rural (Revin and Andra-OPE) or an urban background site within an Alpine valley (Grenoble). This can be explained by the fact that, due to low levels of long-distance transport, fungal spore OA seems to be controlled by the vegetation at the local scale, as also pointed out already for Grenoble by Samaké et al. (2019a).
Despite these overall encouraging results, several limitations appear for our study. One is probably related to the simplification of using a unique LAI parameter which cannot consider differences in vegetation typology. This may explain the strong differences in MFB values between sites in north-eastern France: Revin, located in a forest-rich area in the Ardennes, shows a strong positive MFB of +53 % (the largest one encountered in our study), while the Andra-OPE site surrounded by extensive field crops shows an MFB of −11 %. For this latter site, we can also note that several observed daily peaks (in August 2013 and July 2014) as large as 5 µg m−3 are not simulated. Such peaks may be related to agricultural activities such as harvesting, as demonstrated by Samaké et al. (2019b) from the record of fieldwork. In addition, atmospheric concentrations of fungal spores mainly come from plant host species (Samaké et al., 2020), so mechanised crop pruning and harvesting can have an impact on spore concentrations in rural areas. The processes which are known to trigger fungal spore emissions are not specifically included in the H&S parameterisation. In the context of this work, we did not seek to better characterise this potential missing source, but this is an interesting perspective for future work.
Our study also clearly shows the inability of the H&S parameterisation to correctly reproduce OMpb and polyol measurements for the Mediterranean areas in southern France, even though, as noted before, our observational database is weaker for this region. However, at these sites, analysis of the chemical composition of aerosols in the PM10 fraction also showed poor simulation of the chemical species, suggesting a more general problem in the Mediterranean area. This could be explained by the specific dynamics in this sector (sea breezes, strong mistral-type winds) coupled with significant orography and heavy urbanisation. As a result, failure to take account of wind speed in the parameterisation of H&S may be a major cause of a lack of emissions and concentrations in the Mediterranean area. Again, this failure may also be related to the fact that LAI does not capture specific characteristics of Mediterranean-type vegetation that are not included in the H&S parameterisation, which is mainly tested for sites that are mostly in northern Europe. In addition, it is striking that our simulations at Mediterranean sites, as expected, still simulate weak autumn and winter emissions due to low LAI and specific humidity but contradict the still high observed concentrations. This could be due to the relatively stronger importance of soil-related fungal spore emissions, which would be independent of LAI. Further, the drier and hotter Mediterranean climate could lead to relatively smaller emissions during dry summers and relatively larger emissions during winter that are still warm enough to allow for fungal spore emissions. It was observed by Samaké et al. (2019b) that the sudden and large decrease in the autumn concentrations to the winter levels observed simultaneously in Grenoble and Chamonix (160 km apart) coincides with a first night temperature below +5 °C, which may be a threshold for the fungi population in this area. Such complex relationships would not be captured by the single specific humidity parameter, which agglomerates information from relative humidity and temperature.
Finally, it may be noted that marine sources could also contribute to enhanced polyol levels and organic aerosol at near-coastal sites, although such sources are not considered in our simulation. For instance, Fu et al. (2013) reported that large mannitol concentrations of up to more than 50 ng m−3 over the Arctic Ocean are comparable to the maximum concentrations observed at our Mediterranean coastal sites. They attributed this source to long-range transport of fungal spores, despite the small transport distance in at least the boundary layer due to efficient dry deposition. Direct marine sources of polyols are an alternative explanation (algae, marine fungi). In particular, mannitol can account for up to 20 %–30 % of the dry weight of some algae species and is likely to be an important source of carbon for marine heterotrophic bacteria (Groisillier et al., 2015). As a conclusion, the H&S parameterisation should not be applied for PBOA emissions in Mediterranean or marine areas, and further work is needed to better document PBOA concentrations and emission processes in such areas.
In this work, we introduced the parameterisation proposed by Heald and Spracklen (2009) for fungal spore OA emissions and updated by Hoose et al. (2010) in the CHIMERE regional chemistry-transport model (H&S). The rationale behind this work is to recognise the potentially important contribution of fungal spores to summertime PM10 (Samaké et al., 2019a, b) that can fill in the missing parts of the OM in chemistry-transport models. The simplicity of the H&S parameterisation gives us specific advantages: a unique LAI parameter gives a slowly varying emission potential, which is modulated with respect to meteorological conditions by specific humidity.
Here, we largely extended the geographical and temporal validity of this parameterisation, which has only been tested before for a limited dataset of observations at northern European locations during the end of summer, to a 2-year dataset of seven sites over north-eastern France. Both polyols (more precisely, the sum of arabitol and mannitol observations) and a primary biogenic organic aerosol factor from PMF analysis show only limited biases for these sites, +5 % and −2 %, in terms of MFB (from four sites only for the comparison with PMF analysis). These small biases, largely within the uncertainty of the polyol or OM conversion factor and the PMF factor, are positive outcomes of our study. In addition, for this group of sites, the seasonal variation of fungal spore emissions, displaying large summer values and small winter values, is correctly depicted, as manifested in large monthly mean correlations (median 0.78, range from 0.52 to 0.83) from polyol measurements.
Still, and obviously, limitations can be noted, such as a wide range of biases for individual sites, with MFB values between −23 % and +53 % for polyol observations. This might be related to biome-specific differences in the emissions only described by a single LAI parameter. The emission variability on a day-to-day basis is only partly expressed by the single specific humidity parameter (range of correlation coefficients between 0.31 and 0.57 for the polyol measurements at the seven sites in north-eastern France). Here, using a more sophisticated combination of meteorological parameters would be desirable for improving the modelling, as for example in Janssen et al. (2021) including also maximum and minimum daily temperatures and friction velocities (even if these authors did not evaluate the capacity of such a combination to simulate the daily PBOA variation). One possible reason for the lack of correlation in daily time series is the impact of land-use-dependent activities, such as annual harvest or tilling in agricultural areas.
For a smaller group of Mediterranean sites with less observational data coverage, the H&S parameterisation failed to capture fungal spore emissions in terms of both absolute values and seasonal variations, which led to strong negative biases, especially during the autumn and winter seasons. In conclusion, for this region the use of the H&S parameterisation in regional PM modelling may not consider certain factors to be necessary for these specific sites. In particular, the nighttime temperature was milder than at the other sites, allowing fungal spores to be released even in winter. Additional efforts are required to enhance the model dynamics, specifically over the Mediterranean coastal environment. This includes extending the simulation of fungal spores over more extended periods in these locations, which also includes an assessment of transport and storage. Furthermore, there is a need to better characterise a source of Mediterranean marine OA that is distinct from fungal spores but shares the emission of polyols. It is also necessary to have more measurement points in this specific area to be able to achieve a more concrete conclusion.
These 2-year CHIMERE simulations incorporating the H&S parameterisation revealed a significant contribution of fungal spore OA to PM10 mass, which is of the order of 1 % or less during winter and up to 20 % during summer in high-emission zones over forested areas such as the Massif Central. In terms of contribution to OM, the simulated autumn fungal spore contribution is even as high as 40 %. This large predicted fungal spore OA contribution over the Massif Central however still warrants confirmation by observations.
Finally, the projected impact of fungal spore organic aerosol suggests significant and seasonally variable contributions to both PM10 and OM mass. Consequently, the simulation of spores should be included in state-of-the-art chemistry-transport models. While the validity of the H&S parameterisation has been demonstrated with good agreement with measurements across northern and eastern France, its application is cautioned against in Mediterranean regions.
All measurement and PMF data for this paper are archived at the IGE and are available on request from the corresponding authors (Jean-Luc Jaffrezo and Gaelle Uzu). The codes and modelling data are available from the LISA authors (Matthieu Vida, Gilles Foret, Matthias Beekmann, and Guillaume Siour). The model is available here: https://www.lmd.polytechnique.fr/chimere/ (Menut et al., 2021; login required, last access: 18 September 2024). The MODIS observations are available here: https://modis.gsfc.nasa.gov/data/dataprod/mod15.php (last access: 18 September 2024, Lin et al., 2023).
The supplement related to this article is available online at: https://doi.org/10.5194/acp-24-10601-2024-supplement.
JLJ and GU provided the PM10, polyol, and PMF speciation data developed at the IGE for the PhD work of Abdoulaye Samaké and Samuel Weber. OF completed the dataset using those obtained at the LCSQA during the CARA programme. FC developed the H&S parameterisation code at INERIS, and GS adapted the code for a more recent version of the CHIMERE model at LISA. AC contributed to the LAI mapping. MV, GF, and MB designed the numerical experiments. MV performed the simulations, produced the figures and tables, and wrote the paper. All the co-authors contributed to the discussion of the results. MV prepared the paper with contributions from all the co-authors. MV, MB, GF, GS, JLJ, and GU designed the study. MV, MB, GF, GS, JLJ, GU, OF, FC, and AC contributed to the writing of the article.
The contact author has declared that none of the authors has any competing interests.
Publisher's note: Copernicus Publications remains neutral with regard to jurisdictional claims made in the text, published maps, institutional affiliations, or any other geographical representation in this paper. While Copernicus Publications makes every effort to include appropriate place names, the final responsibility lies with the authors.
This work was granted access to the HPC resources of TGCC under allocation 2022-A0130107232 made by GENCI. The authors are grateful for the dedicated work of many staff members in the field for collecting the samples at all the sites of the AASQA (Atmo AuRA, Atmo Sud, Atmo HdF, Atmo GE, etc.). Also, we would like to thank all the technicians in the AirOSol analytical platform at the IGE for their work on the samples. Many thanks go to Hans Puxbaum for a close look at the paper in ACPD and for a few interesting remarks. We also thank the two anonymous reviewers, who helped to improve the quality of this work.
The PhD of Matthieu Vida is funded by ADEME and the Paris Region in the framework of the research network on air quality, the DIM Qi2. This work has been supported by the EU Horizon 2020 Green Deal project RI-URBANS (grant no. 101036245). The ANR programme Atmospheric Biogenic Sugar ANR-21-CE01-0021-01 provided some financial support for this collaboration, while analytical aspects were also supported at the IGE by the AirOSol platform within Labex OSUG@2020 (ANR10 LABX56). The work at the IGE for the Andra-OPE site is supported by a long-term grant from ANDRA.
This paper was edited by Maria Kanakidou and reviewed by two anonymous referees.
Bauer, H., Kasper-Giebl, A., Löflund, M., Giebl, H., Hitzenberger, R., Zibuschka, F., and Puxbaum, H.: The contribution of bacteria and fungal spores to the organic carbon content of cloud water, precipitation and aerosols, Atmos. Res., 64, 109–119, https://doi.org/10.1016/S0169-8095(02)00084-4, 2002.
Bauer, H., Claeys, M., Vermeylen, R., Schueller, E., Weinke, G., Berger, A., and Puxbaum, H.: Arabitol and mannitol as tracers for the quantification of airborne fungal spores, Atmos. Environ., 42, 588–593, https://doi.org/10.1016/j.atmosenv.2007.10.013, 2008a.
Bauer, H., Schueller, E., Weinke, G., Berger, A., Hitzenberger, R., Marr, I. L., and Puxbaum, H.: Significant contributions of fungal spores to the organic carbon and to the aerosol mass balance of the urban atmospheric aerosol, Atmos. Environ., 42, 5542–5549, https://doi.org/10.1016/j.atmosenv.2008.03.019, 2008b.
Belis, C. A., Pernigotti, D., Pirovano, G., Favez, O., Jaffrezo, J. L., Kuenen, J., Denier Van Der Gon, H., Reizer, M., Riffault, V., Alleman, L. Y., Almeida, M., Amato, F., Angyal, A., Argyropoulos, G., Bande, S., Beslic, I., Besombes, J.-L., Bove, M. C., Brotto, P., Calori, G., Cesari, D., Colombi, C., Contini, D., De Gennaro, G., Di Gilio, A., Diapouli, E., El Haddad, I., Elbern, H., Eleftheriadis, K., Ferreira, J., Vivanco, M. G., Gilardoni, S., Golly, B., Hellebust, S., Hopke, P. K., Izadmanesh, Y., Jorquera, H., Krajsek, K., Kranenburg, R., Lazzeri, P., Lenartz, F., Lucarelli, F., Maciejewska, K., Manders, A., Manousakas, M., Masiol, M., Mircea, M., Mooibroek, D., Nava, S., Oliveira, D., Paglione, M., Pandolfi, M., Perrone, M., Petralia, E., Pietrodangelo, A., Pillon, S., Pokorna, P., Prati, P., Salameh, D., Samara, C., Samek, L., Saraga, D., Sauvage, S., Schaap, M., Scotto, F., Sega, K., Siour, G., Tauler, R., Valli, G., Vecchi, R., Venturini, E., Vestenius, M., Waked, A., and Yubero, E.: Evaluation of receptor and chemical transport models for PM10 source apportionment, Atmos. Environ. X, 5, 100053, https://doi.org/10.1016/j.aeaoa.2019.100053, 2020.
Borlaza, L. J. S., Weber, S., Uzu, G., Jacob, V., Cañete, T., Micallef, S., Trébuchon, C., Slama, R., Favez, O., and Jaffrezo, J.-L.: Disparities in particulate matter (PM10) origins and oxidative potential at a city scale (Grenoble, France) – Part 1: Source apportionment at three neighbouring sites, Atmos. Chem. Phys., 21, 5415–5437, https://doi.org/10.5194/acp-21-5415-2021, 2021.
Cavalli, F., Viana, M., Yttri, K. E., Genberg, J., and Putaud, J.-P.: Toward a standardised thermal-optical protocol for measuring atmospheric organic and elemental carbon: the EUSAAR protocol, Atmos. Meas. Tech., 3, 79–89, https://doi.org/10.5194/amt-3-79-2010, 2010.
Cholakian, A., Beekmann, M., Colette, A., Coll, I., Siour, G., Sciare, J., Marchand, N., Couvidat, F., Pey, J., Gros, V., Sauvage, S., Michoud, V., Sellegri, K., Colomb, A., Sartelet, K., Langley DeWitt, H., Elser, M., Prévot, A. S. H., Szidat, S., and Dulac, F.: Simulation of fine organic aerosols in the western Mediterranean area during the ChArMEx 2013 summer campaign, Atmos. Chem. Phys., 18, 7287–7312, https://doi.org/10.5194/acp-18-7287-2018, 2018.
Derognat, C., Beekmann, M., Baeumle, M., Martin, D., and Schmidt, H.: Effect of biogenic volatile organic compound emissions on tropospheric chemistry during the Atmospheric Pollution Over the Paris Area (ESQUIF) campaign in the Ile-de-France region, J. Geophys. Res.-Atmos., 108, 8560, https://doi.org/10.1029/2001JD001421, 2003.
Després, V. R., Huffman, J. A., Burrows, S. M., Hoose, C., Safatov, A. S., Buryak, G., Fröhlich-Nowoisky, J., Elbert, W., Andreae, M. O., Pöschl, U., and Jaenicke, R.: Primary biological aerosol particles in the atmosphere: a review, Tellus B, 64, 15598, https://doi.org/10.3402/tellusb.v64i0.15598, 2012.
Douwes, J., Thorne, P., Pearce, N., and Heederik, D.: Bioaerosol Health Effects and Exposure Assessment: Progress and Prospects, Ann. Occup. Hyg., 47, 187–200, https://doi.org/10.1093/annhyg/meg032, 2003.
Eduard, W., Heederik, D., Duchaine, C., and Green, B. J.: Bioaerosol exposure assessment in the workplace: the past, present and recent advances, J. Environ. Monitor., 14, 334, https://doi.org/10.1039/c2em10717a, 2012.
Elbert, W., Taylor, P. E., Andreae, M. O., and Pöschl, U.: Contribution of fungi to primary biogenic aerosols in the atmosphere: wet and dry discharged spores, carbohydrates, and inorganic ions, Atmos. Chem. Phys., 7, 4569–4588, https://doi.org/10.5194/acp-7-4569-2007, 2007.
Favez, O., El Haddad, I., Piot, C., Boréave, A., Abidi, E., Marchand, N., Jaffrezo, J.-L., Besombes, J.-L., Personnaz, M.-B., Sciare, J., Wortham, H., George, C., and D'Anna, B.: Inter-comparison of source apportionment models for the estimation of wood burning aerosols during wintertime in an Alpine city (Grenoble, France), Atmos. Chem. Phys., 10, 5295–5314, https://doi.org/10.5194/acp-10-5295-2010, 2010.
Favez, O., Weber, S., Petit, J.-E., Alleman, L. Y., Albinet, A., Riffault, V., Chazeau, B., Amodeo, T., Salameh, D., Zhang, Y., Srivastava, D., Samaké, A., Aujay-Plouzeau, R., Papin, A., Bonnaire, N., Boullanger, C., Chatain, M., Chevrier, F., Detournay, A., Dominik-Sègue, M., Falhun, R., Garbin, C., Ghersi, V., Grignion, G., Levigoureux, G., Pontet, S., Rangognio, J., Zhang, S., Besombes, J.-L., Conil, S., Uzu, G., Savarino, J., Marchand, N., Gros, V., Marchand, C., Jaffrezo, J.-L., and Leoz-Garziandia, E.: Overview of the French Operational Network for In Situ Observation of PM Chemical Composition and Sources in Urban Environments (CARA Program), Atmosphere, 12, 207, https://doi.org/10.3390/atmos12020207, 2021.
Fountoukis, C. and Nenes, A.: ISORROPIA II: a computationally efficient thermodynamic equilibrium model for K+–Ca2+–Mg2+––Na+–––Cl−–H2O aerosols, Atmos. Chem. Phys., 7, 4639–4659, https://doi.org/10.5194/acp-7-4639-2007, 2007.
Fröhlich-Nowoisky, J., Kampf, C. J., Weber, B., Huffman, J. A., Pöhlker, C., Andreae, M. O., Lang-Yona, N., Burrows, S. M., Gunthe, S. S., Elbert, W., Su, H., Hoor, P., Thines, E., Hoffmann, T., Després, V. R., and Pöschl, U.: Bioaerosols in the Earth system: Climate, health, and ecosystem interactions, Atmos. Res., 182, 346–376, https://doi.org/10.1016/j.atmosres.2016.07.018, 2016.
Fu, P. Q., Kawamura, K., Chen, J., Charrière, B., and Sempéré, R.: Organic molecular composition of marine aerosols over the Arctic Ocean in summer: contributions of primary emission and secondary aerosol formation, Biogeosciences, 10, 653–667, https://doi.org/10.5194/bg-10-653-2013, 2013.
Ghosh, B., Lal, H., and Srivastava, A.: Review of bioaerosols in indoor environment with special reference to sampling, analysis and control mechanisms, Environ. Int., 85, 254–272, https://doi.org/10.1016/j.envint.2015.09.018, 2015.
Gosselin, M. I., Rathnayake, C. M., Crawford, I., Pöhlker, C., Fröhlich-Nowoisky, J., Schmer, B., Després, V. R., Engling, G., Gallagher, M., Stone, E., Pöschl, U., and Huffman, J. A.: Fluorescent bioaerosol particle, molecular tracer, and fungal spore concentrations during dry and rainy periods in a semi-arid forest, Atmos. Chem. Phys., 16, 15165–15184, https://doi.org/10.5194/acp-16-15165-2016, 2016.
Groisillier, A., Labourel, A., Michel, G., and Tonon, T.: The Mannitol Utilization System of the Marine Bacterium Zobellia galactanivorans, Appl. Environ. Microb., 81, 1799–1812, https://doi.org/10.1128/AEM.02808-14, 2015.
Guenther, A. B., Jiang, X., Heald, C. L., Sakulyanontvittaya, T., Duhl, T., Emmons, L. K., and Wang, X.: The Model of Emissions of Gases and Aerosols from Nature version 2.1 (MEGAN2.1): an extended and updated framework for modeling biogenic emissions, Geosci. Model Dev., 5, 1471–1492, https://doi.org/10.5194/gmd-5-1471-2012, 2012.
Heald, C. L. and Spracklen, D. V.: Atmospheric budget of primary biological aerosol particles from fungal spores, Geophys. Res. Lett., 36, 2009GL037493, https://doi.org/10.1029/2009GL037493, 2009.
Hoose, C., Kristjánsson, J. E., and Burrows, S. M.: How important is biological ice nucleation in clouds on a global scale?, Environ. Res. Lett., 5, 024009, https://doi.org/10.1088/1748-9326/5/2/024009, 2010.
Hopke, P. K., Dai, Q., Li, L., and Feng, Y.: Global review of recent source apportionments for airborne particulate matter, Sci. Total Environ., 740, 140091, https://doi.org/10.1016/j.scitotenv.2020.140091, 2020.
Huffman, J. A., Prenni, A. J., DeMott, P. J., Pöhlker, C., Mason, R. H., Robinson, N. H., Fröhlich-Nowoisky, J., Tobo, Y., Després, V. R., Garcia, E., Gochis, D. J., Harris, E., Müller-Germann, I., Ruzene, C., Schmer, B., Sinha, B., Day, D. A., Andreae, M. O., Jimenez, J. L., Gallagher, M., Kreidenweis, S. M., Bertram, A. K., and Pöschl, U.: High concentrations of biological aerosol particles and ice nuclei during and after rain, Atmos. Chem. Phys., 13, 6151–6164, https://doi.org/10.5194/acp-13-6151-2013, 2013.
Hummel, M., Hoose, C., Gallagher, M., Healy, D. A., Huffman, J. A., O'Connor, D., Pöschl, U., Pöhlker, C., Robinson, N. H., Schnaiter, M., Sodeau, J. R., Stengel, M., Toprak, E., and Vogel, H.: Regional-scale simulations of fungal spore aerosols using an emission parameterization adapted to local measurements of fluorescent biological aerosol particles, Atmos. Chem. Phys., 15, 6127–6146, https://doi.org/10.5194/acp-15-6127-2015, 2015.
Jaenicke, R., Matthias-Maser, S., and Gruber, S.: Omnipresence of biological material in the atmosphere, Environ. Chem., 4, 217, https://doi.org/10.1071/EN07021, 2007.
Janssen, R. H. H., Heald, C. L., Steiner, A. L., Perring, A. E., Huffman, J. A., Robinson, E. S., Twohy, C. H., and Ziemba, L. D.: Drivers of the fungal spore bioaerosol budget: observational analysis and global modeling, Atmos. Chem. Phys., 21, 4381–4401, https://doi.org/10.5194/acp-21-4381-2021, 2021.
Jones, A. M. and Harrison, R. M.: The effects of meteorological factors on atmospheric bioaerosol concentrations, a review, Sci. Total Environ., 326, 151–180, https://doi.org/10.1016/j.scitotenv.2003.11.021, 2004.
Karagulian, F., Belis, C. A., Dora, C. F. C., Prüss-Ustün, A. M., Bonjour, S., Adair-Rohani, H., and Amann, M.: Contributions to cities' ambient particulate matter (PM): A systematic review of local source contributions at global level, Atmos. Environ., 120, 475–483, https://doi.org/10.1016/j.atmosenv.2015.08.087, 2015.
Lin, W., Yuan, H., Dong, W., Zhang, S., Liu, S., Wei, N., Lu, X., Wei, Z., Hu, Y., and Dai, Y.: Reprocessed MODIS Version 6.1 Leaf Area Index Dataset and Its Evaluation for Land Surface and Climate Modeling, Remote Sens., 15, 1780, https://doi.org/10.3390/rs15071780, 2023.
Marécal, V., Peuch, V.-H., Andersson, C., Andersson, S., Arteta, J., Beekmann, M., Benedictow, A., Bergström, R., Bessagnet, B., Cansado, A., Chéroux, F., Colette, A., Coman, A., Curier, R. L., Denier van der Gon, H. A. C., Drouin, A., Elbern, H., Emili, E., Engelen, R. J., Eskes, H. J., Foret, G., Friese, E., Gauss, M., Giannaros, C., Guth, J., Joly, M., Jaumouillé, E., Josse, B., Kadygrov, N., Kaiser, J. W., Krajsek, K., Kuenen, J., Kumar, U., Liora, N., Lopez, E., Malherbe, L., Martinez, I., Melas, D., Meleux, F., Menut, L., Moinat, P., Morales, T., Parmentier, J., Piacentini, A., Plu, M., Poupkou, A., Queguiner, S., Robertson, L., Rouïl, L., Schaap, M., Segers, A., Sofiev, M., Tarasson, L., Thomas, M., Timmermans, R., Valdebenito, Á., van Velthoven, P., van Versendaal, R., Vira, J., and Ung, A.: A regional air quality forecasting system over Europe: the MACC-II daily ensemble production, Geosci. Model Dev., 8, 2777–2813, https://doi.org/10.5194/gmd-8-2777-2015, 2015.
Menut, L., Bessagnet, B., Briant, R., Cholakian, A., Couvidat, F., Mailler, S., Pennel, R., Siour, G., Tuccella, P., Turquety, S., and Valari, M.: The CHIMERE v2020r1 online chemistry-transport model, Geosci. Model Dev., 14, 6781–6811, https://doi.org/10.5194/gmd-14-6781-2021, 2021.
Paatero, P. and Tapper, U.: Positive matrix factorization: A non-negative factor model with optimal utilization of error estimates of data values, Environmetrics, 5, 111–126, https://doi.org/10.1002/env.3170050203, 1994.
Patade, S., Phillips, V. T. J., Amato, P., Bingemer, H. G., Burrows, S. M., DeMott, P. J., Goncalves, F. L. T., Knopf, D. A., Morris, C. E., Alwmark, C., Artaxo, P., Pöhlker, C., Schrod, J., and Weber, B.: Empirical formulation for multiple groups of primary biological ice nucleating particles from field observations over Amazonia, J. Atmos. Sci., 78, 2195–2220, https://doi.org/10.1175/JAS-D-20-0096.1, 2021.
Pearson, C., Littlewood, E., Douglas, P., Robertson, S., Gant, T. W., and Hansell, A. L.: Exposures and Health Outcomes in Relation to Bioaerosol Emissions From Composting Facilities: A Systematic Review of Occupational and Community Studies, J. Toxicol. Env. Heal. B, 18, 43–69, https://doi.org/10.1080/10937404.2015.1009961, 2015.
Petit, J.-E., Favez, O., Sciare, J., Crenn, V., Sarda-Estève, R., Bonnaire, N., Močnik, G., Dupont, J.-C., Haeffelin, M., and Leoz-Garziandia, E.: Two years of near real-time chemical composition of submicron aerosols in the region of Paris using an Aerosol Chemical Speciation Monitor (ACSM) and a multi-wavelength Aethalometer, Atmos. Chem. Phys., 15, 2985–3005, https://doi.org/10.5194/acp-15-2985-2015, 2015.
Rouil, L., Honoré, C., Vautard, R., Beekmann, M., Bessagnet, B., Malherbe, L., Meleux, F., Dufour, A., Elichegaray, C., Flaud, J.-M., Menut, L., Martin, D., Peuch, A., Peuch, V.-H., and Poisson, N.: Prev'air: An Operational Forecasting and Mapping System for Air Quality in Europe, B. Am. Meteorol. Soc., 90, 73–84, https://doi.org/10.1175/2008BAMS2390.1, 2009.
Samaké, A., Uzu, G., Martins, J. M. F., Calas, A., Vince, E., Parat, S., and Jaffrezo, J. L.: The unexpected role of bioaerosols in the Oxidative Potential of PM, Sci. Rep.-UK, 7, 10978, https://doi.org/10.1038/s41598-017-11178-0, 2017.
Samaké, A., Jaffrezo, J.-L., Favez, O., Weber, S., Jacob, V., Canete, T., Albinet, A., Charron, A., Riffault, V., Perdrix, E., Waked, A., Golly, B., Salameh, D., Chevrier, F., Oliveira, D. M., Besombes, J.-L., Martins, J. M. F., Bonnaire, N., Conil, S., Guillaud, G., Mesbah, B., Rocq, B., Robic, P.-Y., Hulin, A., Le Meur, S., Descheemaecker, M., Chretien, E., Marchand, N., and Uzu, G.: Arabitol, mannitol, and glucose as tracers of primary biogenic organic aerosol: the influence of environmental factors on ambient air concentrations and spatial distribution over France, Atmos. Chem. Phys., 19, 11013–11030, https://doi.org/10.5194/acp-19-11013-2019, 2019a.
Samaké, A., Jaffrezo, J.-L., Favez, O., Weber, S., Jacob, V., Albinet, A., Riffault, V., Perdrix, E., Waked, A., Golly, B., Salameh, D., Chevrier, F., Oliveira, D. M., Bonnaire, N., Besombes, J.-L., Martins, J. M. F., Conil, S., Guillaud, G., Mesbah, B., Rocq, B., Robic, P.-Y., Hulin, A., Le Meur, S., Descheemaecker, M., Chretien, E., Marchand, N., and Uzu, G.: Polyols and glucose particulate species as tracers of primary biogenic organic aerosols at 28 French sites, Atmos. Chem. Phys., 19, 3357–3374, https://doi.org/10.5194/acp-19-3357-2019, 2019b.
Samaké, A., Bonin, A., Jaffrezo, J.-L., Taberlet, P., Weber, S., Uzu, G., Jacob, V., Conil, S., and Martins, J. M. F.: High levels of primary biogenic organic aerosols are driven by only a few plant-associated microbial taxa, Atmos. Chem. Phys., 20, 5609–5628, https://doi.org/10.5194/acp-20-5609-2020, 2020.
Sesartic, A. and Dallafior, T. N.: Global fungal spore emissions, review and synthesis of literature data, Biogeosciences, 8, 1181–1192, https://doi.org/10.5194/bg-8-1181-2011, 2011.
Shaffer, B. T. and Lighthart, B.: Survey of Culturable Airborne Bacteria at Four Diverse Locations in Oregon: Urban, Rural, Forest, and Coastal, Microb. Ecol., 34, 167–177, https://doi.org/10.1007/s002489900046, 1997.
Sindelarova, K., Granier, C., Bouarar, I., Guenther, A., Tilmes, S., Stavrakou, T., Müller, J.-F., Kuhn, U., Stefani, P., and Knorr, W.: Global data set of biogenic VOC emissions calculated by the MEGAN model over the last 30 years, Atmos. Chem. Phys., 14, 9317–9341, https://doi.org/10.5194/acp-14-9317-2014, 2014.
Skamarock, W. C., Klemp, J. B., Dudhia, J., Gill, D. O., Barker, D. M., Duda, M. G., Huang, X.-Y., Wang, W., and Powers, J. G.: A Description of the Advanced Research WRF Version 3, National Center for Atmospheric Research Boulder, Colorado, USA, 2008.
Verlhac, S., Favez, O., and Albinet, A.: Interlaboratory comparison organized for the European laboratories involved in the analysis of levoglucosan and its isomers, LCSQA, Verneuil-en-Halatte, 2013.
Vestreng, V.: Review and Revision, Emission Data Reported to CLRTAP, MSC-W Status Report, Norwegian Meteorological Institute, Oslo, Norway, 2003.
Von Storch, H., Langenberg, H., and Feser, F.: A Spectral Nudging Technique for Dynamical Downscaling Purposes, Mon. Weather Rev., 128, 3664–3673, https://doi.org/10.1175/1520-0493(2000)128<3664:ASNTFD>2.0.CO;2, 2000.
Waked, A., Favez, O., Alleman, L. Y., Piot, C., Petit, J.-E., Delaunay, T., Verlinden, E., Golly, B., Besombes, J.-L., Jaffrezo, J.-L., and Leoz-Garziandia, E.: Source apportionment of PM10 in a north-western Europe regional urban background site (Lens, France) using positive matrix factorization and including primary biogenic emissions, Atmos. Chem. Phys., 14, 3325–3346, https://doi.org/10.5194/acp-14-3325-2014, 2014.
Weber, S., Uzu, G., Favez, O., Borlaza, L. J. S., Calas, A., Salameh, D., Chevrier, F., Allard, J., Besombes, J.-L., Albinet, A., Pontet, S., Mesbah, B., Gille, G., Zhang, S., Pallares, C., Leoz-Garziandia, E., and Jaffrezo, J.-L.: Source apportionment of atmospheric PM10 oxidative potential: synthesis of 15 year-round urban datasets in France, Atmos. Chem. Phys., 21, 11353–11378, https://doi.org/10.5194/acp-21-11353-2021, 2021.
Yttri, K. E., Schnelle-Kreis, J., Maenhaut, W., Abbaszade, G., Alves, C., Bjerke, A., Bonnier, N., Bossi, R., Claeys, M., Dye, C., Evtyugina, M., García-Gacio, D., Hillamo, R., Hoffer, A., Hyder, M., Iinuma, Y., Jaffrezo, J.-L., Kasper-Giebl, A., Kiss, G., López-Mahia, P. L., Pio, C., Piot, C., Ramirez-Santa-Cruz, C., Sciare, J., Teinilä, K., Vermeylen, R., Vicente, A., and Zimmermann, R.: An intercomparison study of analytical methods used for quantification of levoglucosan in ambient aerosol filter samples, Atmos. Meas. Tech., 8, 125–147, https://doi.org/10.5194/amt-8-125-2015, 2015.
Note that, following the definition of MFB (see the Supplement), a relative difference between simulations and observations of a factor of 2 () corresponds to an MFB of 67 % (−67 %). Thus, in a very crude manner, the simulations with sites with the largest and lowest MFBs show a difference of a factor of 2 with the observations.