the Creative Commons Attribution 4.0 License.
the Creative Commons Attribution 4.0 License.
 | 23 Sep 2024
Ammonia emission estimates using CrIS satellite observations over Europe
Ronald van der A
Henk Eskes
Enrico Dammers
Mark Shephard
Roy Wichink Kruit
Marc Guevara
Leonor Tarrason
Over the past century, ammonia (NH3) emissions have increased with the growth of livestock and fertilizer usage. The abundant NH3 emissions lead to secondary fine particulate matter (PM2.5) pollution, climate change, and a reduction in biodiversity, and they affect human health. Up-to-date and spatially and temporally resolved information on NH3 emissions is essential to better quantify their impact. In this study we applied the existing Daily Emissions Constrained by Satellite Observations (DECSO) algorithm to NH3 observations from the Cross-track Infrared Sounder (CrIS) to estimate NH3 emissions. Because NH3 in the atmosphere is influenced by nitrogen oxides (NOx), we implemented DECSO to estimate NOx and NH3 emissions simultaneously. The emissions are derived over Europe for 2020 on a spatial resolution of 0.2°×0.2° using daily observations from both CrIS and the TROPOspheric Monitoring Instrument (TROPOMI; on the Sentinel-5 Precursor (S5P) satellite). Due to the limited number of daily satellite observations of NH3, monthly emissions of NH3 are reported. The total NH3 emissions derived from observations are about 8 Tg yr−1, with a precision of about 5 %–17 % per grid cell per year over the European domain (35–55° N, 10° W–30° E). The comparison of the satellite-derived NH3 emissions from DECSO with independent bottom-up inventories and in situ observations indicates a consistency in terms of magnitude on the country totals, with the results also being comparable regarding the temporal and spatial distributions. The validation of DECSO over Europe implies that we can use DECSO to quickly derive fairly accurate monthly emissions of NH3 over regions with limited local information on NH3 emissions.
- Article
(7416 KB) - Full-text XML
- Companion paper
-
Supplement
(2251 KB) - BibTeX
- EndNote


Ammonia (NH3) is the most abundant alkaline gas and one of the main reactive nitrogen species in the atmosphere. NH3 is a precursor for the formation of atmospheric aerosols, which play an important role in climate change. In Europe, about 50 % (Wyer et al., 2022) of atmospheric NH3 is transformed into fine particulate matter (PM2.5) composed of ammonium through chemical reactions with sulfuric and nitric acids from nitrogen oxides (NOx) and sulfur dioxides (SO2) in the atmosphere (Renard et al., 2004; Schaap et al., 2004). According to the European Environment Agency (EEA), the dominant source of NH3 in Europe is agriculture, which is responsible for more than 90 % of European emissions. The other source sectors include industry, transport, energy, waste treatment, and biomass burning (Behera et al., 2013; Backes et al., 2016a; Van Damme et al., 2018; Adams et al., 2019). Excessive NH3 emissions have an adverse impact on biodiversity, human health, and climate change (Galloway et al., 2008). Over the past century, NH3 emissions have increased strongly with the growing human population, cattle farming, and fertilizer usage (Crippa et al., 2023; Erisman et al., 2008; Van Damme et al., 2021), leading to high nitrogen deposition loads to water and soil (Erisman et al., 2013) with the associated eutrophication, acidification, and biodiversity loss problems (Behera et al., 2013). Since 2019, the Dutch policymakers have paid a lot of attention to NH3 emissions due to the nitrogen (N) crisis after the national programmatic approach to nitrogen was rejected by the Supreme Court because it was inadequate for the protection of vulnerable areas of nature (named Natura 2000). The Dutch government is obliged by EU laws to protect the natural environment and prevent damage caused by overly high emissions of reactive nitrogen. Studies show that the abatement of NH3 emissions is very cost-effective in improving air quality and has high social benefits (Backes et al., 2016b; Zhang et al., 2020; Gu et al., 2021). Detailed spatially and temporally resolved information on NH3 emissions is crucial for both scientific communities and policymakers to study and predict pollutant concentrations and deposition, along with their impact on the environment, and to motivate environmental control strategies.
The empirical method to estimate NH3 emissions is the so-called bottom-up approach, which combines available official reported activity data incorporating a full differentiation of emission activities with emission factors and with technology and abatement measures from individual countries for each source category (Crippa et al., 2018, 2023; Janssens-Maenhout et al., 2019). The annual emissions are then distributed in time and space based on proxy data, such as land-use data, and meteorological parameters (Backes et al., 2016a). Ge et al. (2020) summarized the key factors of agricultural NH3 emissions: local agricultural practices and the application of manure and fertilizer, including type, amount and method, animal species, housing, manure storage, meteorological conditions, soil properties, and regulations of agricultural practice. The uncertainties in NH3 emissions calculated by the bottom-up approach are very large due to insufficient data on agricultural activities (Behera et al., 2013; Beusen et al., 2008). Crippa et al. (2018) pointed out that the uncertainty in NH3 (between 186 % and 294.4 %) in the Emissions Database for Global Atmospheric Research (EDGAR) inventory is the largest among all pollutants because of the high uncertainty in both agricultural statistics and emission factors.
The validation of NH3 emission inventories using ground-based observations is very challenging due to the sparsely distributed in-site measurement network. NH3 concentrations have large temporal and spatial variability due to their short lifetime, which ranges from about a few hours to 2 d (Dammers et al., 2019; Luo et al., 2022). Densely distributed hourly or daily ground measurements are impractical for large areas due to high costs and specific operational requirements (Noordijk et al., 2020). In the last decade, a wide spatial and temporal coverage of satellite observations of NH3 in the lower troposphere was established due to the development of infrared nadir-viewing satellite instruments, such as the Tropospheric Emission Spectrometer (TES) (Beer et al., 2008) on the NASA Aura satellite. The operational Cross-track Infrared Sounder (CrIS) (Shephard and Cady-Pereira, 2015) on the Suomi National Polar-orbiting Partnership (SNPP) and on the Joint Polar Satellite System-1 and System-2 (JPSS-1 and JPSS-2, also named NOAA-20 and NOAA-21) satellites of NASA/NOAA and the Infrared Atmospheric Sounding Interferometer (IASI) (Clarisse et al., 2009) on the MetOp satellites from the European Space Agency (ESA), with their large swaths, provide daily global coverage of NH3 observations and improve our understanding of NH3 global distribution and temporal variability.
NH3 emissions can be obtained by applying an inversion algorithm to satellite observations. Such estimates provide useful information which is independent from bottom-up inventories. By using IASI NH3 observations, Van Damme et al. (2018) identified NH3 emission hotspots and calculated emissions based on a mass balance approach. They found that NH3 emissions from most hotspots, especially industrial emitters, were largely underestimated compared to EDGAR. Dammers et al. (2019) used both IASI and CrIS observations to derive emissions, lifetimes, and plume widths of NH3 from large agricultural and industrial point sources and concluded that 55 locations were missing in the Hemispheric Transport of Air Pollution version 2 (HTAP v2) emission inventory. Besides the studies on point sources, data assimilation techniques combining a chemical transport model (CTM) with satellite observations are also widely used to derive NH3 surface emissions. Van der Graaf et al. (2022) adjusted the NH3 emissions over Europe using a local ensemble transform Kalman filter (LETKF) applied to CrIS NH3 profiles. Sitwell et al. (2022) developed an ensemble-variational inversion system to estimate NH3 emissions from CrIS over North America. Another widely used method is 4D-Var using the GEOS-Chem global chemistry transport model, which has been applied to America, China, and Europe using NH3 observations from different instruments (Zhu et al., 2013; Zhang et al., 2018; Li et al., 2019; Cao et al., 2020, 2022; Chen et al., 2021). The main advantage of CrIS is the combination of global coverage and the improved sensitivity in the boundary layer attributed to the low spectral noise of about 0.04 K at 280 K in the NH3 spectral band (Zavyalov et al., 2013). The infrared instrument is also more sensitive at the overpass time in the early afternoon, with high thermal contrast between air and surface.
The Daily Emissions Constrained by Satellite Observations (DECSO) inversion algorithm uses satellite column observations to derive emissions for short-lived gases based on an extended Kalman filter (Mijling and van der A, 2012). The concentrations of the species are calculated from the emissions by a CTM and compared to satellite observations. One of the main advantages of using DECSO is the fast calculation speed compared to other data assimilation methods. Furthermore, the derived emissions are updated by addition, not by scaling the existing emissions. This enables the fast detection of new sources and changed emissions. In previous studies, DECSO was applied to nitrogen dioxide (NO2) observations from different satellites and used the Eulerian regional offline CTM CHIMERE (Menut et al., 2021, 2013) to estimate regional NOx (NO2+NO) emissions, and it revealed that the temporal and spatial variability in total surface NOx emissions is well captured by DECSO compared to bottom-up inventories or in situ observations (Ding et al., 2015, 2017a, 2020, 2022; van der A et al., 2020; Liu et al., 2018).
Direct validation of emission inventories, regardless of bottom-up or satellite-derived approaches, presents the same challenge due to the inherent difficulty of directly measuring large-scale emissions on the ground. The intercomparison of emissions using independent data and different approaches is usually performed to assess the emission data. Another common way to validate emissions can be achieved by using them as input data in a chemical transport model. The model-simulated concentrations are compared to in situ observations.
In this study we extend the DECSO-NOx system to NH3 in order to derive both NOx and NH3 emissions simultaneously, using CrIS NH3 observations and NO2 observations from the TROPOspheric Monitoring Instrument (TROPOMI) (Veefkind et al., 2012). Using the multi-species DECSO version, we update NOx and NH3 emissions simultaneously to reduce the impact of the temporal change (e.g. trend) in NOx when deriving NH3 emissions. After the description of the DECSO algorithm applied to NH3, the results of NH3 emissions over Europe are presented at a spatial resolution of 0.2°×0.2°. To evaluate the derived NH3 emissions, we will compare the country totals and the monthly variability with bottom-up inventories, with a focus on NH3 emissions in the Netherlands. In addition, we compare the NH3 concentration simulations of CHIMERE using different emission inventories with in situ observations.
2.1 Satellite observations
2.1.1 CrIS observations of NH3
The CrIS instrument is a Fourier-transform spectrometer (FTS) launched on the Suomi National Polar-orbiting Partnership (SNPP) satellite in 2011 and on the NOAA-20 satellite in 2017. The overpass time of SNPP at the Equator is about 01:30 and 13:30 LT. NOAA-20 circles the Earth in the same orbit as SNPP, but it is separated in time and space by 50 min and crosses the Equator at about 02:20 and 14:20 LT. The instrument has a wide swath of up to 2200 km, providing twice-daily global coverage. The total angular field of view consists of a 3×3 array of circular pixels of 14 km diameter each at nadir (Han et al., 2013). CrIS measures the infrared spectrum, including the main NH3 spectral signatures located in the long-wave window region between 900 and 1000 cm−1. The spectral resolution of the radiance data is 0.625 cm−1. NH3 observations are retrieved with the CrIS fast physical retrieval (CFPR) algorithm based on an optimal estimate method minimizing the difference between measured spectral radiances and those simulated by a radiative transfer model (Shephard and Cady-Pereira, 2015). Three typical a priori profiles of NH3 representing high source, moderate source, and background source are used in the retrieval algorithm. The NH3 profiles are retrieved on 14 pressure levels, with the peak sensitivity of CrIS between 900 and 700 hPa (Shephard et al., 2020). For SNPP, the retrieval products start from 2011 and end in May 2021, with missing data from April to August 2019. The NH3 retrieval product of NOAA-20 starts from March 2019. We use the version 1.6.4 retrieval products of CrIS on both SNPP and NOAA-20 from September 2019 to December 2020, which also accounts for non-detects in the observations and retrievals through optically thin clouds (White et al., 2023). We use the daytime observations with the quality flag larger than 3 over our study domain of Europe (35–55° N, −10–30° E; Shephard et al., 2020). Since there are almost no emissions over the ocean, we only use the observations over land. To reduce extreme-emission updates in 1 d, we filter the NH3 data greater than the 99th percentile of all observations for the selected period over the study domain. This was also applied by van der Graaf et al. (2022). To make a fair comparison between NH3 observations of CrIS and model simulations of CHIMERE, we interpolate modelled concentrations from the model grid cell over the satellite footprints and apply the averaging kernel to the modelled profile. Although the NH3 observations from CrIS are in circular pixels, we still assume the pixels to be rectangular and calculate the pixel corner coordinates based on the satellite height, satellite zenith angle, and viewing angle while assuming the width of each pixel to be equal to the diameter of the circular pixel. To simplify the calculation of applying the original logarithmic averaging kernels, we converted them to linearized average kernels based on the method of Cao et al. (2022).
2.1.2 TROPOMI observations of NO2
TROPOMI is on board the Sentinel-5 Precursor (S5P) satellite launched on 13 October 2017 with a high spatial resolution of 3.5 km×5.5 km at nadir for NO2 observations. The overpass time is about 13:30 LT, similar to that of CrIS. We use TROPOMI tropospheric NO2 columns from the version 2.4 reprocessed retrieval dataset (van Geffen et al., 2022) and follow the recommendations for using the QA value as detailed in the Product User Manual (Eskes and Eichmann, 2022). NO2 columns are converted into “super-observations” representing the integrated average (Boersma et al., 2016; Rijsdijk et al., 2024) over the 0.2°×0.2° grid cells. The super-observation error takes into account spatial correlations between individual TROPOMI observations and representativity errors in the case of incomplete coverage. In this paper, the super-observations are calculated for the NO2 columns from the surface to about 700 hPa, where the NO2 concentrations are most related to surface emissions. The signal-to-noise ratio and calculation time of DECSO are improved by using super-observations. The details of TROPOMI NO2 data used by DECSO are described in Ding et al. (2020) and van der A et al. (2024).
2.2 Ground-based observations
To evaluate the NH3 emissions derived by DECSO, we compare independent ground-based observations from 2020 with model-simulated NH3 concentrations of CHIMERE using different inventories. Compared to other countries, the Netherlands has the densest network for monitoring surface NH3 concentrations. We use hourly NH3 concentrations measured by the miniDOAS at six locations (Fig. S1 in the Supplement) from the Dutch Air Quality Monitoring (LML) network (Berkhout et al., 2017) and monthly measurements of NH3 concentration provided by passive samples at 394 locations (Fig. S2 in the Supplement) from the Dutch Measuring Ammonia in Nature (MAN) network (Lolkema et al., 2015). The uncertainty in NH3 concentrations measured with individual passive samples is large (22 % for a single monthly measurement), and the measurements are calibrated monthly against the high-quality measurements (about 20 % for an hourly measurement) from the LML network to enhance the accuracy.
2.3 Emission inventories
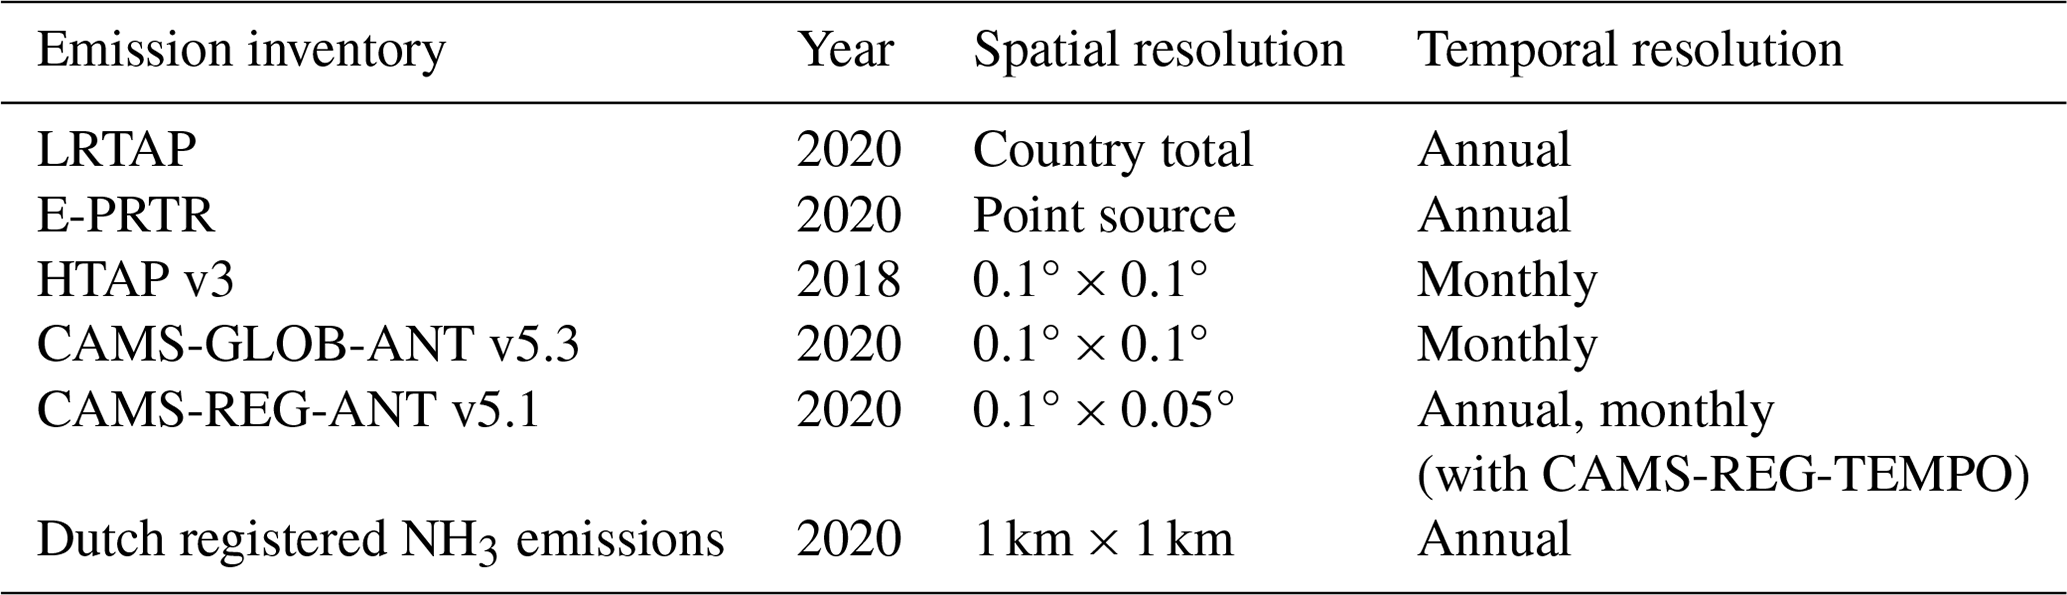
To verify the satellite-derived emissions of NH3 in Europe, we compare them to several emission inventories, including the national emission inventories officially reported under the Convention on Long-range Transboundary Air Pollution (LRTAP) (Pinterits et al., 2023) of 2020; the emissions reported under the European Pollutant Release and Transfer Register (E-PRTR) (EPRTR, 2012) of 2020, including releases from industrial facilities and livestock facilities; the global emission inventory Hemispheric Transport of Air Pollution (HTAP) v3 of 2018 (Crippa et al., 2023); the Copernicus Atmosphere Monitoring Service (CAMS) global anthropogenic emissions (CAMS-GLOB-ANT) v5.3 of 2020 (Soulie et al., 2023); the regional European CAMS anthropogenic emission inventory (CAMS-REG-ANT) v5.1 of 2020 (Kuenen et al., 2022); and the Dutch official registered emissions of NH3 in 2020 (https://data.emissieregistratie.nl/export, last access: 11 September 2024) (see Table 1). HTAP v3 was developed by integrating official inventories over specific areas, including CAMS-REG-ANT v5.1 for Europe, and the EDGAR v6.1 inventory was used for the remaining world regions, with a spatial resolution of 0.1°×0.1°. CAMS-GLOB-ANT combines the EDGAR annual emissions and the Copernicus Atmosphere Monitoring Service TEMPOral profiles (CAMS-TEMPO) on a global scale (Guevara et al., 2021). The emissions of the most recent years are calculated based on the trends from the Community Emissions Data System (CEDS) global inventory (Hoesly et al., 2018). The resolution of CAMS-GLOB-ANT is 0.1°×0.1°. CAMS-REG-ANT v5.1 provide yearly emissions at a spatial resolution of 0.1°×0.05°. We have applied the regional European CAMS-TEMPO profiles (Guevara et al., 2021) to CAMS-REG-ANT v5.1 to obtain the monthly emissions (hereinafter referred to as CAMS-REG-TEMPO). The Dutch registered NH3 emissions are taken from https://www.emissieregistratie.nl (last access: 11 September 2024) and are provided annually at a high resolution of 1 km×1 km. To compare the derived NH3 emissions of DECSO spatially with bottom-up inventories, we aggregate emissions from these bottom-up inventories into the 0.2°×0.2° grid cells of the DECSO working domain.
Table 1Summary of the bottom-up inventories compared to the satellite-derived NH3 emissions from DECSO.
2.4 DECSO
DECSO is an inversion algorithm developed for the purpose of deriving emissions of short-lived species from satellite observations. As such, DECSO has specifically been designed to use daily satellite observations of column concentrations to provide rapid updates of emission estimates of short-lived atmospheric constituents on a regional scale. An extended Kalman filter is used, in which emissions are translated to column concentrations via the CTM, and these are compared to the satellite column observations. Based on that single forward CTM simulation, the sensitivity of concentrations to emissions is calculated by using trajectory analyses to account for transport away from the source. In previous studies, DECSO was applied to NO2 observations from different satellites, including TROPOMI, to estimate NOx emissions (Mijling et al., 2013; Ding et al., 2015, 2022, 2020; van der A et al., 2020, 2024). The studies revealed that the temporal and spatial variability in total surface NOx emissions are captured well by DECSO (Ding et al., 2017a; van der A et al., 2017, 2024; Liu et al., 2018). Here we have used the updated version, DECSO v6.3 (van der A et al., 2024), for estimating NOx and NH3 emissions simultaneously, using the daily observations from TROPOMI and CrIS (referred to as multi-species DECSO). The main changes of v6.3 include improving the sensitivity matrix calculation and using the latest Eulerian regional offline CTM CHIMERE v2020v3 (Menut et al., 2021) instead of CHIMERE v2013. In the CTM, we employ the Copernicus Land Cover 2019 data (Buchhorn et al., 2020) and the source sector distributions of emissions obtained from HTAP v3 of 2018, which are also used as input emissions of other species besides NOx and NH3. CHIMERE is driven by the operational meteorological forecast of the European Centre for Medium-Range Weather Forecasts (ECMWF). Here we present the specific setting in DECSO for NH3 (referred to as DECSO-NH3).
To update NH3 emissions based on the Kalman filter equations, one of the essential calculations is the Kalman gain matrix (K) using the following equation:
Pf is the error covariance matrix of the forecasted emissions at time t. H is the sensitivity matrix (Jacobian) describing how the NH3 column concentration on a satellite footprint depends on gridded NH3 emissions. R is the error covariance combining the observation error of tropospheric NH3 columns, the uncertainty in the CTM, and the representation error introduced by the projection of modelled columns on the satellite footprint.
Pf is parameterized based on an evaluation of the emission forecast error q, which is the error increase during one time step of the forecast model. The emission forecast model is persistent, predicting that the emission is equal to the analysis of the emissions from the previous day. We parameterize q of NH3 following
εabs and εrel are the absolute and relative errors that are the dominating emission errors for low and high emissions respectively.
To determine εabs and εrel, and also the covariance matrix R for NH3, we follow the method described by Ding et al. (2017b) based on the analysis of observation minus forecast (OmF) and observation minus assimilation (OmA). The fitted εabs and εrel are 0.075×10¹⁵ and 0.045. Note that R is the variance of the observation error, the CTM model error, and the representation error. Our analyses showed that the R values are dominated by the satellite observation errors (σobs). The representation error can be neglected. We set the small contribution of model errors in R to 0.5×10¹⁵ molecule cm−2. To capture the quick changes in NH3 emissions during the fertilizing seasons and give more weight to satellite observations with high values during the assimilation, we need to reduce their high observation errors for high values and keep the same observation errors for low values. By fitting NH3 observation errors (σobs) against the observed columns C using all observations in 2020, we find a linear relation:
α is equal to 0.2, and b is equal to 1×10¹⁵ molecule cm−2. If the given σobs is larger than αC+b, we use Eq. (3) for the observation error in R.
We only update NH3 emissions over land, since there are almost no NH3 emissions over oceans and seas.
As we mentioned, NH3 reacts with sulfuric and nitric acid from SO2 and NOx to form PM2.5. The changes in NOx and SO2 emissions will affect the concentration and removal of NH3 in the atmosphere. Inaccurate emissions of NOx and SO2 will therefore affect the inversion of NH3 emissions (Kuttippurath et al., 2024). To assess the sensitivity of NH3 emissions derived with DECSO towards NOx and SO2 emissions, we ran DECSO with different NOx and SO2 emissions (default emissions of HTAP v3 and doubling the emissions of HTAP v3 for SO2 and NOx) as input for the CTM. The results show that the inversion of NH3 emissions is not sensitive to the change in SO2 emissions but that it is sensitive to NOx emissions. In Europe, the impact of SO2 emissions on NH3 can be neglected nowadays due to the low SO2 emissions (Luo et al., 2022), which were reduced by 80 % in 2020 compared to 2005 (EEA, 2023). The sensitivity tests indicate that up-to-date NOx emissions are very important for the accurate inversion of NH3 emissions. The monthly NOx emissions of HTAP in 2018 and those derived with DECSO in 2020 are quite different over the various countries (Fig. S3 in the Supplement). In 2020, due to the COVID-19 pandemic, NOx emissions reduced compared to other years. Van der A et al. (2024) compared the seasonality of NOx emissions of DECSO to other bottom-up inventories and showed that the individual temporal variability in industrial facilities is derived with DECSO in Europe, while bottom-up inventories use the same temporal profile per country per sector and no detailed information on the temporal changes of individual sources. We simultaneously estimate NH3 and NOx emissions with DECSO (the multi-species DECSO) from CrIS and TROPOMI on a daily basis. We use the DECSO-NH3 version to estimate only NH3 emissions from CrIS and use NOx emissions of HTAP v3 as input for the CTM. Figure 1 shows the difference in monthly NH3 emissions in three countries (Netherlands, Italy, and Greece) derived with the multi-species DECSO version and the DECSO-NH3 version. The derived NH3 emissions all differ largely (up to ±40 %) in winter and less in summer.
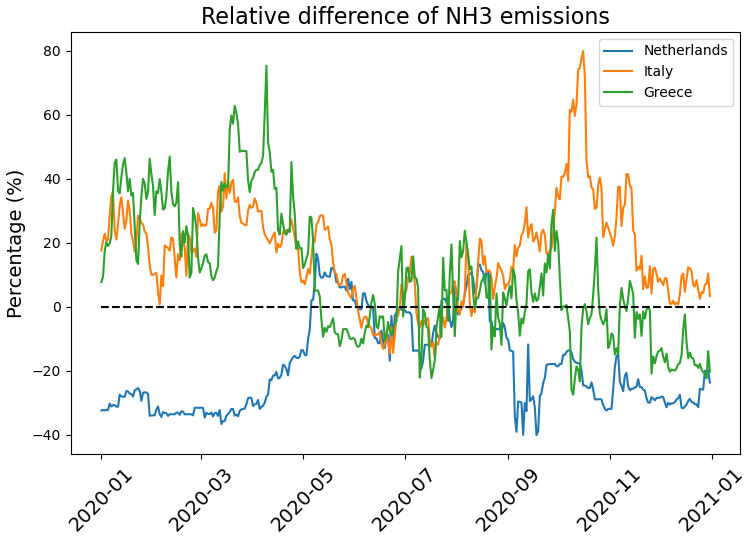
Figure 1The relative difference (multi-species DECSO minus DECSO-NH3) in NH3 emissions between multi-species DECSO and DECSO-NH3. DECSO-NH3 means that only NH3 emissions are derived with CrIS-NOAA-20, and multi-species DECSO means that NH3 and NOx emissions are derived using CrIS-NOAA-20 and TROPOMI observations.
3.1 NH3 emissions in Europe
We have run the multi-species DECSO version with NH3 observations from CrIS-NOAA-20 and CrIS-SNPP respectively to estimate NH3 emissions over the selected domain of Europe in 2020 (Fig. 2), which is the only year with a full-year overlap of NH3 observations for these two satellites. The total NH3 emissions over the study domain are 8.0 Tg yr−1 from SNPP and 8.1 Tg yr−1 from NOAA-20. The spatial distribution of the NH3 emissions derived from the two satellites agrees well, with small differences (with a relative root-mean-square difference of 1.2 %) resulting from deviations in the observed NH3 columns. The spatial distribution of high NH3 emissions derived from DECSO is similar to that of HTAP, CAMS-REG-ANT, and CAMS-GLOB-ANT but with more local-scale variability and hotspots. The total emissions of DECSO over the European domain are higher than HTAP (4.2 Tg yr−1), CAMS-REG-ANT (4.0 Tg yr−1), and CAMS-GLOB-ANT (5.9 Tg yr−1)
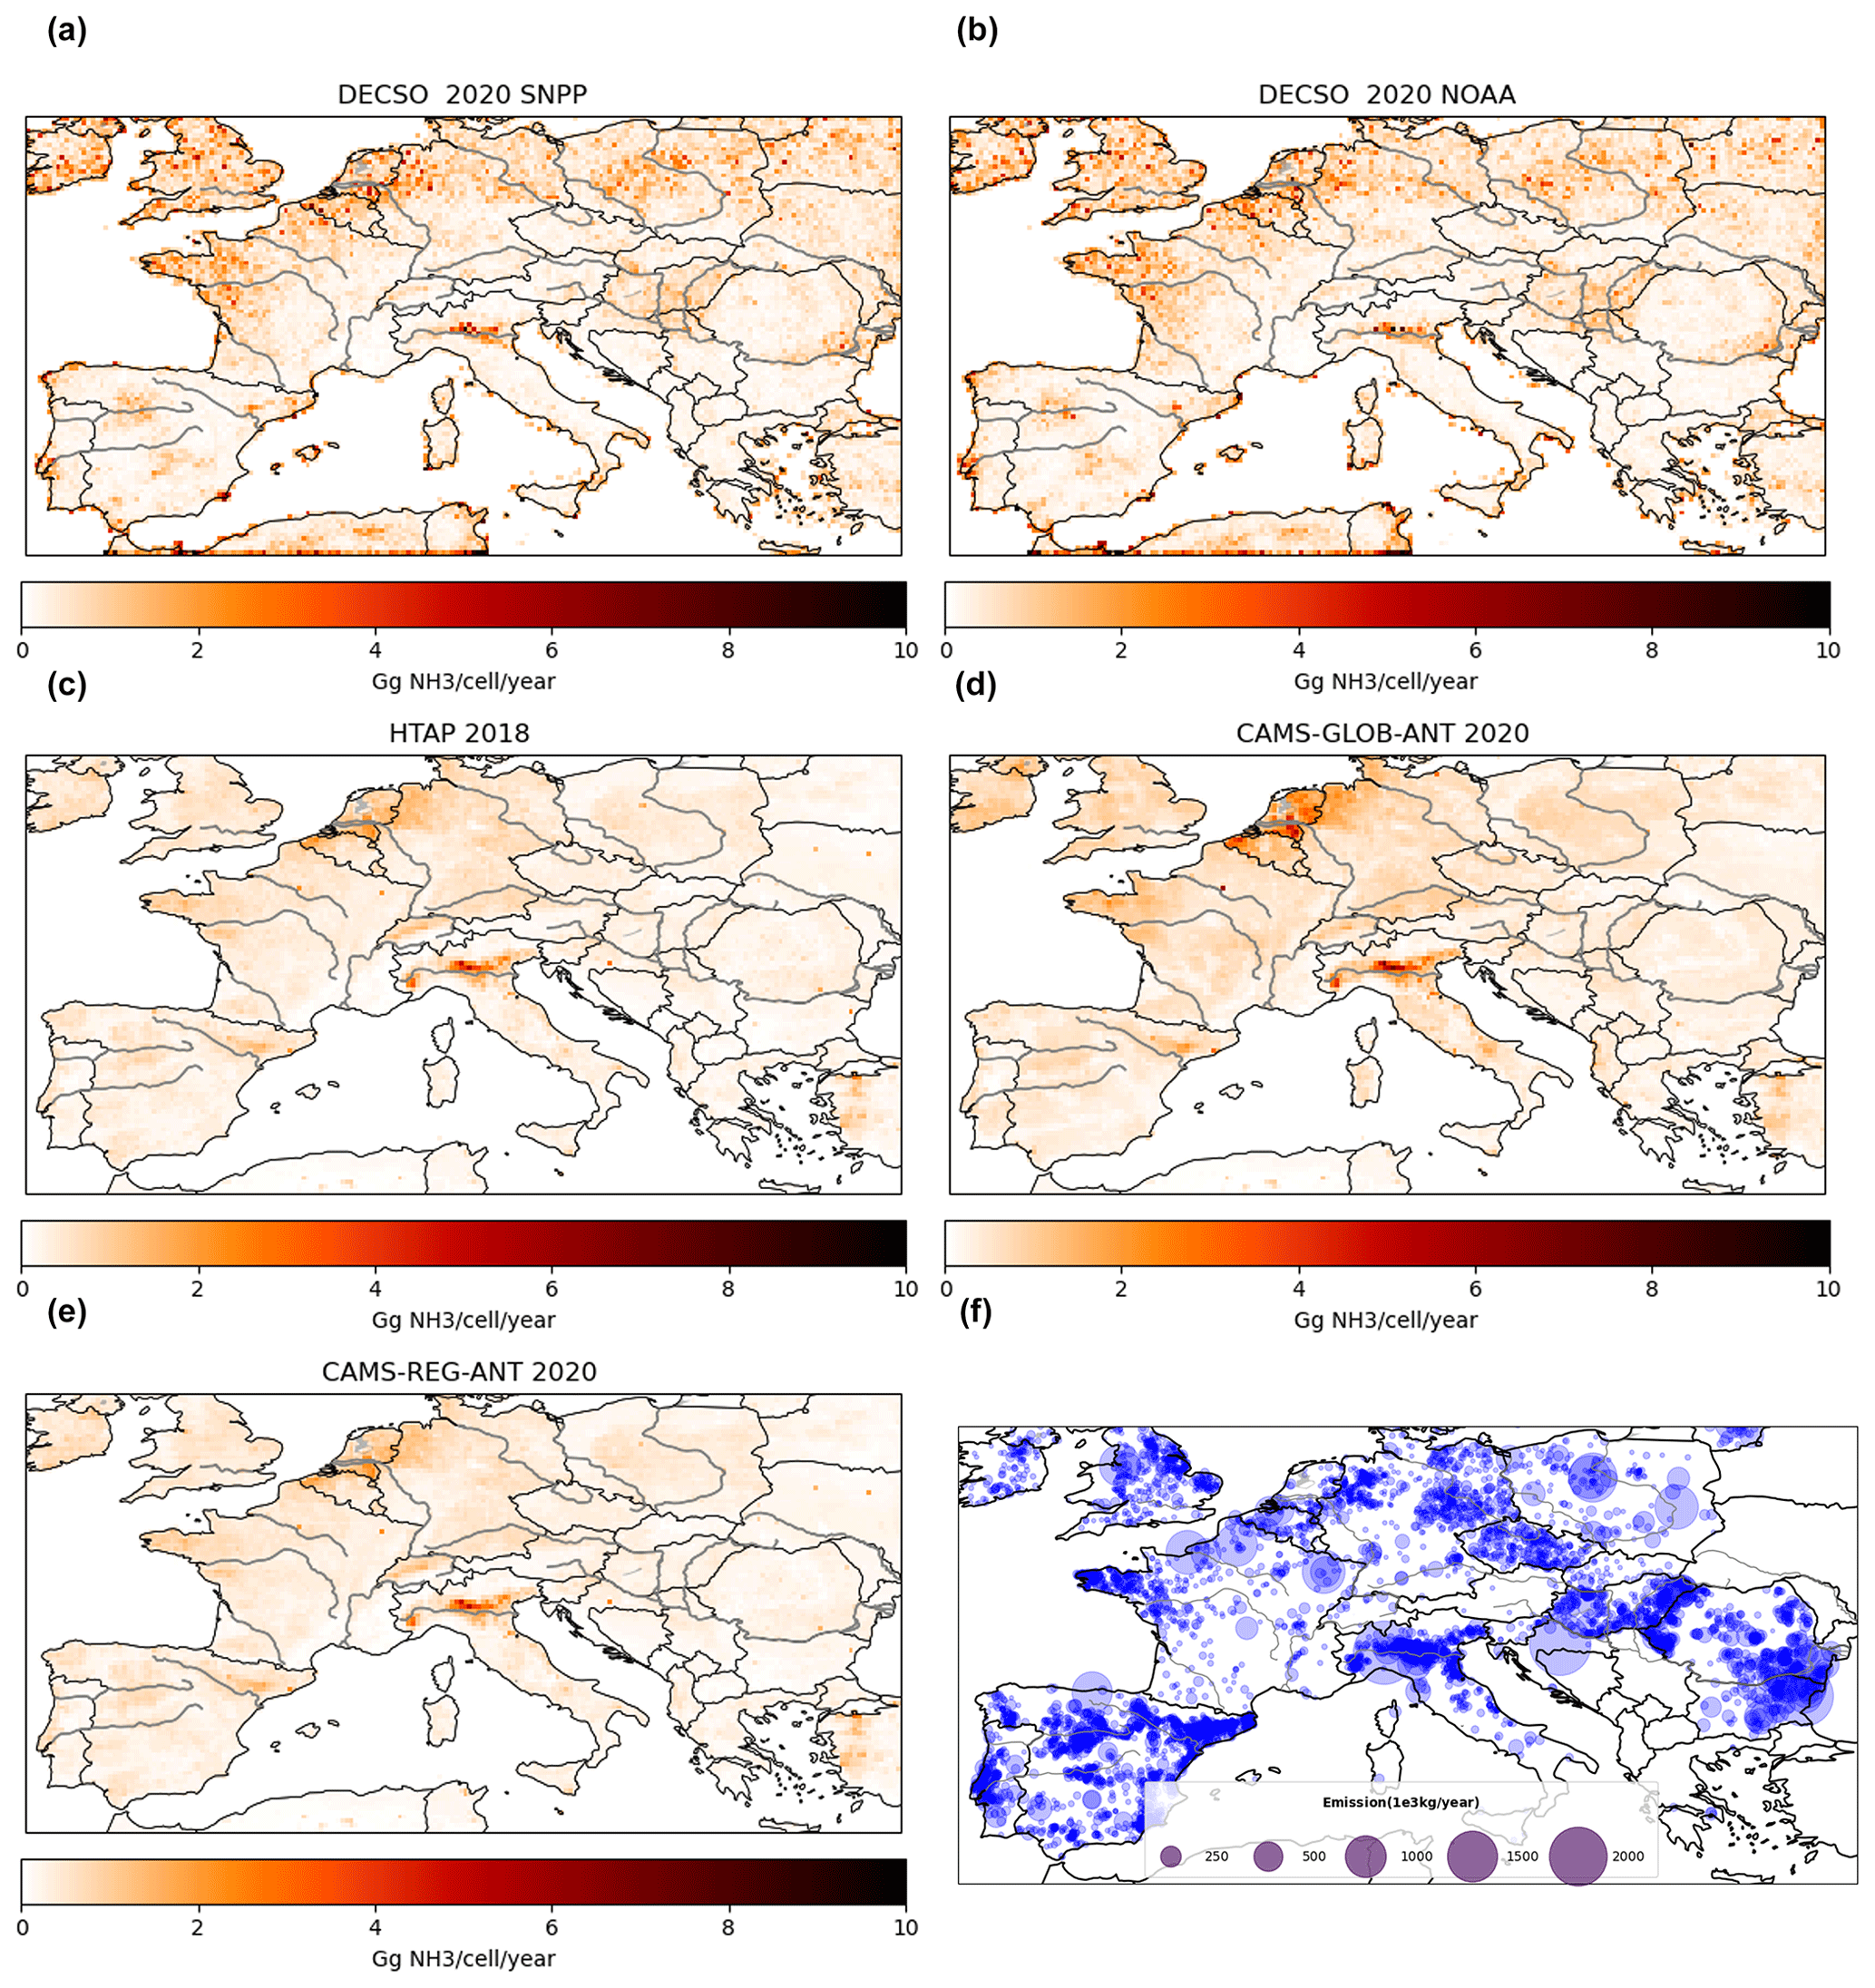
Figure 2NH3 emission maps. NH3 emissions derived with DECSO from (a) SNPP and (b) NOAA-20 in 2020. NH3 emissions of (c) HTAP in 2018, (d) CAMS-GLOB-ANT in 2020, and (e) CAMS-REG-ANT in 2020. (f) The registered point sources of E-PRTR in 2017.
The locations of high NH3 emissions shown in DECSO, especially in the Po Valley, Spain, Hungary, and eastern Romania, are highly correlated to the registered NH3 point sources of E-PRTR, which are from industrial facilities, including livestock facilities, but not from fertilizer applications. We see that emissions from the Netherlands are high in DECSO and in the bottom-up inventories but are missing in the database of E-PRTR. For the countries in eastern Europe (e.g. Poland, Hungary, Romania), the NH3 emissions derived with DECSO are much higher than those derived from bottom-up inventories. To assess the NH3 emissions per country, we calculated the country total emissions (see Fig. 3). The correlation coefficients of country totals from DECSO with the bottom-up inventories are all higher than 0.95. In general, the country totals of NH3 emissions derived by DECSO from either NOAA-20 or SNPP are comparable to HTAP, LRTAP, CAMS-REG-ANT, and CAMS-GLOB-ANT, with DECSO about 30 % higher. HTAP, LRTAP, and CAMS-REG-ANT have very similar emissions per country, while CAMS-GLOB-ANT shows higher emissions than the other three bottom-up inventories. Because HTAP v3 uses annual emissions from CAMS-REG-ANT for Europe, the only difference between HTAP v3 and CAMS-REG-ANT is the difference in year. The input of CAMS-REG-ANT is mainly based on LRTAP. CAMS-GLOB-ANT is based on EDGAR and uses different emission activities and factors compared to the other three bottom-up inventories. In northern Europe (for example, the Netherlands and Germany), DECSO results show lower NH3 emissions than those of CAMS-GLOB-ANT but higher than those of HTAP, LRTAP, and CAMS-REG-ANT.
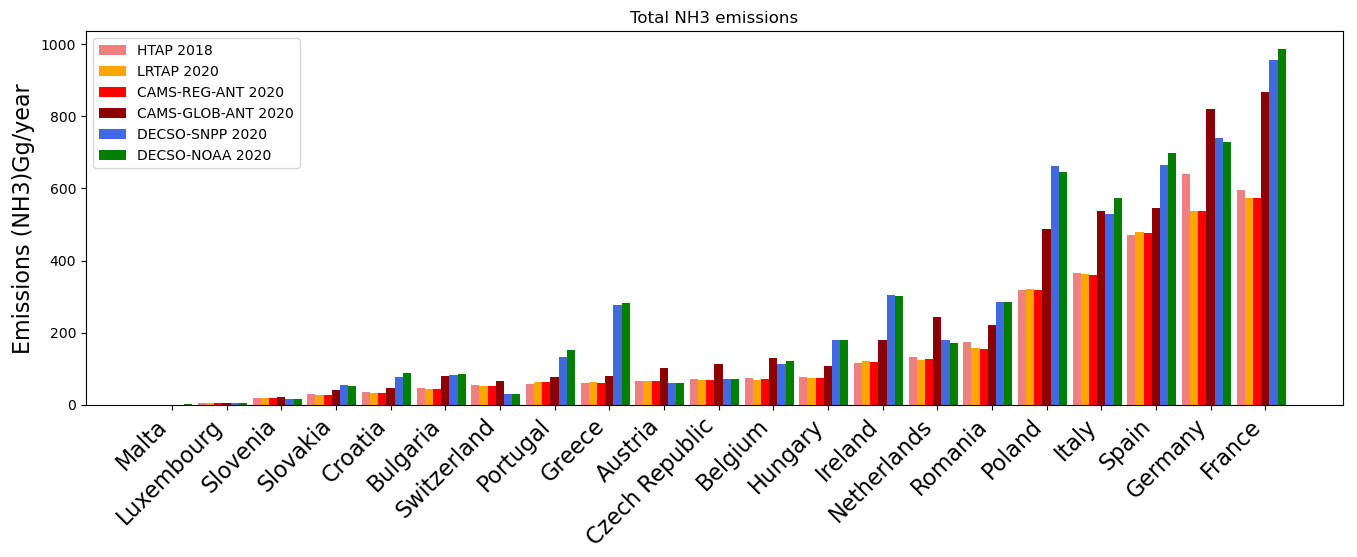
Figure 3Country totals of NH3 emissions (Gg yr−1) according to LRTAP in 2020, HTAP in 2018, CAMS-REG-ANT in 2020, CAMS-GLOB-ANT in 2020, and the DECSO calculations from SNPP and NOAA-20 in 2020.
To analyse the seasonality of NH3 emissions derived from DECSO, we compare the monthly emissions of DECSO with bottom-up inventories. Figure 4 shows the monthly NH3 emissions from DECSO, HTAP, CAMS-REG-TEMPO, and CAMS-GLOB-ANT of the Netherlands, Spain, France, and Poland. We see that the seasonal cycle of NH3 emissions derived with DECSO is closer to CAMS-GLOB-ANT. HTAP shows the exact same monthly variability for each country. CAMS-REG-TEMPO shows very similar monthly patterns to the ones reported by CAMS-GLOB-ANT, as they both use the same method to derive the temporal profiles for livestock and agricultural soil emissions (Guevara et al., 2021). In the Netherlands, as an example for northern Europe, the monthly NH3 emissions of DECSO are lower than those of CAMS-GLOB-ANT but very close to those of CAMS-REG-ANT. Two peaks in NH3 emissions show up in April and August for CAMS emissions. This is also confirmed by the monthly surface concentrations measured by the MAN network (Fig. S4 in the Supplement). In Spain and France, the monthly emissions of DECSO are comparable to CAMS-GLOB-ANT. In eastern European countries such as Poland, DECSO estimates higher emissions. Note that, in spring, when the NH3 emissions are high due to fertilizer applications on farms, the NH3 emissions derived with DECSO can suffer from a time lag due to insufficient observations (e.g. due to cloudiness; see Fig. S5 in the Supplement).
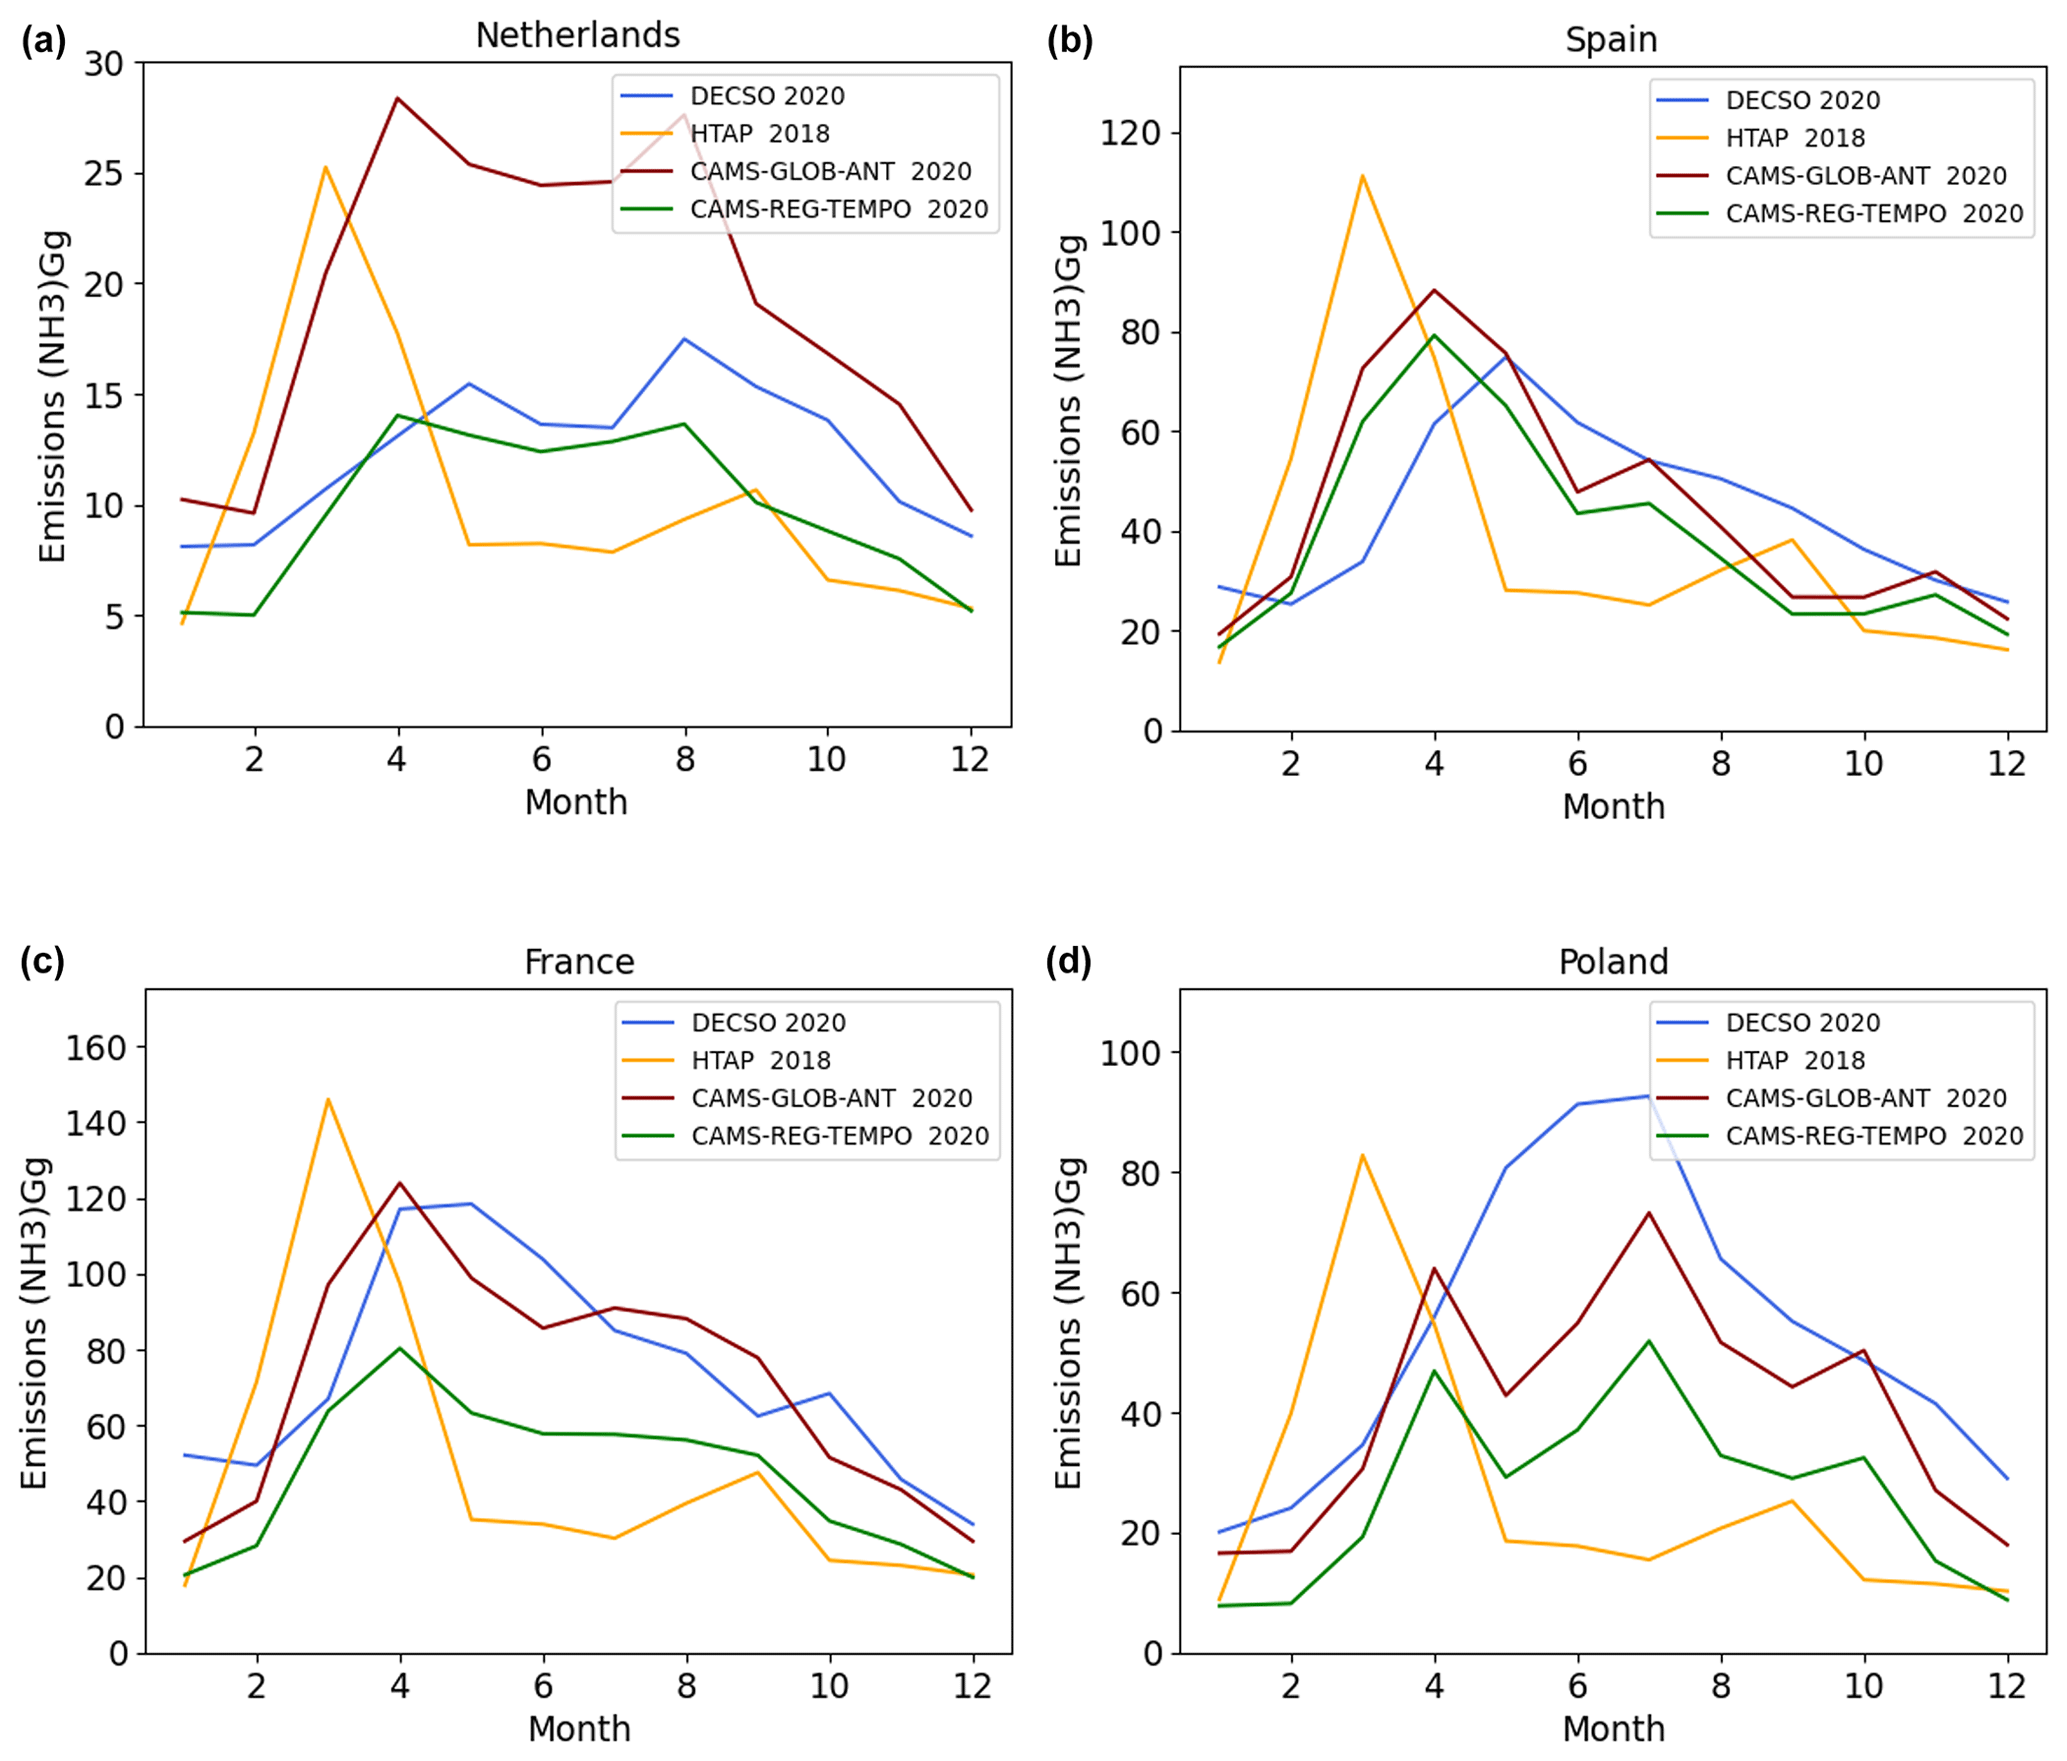
Figure 4Monthly NH3 emissions (Gg month−1) of DECSO in 2020, HTAP in 2018, CAMS-REG-TEMPO in 2020, and CAMS-GLOB-TEMPO in 2020 for (a) the Netherlands, (b) Spain, (c) France, and (d) Poland.
3.2 Emissions in the Netherlands
In the emission maps in Fig. 2, we see that the Netherlands and the Po Valley have the highest emission intensity of NH3. In this section, we focus our analysis on the Netherlands, since it has the densest network for monitoring surface NH3 concentrations and also a detailed emission inventory at a very high spatial resolution. The total emissions from the Netherlands estimated by the two satellites are very similar (Fig. 3), but the spatial distributions show significant differences (Fig. S6 in the Supplement). One possible reason is that about 10 % more observations were available from NOAA-20 than from SNPP in 2020 (see Fig. S7 in the Supplement). In general, the number of valid observations is low at high latitudes (Fig. S8 in the Supplement). More observations allow the detection of fast changes in NH3 emissions from day to day. By averaging the emissions, the information from both satellites is combined and the quality of the derived emissions is improved due to the number of observations being doubled. We use the average of the results of DECSO-SNPP and DECSO-NOAA-20 to obtain a better spatial distribution of NH3 emissions derived from satellite observations.
We compare the total NH3 emissions of DECSO with CAMS-GLOB-ANT, HTAP, and the official national NH3 emissions of the Netherlands, which are 148, 230, 122, and 123 Gg yr−1 respectively. DECSO is lower than CAMS-GLOB-ANT but higher than HTAP and the official NH3 emissions of the Netherlands. Figure 5 shows the spatial distribution of each inventory in the Netherlands. We see that DECSO captures the high-emission areas and regional distribution over the country. The correlation coefficients of the spatial distribution of NH3 emissions between DECSO and the national emissions of the Netherlands, HTAP v3, and CAMS-GLOB-ANT are 0.87, 0.87, and 0.88 respectively. At the resolution of the individual DECSO grid cells, 0.2°×0.2°, the emission patterns show differences. This may be due to uncertainties in the location of the emissions and displacements by up to one grid cell, similar to those of NOx emissions (van der A et al., 2024). For example, the emission sources at the edge of grid cells can be spread to the neighbouring grid cells.
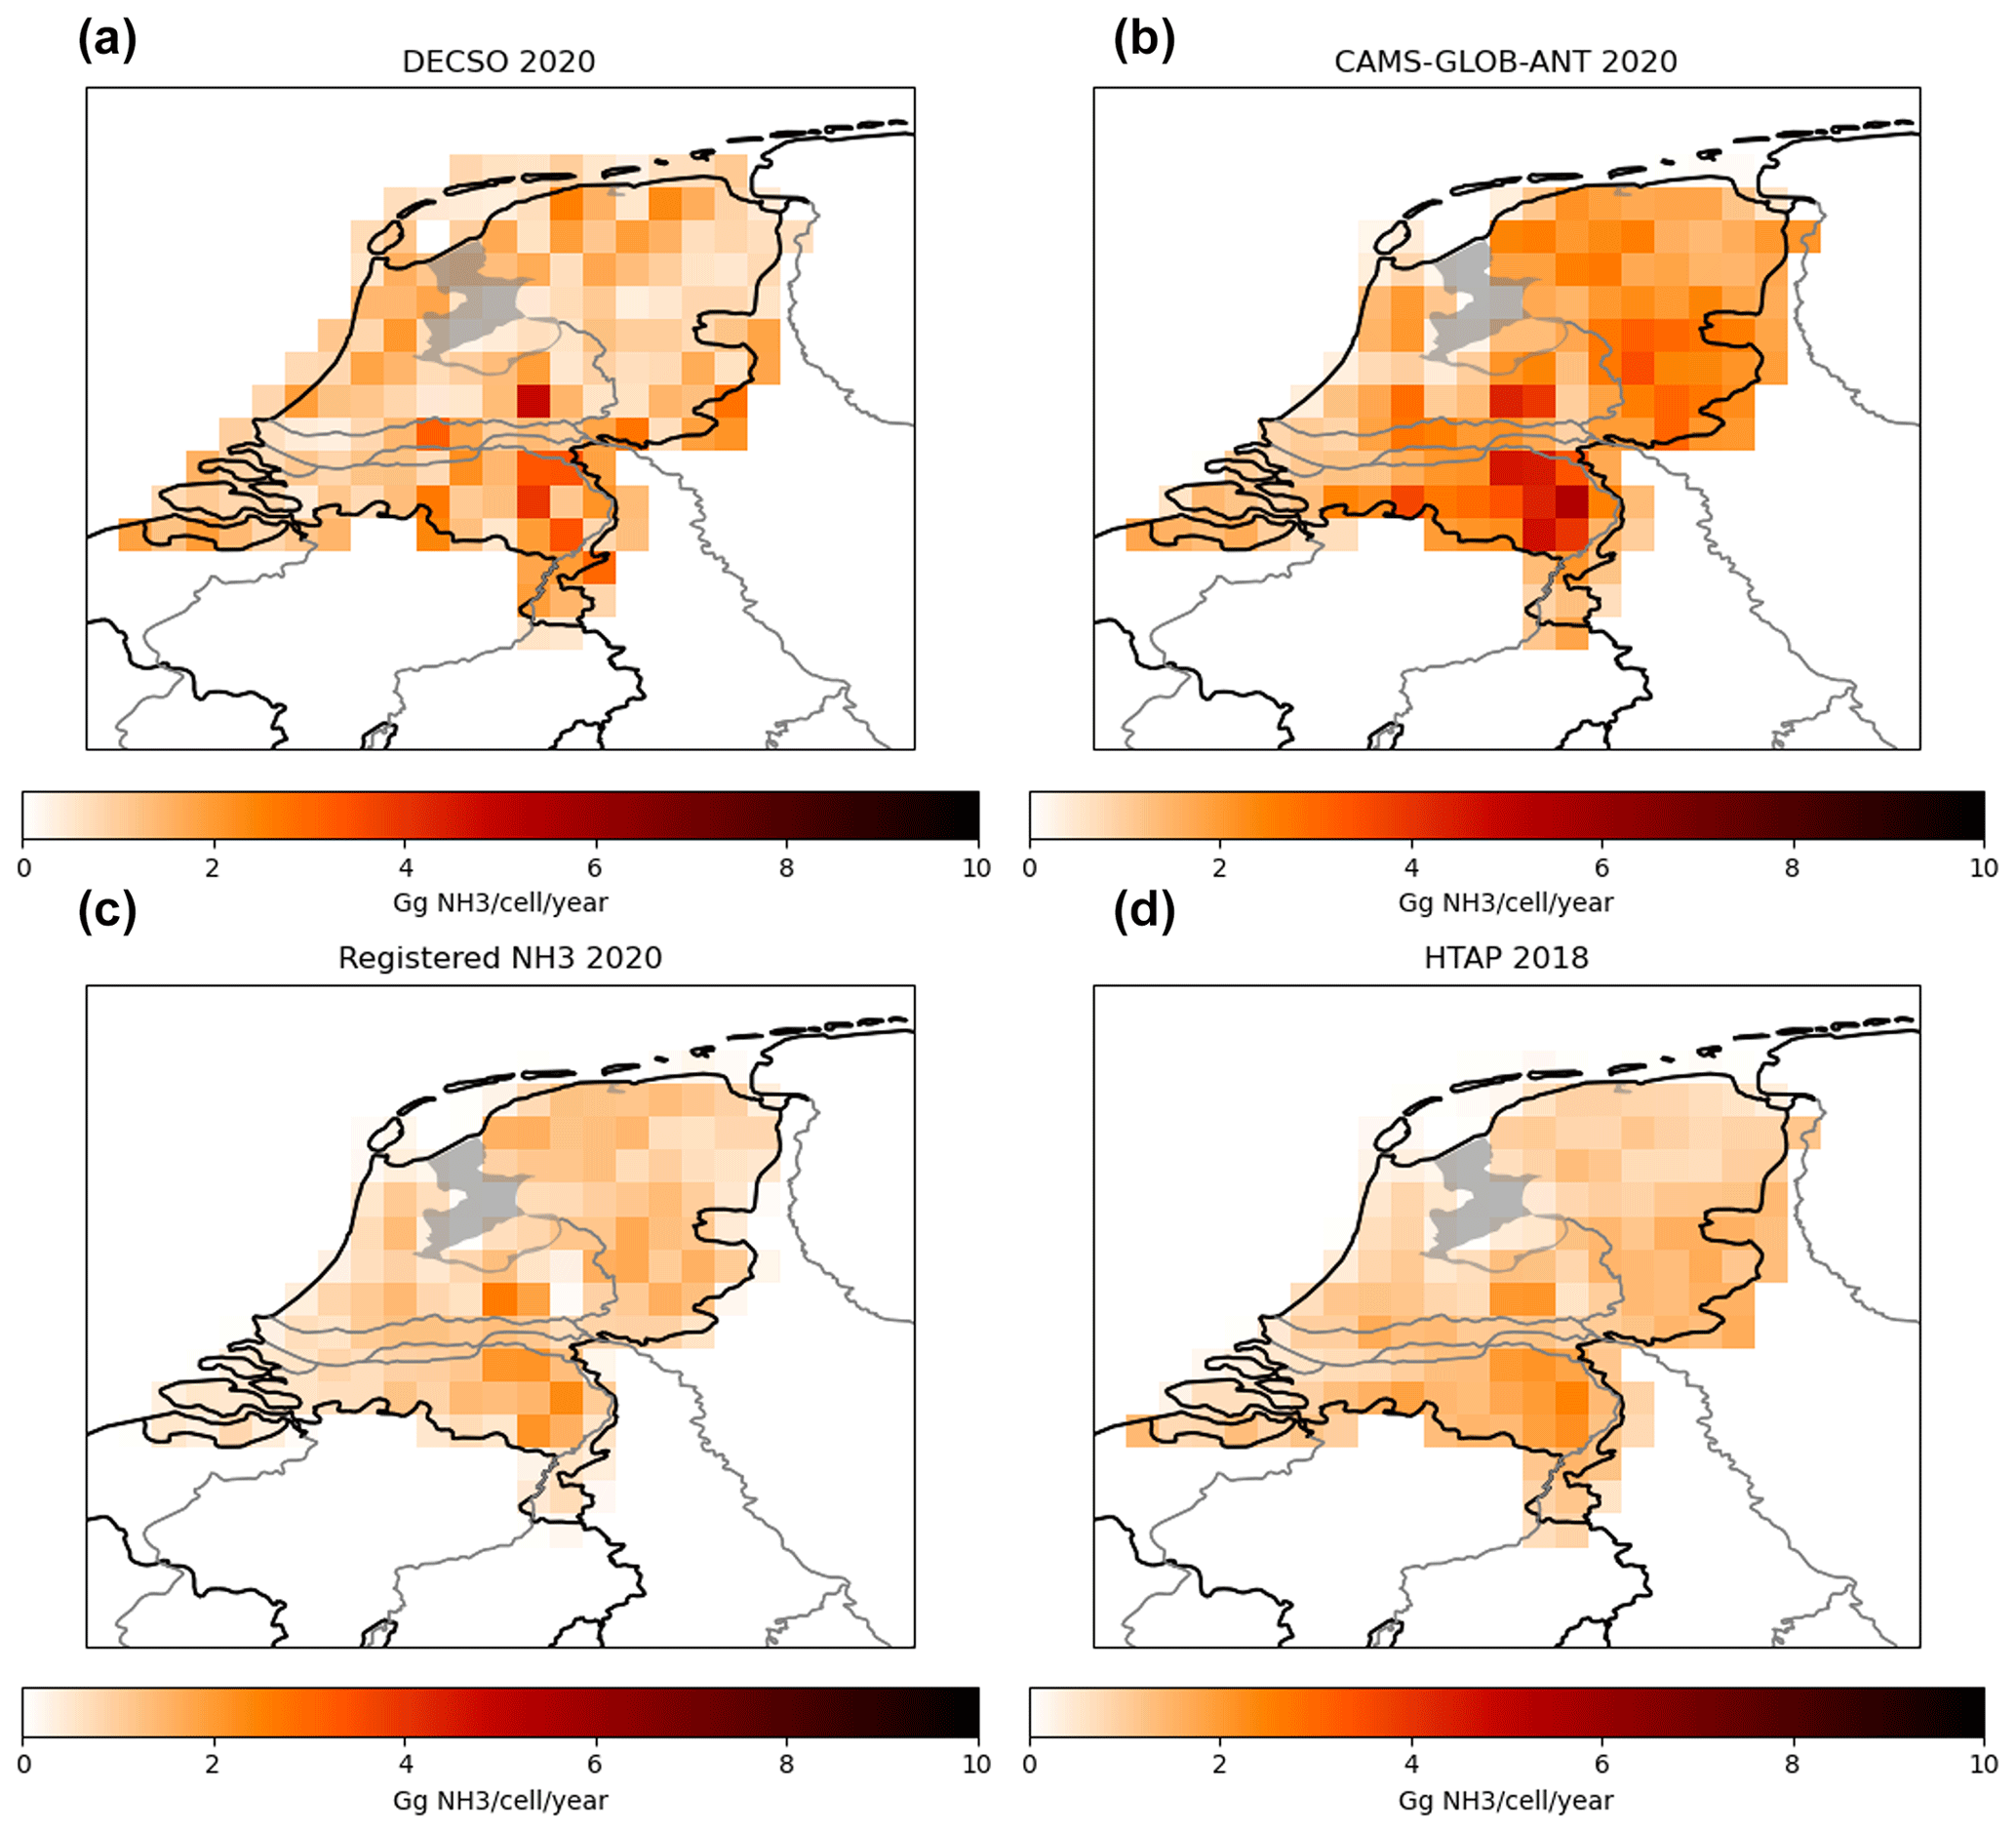
Figure 5NH3 emissions in the Netherlands. (a) The averaged NH3 emissions derived with DECSO from SNPP and NOAA-20. (b) NH3 emissions of CAMS-GLOB-ANT in 2020. (c) The official national NH3 emissions for the Netherlands in 2020 (from emissieregistratie.nl). (d) NH3 emissions of HTAP in 2018.
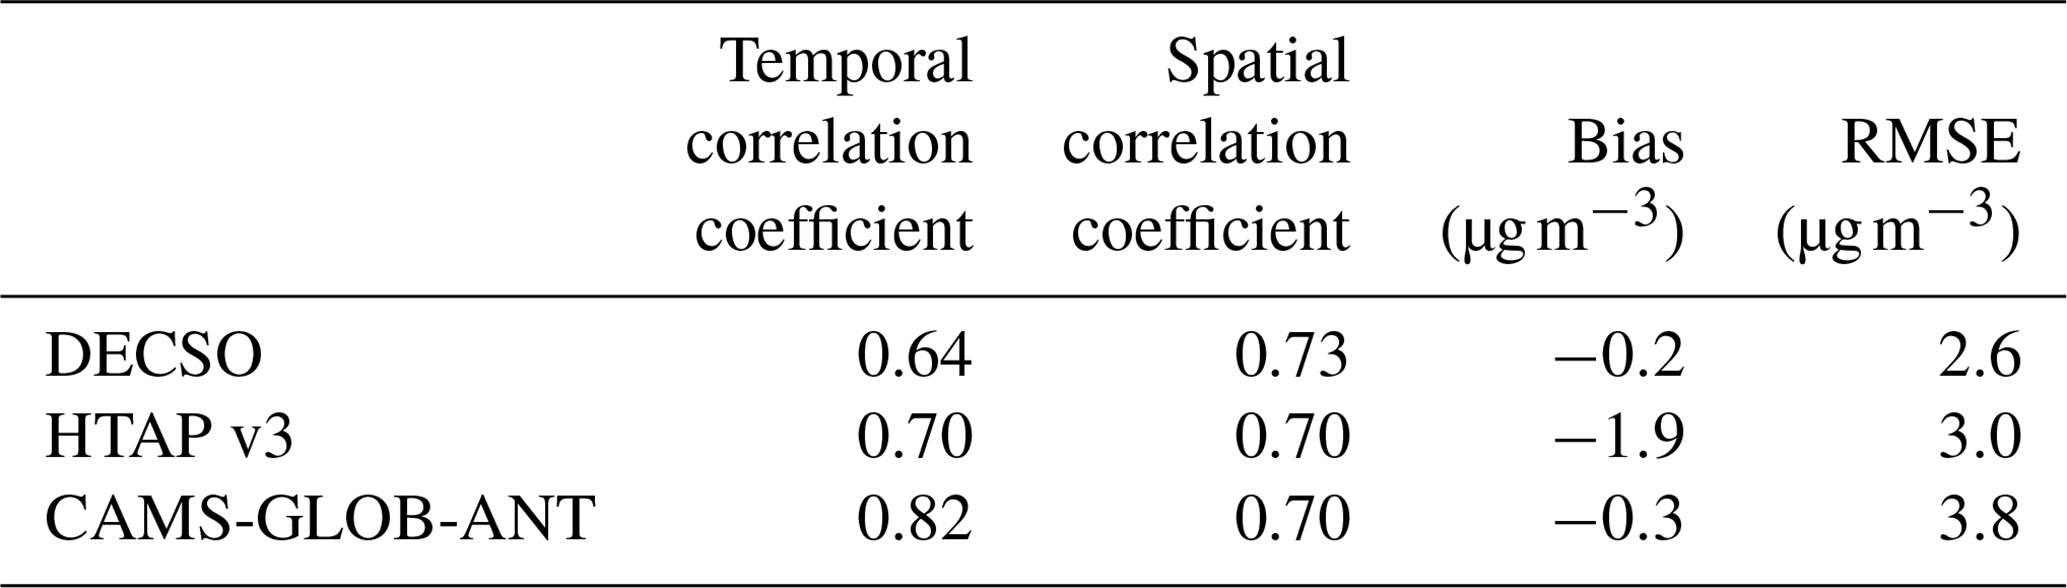
To further assess the DECSO results using in situ observations from the LML and MAN networks in the Netherlands, we conducted three runs of CHIMERE for the year 2020 using NH3 emissions from DECSO in 2020, HTAP in 2018, and CAMS-GLOB-ANT in 2020 over the European domain (same as the setup of DECSO). To compare this to the surface NH3 measurement from the MAN network, we calculated the monthly average of surface NH3 concentrations from the model simulations. Figure 6a–c show the scatter plots of monthly NH3 concentrations of model simulations against observations for the whole year. We see that modelled NH3 concentrations with the HTAP emissions are underestimated and that those with the CAMS-GLOB-ANT emissions are overestimated compared to in situ observations. The modelled NH3 concentrations with DECSO emissions have the lowest absolute bias (modelled concentration minus in situ observations of the MAN network) (Fig. 7). The performance of model simulations is better in summer months (April–September) than in winter months (October–March). In winter months, few cloud-free satellite observations are available for the Netherlands. For DECSO, the scatter plot looks more spread out than in summer months (Fig. 6d–i). In summer months, the NH3 concentrations with CAMS-GLOB-ANT are largely overestimated and those with HTAP are largely underestimated, while DECSO has a lower bias compared to the other two. Note that, in the grid cells, the number of stations can vary from 1 to 16. If we select grid cells with more than three sites, DECSO shows better spatial correlation with in situ observations and lower bias than the other two inventories do (Fig. 7 and Table 2).
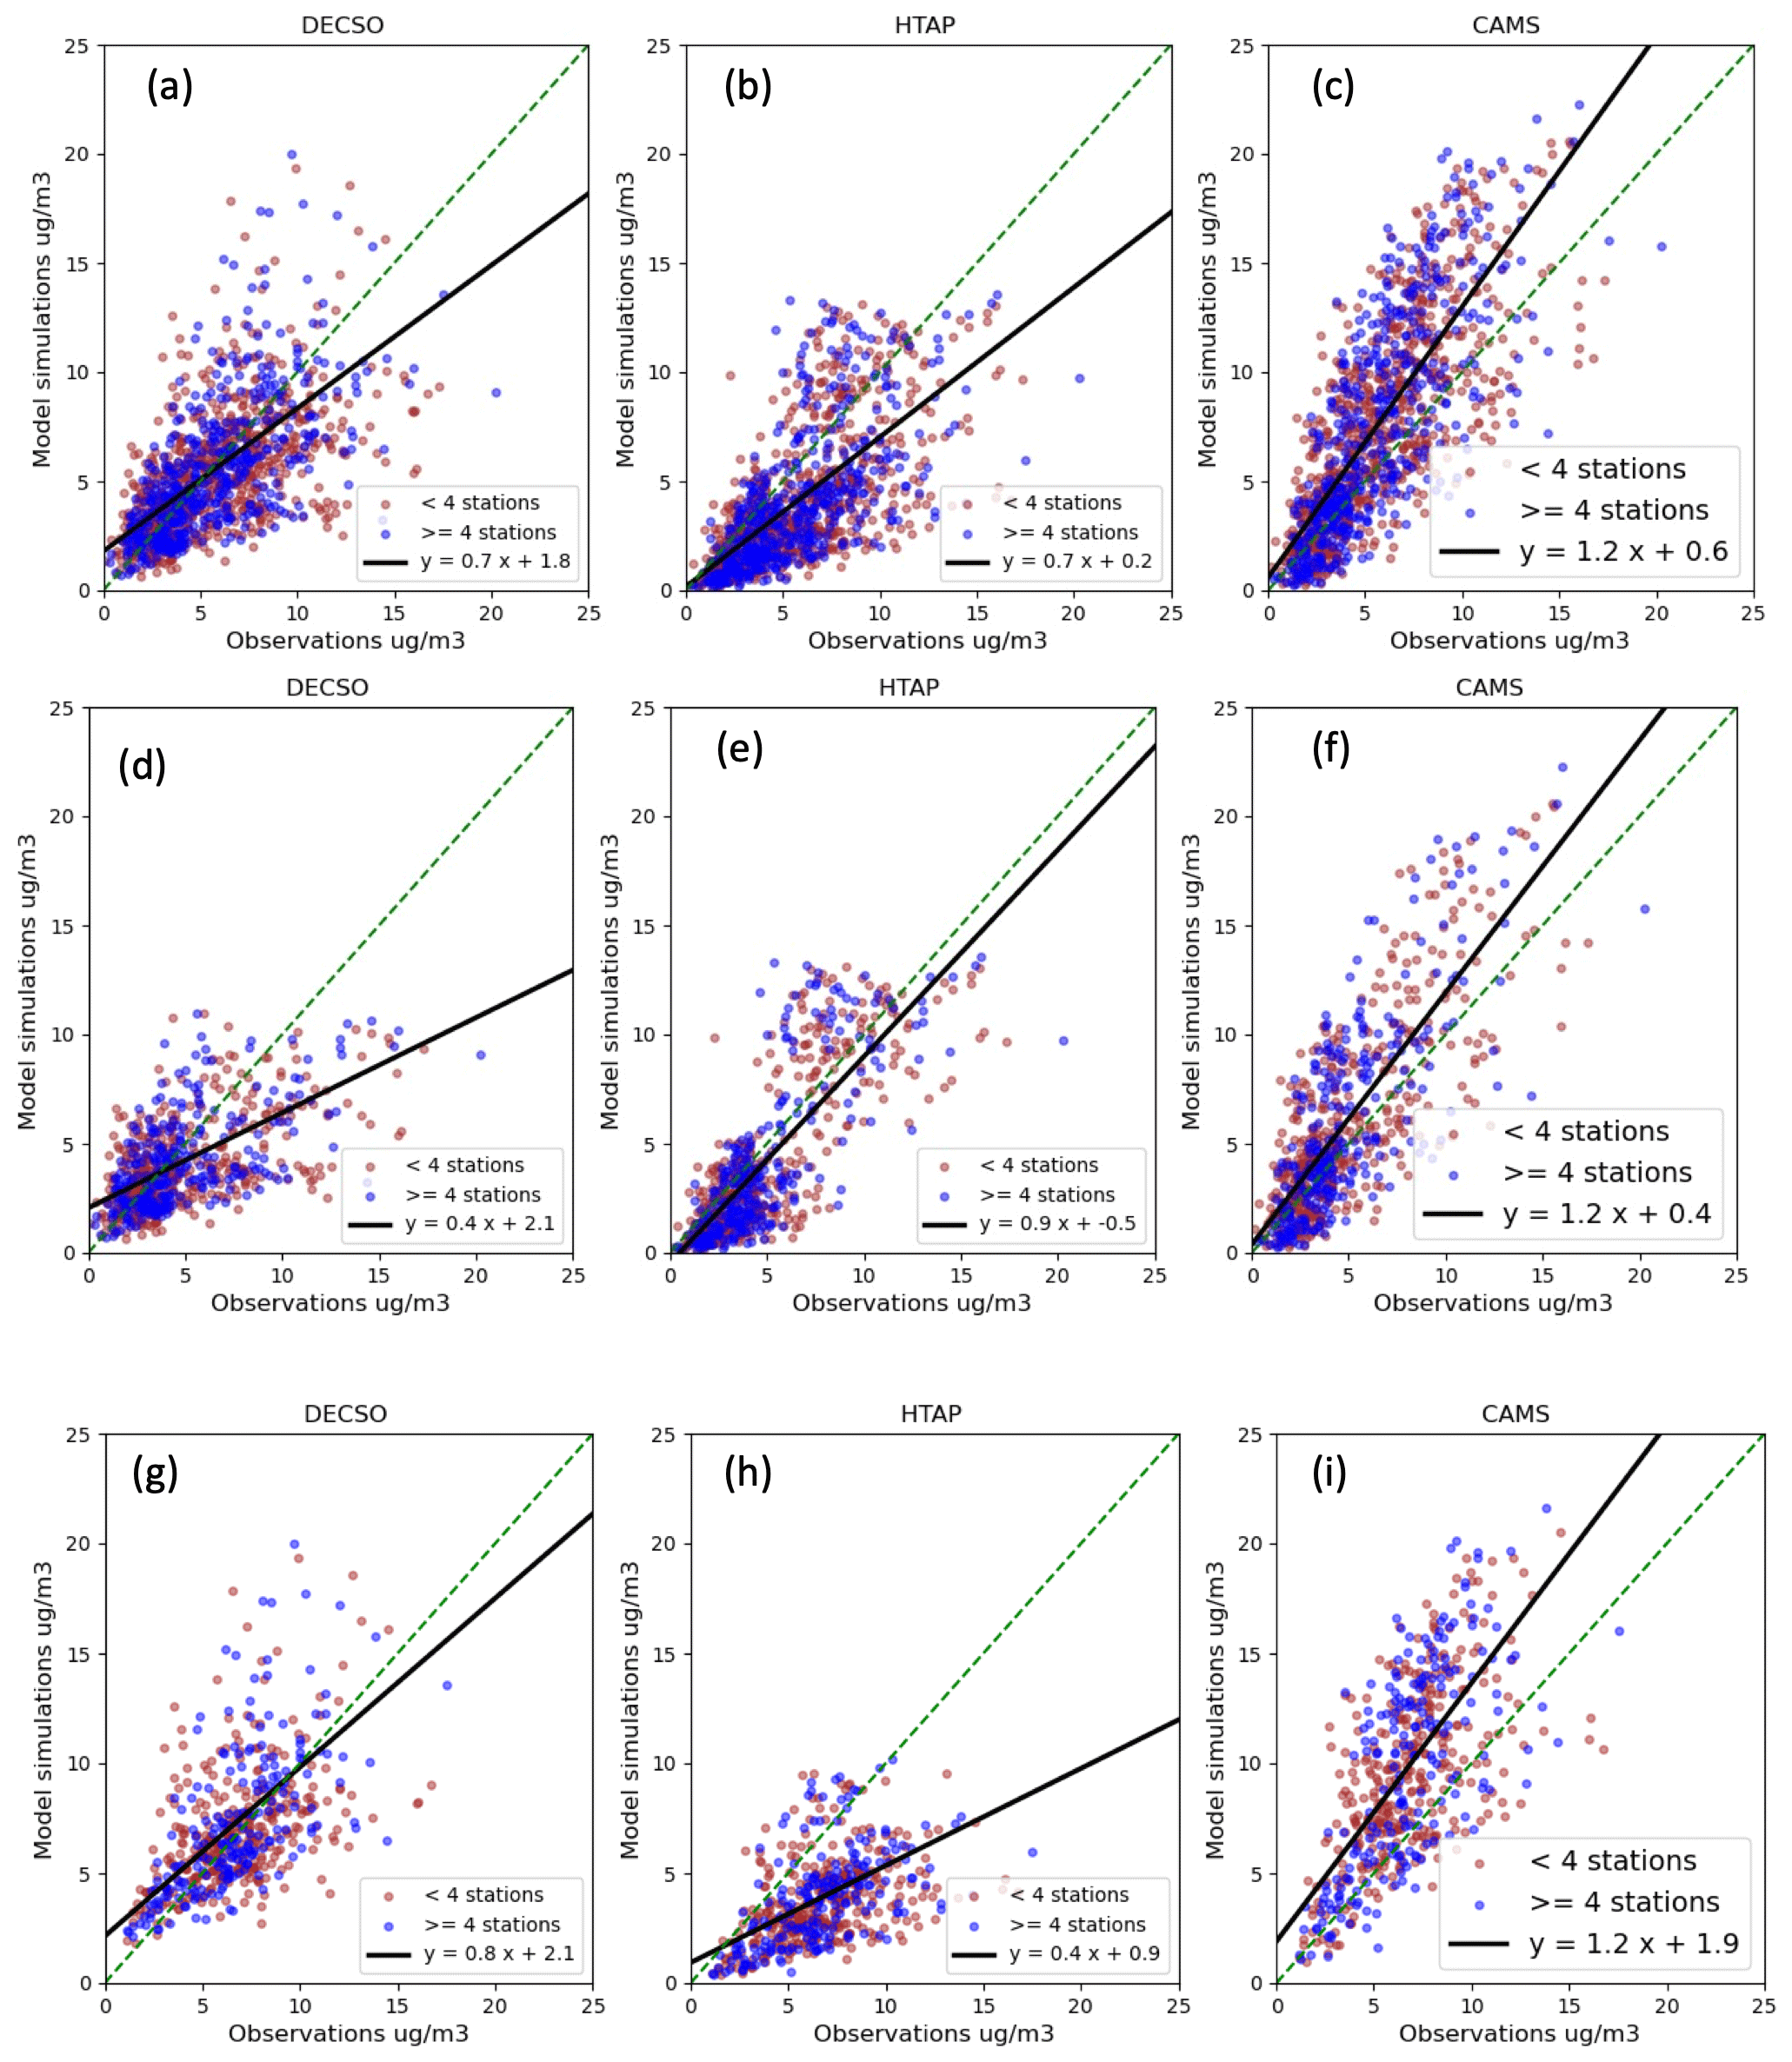
Figure 6Scatter plots of observations from the MAN network with NH3 surface concentrations from model simulations with NH3 emissions from DECSO (a, d, g), HTAP (b, e, h), and CAMS-GLOB-ANT (c, f, i). (a–c) The scatter plot of data for the whole year for all sites. (d–f) The scatter plot of the data in winter months (October to March). (g–i) The scatter plot of the data in summer months (April to September). Each point presents the model grid cells with in situ observations. The red dots mean there are fewer than four in situ sites in each grid cell. The blue dots mean there are at least four in situ sites in each grid cell. The fitted black line is for grid cells with at least four in situ sites.
Table 2The spatial and temporal correlation coefficients and the bias of monthly mean simulated NH3 surface concentration using DECSO, HTAP, and CAMS-GLOB-ANT NH3 emissions against observations of the MAN network for grid cells with more than three measurement locations.
The LML network has six sites measuring surface NH3 concentrations, which are provided every hour. Since the difference in our model simulations is only due to the monthly input emissions of NH3, we calculate monthly average NH3 observations for the six sites to compare with the modelled monthly averaged concentrations. The comparison shows that the model simulations using the DECSO NH3 emissions have perform similarly to bottom-up inventories (Figs. S9 and S10 in the Supplement). The correlations of modelled monthly NH3 concentration using DECSO and CAMS-GLOB-ANT emissions with the observations from the LML network are better than those of HTAP, while CAMS-GLOB-ANT has the lowest bias. Based on these six sites, the comparison shows that the model result using DECSO is very comparable with that using CAMS-GLOB-ANT.
3.3 Uncertainties and bias in NH3 emissions
One advantage of DECSO is that 1 standard deviation of derived emissions is also calculated per grid cell on a daily basis according to the Kalman filter equations. As described by van der A et al. (2024), the derived errors in the emissions are correlated in time, linked to the assumption of the persistent emission forecast model. The autocorrelation effects can be neglected after about 1 week up to 10 d. We follow the autocorrelation function presented by van der A et al. (2024) to calculate the monthly variance in NH3 emissions. The monthly variance in NH3 emissions for each grid cell in the study domain varies from 17 % to 58 %. For the Netherlands, the precision (random uncertainty) of the monthly emissions is about 20 % and the precision of the annual total is about 5 %.
A bias in satellite-derived emissions can be introduced due to the linearization of the averaging kernels (Sitwell et al., 2022). The CrIS ammonia observations are retrieved in logarithm space together with logarithmic averaging kernels. As discussed by Sitwell et al. (2022), using either the logarithmic averaging kernel or the linearized averaging kernel introduces a bias when applying them to the model-simulated profiles. The logarithmic averaging kernels cause problems when the model profiles are zero at any point in the profile and lead to a positive bias in emission estimates. Linearized averaging kernels may introduce a negative bias in emissions when there is a large difference between the model profile and the a priori profile used in the retrieval.
To assess how the biases in satellite NH3 observations affect emissions derived by DECSO, we conduct two simple bias tests. For the first test, the NH3 columns of CrIS on NOAA-20 are increased by 20 %, a positive relative bias for the satellite observations. The annual emissions of NH3 with the introduced bias increase by 27 % for the European domain. It seems that the introduced bias has a higher impact on emissions in winter than in summer. The relative bias on emissions can be as high as 50 % in winter. The change in emissions in summer even becomes negative, probably because NH3 column concentrations can show a large variation from day to day. When the NH3 columns are very high on one day and then drop to a very low value, the absolute change in concentration is larger than the original situation without introduced bias. This will lead to a larger decrease in the updated emissions and can result in a negative change in emissions. For the second test, an absolute bias of 5×10¹⁵ molecule cm−2 is added to each NH3 column observation of CrIS on NOAA-20. Figure 8 shows the increase in NH3 emissions caused by the absolute bias introduced in the satellite observations. We see that the increase is doubled in winter compared to summer because the lifetime in winter is longer than in summer. The averaged effective lifetime calculated with DECSO is about 10 h in winter and 5 h in summer. With the same bias in NH3 columns, the impact on emissions is larger in winter than in summer.
To derive NH3 emissions from satellite data, we presented an updated version of the DECSO algorithm with specific settings for NH3. Together with the improved DECSO version for NOx of van der A et al. (2024), we used the multi-species DECSO version to update NOx and NH3 emissions simultaneously. In general, the removal of NH3 in the atmosphere is affected by the amount of NOx and SO2 emissions. For the study domain of Europe, our sensitivity study shows that the influence of changes in NOx emissions needs to be considered in the inversion of NH3 emissions in DECSO. The impact of SO2 emissions is very small and can be neglected, since the SO2 emissions are usually low in Europe. Thus, to derive NH3 emissions and to analyse the seasonal cycle and trend in NH3 emissions from satellite observations over Europe, it is recommended to include updated NOx emissions in the inversion calculation of NH3 emissions in DECSO. For regions with high SO2 emissions, it is necessary to consider if the SO2 emissions are changing rapidly and are up to date in the inversion.
The error covariances of the updated daily NH3 emissions per grid cell are provided during the calculation in DECSO. Considering the autocorrelations introduced by the assumption of the persistency emission model, the calculated monthly error in NH3 emissions for each grid cell in the study domain varies from 17 % to 58 %. The yearly error per grid cell is about 5 %–15 %. The sensitivity tests for retrieval biases show that, with an introduced constant relative and absolute bias in NH3 retrievals, the resulting bias in emissions derived with DECSO shows a seasonal variability with a peak in winter. This means the algorithm is more sensitive to a bias in the observations during wintertime.
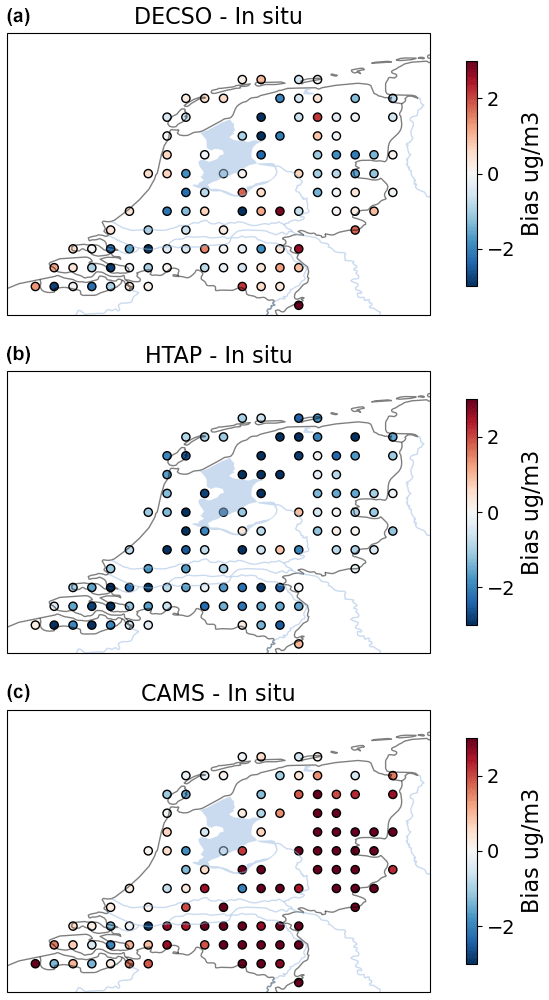
Figure 7Bias in the model-simulated surface concentrations with NH3 emissions from DECSO (a), HTAP (b), and CAMS-GLOB-ANT (c) compared to the in situ observations from the MAN network.
The total NH3 emissions in our European domain, derived from NH3 observations of SNPP and NOAA-20, are 8.0 and 8.1 Tg yr−1 respectively, with a precision of about 5 %–17 % per grid cell per year. The difference in country total emissions derived from the two satellites is very small. However, the details of the spatial distribution of emissions derived from both satellites are different over the northern part of the domain, such as the Netherlands. This may be due to the varying number of observations per region per year from the two satellites. An average of the emissions derived from both satellites leads to an improved spatial distribution compared to the emissions derived from the individual satellite. The spatial distribution of derived NH3 emissions is similar to the bottom-up inventories, but DECSO emissions are higher in general. The annual total emissions derived by DECSO for the whole domain are larger than those derived by the bottom-up inventories (LRTAP, HTAP, CAMS-REG-ANT, and CAMS-GLOB-ANT). The comparison of country total emissions shows that DECSO gives higher NH3 emissions for countries in eastern Europe than the bottom-up inventories. In addition, DECSO results show higher sources in Spain, Hungary, and eastern Romania. This is in line with the registered point sources of E-PRTR. The seasonal cycle of the emissions of DECSO is comparable to CAMS-GLOB-ANT, while HTAP uses the same seasonal cycle for each country in Europe. The analysis indicates that DECSO can be used to estimate NH3 over a long period for the trend study. The retrieval product of NH3 from SNPP ends in May 2021. Because of the insignificant differences in NH3 emissions derived from the two satellites for the overlap year 2020, the trends analysis can be continued by using the NH3 data from NOAA-20 (Fig. S11 in the Supplement). We have shown the importance of the impact of NOx emissions on the inversion of NH3 emissions. Since the NOx emissions derived from TROPOMI are in good agreement with CAMS-REG-ANT, as shown by van der A et al. (2024), the NOx emissions from CAMS-REG-ANT can be used for the years before 2019 in trend studies of NH3 emissions over Europe. For the Netherlands, model simulations using NH3 emissions from DECSO, HTAP, and CAMS-GLOB-ANT are compared to in situ observations from the MAN and LML networks. In general, the simulation using DECSO emissions has a lower bias, but it also has a lower temporal correlation compared to CAM-GLOB-ANT. The performance of model simulations with DECSO is better in summer than in winter. Both the bias and spatial correlation between model simulations using DECSO emissions and the MAN in situ observations are higher than CAMS-GLOB-ANT for grid cells including more than three measurement sites. We conclude that satellite-derived emissions derived with DECSO show a comparable temporal and spatial distribution to bottom-up inventories. The emissions derived from satellite observations can provide fully independent information on emissions for verifying the bottom-up inventories. With the global coverage of satellite observations, DECSO can easily be applied to different regions. After validation of DECSO over regions like Europe, where there is sufficient information on emissions, the added value of DECSO for deriving NH3 emissions is to provide NH3 emissions over regions with limited local information on NH3 emissions.
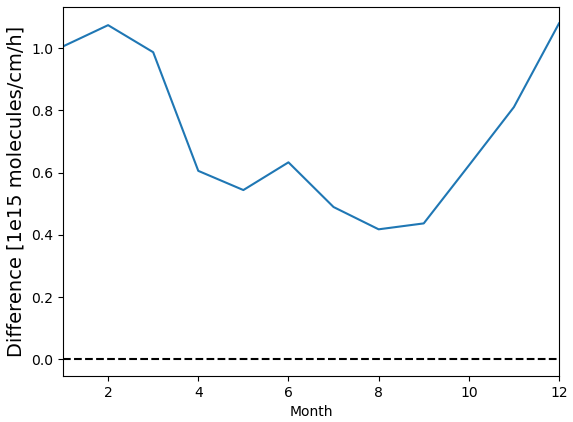
Figure 8The absolute change in monthly NH3 emissions () if there is a positive bias of 5×10¹⁵ molecule cm−2 in each NH3 column observation.
The CrIS NH3 v1.6.4 data from SNPP and NOAA-20 created by Environment and Climate Change Canada are currently publicly available upon request (mark.shephard@canada.ca) at https://hpfx.collab.science.gc.ca/~mas001/satellite_ext/cris/snpp/nh3/v1_6_4 (Shephard et al., 2020).
The TROPOMI NO2 version 2.4 data are available on the Copernicus website (https://dataspace.copernicus.eu/; van Geffen et al., 2022) and on the TEMIS website (https://www.temis.nl/airpollution/no2.php; last access: 2 August 2024) (https://doi.org/10.5270/S5P-9bnp8q8; Copernicus Sentinel-5P, 2021).
The NH3 and NOx emissions from DECSO v6.3 are available on the GlobEmission websites at https://www.temis.nl/emissions/region_europe/datapage_nox.php (van der A, 2023) and https://www.temis.nl/emissions/region_europe/datapage_nH3.php (Ding, 2023).
The HTAP v3 dataset is available at https://edgar.jrc.ec.europa.eu/dataset_htap_v3 (HTAP, 2023).
The European emission datasets for countries (NEC and LRTAP) are available on the website of the EEA at https://www.eea.europa.eu/en/analysis/ (EEA, 2024) and large facilities (E-PRTR) at https://industry.eea.europa.eu/ (EPRTR, 2012).
The CAMS-REG-ANT v5.1, CAMS-GLOB-ANT, and CAMS-TEMPO databases are available on the ECCAD website: https://eccad.sedoo.fr/#/metadata/608 (ECCAD 2023), https://eccad.sedoo.fr/#/metadata/479 (ECCAD, 2023a), https://eccad.sedoo.fr/#/metadata/487 (ECCAD, 2023b), and https://eccad.sedoo.fr/#/metadata/506 (ECCAD, 2023c).
The NH3 observation data from the LML network are available on the RIVM website (https://data.rivm.nl/data/luchtmeetnet/; last access: 11 September 2024) (LML, 2024).
The NH3 observation data from the MAN network are available at https://man.rivm.nl (MAN, 2024).
The Dutch registered NH3 emissions are available at https://data.emissieregistratie.nl/export (RIVM, 2023) (in Dutch).
The supplement related to this article is available online at: https://doi.org/10.5194/acp-24-10583-2024-supplement.
JD developed the inversion algorithm of NH3, performed all emission inversions, conducted the analysis, and wrote the paper. RvdA and JD made improvements to the inversion algorithm of NOx. HE developed the super-observation code. ED provided the code for the linearization of the averaging kernels of CrIS. MS provided the CrIS data. RWK provided the NH3 observation data from the MAN and LML networks. MG provided the CAMS-TEMPO profiles. LT provided suggestions during the research. All authors contributed to the reviewing and editing of the paper.
The contact author has declared that none of the authors has any competing interests.
Publisher's note: Copernicus Publications remains neutral with regard to jurisdictional claims made in the text, published maps, institutional affiliations, or any other geographical representation in this paper. While Copernicus Publications makes every effort to include appropriate place names, the final responsibility lies with the authors.
This work was financed by the Sentinel EO-based Emission and Deposition Service (SEEDS) project that received funding from the European Union's Horizon 2020 research and innovation programme (grant no. 101004318). Part of this work was funded by the Nationaal Kennisprogramma Stikstof (NKS) of the Dutch Ministry of Agriculture, Nature and Food Quality.
This research has been supported by Horizon 2020 (grant no. 101004318).
This paper was edited by Tanja Schuck and reviewed by two anonymous referees.
Adams, C., McLinden, C. A., Shephard, M. W., Dickson, N., Dammers, E., Chen, J., Makar, P., Cady-Pereira, K. E., Tam, N., Kharol, S. K., Lamsal, L. N., and Krotkov, N. A.: Satellite-derived emissions of carbon monoxide, ammonia, and nitrogen dioxide from the 2016 Horse River wildfire in the Fort McMurray area, Atmos. Chem. Phys., 19, 2577–2599, https://doi.org/10.5194/acp-19-2577-2019, 2019.
Backes, A., Aulinger, A., Bieser, J., Matthias, V., and Quante, M.: Ammonia emissions in Europe, part I: Development of a dynamical ammonia emission inventory, Atmos. Environ., 131, 55–66, https://doi.org/10.1016/j.atmosenv.2016.01.041, 2016a.
Backes, A. M., Aulinger, A., Bieser, J., Matthias, V., and Quante, M.: Ammonia emissions in Europe, part II: How ammonia emission abatement strategies affect secondary aerosols, Atmos. Environ., 126, 153–161, https://doi.org/10.1016/j.atmosenv.2015.11.039, 2016b.
Beer, R., Shephard, M. W., Kulawik, S. S., Clough, S. A., Eldering, A., Bowman, K. W., Sander, S. P., Fisher, B. M., Payne, V. H., Luo, M., Osterman, G. B., and Worden, J. R.: First satellite observations of lower tropospheric ammonia and methanol, Geophys. Res. Lett., 35, L09801, https://doi.org/10.1029/2008GL033642, 2008.
Behera, S. N., Sharma, M., Aneja, V. P., and Balasubramanian, R.: Ammonia in the atmosphere: a review on emission sources, atmospheric chemistry and deposition on terrestrial bodies, Environ. Sci. Pollut. R., 20, 8092–8131, https://doi.org/10.1007/s11356-013-2051-9, 2013.
Berkhout, A. J. C., Swart, D. P. J., Volten, H., Gast, L. F. L., Haaima, M., Verboom, H., Stefess, G., Hafkenscheid, T., and Hoogerbrugge, R.: Replacing the AMOR with the miniDOAS in the ammonia monitoring network in the Netherlands, Atmos. Meas. Tech., 10, 4099–4120, https://doi.org/10.5194/amt-10-4099-2017, 2017.
Beusen, A. H. W., Bouwman, A. F., Heuberger, P. S. C., Van Drecht, G., and Van Der Hoek, K. W.: Bottom-up uncertainty estimates of global ammonia emissions from global agricultural production systems, Atmos. Environ., 42, 6067–6077, https://doi.org/10.1016/j.atmosenv.2008.03.044, 2008.
Boersma, K. F., Vinken, G. C. M., and Eskes, H. J.: Representativeness errors in comparing chemistry transport and chemistry climate models with satellite UV–Vis tropospheric column retrievals, Geosci. Model Dev., 9, 875–898, https://doi.org/10.5194/gmd-9-875-2016, 2016.
Buchhorn, M., Smets, B., Bertels, L., De Roo, B., Lesiv, M., Tsendbazar, N.-E., Herold, M., and Fritz, S.: Copernicus Global Land Service: Land Cover 100m: collection 3: epoch 2019: Globe, https://doi.org/10.5281/zenodo.3939050, 2020.
Cao, H., Henze, D. K., Shephard, M. W., Dammers, E., Cady-Pereira, K., Alvarado, M., Lonsdale, C., Luo, G., Yu, F., Zhu, L., Danielson, C. G., and Edgerton, E. S.: Inverse modeling of NH3 sources using CrIS remote sensing measurements, Environ. Res. Lett., 15, 104082, https://doi.org/10.1088/1748-9326/abb5cc, 2020.
Cao, H., Henze, D. K., Zhu, L., Shephard, M. W., Cady-Pereira, K., Dammers, E., Sitwell, M., Heath, N., Lonsdale, C., Bash, J. O., Miyazaki, K., Flechard, C., Fauvel, Y., Kruit, R. W., Feigenspan, S., Brümmer, C., Schrader, F., Twigg, M. M., Leeson, S., Tang, Y. S., Stephens, A. C. M., Braban, C., Vincent, K., Meier, M., Seitler, E., Geels, C., Ellermann, T., Sanocka, A., and Capps, S. L.: 4D-Var Inversion of European NH3 Emissions Using CrIS NH3 Measurements and GEOS-Chem Adjoint With Bi-Directional and Uni-Directional Flux Schemes, J. Geophys. Res.-Atmos., 127, e2021JD035687, https://doi.org/10.1029/2021JD035687, 2022.
Chen, Y., Shen, H., Kaiser, J., Hu, Y., Capps, S. L., Zhao, S., Hakami, A., Shih, J.-S., Pavur, G. K., Turner, M. D., Henze, D. K., Resler, J., Nenes, A., Napelenok, S. L., Bash, J. O., Fahey, K. M., Carmichael, G. R., Chai, T., Clarisse, L., Coheur, P.-F., Van Damme, M., and Russell, A. G.: High-resolution hybrid inversion of IASI ammonia columns to constrain US ammonia emissions using the CMAQ adjoint model, Atmos. Chem. Phys., 21, 2067–2082, https://doi.org/10.5194/acp-21-2067-2021, 2021.
Clarisse, L., Clerbaux, C., Dentener, F., Hurtmans, D., and Coheur, P.-F.: Global ammonia distribution derived from infrared satellite observations, Nat. Geosci., 2, 479–483, https://doi.org/10.1038/ngeo551, 2009.
Copernicus Sentinel-5P (processed by ESA): TROPOMI Level 2 Nitrogen Dioxide total column products, Version 02, European Space Agency [data set], https://doi.org/10.5270/S5P-9bnp8q8, 2021.
Crippa, M., Guizzardi, D., Muntean, M., Schaaf, E., Dentener, F., van Aardenne, J. A., Monni, S., Doering, U., Olivier, J. G. J., Pagliari, V., and Janssens-Maenhout, G.: Gridded emissions of air pollutants for the period 1970–2012 within EDGAR v4.3.2, Earth Syst. Sci. Data, 10, 1987–2013, https://doi.org/10.5194/essd-10-1987-2018, 2018.
Crippa, M., Guizzardi, D., Butler, T., Keating, T., Wu, R., Kaminski, J., Kuenen, J., Kurokawa, J., Chatani, S., Morikawa, T., Pouliot, G., Racine, J., Moran, M. D., Klimont, Z., Manseau, P. M., Mashayekhi, R., Henderson, B. H., Smith, S. J., Suchyta, H., Muntean, M., Solazzo, E., Banja, M., Schaaf, E., Pagani, F., Woo, J.-H., Kim, J., Monforti-Ferrario, F., Pisoni, E., Zhang, J., Niemi, D., Sassi, M., Ansari, T., and Foley, K.: The HTAP_v3 emission mosaic: merging regional and global monthly emissions (2000–2018) to support air quality modelling and policies, Earth Syst. Sci. Data, 15, 2667–2694, https://doi.org/10.5194/essd-15-2667-2023, 2023.
Dammers, E., McLinden, C. A., Griffin, D., Shephard, M. W., Van Der Graaf, S., Lutsch, E., Schaap, M., Gainairu-Matz, Y., Fioletov, V., Van Damme, M., Whitburn, S., Clarisse, L., Cady-Pereira, K., Clerbaux, C., Coheur, P. F., and Erisman, J. W.: NH3 emissions from large point sources derived from CrIS and IASI satellite observations, Atmos. Chem. Phys., 19, 12261–12293, https://doi.org/10.5194/acp-19-12261-2019, 2019.
Ding, J., van der A, R. J., Mijling, B., Levelt, P. F., and Hao, N.: NOx emission estimates during the 2014 Youth Olympic Games in Nanjing, Atmos. Chem. Phys., 15, 9399–9412, https://doi.org/10.5194/acp-15-9399-2015, 2015.
Ding, J., Miyazaki, K., van der A, R. J., Mijling, B., Kurokawa, J.-I., Cho, S., Janssens-Maenhout, G., Zhang, Q., Liu, F., and Levelt, P. F.: Intercomparison of NOx emission inventories over East Asia, Atmos. Chem. Phys., 17, 10125–10141, https://doi.org/10.5194/acp-17-10125-2017, 2017a.
Ding, J., van der A, R. J., Mijling, B., and Levelt, P. F.: Space-based NOx emission estimates over remote regions improved in DECSO, Atmos. Meas. Tech., 10, 925–938, https://doi.org/10.5194/amt-10-925-2017, 2017b.
Ding, J., van der A, R. J., Eskes, H. J., Mijling, B., Stavrakou, T., van Geffen, J. H. G. M., and Veefkind, J. P.: NOx Emissions Reduction and Rebound in China Due to the COVID-19 Crisis, Geophys. Res. Lett., 47, e2020GL089912, https://doi.org/10.1029/2020GL089912, 2020.
Ding, J., van der A, R., Mijling, B., de Laat, J., Eskes, H., and Boersma, K. F.: NOx emissions in India derived from OMI satellite observations, Atmospheric Environment: X, 14, 100174, https://doi.org/10.1016/j.aeaoa.2022.100174, 2022.
Ding, J.: NH3 emissions in Europe (CrIS), DECSO NH3 emissions, ESA [data set], https://www.temis.nl/emissions/ region_europe/datapage_nH3.php (last access: 11 September 2024), 2023.
ECCAD: CAMS-REG-ANT, ECCAD [data set], https://eccad. sedoo.fr/#/metadata/608 (last access: 11 September 2024), 2023.
EEA (European Environment Agency): Emissions of the main air pollutants in Europe, https://www.eea.europa.eu/en/analysis/indicators/emissions-of-the-main-air?activeAccordion=ecdb3bcf-bbe9-4978-b5cf-0b136399d9f8 (last access: 3 April 2024), 2023.
EEA: Analysis and data, European emission datasets for countries (NEC and LRTAP), European Environment Agency, https://www.eea.europa.eu/en/analysis/ (last access: 11 September 2024), 2024.
EECAD: CAMS-GLOB-ANT, ECCAD [data set], https://eccad.sedoo.fr/#/metadata/479 (last access: 11 September 2024), 2023a.
EECAD: CAMS-GLOB-TEMPO, ECCAD [data set], https://eccad.sedoo.fr/#/metadata/487 (last access: 11 September 2024), 2023b.
EECAD: CAMS-REG-TEMPO, EECAD [data set], https://eccad.sedoo.fr/#/metadata/506 (last access: 11 September 2024), 2023c.
EPRTR: European Pollutant Transfer Register, database version v4.2, European Environment Agency, https://industry.eea.europa.eu/ (last access: 11 September 2024), 2012.
Erisman, J. W., Sutton, M. A., Galloway, J., Klimont, Z., and Winiwarter, W.: How a century of ammonia synthesis changed the world, Nat. Geosci., 1, 636–639, https://doi.org/10.1038/ngeo325, 2008.
Erisman, J. W., Galloway, J. N., Seitzinger, S., Bleeker, A., Dise, N. B., Petrescu, A. M. R., Leach, A. M., and de Vries, W.: Consequences of human modification of the global nitrogen cycle, Philos. T. Roy. Soc. B, 368, 20130116, https://doi.org/10.1098/rstb.2013.0116, 2013.
Eskes, H. J. and Eichmann, K.-U.: S5P Mission Performance Centre Nitrogen Dioxide [L2__NO2___] Readme, Tech. rep., ESA, https://sentinel.esa.int/documents/247904/3541451/Sentinel-5P-Nitrogen-Dioxide-Level-2-Product-Readme-File (last access: 11 September), 2022.
Galloway, J. N., Townsend, A. R., Erisman, J. W., Bekunda, M., Cai, Z., Freney, J. R., Martinelli, L. A., Seitzinger, S. P., and Sutton, M. A.: Transformation of the Nitrogen Cycle: Recent Trends, Questions, and Potential Solutions, Science, 320, 889–892, https://doi.org/10.1126/science.1136674, 2008.
Ge, X., Schaap, M., Kranenburg, R., Segers, A., Reinds, G. J., Kros, H., and de Vries, W.: Modeling atmospheric ammonia using agricultural emissions with improved spatial variability and temporal dynamics, Atmos. Chem. Phys., 20, 16055–16087, https://doi.org/10.5194/acp-20-16055-2020, 2020.
Gu, B., Zhang, L., Van Dingenen, R., Vieno, M., Van Grinsven, H. J., Zhang, X., Zhang, S., Chen, Y., Wang, S., Ren, C., Rao, S., Holland, M., Winiwarter, W., Chen, D., Xu, J., and Sutton, M. A.: Abating ammonia is more cost-effective than nitrogen oxides for mitigating PM2.5 air pollution, Science, 374, 758–762, https://doi.org/10.1126/science.abf8623, 2021.
Guevara, M., Jorba, O., Tena, C., Denier van der Gon, H., Kuenen, J., Elguindi, N., Darras, S., Granier, C., and Pérez García-Pando, C.: Copernicus Atmosphere Monitoring Service TEMPOral profiles (CAMS-TEMPO): global and European emission temporal profile maps for atmospheric chemistry modelling, Earth Syst. Sci. Data, 13, 367–404, https://doi.org/10.5194/essd-13-367-2021, 2021.
Han, Y., Revercomb, H., Cromp, M., Gu, D., Johnson, D., Mooney, D., Scott, D., Strow, L., Bingham, G., Borg, L., Chen, Y., DeSlover, D., Esplin, M., Hagan, D., Jin, X., Knuteson, R., Motteler, H., Predina, J., Suwinski, L., Taylor, J., Tobin, D., Tremblay, D., Wang, C., Wang, L., Wang, L., and Zavyalov, V.: Suomi NPP CrIS measurements, sensor data record algorithm, calibration and validation activities, and record data quality, J. Geophys. Res.-Atmos., 118, 12734–12748, https://doi.org/10.1002/2013JD020344, 2013.
Hoesly, R. M., Smith, S. J., Feng, L., Klimont, Z., Janssens-Maenhout, G., Pitkanen, T., Seibert, J. J., Vu, L., Andres, R. J., Bolt, R. M., Bond, T. C., Dawidowski, L., Kholod, N., Kurokawa, J.-I., Li, M., Liu, L., Lu, Z., Moura, M. C. P., O'Rourke, P. R., and Zhang, Q.: Historical (1750–2014) anthropogenic emissions of reactive gases and aerosols from the Community Emissions Data System (CEDS), Geosci. Model Dev., 11, 369–408, https://doi.org/10.5194/gmd-11-369-2018, 2018.
HTAP: HTAPv3 mosaic An emission inventory in support to Hemisperic Transport of Air Pollution, European Commission [data set], https://edgar.jrc.ec.europa.eu/dataset_htap_v3 (last access: 11 September 2024), 2023.
Janssens-Maenhout, G., Crippa, M., Guizzardi, D., Muntean, M., Schaaf, E., Dentener, F., Bergamaschi, P., Pagliari, V., Olivier, J. G. J., Peters, J. A. H. W., van Aardenne, J. A., Monni, S., Doering, U., Petrescu, A. M. R., Solazzo, E., and Oreggioni, G. D.: EDGAR v4.3.2 Global Atlas of the three major greenhouse gas emissions for the period 1970–2012, Earth Syst. Sci. Data, 11, 959–1002, https://doi.org/10.5194/essd-11-959-2019, 2019.
Kuenen, J., Dellaert, S., Visschedijk, A., Jalkanen, J.-P., Super, I., and Denier van der Gon, H.: CAMS-REG-v4: a state-of-the-art high-resolution European emission inventory for air quality modelling, Earth Syst. Sci. Data, 14, 491–515, https://doi.org/10.5194/essd-14-491-2022, 2022.
Kuttippurath, J., Patel, V. K., Kashyap, R., Singh, A., and Clerbaux, C.: Anomalous increase in global atmospheric ammonia during COVID-19 lockdown: Need policies to curb agricultural emissions, J. Clean. Prod., 434, 140424, https://doi.org/10.1016/j.jclepro.2023.140424, 2024.
Li, C., Martin, R. V., Shephard, M. W., Cady-Pereira, K., Cooper, M. J., Kaiser, J., Lee, C. J., Zhang, L., and Henze, D. K.: Assessing the Iterative Finite Difference Mass Balance and 4D-Var Methods to Derive Ammonia Emissions Over North America Using Synthetic Observations, J. Geophys. Res.-Atmos., 124, 4222–4236, https://doi.org/10.1029/2018JD030183, 2019.
Liu, F., van der A, R. J., Eskes, H., Ding, J., and Mijling, B.: Evaluation of modeling NO2 concentrations driven by satellite-derived and bottom-up emission inventories using in situ measurements over China, Atmos. Chem. Phys., 18, 4171–4186, https://doi.org/10.5194/acp-18-4171-2018, 2018.
LML: Dutch Air Quality Monitoring, RIVM [data set] https://data.rivm.nl/data/luchtmeetnet/ (last access: 11 September 2024), 2024.
Lolkema, D. E., Noordijk, H., Stolk, A. P., Hoogerbrugge, R., van Zanten, M. C., and van Pul, W. A. J.: The Measuring Ammonia in Nature (MAN) network in the Netherlands, Biogeosciences, 12, 5133–5142, https://doi.org/10.5194/bg-12-5133-2015, 2015.
Luo, Z., Zhang, Y., Chen, W., Van Damme, M., Coheur, P.-F., and Clarisse, L.: Estimating global ammonia (NH3) emissions based on IASI observations from 2008 to 2018, Atmos. Chem. Phys., 22, 10375–10388, https://doi.org/10.5194/acp-22-10375-2022, 2022.
MAN: Dutch Measuring Ammonia in Nature, RIVM, https://man.rivm.nl (last access: 11 September 2024), 2024 (in Dutch).
Menut, L., Bessagnet, B., Khvorostyanov, D., Beekmann, M., Blond, N., Colette, A., Coll, I., Curci, G., Foret, G., Hodzic, A., Mailler, S., Meleux, F., Monge, J.-L., Pison, I., Siour, G., Turquety, S., Valari, M., Vautard, R., and Vivanco, M. G.: CHIMERE 2013: a model for regional atmospheric composition modelling, Geosci. Model Dev., 6, 981–1028, https://doi.org/10.5194/gmd-6-981-2013, 2013.
Menut, L., Bessagnet, B., Briant, R., Cholakian, A., Couvidat, F., Mailler, S., Pennel, R., Siour, G., Tuccella, P., Turquety, S., and Valari, M.: The CHIMERE v2020r1 online chemistry-transport model, Geosci. Model Dev., 14, 6781–6811, https://doi.org/10.5194/gmd-14-6781-2021, 2021.
Mijling, B. and van der A, R. J.: Using daily satellite observations to estimate emissions of short-lived air pollutants on a mesoscopic scale, J. Geophys. Res., 117, D17302, https://doi.org/10.1029/2012JD017817, 2012.
Mijling, B., van der A, R. J., and Zhang, Q.: Regional nitrogen oxides emission trends in East Asia observed from space, Atmos. Chem. Phys., 13, 12003–12012, https://doi.org/10.5194/acp-13-12003-2013, 2013.
Noordijk, H., Braam, M., Rutledge-Jonker, S., Hoogerbrugge, R., Stolk, A. P., and van Pul, W. A. J.: Performance of the MAN ammonia monitoring network in the Netherlands, Atmos. Environ., 228, 117400, https://doi.org/10.1016/j.atmosenv.2020.117400, 2020.
Pinterits, M., Ullrich, B., Bartmann, T., and Gager, M.: European Union emission inventory report 1990–2019 under the UNECE Convention on Long-range Transboundary Air Pollution (Air Convention), EEA Report No 5/2021, 2021NEC, Air pollution in Europe: 2023 reporting status under the National Emission reduction Commitments Directive, https://www.eea.europa.eu/publications/national-emission-reduction-commitments-directive-2023/air-pollution-in-europe-2023 (last access: 11 September 2024), 2023.
Renard, J. J., Calidonna, S. E., and Henley, M. V.: Fate of ammonia in the atmosphere – a review for applicability to hazardous releases, J. Hazard. Mater., 108, 29–60, https://doi.org/10.1016/j.jhazmat.2004.01.015, 2004.
Rijsdijk, P., Eskes, H., Dingemans, A., Boersma, F., Sekiya, T., Miyazaki, K., and Houweling, S.: Quantifying uncertainties of satellite NO2 superobservations for data assimilation and model evaluation, EGUsphere [preprint], https://doi.org/10.5194/egusphere-2024-632, 2024.
RIVM: Emissie Registratie, Dutch registered NH3 emissions, https://data.emissieregistratie.nl/export (last access: 11 September 2024), 2023.
Schaap, M., van Loon, M., ten Brink, H. M., Dentener, F. J., and Builtjes, P. J. H.: Secondary inorganic aerosol simulations for Europe with special attention to nitrate, Atmos. Chem. Phys., 4, 857–874, https://doi.org/10.5194/acp-4-857-2004, 2004.
Shephard, M. W. and Cady-Pereira, K. E.: Cross-track Infrared Sounder (CrIS) satellite observations of tropospheric ammonia, Atmos. Meas. Tech., 8, 1323–1336, https://doi.org/10.5194/amt-8-1323-2015, 2015.
Shephard, M. W., Dammers, E., Cady-Pereira, K. E., Kharol, S. K., Thompson, J., Gainariu-Matz, Y., Zhang, J., McLinden, C. A., Kovachik, A., Moran, M., Bittman, S., Sioris, C. E., Griffin, D., Alvarado, M. J., Lonsdale, C., Savic-Jovcic, V., and Zheng, Q.: Ammonia measurements from space with the Cross-track Infrared Sounder: characteristics and applications, Atmos. Chem. Phys., 20, 2277–2302, https://doi.org/10.5194/acp-20-2277-2020, 2020 (data available at: https://hpfx.collab.science.gc.ca/~mas001/satellite_ext/cris/snpp/nh3/v1_6_4/, last access: 11 September 2024).
Sitwell, M., Shephard, M. W., Rochon, Y., Cady-Pereira, K., and Dammers, E.: An ensemble-variational inversion system for the estimation of ammonia emissions using CrIS satellite ammonia retrievals, Atmos. Chem. Phys., 22, 6595–6624, https://doi.org/10.5194/acp-22-6595-2022, 2022.
Soulie, A., Granier, C., Darras, S., Zilbermann, N., Doumbia, T., Guevara, M., Jalkanen, J.-P., Keita, S., Liousse, C., Crippa, M., Guizzardi, D., Hoesly, R., and Smith, S. J.: Global anthropogenic emissions (CAMS-GLOB-ANT) for the Copernicus Atmosphere Monitoring Service simulations of air quality forecasts and reanalyses, Earth Syst. Sci. Data, 16, 2261–2279, https://doi.org/10.5194/essd-16-2261-2024, 2024.
Van Damme, M., Clarisse, L., Whitburn, S., Hadji-Lazaro, J., Hurtmans, D., Clerbaux, C., and Coheur, P.-F.: Industrial and agricultural ammonia point sources exposed, Nature, 564, 99–103, https://doi.org/10.1038/s41586-018-0747-1, 2018.
Van Damme, M., Clarisse, L., Franco, B., Sutton, M. A., Erisman, J. W., Wichink Kruit, R., van Zanten, M., Whitburn, S., Hadji-Lazaro, J., Hurtmans, D., Clerbaux, C., and Coheur, P.-F.: Global, regional and national trends of atmospheric ammonia derived from a decadal (2008–2018) satellite record, Environ. Res. Lett., 16, 055017, https://doi.org/10.1088/1748-9326/abd5e0, 2021.
van der A, R. J.: NOx emissions in Europe (TROPOMI), DECSO NOx emissions, ESA [data set], https://www.temis.nl/emissions/region_europe/datapage_nox.php (last access: 11 September 2024), 2023.
van der A, R. J., Mijling, B., Ding, J., Koukouli, M. E., Liu, F., Li, Q., Mao, H., and Theys, N.: Cleaning up the air: effectiveness of air quality policy for SO2 and NOx emissions in China, Atmos. Chem. Phys., 17, 1775–1789, https://doi.org/10.5194/acp-17-1775-2017, 2017.
van der A, R. J., de Laat, A. T. J., Ding, J., and Eskes, H. J.: Connecting the dots: NOx emissions along a West Siberian natural gas pipeline, npj Climate and Atmospheric Science, 3, 16, https://doi.org/10.1038/s41612-020-0119-z, 2020.
van der A, R. J., Ding, J., and Eskes, H.: Monitoring European anthropogenic NOx emissions from space, Atmos. Chem. Phys., 24, 7523–7534, https://doi.org/10.5194/acp-24-7523-2024, 2024.
van der Graaf, S., Dammers, E., Segers, A., Kranenburg, R., Schaap, M., Shephard, M. W., and Erisman, J. W.: Data assimilation of CrIS NH3 satellite observations for improving spatiotemporal NH3 distributions in LOTOS-EUROS, Atmos. Chem. Phys., 22, 951–972, https://doi.org/10.5194/acp-22-951-2022, 2022.
van Geffen, J. H. G. M., Eskes, H. J., Boersma, K. F., and Veefkind, J. P.: TROPOMI ATBD of the total and tropospheric NO2 data products, Report S5P-KNMI-L2-0005-RP, version 2.4.0, 202207-11, KNMI, De Bilt, the Netherlands, https://dataspace.copernicus.eu/ (last access: 11 September 2024), 2022.
Veefkind, J. P., Aben, I., McMullan, K., Förster, H., de Vries, J., Otter, G., Claas, J., Eskes, H. J., de Haan, J. F., Kleipool, Q., van Weele, M., Hasekamp, O., Hoogeveen, R., Landgraf, J., Snel, R., Tol, P., Ingmann, P., Voors, R., Kruizinga, B., Vink, R., Visser, H., and Levelt, P. F.: TROPOMI on the ESA Sentinel-5 Precursor: A GMES mission for global observations of the atmospheric composition for climate, air quality and ozone layer applications, Remote Sens. Environ., 120, 70–83, https://doi.org/10.1016/j.rse.2011.09.027, 2012.
White, E., Shephard, M. W., Cady-Pereira, K. E., Kharol, S. K., Ford, S., Dammers, E., Chow, E., Thiessen, N., Tobin, D., Quinn, G., O'Brien, J., and Bash, J.: Accounting for Non-Detects: Application to Satellite Ammonia Observations, Remote Sens. 2023, 15, 2610, https://doi.org/10.3390/rs15102610, 2023.
Wyer, K. E., Kelleghan, D. B., Blanes-Vidal, V., Schauberger, G., and Curran, T. P.: Ammonia emissions from agriculture and their contribution to fine particulate matter: A review of implications for human health, J. Environ. Manage., 323, 116285, https://doi.org/10.1016/j.jenvman.2022.116285, 2022.
Zavyalov, V., Esplin, M., Scott, D., Esplin, B., Bingham, G., Hoffman, E., Lietzke, C., Predina, J., Frain, R., Suwinski, L., Han, Y., Major, C., Graham, B., and Phillips, L.: Noise performance of the CrIS instrument, J. Geophys. Res.-Atmos., 118, 13108–13120, https://doi.org/10.1002/2013JD020457, 2013.
Zhang, L., Chen, Y., Zhao, Y., Henze, D. K., Zhu, L., Song, Y., Paulot, F., Liu, X., Pan, Y., Lin, Y., and Huang, B.: Agricultural ammonia emissions in China: reconciling bottom-up and top-down estimates, Atmos. Chem. Phys., 18, 339–355, https://doi.org/10.5194/acp-18-339-2018, 2018.
Zhang, X., Gu, B., van Grinsven, H., Lam, S. K., Liang, X., Bai, M., and Chen, D.: Societal benefits of halving agricultural ammonia emissions in China far exceed the abatement costs, Nat. Commun., 11, 4357, https://doi.org/10.1038/s41467-020-18196-z, 2020.
Zhu, L., Henze, D. K., Cady-Pereira, K. E., Shephard, M. W., Luo, M., Pinder, R. W., Bash, J. O., and Jeong, G.-R.: Constraining U. S. ammonia emissions using TES remote sensing observations and the GEOS-Chem adjoint model, J. Geophys. Res.-Atmos., 118, 3355–3368, https://doi.org/10.1002/jgrd.50166, 2013.