the Creative Commons Attribution 4.0 License.
the Creative Commons Attribution 4.0 License.
 | 18 Sep 2024
Biomass-burning sources control ambient particulate matter, but traffic and industrial sources control volatile organic compound (VOC) emissions and secondary-pollutant formation during extreme pollution events in Delhi
Arpit Awasthi
Haseeb Hakkim
Sachin Mishra
Varkrishna Mummidivarapu
Gurmanjot Singh
Sachin D. Ghude
Vijay Kumar Soni
Narendra Nigam
Vinayak Sinha
Madhavan N. Rajeevan
Volatile organic compounds (VOCs) and particulate matter (PM) are major constituents of smog. Delhi experiences severe smog during the post-monsoon season, but a quantitative understanding of VOCs and PM sources is still lacking. Here, we conduct a source apportionment study for VOCs and PM using a recent (2022), high-quality dataset of 111 VOCs, PM2.5, and PM10 in a positive matrix factorization (PMF) model. Contrasts between clean monsoon air and polluted post-monsoon air, VOC source fingerprints, and molecular tracers enabled us to differentiate paddy residue burning from other biomass-burning sources, which had previously been impossible. Burning of fresh paddy residue, as well as residential heating and waste burning, contributed the most to observed PM10 levels (25 % and 23 %, respectively) and PM2.5 levels (23 % and 24 %, respectively), followed by heavy-duty vehicles fuelled by compressed natural gas (CNG), with a PM10 contribution of 15 % and a PM2.5 contribution of 11 %. For ambient VOCs, ozone formation potential, and secondary-organic-aerosol (SOA) formation potential, the top sources were petrol four-wheelers (20 %, 25 %, and 30 %, respectively), petrol two-wheelers (14 %, 12 %, and 20 %, respectively), industrial emissions (12 %, 14 %, and 15 %, respectively), solid-fuel-based cooking (10 %, 10 %, and 8 %, respectively), and road construction (8 %, 6 %, and 9 %, respectively). Emission inventories tended to overestimate residential biofuel emissions at least by a factor of 2 relative to the PMF output. The major source of PM pollution was regional biomass burning, while traffic and industries governed VOC emissions and secondary-pollutant formation. Our novel source apportionment method even quantitatively resolved similar biomass and fossil fuel sources, offering insights into both VOC and PM sources affecting extreme pollution events. This approach represents a notable advancement compared to current source apportionment approaches, and it could be of great relevance for future studies in other polluted cities and regions of the world with complex source mixtures.
- Article
(7905 KB) - Full-text XML
-
Supplement
(3951 KB) - BibTeX
- EndNote


The Delhi National Capital Region (NCR) is located in the Indo-Gangetic Plain and experiences some of the severest air pollution events worldwide, exposing its inhabitants to hazardous air quality. New Delhi recorded the world's highest population-weighted annual average PM2.5 exposure, amounting to 217.6 µg m−3, and the sixth-highest PM2.5-attributable death rate (85 out of 100 000 deaths; Pandey et al., 2021). India is currently among the world's leading developing countries, and Delhi, India's capital, has witnessed rapid population growth and urbanization in the past decade. However, a significant fraction of the population still lacks access to cleaner technologies for cooking and heating (Thakur, 2023; Fadly et al., 2023). With a population of 31.7 million people (UN World Population Prospects, 2022), Delhi sees an addition of over 600 000 vehicles per year, based on the VAHAN database from the Ministry of Road Transport and Highways (MoRTH; Government of India, 2022). Sources of air pollutants in the region have received much attention recently, and a number of source apportionment methods have been applied. Several studies have relied on chemical mass balance (CMB) models, which are unable to identify unknown fugitive sources since their application depends on prior knowledge of all relevant sources and their source profiles (Prakash et al., 2021; Srivastava et al., 2008). Clearly, in a dynamic, developing world megacity like Delhi, where wide disparities exist in terms of access to clean energy and waste burning and many other activities continue to be carried out by the informal sector, the CMB approach may misattribute emissions to known sources, failing to identify other major sources that may be active. While much information has come to light through previous aerosol-mass-spectrometry-based source apportionment studies, a key limitation of previous studies has been their inability to distinguish between similar types of fossil fuel and biomass-burning sources (Kumar et al., 2022; Mishra et al., 2023). The volatile organic compound (VOC) source fingerprints of many combustion sources are well constrained and understood, and they have recently been used in positive matrix factorization (PMF) studies to conduct source apportionment for co-emitted greenhouse gases, such as methane, CO2, and N2O (Guha et al., 2015; Assan et al., 2018; Schulze et al., 2023). We now extend the use of this promising new technique to the source apportionment of co-emitted PM2.5 and PM10. This helps us overcome another major limitation of existing studies, which have often taken a piecemeal approach by focusing on either VOCs (Jain et al., 2022), particulate matter (PM), or subsets thereof, using datasets acquired in 2019 or earlier (i.e. the pre-COVID-19 period), after which significant changes were implemented. For example, Bharat Stage VI, which complies with Euro VI norms, was implemented in Delhi in 2018 and in the Delhi NCR in 2019 (Gajbhiye et al., 2023). This significant decision was prompted by the severe air pollution challenges faced by Delhi, which particularly worsened around 2019 (Gajbhiye et al., 2023). Still, air pollution continues to pose major health risks. Overall, a continued lack of strategic knowledge and an inability to pinpoint the exact sources and their contributions hamper efforts to propose evidence-based strategies for mitigating major sources. In our previous studies conducted at another site in the Indo-Gangetic Plain (Pallavi et al., 2019; Singh et al., 2023), we demonstrated that source apportionment via PMF, when combined with measured VOC chemical fingerprints of sources, can distinguish and quantify the contributions from even similar types of sources (e.g. differentiating four-wheelers from two-wheelers and diesel vehicles within traffic sources and differentiating paddy stubble burning from residential biofuel combustion within biomass-burning sources). We improve upon these studies, which were carried out on datasets acquired using a VOC-based proton-transfer-reaction mass spectrometer with unity mass resolution, by incorporating recent data acquired using the latest extended-volatility-range, high-mass-resolution, and high-sensitivity PTR-TOF-MS (proton-transfer-reaction time-of-flight mass spectrometry) technology – PTR-TOF 10k – over Delhi (Mishra et al., 2024).
The dataset used for source apportionment in this study, which uses PMF modelling, includes the high-sensitivity (several ppt), high-mass-resolution (> 10 000) real-time acquisition of 111 speciated volatile organic compounds measured from 15 August 2022–26 November 2022 using the PTR-TOF 10k mass spectrometry instrument in Delhi, along with hourly averaged PM2.5 and PM10 measurements. This dataset is novel in that it contains all major known gas-phase molecular tracers from varied sources and VOC profiles of major agricultural and urban sources existing across the Indo-Gangetic Plain. The dataset spans the relatively cleaner monsoon season, which provides a baseline for air pollution over the city, and the post-monsoon season, when post-harvest agricultural paddy residue burning in the Indo-Gangetic Plain perturbs the atmospheric chemical composition by providing an additional source of VOC and PM emissions. This comprehensive approach ensured that the PMF model, which provides the advantage of determining air pollution sources without any prior knowledge of the source fingerprints, was able to reliably quantify the contributions of different sources to ambient VOC, PM2.5, and PM10 mass concentrations as its solutions are sensitive to contrasts in ambient time series data. The statistical solution obtained using the model was verified against measured real-world source profiles from the region, presenting a significant advancement compared to previous PMF source apportionment studies from the Delhi NCR. Furthermore, by combining this molecular-tracer-based methodology (and corresponding analyses) with additional back-trajectory and statistical analyses of air masses, we constrained the locations of major pollution sources and regions and compared the results of our source apportionment study with two widely used gridded emission inventories from chemical transport models: the Emissions Database for Global Atmospheric Research (EDGARv6.1; Crippa et al., 2022) and the Regional Emission inventory in ASia (REASv3.2.1; Kurokawa and Ohara, 2020).
2.1 Measurement site and meteorological conditions
The new extended-volatility-range PTR-TOF mass spectrometer (PTR-TOF 10k), along with the primary VOC dataset and site, is described and analysed in detail in the companion paper to this work (Mishra et al., 2024). Hence, only a brief description of these aspects and complementary details, such as the air mass flow trajectories at the site during the study period from August to November 2022, are provided below.
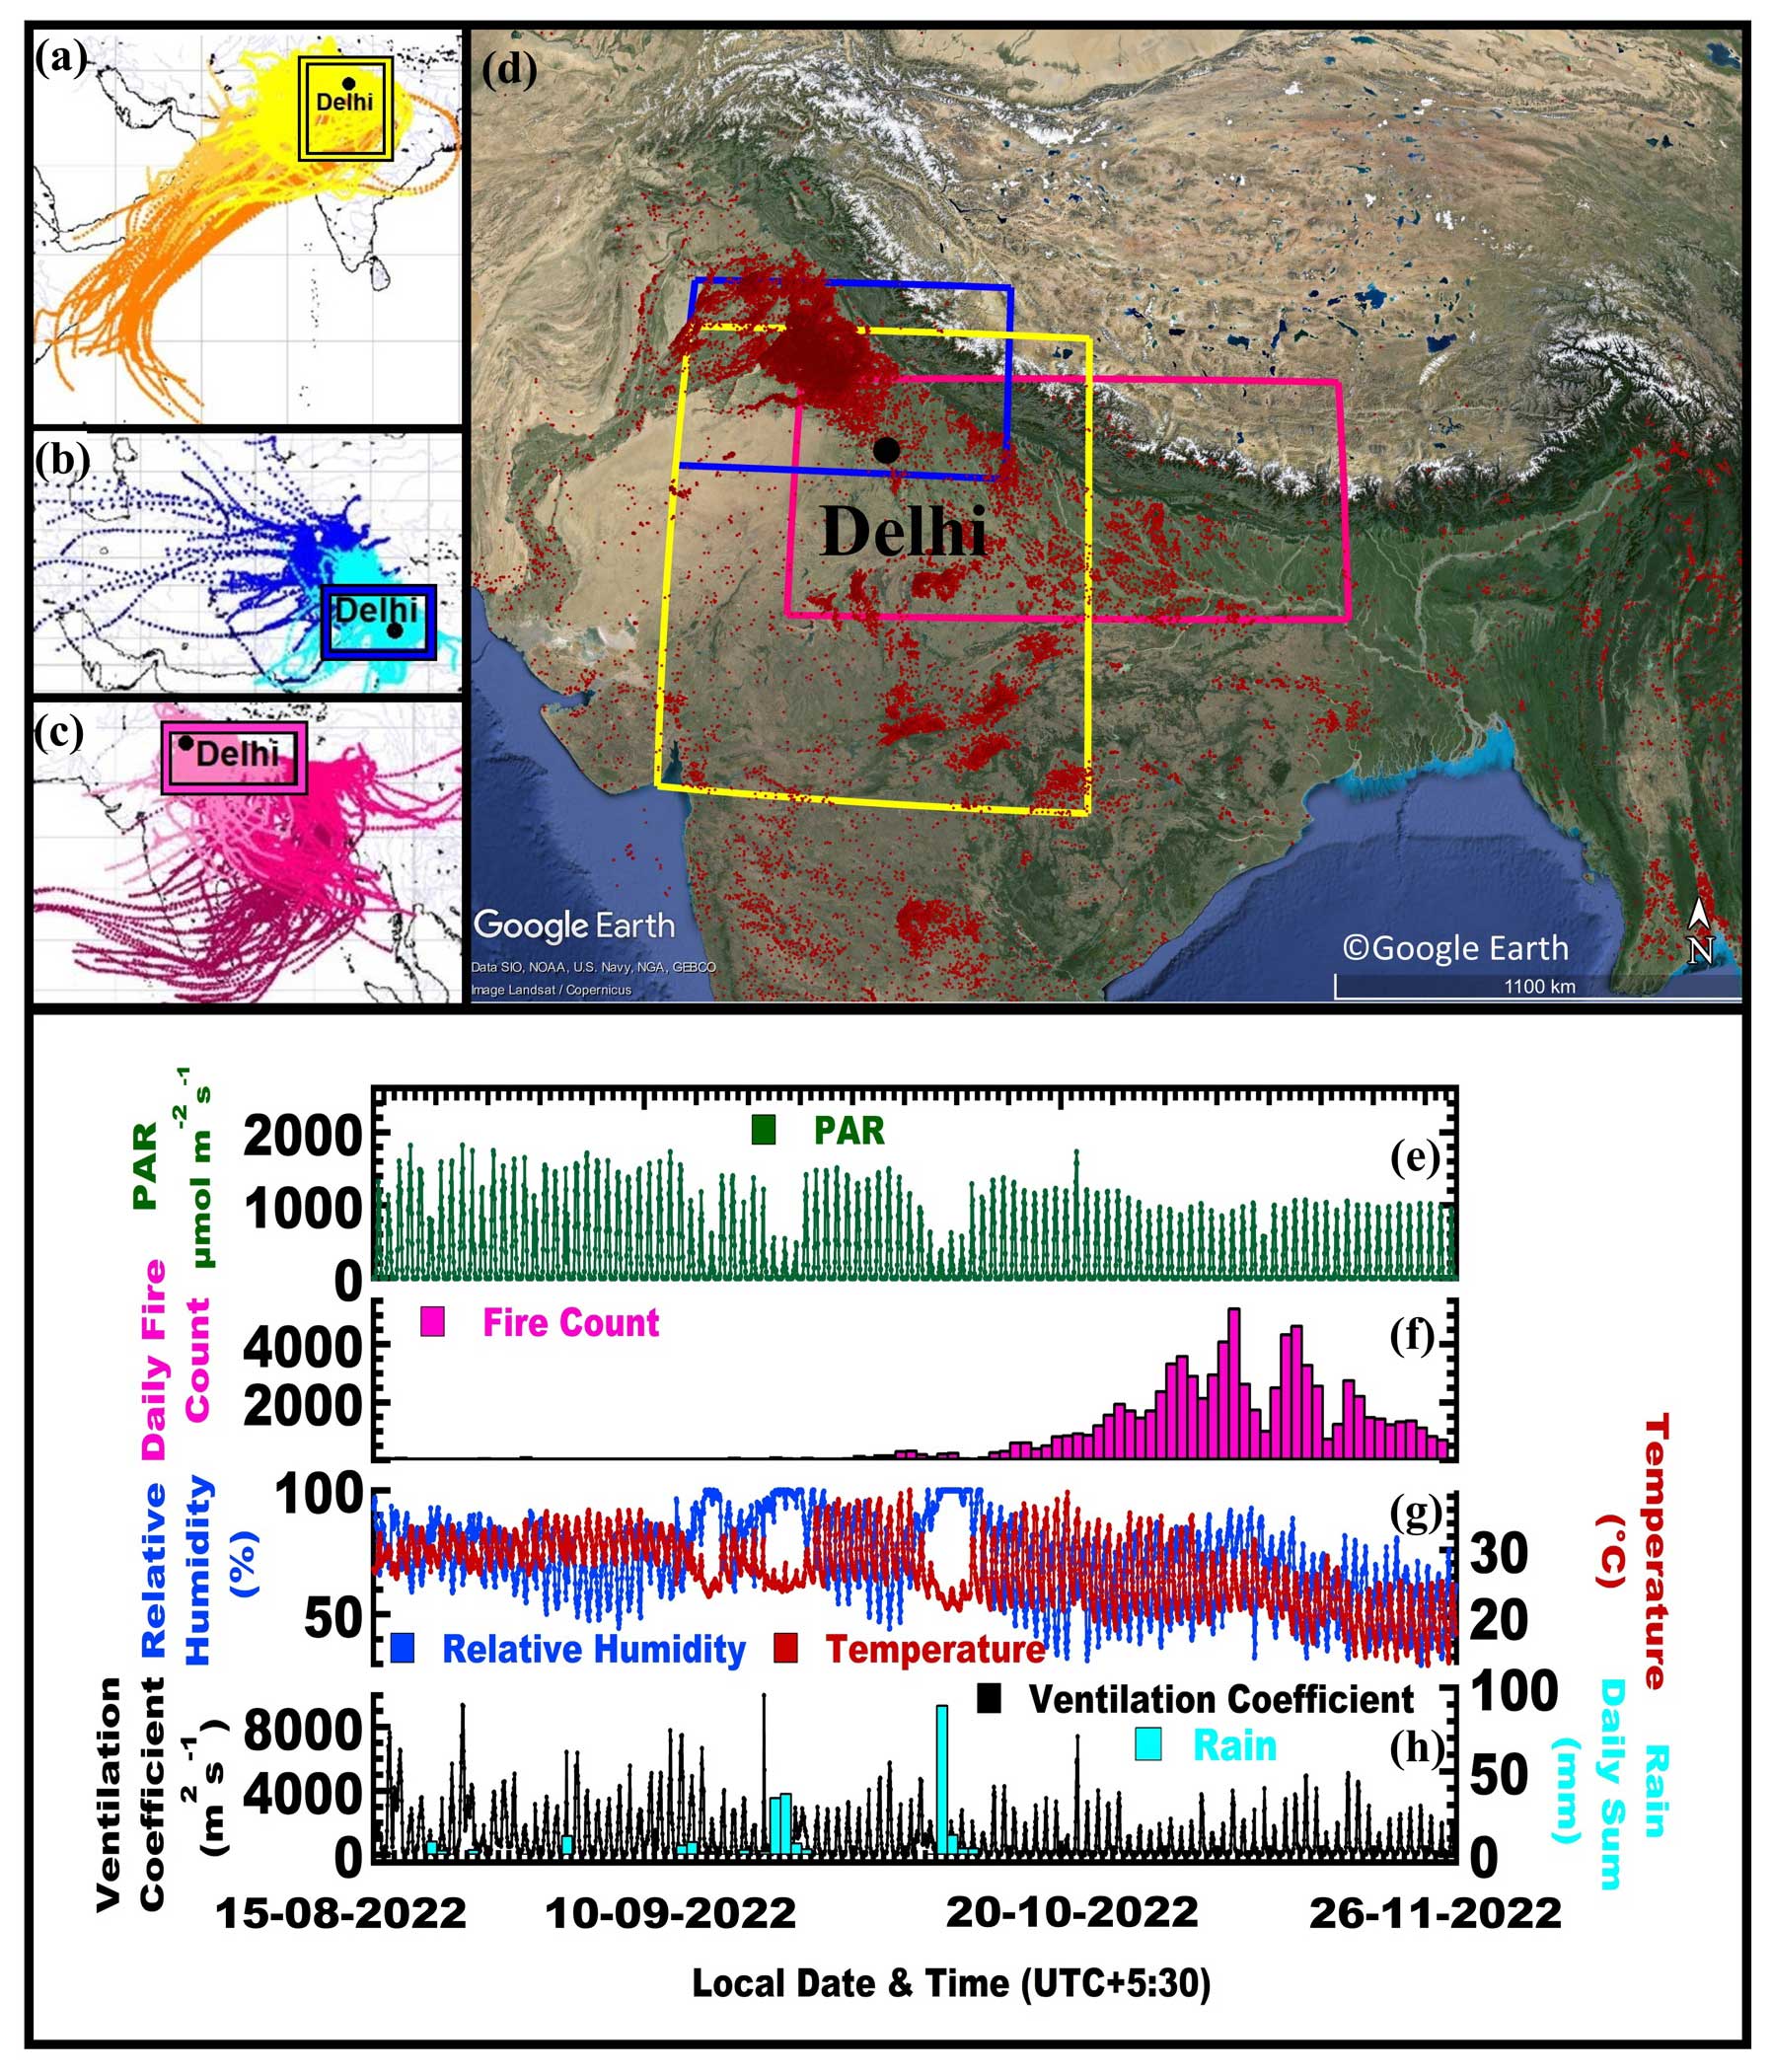
Figure 1A 120 h back trajectory of air masses reaching the receptor site located at Mausam Bhawan (28.5896° N, 77.2210° E; 50 m a.g.l.) grouped according to the dominant synoptic-scale transport into (a) southwesterly flow, (b) northwesterly flow, and (c) southeasterly flow. (d) Spatial map of daily fire counts in the region for the post-monsoon season, with square boxes indicating the fetch regions from which air masses typically reach the receptor site within 24 h for a given flow situation (© Google Earth). The bottom panels show (e) the photosynthetically active radiation (PAR), (f) the daily fire counts in the fetch region, (g) the temperature and relative humidity, and (h) the ventilation coefficient and sum of the daily rainfall for the study period.
Ambient air was sampled by the instruments from the rooftop of a tall building (28.5896° N, 77.2210° E) at ∼ 35 m a.g.l., located within the premises of the Indian Meteorological Department (IMD) on Lodhi Road, New Delhi, situated in Central Delhi. The sampling site is a typical urban area surrounded by green spaces, government offices, and residential areas, but it is not in the direct vicinity of any major industries (Fig. S1 in the Supplement). It is representative of the seasonal airflow patterns observed in Delhi. Figure 1 shows the location of the site and the 120 h back trajectories of air masses arriving at the site. These trajectories were grouped according to the dominant synoptic regional-scale transport into (a) southwesterly flows (orange and yellow), carrying emissions from southern Punjab, Haryana, Uttar Pradesh, Madhya Pradesh, Rajasthan, and Gujarat towards the receptor; (b) northwesterly flows (light and dark blue), carrying emissions from Punjab (Pakistan), Punjab (India), Haryana, western Uttar Pradesh, Himachal Pradesh, and Uttarakhand towards the receptor; and (c) southeasterly flows (light and dark red), carrying emissions from Haryana, southern Uttarakhand, Uttar Pradesh, Bihar, and Nepal towards the receptor. Figure 1d shows a Google Earth image with a spatial map illustrating the daily fire counts in the region for the post-monsoon season and the maximum 24 h fetch region for each synoptic-flow situation, marked by coloured squares. Figure 1e shows the photosynthetically active radiation, Fig. 1f shows the daily fire counts in the fetch region (21–32° N, 72–88° E), Fig. 1g shows the temperature and relative humidity, and Fig. 1h shows the ventilation coefficient and sum of daily rainfall during the study period (15 August 2022–26 November 2022). Wind speed, wind direction, ambient temperature, relative humidity, and photosynthetically active radiation were measured using meteorological sensors (Campbell Scientific portable sensors equipped with a CS215 relative humidity and temperature sensor, a PQS1 PAR sensor, and a TE525-L 40 V rain gauge; Campbell Scientific, Inc.). Boundary layer height was taken from the ERA5 dataset (Hersbach et al., 2023), and the ventilation coefficient was calculated as the product of measured wind speed and boundary layer height. Fire counts were obtained using 375 m thermal anomalies and active fire product data from the Visible Infrared Imaging Radiometer Suite (VIIRS) sensor aboard the NASA/NOAA Suomi National Polar-orbiting Partnership (Suomi NPP) and NOAA-20 satellites, using high and normal confidence intervals only. The back trajectories in Fig. 1, showing the 5 d runs, were obtained using version 5.2.1 of the HYSPLIT desktop application (Stein et al., 2015; Rolph et al., 2017) with 0.25° resolution Global Forecast System (GFSv1) meteorological fields employed as input data. The model was initialized every 3 h (00:00, 03:00, 06:00, 09:00, 12:00, 15:00, 18:00, and 21:00 UTC) at 50 m a.g.l. for the year 2022, and trajectories were subjected to back-trajectory cluster analysis via k-means clustering (Bow, 1984) with Euclidean distance metrics, employing the “openair” package (v2.11; Carslaw and Ropkins, 2012). Three basic air transport situations occur at this site: southwesterly flow (Fig. 1a), northwesterly flow (Fig. 1b), and southeasterly flow (Fig. 1c). These regional transport situations in the shared airshed have been described in great detail for another receptor site, located 300 km north of Delhi (Pawar et al., 2015). In Delhi, each of these large-scale flow patterns can occur at three different transport speeds – fast (darkest colour), medium (intermediate colour), and slow (lightest colour) – resulting in nine clusters.
During the monsoon season (15 August–30 September 2022), air masses from the southwest (western arm of the monsoon) were more prevalent than air masses reaching the site from the southeast (Bay of Bengal arm of the monsoon). During the post-monsoon season (1 October–26 November 2022), air masses remained confined over the northwestern Indo-Gangetic Plain (IGP) for prolonged periods and primarily reached the site from the northwest (Fig. 1b), except during the passage of western disturbances (5–10 October and 4–10 November 2022), which caused brief periods of southwesterly and southeasterly flow and rain (Fig. 1h). Figure 1f shows that paddy residue burning of short-duration varieties began before the monsoon withdrawal on 29 September 2022; however, the burning peaked during the harvest of late varieties in late October and early November. During this period, a drop in temperature (Fig. 1g) and increased fire activity (Fig. 1f) resulted in the build-up of a persistent haze layer, leading to suppressed photosynthetically active radiation (Fig. 1e). This is associated with prolonged periods of poor ventilation (Fig. 1h).
2.2 Measurement of volatile organic compounds, trace gases, and PM2.5 and PM10 mass concentrations
Measurements of volatile organic compounds were performed using a high-mass-resolution and high-sensitivity PTR-TOF mass spectrometer (PTR-TOF 10k, model PT10-004, manufactured by IONICON Analytik GmbH, Austria). Details pertaining to the characterization, calibration, QA, and QC of the acquired dataset are provided in Mishra et al., 2024. It is worth mentioning again that, as a significant improvement over previous PTR-TOF-MS deployments in Delhi, the inlet system of the instrument used in this work was designed for sampling and detecting low-volatility compounds with extended-volatility-range technology (Piel et al., 2021). The inlet system of the instrument and the ionization chamber are fully integrated into a heated chamber, and the inlet capillary is fed through a heated hose to ensure that there are no cold spots that could cause condensation. The entire inlet system is made of inert materials (e.g. polyetheretherketone (PEEK) or SilcoNert-treated steel capillaries) to minimize the surface effects. Furthermore, the overall inlet residence time was less than 3 s throughout the campaign. Compared to previous PTR-TOF-MS instruments deployed in Delhi, this instrument also offers unprecedented mass resolution (greater than 10 000 m Δm−1 (full width at half maximum; FWHM) at ≥ 79 amu, reaching up to 15 000 at 330) coupled with a high detection sensitivity (∼ 1 ppt or better for 60 s averaged data), providing unprecedented capability for identifying and quantifying new ambient compounds. Mass spectra were acquired over the 15–450 amu range at a frequency of 1 Hz. Table S1 in the Supplement lists information pertaining to the mass-to-charge ratio (), compound names (Pagonis et al., 2019; Yáñez-Serrano et al., 2021), sources (supported by references to previous studies where available), averaged ambient mass concentrations, and the classification of species as weak or strong for the PMF model runs. The accuracy error was minimized by conducting a total of eight span calibrations throughout the study period. The details of these calibrations can be found in Mishra et al. (2024). The precision error for each ratio listed in Table S1, which needs to be included into the PMF model runs, was calculated from the average observed count rate of each ratio, measured in counts per second (cps), with the help of Poisson statistics. The detection limit was determined as 2σ of the noise observed in clean zero air.
Thermo Fisher Scientific trace-level air quality analysers – i.e. 48i (infrared-filter correlation-based spectroscopy), 43i (pulsed UV fluorescence), 49i (UV absorption photometry), and 42i (chemiluminescence) – were used to quantify carbon monoxide (CO), ozone (O3), NO, and NO2, respectively. The overall uncertainty in the measurements was less than 6 %. Measurements of PM2.5 and PM10 were made using the Thermo Fisher Scientific 5014i series, which is based on the beta attenuation technique. Technical details pertaining to the QA and QC of these instruments are comprehensively described in our previous works (Chandra and Sinha, 2016; Kumar et al., 2016; Sinha et al., 2014). Carbon dioxide and methane were measured using a cavity ring-down spectrometer (Picarro G2508; Picarro, Santa Clara, CA, USA). The overall uncertainty in these measurements was below 4 %, and technical details pertaining to the instrument are available in Chandra et al. (2017).
2.3 PMF model analysis
The US Environmental Protection Agency (EPA) PMF 5.0 model (Paatero et al., 2002, 2014; Paatero and Hopke, 2009; Norris et al., 2014) was applied to a sample matrix consisting of 2496 hourly observations and 111 VOC species. The species with a signal-to-noise ratio () greater than 2.0 were designated as strong species (94), while others were designated as weak species (17). The total VOC mass was included as a weak species and was calculated as the sum of the mass of the individual 111 VOC species included in the PMF model. Overall, the 111 VOC species included in our analysis and their isotopic peaks accounted for 86 % of the VOC mass detected during our study period. The remaining 119 , which accounted for 14 % of the detected VOC mass, could not be included in our PMF analysis, primarily because signals were below the detection limit for almost 50 % of the observation period and because compound identity could not be confirmed via isotopic peaks. PM2.5 and PM10 were included as additional weak species in the model. The specified uncertainty for weak species is tripled by the PMF model to limit the influence of such species on the PMF solution. Several authors have recently pioneered the use of VOC tracers in PMF models to conduct source apportionment for co-emitted greenhouse gases, such as methane, CO2, and N2O (Guha et al., 2015; Assan et al., 2018; Schulze et al., 2023). Since the VOC source fingerprints of many combustion sources are well constrained and understood, we now extend the use of this promising new technique towards the source apportionment of co-emitted PM2.5 and PM10. The PMF model is a matrix decomposition factor analysis model that decomposes a time series of measured species into a set of factors with fixed source fingerprints, whose contributions to the input dataset vary over time. This makes the model well suited to accommodate all chemical species co-emitted from the same source.
EPA PMF 5.0 is a multivariate factor analysis tool and receptor model that divides the data matrix Xij (time series of measured concentrations of VOCs with i distinct observations and j measured species) into two matrices, Fkj (source fingerprint) and Gik (source contribution), and a residual matrix Eij using the simultaneous application of the linear least-squares method in multiple dimensions.
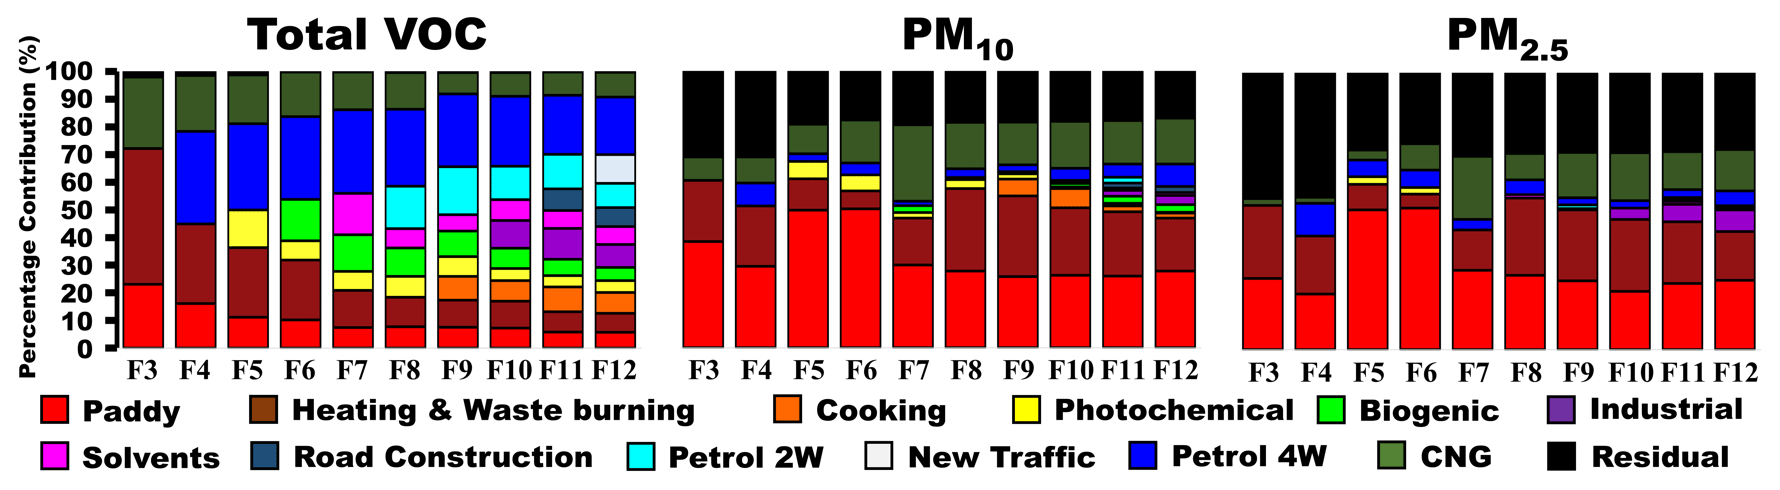
Figure 2Percentage shares of the total VOC, PM10, and PM2.5 mass loadings explained by various factors in the PMF model as the number of PMF factors in the model increases from 3 to 12. The remaining percentage share, shown in black, indicates the portion of the total mass attributed to the PMF residuals. Petrol 2W: petrol two-wheeler. Petrol 4W: petrol four-wheeler.
The user must provide the number of variables or sources (k). To determine the number of VOC sources the model can resolve in this atmospheric environment, the model was run using 3 to 12 factors. The model was initiated for 20 base runs with the recommended block size of 379, and the run with the lowest Qrobust and Qtrue was chosen for further analysis and is displayed in Fig. 2. Figure 2 shows how the percentage shares of total VOCs, PM2.5, and PM10 attributable to various sources change as the number of factors increases from 3 to 12, while Figs. S2–S4 illustrate the evolution of the factor contribution time series, source profile, and percentage of species accounted for by different sources as the number of factors in the PMF model increases. Figure S5 shows how the and ratios, as well as scaled residuals beyond 3 standard deviations, drop exponentially when the number of factors increases. It can be seen that, initially, the ratio drops faster than the ratio as each additional factor better accounts for additional major plumes. However, with the increase from 11 to 12 factors, both ratios drop in a parallel fashion, indicating that the point of diminishing returns has been reached.
While the three major traffic factors – compressed natural gas (CNG), petrol four-wheelers, and petrol two-wheelers – are completely resolved with the eight-factor solution, three major biomass-burning-related sources – namely paddy residue burning, heating and waste burning, and solid-fuel-based cooking – are distinguished with a nine-factor solution. Until the PMF model has identified a distinct factor for emissions of oxygenated volatile organic compounds (OVOCs) caused by industrial solvent usage and stack venting in the seven-factor solution, the partitioning between PM2.5 and PM10 emissions resulting from paddy residue burning and those resulting from heating and waste burning in the model remains unstable. This is because these sources, with their strong oxygenated volatile organic compound (OVOC) emissions, are more likely to accommodate additional OVOC sources in their fingerprint at the expense of accounting for the PM2.5 and PM10 emissions. Once industrial OVOC emissions have their own factor, this split becomes stable. The amount of PM attributed to residential heating and waste burning stabilizes after a separate factor for cooking emissions is identified in the nine-factor solution. Industrial emissions are separated from solvent usage emissions and other evaporative emissions using the 10-factor solution, and road construction activity emerges as a separate source with an 11-factor solution. While attempting to resolve 12 factors, the model splits transport sector emissions into four separate factors. However, this new transport sector factor shows a time series correlation with the petrol four-wheeler factor (R = 0.8), and the 12-factor solution is found to be rotationally unstable during bootstrap runs, indicating that the model cannot resolve more than 11 factors with the available VOC tracers. The 12-factor solution also hardly improves the and ratios (Fig. S5). Therefore, the 11-factor solution shall be analysed further in this paper. The model was run in the constrained mode, as elaborately described in Sarkar et al. (2017) and Singh et al. (2023). This mode reduces rotational ambiguity with the aid of prior knowledge, encouraging the model to minimize (pull down) or maximize (pull up) the total mass assigned to specific hourly observations or compounds in source profiles as much as possible within a predefined permissible penalty regarding Q. The primary problem with the base run solutions is that nighttime biomass-burning plumes contaminate both the biogenic and photochemical factors. To minimize this in our constrained run, we pulled down primary emissions (acetonitrile, toluene, C8 aromatics, and C9 aromatics) in the biogenic and photochemical factors. We also pulled down the top seven strongest nighttime plumes contaminating the biogenic and photochemical factors. In addition, we pulled up the highest plume events for all anthropogenic-emission-related factors, as detailed in Table S2. The overall penalty with regard to Q (the object function) was 4.9 %, i.e. within the recommended limit of 5 % (Norris et al., 2014; Rizzo and Scheff, 2007). The model uncertainty was assessed using bootstrap runs. The constrained model was found to be rotationally stable and robust, with 100 % of all bootstrap runs for each individual factor mapping onto the base factor when R > 0.6 and no unmapped bootstraps remaining.
2.4 Calculation of ozone formation potential (OFP), secondary-organic-aerosol (SOA) formation, and volatility
The contribution of VOCs to ozone production was derived with the maximum incremental reactivity (MIR; Carter, 2010) method using the following equation:
where ci is the measured concentration of VOC species i and MIRi is the maximum incremental reactivity of VOC species i.
SOA production (SOAP) was determined using the following equation:
SOAPi values were calculated using the SOA yields for environments with high NOx emissions reported in Table S3, according to the equation by Derwent et al. (1998, 2010) since Delhi, as a megacity, is an environment exhibiting high NOx emissions. This equation evaluates each VOC species' ability to produce SOA relative to the amount of SOA that the same mass of toluene would produce when introduced to the ambient environment. This is represented by SOAPi.
The saturation vapour pressure of VOCs was calculated using version 4.1 of the EPA's Estimation Programs Interface (EPI) Suite (MPBPWIN v.1.43 and KOAWIN v.1.00), provided by the US Environmental Protection Agency (US EPA, 2015), according to the method described in Li et al. (2016). The vapour pressure of liquids and gases is estimated using the average of the Antoine method (Lyman et al., 1990) and the modified Grain method (Lyman 1985). The vapour pressure is then converted to saturation mass concentration C0, measured in µg m−3, using the following equation:
where M is the molar mass (g mol−1), R is the ideal gas constant (8.205 × 10⁻⁵ ), p0 is the saturation vapour pressure (mm Hg), and T is the temperature (K). Organic compounds with C0 > 3 × 10⁶ µg m−3 are classified as VOCs, while compounds with 300 < C0 < 3 × 10⁶ µg m−3 are classified as intermediate VOCs (IVOCs).
2.5 Comparison of existing emission inventories with PMF-derived output
The observational data were grouped according to the predominant airflow into three groups: southwesterly flow, northwesterly flow, and southeasterly flow. The fetch regions from which air masses could reach the receptor site within 24 h were determined for each group separately. The locations of the regions for the three flow regimes are as follows: 21–31° N, 72–82° E; 28–32° N, 72–80° E; and 25–30° N, 75–88° E, respectively. Two gridded emission inventories, namely the Emissions Database for Global Atmospheric Research (EDGARv6.1) for the year 2018 (Crippa et al., 2022) and the Regional Emission inventory in ASia (REASv3.2.1) for the year 2015 (Kurokawa and Ohara, 2020), were filtered based on these three fetch regions to compare the PMF results with the emission inventory data. We compared the relative percentage contribution of the sources to the total atmospheric pollution burden in the PMF model with the relative percentage contribution of the sources to the total emissions in the emission inventories. This approach is routinely used to evaluate emission inventories with the help of PMF results from different sites around the world (Buzcu-Guven and Fraser, 2008; Morino et al., 2011; Sarkar et al., 2017; Li et al., 2019; Qin et al., 2022). For the purpose of comparing emission inventory data with anthropogenic sources, natural sources, such as biogenic emissions and the photochemistry factor, were removed from the PMF output, while the solid-fuel-based cooking, residential-heating, and waste-burning emissions were summed up in one single residential and waste management category. In addition, the CNG, petrol two-wheeler, and petrol four-wheeler factors were combined into a consolidated category for transport sector emissions.
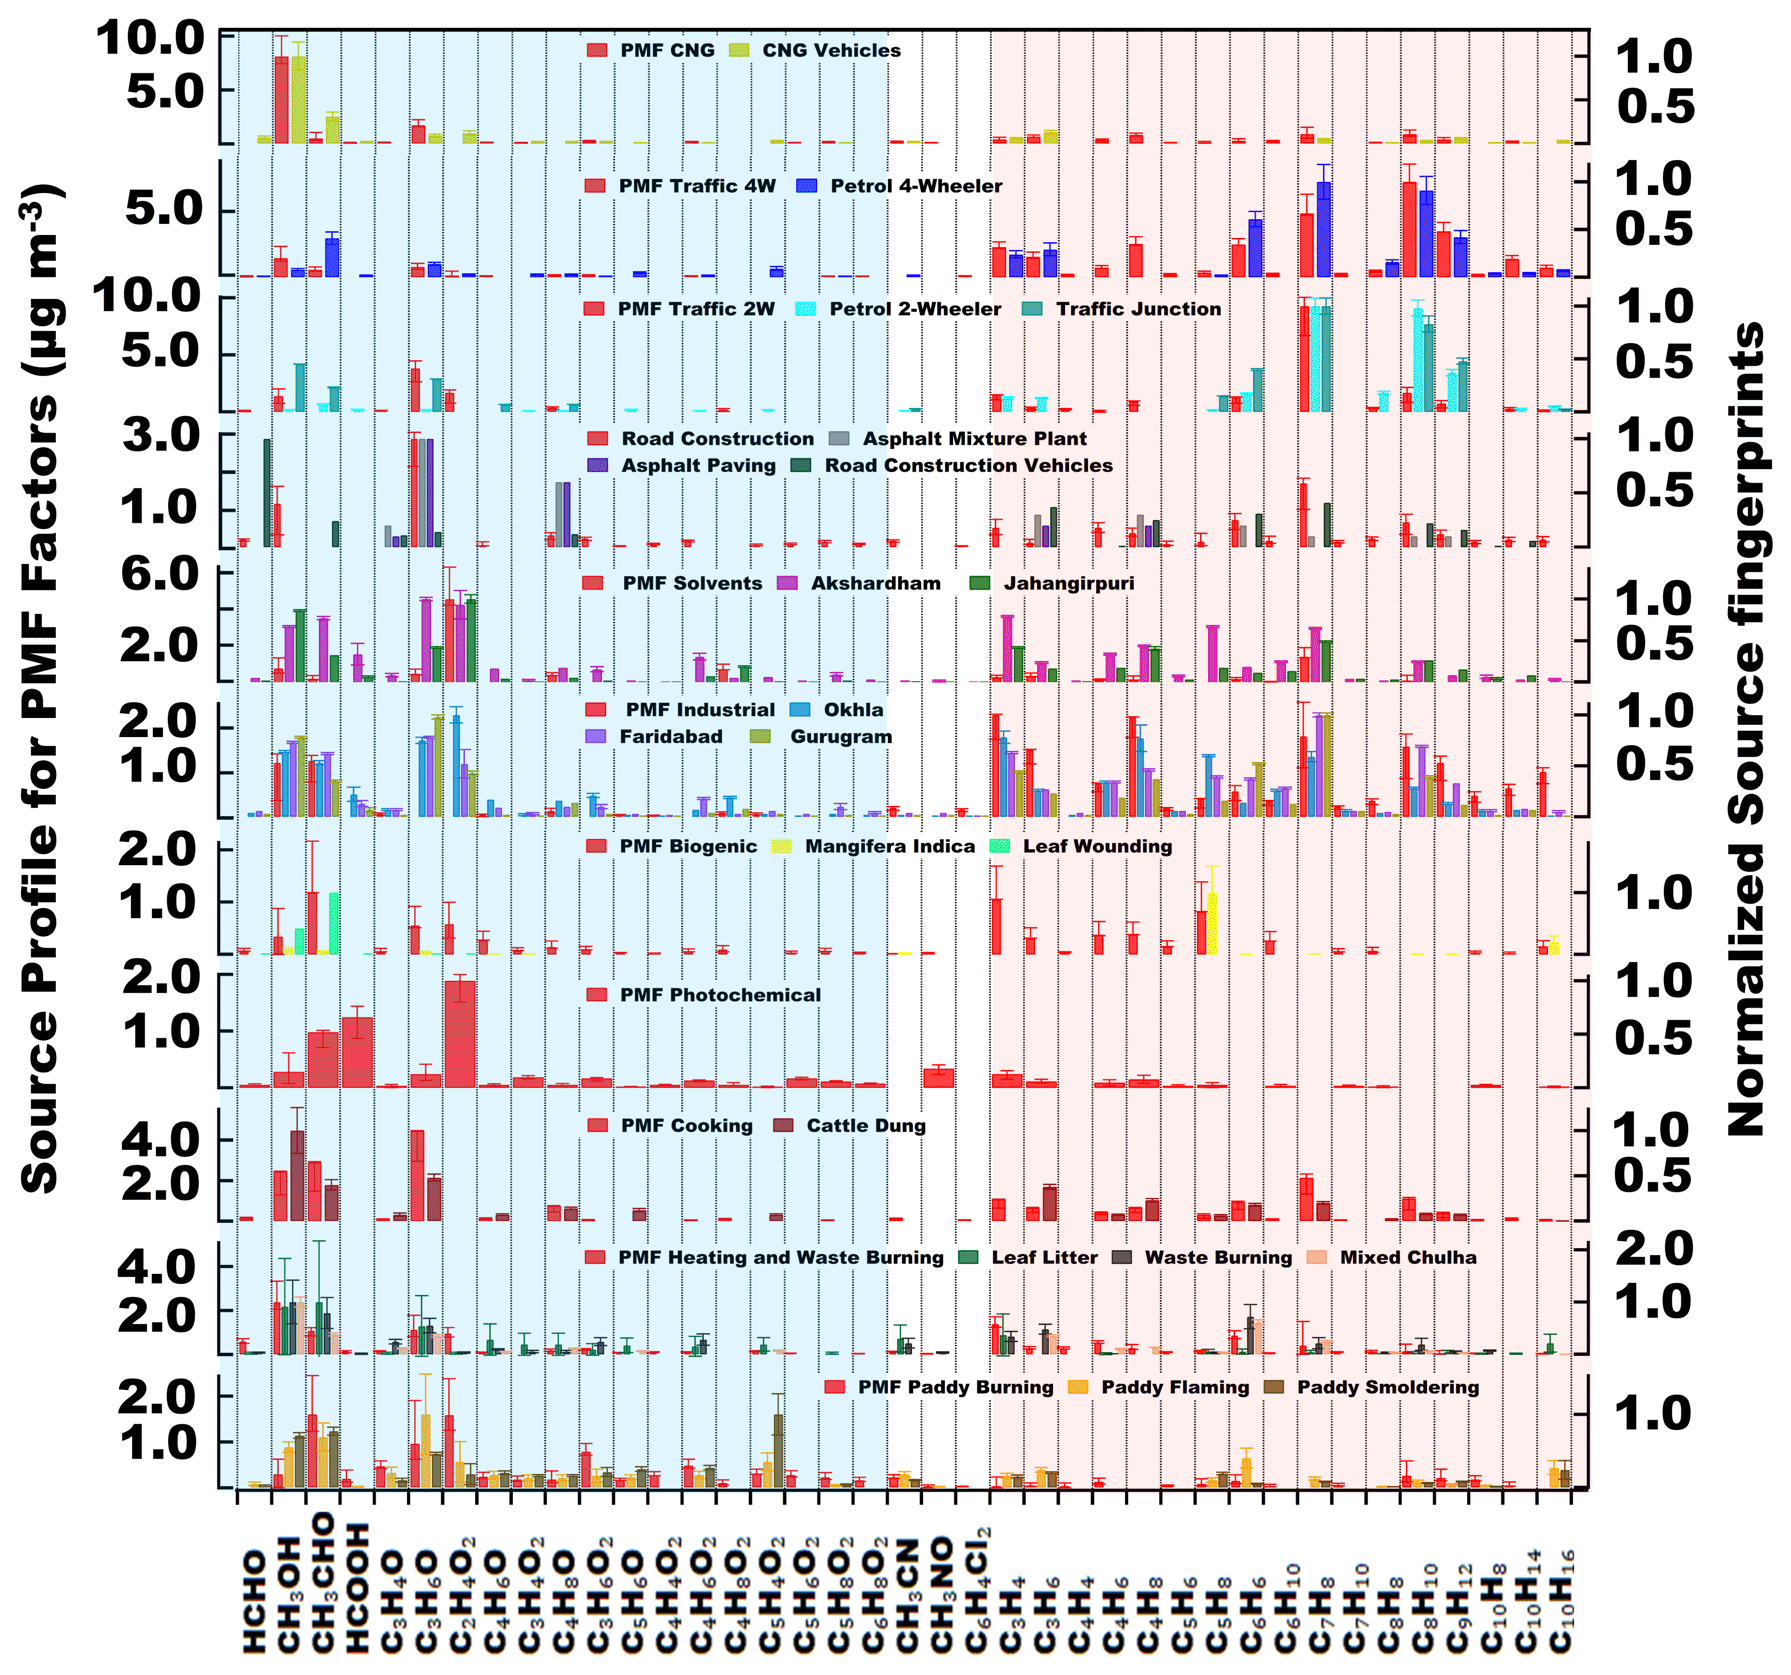
Figure 3PMF factor profile for the 11 factors identified. The source profile, measured in µg m−3 (shown in red on the left), and the normalized source fingerprint of the grab samples collected at the source (shown in various colours on the right). The error bars indicate the 2σ uncertainty range from the bootstrap runs for PMF factor profiles and the 1σ error in the mean of the emission factors for the source samples.
3.1 Validation of the PMF output with source fingerprints
Figure 3 shows the source profile for the 11 factors resolved in our PMF analyses. Out of the 111 VOCs, only those whose normalized source contribution exceeded 0.1 (when divided by the most abundant compound in the same source profile for at least one of the sources) were included in the figure. The source identities of the PMF factors were confirmed by matching the PMF factor profiles (measured in units of µg m−3) with normalized source fingerprints of grab samples collected from the potential sources. To facilitate the comparison of emission factors and grab samples from different studies with the PMF output, the source samples were normalized by dividing each species' mass (emission factor) by the mass (emission factor) of the most abundant species in a given fingerprint. The PMF factor profile best matched source samples collected from burning paddy fields (R = 0.6; Kumar et al., 2020) for the paddy-residue-burning factor. The cooking factor matched emissions from a cow-dung-fired traditional stove, called an angithi (R = 0.7; Fleming et al., 2018). The residential-heating and waste-burning factor had a source fingerprint that matched emissions from leaf litter burning (R = 0.7; Chaudhary et al., 2022), waste burning (R = 0.7; Sharma et al., 2022), and cooking on a chulha fired by a mixture of firewood and cow dung (R = 0.9; Fleming et al., 2018). The factors identified as CNG (R = 1.0), petrol four-wheelers (R = 0.9), and petrol two-wheelers (R = 0.6) matched the tailpipe emissions of the respective vehicle types and fuels (Hakkim et al., 2021). The petrol four-wheelers (R = 0.9) and petrol two-wheelers (R = 0.7) also matched traffic junction grab samples from Delhi (Chandra et al., 2018). The OVOC source fingerprint of the road construction factor matched the source fingerprint of asphalt mixture plants and asphalt paving (R = 0.9; Li et al., 2020), while the hydrocarbon source fingerprint matched the source fingerprint of diesel-fuelled road construction vehicles (R = 0.6; Che et al., 2023). The factors identified as solvent usage and evaporative emissions matched ambient air grab samples collected from an industrial area in Jahangirpuri (R = 0.7) and a “dhobi ghat” in Akshardham (R = 0.5) in this study. The factor identified as industrial emissions showed the greatest similarity to ambient air grab samples from the vicinity of the Okhla waste-to-energy plant (R = 0.8), Gurugram (R = 0.7), and the Faridabad industrial area (R = 0.8). The biogenic factor showed the greatest similarity to leaf-wounding compounds released from Populus tremula (R = 0.8; Portillo-Estrada et al., 2015) and biogenic volatile organic compound (BVOC) fluxes from Mangifera indica (R = 0.4; Datta et al., 2021).
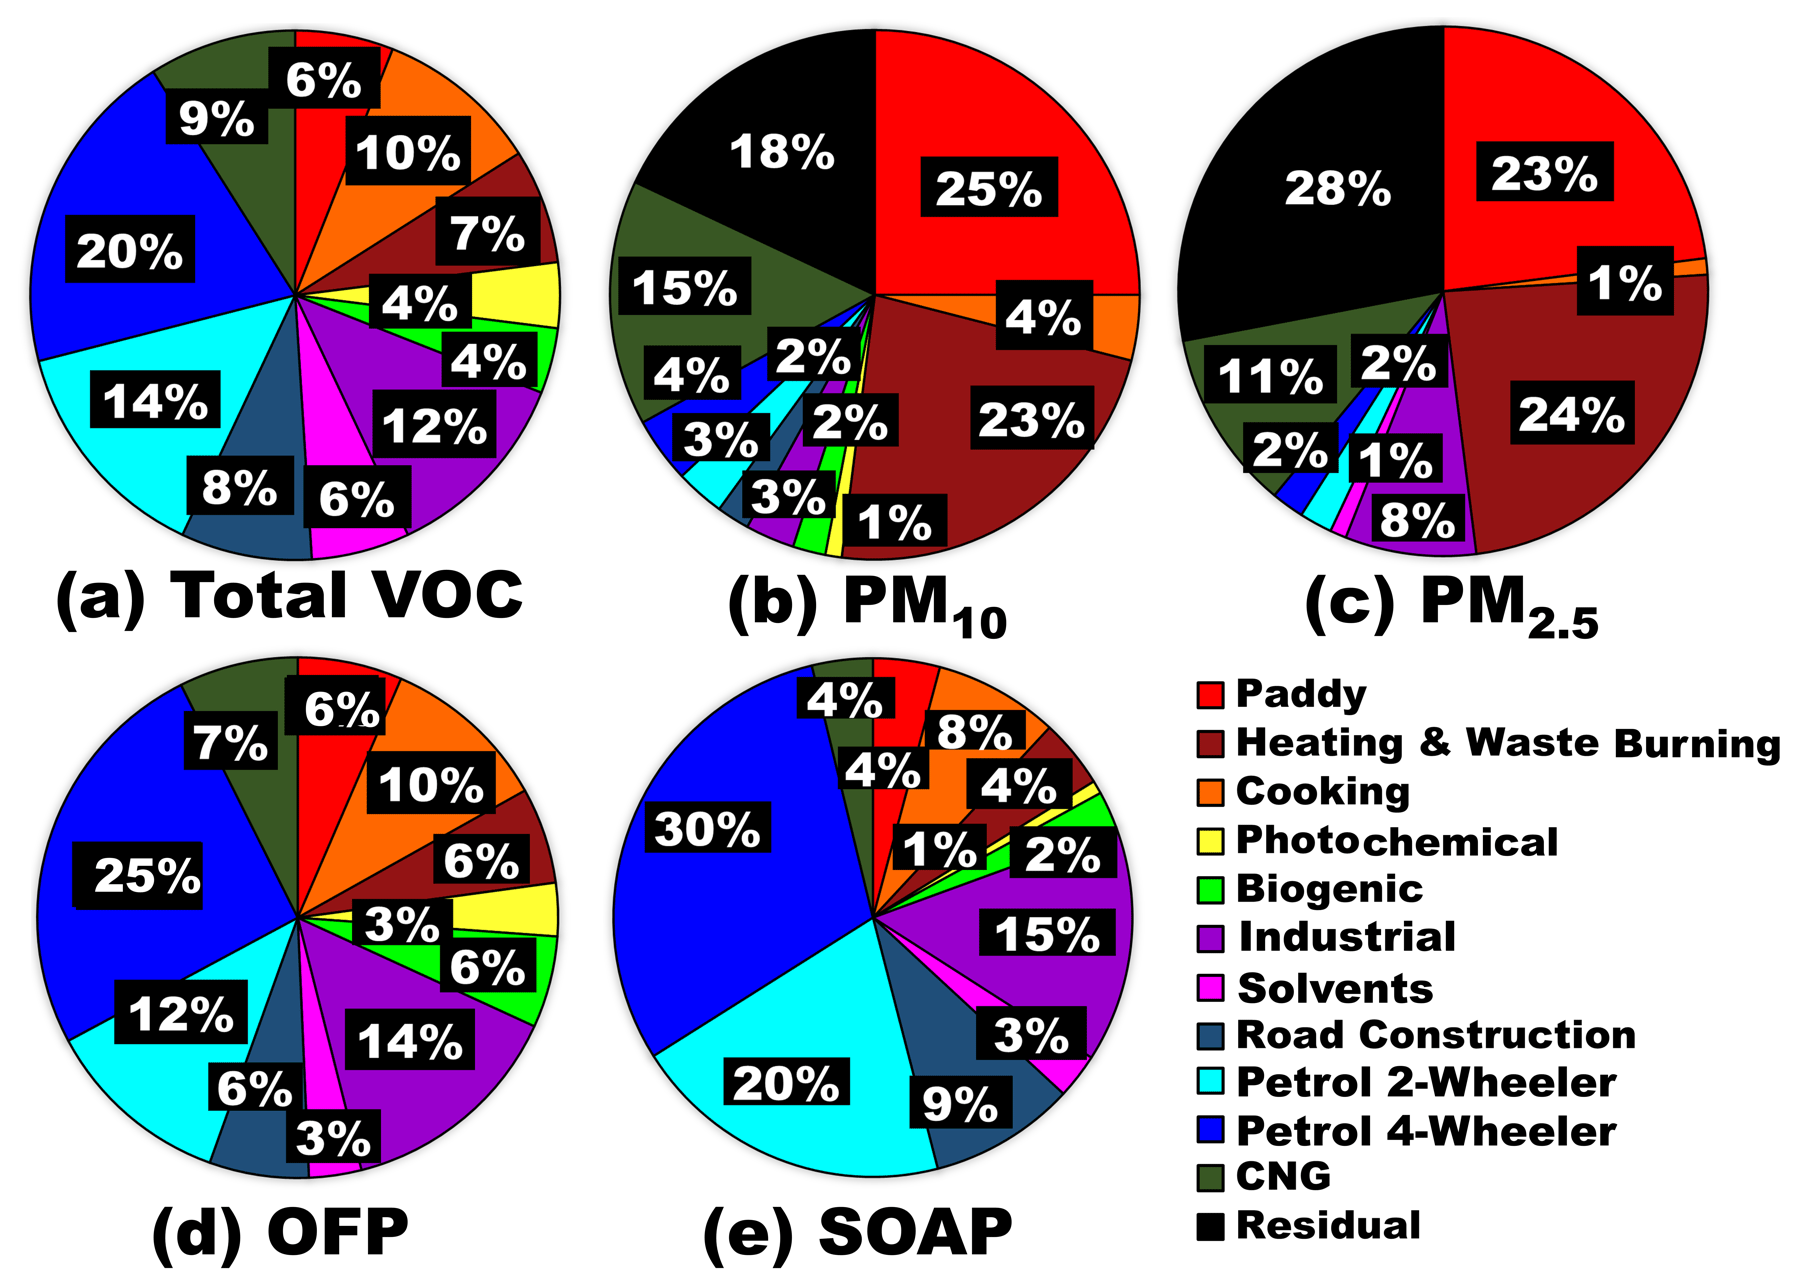
Figure 4Source contributions from the 11 sources to (a) total ambient VOC mass loading, (b) PM10 mass loading, (c) PM2.5 mass loading, (d) ozone formation potential, and (e) SOA formation potential.
Figure 4 shows the relative contributions of different sources to the total pollution burden of VOCs, PM2.5, and PM10 at the receptor site. In the megacity of Delhi, transport sector sources contributed the most (42 ± 4 %) to the total VOC burden, while they contributed much less (only 24 %) to the total VOC burden in Mohali, a suburban site 250 km north of Delhi, during the same season (Singh et al., 2023). On the other hand, the contributions of paddy residue burning (6 ± 2 %) and the summed residential-sector emissions (17 ± 3 % in Delhi and 18 % in Mohali) to the total VOC burden during post-monsoon season were similar at both sites. The contribution of the different factors to SOA formation potential (Fig. 4e) stands in stark contrast to the factors' contribution to primary PM emissions. SOA formation potential was dominated by the transport sector (54 %), while direct PM10 (52 ± 8 %) and PM2.5 (48 ± 12 %) emissions were dominated by different biomass-burning sources (Fig. 4b and c). CNG-fuelled vehicles also contributed significantly to the PM10 (15 ± 3 %) and PM2.5 (11 ± 3 %) burdens. A significant share of the PM10 (18 %) and PM2.5 (28 %) burdens is associated with the residual (Eij in Eq. 1) and is not directly linked to co-emitted combustion tracers. This share is likely attributed to windblown dust arriving at the site through long-range transport (Pawar et al., 2015), to secondary organic aerosols, and to secondary inorganic aerosols (such as ammonium sulfate and ammonium nitrate). Due to the complex relationship between secondary aerosols and gas-phase precursors and emission tracers, VOC tracers are not suitable for conducting source apportionment for this aerosol component. Meteorological conditions, along with homogeneous, heterogeneous, and multiphase chemistry, control how quickly primary emissions are converted to secondary aerosols. To explain the source of these species, one also needs to consider the physicochemical and thermodynamical properties of the aerosol (Acharja et al., 2022).
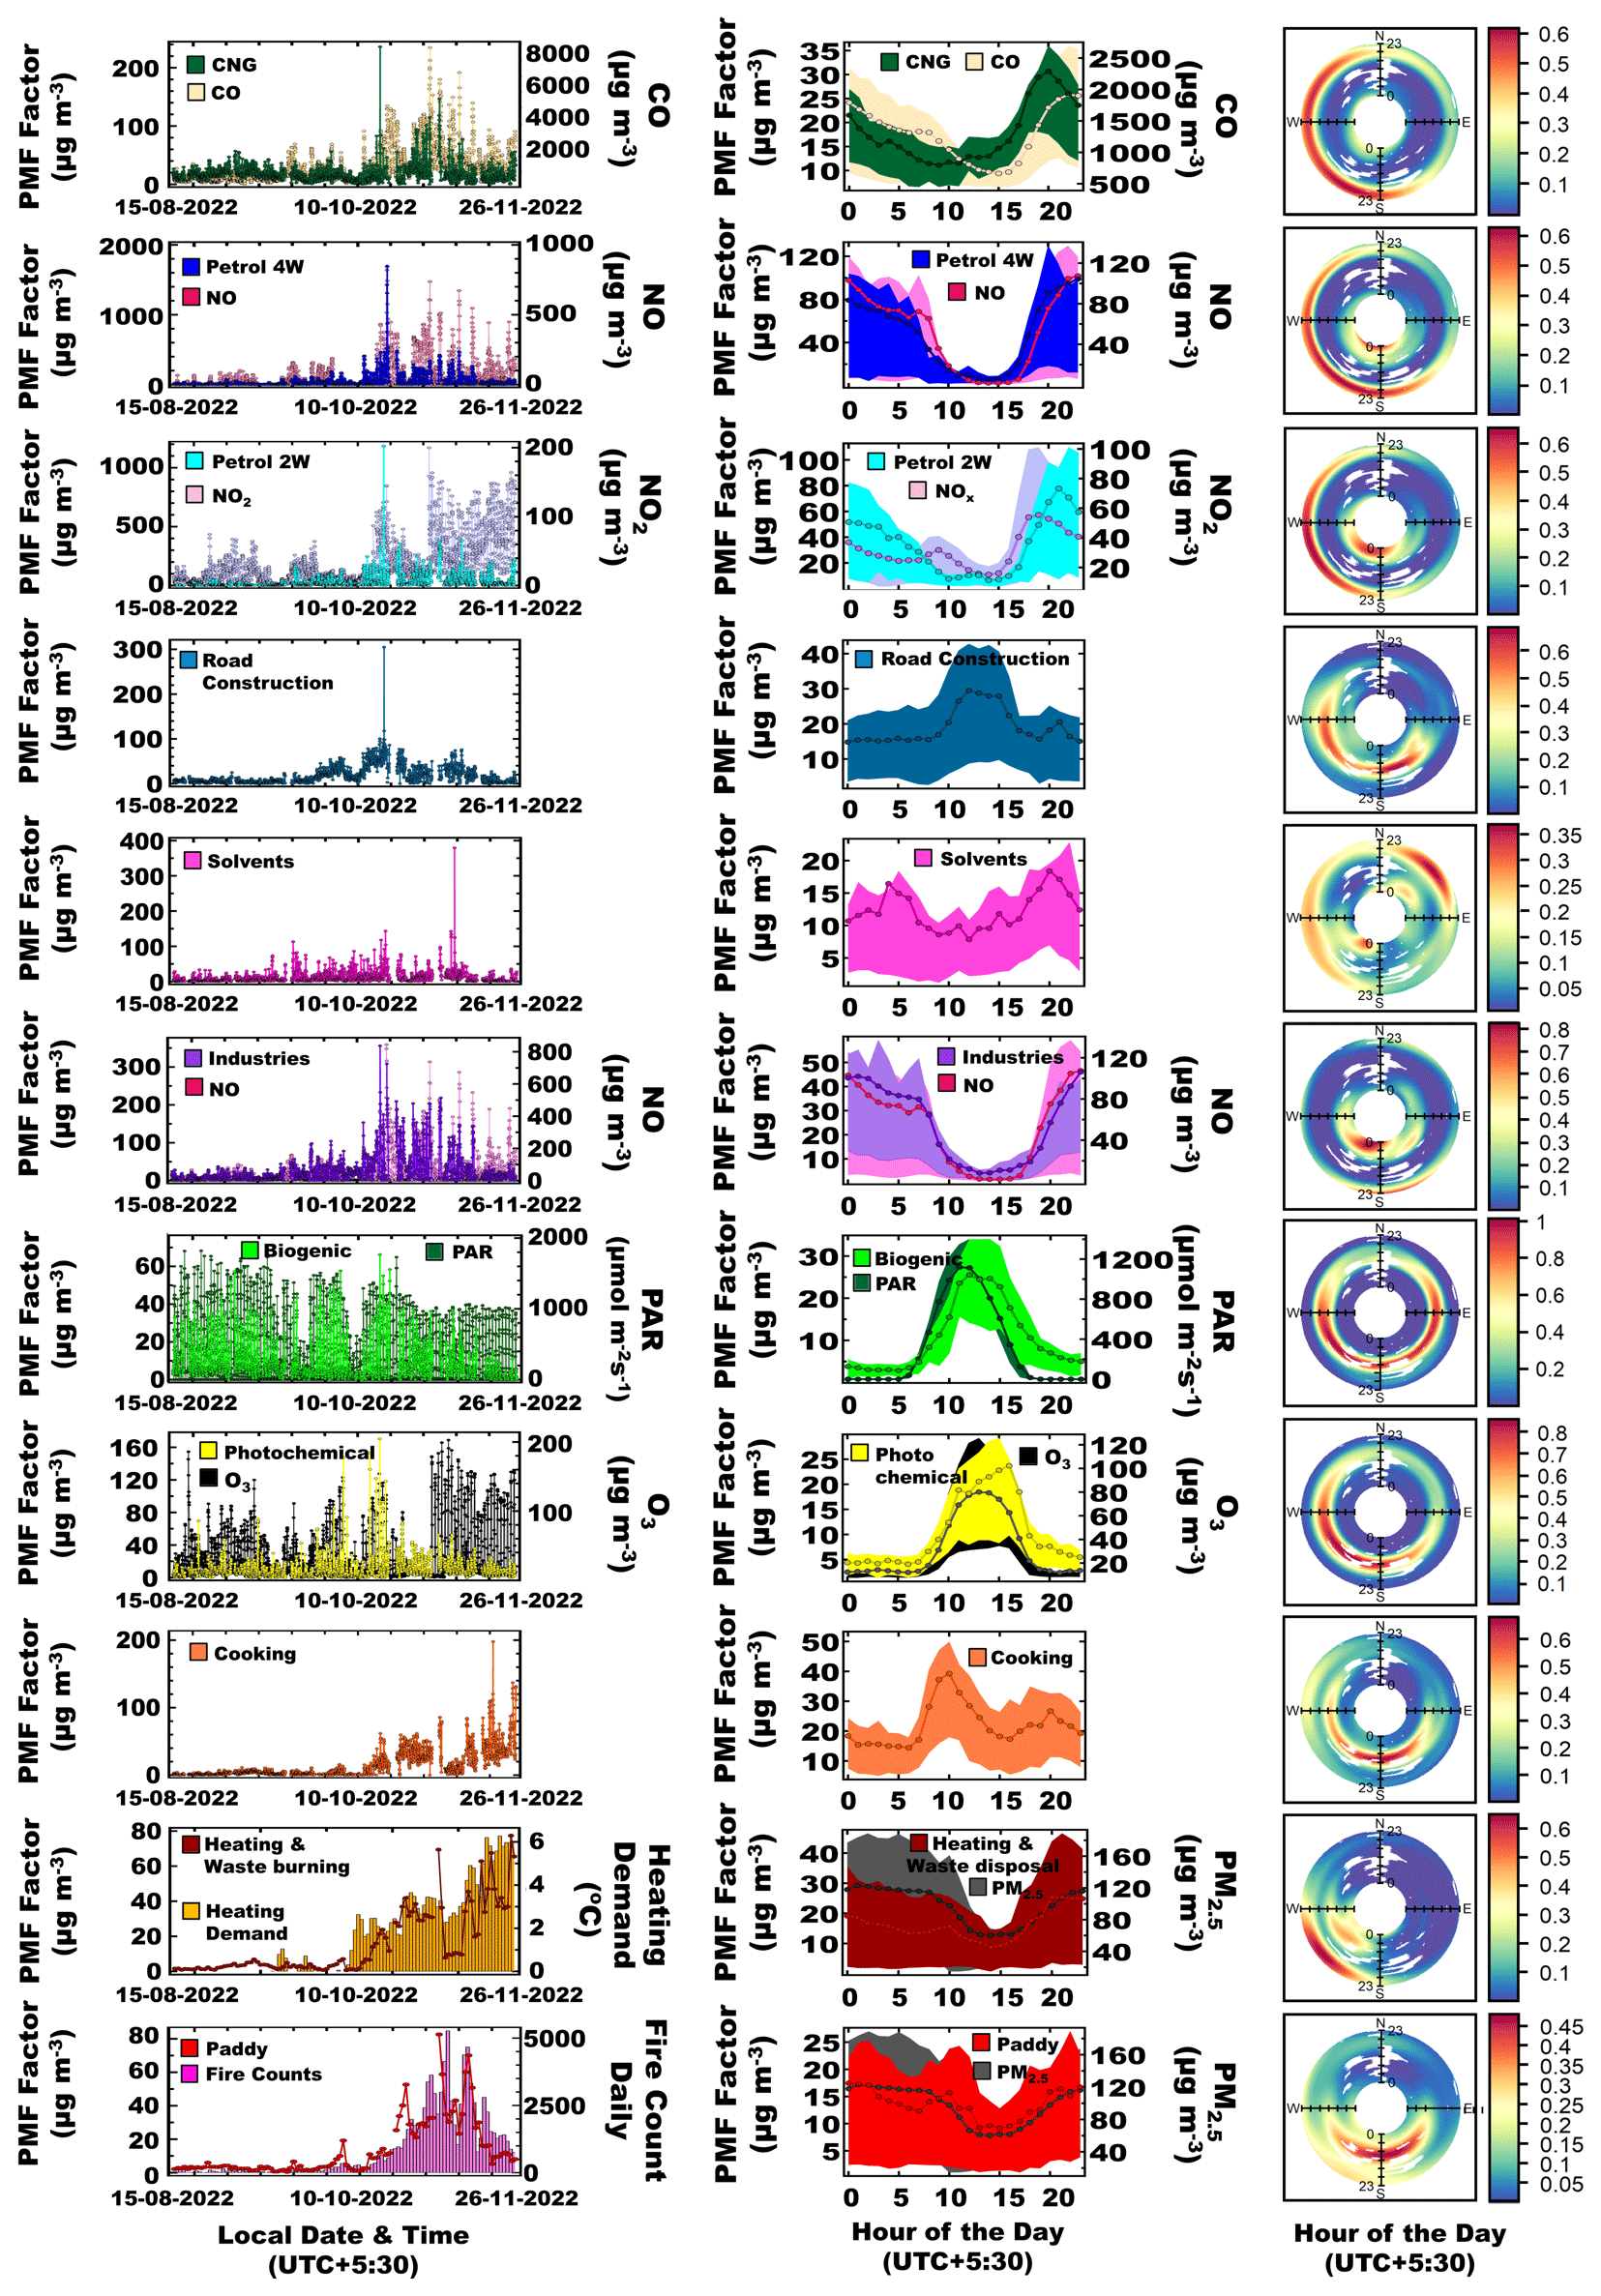
Figure 5Time series for each factor (left column), measured in µg m−3, with corresponding normalized diurnal profiles (centre column). The shaded region in the diurnal profiles depicts the area between the 25th and 75th percentiles, while the median of the dataset is indicated by the line. The polar plots (right column) depict the conditional probability of a factor having a mass contribution above the 75th percentile of the dataset during certain hours of the day between 00:00 (centre of the rose) and 23:00 IST (UTC+5:30) (outer edge of the rose) from a specific wind direction. This probability is determined by dividing the number of observations above the 75th percentile by the total number of measurements in each bin.
3.2 Detailed discussion of individual emission sources
3.2.1 Factor 1: paddy residue burning
Paddy residue burning was one of the largest contributors to the total observed PM10 (25 %) and PM2.5 (23 %; Fig. 4b and c) mass concentrations in Delhi. An earlier WRF–Chem-based study using version 1.5 of the Fire INventory from the National Center for Atmospheric Research (FINNv1.5) attributed 20 % of the PM2.5 burden to this source for the year 2018 (Kulkarni et al., 2020). Its importance as a PM source stands in stark contrast to its minor contribution to the overall VOC mass loading in Delhi (6 %). In Mohali, Punjab, this source also only contributed 6 % to the VOC burden in October and November (Singh et al., 2023). In descending order of mass contribution, acetaldehyde (CH3CHO), acetic acid (C2H4O2), acetone + propanal (C3H6O), hydroxyacetone (C3H6O2), acrolein (C3H4O), diketone (C4H6O2), and furfural (C5H4O2) contributed the most to the total VOC mass pertaining to this factor. Figure 5 shows that the 24 h averaged factor contribution time series has the highest cross-correlation with same-day fire counts (R = 0.8), while hourly averaged source contributions correlate most with PM2.5 (0.7) and PM10 (0.7; Table S4). The high correlation with same-day fire counts indicates that nearby fire activity is the dominant source of paddy-burning-related pollution in the Delhi NCR. A recent study from Punjab indicated that the largest PM enhancements at a receptor site are caused by fires occurring within a 50 km radius around the receptor site (Pawar and Sinha, 2022). Figure S6 shows that the PM2.5 and PM10 mass loadings at the receptor site increased by 0.027 ± 0.006 and 0.047 ± 0.01 µg m−3, respectively, for each additional fire count within the 24 h fetch region whenever the trajectories arrived from the northwest and southwest region. It is very interesting to note that the incremental increase in PM2.5 and PM10 mass loadings for each additional fire count was almost 4 times higher than the increases observed in the aforementioned regions when the trajectory fetch region was located to the southeast, amounting to 0.11 ± 0.01 and 0.19 ± 0.02 µg m−3, respectively. This is likely because complete burns of entire fields (Fig. S7), which are prominent in Punjab, can be more easily identified as fire activity using satellite-based detection (Liu et al., 2019, 2020), while partial burns (Fig. S8), which are more prevalent in the eastern IGP and Haryana, have larger omission errors (Liu et al., 2019, 2020). Regional gradients in fire detection efficiency can complicate attempts to model air quality using fire-count-based emission inventories (Kulkarni et al., 2020).
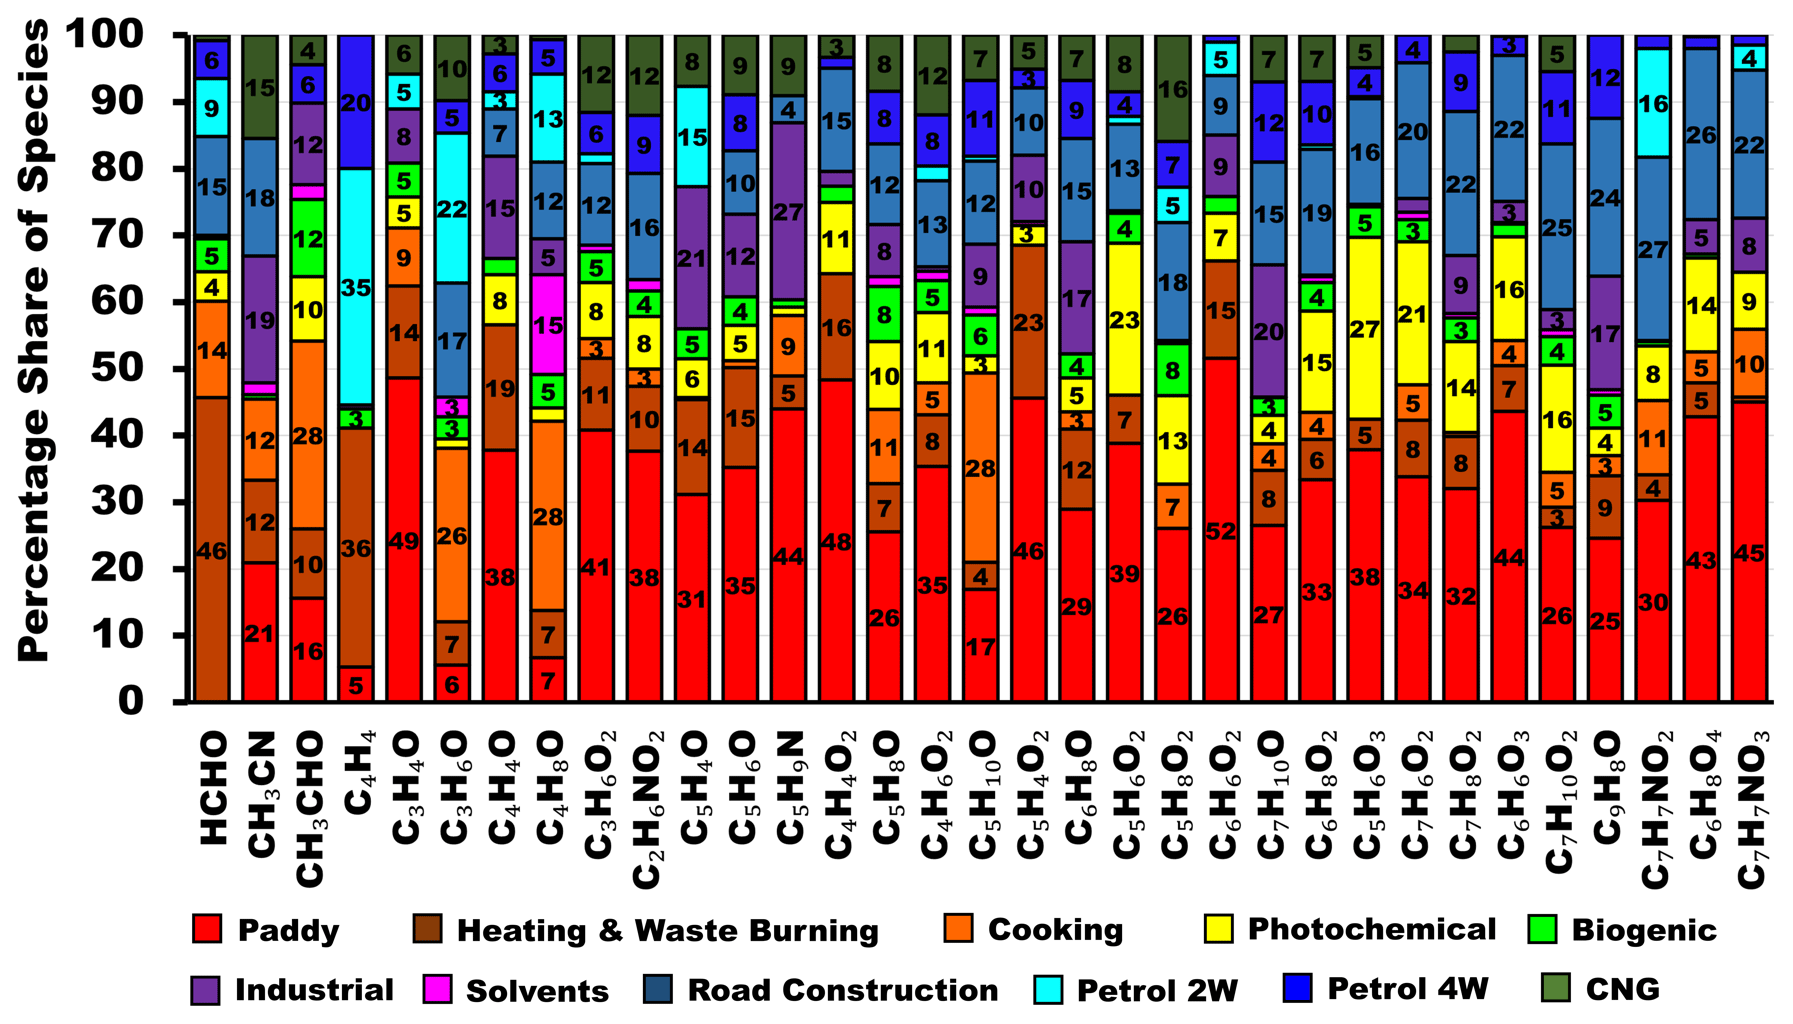
Figure 6Contribution of PMF factors to VOC species to which different forms of biomass burning contribute the highest percentage share of the atmospheric burden in Delhi.
Figure 6 shows that this factor accounted for the largest percentage share of O-heteroarene compounds, such as furfural (C5H4O2), methylfurfural (C6H6O2), hydroxymethylfurfural (C6H6O3), furanone (C4H4O2), hydroxymethyl furanone (C5H6O3), furfuryl alcohol (C5H6O2), furan (C4H4O), methylfuran (C5H6O), C2-substituted furan (C6H8O), and C3-substituted furan (C7H10O). These compounds are produced by the pyrolysis of cellulose and hemicellulose and have previously been detected in biomass-burning samples (Coggon et al., 2019; Hatch et al., 2015, 2017; Koss et al., 2018; Stockwell et al., 2015). Figure 6 also shows that this factor accounts for the largest share of the most abundant oxidation products resulting from nitrate-radical-initiated oxidation of toluene and from OH-initiated oxidation of aromatic compounds under high-NOx conditions, namely nitrotoluene (C7H7NO2) and nitrocresols (C7H7NO3; Ramasamy et al., 2019). This indicates a certain degree of ageing of the plumes. These nitroaromatic compounds are significant contributors to SOAs and brown carbon (BrC; Palm et al., 2020; Harrison et al., 2005a, b). This also explains several other nitrogen-containing VOCs, such as nitroethane (C2H6NO2), the biomass-burning tracer acetonitrile (CH3CN), and pentanenitrile (C5H9N). The presence of pentanenitrile isomers in biomass-burning smoke has previously been confirmed using gas-chromatography-based studies (Hatch et al., 2015, 2017). In addition, the factor accounts for the largest percentage share of acrolein (C3H4O), hydroxyacetone (C3H6O2), cyclopentadienone (C5H4O), cyclopentanone (C5H8O), diketone (C4H6O2), pentanedione (C5H8O2), hydroxybenzaldehyde (C7H6O2), guaiacol (C7H8O2), and the levoglucosan fragment (C6H8O4). Many of these compounds are known to form during lignin pyrolysis (Hatch et al., 2015; Koss et al., 2018; Nowakowska et al., 2018), while dimethylbutenedial (C6H8O2) and trimethylbutenedial (C7H10O2) are ring-opening oxidation products of aromatic compounds (Zaytsev et al., 2019). Figure S9 shows the volatility oxidation state plot for all 111 VOCs, where the marker size represents the percentage share of each compound accounted for by the paddy-residue-burning factor and markers are colour-coded according to the number of carbon atoms. The plot shows evidence that first- and second-generation oxidation products of C5 and C6 hydrocarbons transition from the VOC to the IVOC range along trajectories expected for the addition of the =O functionality to the molecules (Jimenez et al., 2009), while C7 hydrocarbons progress along trajectories expected for the addition of -OH and the =O functionality. This indicates that paddy residue burning contributes significantly to the SOA burden. However, the fact that the PM10 mass associated with this factor (36.5 µg m−3) is 1.8 times larger than the PM2.5 mass (20.7 µg m−3) and 3 times larger than the VOC mass released during the same combustion process (11.6 µg m−3) suggests that the relatively coarse ash formed from the phytolith skeleton of rice straw (Fig. S10) is the dominant aerosol source.
3.2.2 Factor 2: residential heating and waste burning
The residential-heating and waste-burning factor is the second-largest PM source at the receptor site and contributes 23 % and 24 % to the total PM10 and PM2.5 mass loadings, respectively (Fig. 4). However, it contributed only 7 % to the total VOC mass loading, and it contributed 6 % and 4 % to ozone formation potential and SOA formation potential, respectively (Fig. 4). Emissions peak at nighttime (Fig. 5), and the factor contribution time series displays the largest cross-correlation with the 24 h averaged heating demand (R = 0.8; Fig. S6), PM10 (R = 0.7), PM2.5 (R = 0.6), NO2 (R = 0.7), and CO (R = 0.5; Table S4). The lower correlation with NO (R = 0.4; Table S4) indicates that emissions are related to combustion but are not always fresh. Occasionally, fresh plumes reach the receptor site within minutes; however, the majority of plumes have a higher atmospheric age as NO is a short-lived species and is oxidized to NO2 on a timescale of minutes in the presence of ozone (Sinha et al., 2014). The factor contribution time series is anti-correlated with temperature (R = −0.6) and has a strong correlation with the 24 h averaged heating demand (R = 0.8), indicating that this combustion activity is primarily triggered by the need to keep warm. Figure S11 shows that the PM2.5 and PM10 mass loadings at the receptor site increase by 13.9 µg m−3 and 22.3 µg m−3, respectively, for each degree increase in the 24 h averaged heating demand. Earlier studies have documented the strong seasonality of open-waste-burning emissions over Delhi, as well as the diversity of fuel used in wintertime heating-related fires (Nagpure et al., 2015). This factor accounts for 7 % of the total VOC mass loading. The top contributors to the VOC mass of this factor, in descending order of contribution, are methanol (CH3OH), propyne (C3H4), acetone + propanal (C3H6O), acetaldehyde (CH3CHO), acetic acid (C2H4O2), and benzene (C6H6). Figure 6 shows that this factor accounts for the largest percentage share of the total mass for formaldehyde (HCHO) and vinylacetylene + 1-buten-3-yne (C4H4), and it accounts for the second-largest percentage share of furfural (C5H4O2), methylfurfural (C6H6O2), furan (C4H4O), methylfuran (C5H6O), furanone (C4H4O2), and acrolein (C3H4O). All these compounds are characteristic of biomass-burning smoke (Hatch et al., 2015; Stockwell et al., 2015; Koss et al., 2018).
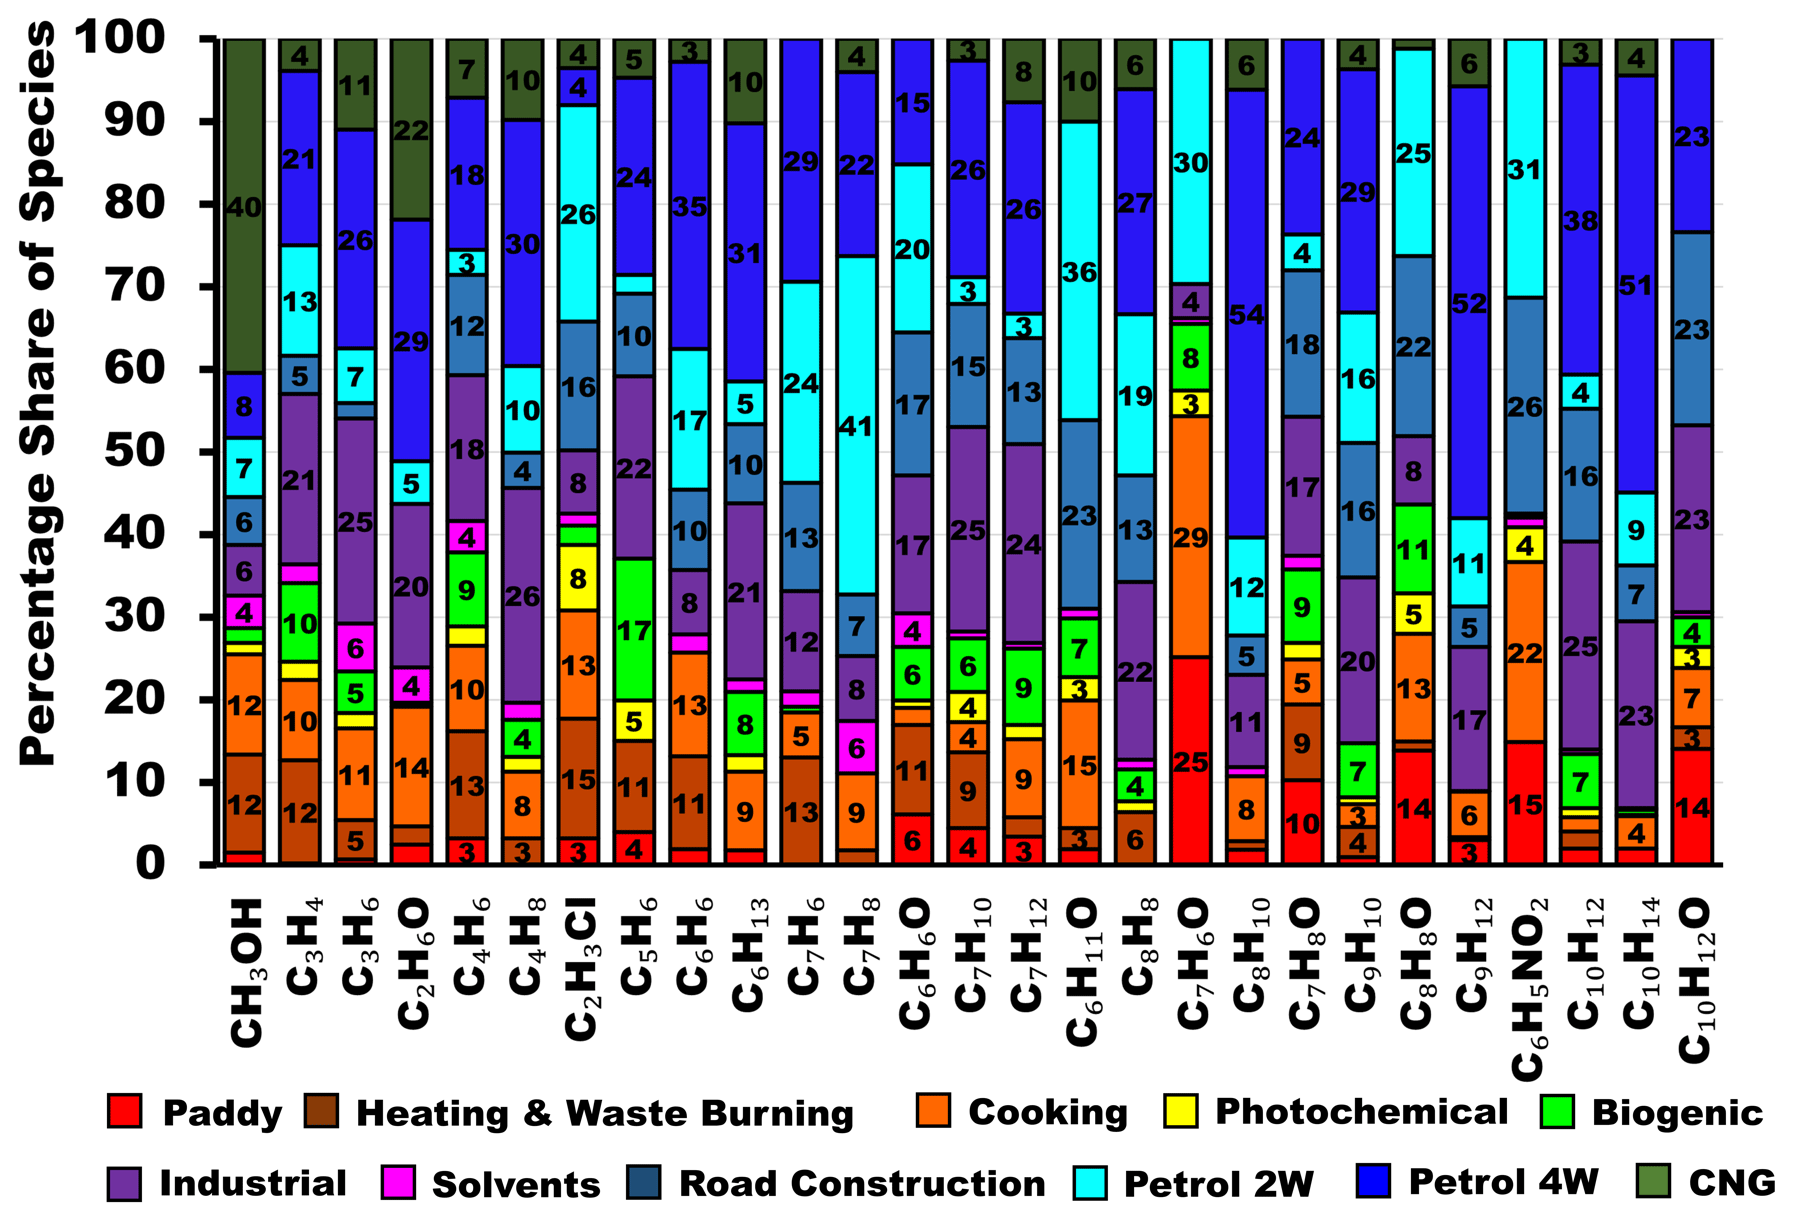
Figure 7Contribution of PMF factors to VOC species to which the transport sector contributes the highest percentage share of the atmospheric burden in Delhi.
3.2.3 Factor 3: solid-fuel-based cooking
The cooking factor is a daytime factor and accounts for 10 % of the total VOC mass loading, 10 % of the ozone formation potential, and 8 % of the SOA formation potential (Fig. 4). However, it only accounts for a negligible share of the total PM10 burden (≤ 4 %). The volatility oxidation state plot (Fig. S9) also shows very little evidence of IVOC oxidation products that could partition into the aerosol phase. The activity peaks from 08:00 to 12:00 IST, with a secondary peak in the early evening hours, and persists throughout the monsoon and post-monsoon seasons. Emissions reaching the receptor site show no correlation with NO (R = 0.1), indicating that the plumes are not fresh. In descending order of mass contribution, acetone (C3H6O), acetaldehyde (CH3CHO), methanol (CH3OH), toluene (C7H8), the sum of the C8 aromatics (C8H10), propyne (C3H4), and benzene (C6H6) contribute the most to this factor. These aromatic compounds have been reported to originate from cooking emissions (Crippa et al., 2013). Figure 6 shows that this factor accounts for the largest percentage share of butanone (C4H8O), pentanone (C5H10O), acetaldehyde (CH3CHO), acetone (C3H6O), and benzaldehyde (C7H6O). All these compounds are characteristic of biomass-burning smoke (Hatch et al., 2015; Stockwell et al., 2015; Koss et al., 2018).
3.2.4 Factor 4: CNG
CNG-fuelled vehicles are identified as the third-largest source of PM10 (15 %) and PM2.5 (11 %), contributing 9 % to the total VOC burden (Fig. 4). The much higher contribution of this source to the coarse-mode PM burden (PM10 value of 22.5 µg m−3) compared to the fine-mode PM burden (PM2.5 value of 10.4 µg m−3) confirms earlier emission-inventory-based estimates that flagged that non-tailpipe emissions, such as brake wear, tyre wear, and road dust resuspension, have become the dominant transport-sector-related PM sources in the Delhi NCR (Nagpure et al., 2016). While non-tailpipe emissions contribute the most to the PM10 burden, they have also become the largest source of transport-sector-related fine-mode aerosols and VOC emissions in certain countries that have adopted Euro VI norms (Harrison et al., 2021). This study attributes a large share of these non-tailpipe emissions to trucks, buses, and other commercial vehicles that are typically fuelled by CNG. This is because commercial diesel vehicles younger than 10 years face severe entry restrictions that limit their use within the Delhi NCR, while older diesel vehicles have been completely banned from operating within city limits. Policy interventions in favour of CNG use (Krelling and Badami, 2022) have resulted in a halving of diesel sales, a rapid transition to CNG for Delhi's heavy-duty-vehicle (HDV) fleet (Fig. S12), and a significant reduction in tailpipe exhaust emissions. In descending order, methanol (CH3OH), acetone + propanal (C3H6O), toluene (C7H8), C8 aromatic compounds (C8H10), butene (C4H8), propene (C3H6), and acetaldehyde (CH3CHO) contribute the most to the VOC mass in this source. Figure 7 shows that this factor accounts for the largest percentage share of methanol (CH3OH) and the second-largest percentage share of ethanol (C2H6O). These compounds are formed by the incomplete combustion of CNG, which is catalytically converted to methanol and ethanol (Singh et al., 2016).
3.2.5 Factor 5: petrol four-wheeler factor
Figure 4 shows that petrol four-wheelers contributed 20 %, 25 %, and 30 % to VOC mass loading, OFP, and SOAP, respectively. The source fingerprint here matches the tailpipe emissions of petrol-fuelled four-wheelers (Hakkim et al., 2021) and is characterized, in descending order of contribution, by C8 aromatics, toluene, C9 aromatics (C9H12), benzene, butene + methyl tert-butyl ether (MTBE) fragment, propyne, propene, methanol, and C2-substituted xylene + C4-substituted benzene (C10H14). Figure 5 shows that emissions peak in the evening between 19:00 and 00:00 IST, exhibiting average VOC mass loadings > 70 µg m−3, and reach the receptor site from most wind directions. Emissions are strongly correlated with NO (R = 0.8), CO (R = 0.7), and CO2 (R = 0.7), indicating that the receptor site is impacted by fresh combustion emissions from this source and that the atmospheric age of most plumes corresponds to the timescale of minutes. Figure 7 shows that this factor accounts for the largest percentage share of most aromatic compounds, namely C8 aromatics, toluene, C9 aromatics (C8H12), C4-substituted benzene + C2-substituted xylene, benzene, styrene (C8H8), methylstyrene + indane (C9H10), and C2-substituted styrene (C10H12), as well as a few oxygenated aromatic hydrocarbons, such as methyl phenol isomers (C7H8O) and methyl chavicol (C10H12O). The fact that this factor accounts for the largest percentage share of ethanol and the MTBE fragment (C4H8) can likely be attributed to ethanol blending and the use of MTBE in petrol (Achten et al., 2001). This factor also accounts for the largest percentage share of several other hydrocarbons, such as propyne (C3H4), propene (C3H6), cyclopentadiene (C5H6), hexane (C6H13), C7H6, C7H10, and cycloheptene (C7H12).
Figure S9 shows that this factor contributes significantly to the burden of C6–C10 hydrocarbons and, consequently, to SOA formation potential. However, due to freshly emitted plumes, it barely contributes to the burden of the first- and second-generation oxidation products of these hydrocarbons at the receptor site. Instead, this factor is likely to contribute to secondary-pollutant formation downwind of the Delhi NCR.
3.2.6 Factor 6: petrol two-wheeler factor
Figure 4 shows that petrol two-wheelers contributed 14 %, 12 %, and 20 % to VOC mass loading, OFP, and SOAP, respectively. The fingerprint of this source matches the tailpipe emissions of petrol-based two-wheelers (Hakkim et al., 2021) and is characterized, in descending order of contribution, by toluene, acetone + propanal, C8 aromatic compounds, acetic acid (C2H4O2), propyne (C3H4), methanol (CH3OH), benzene (C6H6), the MTBE fragment, and C9 aromatics (C9H12). A key difference between the petrol two-wheeler source profile and the petrol four-wheeler source profile is the lower benzene-to-toluene ratio, which is supported by the gas chromatography–flame ionization detection (GC-FID) analysis of tailpipe exhaust emissions (Kumar et al., 2020). Figure 5 shows that emissions peak in the evening between 20:00 and 22:00 IST, exhibiting average VOC mass loadings > 50 µg m−3, and reach the receptor site from most wind directions. Emissions are strongly correlated with NOx (R = 0.6), CO (R = 0.6), and CO2 (R = 0.7); however, they have a lower correlation with NO (R = 0.5; Table S4) and provide a larger contribution of oxygenated compounds to the source profile, indicating that the emissions have been photochemically aged. This suggests that, unlike four-wheeler plumes, which originate from the immediate vicinity of the receptor site in Central Delhi (Fig. S1), two-wheeler plumes reach the receptor site after prolonged transport from more distant rural and suburban areas on the outskirts of the city. In such areas, people often favour two-wheelers over four-wheelers. Figure 7 shows that this factor accounts for the largest percentage share of toluene and a number of oxygenated aromatic compounds, such as benzaldehyde (C7H6O), tolualdehyde (C8H8O), and phenol (C6H6O). It also accounts for the largest percentage share of nitrobenzene (C6H5NO2), cyclohexanone (C6H11O), and vinyl chloride (C2H3Cl). It also accounts for the second-largest percentage share of benzene, vinylacetylene (C4H4), acetone + propanal, methoxyamine (CH5NO), and butanoic acid + ethyl acetate (C4H9O2).
3.2.7 Factor 7: industrial point sources
This factor contributes 12 %, 14 %, 15 %, 8 %, and 3 % to VOC mass loading, OFP, SOAP, PM2.5 mass loading, and PM10 mass loading, respectively. On average, more than 30 µg m−3 of the VOC burden throughout the night, from 21:00 to 07:00 IST (Fig. 5), is attributed to this factor. This factor is identified corresponding to industrial point sources located in the wind sector south to southwest of the receptor site. Emissions are most strongly correlated with CO (R = 0.7), NO (R = 0.7), CH4 (R = 0.8), and CO2 (R = 0.8), indicating that the emissions are fresh and originate from combustion processes. The main contributors to the VOC mass in the industrial factor, in descending order of contribution, are propyne (C3H4), butene + the MTBE fragment (C4H8), toluene (C7H8), C8 aromatic compounds (C8H10), propene (C3H6), acetaldehyde (CH3CHO), methanol (CH3OH), C9 aromatics, and the sum of monoterpenes (C10H16). The source fingerprint is most similar to ambient air grab samples collected near the Okhla waste-to-energy plant and the industrial area in Faridabad.
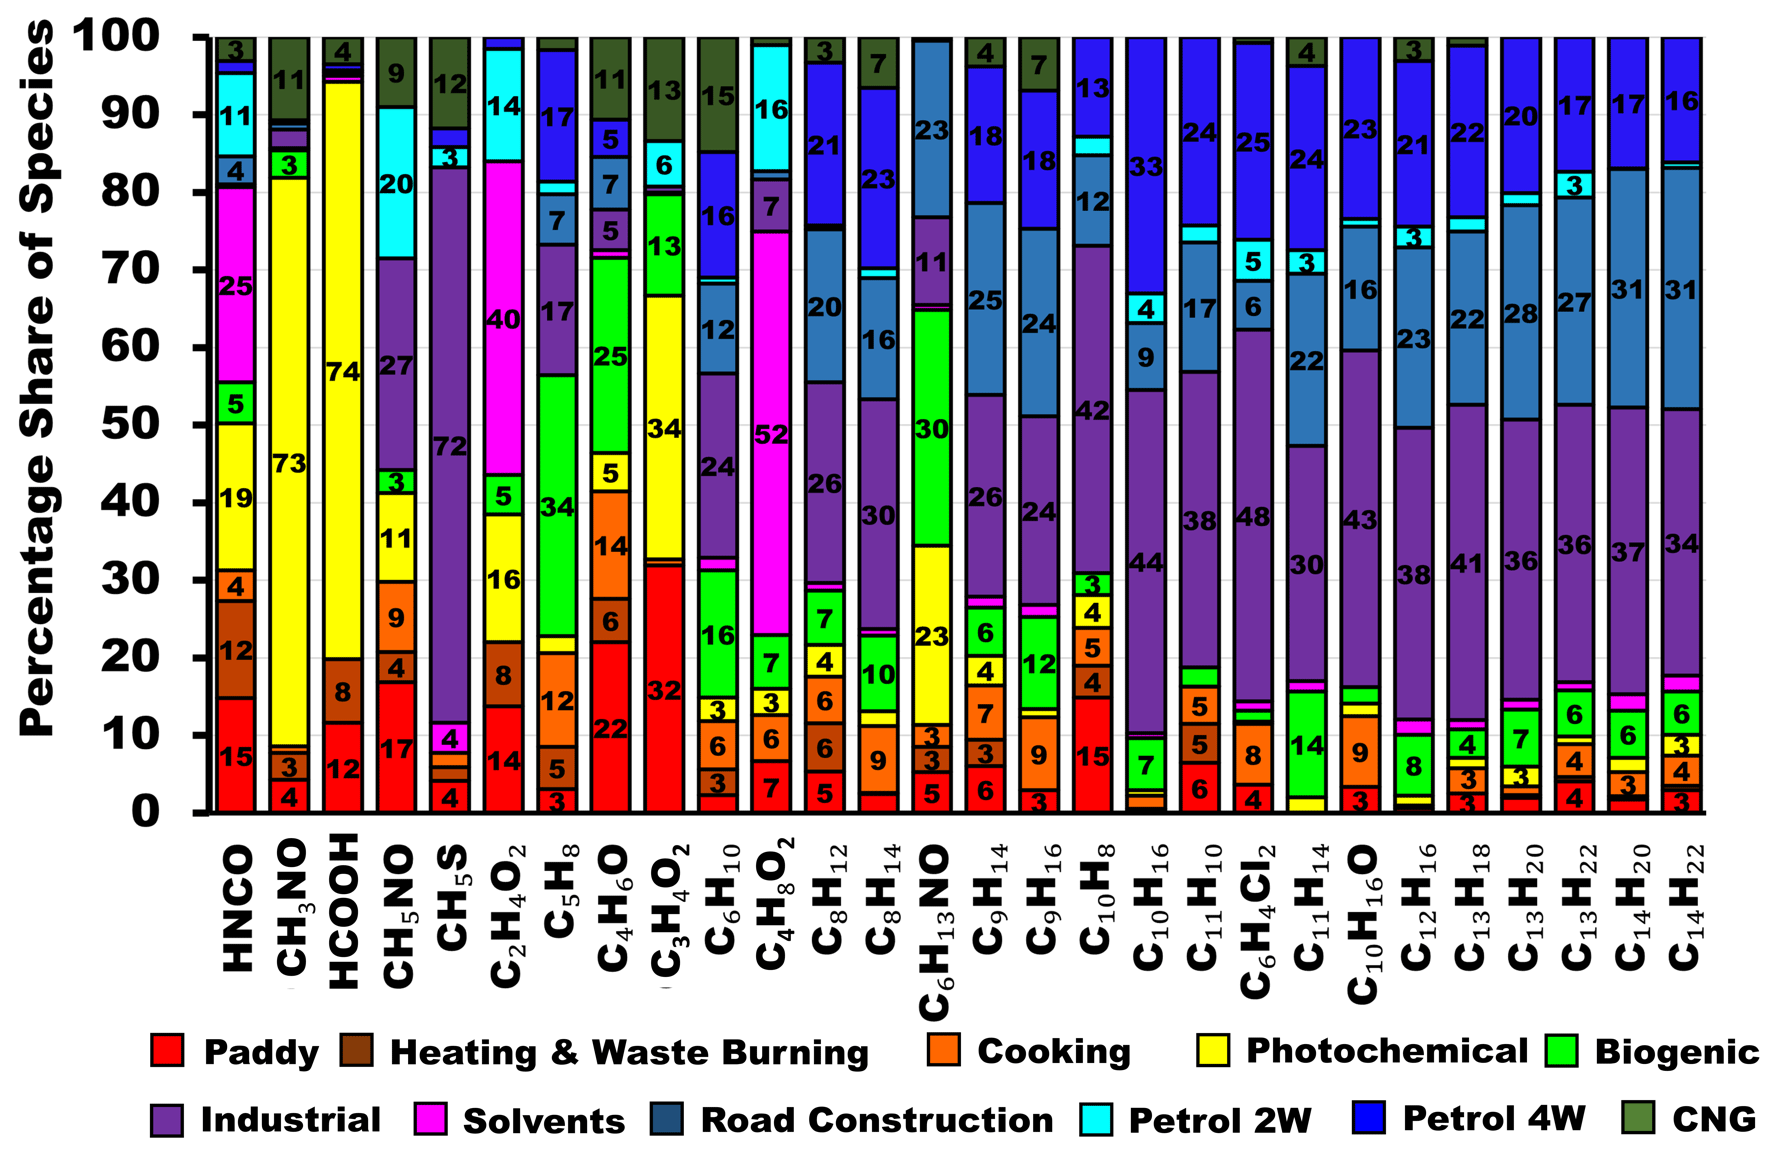
Figure 8Contribution of PMF factors to VOC species to which industries, solvent usage, photochemistry, or biogenic sources contribute the highest percentage share of the atmospheric burden in Delhi.
Figure 8 shows that this factor accounts for the largest percentage share of methanethiol (CH5S), a chemical used in the manufacturing of the essential amino acid methionine, the plastic industry, and the manufacturing of pesticides; dichlorobenzene (C6H4Cl2), a chemical used in the synthesis of dyes, pesticides, and other industrial products; and methoxyamine (CH5NO). Analyses of the primary dataset by Mishra et al. (2024) also qualitatively inferred an industrial source for methanethiol and dichlorobenzene. This factor also accounts for the largest percentage share of the sum of monoterpenes, camphor + pinene oxide (C10H16O), santene (C9H14), the terpene fragment (C8H12), C8H14, C9H16, cyclohexene (C6H10), and cyclopentylbenzene (C11H14). Terpenes are used in the food and beverage, cosmetics, pharmaceutical, and rubber industries. In addition, this factor also accounts for the largest percentage share of a large suite of volatile and IVOC aromatic hydrocarbons, including naphthalene (C10H8), methylnaphthalene (C11H10), C12H16, C13H18, C13H20, C13H22, C14H20, and C14H22. Ambient observations for most of these IVOCs have not been reported in the literature so far. Only C9H14, C12H12, and C12H16 have been reported as originating from aircraft engine emissions (Kılıç et al., 2018), while terpene, C9H16, cyclopentylbenzene, naphthalene, and methylnaphthalene have been reported as originating from a wide range of combustion sources (Hatch et al., 2015; Bruns et al., 2017). Most other compounds have so far only been reported to degas from heated asphalt (Khare et al., 2020). Due to its high abundance of IVOCs, this factor contributes 15 % to the total SOA formation potential. Figure S9 shows the volatility oxidation state plot for all 111 VOCs, where the marker size represents the percentage share of each compound accounted for by the industrial factor and markers are colour-coded according to the number of carbon atoms. The plot shows evidence that the first- and second-generation oxidation products of C6–C10 hydrocarbons transition from the VOC to the IVOC range along trajectories expected for the addition of the =O functionality to the molecules (Jimenez et al., 2009). This, along with the fact that all of the aerosol associated with this factor corresponds to PM2.5, indicates that most of the aerosol associated with this factor likely comprises SOA.
3.2.8 Factor 8: solvents and evaporative emissions
Solvent usage emissions and evaporative emissions reach the site from several point sources and wind directions and often do so in the form of short, intense plumes that show no correlation with combustion tracers. This source contributes the most to the VOC burden at night, accounting for 6 % of the total VOC but ≤ 1 % of the total PM2.5 and PM10 mass (Fig. 4). The source fingerprint of the solvent factor (Fig. 3) is characterized, in descending order of mass contribution, by acetic acid + glycolaldehyde (C2H4O2), toluene (C7H8), methanol (CH3OH), butanoic acid + ethyl acetate (C4H9O2), acetone + propanal (C3H6O), and butanal + butanone + methyl ethyl ketone (MEK; C4H8O). Figure 8 shows that this factor accounts for the largest share of organic acids, namely butanoic acid, acetic acid, and isocyanic acid (HNCO), and the second-largest share of butanal + butanone + MEK (C4H8O). These compounds suggest that stack venting of VOCs from chemical, food, or pharmaceutical industries and polymer manufacturing are likely sources of these emissions (Hodgson et al., 2000; Villberg and Veijanen, 2001; Jankowski et al., 2017; Gao et al., 2019). This assessment is broadly confirmed by the fact that the best match (R = 0.7) for this source was collected from a plot situated opposite a polymer manufacturing unit and next to a pet food manufacturer in an industrial area in Jahangirpuri, north of the receptor site.
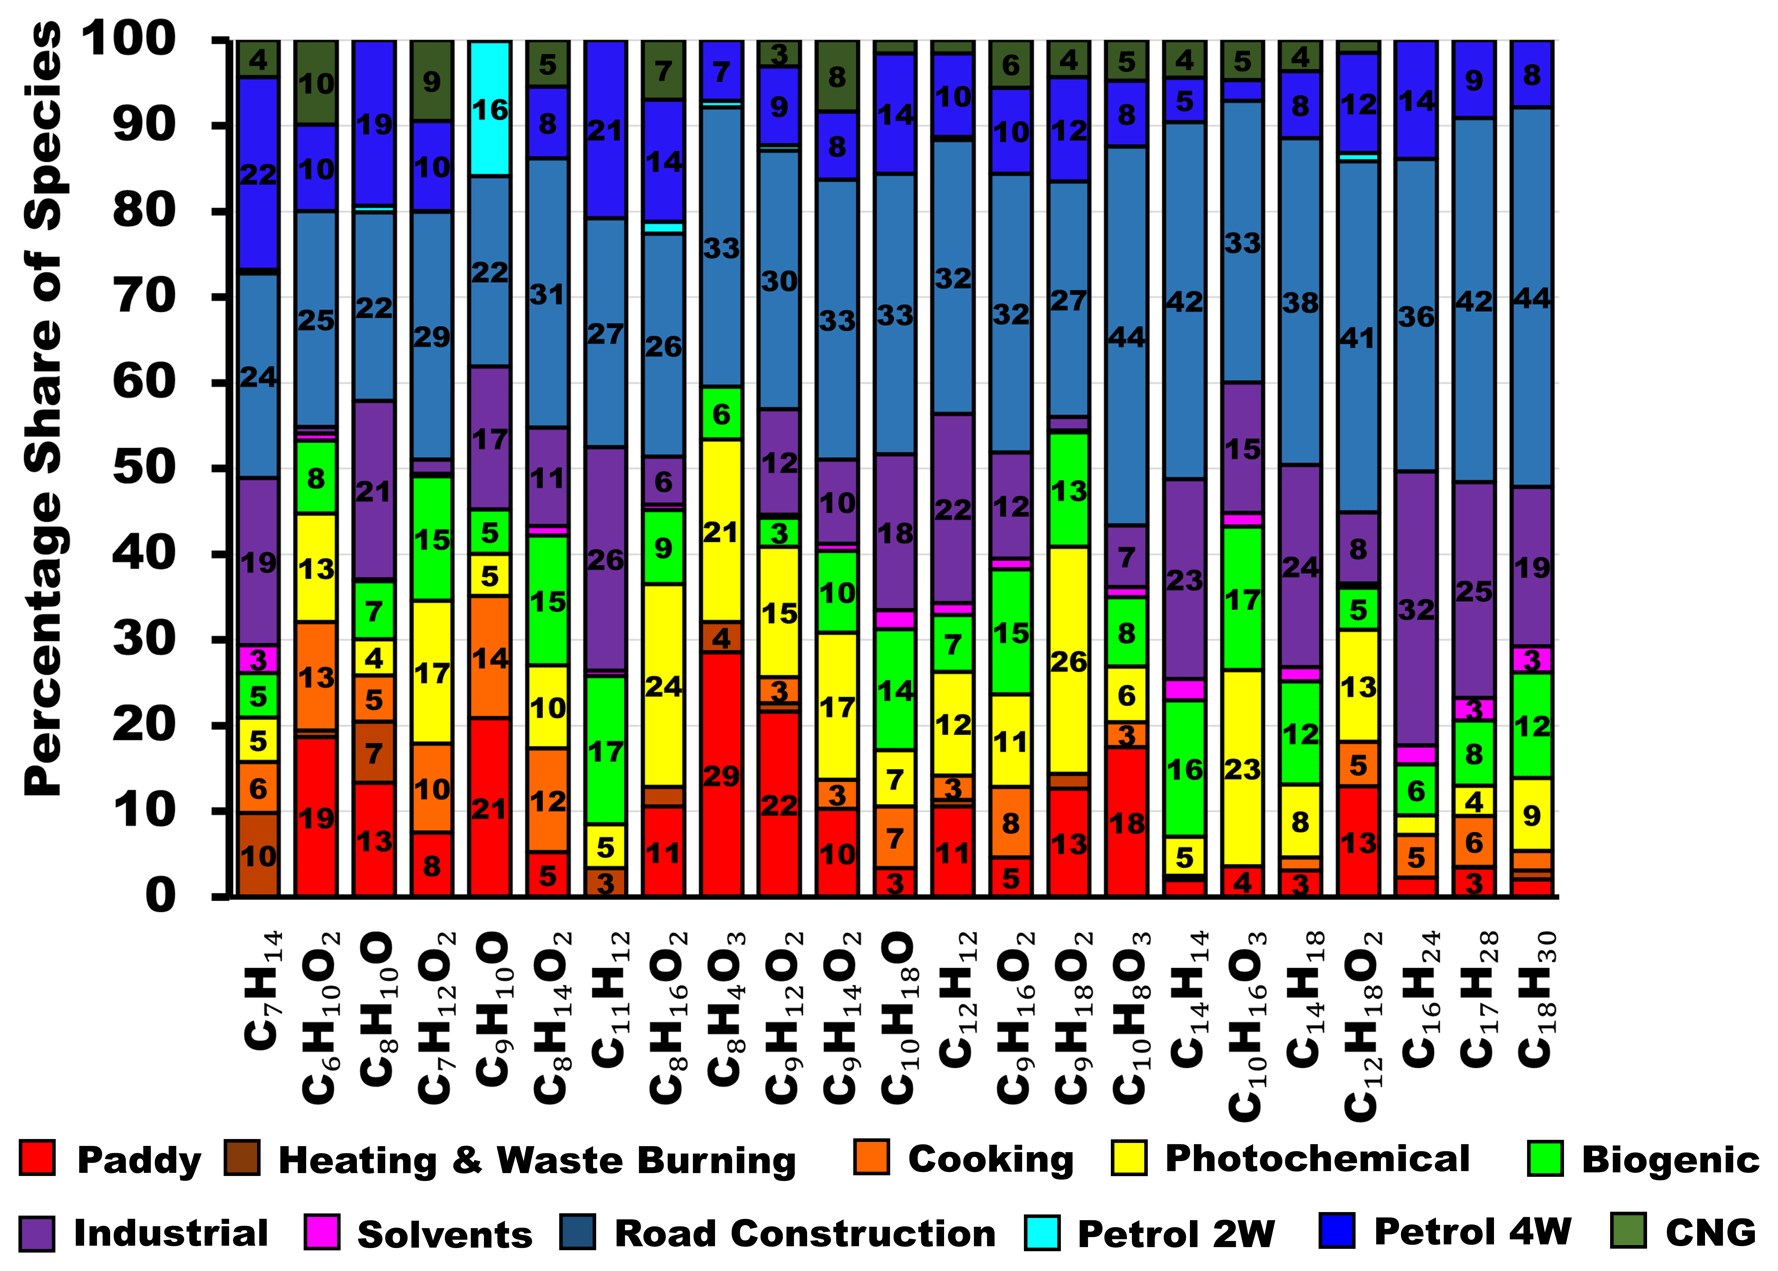
Figure 9Contribution of PMF factors to VOC species to which road construction contributes the highest percentage share of the atmospheric burden in Delhi.
3.2.9 Factor 9: road construction
The road construction factor contributed 8 % to the total VOC mass loading and 2 % to the total PM10 burden. This factor is almost absent during monsoon season as road repair work is mostly avoided during this period due to waterlogging risks, and emissions from this source generally peak during the day as the degassing of compounds from asphalt is driven by temperature and continues for days after the initial paving (Khare et al., 2020). The source fingerprint of the road construction factor is characterized, in descending order of mass concentrations, by acetone + propionaldehyde, toluene, methanol, benzene, and C8 aromatics. Acetone and propionaldehyde were found to be the most abundant OVOCs emitted during asphalt paving (Li et al., 2020). The source profile showed the greatest similarity with the mix of emissions originating from asphalt paving (Li et al., 2020) and the tailpipes of road construction vehicles (Che et al., 2023). As represented in Fig. 9, this factor accounts for the largest percentage share of a large suite of volatile and IVOC hydrocarbons, namely heptene (C7H14), C11H12, C12H12, C14H14, C14H18, C16H24, C17H28, and C18H30. In addition, it accounts for the second-largest percentage share of many other IVOC hydrocarbons, namely C9H14, C9H16, C11H14, C12H16, C13H18, C13H20, C13H22, C14H20, and C14H22. Except for the four hydrocarbons C7H14, C9H14, C9H16, and C11H12, all of these IVOCs have been reported to degas from asphalt pavements at 60 °C (Khare et al., 2020). So far, only C14H18 has been reported as a fresh gas-phase emission (transport time < 2.5 min), originating from a farm (Loubet et al., 2022) in ambient air, while C17H28 has been observed in the aerosol phase (Xu et al., 2022). The road construction factor also accounts for the largest percentage share of a long list of OVOCs: C6 diketone isomers (C6H10O2); C2-substituted phenol (C8H10O); C7H12O2; C8H14O2; C8H16O2; phthalic anhydride (C8H4O3), which is a naphthalene oxidation product (Bruns et al., 2017); C9H10O; C9H12O2; C9H14O2; C9H16O2; C9H18O2; C10H12O; C10H18O; C10H8O3; C10H16O3; and C12H18O2. However, out of these, only C10H12O and C10H18O have been detected as direct emissions from heated asphalt pavements (Khare et al., 2020), indicating that most OVOCs in this factor are possibly oxidation products of short-lived IVOC hydrocarbons emitted by this source. This assessment is supported by the volatility oxidation state plot for the road construction factor (Fig. S9), which demonstrates that both precursors and oxidation products are present in this factor and that C6–C10 hydrocarbons appear to progress from the VOC to the IVOC range along trajectories expected for the addition of the =O functionality to the molecules (Jimenez et al., 2009).
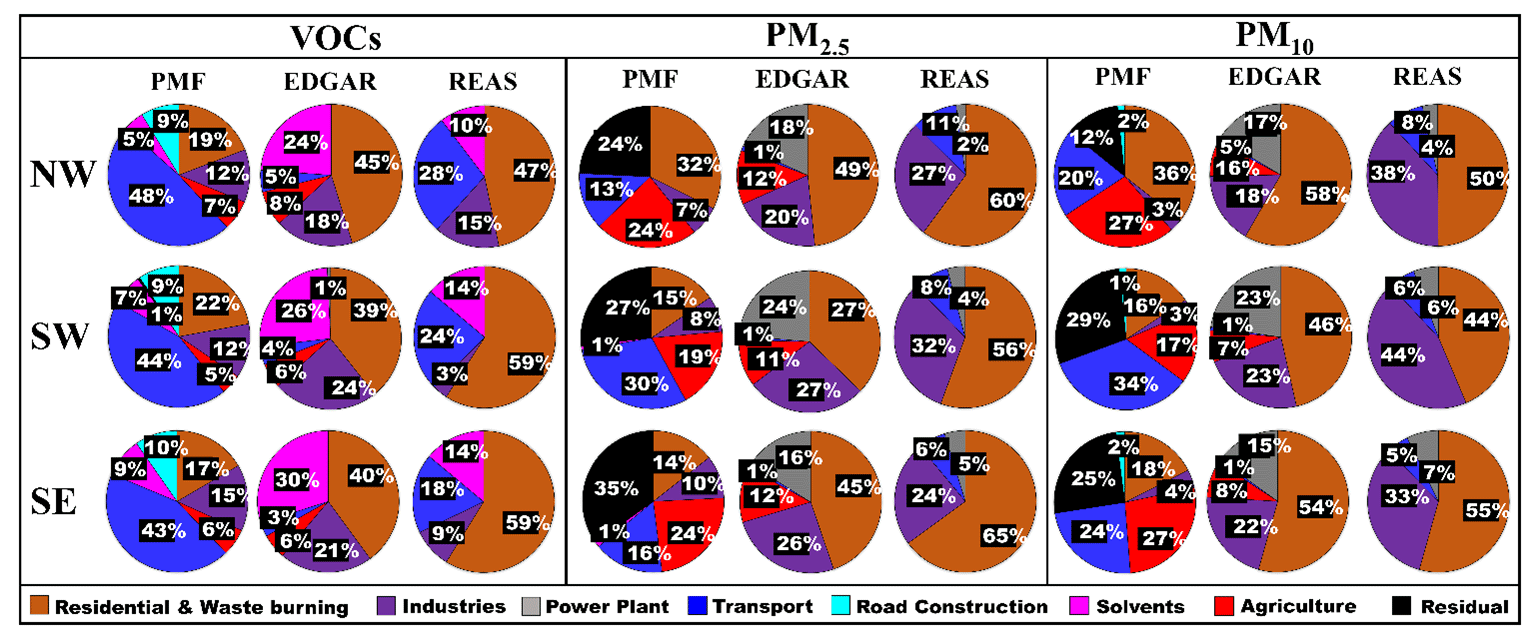
Figure 10Comparison of different anthropogenic-emission inventories with the PMF output from this study for three overlapping fetch regions corresponding to different airflow patterns.
3.2.10 Factor 10: photochemistry
The photochemical factor has a diurnal profile that mirrors the diurnal profile of ozone (R = 0.4). The factor profile is dominated by certain OVOCs, such as acetic acid (C2H4O2), formic acid (CH3O2), acetaldehyde (CH3CHO), formamide (CH4NO), and methanol (CH3OH). Figure 8 shows that this factor accounts for the largest percentage share of formic acid, formamide, and methylglyoxal (C3H5O2). It also accounts for the second-largest percentage share of isocyanic acid (HNCO) and hexanamide (C6H13NO), which are formed by the photooxidation of amines (Yao et al., 2016; Wang et al., 2022). Some compounds suggest a significant contribution of photochemically aged biomass-burning emissions to this factor, including furfuryl alcohol (C5H6O2), hydroxymethyl furanone (C5H6O3), and hydroxybenzaldehyde (C7H6O2). While this factor accounted for ≤ 4 % of the total VOC share and a negligible share of PM2.5 and PM10 mass in Delhi, photochemically aged biomass-burning emissions were a significant source of VOCs at a suburban site in Punjab during the post-monsoon season of 2017 (Singh et al., 2023). This difference is likely due to the fact that the severe smog episode of 2017 was primarily driven by low wind speeds, a shallow boundary layer, and a regional-scale build-up of emissions over a prolonged period (Dekker et al., 2019; Roozitalab et al., 2021), whereas the post-monsoon season of 2022 experienced western disturbances and higher ventilation coefficients. This factor also accounts for the largest percentage share of total mass for certain organic acids, such as nonanoic acid (C9H18O2) and n-octanoic acid (C8H16O2), which have been detected in biomass-burning-impacted environments in China (Mochizuki et al., 2019). Furthermore, it accounts for C12H18O2, which has been found in aged wildfire plumes in the US (Haeri, 2023), and specific terpene ozonolysis products: norpinonaldehyde (C9H14O2), cis-pinonic acid (C10H16O3; Camredon et al., 2010), and C7H12O2. Pinonic acid has been identified as an important aerosol-phase tracer of biogenic SOA formation in India (Mahilang et al., 2021), and C7H12O2 has been reported as an aqueous-phase photolysis product of pinonic acid (Lignell et al., 2013; Fig. 8).
3.2.11 Factor 11: biogenic
Biogenic VOC emissions at the receptor site show the highest cross-correlation with photosynthetically active radiation (PAR; R = 0.7) and temperature (R = 0.7; Table S4), accounting for 4 % of the total VOC burden and 2 % of the PM10 burden in the PMF model. The BVOC emissions in this factor are relatively fresh as the ratio of isoprene to each of its first-generation oxidation products – MEK (C4H8O) and methyl vinyl ketone (MVK) + methacrolein (MACR; C4H6O) – is 5.9 and 3.0, respectively. At the site, the top of the canopy of roadside trees is located approximately 20 m below the inlet height. Figure 3 shows that, in descending order of mass contribution, acetaldehyde (CH3CHO), C3H4, isoprene (C5H8), acetic acid + glycolaldehyde (C2H4O2), and acetone + propanal (C3H6O) are the major contributors to the biogenic factor, indicating that leaf-wounding compounds contribute significantly to the BVOC burden in Delhi (Portillo-Estrada et al., 2015). The signal at 41.035 can potentially be attributed to C3H4 and the 2-methyl-3-buten-2-ol fragment (Kim et al., 2010; Park et al., 2013), a known fragment of isoprene (Yuan et al., 2017). Figure 8 shows that this factor accounts for the largest percentage share of two BVOCs, namely isoprene + the 2-methyl-3-butene-2-ol fragment and the corresponding oxidation product (MVK + MACRC + 2-butenal). It also accounts for the largest percentage share of C6 amides (C6H13NO), which are produced by the photooxidation of amines (Yao et al., 2016). C6 amines, the potential precursor, have previously been detected in forested environments (You et al., 2014). However, it is also possible that C6 amides are only attributed to the biogenic factor because their diurnal concentration profile matches that of first-generation oxidation products and because the source strength is high during both the monsoon and post-monsoon seasons. This type of time series would also be expected if the precursors of this oxidation product were emitted from agricultural activities.
3.3 Comparison with emission inventories
Figure 10 shows a comparison of different anthropogenic-emission inventories with the PMF output data from this study for three overlapping fetch regions. These regions correspond to the areas from which air masses for different airflow patterns reach the receptor site within 24 h (Fig. 1).
One feature that stands out in this comparison is that all inventories appear to significantly overestimate the relative contribution of residential fuel usage to VOC and PM emissions across all fetch regions. In absolute terms, the Regional Emission inventory in ASia (REASv3.2.1) for the year 2015 (Kurokawa and Ohara, 2020) and the Emissions Database for Global Atmospheric Research (EDGARv6.1) for the year 2018 (Crippa et al., 2022) align on residential-sector PM2.5 emissions for the northwestern fetch region (Table S5). According to recent estimates (Pandey et al., 2021), the northwestern IGP region has the lowest prevalence of solid-fuel usage in the entire IGP, and the inventories appear to overestimate PM2.5 emissions from this fetch region by only a factor of 1.5–1.9. For the southwestern and southeastern fetch regions, REASv3.2.1 estimates much higher residential-sector PM2.5 emissions than EDGARv6.1 and overestimates the PMF estimates by factors of 3.7 and 4.6, respectively. In contrast, EDGARv6.1 only overestimates PMF estimates by factors of 1.8 and 3.2 for the southwestern and southeastern fetch regions, respectively. Solid-fuel-based cooking is more prevalent in central and western India, as well as the eastern IGP, compared to the northwestern IGP (Pandey et al., 2021). The overestimation in both inventories may be caused by the gradual adoption of cleaner technology. Sharma et al. (2022) calculated a 13 % drop in residential-sector PM2.5 emissions between 2015 and 2020 due to increased sales of liquefied petroleum gas (LPG), and a continuation of this trend until 2022 might explain the overestimation of residential fuel usage in the present emission inventory data. For PM10, the EDGARv6.1 emission estimates for the northwestern, southwestern, and southeastern fetch regions are greater than those from REASv3.2.1. The EDGARv6.1 inventory and REASv3.2.1 both overestimate our PMF PM10 results by a factor of 1.5 to 3.0. However, while REASv3.2.1 appears to assume that most residential-sector aerosol emissions are fine-mode emissions, our PMF results (Fig. 10) clearly align with the EDGARv6.1 inventory regarding the significant association of coarse-aerosol emissions with solid-fuel-based cooking and heating. Table S5 shows that for residential-sector VOC emissions, the absolute emissions in the EDGARv6.1 inventory are almost twice as high as those in REASv3.2.1, even though the percentage contribution of this sector to VOC emissions in the inventory (shown in Fig. 10) appears to be similar for both. This is due to higher VOC emissions from solvent use and industries in the EDGARv6.1 inventory. Both inventories overestimate the relative importance of residential-sector emissions compared to VOC emissions from other sectors by more than a factor of 2 relative to our PMF estimate, most likely because they have not been updated to reflect recent fuel shifts towards LPG in the relatively prosperous Delhi NCR (Sharma et al., 2022).
With respect to industrial VOC emissions for the northwestern fetch region, our PMF results indicate that actual emissions are slightly lower than those from REASv3.2.1, while the EDGARv6.1 inventory overestimates emissions. For the southwestern and southeastern fetch regions, our PMF estimates fall between those from the EDGARv6.1 inventory and REASv3.2.1. For industrial PM2.5 emissions, both the EDGARv6.1 inventory and REASv3.2.1 are closely aligned in their estimates of the magnitude of emissions for the northwestern, southwestern, and southeastern fetch regions, and both inventories appear to overestimate emissions compared to our PMF results. Our findings seem to suggest that pollution boards have been somewhat successful in reducing industrial emissions and that the technology employed is better than what is currently reflected in emission inventories. Industrial fly ash (PM10) emissions are higher in REASv3.2.1 across all fetch regions compared to the EDGARv6.1 inventory. However, both inventories appear to significantly overestimate industrial emissions compared to our PMF results. These findings also indicate that pollution boards have been somewhat successful in reducing large and visible fly ash sources and that the EDGARv6.1 inventory has more effectively captured this clean-technology transition.
REASv3.2.1 completely overlooks direct VOC and PM emissions from the agricultural sector. The EDGARv6.1 inventory significantly underestimates PM2.5 and PM10 emissions from agricultural activities (including, but not limited to, crop residue burning) in comparison to our PMF results, particularly over northwestern India (Table S5). Over this fetch region, EDGARv6.1 attributes as much PM2.5 to all agricultural activities combined for the full year as FINNv2.5 (Wiedinmyer et al., 2023) attributes solely to agricultural residue-burning activities occurring between 15 August and 26 November 2021 (a time period comparable to that of our model run) – this excludes the emissions from rabi crop residue burning in summer (Kumar et al., 2016) and other agricultural activities, such as harvesting and ploughing. For PM10, the fire-count-based FINNv2.5 estimate is twice as high as the emission estimate of EDGARv6.1 for this fetch region, and it is more likely to be correct because the phytoliths present in rice straw form coarse-mode ash during the combustion process (Fig. S10). The fact that EDGARv6.1 appears to underestimate residue-burning emissions over this fetch region has been flagged previously (Pallavi et al., 2019; Kumar et al., 2021; Singh et al., 2023). Our PMF analysis also reveals that the relative contribution of agricultural residue burning to the PM burden over the northwestern IGP (24 % and 27 % of PM2.5 and PM10, respectively) and southeastern IGP (24 % and 27 % of PM2.5 and PM10, respectively) is comparable, despite much lower fire counts over the southeastern IGP (17 810) compared to the northwestern IGP (61 334). This indicates that fires to the southeast burn closer to the receptor site or that fire detection efficiency in this fetch region is lower. Table S5 reveals that the relative importance of agricultural emissions over the southeastern fetch region is even more severely underestimated in FINNv2.5 than in the EDGARv6.1 inventory due to poorer fire detection for partial burns prevalent over this region (Liu et al., 2019, 2020; Fig. S8) compared to complete burns prevalent over the northwestern IGP, resulting in an omission error close to 100 % (Liu et al., 2019, 2020; Fig. S7).
Transport sector VOC emissions appear to be severely underestimated in the EDGARv6.1 inventory for the northwestern, southwestern, and southeastern fetch regions; this has been previously noted for earlier versions of the same inventory (Sarkar et al., 2017; Pallavi et al., 2019; Singh et al., 2023). REASv3.2.1 also underestimates our PMF results. This indicates that the contribution of the transport sector to ambient VOC pollution levels in a megacity like Delhi may not be adequately reflected in the two emission inventories. Our PMF model suggests that the overall contribution of the transport sector to total PM2.5 and PM10 pollution levels is primarily due to non-exhaust emissions from the CNG-fuelled public-transport fleet. These non-exhaust emissions are much higher than those accounted for in both the EDGARv6.1 inventory and REASv3.2.1 for PM2.5 and PM10 emissions from the northwestern, southwestern, and southeastern fetch regions. The transport-sector-related findings from this PMF source apportionment study are in agreement with findings from earlier source apportionment studies, which have often attributed a quarter or more of total PM emissions to the transport sector. Previous studies have used metals (such as Pb), organic carbon (OC), and/or elemental carbon (EC) as transport sector activity tracers (Jain et al., 2017, 2020; Sharma et al., 2016; Jaiprakash et al., 2016; Sharma and Mandal, 2017), while others have attributed almost the entire hydrocarbon-like organic aerosol (HOA) component of organic aerosols to transport sector emissions (Reyes-Villega et al., 2021; Cash et al., 2021; Kumar et al., 2022; Shukla et al., 2023) or used a chemical mass balance (CMB) model with source fingerprints from the EPA database (Nagar et al., 2017). Our PMF results differ from emission-inventory-based assessments, which only attribute a minor share of the total PM burden to this activity (Guo et al., 2017). Our findings also shed light on the reasons why transport-sector-targeted air quality interventions have yielded such poor results (Chandra et al., 2018). Public-transport availability was ramped up during periods when road rationing schemes restricted the use of private four-wheelers. Our results suggest that, moving forward, only investments in road infrastructure to reduce resuspension; modal shifts from buses to metro-based public transport; and electric vehicles with > 50 % regenerative braking (Liu et al., 2021), limiting brake wear, can yield meaningful reductions in transport-sector-related PM emissions.
Our PMF results indicate that solvent usage results in VOC emissions that align more closely with REASv3.2.1, while the EDGARv6.1 inventory overestimates emissions by a factor of 4 across all the fetch regions.
Power generation is not considered a significant VOC source in either emission inventory (amounting to < 1 % of the total VOC mass), and it fails to show up as a separate sector in our PMF results as our model runs rely on VOC tracers to track pollution sources. However, the contribution of energy generation to the PM burden, particularly in the EDGARv6.1 emission inventory, is significant. It is, however, striking to note that the PMF model features a residual that is of similar magnitude to the PM2.5 and PM10 emissions attributed to power generation in the EDGARv6.1 inventory. Power generation is believed to be the dominant source of secondary sulfate aerosols (Atabakhsh et al., 2023), which are the largest contributor to the secondary-inorganic-aerosol burden during the monsoon season (Cash et al., 2021). It is, hence, likely that much of our PMF residual can be attributed to this source. While a portion of this residual, particularly during post-monsoon season, may also comprise secondary ammonium nitrate, to which power generation, the transport sector, and industrial NOx and NH3 emissions contribute (Alanen et al., 2017; Link et al., 2017), ammonium nitrate formation is not thermodynamically favoured during the warm months of the year. The proportion of emissions attributed to power generation in REASv3.2.1 is much smaller than that pertaining to EDGARv6.1, likely because REASv3.2.1 overlooks several coal generation units that were commissioned between 2015–2018.
Our PMF results identify road construction and asphalt pavements as additional VOC sources that are currently not reflected in emission inventories.
This study presents source apportionment results derived from applying the PMF model to a recently acquired high-quality dataset of PM2.5, PM10, and 111 VOCs. The latter were measured using a new extended-volatility-range PTR-TOF-MS instrument, PTR-TOF 10k, during the monsoon and post-monsoon seasons of 2022 in Delhi, one of the world's most polluted megacities. We found that the top-ranked major emission sources differed between the gas phase and aerosol phase, highlighting the complexity of air pollution sources in such atmospheric environments. While the burning of fresh paddy was a negligible source of VOCs (6 %), it was the largest source of PM2.5 and PM10 (23 % and 25 %, respectively) in the Delhi NCR during our study period. This is likely because the combustion of phytolith-containing rice straw triggers the formation of coarse-mode ash (Fig. S10), which contributes significantly to the PM burden. PM2.5 and PM10 are the two criteria air pollutants regulated under the National Ambient Air Quality Standard that are thought to be the leading contributors to the air pollution emergency that occurs each year in November in Delhi (Khan et al., 2023). The strong correlation of PM2.5 and PM10 with same-day fire counts and VOC emission signatures of fresh paddy-burning plumes indicates that fires burning in and within the vicinity of the Delhi NCR, along with plumes reaching the receptor on the same day, were the strongest contributors to high pollution levels compared to plumes from more distant areas, such as Punjab (India) and Punjab (Pakistan). Both are located northwest of the Delhi NCR and are thought to be major contributors to the pollution levels because the detected fire activity in these locations is more prevalent. Furthermore, PM2.5 and PM10 emissions from residential heating and waste burning (24 % and 23 %) rival those from crop residue burning, and, unlike paddy-residue-burning emissions, which are episodic, this activity persists into winter. While popular perception generally blames burning in Punjab for the high PM burden due to paddy stubble burning, our PMF results reveal that, despite much lower fire counts across the eastern IGP (17 810) compared to those across the northwestern IGP (61 334), both are significant sources of paddy-stubble-burning PM in the Delhi NCR. Additionally, sources that are generally targeted by clean-air action plans, such as tailpipe exhaust emissions of private vehicles and industries, are responsible for less than one-quarter of the PM mass loading that can be traced using gas-phase organic molecular tracers. Instead, the transport sector's PM emissions are dominated by non-exhaust emissions, such as those arising from road dust suspension, brake wear, and tyre wear of the CNG-fuelled commercial-vehicle fleet, which, according to a recent emission inventory for Delhi, are 1 order of magnitude higher than the transport sector's tailpipe exhaust emissions (Nagpure et al., 2016).
The PMF results based on primary in situ data indicate that the EDGARv6.1 inventory provides a better representation of emissions than REASv3.2.1 for most sectors, with the exception of transport sector emissions and VOC emissions from solvent use. Agricultural burning emissions over the northwestern IGP are best represented in FINNv2.5 (Wiedinmyer et al., 2023), while agricultural emissions over the southeastern IGP are better captured by EDGARv6.1. At present, none of the residential-sector inventories seem to have incorporated the changes in magnitude and spatial patterns due to the adoption of cleaner cooking technology interventions since 2018. Transport sector non-exhaust emissions are still absent (REASv3.2) or underestimated (EDGARv6.1) in all inventories. For VOC emissions from solvent usage, REASv3.2 provides better estimates than EDGARv6.1. Our PMF results also reveal that the road construction sector contributes significantly (9 %–10 %) to the VOC burden, but this has not been addressed in any emission inventories so far, and our study, by including measurements of specific molecular markers of this activity, has been able to provide new strategic insights into this missing source.
Considerable portions of the PM10 (18 %) and PM2.5 (28 %) loads are connected to residual sources that are not directly related to combustion tracers. These contributions are likely due to windblown dust transported over long distances (Pawar et al., 2015) as well as secondary inorganic aerosols, such as ammonium sulfate and ammonium nitrate, whose precursors are primarily emitted from power plants. Despite the fact it includes the most comprehensive set of organic species that have been measured in Delhi to date, our study does not include similar information about these other species.
Residential heating and waste burning were identified as two of the largest contributors to PM pollution, with these sources being active year-round, although their strengths vary depending on the season. The total contribution of residential-sector solid-fuel usage and waste burning (17 % in Delhi and 18 % in Mohali) to the VOC burden during the post-monsoon season was similar at both sites. Thus, targeting these sources through improved access to cleaner energy sources for heating and cooking would likely improve air quality significantly in other seasons. Similarly designed quantitative studies are needed in the future to confirm this hypothesis.
The findings and insights from this study emphasize the necessity for a comprehensive, multi-sectoral approach to reduce primary emissions. While many recent efforts in some sectors (e.g. residential biofuel and cooking) appear to have yielded emission reduction benefits, the narrative of exclusively blaming more visible sources (e.g. paddy residue burning) for post-monsoon pollution needs to be corrected to ensure that other sources are also mitigated. Our findings support the assertions of Ganguly et al. (2020), who pointed out previously that it is crucial to address the disparity between primary targets of clean-air action plans and actual dominant sources of PM rather than solely focusing on specific sources, such as agricultural-residue burning or transport emissions. Future action plans need to account for more targeted and impactful pollution control measures and should adopt a more comprehensive approach to address the diverse urban sources highlighted in this study, such as industries, residential solid-fuel/waste burning, non-exhaust road emissions, and emissions from road construction.
This new approach of combining VOC tracers with PM measurements provides great potential for improved source apportionment in complex emission environments, offering a level of detail beyond simply attributing emissions to biomass burning or fossil fuel burning, as has been done in all previous studies from the region to date. Previously in the Delhi NCR, Kumar et al. (2022) identified “cooking-related” organic aerosols using extractive-electrospray-ionization time-of-flight (EESI-TOF) analysis, but due to analytical limitations, they only reported quantitative data for three primary factors (i.e. HOA and the biomass-burning organic aerosols BBOA-1 and BBOA-2), without naming the activities responsible for the formation of BBOA-1 and BBOA-2. One of the more comprehensive studies based on aerosol mass spectrometry (AMS) was conducted by Cash et al. (2021) across pre-monsoon, monsoon, and post-monsoon seasons of the year 2018; however, it only identified three different primary biomass-burning factors, namely cooking organic aerosol (6 % of PM1), solid-fuel organic aerosol (≤ 11 % of PM1), and semi-volatile biomass-burning organic aerosol (≤ 13 % of PM1), which broadly appear to correspond to our factors for solid-fuel-based cooking (4 % of PM10), residential heating and waste burning (23 % of PM10), and paddy residue burning (25 % of PM10). Nevertheless, the study failed to name and attribute two of these three factors in policy-relevant ways, could not identify the significant contribution of coarse-mode fly ash to the total aerosol burden, and was unable to distinguish between different fossil-fuel-related sources. Our study design, which captured contrasts between clean monsoon air and polluted post-monsoon air and included measured VOC source fingerprints and molecular tracers, enabled us to distinguish paddy residue burning from other biomass-burning sources and resolve similar traffic emission sources (e.g. by distinguishing two-wheelers from four-wheelers and CNG vehicles). This represents a significant advancement compared to existing source apportionment studies and could be of great relevance in other complex emission environments suffering from high levels of air pollution, where quantitative knowledge of sources can lead to evidence-based efforts for emission reduction prioritization and a better understanding of the atmospheric chemistry of polluted environments around the world.
PMF model simulations and input data can be obtained by contacting Baerbel Sinha.
The supplement related to this article is available online at: https://doi.org/10.5194/acp-24-10279-2024-supplement.
AA: data curation, formal analysis, investigation, software, visualization, and writing (original draft preparation). BS: conceptualization, data curation, formal analysis, methodology, project administration, resources, software, supervision, validation, and writing (review and editing). HH: data curation, formal analysis, investigation, and writing (review and editing). SM: data curation, formal analysis, and investigation. VM: investigation. GS: investigation. SDG: resources. VKS: resources. NN: resources. VS: conceptualization, data curation, project administration, methodology, supervision, and writing (review and editing). MR: resources.
The contact author has declared that none of the authors has any competing interests.
Publisher's note: Copernicus Publications remains neutral with regard to jurisdictional claims made in the text, published maps, institutional affiliations, or any other geographical representation in this paper. While Copernicus Publications makes every effort to include appropriate place names, the final responsibility lies with the authors.
We acknowledge the financial support given by the Ministry of Earth Sciences (MoES), Government of India, to support the RASAGAM (Realtime Ambient Source Apportionment of Gases and Aerosol for Mitigation) project at IISER Mohali (grant no. MOES/16/06/2018-RDEAS; awarded on 22 June 2021). Sachin Mishra acknowledges IISER Mohali for providing an institute PhD fellowship. Arpit Awasthi acknowledges the MoE for providing a PMRF PhD fellowship. We thank Rajamma Sukumaran Mahesh, Gopal Iyengar, Raghavan Krishnan (Director at IITM, Pune), Jayaraman Gowrishankar (Director at IISER Mohali), Mrutyunjay Mohapatra (Director General at the IMD), and Muthalagu Ravichandran (Secretary at the Ministry of Earth Sciences) for their encouragement and support. We thank the student members of the Atmospheric Chemistry & Emissions (ACE) research group and the Aerosol Research Group (ARG) at IISER Mohali and IITM, Pune. In particular, we thank Akash Vispute, Prasanna Lonkar, and local scientists from the IMD for their logistical support. We gratefully acknowledge the NASA/NOAA Suomi National Polar-orbiting Partnership (Suomi NPP) and the NOAA-20 satellites for providing the VIIRS fire count data used in this publication. The authors gratefully acknowledge the NOAA Air Resources Laboratory (ARL) for providing the HYSPLIT transport and dispersion model used in this publication.
This research has been supported by the Ministry of Earth Sciences (grant no. MoES/16/06/2018-RDEAS).
This paper was edited by Alexander Laskin and reviewed by two anonymous referees.
Acharja, P., Ali, K., Ghude, S. D., Sinha, V., Sinha, B., Kulkarni, R., Gultepe, I., Rajeevan, M. N.: Enhanced secondary aerosol formation driven by excess ammonia during fog episodes in Delhi, India, Chemosphere 289, 133155, https://doi.org/10.1016/j.chemosphere.2021.133155, 2022.
Achten, C., Kolb, A., and Püttmann, W.: Methyl tert-butyl ether (MTBE) in urban and rural precipitation in Germany, Atmos. Environ., 35, 6337–6345, https://doi.org/10.1016/S1352-2310(01)00423-X, 2001.
Alanen, J., Simonen, P., Saarikoski, S., Timonen, H., Kangasniemi, O., Saukko, E., Hillamo, R., Lehtoranta, K., Murtonen, T., Vesala, H., Keskinen, J., and Rönkkö, T.: Comparison of primary and secondary particle formation from natural gas engine exhaust and of their volatility characteristics, Atmos. Chem. Phys., 17, 8739–8755, https://doi.org/10.5194/acp-17-8739-2017, 2017.
Assan, S., Vogel, F. R., Gros, V., Baudic, A., Staufer, J., and Ciais, P.: Can we separate industrial CH4 emission sources from atmospheric observations?-A test case for carbon isotopes, PMF and enhanced APCA. Atmos. Environ., 187, 317–327, https://doi.org/10.1016/j.atmosenv.2018.05.004, 2018.
Atabakhsh, S., Poulain, L., Chen, G., Canonaco, F., Prévôt, A. S. H., Pöhlker, M., Wiedensohler, A., and Herrmann, H.: A 1-year aerosol chemical speciation monitor (ACSM) source analysis of organic aerosol particle contributions from anthropogenic sources after long-range transport at the TROPOS research station Melpitz, Atmos. Chem. Phys., 23, 6963–6988, https://doi.org/10.5194/acp-23-6963-2023, 2023.
Bow, S.-T.: Pattern Recognition, Application to Large Data Set Problems, Marcel Dekker, Inc., ISBN 0824771761, ISBN 13 978-0824771768, 1984.
Bruns, E. A., Slowik, J. G., El Haddad, I., Kilic, D., Klein, F., Dommen, J., Temime-Roussel, B., Marchand, N., Baltensperger, U., and Prévôt, A. S. H.: Characterization of gas-phase organics using proton transfer reaction time-of-flight mass spectrometry: fresh and aged residential wood combustion emissions, Atmos. Chem. Phys., 17, 705–720, https://doi.org/10.5194/acp-17-705-2017, 2017.
Buzcu-Guven, B. and Fraser, M. P.: Comparison of VOC emissions inventory data with source apportionment results for Houston, TX, Atmos. Environ., 42, 5032–5043, https://doi.org/10.1016/j.atmosenv.2008.02.025, 2008.
Camredon, M., Hamilton, J. F., Alam, M. S., Wyche, K. P., Carr, T., White, I. R., Monks, P. S., Rickard, A. R., and Bloss, W. J.: Distribution of gaseous and particulate organic composition during dark α-pinene ozonolysis, Atmos. Chem. Phys., 10, 2893–2917, https://doi.org/10.5194/acp-10-2893-2010, 2010.
Carslaw, D. C. and Ropkins, K.: openair – An R package for air quality data analysis, Environ. Modell. Softw., 27–28, 52–61, https://doi.org/10.1016/j.envsoft.2011.09.008, 2012.
Carter, W. P. L.: Updated maximum incremental reactivity scale and hydrocarbon bin reactivities for regulatory applications, prepared for California Air Resources Board Contract 07-339, https://ww2.arb.ca.gov/sites/default/files/barcu/regact/2009/mir2009/mir10.pdf (last access: July 2018), 2010.
Cash, J. M., Langford, B., Di Marco, C., Mullinger, N. J., Allan, J., Reyes-Villegas, E., Joshi, R., Heal, M. R., Acton, W. J. F., Hewitt, C. N., Misztal, P. K., Drysdale, W., Mandal, T. K., Shivani, Gadi, R., Gurjar, B. R., and Nemitz, E.: Seasonal analysis of submicron aerosol in Old Delhi using high-resolution aerosol mass spectrometry: chemical characterisation, source apportionment and new marker identification, Atmos. Chem. Phys., 21, 10133–10158, https://doi.org/10.5194/acp-21-10133-2021, 2021.
Chandra, B. P. and Sinha, V.: Contribution of post-harvest agricultural paddy residue fires in the N. W. Indo–Gangetic Plain to ambient carcinogenic benzenoids, toxic isocyanic acid and carbon monoxide, Environ. Int., 88, 187–197, https://doi.org/10.1016/J.ENVINT.2015.12.025, 2016.
Chandra, B. P., Sinha, V., Hakkim, H., and Sinha, B.: Storage stability studies and field application of low-cost glass flasks for analyses of thirteen ambient VOCs using proton transfer reaction mass spectrometry, Int. J. Mass Spectrom., 419, 11–19, https://doi.org/10.1016/j.ijms.2017.05.008, 2017.
Chandra, B. P., Sinha, V., Hakkim, H., Kumar, A., Pawar, H., Mishra, A. K., Sharma, G., Pallavi, Garg, S., Ghude, S. D., Chate, D. M., Pithani, P., Kulkarni, R., Jenamani, R. K., and Rajeevan M.: Odd–even traffic rule implementation during winter 2016 in Delhi did not reduce traffic emissions of VOCs, carbon dioxide, methane and carbon monoxide, Curr. Sci. India, 114, 1318–1325, 2018.
Chaudhary, P., Singh, R., Shabin, M., Sharma, A., Bhatt, S., Sinha, V., and Sinha, B.: Replacing the greater evil: Can legalizing decentralized waste burning in improved devices reduce waste burning emissions for improved air quality?, Environ. Pollut., 311, 119897, https://doi.org/10.1016/J.ENVPOL.2022.119897, 2022.
Che, H., Shen, X., Yao, Z., Wua, B., Gou, R., Hao, X., Cao, X., Li, X., Zhang, Z., Wang, S., and Chen, Z.: Real-world emission characteristics and inventory of volatile organic compounds originating from construction and agricultural machinery, Sci. Total. Environ., 894, 164993, https://doi.org/10.1016/j.scitotenv.2023.164993, 2023.
Crippa, M., Canonaco, F., Slowik, J. G., El Haddad, I., DeCarlo, P. F., Mohr, C., Heringa, M. F., Chirico, R., Marchand, N., Temime-Roussel, B., Abidi, E., Poulain, L., Wiedensohler, A., Baltensperger, U., and Prévôt, A. S. H.: Primary and secondary organic aerosol origin by combined gas-particle phase source apportionment, Atmos. Chem. Phys., 13, 8411–8426, https://doi.org/10.5194/acp-13-8411-2013, 2013.
Crippa M., Guizzardi D., Banja M., Solazzo E., Muntean M., Schaaf E., Pagani F., Monforti-Ferrario F., Olivier, J. G. J., Quadrelli, R., Risquez Martin, A., Taghavi-Moharamli, P., Grassi, G., Rossi, S., Oom, D., Branco, A., San-Miguel, J., and Vignati, E.: CO2 emissions of all world countries – JRC/IEA/PBL 2022 Report, Publications Office of the European Union, Luxembourg, JRC130363, https://doi.org/10.2760/07904, 2022.
Coggon, M. M., Lim, C. Y., Koss, A. R., Sekimoto, K., Yuan, B., Gilman, J. B., Hagan, D. H., Selimovic, V., Zarzana, K. J., Brown, S. S., Roberts, J. M., Müller, M., Yokelson, R., Wisthaler, A., Krechmer, J. E., Jimenez, J. L., Cappa, C., Kroll, J. H., de Gouw, J., and Warneke, C.: OH chemistry of non-methane organic gases (NMOGs) emitted from laboratory and ambient biomass burning smoke: evaluating the influence of furans and oxygenated aromatics on ozone and secondary NMOG formation, Atmos. Chem. Phys., 19, 14875–14899, https://doi.org/10.5194/acp-19-14875-2019, 2019.
Datta, S., Sharma, A., Parkar, V., Hakkim, H., Kumar, A., Chauhan, A., Tomar S. S., and Sinha, B.: A new index to assess the air quality impact of urban tree plantation, Urban Climate, 40, 100995, https://doi.org/10.1016/j.uclim.2021.100995, 2021.
Dekker, I. N., Houweling, S., Pandey, S., Krol, M., Röckmann, T., Borsdorff, T., Landgraf, J., and Aben, I.: What caused the extreme CO concentrations during the 2017 high-pollution episode in India?, Atmos. Chem. Phys., 19, 3433–3445, https://doi.org/10.5194/acp-19-3433-2019, 2019.
Derwent, R. G., Jenkin, M. E., Saunders, S. M., and Pilling, M. J.: Photochemical ozone creation potentials for organic compounds in northwest Europe calculated with a master chemical mechanism, Atmos. Environ., 32, 2429–2441, https://doi.org/10.1016/S1352-2310(98)00053-3, 1998.
Derwent, R. G., Jenkin, M. E., Utembe, S. R., Shallcross, D. E., Murrells, T. P., and Passant, N. R.: Secondary organic aerosol formation from a large number of reactive man-made organic compounds, Sci. Total. Environ., 408, 3374–3381, https://doi.org/10.1016/J.SCITOTENV.2010.04.013, 2010.
Fadly, D., Fontes, F., and Maertens, M.: Fuel for food: Access to clean cooking fuel and Food Secur in India, Food Secur., 15, 301–321, https://doi.org/10.1007/s12571-023-01350-y, 2023.
Fleming, L. T., Weltman, R., Yadav, A., Edwards, R. D., Arora, N. K., Pillarisetti, A., Meinardi, S., Smith, K. R., Blake, D. R., and Nizkorodov, S. A.: Emissions from village cookstoves in Haryana, India, and their potential impacts on air quality, Atmos. Chem. Phys., 18, 15169–15182, https://doi.org/10.5194/acp-18-15169-2018, 2018.
Gajbhiye, M. D., Lakshmanan, S., Aggarwal, R., Kumar, N., and Bhattacharya, S.: Evolution and mitigation of vehicular emissions due to India's Bharat Stage Emission Standards–A case study from Delhi, Environmental Development, 45, 100803, https://doi.org/10.1016/j.envdev.2023.100803, 2023.
Ganguly, T., Selvaraj, K. L., and Guttikunda, S. K.: National Clean Air Programme (NCAP) for Indian cities: Review and outlook of clean air action plans, Atmos. Environ.: X, 8, 100096, https://doi.org/10.1016/j.aeaoa.2020.100096, 2020.
Gao, Z., Hu, G., Wang, H., Zhu, B.: Characterization and assessment of volatile organic compounds (VOCs) emissions from the typical food manufactures in Jiangsu province, China, Atmos. Pollut. Res., 10, 571–579, https://doi.org/10.1016/j.apr.2018.10.010, 2019.
Guha, A., Gentner, D. R., Weber, R. J., Provencal, R., and Goldstein, A. H.: Source apportionment of methane and nitrous oxide in California's San Joaquin Valley at CalNex 2010 via positive matrix factorization, Atmos. Chem. Phys., 15, 12043–12063, https://doi.org/10.5194/acp-15-12043-2015, 2015.
Guo, H., Kota, S. H., Sahu, S. K., Hu, J., Ying, Q., Gao, A., and Zhang, H.: Source apportionment of PM2.5 in North India using source-oriented air quality models, Atmos. Chem. Phys., 17, 426–436, https://doi.org/10.1016/j.envpol.2017.08.016, 2017.
Haeri, F.: Molecular Speciation of Organic Nitrogen Compounds Separated in Smoke Particles Emitted from Burning Western U. S. Wildland Fuels, PhD thesis, Carnegie Mellon University, Pittsburgh, PA, USA, https://doi.org/10.1184/R1/22670578.v1, 2023.
Hakkim, H., Kumar, A., Annadate, S., Sinha, B., and Sinha, V.: Air pollution scenario analyses of fleet replacement strategies to accomplish reductions in criteria air pollutants and 74 VOCs over India, Atmos. Environ.: X, 13, 100150, https://doi.org/10.1016/j.aeaoa.2022.100150, 2021.
Harrison, M. A., Barra, S., Borghesi, D., Vione, D., Arsene, C., and Olariu, R. I.: Nitrated phenols in the atmosphere: a review, Atmos. Environ., 39, 231–248, https://doi.org/10.1016/j.atmosenv.2004.09.044, 2005a.
Harrison, M. A. J., Heal, M. R., and Cape, J. N.: Evaluation of the pathways of tropospheric nitrophenol formation from benzene and phenol using a multiphase model, Atmos. Chem. Phys., 5, 1679–1695, https://doi.org/10.5194/acp-5-1679-2005, 2005b.
Harrison, R. M., Allan, J., Carruthers, D., Heal, M. R., Alastair, L. C., Marner, B., Murrells, T., and Williams, A.: Non-exhaust vehicle emissions of particulate matter and VOC from road traffic: A review, Atmos. Environ., 262, 118592, https://doi.org/10.1016/j.atmosenv.2021.118592, 2021.
Hatch, L. E., Luo, W., Pankow, J. F., Yokelson, R. J., Stockwell, C. E., and Barsanti, K. C.: Identification and quantification of gaseous organic compounds emitted from biomass burning using two-dimensional gas chromatography–time-of-flight mass spectrometry, Atmos. Chem. Phys., 15, 1865–1899, https://doi.org/10.5194/acp-15-1865-2015, 2015.
Hatch, L. E., Yokelson, R. J., Stockwell, C. E., Veres, P. R., Simpson, I. J., Blake, D. R., Orlando, J. J., and Barsanti, K. C.: Multi-instrument comparison and compilation of non-methane organic gas emissions from biomass burning and implications for smoke-derived secondary organic aerosol precursors, Atmos. Chem. Phys., 17, 1471–1489, https://doi.org/10.5194/acp-17-1471-2017, 2017.
Hersbach, H., Bell, B., Berrisford, P., Biavati, G., Horányi, A., Muñoz Sabater, J., Nicolas, J., Peubey, C., Radu, R., Rozum, I., Schepers, D., Simmons, A., Soci, C., Dee, D., Thépaut, J.-N.: ERA5 hourly data on single levels from 1940 to present, Copernicus Climate Change Service (C3S) Climate Data Store (CDS), https://doi.org/10.24381/cds.adbb2d47, 2023.
Hodgson, S. C., Casey, R. J., Bigger, S. W., and Scheirs, J.: Review of volatile organic compounds derived from polyethylene, Polym.-Plast. Technol., 39, 845–874, https://doi.org/10.1081/PPT-100101409, 2000.
Jain, S., Sharma, S. K., Choudhary, N., Masiwal, R., Saxena, M., Sharma, A., Mandal, T. K., Gupta, A., Gupta, N. C., and Sharma, C.: Chemical characteristics and source apportionment of PM2.5 using PCA/APCS, UNMIX, and PMF at an urban site of Delhi, India, Environ. Sci. Pollut. R., 24, 14637–14656, https://doi.org/10.1007/s11356-017-8925-5, 2017.
Jain, S., Sharma, S. K., Vijayan, N., and Mandal, T. K.: Seasonal characteristics of aerosols (PM2.5 and PM10) and their source apportionment using PMF: A four-year study over Delhi, India, Environ. Pollut., 262, 114337, https://doi.org/10.1016/j.envpol.2020.114337, 2020.
Jain, V., Tripathi, S. N., Tripathi, N., Sahu, L. K., Gaddamidi, S., Shukla, A. K., Bhattu, D., Ganguly, D.: Seasonal variability and source apportionment of non-methane VOCs using PTR-TOF-MS measurements in Delhi, India, Atmos. Environ., 283, 119163, https://doi.org/10.1016/j.atmosenv.2022.119163, 2022.
Jaiprakash, Singhai, A., Habib, G., Sunder Raman, R., and Gupta, T.: Chemical characterization of PM1.0 aerosol in Delhi and source apportionment using positive matrix factorization. Environ. Sci. Pollut. R., 24, 445–462, https://doi.org/10.1007/s11356-016-7708-8, 2016.
Jankowski, M. J., Olsen, R., Thomassen, Y., and Molander, P.: Comparison of air samplers for determination of isocyanic acid and applicability for work environment exposure assessment, Environ. Sci.-Proc. Imp., 19, 1075–1085, https://doi.org/10.1039/C7EM00174F, 2017.
Jimenez, J. L., Canagaratna, M. R., Donahue, N. M., Prevot, A. S. H., Zhang, Q., Kroll, J. H., DeCarlo, P. F., Allan, J. D., Coe, H., Ng, N. L., Aiken, A. C., Docherty, K. S., Ulbrich, I. M., Grieshop, A. P., Robinson, A. L., Duplissy, J., Smith, J. D., Wilson, K. R., Lanz, V. A., Hueglin, C., Sun, Y. L., Tian, J., Laaksonen, A., Raatikainen, T., Rautiainen, J., Vaattovaara, P., Ehn, M., Kulmala, M., Tomlinson, J. M., Collins, D. R., Cubison, M. J., Dunlea, E. J., Huffman, J. A., Onasch, T. B., Alfarra, M. R., Williams, P. I., Bower, K., Kondo, Y., Schneider, J., Drewnick, F., Borrmann, S., Weimer, S., Demerjian, K., Salcedo, D., Cottrell, L., Griffin, R., Takami, A., Miyoshi, T., Hatakeyama, S., Shimono, A., Sun, J. Y., Zhang, Y. M., Dzepina, K., Kimmel, J. R., Sueper, D., Jayne, J. T., Herndon, S. C., Trimborn, A. M., Williams, L. R., Wood, E. C., Middlebrook, A. M., Kolb, C. E., Baltensperger, U., and Worsnop, D. R.: Evolution of Organic Aerosols in the Atmosphere, Science, 326, 1525–1529, https://doi.org/10.1126/science.1180353, 2009.
Khan, A. A., Garsa, K., Jindal, P., and Devara, P. C. S.: Effects of stubble burning and firecrackers on the air quality of Delhi, Environ. Monit. Assess., 195, 1170, https://doi.org/10.1007/s10661-023-11635-6, 2023.
Khare, P., Machesky, J., Soto, R. He, M., Presto, A. A., and Gentner, D. R.: Asphalt-related emissions are a major missing nontraditional source of secondary organic aerosol precursors, Science Advances, 6, eabb9785, https://doi.org/10.1126/sciadv.abb9785, 2020.
Kılıç, D., El Haddad, I., Brem, B. T., Bruns, E., Bozetti, C., Corbin, J., Durdina, L., Huang, R.-J., Jiang, J., Klein, F., Lavi, A., Pieber, S. M., Rindlisbacher, T., Rudich, Y., Slowik, J. G., Wang, J., Baltensperger, U., and Prévôt, A. S. H.: Identification of secondary aerosol precursors emitted by an aircraft turbofan, Atmos. Chem. Phys., 18, 7379–7391, https://doi.org/10.5194/acp-18-7379-2018, 2018.
Kim, S., Karl, T., Guenther, A., Tyndall, G., Orlando, J., Harley, P., Rasmussen, R., and Apel, E.: Emissions and ambient distributions of Biogenic Volatile Organic Compounds (BVOC) in a ponderosa pine ecosystem: interpretation of PTR-MS mass spectra, Atmos. Chem. Phys., 10, 1759–1771, https://doi.org/10.5194/acp-10-1759-2010, 2010.
Koss, A. R., Sekimoto, K., Gilman, J. B., Selimovic, V., Coggon, M. M., Zarzana, K. J., Yuan, B., Lerner, B. M., Brown, S. S., Jimenez, J. L., Krechmer, J., Roberts, J. M., Warneke, C., Yokelson, R. J., and de Gouw, J.: Non-methane organic gas emissions from biomass burning: identification, quantification, and emission factors from PTR-ToF during the FIREX 2016 laboratory experiment, Atmos. Chem. Phys., 18, 3299–3319, https://doi.org/10.5194/acp-18-3299-2018, 2018.
Krelling, C. and Badami, M.: Cost-effectiveness analysis of compressed natural gas implementation in the public bus transit fleet in Delhi, India, Transp Policy, 115, 49–61, https://doi.org/10.1016/j.tranpol.2021.10.019, 2022.
Kulkarni, S. H., Ghude, S. D., Jena, C., Karumuri, R. K., Sinha, B., Sinha, V., Kumar, R., Soni, V. K., and Khare M.: How Much Does Large-Scale Crop Residue Burning Affect the Air Quality in Delhi?, Environ. Sci. Technol., 54, 4790–4799, https://doi.org/10.1021/acs.est.0c00329, 2020.
Kumar, A., Sinha, V., Shabin, M., Hakkim, H., Bonsang, B., and Gros, V.: Non-methane hydrocarbon (NMHC) fingerprints of major urban and agricultural emission sources for use in source apportionment studies, Atmos. Chem. Phys., 20, 12133–12152, https://doi.org/10.5194/acp-20-12133-2020, 2020.
Kumar, A., Hakkim, H., Sinha, B., and Sinha, V.: Gridded 1 km × 1 km emission inventory for paddy stubble burning emissions over north-west India constrained by measured emission factors of 77 VOCs and district-wise crop yield data, Sci. Total. Environ., 789, 148064, https://doi.org/10.1016/J.SCITOTENV.2021.148064, 2021.
Kumar, V., Sarkar, C., and Sinha, V.: Influence of post-harvest crop residue fires on surface ozone mixing ratios in the NW IGP analyzed using 2 years of continuous in situ trace gas measurements, J. Geophys. Res.-Atmos., 121, 3619–3633, https://doi.org/10.1002/2015JD024308, 2016.
Kumar, V., Giannoukos, S., Haslett, S. L., Tong, Y., Singh, A., Bertrand, A., Lee, C. P., Wang, D. S., Bhattu, D., Stefenelli, G., Dave, J. S., Puthussery, J. V., Qi, L., Vats, P., Rai, P., Casotto, R., Satish, R., Mishra, S., Pospisilova, V., Mohr, C., Bell, D. M., Ganguly, D., Verma, V., Rastogi, N., Baltensperger, U., Tripathi, S. N., Prévôt, A. S. H., and Slowik, J. G.: Highly time-resolved chemical speciation and source apportionment of organic aerosol components in Delhi, India, using extractive electrospray ionization mass spectrometry, Atmos. Chem. Phys., 22, 7739–7761, https://doi.org/10.5194/acp-22-7739-2022, 2022.
Kurokawa, J. and Ohara, T.: Long-term historical trends in air pollutant emissions in Asia: Regional Emission inventory in ASia (REAS) version 3, Atmos. Chem. Phys., 20, 12761–12793, https://doi.org/10.5194/acp-20-12761-2020, 2020.
Li, J., Hao, Y., Simayi, M., Shi, Y., Xi, Z., and Xie, S.: Verification of anthropogenic VOC emission inventory through ambient measurements and satellite retrievals, Atmos. Chem. Phys., 19, 5905–5921, https://doi.org/10.5194/acp-19-5905-2019, 2019.
Li, N., Jiang, Q., Wang, F., Xie, J., Li, Y., Li, J., and Wu, S.: Emission behaviour, environmental impact and priority-controlled pollutants assessment of volatile organic compounds (VOCs) during asphalt pavement construction based on laboratory experiment, J. Hazard. Mater., 398, 122904, https://doi.org/10.1016/j.jhazmat.2020.122904, 2020.
Li, Y., Pöschl, U., and Shiraiwa, M.: Molecular corridors and parameterizations of volatility in the chemical evolution of organic aerosols, Atmos. Chem. Phys., 16, 3327–3344, https://doi.org/10.5194/acp-16-3327-2016, 2016.
Lignell, H., Epstein, S. A., Marvin, M. R., Shemesh, D., Gerber, B., and Nizkorodov, S.: Experimental and Theoretical Study of Aqueous cis-Pinonic Acid Photolysis., J. Phys. Chem. A., 117, 12930–12945, https://doi.org/10.1021/jp4093018, 2013.
Link, M. F., Kim, J., Park, G., Lee, T., Park, T., Babar, Z. B., Sung, K., Kim, P., Kang, S., Kim, J. S., and Choi, Y.: Elevated production of NH4NO3 from the photochemical processing of vehicle exhaust: implications for air quality in the Seoul Metropolitan Region, Atmos. Environ., 156, 95–101, https://doi.org/10.1016/j.atmosenv.2017.02.031, 2017.
Liu, T., Marlier, M. E., Karambelas, A., Jain, M., Singh, S., Singh, M. K., Gautam, R., and DeFries, R. S.: Missing emissions from post-monsoon agricultural fires in northwestern India: regional limitations of MODIS burned area and active fire products, Environ. Res. Commun., 1, 011007, https://doi.org/10.1088/2515-7620/ab056c, 2019.
Liu, T., Mickley, L. J., Singh, S., Jain, M., DeFries, R. S., and Marlier, M. E.: Crop residue burning practices across north India inferred from household survey data: Bridging gaps in satellite observations, Atmos. Environ.: X, 8, 100091, https://doi.org/10.1016/j.aeaoa.2020.100091, 2020.
Liu, Y., Chen, H., Gao, J., Li, Y., Dave, K., Chen, J., Federici, M., and Perricone, G.: Comparative analysis of non-exhaust airborne particles from electric and internal combustion engine vehicles, J. Hazard. Mater., 420, 126626, https://doi.org/10.1016/j.jhazmat.2021.126626, 2021.
Loubet, B., Buysse, P., Gonzaga-Gomez, L., Lafouge, F., Ciuraru, R., Decuq, C., Kammer, J., Bsaibes, S., Boissard, C., Durand, B., Gueudet, J.-C., Fanucci, O., Zurfluh, O., Abis, L., Zannoni, N., Truong, F., Baisnée, D., Sarda-Estève, R., Staudt, M., and Gros, V.: Volatile organic compound fluxes over a winter wheat field by PTR-Qi-TOF-MS and eddy covariance, Atmos. Chem. Phys., 22, 2817–2842, https://doi.org/10.5194/acp-22-2817-2022, 2022.
Lyman, W. J.: Estimation of physical properties, in: Environmental Exposure From Chemicals, edited by: Neely, W. B. and Blau, G. E., CRC Press, Boca Raton, FL, https://doi.org/10.1201/9781351071789, p. 13–47, 1985.
Lyman, W. J., Reehl, W. F., and Rosenblatt, D. H.: Handbook of chemical property estimation methods, United States, American Chemical Society, ISBN: 0841217610, ISBN-13: 978-0841217614, 1990.
Mahilang, M., Deb, M. K., Pervez, S., Tiwari, S., and Jain, V. K.: Biogenic secondary organic aerosol formation in an urban area of eastern central India: Seasonal variation, size distribution and source characterization, Environ. Res., 195, 110802, https://doi.org/10.1016/j.envres.2021.110802, 2021.
Ministry of Road Transport & Highways (MoRTH), India: Vahan Dashboard, https://vahan.parivahan.gov.in/vahan4dashboard/, last access: 20 November 2023.
Mishra, S., Tripathi, S. N., Kanawade, V. P., Haslett, S. L., Dada, L., Ciarelli, G., Kumar, V., Singh, A., Bhattu, D., Rastogi, N., Daellenbach, K. R., Ganguly, D., Gargava, P., Slowik, J. G., Kulmala, M., Mohr, C., El-Haddad, I., and Prevot, A. S. H.: Rapid night-time nanoparticle growth in Delhi driven by biomass-burning emissions, Nat. Geosci., 16, 224–230, https://doi.org/10.1038/s41561-023-01138-x, 2023.
Mishra, S., Sinha, V., Hakkim, H., Awasthi, A., Ghude, S. D., Soni, V. K., Nigam, N., Sinha, B., and Rajeevan, M. N.: Discovery of reactive chlorine, sulphur and nitrogen containing ambient volatile organic compounds in the megacity of Delhi during both clean and extremely polluted seasons, EGUsphere [preprint], https://doi.org/10.5194/egusphere-2024-500, 2024.
Mochizuki, T., Kawamura, K., Miyazaki, Y., Kunwar, B., and Boreddy, S. K. R.: Distributions and sources of low-molecular-weight monocarboxylic acids in gas and particles from a deciduous broadleaf forest in northern Japan, Atmos. Chem. Phys., 19, 2421–2432, https://doi.org/10.5194/acp-19-2421-2019, 2019.
Morino, Y., Ohara, T., Yokouchi, Y., and Ooki, A.: Comprehensive source apportionment of volatile organic compounds using observational data, two receptor models, and an emission inventory in Tokyo metropolitan area, J. Geophys. Res.-Atmos., 116, D02311, https://doi.org/10.1029/2010JD014762, 2011.
Nagar, P. K., Singh, D., Sharma, M., Kumar, A., Aneja, V. P., George, M. P., Agarwal, N., and Shukla, S. P.: Characterization of PM2.5 in Delhi: role and impact of secondary aerosol, burning of biomass, and municipal solid waste and crustal matter, Environ. Sci. Pollut. Res., 24, 25179–25189, https://doi.org/10.1007/s11356-017-0171-3, 2017.
Nagpure, A. S., Ramaswami, A., and Russell, A.: Characterizing the spatial and temporal patterns of open burning of municipal solid waste (MSW) in Indian cities, Environ. Sci. Technol., 49, 12904–12912, https://doi.org/10.1021/acs.est.5b03243, 2015.
Nagpure, A. S., Gurjar, B. R., Kumar, V., Kumar, P.: Estimation of exhaust and non-exhaust gaseous, particulate matter and air toxics emissions from on-road vehicles in Delhi, Atmos. Environ., 127, 118–124, https://doi.org/10.1016/j.atmosenv.2015.12.026, 2016.
Norris, G., Duvall, R., Brown, S., and Bai, S.: EPA Positive Matrix Factorization (PMF) 5.0 Fundamentals and User Guide, https://www.epa.gov/sites/production/files/2015-02/documents/pmf_5.0_user_guide.pdf (last access: 31 October 2019), 2014.
Nowakowska, M., Herbinet, O., Dufour, A., and Glaude, P. A.: Kinetic Study of the Pyrolysis and Oxidation of Guaiacol, J. Phys. Chem. A, 122, 7894–7909, https://doi.org/10.1021/acs.jpca.8b06301, 2018.
Paatero, P. and Hopke, P. K.: Rotational tools for factor analytic models, J. Chemometrics, 23, 91–100, https://doi.org/10.1002/CEM.1197, 2009.
Paatero, P., Hopke, P. K., Song, X. H., and Ramadan, Z.: Understanding and controlling rotations in factor analytic models, Chemometr. Intell. Lab., 60, 253–264, https://doi.org/10.1016/S0169-7439(01)00200-3, 2002.
Paatero, P., Eberly, S., Brown, S. G., and Norris, G. A.: Methods for estimating uncertainty in factor analytic solutions, Atmos. Meas. Tech., 7, 781–797, https://doi.org/10.5194/amt-7-781-2014, 2014.
Pagonis, D., Sekimoto, K., and de Gouw, J.: A Library of Proton-Transfer Reactions of H3O+ Ions Used for Trace Gas Detection, J. Am. Soc. Mass Spectrom., 30, 1330–1335, https://doi.org/10.1007/s13361-019-02209-3, 2019.
Pallavi, Sinha, B., and Sinha, V.: Source apportionment of volatile organic compounds in the northwest Indo-Gangetic Plain using a positive matrix factorization model, Atmos. Chem. Phys., 19, 15467–15482, https://doi.org/10.5194/acp-19-15467-2019, 2019.
Palm, B. B., Peng, Q. Y., Fredrickson, C. D., Lee, B., Garofalo, L. A., Pothier, M. A., Kreidenweis, S. M., Farmer, D. K., Pokhrel, R. P., Shen, Y. J., Murphy, S. M., Permar, W., Hu, L., Campos, T. L., Hall, S. R., Ullmann, K., Zhang, X., Flocke, F., Fischer, E. V., and Thornton, J. A.: Quantification of organic aerosol and brown carbon evolution in fresh wildfire plumes, P. Natl. Acad. Sci. USA, 117, 29469–29477, https://doi.org/10.1073/pnas.2012218117, 2020.
Pandey, A., Brauer, M., Cropper, M. L., Balakrishnan, K., Mathur, P., Dey, S., Turkgulu, B., Kumar, G. A., Khare, M., Beig, G., Gupta, T., Krishnankutty, R. P., Causey, K., Cohen, A. J., Bhargava, S., Aggarwal, A. N., Agrawal, A., Awasthi, S., Bennitt, F., et al.: Health and economic impact of air pollution in the states of India: the Global Burden of Disease Study 2019, Lancet Planetary Health, 5, e25–e38, https://doi.org/10.1016/S2542-5196(20)30298-9, 2021.
Park, J.-H., Goldstein, A. H., Timkovsky, J., Fares, S., Weber, R., Karlik, J., and Holzinger, R.: Eddy covariance emission and deposition flux measurements using proton transfer reaction – time of flight – mass spectrometry (PTR-TOF-MS): comparison with PTR-MS measured vertical gradients and fluxes, Atmos. Chem. Phys., 13, 1439–1456, https://doi.org/10.5194/acp-13-1439-2013, 2013.
Pawar, H. and Sinha, B.: Residential heating emissions (can) exceed paddy-residue burning emissions in rural northwest India, Atmos. Environ., 269, 118846, https://doi.org/10.1016/J.ATMOSENV.2021.118846, 2022.
Pawar, H., Garg, S., Kumar, V., Sachan, H., Arya, R., Sarkar, C., Chandra, B. P., and Sinha, B.: Quantifying the contribution of long-range transport to particulate matter (PM) mass loadings at a suburban site in the north-western Indo-Gangetic Plain (NW-IGP), Atmos. Chem. Phys., 15, 9501–9520, https://doi.org/10.5194/acp-15-9501-2015, 2015.
Piel, F., Müller, M., Winkler, K., Skytte af Sätra, J., and Wisthaler, A.: Introducing the extended volatility range proton-transfer-reaction mass spectrometer (EVR PTR-MS), Atmos. Meas. Tech., 14, 1355–1363, https://doi.org/10.5194/amt-14-1355-2021, 2021.
Portillo-Estrada, M., Kazantsev, T., Talts, E., Tosens, T., and Niinemets, Ü.: Emission Timetable and Quantitative Patterns of Wound-Induced Volatiles Across Different Leaf Damage Treatments in Aspen (Populus tremula), J. Chem. Ecol., 41, 1105–1117, https://doi.org/10.1007/s10886-015-0646-y, 2015.
Prakash, J., Choudhary, S., Raliya, R., Chadha, T. S., Fang, J., and Biswas, P.: Real-time source apportionment of fine particle inorganic and organic constituents at an urban site in Delhi city: An IoT-based approach, Atmos. Pollut. Res., 12, 101206, https://doi.org/10.1016/j.apr.2021.101206, 2021.
Qin, G., Gao, S., Fu, Q., Fu, S., Jia, H., Zeng, Q., Fan, L., Ren, H., and Cheng, J.: Investigation of VOC characteristics, source analysis, and chemical conversions in a typical petrochemical area through 1-year monitoring and emission inventory, Environ. Sci. Pollut. Res., 29, 51635–51650, https://doi.org/10.1007/s11356-022-19145-7, 2022.
Ramasamy, S., Nakayama, T., Imamura, T., Morino, Y., Kajii, Y., and Sato, K.: Investigation of dark condition nitrate radical- and ozone-initiated aging oftoluene secondary organic aerosol: Importance of nitrate radical reactions with phenolic products, Atmos. Environ., 219, 117049, https://doi.org/10.1016/j.atmosenv.2019.117049, 2019.
Reyes-Villegas, E., Panda, U., Darbyshire, E., Cash, J. M., Joshi, R., Langford, B., Di Marco, C. F., Mullinger, N. J., Alam, M. S., Crilley, L. R., Rooney, D. J., Acton, W. J. F., Drysdale, W., Nemitz, E., Flynn, M., Voliotis, A., McFiggans, G., Coe, H., Lee, J., Hewitt, C. N., Heal, M. R., Gunthe, S. S., Mandal, T. K., Gurjar, B. R., Shivani, Gadi, R., Singh, S., Soni, V., and Allan, J. D.: PM1 composition and source apportionment at two sites in Delhi, India, across multiple seasons, Atmos. Chem. Phys., 21, 11655–11667, https://doi.org/10.5194/acp-21-11655-2021, 2021.
Rizzo, M. J. and Scheff, P. A.: Utilizing the Chemical Mass Balance and Positive Matrix Factorization models to determine influential species and examine possible rotations in receptor modeling results, Atmos. Environ., 41, 6986–6998, https://doi.org/10.1016/J.ATMOSENV.2007.05.008, 2007.
Rolph, G., Stein, A., and Stunder, B.: Real-time Environmental Applications and Display sYstem: READY, Environ. Modell. Softw., 95, 210–228, https://doi.org/10.1016/j.envsoft.2017.06.025, 2017.
Roozitalab, B., Carmichael, G. R., and Guttikunda, S. K.: Improving regional air quality predictions in the Indo-Gangetic Plain – case study of an intensive pollution episode in November 2017, Atmos. Chem. Phys., 21, 2837–2860, https://doi.org/10.5194/acp-21-2837-2021, 2021.
Sarkar, C., Sinha, V., Kumar, V., Rupakheti, M., Panday, A., Mahata, K. S., Rupakheti, D., Kathayat, B., and Lawrence, M. G.: Overview of VOC emissions and chemistry from PTR-TOF-MS measurements during the SusKat-ABC campaign: high acetaldehyde, isoprene and isocyanic acid in wintertime air of the Kathmandu Valley, Atmos. Chem. Phys., 16, 3979–4003, https://doi.org/10.5194/acp-16-3979-2016, 2016.
Sarkar, C., Sinha, V., Sinha, B., Panday, A. K., Rupakheti, M., and Lawrence, M. G.: Source apportionment of NMVOCs in the Kathmandu Valley during the SusKat-ABC international field campaign using positive matrix factorization, Atmos. Chem. Phys., 17, 8129–8156, https://doi.org/10.5194/acp-17-8129-2017, 2017.
Schulze, B. C., Ward, R. X., Pfannerstill, E. Y., Zhu, Q., Arata, C., Place, B., Nussbaumer, C., Wooldridge, P., Woods, R., Bucholtz, A., and Cohen, R. C.: Methane emissions from dairy operations in California’s San Joaquin Valley evaluated using airborne flux measurements, Environ. Sci. Technol., 57, 19519–19531, https://doi.org/10.1021/acs.est.3c03940, 2023.
Sharma, G., Annadate, S., and Sinha, B.: Will open waste burning become India's largest air pollution source?, Environ. Pollut., 292, 118310, https://doi.org/10.1016/j.envpol.2021.118310, 2022.
Sharma, S. K. and Mandal T. K.: Chemical composition of fine mode particulate matter (PM2.5) in an urban area of Delhi, India and its source apportionment, Urban Climate, 21, 106–122, https://doi.org/10.1016/j.uclim.2017.05.009, 2017.
Sharma, S. K., Sharma, A., Saxena, M., Choudhary, N., Masiwal, R., Mandal, T. K., and Sharma, C.: Chemical characterization and source apportionment of aerosol at an urban area of Central Delhi, India, Atmos. Pollut. Res., 7, 110–121, https://doi.org/10.1016/j.apr.2015.08.002, 2016.
Shukla, A. K., Tripathi, S. N., Canonaco, F., Lalchandani, V., Sahu, R., Srivastava, D., Dave, J., Thamban, N. M., Gaddamidi, S., Sahu, L., Kumar, M., Singh, V., and Rastogi, N.: Spatio-temporal variation of C-PM2.5 (composition based PM2.5) sources using PMF*PMF (double-PMF) and single-combined PMF technique on real-time non-refractory, BC and elemental measurements during post-monsoon and winter at two sites in Delhi, India, Atmos. Environ., 293, 119456, https://doi.org/10.1016/j.atmosenv.2022.119456, 2023.
Singh, R., Sinha, B., Hakkim, H., and Sinha, V.: Source apportionment of volatile organic compounds during paddy-residue burning season in north-west India reveals a large pool of photochemically formed air toxics, Environ. Pollut., 338, 122656, https://doi.org/10.1016/j.envpol.2023.122656, 2023.
Singh, S., Mishra, S., Mathai, R., Sehgal, A. K., and Suresh, R.: Comparative study of unregulated emissions on a heavy duty CNG engine using CNG and hydrogen blended CNG as fuels, SAE Int. J. Engines, 9, 2292–2300, https://doi.org/10.4271/2016-01-8090, 2016.
Sinha, V., Kumar, V., and Sarkar, C.: Chemical composition of pre-monsoon air in the Indo-Gangetic Plain measured using a new air quality facility and PTR-MS: high surface ozone and strong influence of biomass burning, Atmos. Chem. Phys., 14, 5921–5941, https://doi.org/10.5194/acp-14-5921-2014, 2014.
Srivastava, A., Gupta, S., and Jain, V. K.: Source Apportionment of Total Suspended Particulate Matter in Coarse and Fine Size Ranges Over Delhi, Aerosol Air Qual. Res., 8, 188–200, https://doi.org/10.4209/aaqr.2007.09.0040, 2008.
Stein, A. F., Draxler, R. R., Rolph, G. D., Stunder, B. J. B.., Cohen, M. D., and Ngan, F.: NOAA's HYSPLIT atmospheric transport and dispersion modeling system, B. Am. Meteorol. Soc., 96, 2059–2077,https://doi.org/10.1175/BAMS-D-14-00110.1, 2015.
Stockwell, C. E., Veres, P. R., Williams, J., and Yokelson, R. J.: Characterization of biomass burning emissions from cooking fires, peat, crop residue, and other fuels with high-resolution proton-transfer-reaction time-of-flight mass spectrometry, Atmos. Chem. Phys., 15, 845–865, https://doi.org/10.5194/acp-15-845-2015, 2015.
Thakur, M.: Low-smoke chulha and health consequences in Indian slums, doctoral thesis, Maastricht University, https://doi.org/10.26481/dis.20230403mt, 2023.
United Nations Department of Economic and Social Affairs, Population Division, World Population Prospects 2022: Summary of Results, UN DESA/POP/2022/TR/NO. 3, https://www.un.org/development/desa/pd/sites/www.un.org.development.desa.pd/files/wpp2022_summary_of_results.pdf (last access: 9 September 2024), 2022.
US Environmental Protection Agency (US EPA): Estimation Program Interface v4.1, https://www.epa.gov/tsca-screening-tools/download-epi-suitetm-estimation-program-interface-v411 (last access: 9 September 2024), 2015.
Villberg, K. and Veijanen, A.: Analysis of a GC/MS thermal desorption system with simultaneous sniffing for determination of off-odor compounds and VOCs in fumes formed during extrusion coating of low-density polyethylene, Anal. Chem., 73, 971–977, https://doi.org/10.1021/ac001114w, 2001.
Wang, M., Wang, Q., Ho, S. S. H., Li, H., Zhang, R., Ran, W., Que, L.: Chemical characteristics and sources of nitrogen-containing organic compounds at a regional site in the North China Plain during the transition period of autumn and winter, Sci. Total. Environ., 812, 151451, https://doi.org/10.1016/j.scitotenv.2021.151451, 2022.
Wiedinmyer, C., Kimura, Y., McDonald-Buller, E. C., Emmons, L. K., Buchholz, R. R., Tang, W., Seto, K., Joseph, M. B., Barsanti, K. C., Carlton, A. G., and Yokelson, R.: The Fire Inventory from NCAR version 2.5: an updated global fire emissions model for climate and chemistry applications, Geosci. Model Dev., 16, 3873–3891, https://doi.org/10.5194/gmd-16-3873-2023, 2023.
Xu, C., GaoL., Lyu, C., Qiao, L. Huang, D., Liu, Y., Li, D., and Zheng, M.: Molecular characteristics, sources and environmental risk of aromatic compounds in particulate matter during COVID-2019: Nontarget screening by ultra-high resolution mass spectrometry and comprehensive two-dimensional gas chromatography, Environ. Int., 167, 107421, https://doi.org/10.1016/j.envint.2022.107421, 2022.
Yáñez-Serrano, A. M., Filella, I., LLusià, J., Gargallo-Garriga, A., Granda, V., Bourtsoukidis, E., Williams, J., Seco, R., Cappellin, L., Werner, C., de Gouw, J., and Peñuelas, J.: GLOVOCS – Master compound assignment guide for proton transfer reaction mass spectrometry users, Atmos. Environ., 244, 117929, https://doi.org/10.1016/J.ATMOSENV.2020.117929, 2021.
Yao, L., Wang, M.-Y., Wang, X.-K., Liu, Y.-J., Chen, H.-F., Zheng, J., Nie, W., Ding, A.-J., Geng, F.-H., Wang, D.-F., Chen, J.-M., Worsnop, D. R., and Wang, L.: Detection of atmospheric gaseous amines and amides by a high-resolution time-of-flight chemical ionization mass spectrometer with protonated ethanol reagent ions, Atmos. Chem. Phys., 16, 14527–14543, https://doi.org/10.5194/acp-16-14527-2016, 2016.
You, Y., Kanawade, V. P., de Gouw, J. A., Guenther, A. B., Madronich, S., Sierra-Hernández, M. R., Lawler, M., Smith, J. N., Takahama, S., Ruggeri, G., Koss, A., Olson, K., Baumann, K., Weber, R. J., Nenes, A., Guo, H., Edgerton, E. S., Porcelli, L., Brune, W. H., Goldstein, A. H., and Lee, S.-H.: Atmospheric amines and ammonia measured with a chemical ionization mass spectrometer (CIMS), Atmos. Chem. Phys., 14, 12181–12194, https://doi.org/10.5194/acp-14-12181-2014, 2014.
Yuan, B., Koss, A. R., Warneke, C., Coggon, M., Sekimoto, K., and de Gouw, J.: Proton-Transfer-Reaction Mass Spectrometry: Applications in Atmospheric Sciences, Chem. Rev., 117, 13187–13229, https://doi.org/10.1021/acs.chemrev.7b00325, 2017.
Zaytsev, A., Koss, A. R., Breitenlechner, M., Krechmer, J. E., Nihill, K. J., Lim, C. Y., Rowe, J. C., Cox, J. L., Moss, J., Roscioli, J. R., Canagaratna, M. R., Worsnop, D. R., Kroll, J. H., and Keutsch, F. N.: Mechanistic study of the formation of ring-retaining and ring-opening products from the oxidation of aromatic compounds under urban atmospheric conditions, Atmos. Chem. Phys., 19, 15117–15129, https://doi.org/10.5194/acp-19-15117-2019, 2019.