the Creative Commons Attribution 4.0 License.
the Creative Commons Attribution 4.0 License.
 | 16 Sep 2024
Multi-scale variability of southeastern Australian wind resources
Claire L. Vincent
Andrew J. Dowdy
There is growing need to understand wind variability in various regions throughout the world, including in relation to wind energy resources. Here we examine wind variability in southeastern Australia in relation to the El Niño–Southern Oscillation (ENSO) as a dominant mode of atmospheric and oceanic variability for this region. The analysis covers variability from seasonal to diurnal timescales for both land and maritime regions of relevance to wind energy generation. Wind speeds were obtained from the 12 km grid length Bureau of Meteorology Atmospheric high-resolution Regional Reanalysis for Australia (BARRA) reanalysis, with a focus on wind at a typical hub-height of 100 m above the surface. Results show spatiotemporal variations in how ENSO influences wind speeds, including consistency in these variations over the wind speed distribution. For example, ENSO-related variations in mean winds were mostly similar in sign to ENSO-related variations in weak winds, noting uncertainties for strong winds given available data. Diurnal variability in wind speed was larger for summer than winter and for land than ocean regions, with the diurnal cycle maxima typically occurring in the afternoon and evening rather than morning, plausibly associated with sensible heating of air above land following solar radiation. Localised variations in the diurnal cycle were identified around mountains and coastal regions. The results show some indication of ENSO influences on the diurnal variability. These findings are intended to help enhance scientific understanding on wind variability, including in relation to ENSO, and to contribute information towards practical guidance in planning such as for use in energy sector applications.
- Article
(11738 KB) - Full-text XML
- BibTeX
- EndNote


Wind variability is important to understand for many reasons, including its key role in atmospheric circulation and the growth in electricity generation from wind turbines (Herbert et al., 2007; Blanco, 2009; Manwell et al., 2010; Sadorsky, 2021). Large-scale atmospheric and oceanic modes of variability, such as the El Niño–Southern Oscillation (ENSO), can influence weather conditions in regions through the world. For example, many studies have examined the influence of ENSO on regional temperature and rainfall variations (Ropelewski and Halpert, 1986; Bradley et al., 1987; Fraedrich, 1994; Davey et al., 2014; Taschetto et al., 2020). However, apart from trade wind variations in the tropical Pacific associated with the Walker Circulation that help define ENSO (Bjerknes, 1969; Anderson et al., 2013; Chen et al., 2013), only a few studies have examined ENSO–wind relationships with a focus on seasonal variations around Australia (Dowdy, 2020). These include Gunn et al. (2023), who used reanalysis data to examine the optimum distribution of wind farms in Australia to maximise night-time supply and noted inter-annual variability in wind farm capacity factor of over 10 %, finding reasonably high absolute correlations between annual wind power and ENSO in parts of Australia, and Richardson et al. (2023), who examined the co-variability of wind and solar droughts under different phases of ENSO, the Indian Ocean Dipole (IOD) and the Southern Annular Mode.
ENSO is a dominant global mode of atmospheric and oceanic variability on inter-annual timescales, with the El Niño phase of ENSO commonly referring to a weakening of the Walker Circulation and sea surface temperature gradients in the tropical Pacific, and these processes are reversed for the La Niña phase of ENSO, as described by Holton and Dmowska (1989). Additionally, ENSO can influence winds in other regions away from the tropical Pacific region, including through teleconnections and relationships between ENSO and other global and regional climate phenomena that influence local wind fields (Saji and Yamagata, 2003).
El Niño conditions are typically associated with an intensification of the Hadley cell, including constraining its meridional extension and an equatorial movement of the jet stream winds associated with its descending branch (Oort and Yienger, 1996; Nguyen et al., 2013; Li et al., 2024). ENSO conditions are also related to variations in the Southern Annular Mode (SAM), characterised by a nearly zonally symmetric pattern of pressure and geopotential height anomalies between high latitudes and midlatitudes in the Southern Hemisphere extratropics and associated with a meridional swing in the position of the eddy-driven westerly jet (Gong and Wang, 1999; Lim et al., 2013). Another key climate mode that influences weather in the Australian region is the Indian Ocean Dipole (IOD), characterised by coupled atmospheric–ocean variations in the tropical Indian Ocean (Saji et al., 1999). ENSO has significant relationships with IOD during the austral spring and with SAM during the austral spring and summer (e.g. Dowdy, 2016).
In addition to large-scale atmospheric and oceanic modes of variability, wind variability can also be associated with a range of more localised processes, including for the Australian region, such as katabatic (Manins and Sawford, 1979; Low, 1990) and sea breezes (Masouleh et al., 2019). However, there is relatively little research to date on how ENSO might influence such localised wind features as those, including for the Australian region. Examples include the study of Soderholm et al. (2017), who reported that El Niño (La Niña) tends to increase (suppress) the frequency of sea breeze days in southeastern Queensland, and Rauniyar and Walsh (2013), who showed a larger diurnal cycle of precipitation in El Niño than La Niña in tropical Australia. Anomalies of mean sea level pressure (MSLP) have also been examined in relation to ENSO for the Australian region during spring (Gillet et al., 2023), with this also being considered for different seasons in the analysis presented here given the potential to help provide insight into wind variations.
The relationship between ENSO and wind speed is examined here for southeastern Australia, including the surrounding maritime region, noting a focus on offshore wind energy development in this region. Wind variability is analysed at seasonal timescales and diurnal timescales, including how variability may be linked to ENSO variability. This analysis is presented with a focus on wind speed at a height of 100 m, given the relevance of this general height for wind turbines used in electricity generation. Wind data are obtained from the Bureau of Meteorology Atmospheric high-resolution Regional Reanalysis for Australia (BARRA) reanalysis (Su et al., 2019), covering the Australian region based on a horizontal grid spacing of ∼12 km, as detailed in Sect. 2. The BARRA reanalysis was selected for use here as it is specifically designed for providing insight into historical weather and climate for the Australian region. It is intended that these findings based on the BARRA reanalysis could be complementary to studies that use other data sets, such as the Global Wind Atlas (Davis et al., 2023; Larsén et al., 2022). This study does not attempt to include convective-scale wind variability or microscale aspects of the near-surface wind associated with high-resolution terrain or surface roughness.
This study is designed to help contribute to an enhanced understanding of wind variability, including in relation to ENSO as a key driver of variability throughout the world and in the study region of focus around Australia. In particular, the data and methods are selected to be relevant to wind turbines for power generation, including for insight into wind variability over both land and offshore locations. In addition to energy sector applications, the study findings are also intended to help contribute to broader guidance for planning and decision making in other sectors that can be affected by winds or associated ocean waves and coastal impacts. This includes offshore shipping and other maritime activities, coastal recreation, ecology, fishing aquaculture and natural resource management, in addition to helping contribute to an enhanced understanding of physical processes and variations in the general circulation of the atmosphere.
Homogenous wind observations are not available at different heights throughout Australian land and maritime regions. This study therefore uses wind data obtained from a relatively fine-scale reanalysis data set designed for the Australian region. The reanalysis data set used here is referred to as BARRA, as detailed in Su et al. (2019), based on model assimilation of local observations for dynamical downscaling from ERA-Interim reanalysis data (Dee et al., 2011).
Wind speed data from the BARRA reanalysis are used here with a horizontal grid spacing of ∼12 km in latitude and longitude. The BARRA reanalysis has been found to improve on global reanalyses for many features, with verification studies for the region around Australia showing smaller root-mean-square errors (RMSEs) in relation to observed surface pressure, temperature and wind speed (Su et al., 2019). Cowin et al. (2023) compared the BARRA reanalysis to the ERA5 and MERRA-2 reanalyses at selected Australian Bureau of Meteorology coastal weather stations and found that BARRA had the lowest percentage error and highest correlation with observations, while noting the difficulty in sourcing suitable observations for wind validation. Although some bias can still occur in the reanalysis data, the study focus is on broad-scale climatological variability associated with ENSO, while other aspects are not within its scope, such as precisely quantifying wind magnitudes or long-term climate change trends. Extremely strong wind speeds for short-duration gusts are also not considered, noting that this type of analysis could be suitable for finer-resolution reanalysis data (e.g. ∼4 km or finer grid spacing for convection-permitting simulations) that are not currently available for the Australian region.
Hourly time steps were used for the simulated wind data from BARRA reanalysis. Log-linear interpolation in height was used to interpolate data from the two model levels closest to 100 m at each grid point, which had average heights above ground level of 76 and 129 m over the study domain. After the interpolation of wind speeds to 100 m, their average value was calculated for each time step at each grid cell. Sensitivity of the results was tested for wind speed at a height of 300 m above ground level, which is relevant for future wind turbine developments (Herbert et al., 2007; Blanco, 2009; Manwell et al., 2010; Sardorsky, 2021). Very similar patterns of wind anomalies to those at 100 m were found, albeit with slightly large magnitudes (not shown). Moreover, sensitivity was tested for linear rather than log-linear interpolation, and average wind speed differences of up to 0.08 m s−1 were found, indicating that the results are not sensitive to the choice of interpolation method, although we note that there may be increased sensitivity to the interpolation method under low-level jet conditions.
The diurnal variation (including amplitude and phase) of the wind speed was calculated here using a harmonic fit to the hourly data from BARRA reanalysis. This was done individually for each grid cell using the following steps. First, the average wind speed was calculated for each hour using all data through the study period 1990–2018. Second, a simple harmonic fit to the hourly values was applied based on minimising the least-squares difference to a sine wave with varying phase, amplitude and mean offset. Third, the phase information is converted from Universal Time (UT) to a measure of local solar time (LST) using longitude in degrees east as follows: . All diurnal cycles start at the model output time closest to 00:00 LST, noting that this can lead to a small discontinuity in some values at 150° E, where the closest UT time to 00:00 LST changes from 15:00 UT (on the western side) to 14:00 UT (on the eastern side).
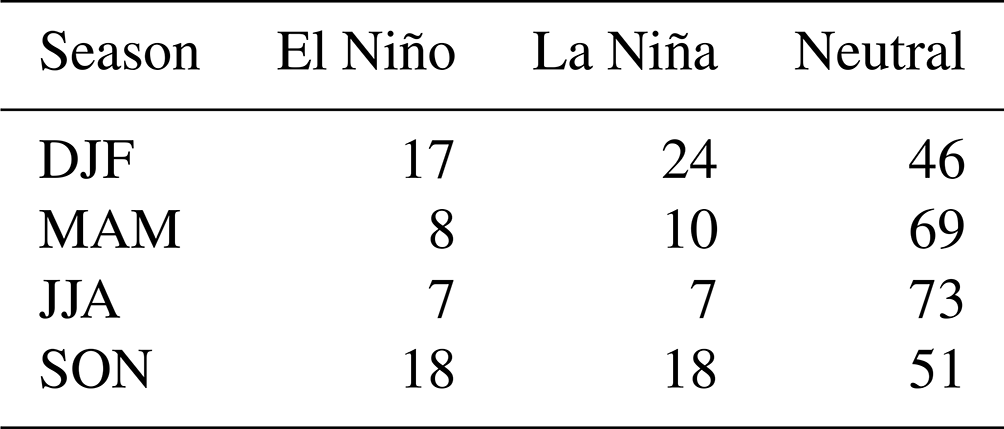
ENSO is represented using monthly values of the NINO3.4 index, with data obtained from NOAA Physical Sciences Laboratory (https://psl.noaa.gov/data/correlation/nina34.anom.data, last access: November 2022). The study method is based on considering composite spatial fields for different phases of ENSO, including the El Niño and La Niña phases. While noting that there is no single globally accepted method to define these phases of ENSO, this study considers El Niño conditions to occur for NINO3.4>0.8 and La Niña conditions to occur for , with neutral conditions for . The study analysis is presented using 3-month-average values to represent the austral seasons of summer (December, January and February, DJF), autumn (March, April and May, MAM), winter (June, July and August, JJA) and spring (September, October and November, SON). Table 1 presents the sample size of monthly values of NINO3.4 for each of the ENSO phases (El Niño, La Niña or neutral), presented individually for each of the four seasons, based on the study period 1990 to 2018.
Table 1Sample size of monthly data for each of the ENSO phases considered here: El Niño, La Niña or neutral. This is presented individually for each season (DJF, MAM, JJA and SON) based on the study period 1990 to 2018.
Statistical significance of results is tested in this study using bootstrapping with 1000 randomised samples. Confidence in results is indicated in some figures with stippling to show values that are significantly different to what could be expected based on a random sample using a statistical confidence level of 95 % (two-tailed test, i.e. >97.5 % or <2.5 %).
3.1 Seasonal variability of the wind speed and ENSO relationship
Figure 1 shows spatial fields of wind speed anomalies from the seasonal mean based on composites for El Niño and La Niña phases of ENSO (noting the sample sizes for these phases from Table 1). Stippling is included to highlight regions that are significantly different to what could be expected on average based on a random sample (as detailed in Sect. 2). Results are presented individually for different seasons of the year, allowing for insight in cases where the ENSO influence might vary between different seasons in a given region.
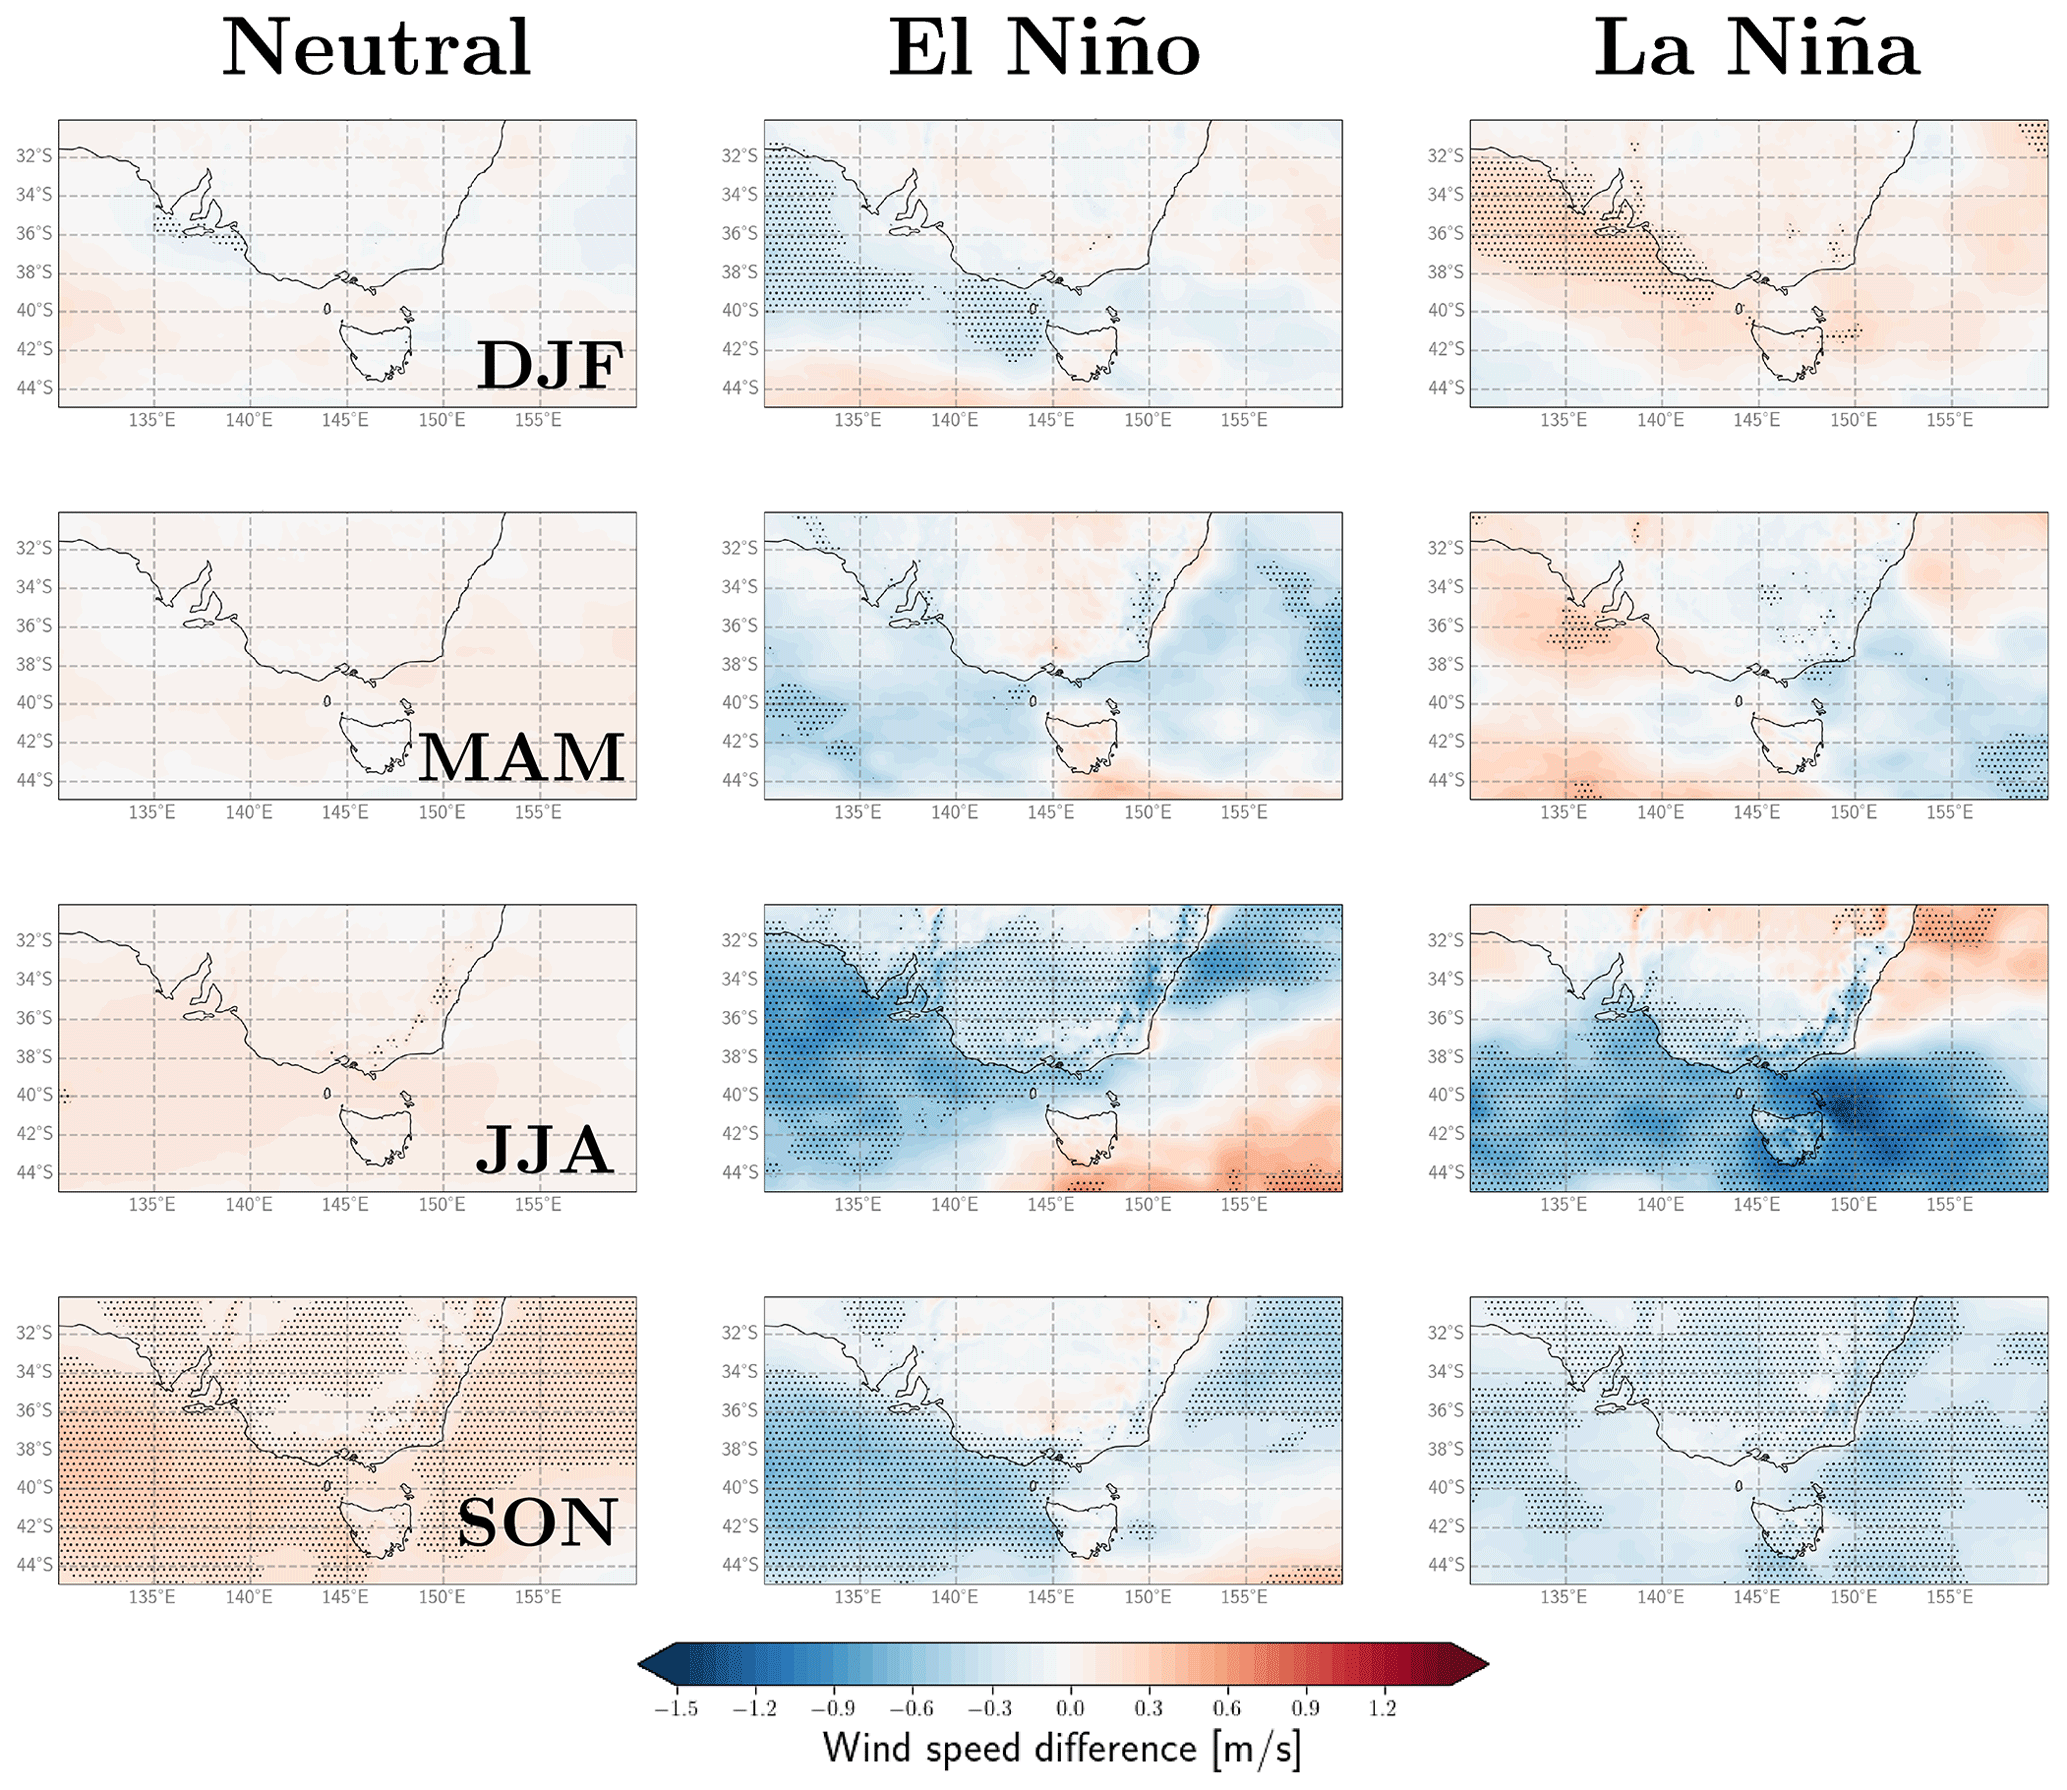
Figure 1Composite fields of wind speed anomalies from the seasonal mean, shown individually for neutral (left column), El Niño (middle column) and La Niña (right column) during the austral summer (DJF, upper row), autumn (MAM, second row), winter (JJA, third row) and spring (SON, lower row). Stippling is included to highlight regions that are significantly different to what could be expected on average based on random chance alone, using a statistical confidence level of 95 % (two-tailed test). Sample sizes for each case are as shown previously in Table 1.
The results indicate several regions with significant relationships between ENSO and wind speed for a given season. For the example of the austral summer (DJF), the winds tend to be weaker for El Niño and stronger for La Niña at about 39° S, particularly in some western maritime areas, with the converse anomalies to this occurring further poleward around 44° S. During winter (JJA), the winds are weaker for El Niño through much of the western and northern areas, with La Niña having stronger winds in the northeast and weaker winds in the south of the study region, while noting a relatively small sample size for El Niño and La Niña in JJA (from Table 1). Relatively weak winds also occur for both El Niño and La Niña along the eastern and southeastern parts of the Australian continent shown here, noting that this corresponds to areas of higher elevation along the Great Dividing Range. During spring (SON), relatively weak winds occur in many locations for El Niño and for La Niña, associated with stronger winds in general for the neutral phase of ENSO. These results are consistent with those of Gunn et al. (2023), who show the correlation of capacity factor with the Nino3.4 index for the whole year. Their results indicate more wind power along the central southern coastal areas of Australia and inland areas of southeastern Australia under La Niña conditions and higher-capacity factors around the topography in southeastern Australia under El Niño conditions.
3.2 High and low extreme wind speeds and ENSO variability
The relationship between ENSO and wind extremes is examined in this section, including for weak winds and strong winds. Results are examined here for wind speeds less than 5 m s−1 and for wind speeds greater than 22 m s−1, providing examples of how ENSO influence might potentially vary over different parts of the wind speed distribution. This study's focus is on wind variability, with results intended to have broad relevance for a range of different wind turbines that may have some variation in power output as a function of wind speed. The lower threshold used here, for winds less than 5 m s−1, is around the approximate range where the power generation from wind turbines typically drops lower than the rated power. This is relevant for the concept of “wind drought” for turbines, where power generation might reduce substantially due to very weak winds, although power output is not directly analysed in this study. The upper threshold, for winds greater than 22 m s−1, is sometimes used for indicating potentially dangerous and damaging winds (Brown et al., 2023). It is also noted that wind turbines typically have a cut-out speed for very strong wind speeds, which varies between turbines, where the blades will be pointed into the wind to reduce potential damage (e.g. excessive strain that might exceed the turbine design standards). The distributions of wind speeds over land and water are shown in Fig. 2 over all seasons and the full study period. This indicates that weak winds (less than 5 m s−1) are relatively frequent, while strong winds (greater than 22 m s−1) are in the extreme tail of the distribution.
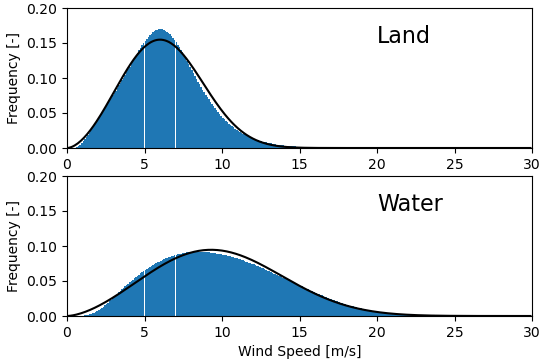
Figure 2Distribution of wind speed over the period 1990–2018 over land and water grid points. The blue shading is the histogram, and the black lines are a two-parameter Weibull fit.
The results for weak winds (i.e. less than 5 m s−1) show various seasons and regions where significant anomalies occur for different ENSO phases (Fig. 3). During summer (DJF), weak winds tend to occur more frequently for El Niño and less frequently for La Niña at around 39° S, particularly in some western maritime areas. This is a similar region to where the mean winds were relatively weak for El Niño and strong for La Niña, as seen previously from Fig. 1. It therefore appears that ENSO influences a range of the wind speed distribution in a similar way in this region during summer, with weaker winds for El Niño and stronger winds for La Niña on average, as shown from the mean wind speeds and for very weak wind speeds. Further poleward around 44° S, weak winds tend to occur less frequently for El Niño than La Niña, noting that this also indicates some similarities to results from Fig. 1.
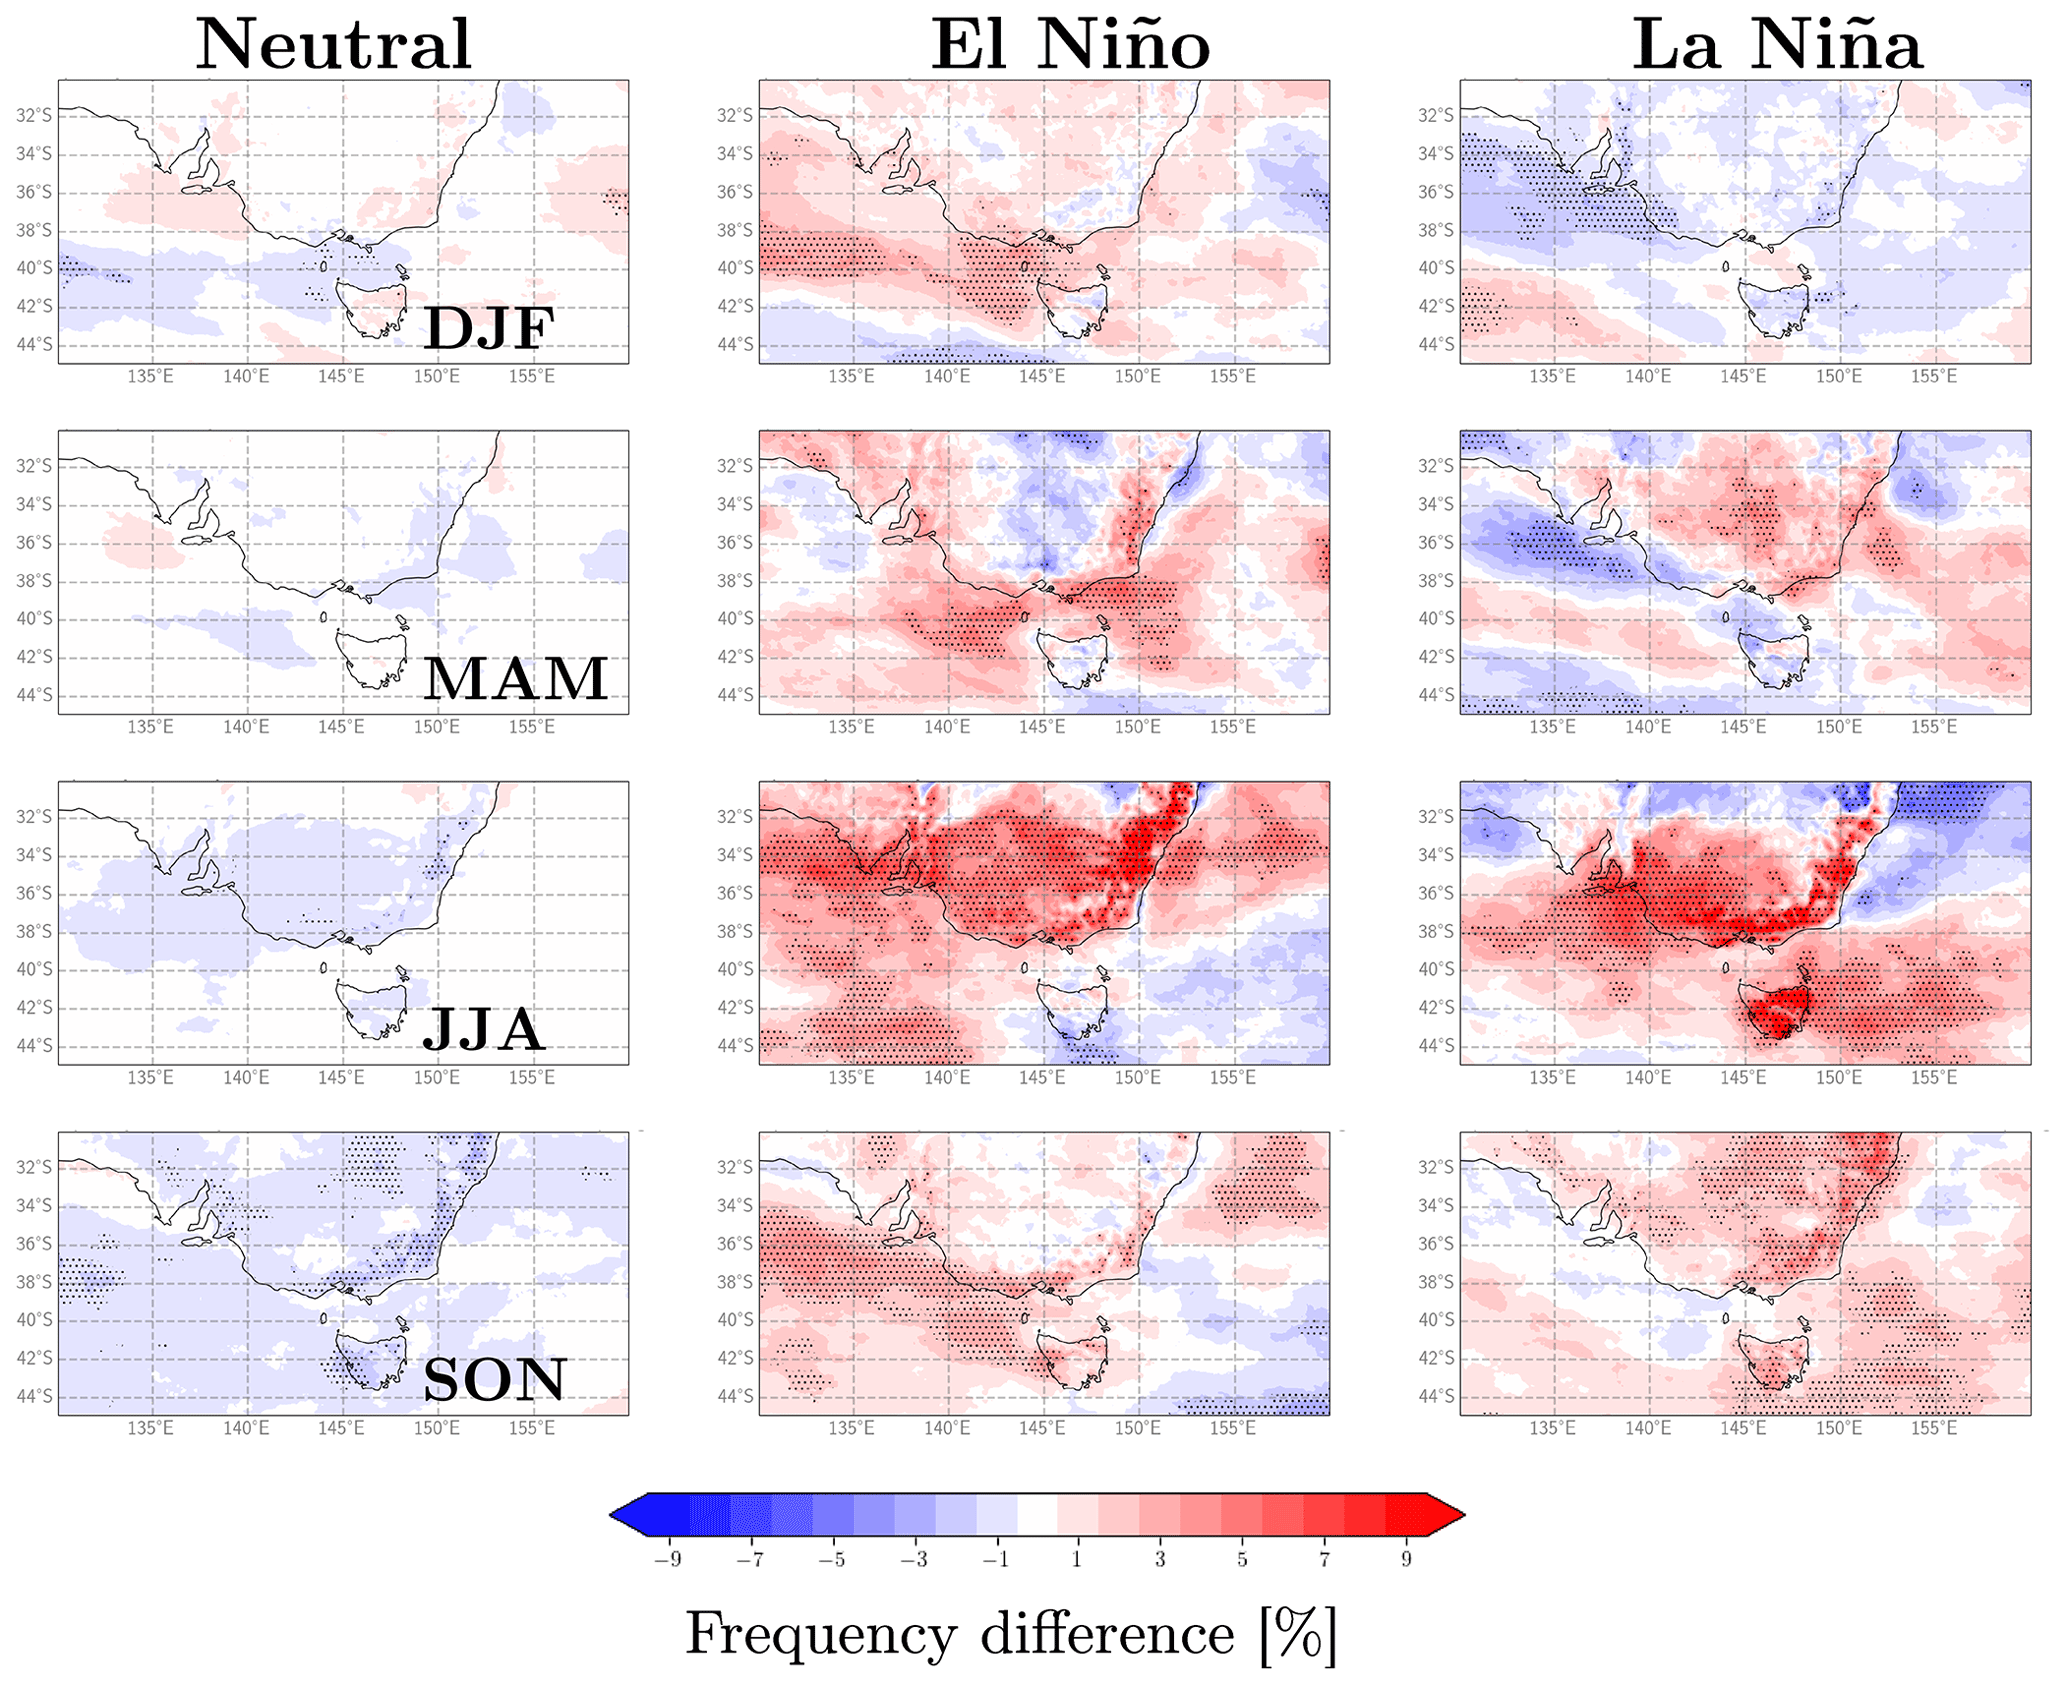
Figure 3The occurrence frequency of wind speeds less than 5 m s−1, based on hourly time steps. This is presented for neutral (left column), El Niño (central column) and La Niña (right column) conditions individually for the Australia summer (DJF: upper row), autumn (MAM: second row), winter (JJA: third row) and spring (SON: lower row). The values shown are the percentage difference in frequency, relative to all times in the study period.
During winter (JJA), weak winds occur more frequently for El Niño throughout much of the western and northern areas, with La Niña having weak winds occurring less frequently in the northeast and more frequently in the south of the study region (once again noting relatively small sample sizes for JJA from Table 1). Weak winds also occur more frequently for both El Niño and La Niña, as compared to the case for neutral ENSO conditions, along the eastern and southeastern parts of the Australian continent shown here (i.e. corresponding to the Great Dividing Range). These regional features for weak winds in winter are broadly similar to what was seen previously for mean winds (from Fig. 1), including El Niño having weaker winds throughout much of the west and north, La Niña having stronger winds in the northeast and weaker winds in the south, and both El Niño and La Niña having relatively weak winds along the Great Dividing Range.
During spring (SON) for El Niño, weak winds occur more frequently in parts of the west and northeast (Fig. 2), similar to the regions where the mean winds were weaker (from Fig. 1). During spring for La Niña, weak winds occur less frequently through much of the southwestern part of the study region and over the Australian continent, broadly similar to regions where the mean winds for La Niña were weaker than average during spring (from Fig. 1). These results are mostly consistent with those of Richardson et al. (2023), who indicated a greater likelihood of autumn wind droughts (defined as days when the daily average wind speed falls below 4.2 m s−1) in La Niña than El Niño years over a similar region of southeastern Australia to that shown as having increased frequency of light winds in this study. They also show noisy or weak signals in spring and summer and a greater likelihood of wind droughts in El Niño than La Niña in winter. Our results show little difference in likelihood of light wind days between ENSO phases in winter, but we note several differences with the study of Richardson et al. (2023), including using hourly rather than daily data, and using BARRA rather than ERA5 data, as well as a different study period.
The results for strong winds (Fig. 4) are interpreted here with awareness of the limitations of model data for simulating some physical processes associated with storms and severe winds. In particular, the reanalysis data used here are not expected to accurately represent extreme winds from severe convective storms, as that could require much finer-scale model resolution. As such, these results are interpreted in relation to weather systems with larger spatiotemporal scales than thunderstorms, such as extratropical cyclones and frontal systems that can cause extreme winds in the region near southern Australia (Catto and Dowdy, 2023). Additionally, results are shown in Fig. 4 only for locations where the average annual occurrence frequency of these extreme winds is 10 h or more, so as to focus on results for larger sample sizes.
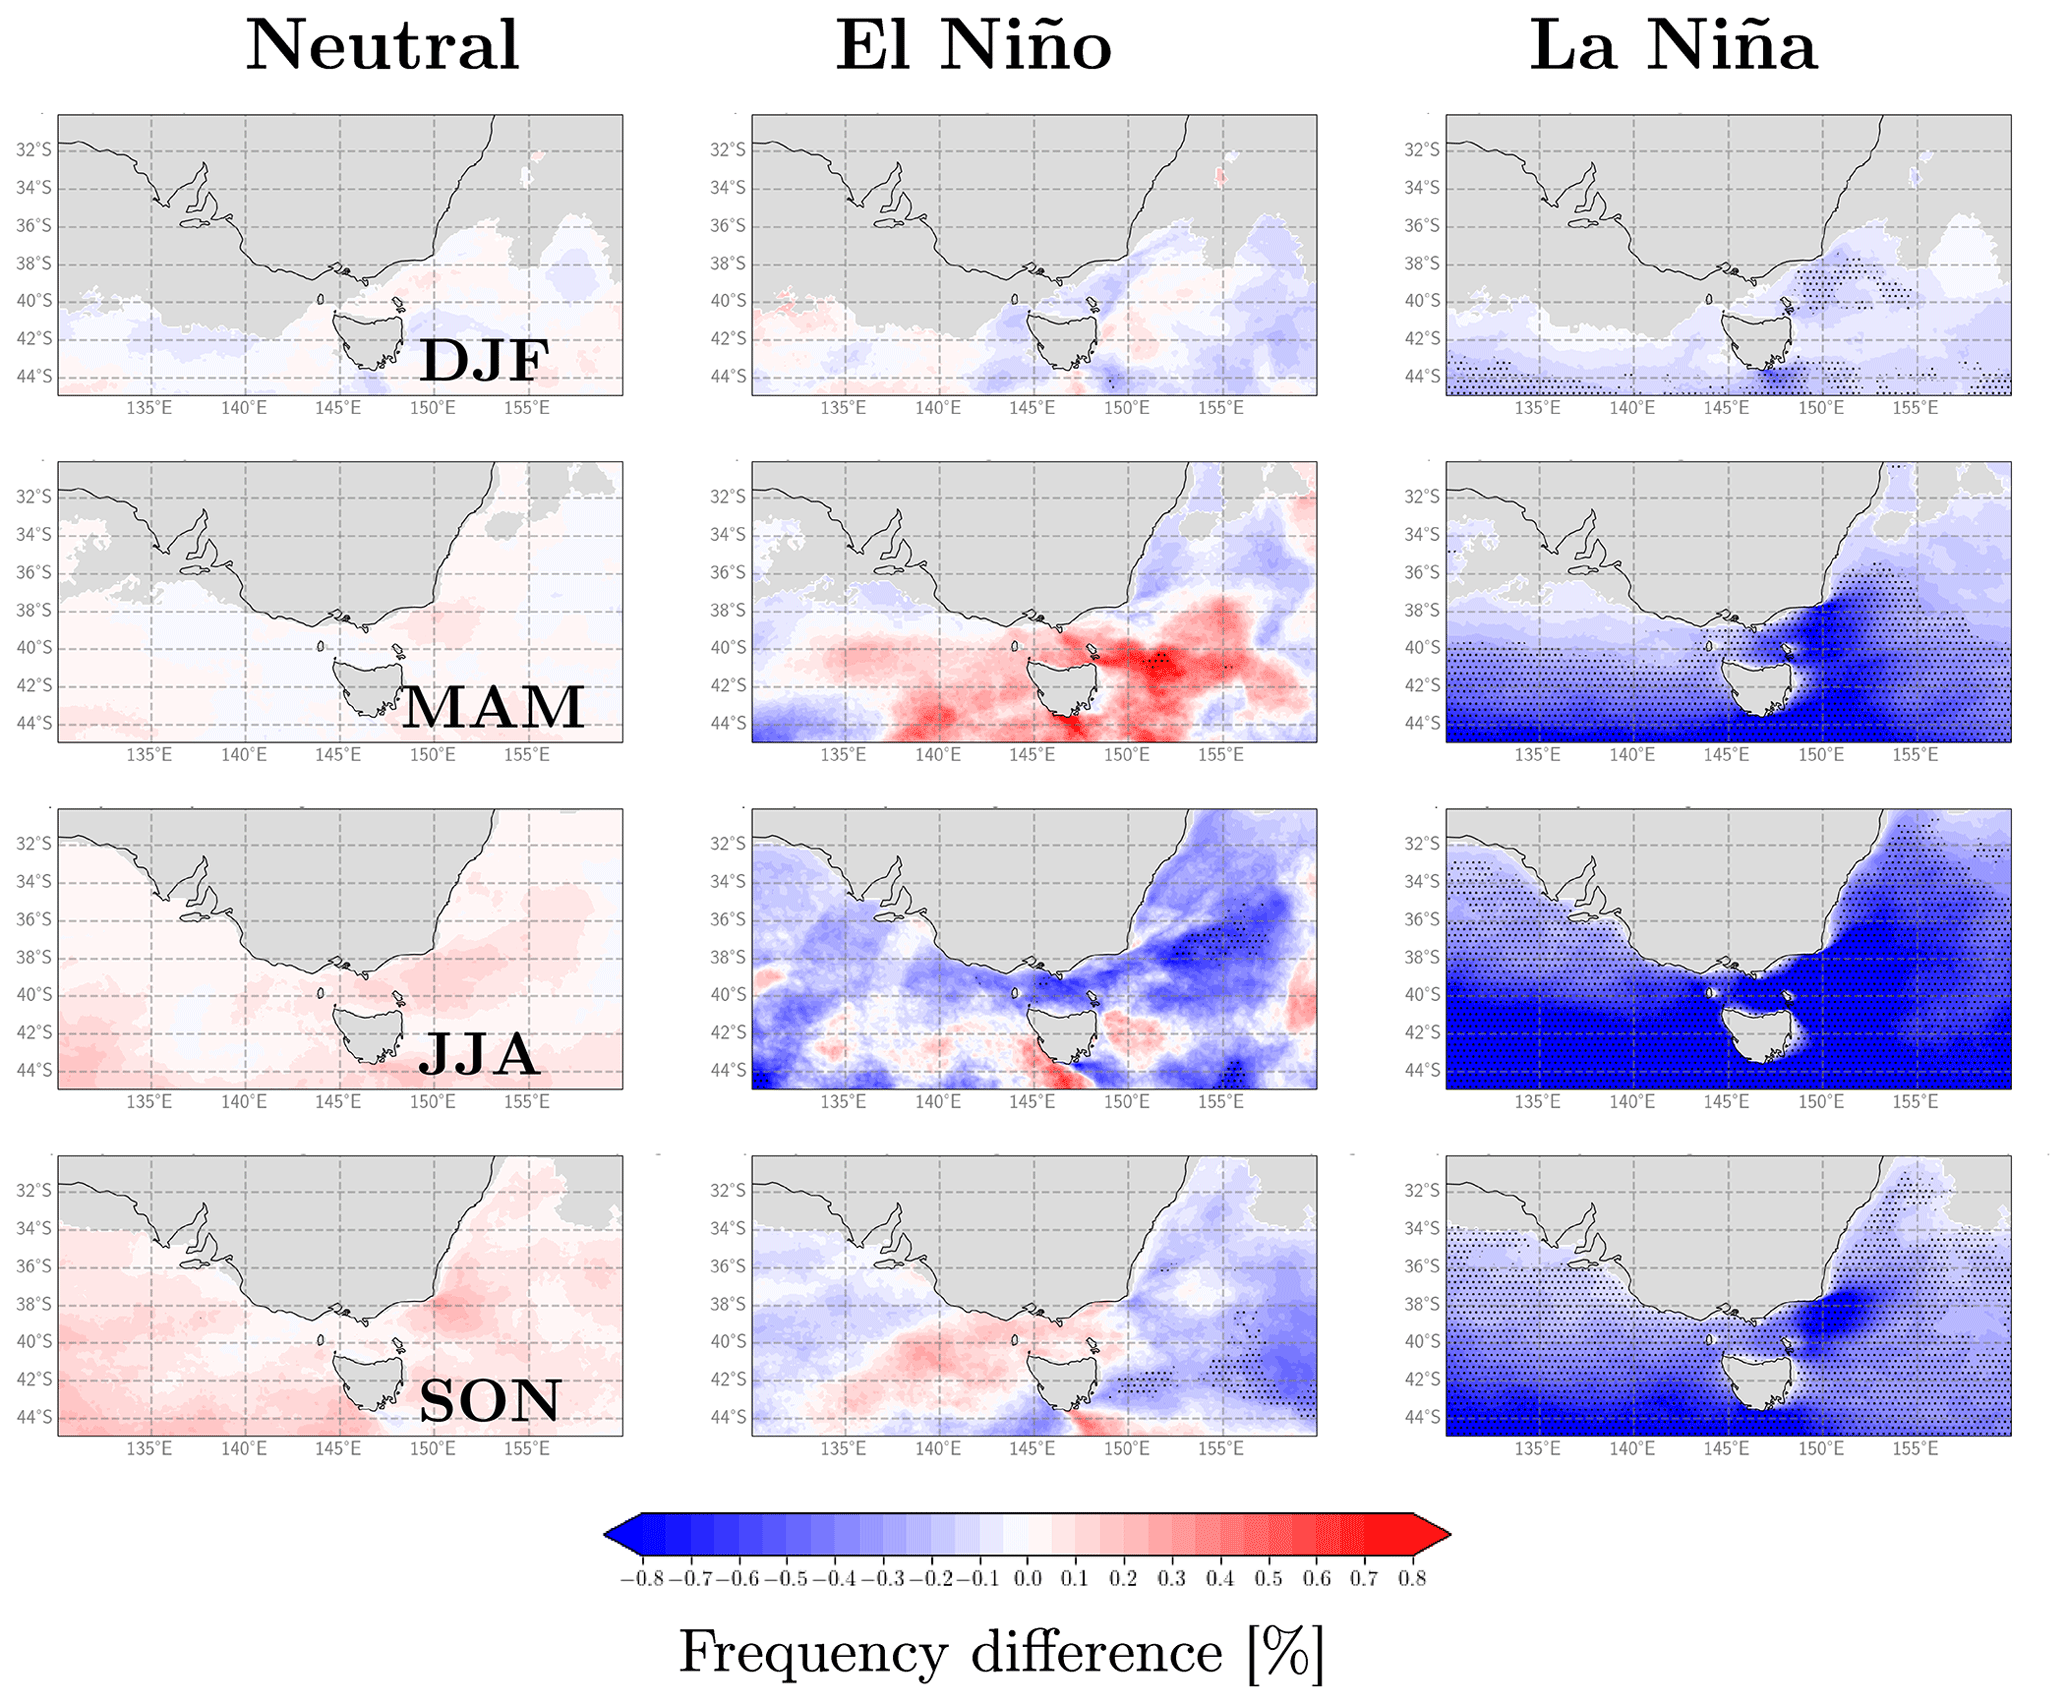
Figure 4The same as Fig. 3 but for wind speeds greater than 22 m s−1. Only regions that have a frequency over all ENSO phases of greater than 10 h yr−1 are shown, since synoptic-scale winds of this magnitude are relatively rare. Areas where the frequency is less than 10 h yr−1 (over all ENSO phases) are shaded in grey.
A substantial ENSO relationship with extreme winds is indicated in some maritime locations, including in the more southern parts of the study region for neutral ENSO conditions during winter and spring. For El Niño, some southern regions had more frequent extreme winds and some less frequent extreme winds, depending on the season. The southern part of the study region is in the general latitude range where extratropical storms are relatively strong and frequent, such as described in Simmonds and Keay (2000). Wind speeds >22 m s−1 are relatively rare, with many regions over land receiving <10 h yr−1 above this level (Fig. 2). Combining this analysis with convective-scale strong winds would lead to a greater number of hours with a wind speed >22 m s−1.
While acknowledging the limitations of the reanalysis data used here, such as discussed above and in Sect. 2, the results for extreme winds shown in Fig. 4 provide some indication that El Niño conditions could potentially be influencing extreme winds associated with the extratropical storm track in this region south of the Australian continent. This hypothesis provides scope for subsequent research that could be considered, such as using metrics for cyclone occurrence and intensity that might help examine these findings further.
3.3 Diurnal variability in wind speed and ENSO relationships
Figure 5 shows the amplitude of the diurnal variation in wind speed, presented as the average value for each season. The diurnal amplitude was calculated following the method described in Sect. 2 based on applying a harmonic fit to the average diurnal cycle in the BARRA reanalysis wind data. The harmonic fit of period 24 h assumes a single daily peak in wind speed and does not account for other periodicity, such as the semi-diurnal cycle or other higher-frequency components. Moreover, only some aspects of the diurnal cycle will be captured in this data set. Vincent and Lane (2017) and Birch et al. (2016) have shown errors in the timing and amplitude of the simulated diurnal cycle of precipitation in the tropics across a range of model resolutions, and some of these errors will also apply in the mid-latitudes and to the near-surface wind speed. However, it is expected that the regions of afternoon, evening or nocturnal wind maxima will be reproduced, albeit with possible timing errors of up to several hours.
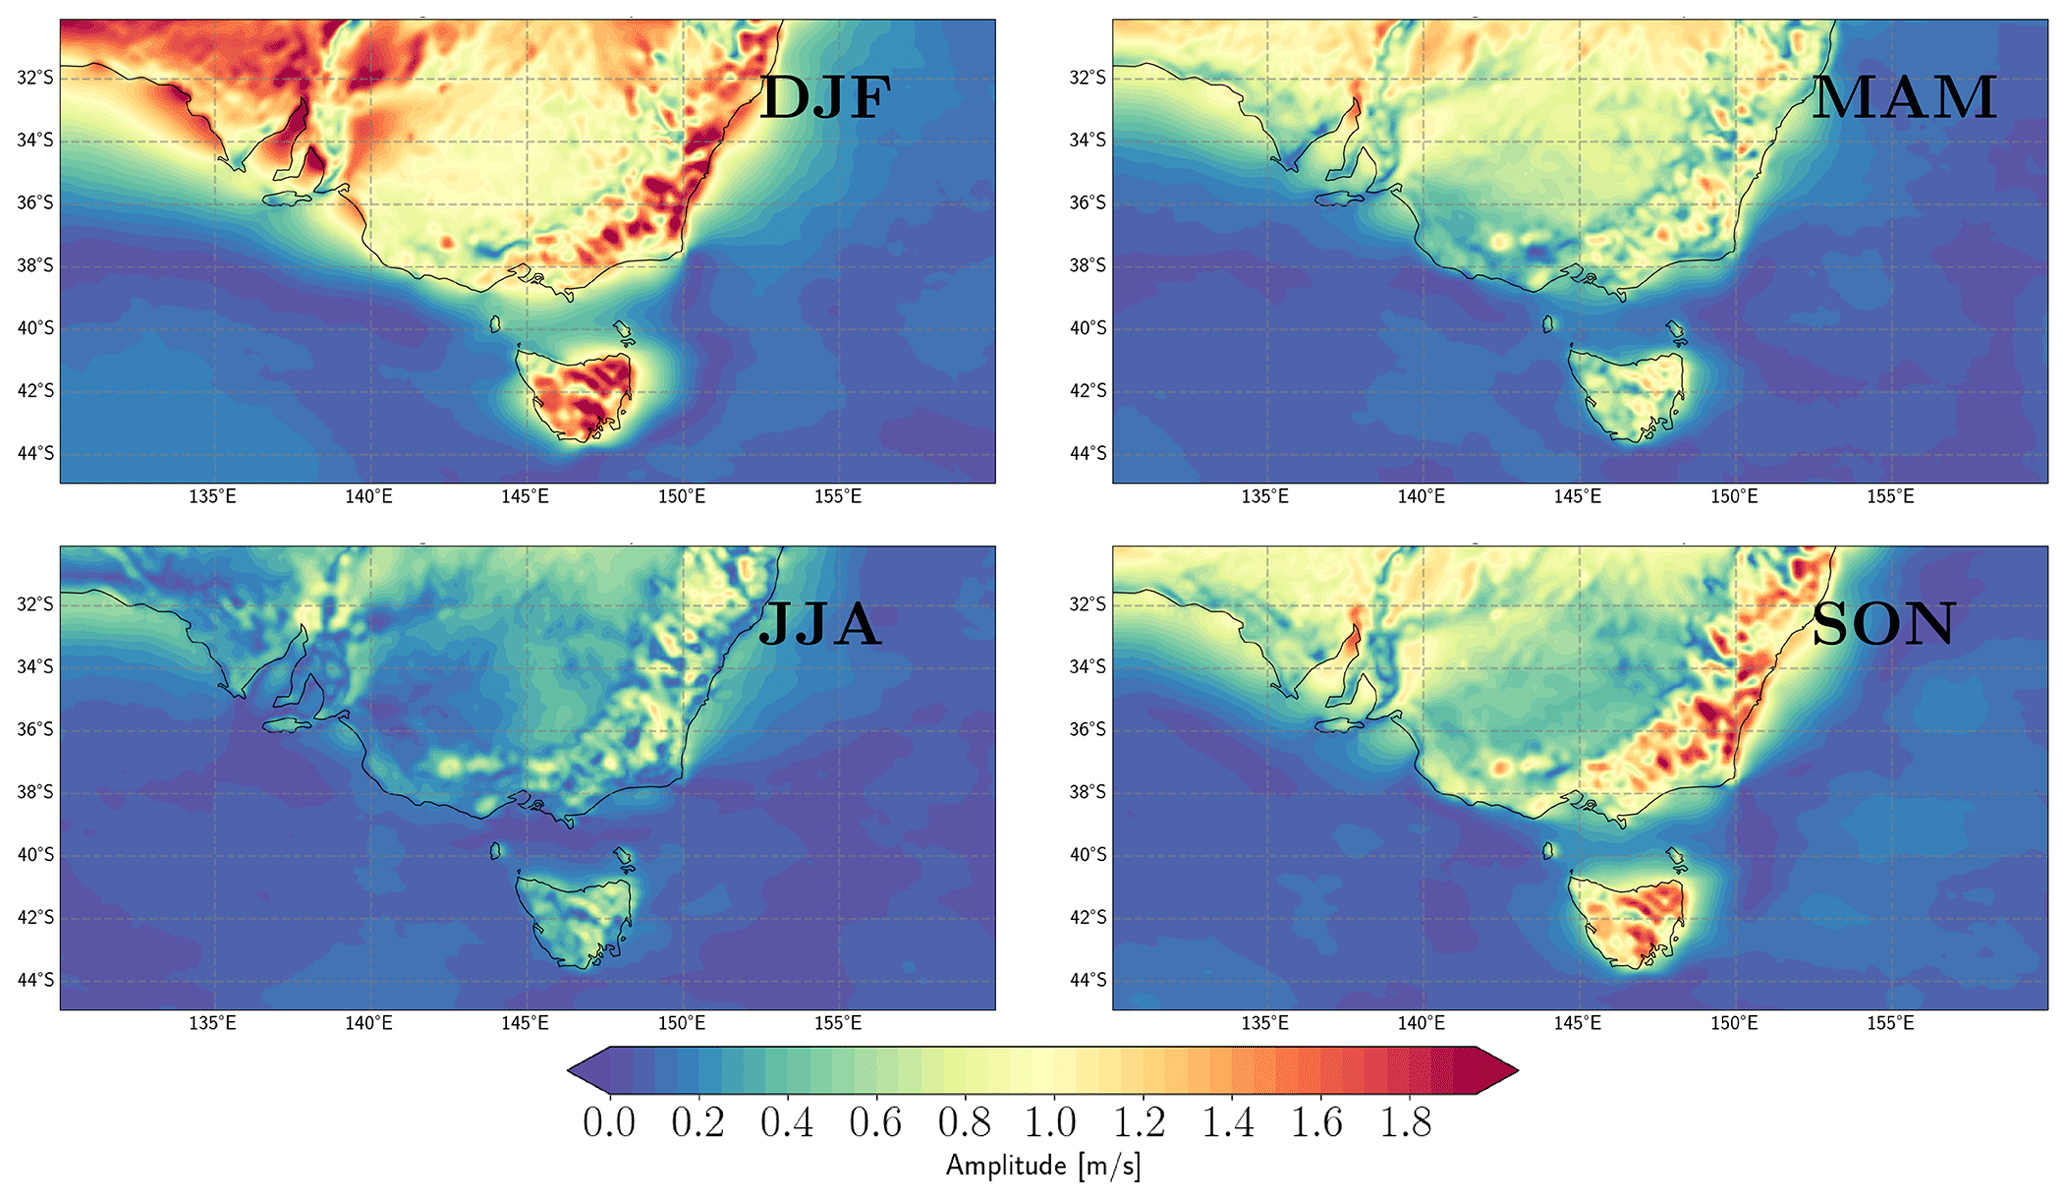
Figure 5Diurnal amplitude of wind speed, calculated from the harmonic fit to the average diurnal cycle at each grid point, presented as the average value for each season (DJF, MAM, JJA and SON).
The results show much larger diurnal amplitude over land than the ocean in general. Over land, the amplitude tends to be largest during summer (DJF) and smallest during winter (JJA). This is also the case in some near-coastal ocean areas. Some land regions have larger diurnal variability than other regions, such as along the east and southeast of the continent (corresponding to the Great Dividing Range and eastern seaboard), on the island of Tasmania to the south of the continent, and in some northern and western locations. Relatively weak diurnal variability occurs in some inland regions shown here, as well as for ocean regions in general.
Figure 6 shows when the peak of the diurnal cycle in wind speed tends to occur during the day, presented as the average value for each season. This phase information uses the same harmonic fit to the wind data as is used for the amplitude of the diurnal variability (from Fig. 5). Results are presented in local solar time (LST) for a given longitude, rather than other options such as Universal Time, to allow a more consistent interpretation over this region.
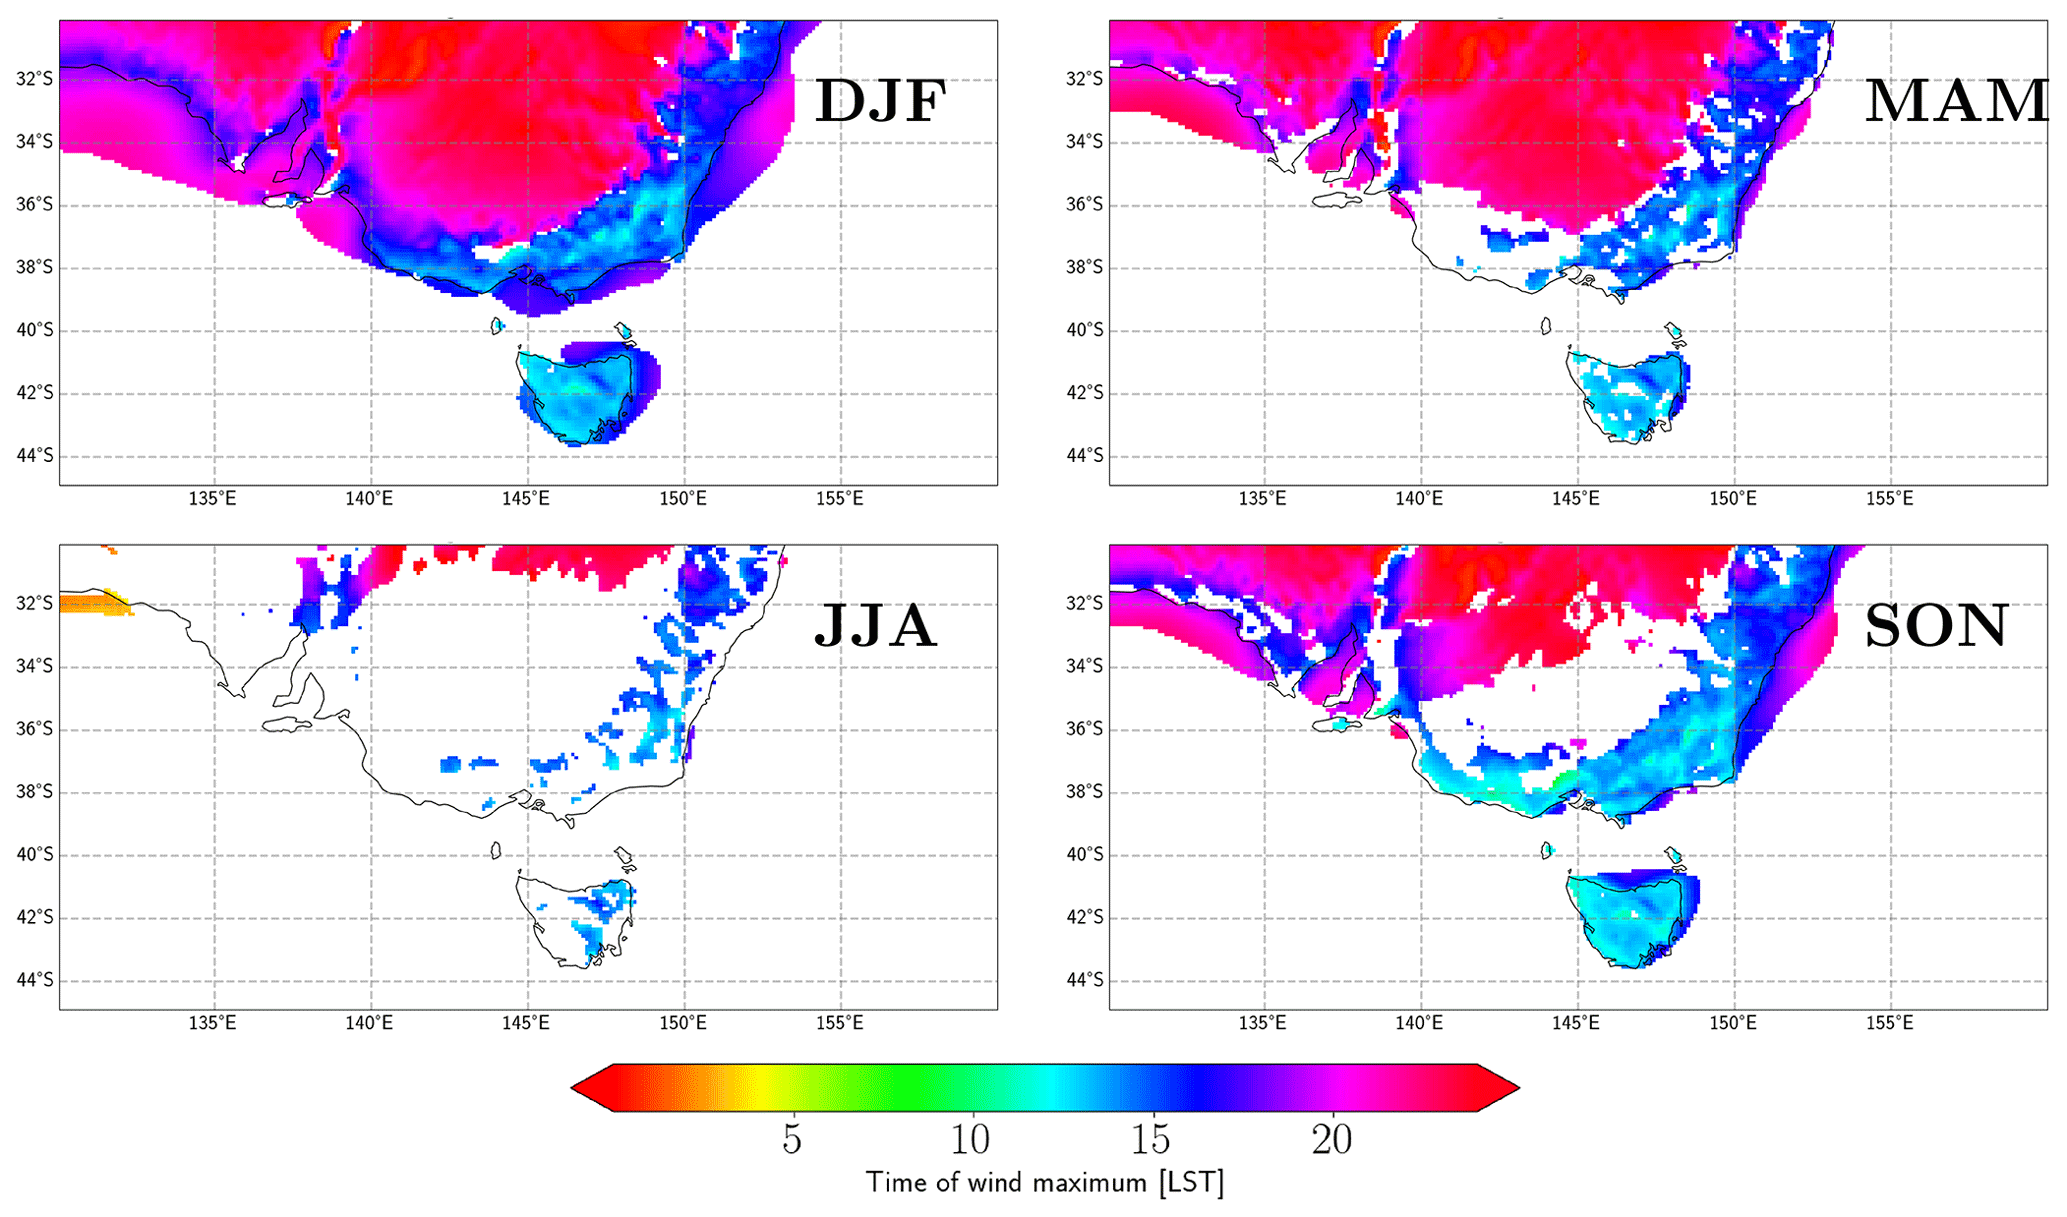
Figure 6Timing of the diurnal maximum in wind speed in local solar time (LST). This is presented as seasonal average values for DJF, MAM, JJA and SON. White regions represent locations where the amplitude of the diurnal variability is less than 0.5 m s−1 on average for a given season (based on the amplitude values from Fig. 5).
The phase information for the diurnal cycle shows that peak wind speeds tend to occur in the afternoon and evening, rather than after midnight and in the morning. The afternoon and evening periods for peak wind speeds shown here are similar to peak periods for energy demand, such as on hot summer days with air conditioner use being particularly prevalent in afternoon and evening periods. This timing is also distinct from the midday peak in solar energy availability. This includes early afternoon (e.g. from about noon to 18:00 LST) along the east and southeast of the continent (i.e. the Great Dividing Range and eastern seaboard region) and to the south for the island of Tasmania, as well as for some near-coastal regions in the western part of the study domain. Somewhat later timing for the peak winds occurs in regions further inland away from key orographic features such as coastal zones and the Great Dividing Range along the east coast of the continent, with peak values occurring in the hours closer to midnight in general (e.g. from about 18:00 to 02:00 LST).
The influence of ENSO on the amplitude of the diurnal variation in wind speed is shown in Fig. 7. This is presented as seasonal average anomalies for each phase of ENSO based on the same harmonic fits to the reanalysis wind data as have been used for Figs. 5 and 6. The anomalies are only shown for locations where the average diurnal wind amplitude is >0.5 m s−1. It is acknowledged that there is a broad range of other potential metrics that could be selected to analyse variability in wind speed for different ENSO phases, such as standard deviation. Here, we focus specifically on the 24 h timescale due to its relevance to energy demand and solar energy availability, both of which are strongly forced on a diurnal scale. Additionally, the full shape of the diurnal cycle for three key regions is also presented in Fig. 8, allowing both the magnitude and the shape of the variability to be examined individually for different ENSO phases, complementary to the results presented here in Fig. 7 regarding the variability of wind speed for different ENSO phases.
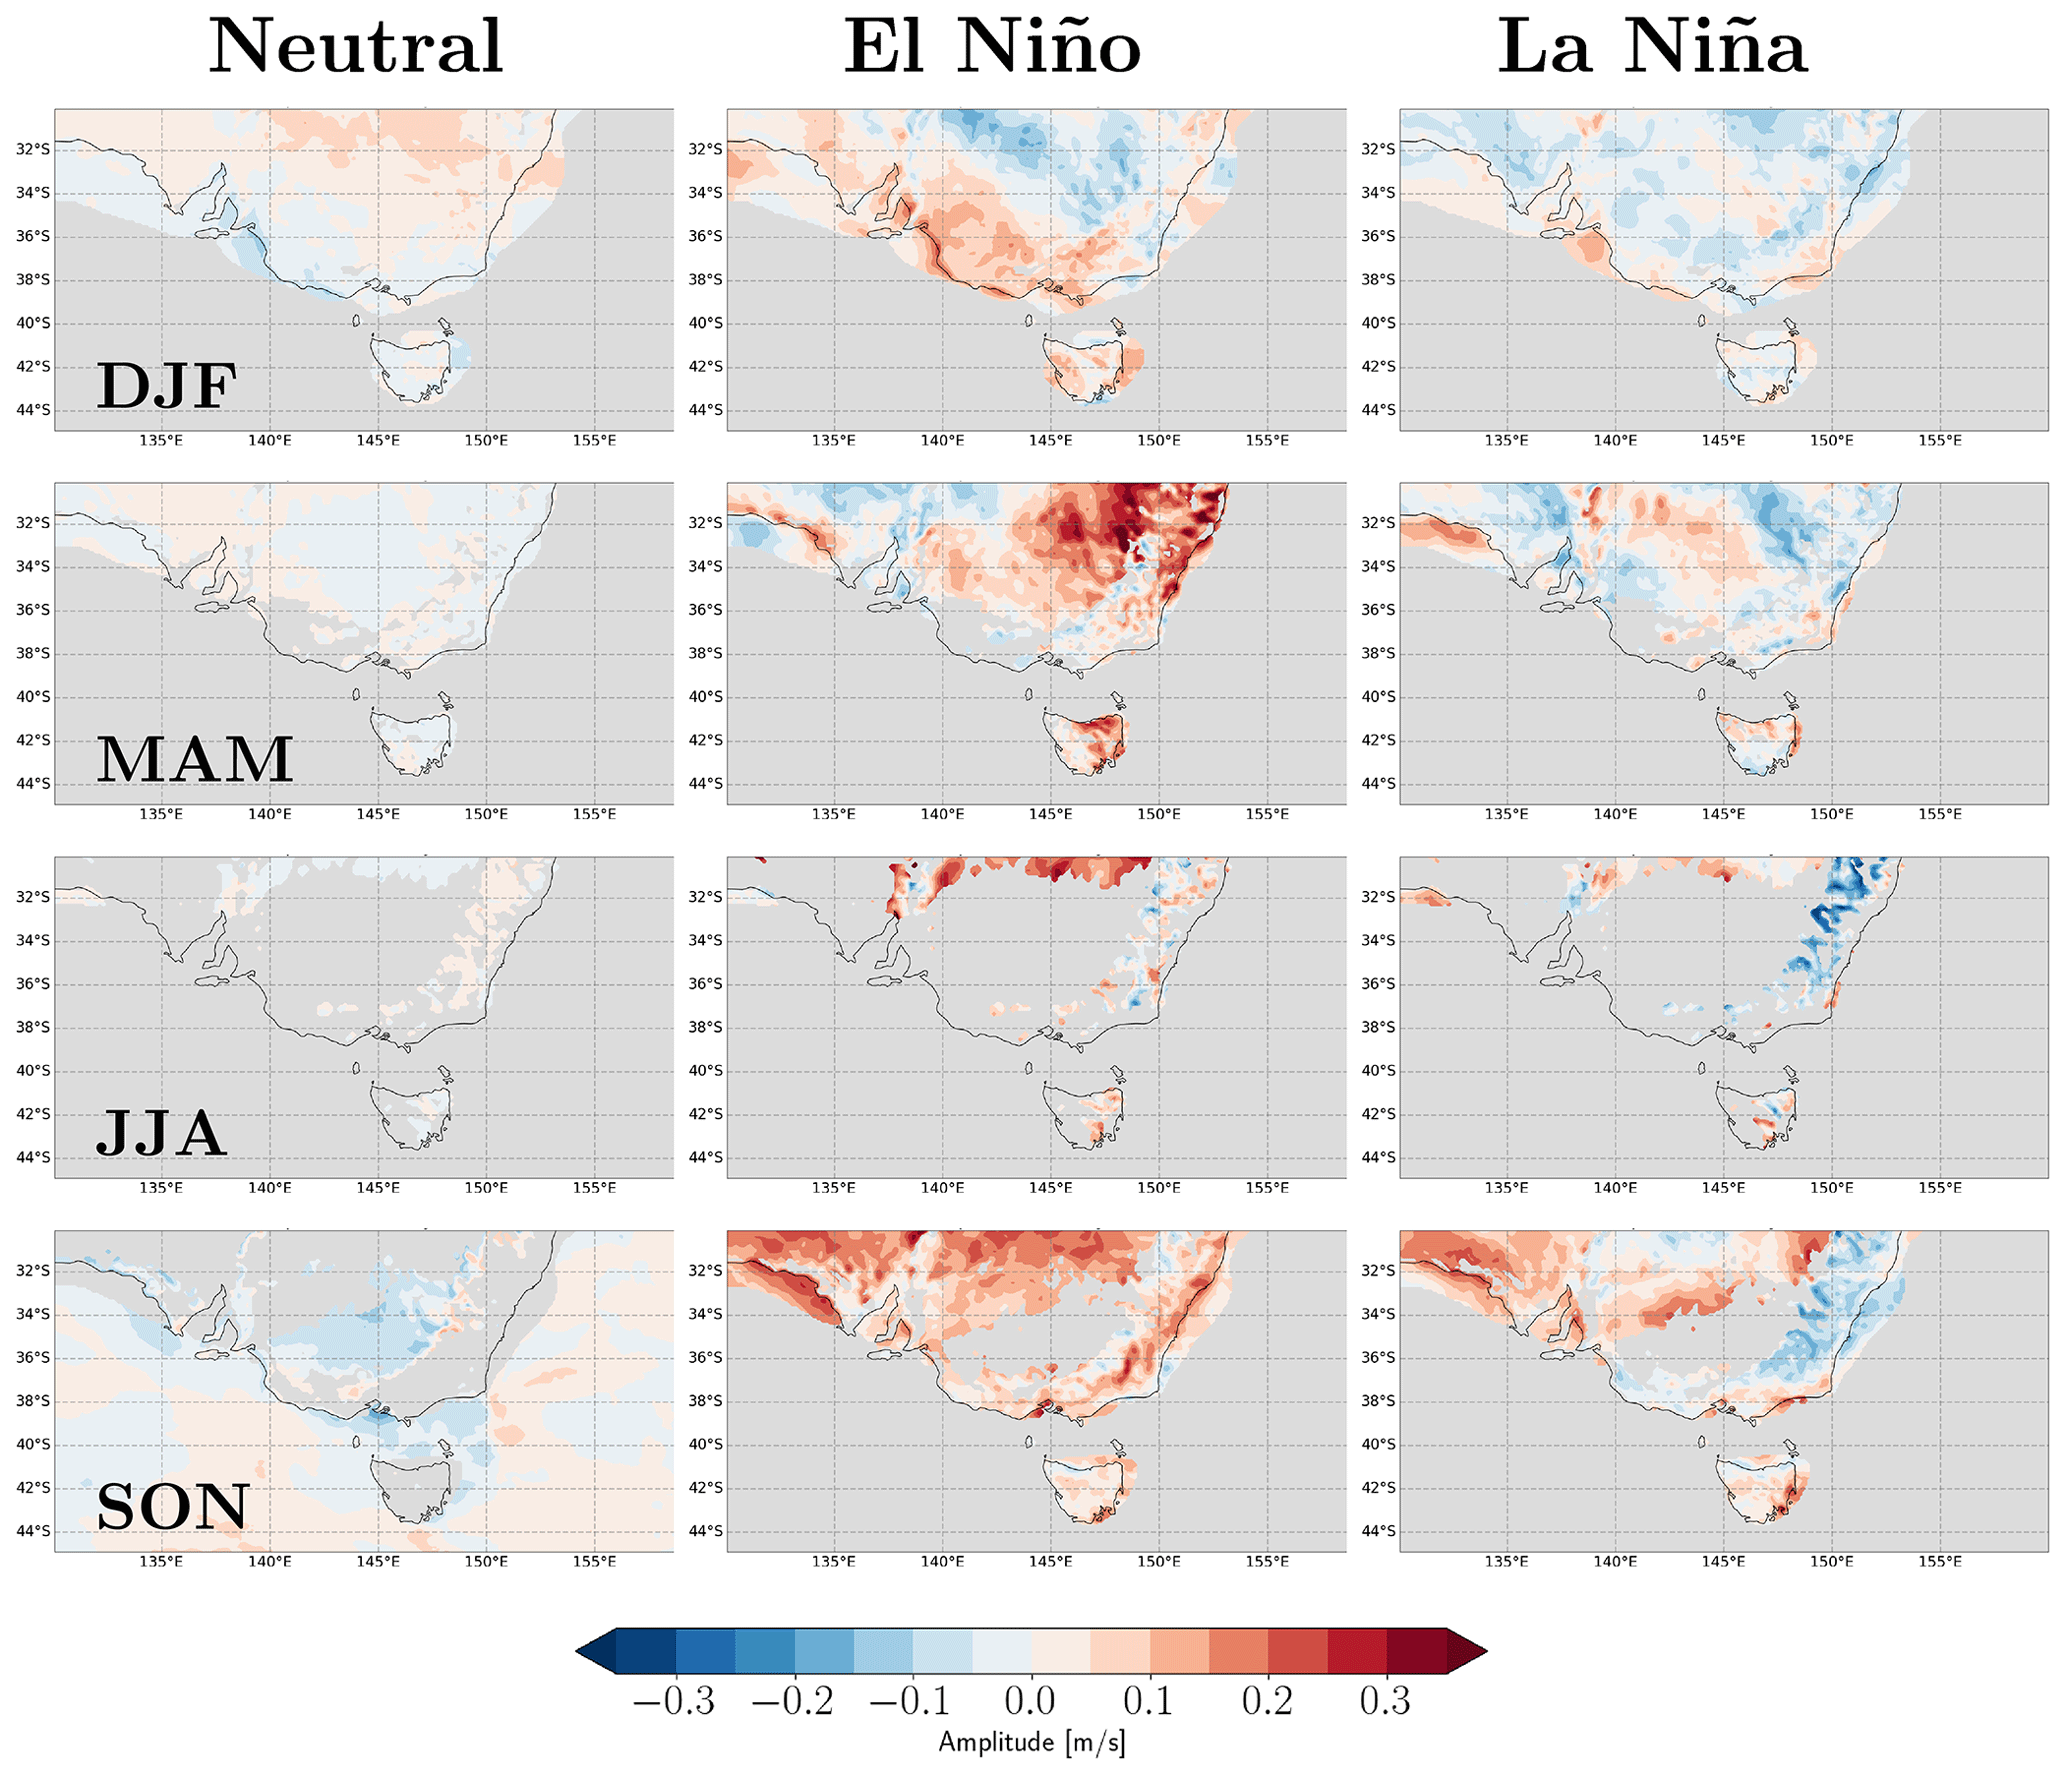
Figure 7Anomalies of the diurnal wind amplitude, relative to all days, presented for El Niño (centre panels) and La Niña (right panels). The values shown are seasonal averages for DJF (upper row), MAM (second row), JJA (third row) and SON (lower row). Grey shading indicates areas where the average diurnal amplitude is less than 0.5 m s−1.
In many regions, there is an enhanced amplitude of the diurnal cycle in El Niño relative to La Niña. This is especially evident in MAM and SON over inland and coastal New South Wales. For DJF, the diurnal cycle is somewhat larger for El Niño and smaller for La Niña along the west and south of the continent, indicating opposing influences for those two ENSO phases. The largest anomalies for DJF occur for El Niño in some locations near the southern coast of land areas of the study domain. For JJA, the anomalies for El Niño and La Niña are similar in sign to each other in some regions, while noting a relatively small sample size for these cases (from Table 1), such as negative anomalies in some near-coastal regions and positive anomalies in some regions further inland in the continent. However, there is also some indication of La Niña having more negative anomalies than El Niño along the east and southeast of the land areas of the study domain for JJA. Negative anomalies for La Niña in that region also occur during SON, with positive anomalies for El Niño. These differences in the diurnal cycle could reflect different radiative forcing at the surface under different ENSO phases.
To help interpret some of the key features of the ENSO influence on diurnal wind speed (from Fig. 7), three individual regions are examined further here based on area-averaged wind speed for each hour of the day. This is presented in Fig. 8, showing the average values for El Niño and La Niña conditions, and for each season, based on the monthly samples for each ENSO phase used previously as described in Table 1. This analysis has a focus on summer (DJF) as this is when the largest diurnal variations occur (from Fig. 4), noting that summer is a key time of year for peak energy demand in Australia for air-conditioning and natural hazards such as wildfires and severe wind gusts that can impact supply (e.g. Dowdy et al., 2021). Although selection of individual regions such as these is somewhat arbitrary, they were each selected here as contrasting examples based on having distinct diurnal cycle regimes, as indicated in Figs. 5 and 6, with this analysis intended for indicative purposes to help provide some further insight into ENSO influences and diurnal wind variability. These regions also represent different orographic characteristics, such as a near-coastal land region (Box 1), a region further inland (Box 2) and a near-coastal maritime region (Box 3). See Fig. 9 for a definition of the three boxes.
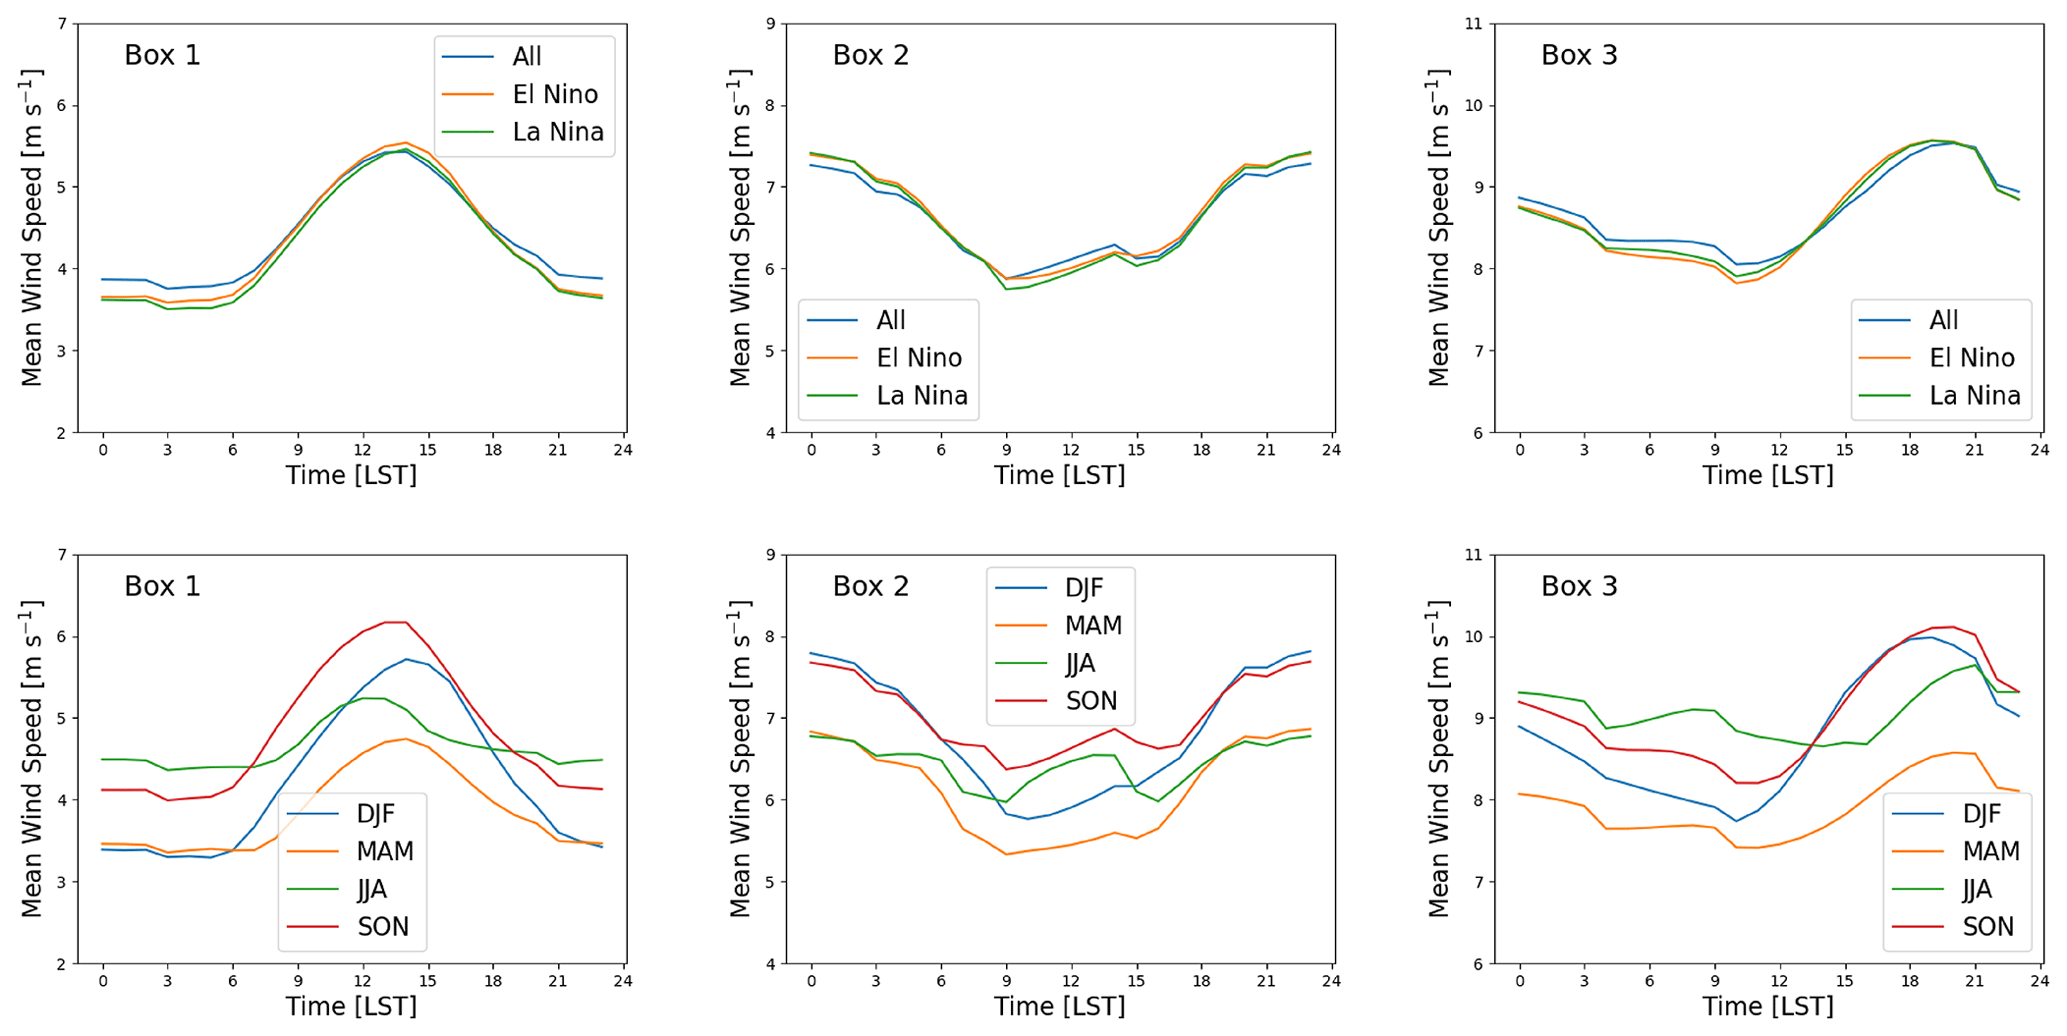
Figure 8Hourly wind speed values throughout the day, presented for area-averaged values in three regions (as shown in Fig. 9). The upper panels show the diurnal cycle for summer conditionally averaged by ENSO phase, and the lower panels show the diurnal cycle conditionally averaged by season.
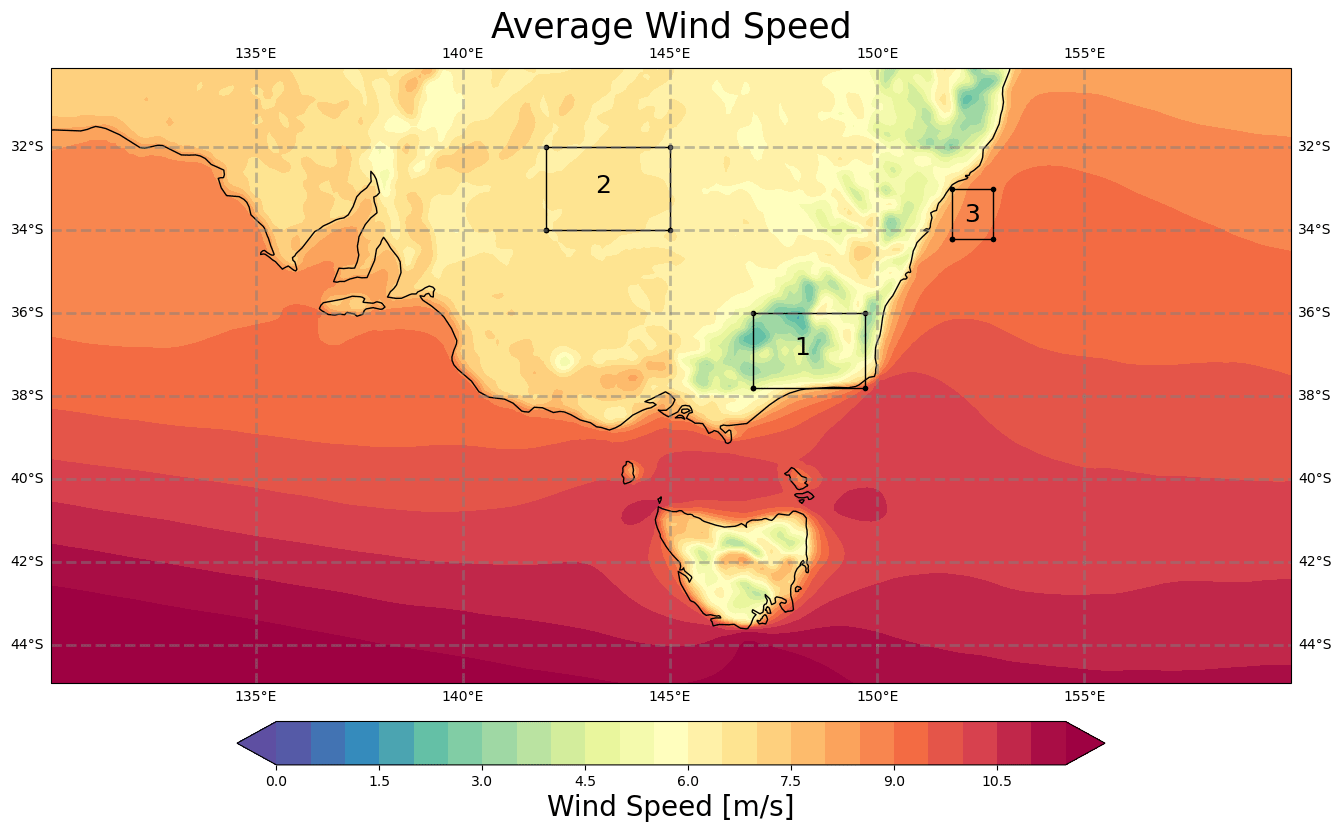
Figure 9Map showing the three regions of focus considered in Fig. 8 and mean wind speeds for the broader regional context.
The diurnal variability for Box 1 in southeastern (SE) Australia shows a peak around the middle of the day, shortly after noon (LST). There is relatively little variation between ENSO phases, apart from La Niña having somewhat weaker winds than the other ENSO phases. In contrast to Box 1, the winds in Box 2 for the inland Australia region peak closer to midnight. There is relatively little variation between ENSO phases, apart from La Niña having a somewhat larger diurnal range than the other ENSO phases due to the daytime minimum being weaker for La Niña compared to the other ENSO phases. For Box 3, the winds tend to peak in the late afternoon, where El Niño has relatively weak winds throughout the day, while La Niña has a smaller amplitude in diurnal variability than El Niño. The seasonal variability is much larger than the inter-annual variability, with the largest diurnal cycle being found in DJF in all three boxes, reflecting the stronger solar forcing at this time of year that influences diurnal processes such as sea breezes, katabatic winds and nocturnal low-level jets. For example, Rife et al. (2010) showed more low-level jet formation over Australia in DJF than JJA. Notably, in the inland box the average DJF wind speed shows a lower minimum and a higher maximum than the JJA wind speed.
3.4 Composite synoptic patterns
Figure 10 presents composite fields of mean sea level pressure (MSLP) from the reanalysis data, shown individually for each season and ENSO phase to help provide some insight into physical processes associated with the ENSO–wind relationships. Similar to previous studies (Cai et al., 2011), this shows a clear variation throughout the year in the subtropical ridge, comprising the latitude band with relatively high pressure, with low-pressure systems typically on the poleward side in the extratropical cyclone storm track. This band of relatively high pressure is shown in Fig. 10 to move further poleward (i.e. to the south in the Southern Hemisphere) during summer (DJF) as compared to winter (JJA) in general. For El Niño, the subtropical ridge during summer is shown to be somewhat stronger and further north compared to the case for La Niña. This could plausibly be one contributing factor for somewhat weaker winds for El Niño than La Niña in this region near southern Australia, similar to what was seen in Figs. 1 and 2. Additionally, in DJF the pressure gradient in the far southwest of the region is stronger in general for El Niño than La Niña, noting this is also broadly consistent with the wind anomalies from Fig. 1.
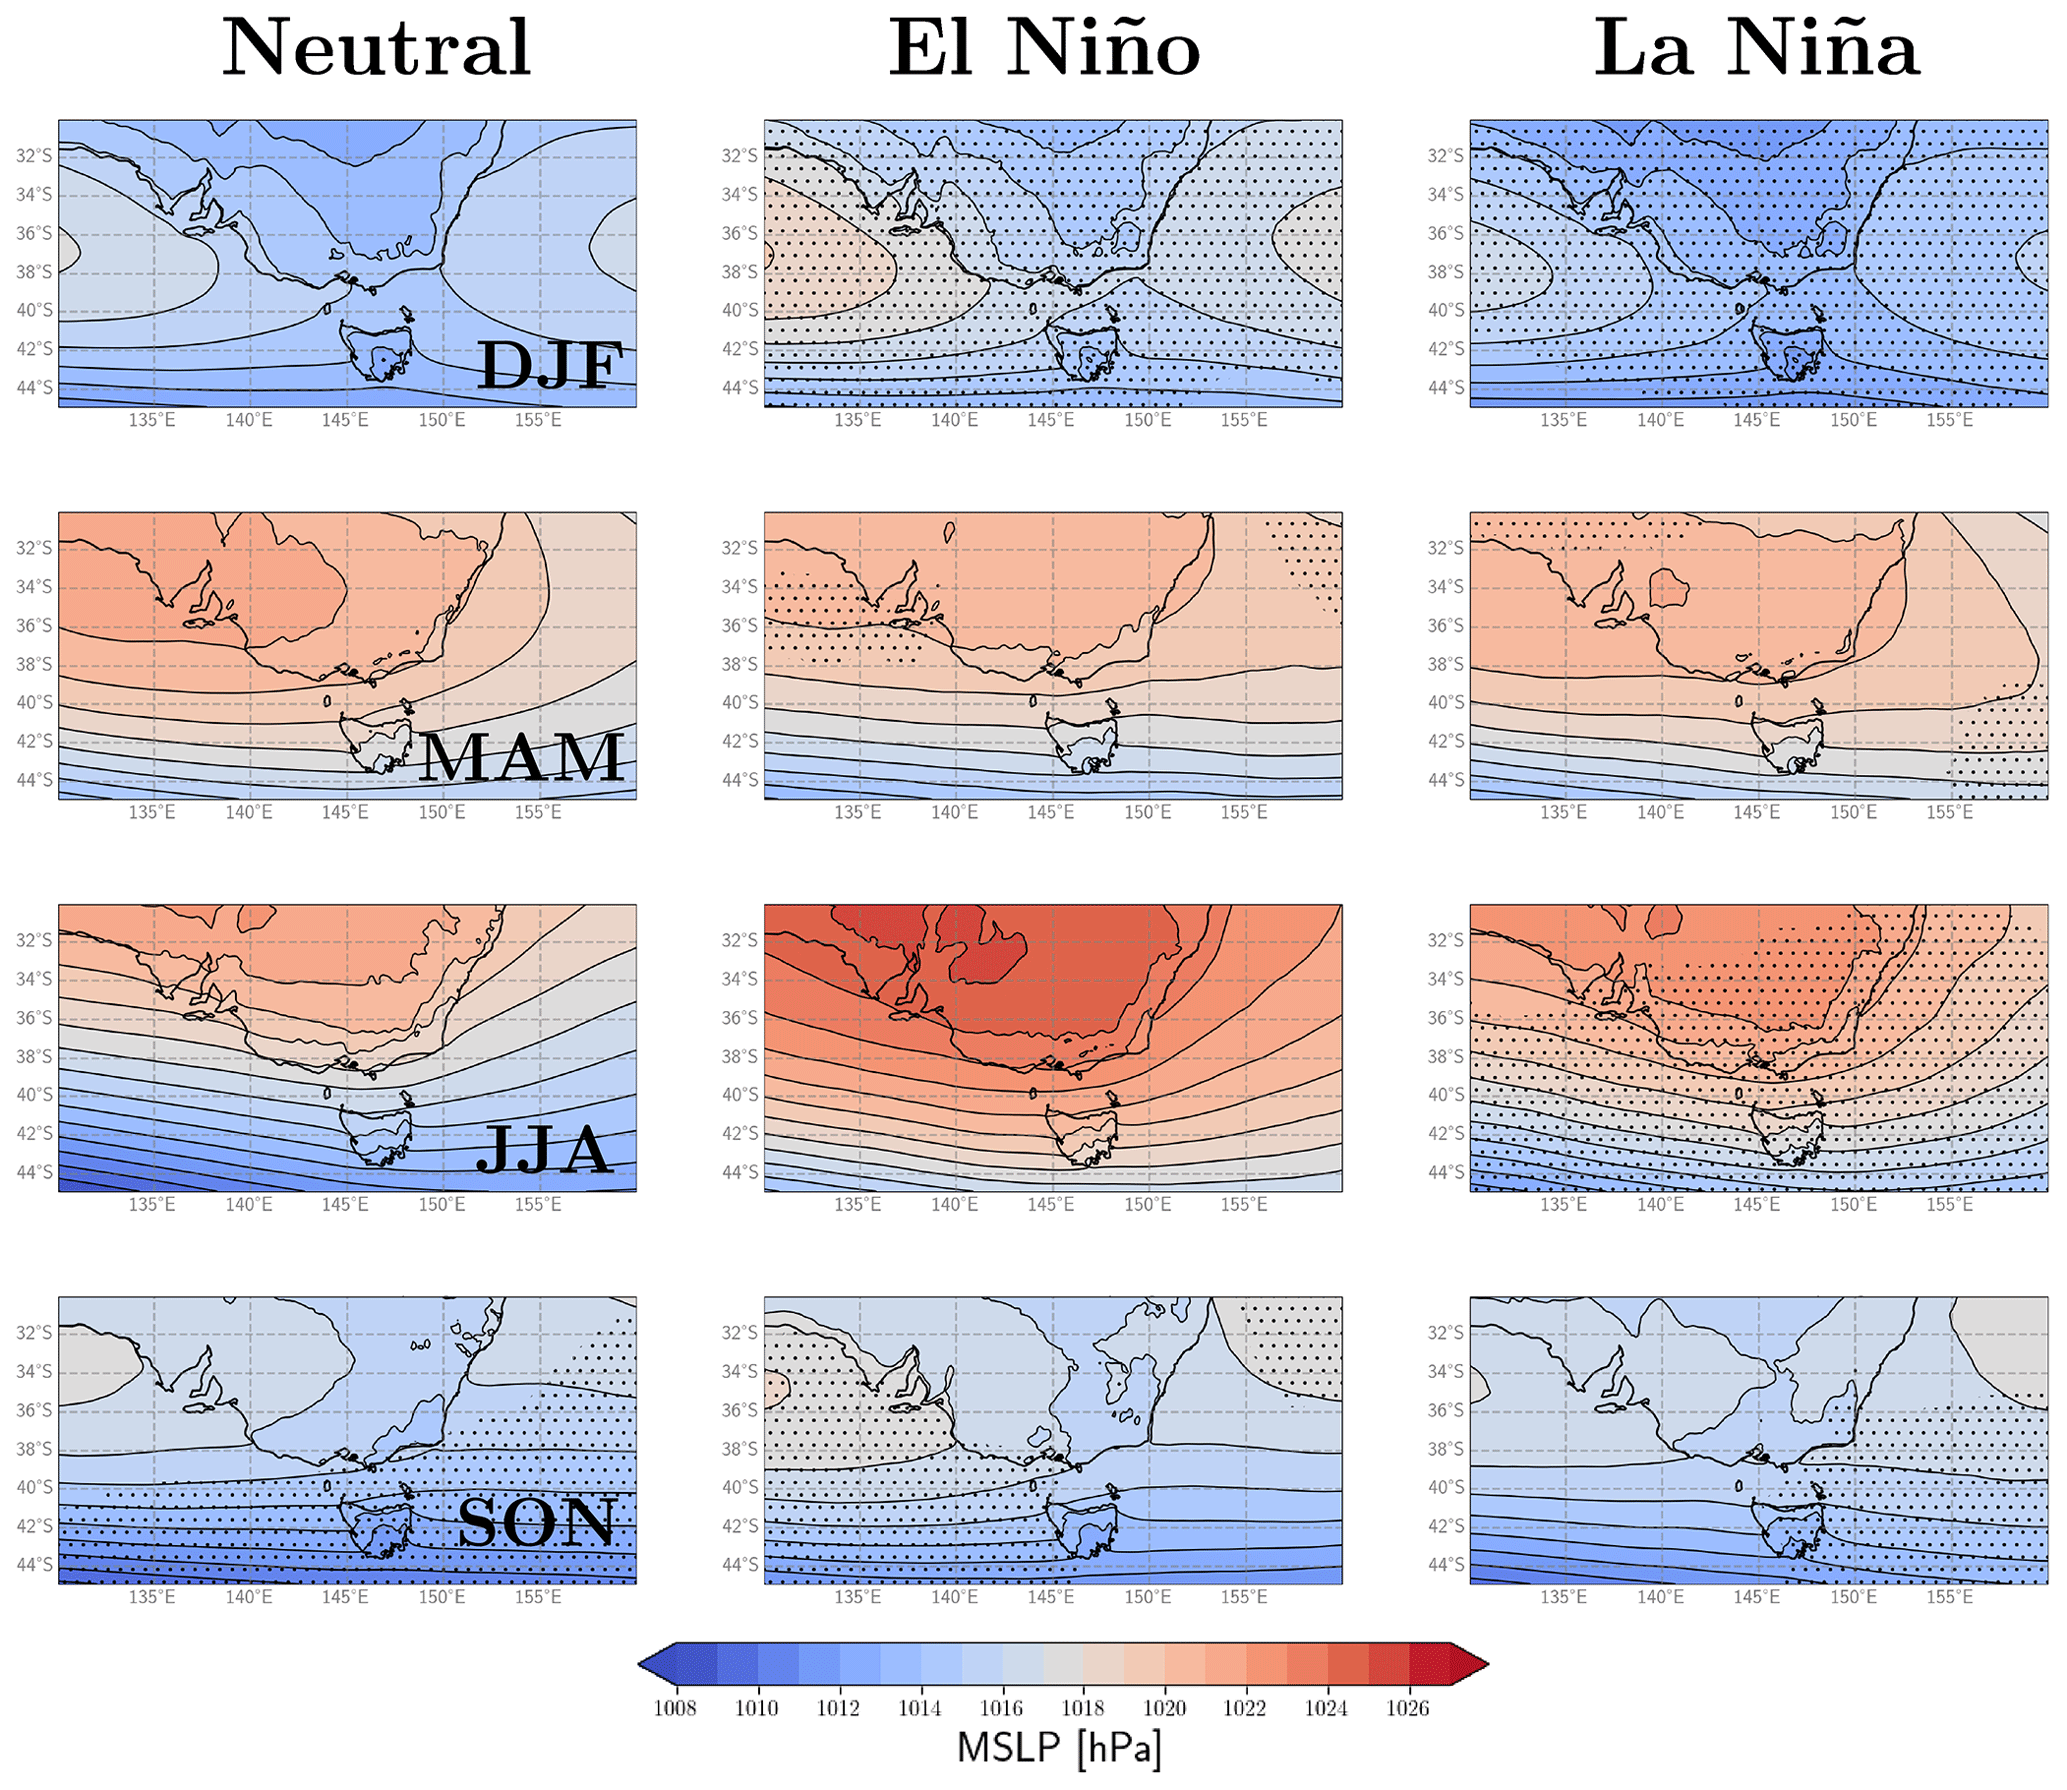
Figure 10Composite fields of mean sea level pressure (MSLP) shown individually for neutral (left column), El Niño (middle column) and La Niña (right column) during the austral summer (DJF: upper row), autumn (MAM: second row), winter (JJA: third row) and spring (SON: lower row). Stippling is included to highlight regions that are significantly different to what could be expected on average based on random chance alone using a statistical confidence level of 95 % (two-tailed). Sample sizes for each case are as shown previously in Table 1.
The differences in pressure composites for different ENSO phases during MAM are not as notable as the case for DJF. This suggests that relatively little wind variation might be expected to occur due to these relatively similar synoptic-scale conditions between ENSO phases.
For winter (JJA), there is a stronger high-pressure region within the inland of the Australian continent for El Niño as compared to other ENSO phases, noting this is not indicated as having high statistical confidence (i.e. not stippled in Fig. 10). This could plausibly be associated with more subsidence leading to relatively clear skies (i.e. less cloudy conditions due to descending air), thereby causing a large diurnal range for temperatures and winds associated with this. Additionally, the strong high-pressure system over the continent also might contribute to stronger pressure gradients and associated wind speed to the south.
Spring tends to have relatively strong pressure gradients and a relatively zonal flow, as compared to the other seasons. This is particularly the case during neutral conditions in the southern parts of the study region. There is some indication of higher pressure for El Niño than La Niña around the southern parts of the continent in spring, as well as relatively low pressure in the southeast for La Niña, with these features being broadly similar to results presented in Gillet et al. (2023).
There are several other regional features apparent from Fig. 10, including notable details in geostrophic wind variations indicated from these pressure composites. For example, in the region between the continent and the island of Tasmania to the south (known as Bass Strait), the winds are predominantly westerly but can vary with a somewhat northerly or southerly component depending on the ENSO phase and season. This poses questions around potential for orographic funnelling through this strait and how that might vary in combination with ENSO influences.
The variability of wind speeds was examined here using a regional reanalysis data set designed for the Australian region. The study focus was on southeastern Australia, including noting this as a key area of interest for wind energy generation. ENSO was found to have a range of influences on winds in this region around southeastern Australia. This includes influences on different regions and seasons based on mean winds and extreme winds, with analysis presented for very weak winds and very strong winds. ENSO was also found to influence the magnitude of the diurnal cycle of wind speed, with no substantial influence apparent on the phase of the diurnal cycle. The findings showed that ENSO can influence a range of the wind speed distribution in a similar way in some cases. For example, during summer in the west of the study region (and around 39° S in general), winds tend to be weaker for El Niño and stronger for La Niña, including for mean winds and for the occurrence frequency of very weak winds. MSLP anomalies indicated a stronger subtropical ridge for El Niño than La Niña around southern Australia during summer, which could act as a contributing factor in these wind anomalies. For winter, weaker winds tend to be associated with El Niño in the west and north, with La Niña having stronger winds in the northeast and weaker winds in the south (e.g. around 44° S), while both El Niño and La Niña show relatively weak winds along the Great Dividing Range. Weak winds occur more frequently in parts of the west and northeast in spring during El Niño, similar to the regions where the mean winds were weaker. Weak winds occur more frequently through much of the southwestern part of the study region and over the Australian continent in spring during La Niña, which is broadly similar to regions where the mean winds were relatively weak for La Niña during the same period.
The study highlights a range of influences on wind variability in relation to mean winds and the diurnal cycle, from large-scale phenomena such as ENSO to smaller-scale aspects such as regional orographic features. While some of the study results show a general zonal consistency, such as in the sign of the summer wind anomalies around 39° S for El Niño and around 44° S for La Niña (from Fig. 1), there are also clear spatial variations at any given latitude including around orography such as coastlines. Zonally symmetric variations in this region can sometimes be related to the Southern Annular Mode (SAM), with a negative phase of SAM typically corresponding to a somewhat more equatorward extent of features such as the Southern Hemisphere extratropical storm track region and the subtropical ridge as compared to the positive phase of SAM. As noted in the introduction section, SAM variability can be related to ENSO variability, including with SAM tending to be in a negative phase for El Niño and in a positive phase for La Niña in the austral summer (e.g. Dowdy, 2016). The MSLP composite results presented in Fig. 10 showed a somewhat more equatorward latitude for features (e.g. the subtropical ridge position) for El Niño than La Niña. That direction of change (i.e. an equatorward shift in position) is similar to what might be expected given the tendency for negative SAM during El Niño conditions as noted above. This suggests a potential influence of ENSO on SAM as one contributing factor to pressure fields and resultant wind variations in this region. While acknowledging the limitations of the reanalysis data used here, particularly in relation to simulation of severe convective storms and associated extreme winds and boundary layer processes, the results for extreme winds shown in Fig. 3 provide some indication that ENSO could plausibly be influencing extreme winds associated with the extratropical storm track in this region south of the Australian continent (e.g. Simmonds and Keay, 2000).
For the diurnal cycle of wind speed, the results showed larger diurnal amplitude over land than the ocean in general, with larger amplitudes over land and in some near-coastal regions during summer than winter. Some land regions were found to have larger diurnal variability than other regions, such as along the east and southeast of the continent (corresponding to the Great Dividing Range and eastern seaboard), on the island of Tasmania to the south of the continent, and in some northern and western locations.
Peak wind speeds were examined for locations where the amplitude exceeds 0.5 m s−1. The peak wind speeds tend to occur in the afternoon and evening, rather than after midnight and in the morning, with some spatial variation in this pattern. For example, the peak winds occurred in the early afternoon (e.g. from about 12:00 to 18:00 LST) along the east and southeast of the continent (i.e. the Great Dividing Range and eastern seaboard region), to the south for the island of Tasmania, and for some near-coastal regions. However, the peak winds occurred somewhat later, closer to midnight, in regions further inland away from key orographic features.
These results provide some indication that solar radiation is having a substantial influence on the magnitude and timing of the diurnal cycle of wind speed. This includes noting the larger magnitude of the diurnal cycle for summer relative to winter and for land regions relative to ocean regions. The timing of maxima for the diurnal cycle in the afternoon and evening (rather than morning) is also similar to expectations given the buildup of sensible heating of air above land during the afternoon following solar radiation through the day. The contrasting phases of the diurnal variability in different regions indicates the contribution of distinct mesoscale processes, which may include the land–sea breeze circulation, anabatic and katabatic flows, and nocturnal low-level jets.
ENSO was found to have some relationship to the diurnal variability of winds in this region. The anomalies for El Niño and La Niña were mapped for individual seasons to detail the spatiotemporal features in how ENSO relates to the diurnal cycle of wind speeds throughout this study region. In many coastal and inland regions in the eastern part of the domain, larger diurnal cycles were found in spring and autumn in El Niño conditions relative to La Niña.
The results presented here are intended to contribute towards a more detailed understanding of how ENSO relates to wind variability at different times through the year, including considering different parts of the wind speed distribution and aspects such as the amplitude and phase of the diurnal cycle. Given the relative lack of previous studies that have focused on these aspects, the seasonal maps and analysis presented here could also be useful as part of guidance for wind energy planning. There is also considerable scope for future work that could build on these findings, such as around more detailed understanding of physical processes and teleconnections associated with ENSO–wind relationships. Finer-scale reanalysis data could also potentially be considered for future studies, noting some plans that are underway for convection-permitting reanalysis of the Australian region in coming years (Su et al., 2023) and for more detailed analysis of extreme wind speeds from storms and other localised and fine-scale processes that could link wind variability with ENSO.
Analysis was performed using the Bureau of Meteorology Atmospheric high-resolution Regional Reanalysis for Australia (BARRA) (https://doi.org/10.25941/5d47da36a409d, Australian Bureau of Meteorology, 2019). The data are available in Australia from the Australian National Computing Infrastructure. Readers are referred to Su et al. (2019) for information.
CLV (50 %) conceptualised the work, performed the data analysis, made the figures and contributed to editing the manuscript. AJD (50 %) wrote the text for the manuscript, contributed to the interpretation of results and refined the design of the analysis.
The contact author has declared that none of the authors has any competing interests.
Publisher's note: Copernicus Publications remains neutral with regard to jurisdictional claims made in the text, published maps, institutional affiliations, or any other geographical representation in this paper. While Copernicus Publications makes every effort to include appropriate place names, the final responsibility lies with the authors.
Analysis was conducted on the Australian National Computing Infrastructure (NCI). The authors would like to thank Holger Wolff of the CLEX computational modelling support team for assistance with the data processing and the two anonymous reviewers for their insightful and helpful comments.
This research has been supported by the Australian Research Council Centre of Excellence for Climate Extremes (CLEX CE170100023) and the Zero Emissions Energy Laboratory of the Melbourne Energy Institute (MEI) at the University of Melbourne.
This paper was edited by Geraint Vaughan and reviewed by two anonymous referees.
Anderson, B. T., Perez, R. C., and Karspeck, A.: Triggering of El Niño onset through trade wind–induced charging of the equatorial Pacific, Geophys. Res. Lett., 40, 1212–1216, 2013.
Australian Bureau of Meteorology: Atmospheric high-resolution Regional Reanalysis for Australia (BARRA), [data set], https://doi.org/10.25941/5d47da36a409d, 2019.
Birch, C. E., Webster, S., Peatman, S. C., Parker, D. J., Matthews, A. J., Li, Y., and Hassim, M. E. E.: Scale interactions between the MJO and the western Maritime Continent, J. Climate, 29, 2471–2492, 2016.
Bjerknes, J. P.: Atmospheric teleconnections from the equatorial Pacific, Mon. Weather Rev., 97, 163–172, 1969.
Blanco, M. I.: The economics of wind energy, Renew. Sust. Energ. Rev., 13, 1372–1382, 2009.
Bradley, R. S., Diaz, H. F., Kiladis, G. N., and Eischeid, J. K.: ENSO signal in continental temperature and precipitation records, Nature, 327, 497–501, 1987.
Brown, A., Dowdy, A., Lane, T. P., and Hitchcock, S.: Types of Severe Convective Wind Events in Eastern Australia, Mon. Weather Rev., 151, 419–448, 2023.
Cai, W., Van Rensch, P., and Cowan, T.: Influence of global-scale variability on the subtropical ridge over southeast Australia, J. Climate, 24, 6035–6053, 2011.
Catto, J. L. and Dowdy, A.: Understanding compound hazards from a weather system perspective, Weather and Climate Extremes, 32, 100313, https://doi.org/10.1016/j.wace.2021.100313, 2021.
Chen, W., Feng, J., and Wu, R.: Roles of ENSO and PDO in the link of the East Asian winter monsoon to the following summer monsoon, J. Climate, 26, 622–635, 2013.
Cowin, E., Wang, C., and Walsh, S. D. C.: Assessing Predictions of Australian Offshore Wind Energy Resources from Reanalysis Datasets, Energies, 16, https://doi.org/10.3390/en16083404, 2023.
Davey, M. K., Brookshaw, A., and Ineson, S.: The probability of the impact of ENSO on precipitation and near-surface temperature, Climate Risk Management, 1, 5–24, 2014.
Davis, N. N, Badger, J., Hahmann, A. N., Hansen, B. O., Mortensen, N. G., Kelly, M., Larsén, X. G., Olsen, B. T., Floors, R., Lizcano, G., Casso, P. Lacave, O., Bosch, A., Bauwens, I., Knight, O. J., Potter van Loon, A., Fox, R., Parvanyan, T., Hansen, S. B. K., Heathfield, D., Onninen, M., and Drummond, R.: The Global Wind Atlas: A High-Resolution Dataset of Climatologies and Associated Web-Based Application, B. Am. Meteorol. Soc., 104, E1507–E1525, 2023.
Dee, D. P., Uppala, S. M., Simmons, A. J., Berrisford, P., Poli, P., Kobayashi, S., Andrae, U., Balmaseda, M. A., Balsamo, G., Bauer, D. P., and Bechtold, P.: The ERA-Interim reanalysis: Configuration and performance of the data assimilation system, Q. J. Roy. Meteor. Soc., 137, 553–597, 2011.
Dowdy, A. J.: Seasonal forecasting of lightning and thunderstorm activity in tropical and temperate regions of the world, Sci. Rep.-UK, 6, 20874, https://doi.org/10.1038/srep20874, 2016.
Dowdy, A. J.: Seamless climate change projections and seasonal predictions for bushfires in Australia, Journal of Southern Hemisphere Earth Systems Science, 70, 120–138, 2020.
Fraedrich, K.: An ENSO impact on Europe?, Tellus A, 46, 541–552, 1994.
Gong, D. and Wang, S.: Definition of Antarctic oscillation index, Geophys. Res. Lett., 26, 459–462, 1999.
Gunn, A., Dargaville, R., Jakob, C., and McGregor, S.: Spatial optimality and temporal variability in Australia's wind resource, Environ. Res. Lett., 18, https://doi.org/10.1088/1748-9326/ad0253, 2023.
Herbert, G. J., Iniyan, S., Sreevalsan, E., and Rajapandian, S.: A review of wind energy technologies, Renew. Sust. Energ. Rev., 11, 1117–1145, 2007.
Holton, J. R. and Dmowska, R.: El Niño, La Niña and the southern oscillation, vol 46, edited by: Philander, S. G., Academic Press, ISBN 978-0125532358, 1989.
Larsén, X. G., Davis, N., Hannesdóttir, Á., Kelly, M., Svenningsen, L., Slot, R., Imberger, M., Olsen, B. T., and Floors, R.: The Global Atlas for Siting Parameters project: Extreme wind, turbulence, and turbine classes, Wind Energy, 25, 1841–1859, 2022.
Li, Y., Li, X., Feng, J., Zhou, Y., Wenzhu, W., and Hou, Y.: Uncertainties of ENSO-related Regional Hadley Circulation Anomalies within Eight Reanalysis Datasets, Adv. Atmos. Sci. 41, 115–140, https://doi.org/10.1007/s00376-023-3047-0, 2024.
Lim, E. P., Hendon, H. H., and Rashid, H.: Seasonal predictability of the southern annular mode due to its association with ENSO, J. Climate, 26, 8037–8054, 2013.
Low, P. S.: Katabatic winds in the lower Tamar valley, Tasmania, Nuovo Cimento C, 13, 981–994, 1990.
Manins, P. C. and Sawford, B. L.: Katabatic winds: A field case study, Q. J. Roy. Meteor. Soc., 105, 1011–1025, 1979.
Manwell, J. F., McGowan, J. G., and Rogers, A. L.: Wind energy explained: theory, design and application, John Wiley & Sons, https://doi.org/10.1002/9781119994367, 2010.
Masouleh, Z. P., Walker, D. J., and Crowther, J. M.: A long-term study of sea-breeze characteristics: A case study of the coastal city of Adelaide, J. Appl. Meteorol. Clim., 58, 385–400, 2019.
Nguyen, H., Evans, A., Lucas, C., Smith, I., and Timbal, B.: The Hadley circulation in reanalyses: Climatology, variability, and change, J. Climate, 26, 3357–3376, 2013.
Oort, A. H. and Yienger, J. J.: Observed interannual variability in the Hadley circulation and its connection to ENSO, J. Climate, 9, 2751–2767, 1996.
Rauniyar, S. P. and Walsh, K. J. E.: Influence of ENSO on the diurnal cycle of rainfall over the Maritime Continent and Australia, J. Climate, 26, 1304–1321, 2013.
Richardson, D., Pitman, A. J., and Ridder, N. N.: Climate influence on compound solar and wind droughts in Australia, NPJ Climate and Atmospheric Science, 6, https://doi.org/10.1038/s41612-023-00507-y, 2023.
Rife, D. L., Pinto, J. O., Monaghan, A. J., Davis, C. A., and Hannan, J. R.: Global distribution and characteristics of diurnally varying low-level jets, J. Climate, 23, 5041–5064, 2010.
Ropelewski, C. F. and Halpert, M. S.: North American precipitation and temperature patterns associated with the El Niño/Southern Oscillation (ENSO), Mon. Weather Rev., 114, 2352–2362, 1986.
Sadorsky, P.: Wind energy for sustainable development: Driving factors and future outlook, J. Clean. Prod., 289, 125779, https://doi.org/10.1016/j.jclepro.2020.125779, 2021.
Saji, N. H. and Yamagata, T.: Structure of SST and surface wind variability during Indian Ocean dipole mode events: COADS observations, J. Climate, 16, 2735–2751, 2003.
Saji, N. H., Goswami, B. N., Vinayachandran, P. N., and Yamagata, T.: A dipole mode in the tropical Indian Ocean, Nature, 401, 360–363, 1999.
Simmonds, I. and Keay, K.: Mean Southern Hemisphere extratropical cyclone behavior in the 40 year NCEP–NCAR reanalysis, J. Climate, 13, 873–885, 2000.
Soderholm, J. S., McGowan, H., Richter, H., Walsh, K., Weckwerth, T. M., and Coleman, M.: An 18 year climatology of hailstorm trends and related drivers across southeast Queensland, Australia, Q. J. Roy. Meteor. Soc., 143, 1123–1135, 2017.
Su, C.-H., Eizenberg, N., Steinle, P., Jakob, D., Fox-Hughes, P., White, C. J., Rennie, S., Franklin, C., Dharssi, I., and Zhu, H.: BARRA v1.0: the Bureau of Meteorology Atmospheric high-resolution Regional Reanalysis for Australia, Geosci. Model Dev., 12, 2049–2068, https://doi.org/10.5194/gmd-12-2049-2019, 2019.
Su, C. H., Rennie, S., Torrance, J., Dharssi, I., Tian, S., Howard, E., Pepler, A., Stassen, C., and Steinle, P.: Preliminary assessment of regional moderate resolution atmospheric reanalysis for Australia, Bureau of Meteorology Research Report #84, Australian Bureau of Meteorology, Melbourne, Australia, ISBN 978-1-925738-72-8, 2023.
Taschetto, A. S., Ummenhofer, C. C., Stuecker, M. F., Dommenget, D., Ashok, K., Rodrigues, R. R., and Yeh, S. W.: In ENSO atmospheric teleconnections: El Niño southern oscillation in a changing climate, American Geophysical Union, 309–335, https://doi.org/10.1002/9781119548164.ch14, 2020.
Vincent, C. L. and Lane, T. P.: A 10 year austral summer climatology of observed and modeled intraseasonal, mesoscale, and diurnal variations over the maritime continent, J. Climate, 30, 3807–3828, 2017.