the Creative Commons Attribution 4.0 License.
the Creative Commons Attribution 4.0 License.
 | 12 Sep 2024
Observations of the vertical distributions of summertime atmospheric pollutants in Nam Co: OH production and source analysis
Chengzhi Xing
Jingkai Xue
Hongyu Wu
Xiangguang Ji
Jinping Ou
Qihou Hu
The Tibetan Plateau (TP) plays a key role in the regional environment and global climate change; however, the lack of vertical observations of atmospheric species, such as HONO and O3, hinders a deeper understanding of the atmospheric chemistry and atmospheric oxidation capacity (AOC) on the TP. In this study, we conducted multi-axis differential optical absorption spectroscopy (MAX-DOAS) measurements at Nam Co, the central TP, to observe the vertical profiles of aerosol, water vapor (H2O), NO2, HONO and O3 from May to July 2019. In addition to NO2 mainly exhibiting a Gaussian shape with the maximum value appearing at 300400 m, the other four species all showed an exponential shape and decreased with the increase in height. The maximum values of monthly averaged aerosol (0.17 km−1) and O3 (66.71 ppb) occurred in May, H2O (3.68 × 10¹⁷ molec. cm−3) and HONO (0.13 ppb) appeared in July, and NO2 (0.39 ppb) occurred in June at the 200–400 m layer. H2O, HONO and O3 all exhibited a multi-peak pattern, and aerosol appeared to have a bi-peak pattern for its averaged diurnal variations. The averaged vertical profiles of OH production rates from O3 and HONO all exhibited an exponential shape decreasing with the increase in height, with maximum values of 2.61 and 0.49 ppb h−1 at the bottom layer, respectively. The total OH production rate contributed by HONO and O3 on the TP was obviously larger than that in low-altitude areas. In addition, source analysis was conducted for HONO and O3 at different height layers. The heterogeneous reaction of NO2 on wet surfaces was a significant source of HONO. The maximum values of HONONO2 appeared when H2O concentrations were approximately 1.0 × 10¹⁷ molec. cm−3 and aerosol concentrations were larger than 0.15 km−1 below 1.0 km. The maximum values were usually accompanied by H2O concentrations of 1.0–2.0 × 10¹⁷ molec. cm−3 and aerosol concentrations greater than 0.02 km−1 at 1.0–2.0 km. O3 was potentially sourced from the South Asian subcontinent and Himalayas through long-range transport. Our results contribute to the new understanding of vertical distribution of atmospheric components and explain the strong AOC on the TP.
- Article
(7164 KB) - Full-text XML
-
Supplement
(2653 KB) - BibTeX
- EndNote


The Tibetan Plateau (TP) spans 2.5 million km2 with an average altitude of over 4000 m. Therefore, it is called the “Third Pole” of the Earth (Y. Ma et al., 2020; Kang et al., 2022). The TP is home to tens of thousands of glaciers and nourishes more than 10 of Asia's rivers; thus it also acts as the “water tower of Asia” (Qu et al., 2019; Ma et al., 2022). Due to its unique topography, the TP serves as a heat source for the atmosphere because of the strong solar radiation, which acts as a driving force that profoundly affects the regional atmospheric circulation, global weather conditions and climate change (Yanai et al., 1992; Boos and Kuang, 2010; Chen et al., 2015; J. Liu et al., 2022; Zhou et al., 2022). Monsoon rainfall in Asia, floods over the Yangtze River valley and the El Niño in the Pacific Ocean are strongly associated with the TP (Hsu et al., 2003; Li et al., 2016a; Lei et al., 2019). In addition, the cyclone circulations caused by the TP heat source can also inhibit the diffusion of atmospheric pollutants in the areas around the TP, such as the Sichuan Basin, causing regional pollution (Zhang et al., 2019). Therefore, observations of the atmospheric species on the TP are essential for enhancing the in-depth understanding of its atmospheric physicochemical processes.
However, deciphering the atmospheric environment of the TP is highly challenging and dangerous due to its complex topography and harsh environment (Barnett et al., 2005; Bolch et al., 2012; Cong et al., 2015; S. Kang et al., 2016). In order to unveil the features of atmospheric composition over the TP and their corresponding climate feedback, a large number of field observation stations have been established, and a series of field campaigns have been carried out recently, especially after the implementation of the Second Tibetan Plateau Scientific Expedition and Research program (Che and Zhao, 2021; Wang et al., 2021; Ran et al., 2022). The China National Environmental Monitoring Centre (CNEMC) has established an in situ monitoring network with more than 12 stations over the TP, namely Lhasa, Shigatse, Shannan, Nyingchi, Nagqu, Ngari, Qamdo, Diqing, Aba, Guoluo, Xining and Haixi, to continuously monitor the surface concentrations of six atmospheric components (i.e., PM10, PM2.5, NO2, SO2, O3 and CO) since 2013 (Gao et al., 2020; Li et al., 2020; Sun et al., 2021). The Institute of Tibetan Plateau Research, Chinese Academy of Sciences, has also established six long-term field observation stations to measure meteorological parameters and small amounts of atmospheric composition (i.e., black carbon, aerosol optical density (AOD)) (Y. Ma et al., 2020). In addition, scientists are relying on advancements in satellite remote sensing technology, such as the Tropospheric Monitoring Instrument (TROPOMI), the Ozone Monitoring Instrument (OMI), the Moderate Resolution Imaging Spectroradiometer (MODIS), and the Cloud-Aerosol Lidar and Infrared Pathfinder Satellite Observations (CALIPSO), to monitor the spatial and temporal evolutions of atmospheric composition on the TP (J. Zhu et al., 2019; Li et al., 2020; Rawat and Naja, 2022). Their advantage is to obtain the column densities of pollutants in a large-scale space of the TP. Although CALIPSO could detect aerosol vertical profiles, the spatiotemporal resolution (i.e., ∼ 5.0 km horizontal resolution, 0.06 km vertical resolution and ∼ 16 d temporal resolution) is limited, and the data uncertainty in the planetary boundary layer (PBL) is large due to the low signal-to-noise ratio (Huang et al., 2007). However, several studies have also revealed that the formation, aging and transport processes of atmospheric composition on the TP occur not only near the ground surface but also at high altitudes (X. Xu et al., 2020; Xu et al., 2022). The high PBL on the TP caused by its strong solar radiation and undulating terrain promotes the atmospheric exchange between the bottom troposphere and stratosphere (Yang et al., 2003; Seidel et al., 2010). Therefore, the lack of vertical profiles hinders the understanding of the evolution of trace gases and their environmental and climate effects over the TP. In recent years, balloon and lidar vertical measurements on the TP have occasionally been carried out (Fang et al., 2019; J. Zhang et al., 2020; Dong et al., 2022), but their limited detection species (i.e., aerosol and O3) and high cost are obstacles that limit long-term continuous observation and the conduction of more in-depth scientific research. Multi-axis differential optical absorption spectroscopy (MAX-DOAS) has the technical advantage of low-cost continuous observation of multiple atmospheric components (i.e., aerosol, O3 and their precursors) (Wang et al., 2018; J. Ma et al., 2020; Cheng et al., 2021; C. Xing et al., 2021a, b; Li et al., 2022; Cheng et al., 2023a, b). Combining these data with better scientific models can reduce the modeling bias and promote a better understanding of the physical, chemical and dynamical processes.
The strong convergent airflow formed by the combined action of monsoons, subtropical anticyclones and the airflow of subtropical westerlies could promote the accumulation of O3 on the TP in summer (Ye and Gao, 1979). Therefore, several studies have revealed the high O3 concentration on the TP (Li et al., 2022; Yang et al., 2022; Yu et al., 2022). The strong solar radiation, high O3 concentration and relatively high humidity on the TP provide great potential for high OH production. Lin et al. (2008) and Ye (2019) also confirmed that the high OH over the TP is mainly related to the reaction between O(1D) and H2O. O(1D) is produced from the photolysis of O3 through UV radiation. Therefore, a hypothesis of strong AOC over the TP was put forward. Previous studies have pointed out that HONO also plays an important role in AOC in low-altitude areas, and its contribution to OH can reach 40 %–60 % and even more than 80 % in the early morning (Michoud et al., 2012; Ryan et al., 2018; Xue et al., 2020). However, few studies on HONO on the TP have been reported. Our previous study, conducted at the Qomolangma Atmospheric and Environmental Observation and Research Station, Chinese Academy of Sciences (QOMS-CAS), revealed that the HONO mainly distributed in the lower PBL and peaked in summer at 1.11 ppb, which is comparable to the average level of HONO in other low-altitude areas (Lou et al., 2010; C. Xing et al., 2021a, b; J. Yang et al., 2021). This indicates that it is also necessary to study the contribution of HONO to AOC on the TP. Furthermore, understanding the vertical distribution of OH is of great significance for learning about the atmospheric chemical processes and the evolution of atmospheric components on the TP (Zhou et al., 2015). Identifying the sources of O3 and HONO is the basis for studying the AOC on the TP. The limited research concluded that the atmospheric HONO on the TP is mainly sourced from the emissions of vehicles, biomass burning and soil, except for the NO2 heterogeneous reaction on aerosol surfaces (C. Xing et al., 2021a). The lower tropospheric O3 on the TP is mainly dominated by local photochemical reactions, regional horizontal transport, vertical mixing and the intrusion from the stratosphere (Yin et al., 2017; X. Xu et al., 2018).
In this study, we first analyze the temporal and vertical characteristics of several atmospheric components (i.e., aerosol, H2O, NO2, HONO and O3) based on MAX-DOAS observations in Nam Co. Afterwards, the contributions of O3 and HONO to OH in the vertical space are discussed through the Tropospheric Ultraviolet and Visible (TUV) radiative transfer model and MAX-DOAS measurements. Finally, the potential sources of O3 and HONO at different altitudes are analyzed based on the MAX-DOAS retrievals.
2.1 Site
The Nam Co Monitoring and Research Station for Multisphere Interactions, CAS (NAMORS) (30.774° N, 90.988° E; 4730 m a.s.l.), is located on the southeastern banks of the Nam Co lake and the foothills of the northern Mt. Nyainqêntanglha (Fig. 1). The station's land is covered by alpine meadows with sandy–silt–loam soil. The southwestern monsoon can carry abundant moisture from the Indian Ocean to this station in summer, increasing humidity and precipitation there. Moreover, due to the large summertime evaporation from the Nam Co lake, the atmospheric H2O around CAS (NAMORS) is more abundant than in other areas of the TP, resulting in lush grass vegetation, which makes the area around this station an important summertime pasture. In addition, there are not large industries and cities within 100 km of CAS (NAMORS). The closest town to CAS (NAMORS) is Dangxiong, which is about 60 km away from the station and about 500 m lower than the station. Only a small number of vehicles pass through this area during the summer tourism season. Therefore, no obvious anthropogenic sources of air pollutants exist near this station. Averaged spatial distributions of AOD, O3, NO2 and HCHO monitored by satellites from May to July 2019 are shown in Fig. S1 in the Supplement. Elevated AOD, NO2 and O3 are mainly distributed in the South Asian subcontinent (e.g., India and Nepal) and the southern foothills of the Himalayas, which are located upwind of the southwestern monsoon, potentially affecting the atmospheric composition over CAS (NAMORS).
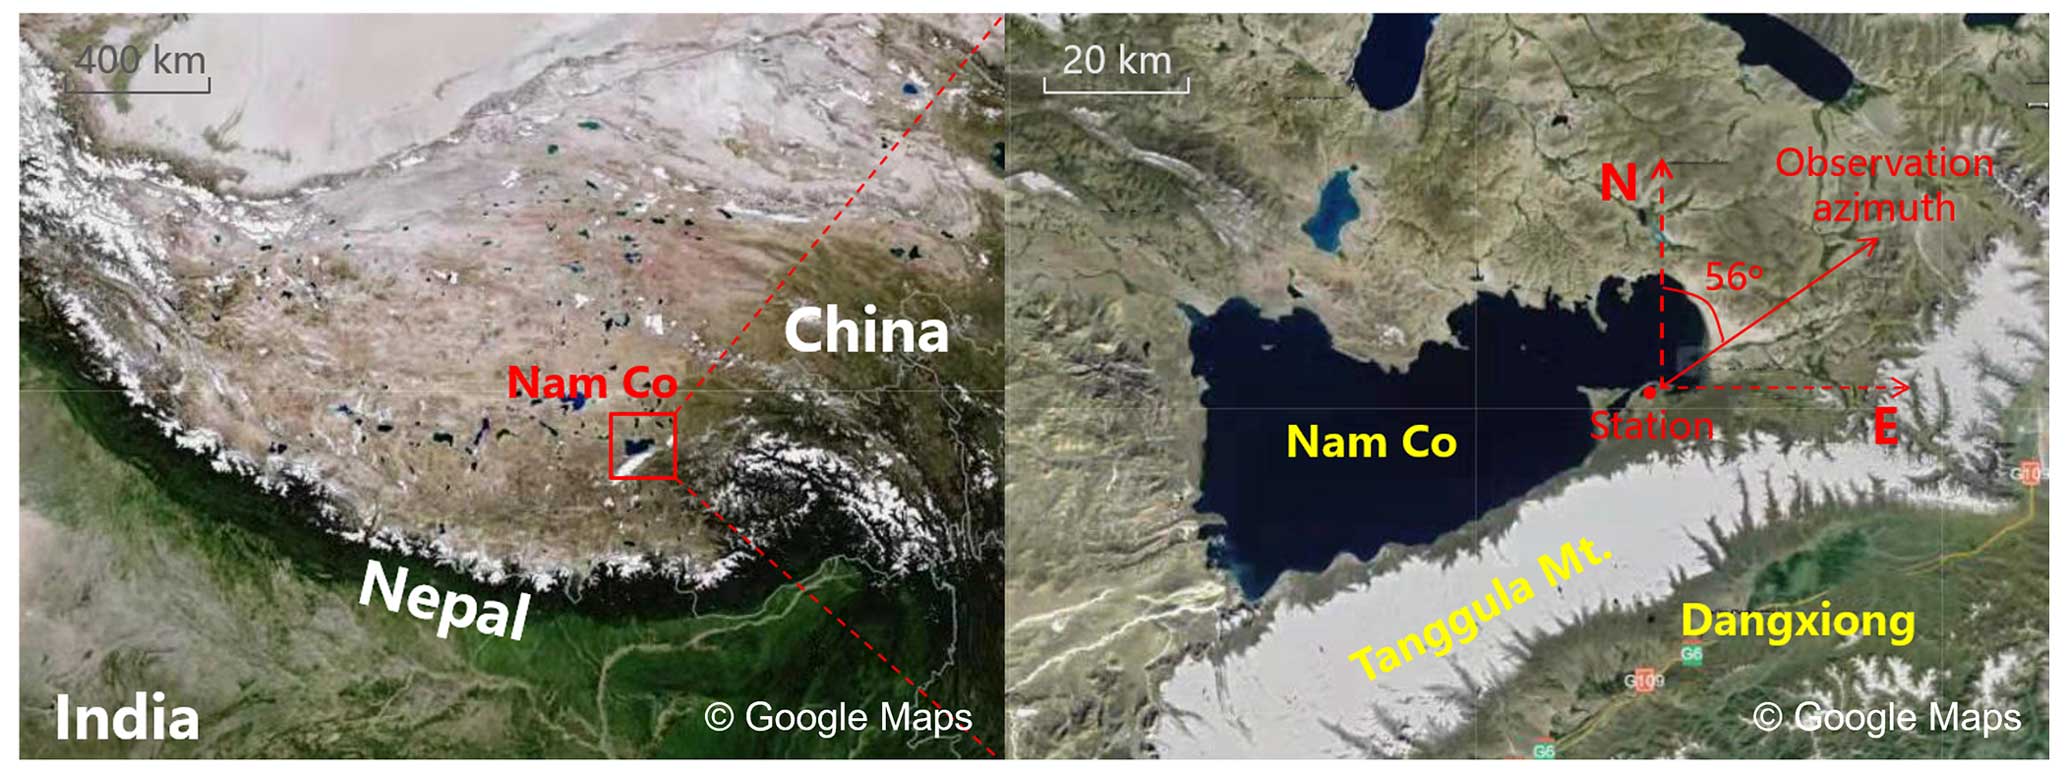
Figure 1Geographical location of CAS (NAMORS) on the Tibetan Plateau.
2.2 Measurements
2.2.1 Instrument setup and spectral analysis
The MAX-DOAS instrument installed at CAS (NAMORS) was operated from 1 May to 9 July 2019. It consists of three major parts: a telescope unit, spectrometer unit and control unit. A detailed description of this instrument can be found in C. Xing et al. (2021a). In this study, the elevation angle sequence was set to 1, 2, 3, 4, 5, 6, 8, 10, 15, 30 and 90°, with an exposure time of 60 s to each individual spectrum. The azimuth angle was set to 56° pointing toward the Nagqu direction. Moreover, only spectra collected under a solar zenith angle (SZA) of less than 75° were used for spectral analysis to avoid the strong stratospheric absorption.
Table 1Detailed DOAS retrieval settings for O4, H2O, NO2, HONO and O3.
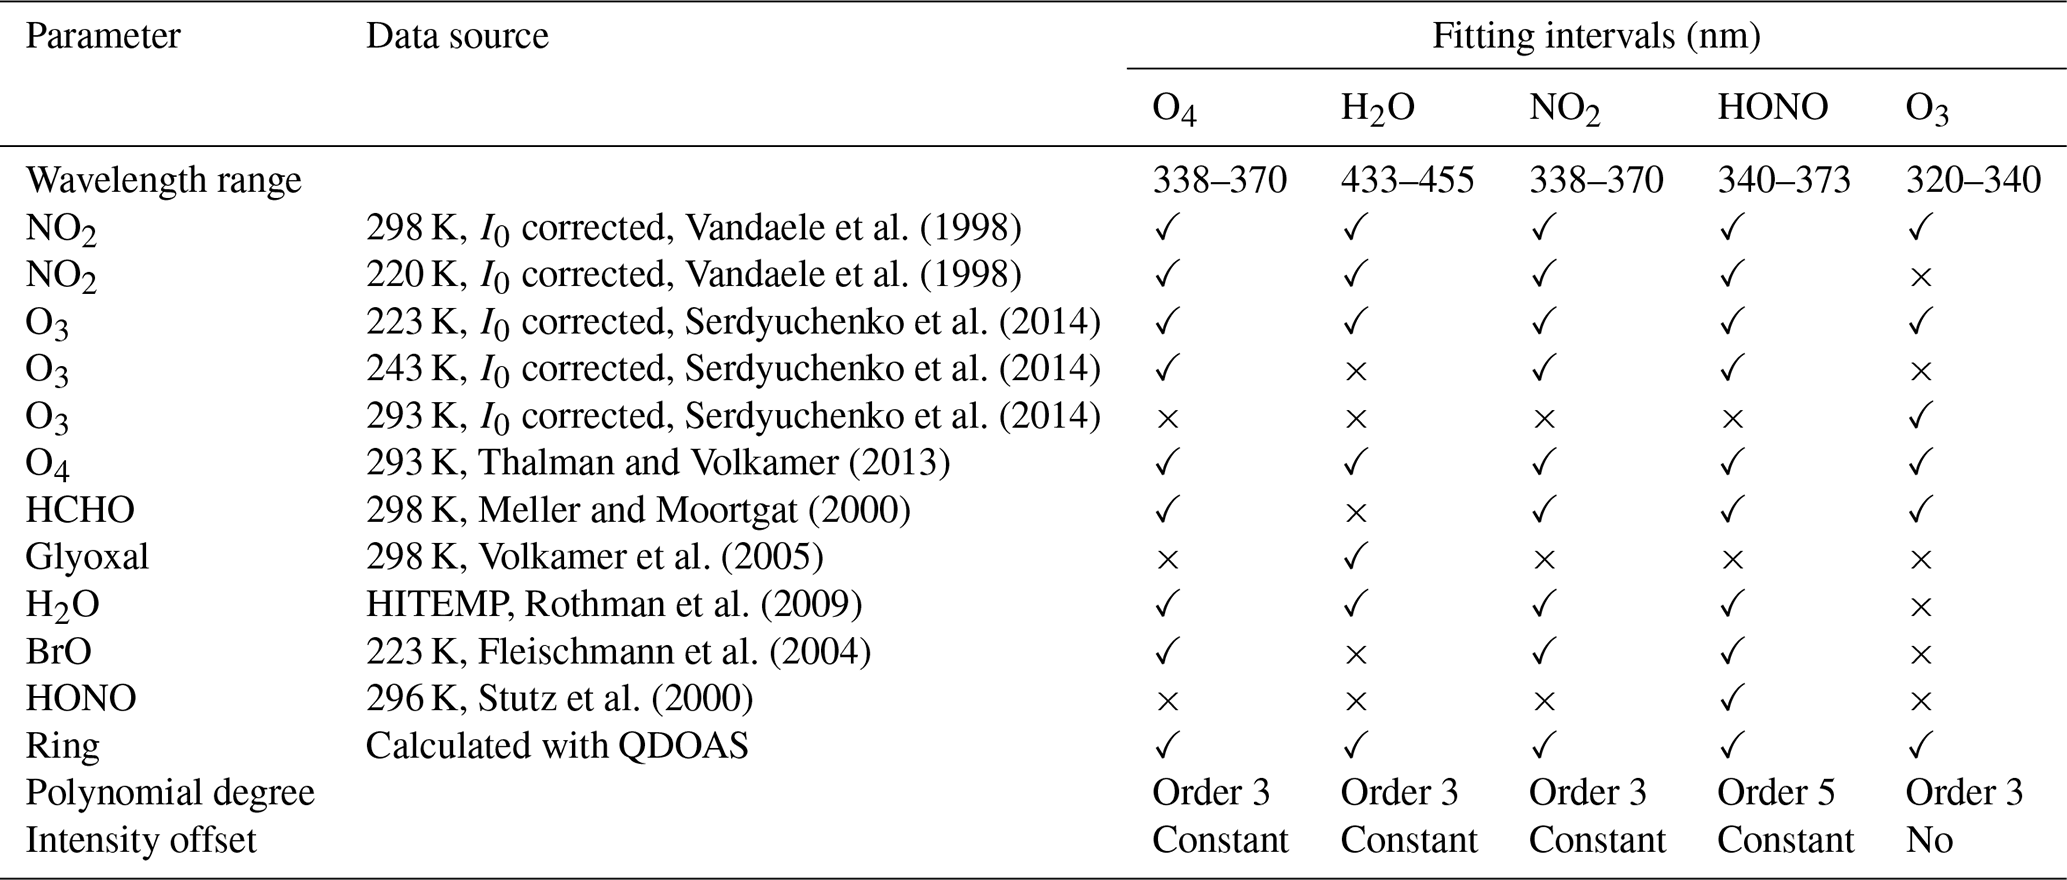
The differential slant column densities (DSCDs) of O4, H2O, NO2, HONO and O3 were retrieved using QDOAS software (http://uv-vis.aeronomie.be/software/QDOAS/, last access: 3 September 2024) developed by the Royal Belgian Institute for Space Aeronomy (BIRA-IASB). The zenith spectra measured at every sequence were selected as the scan Fraunhofer reference spectrum. The retrieval configurations of O4, H2O, NO2, HONO and O3 followed Xing et al. (2017), Lin et al. (2020), C. Xing et al. (2021a, b) and Wang et al. (2020, 2018), respectively. Detailed DOAS fit settings of above five species are listed in Table 1. Corrected I0 (Aliwell et al., 2002) was used in this study. Figure 2 shows a typical DOAS retrieval example for above five species. DOAS fit results with root mean square (RMS) values larger than 5 × 10⁻⁴, 5 × 10⁻⁴, 5 × 10⁻⁴, 1 × 10⁻³ and 6 × 10⁻⁴ for O4, H2O, NO2, HONO and O3, respectively, were filtered out. In addition, we calculated the color index (CI) in order to remove cloud effects (Wagner et al., 2016). The data filter criteria according to the CI followed Ryan et al. (2018) and Xing et al. (2020). Afterwards, the quantified DSCDs of O4, H2O, NO2, HONO and O3 were 91.33 %, 91.97 %, 92.16 %, 86.42 % and 81.09 %, respectively.
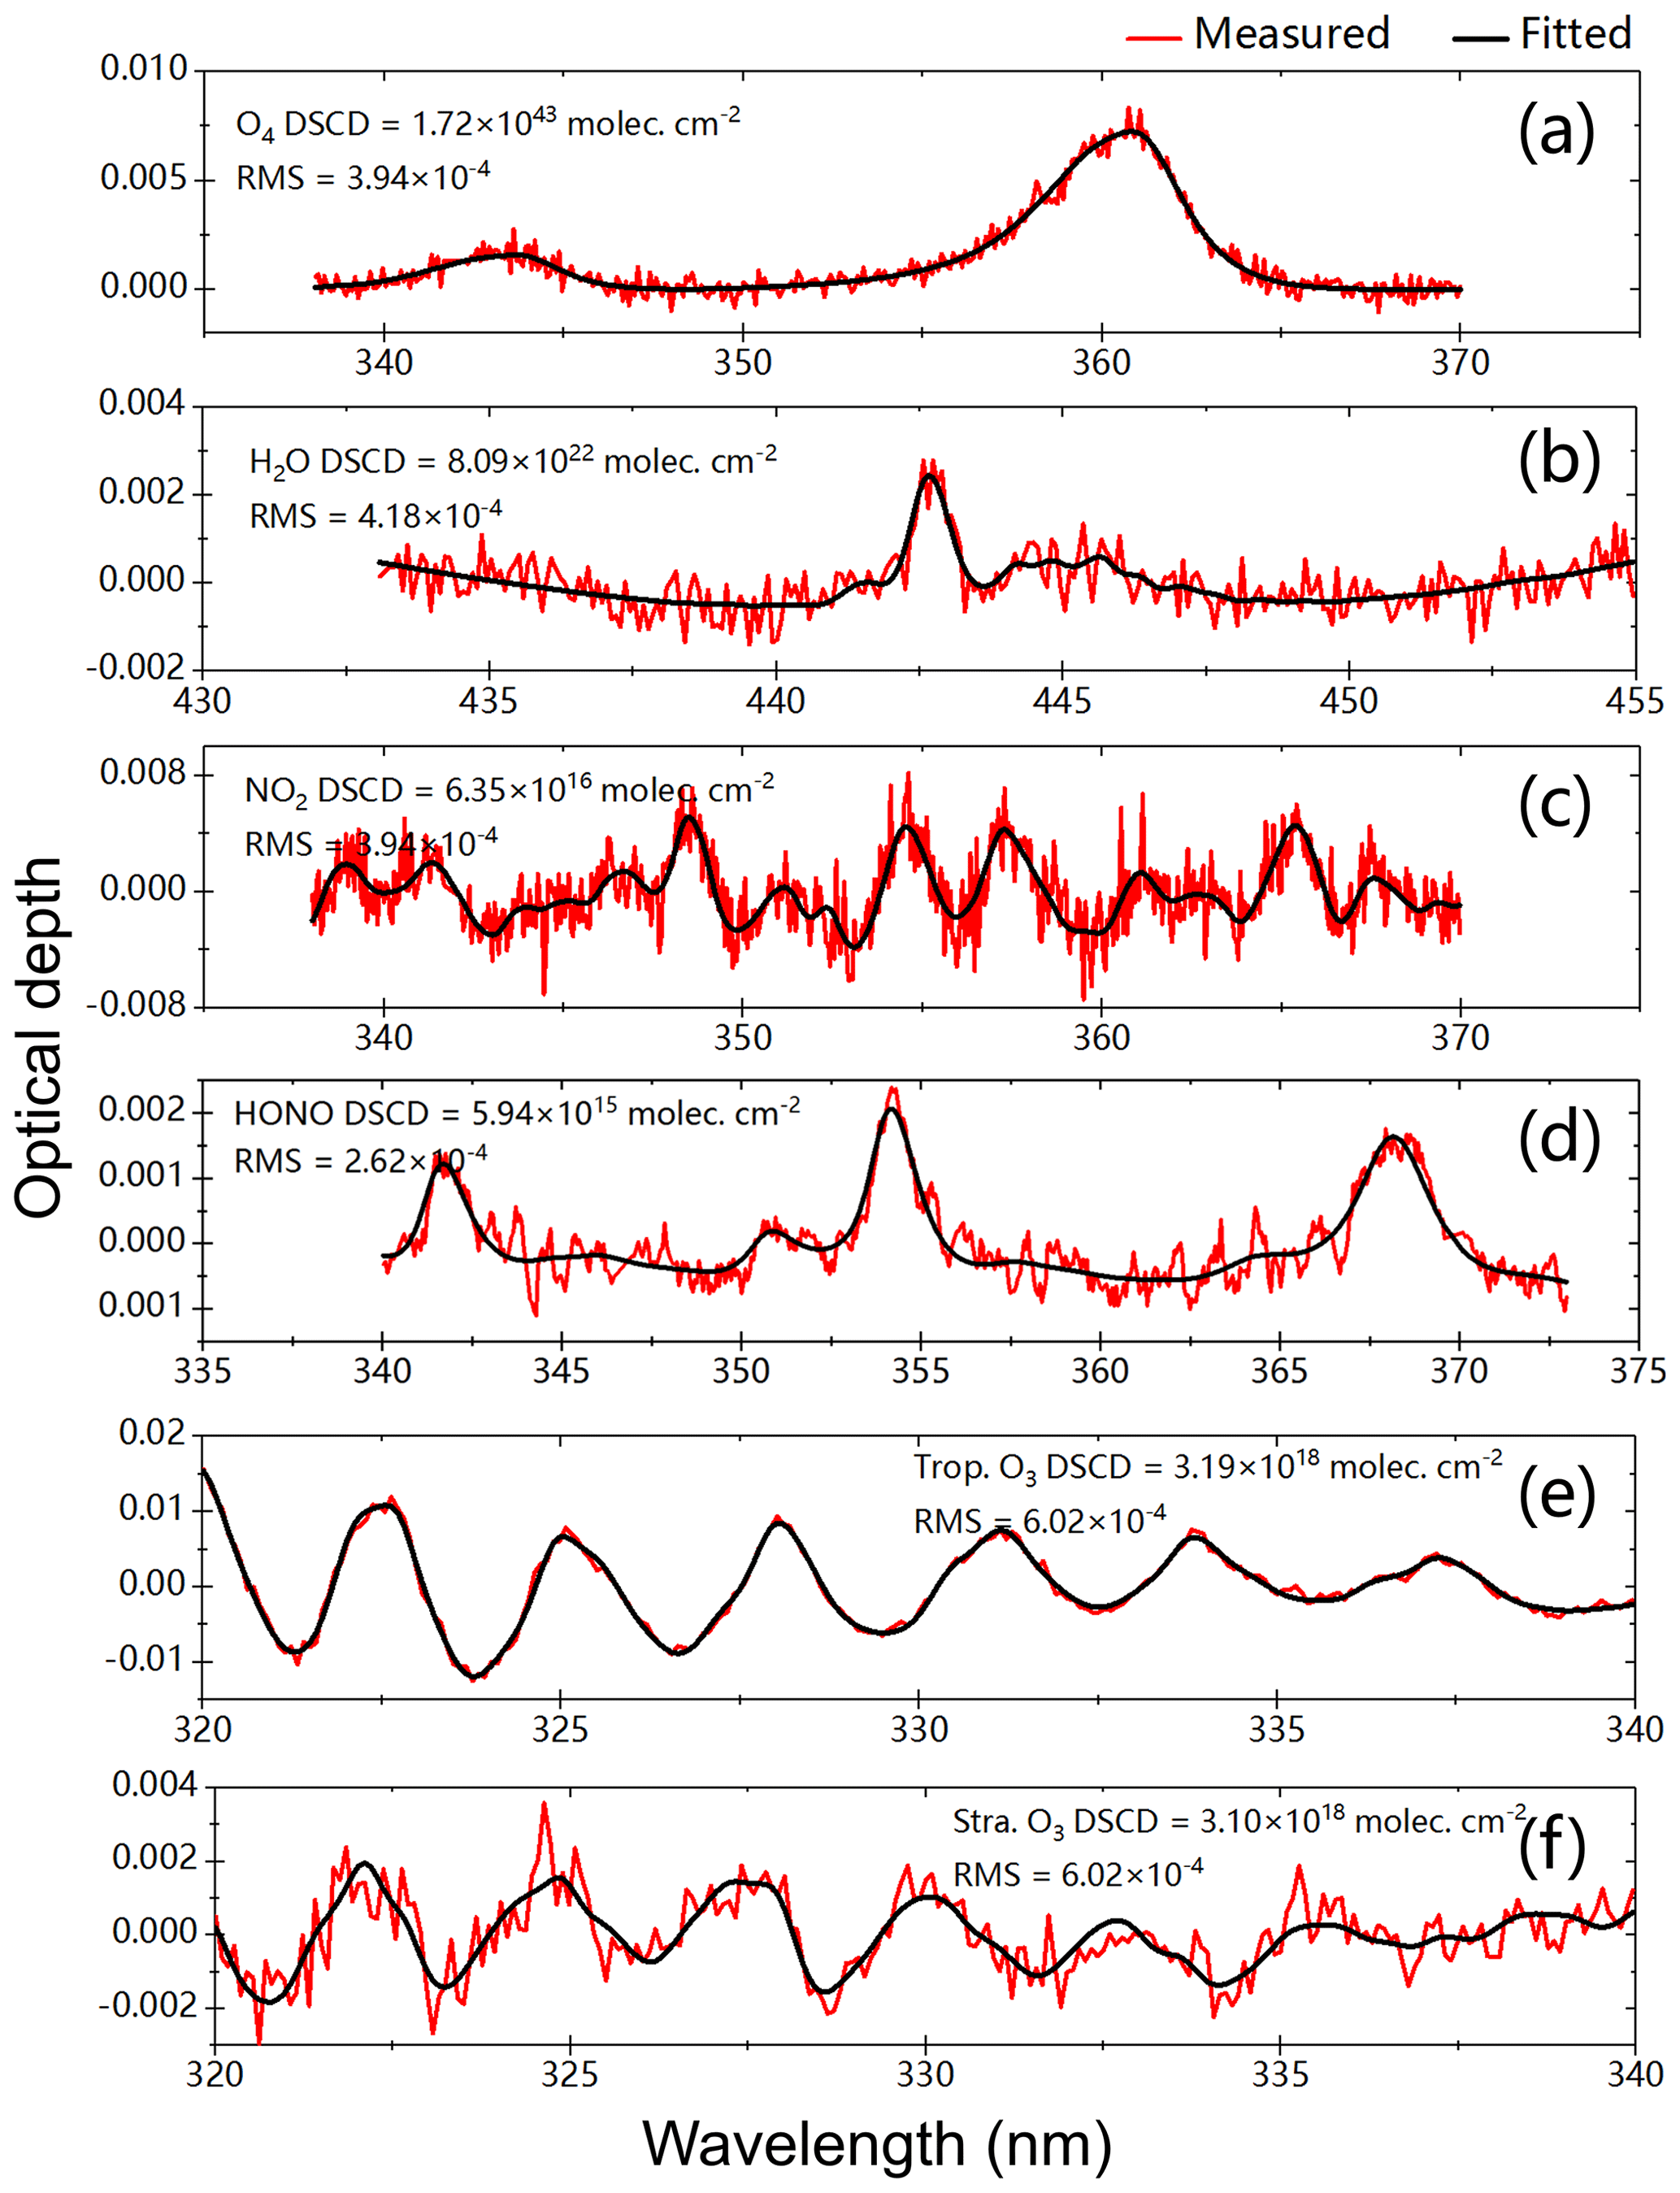
Figure 2DOAS fit examples of O4, H2O, NO2, HCHO, tropospheric O3 and stratospheric O3. The red line and the black line represent the measured and fitted results, respectively.
2.2.2 Vertical profile retrieval
The vertical profiles of aerosol and trace gases (i.e., H2O, NO2, HONO and O3) were retrieved using an algorithm based on the optimal estimation method (OEM). A linearized pseudo-spherical vector discrete ordinate radiative transfer model, VLIDORT, was used as the forward model, and a Gauss–Newton (GN) scheme was used as the inversion strategy (Wedderburn et al., 1974). A detailed description of this algorithm can be found in Liu et al. (2021), C. Xing et al. (2021a) and Wang et al. (2018). Detailed retrieval processes are depicted in Sect. S1 of the Supplement. In this study, the initial a priori profile shape of above five species was set to an exponential decreasing shape, and the AOD and vertical column densities (VCDs) simulated by the Weather Research and Forecasting model coupled with chemistry (WRF-Chem) were also used as initial input a priori information to constrain the retrieval process. For the O3 profile retrieval, the stratospheric O3 profile was deducted using the TROPOMI O3 profile (Zhao et al., 2021). We set 20 vertical layers from 0.0 to 4.0 km with a vertical resolution of 0.2 km. The correlation height was set to 1.0 km. Moreover, the surface albedo, single-scattering albedo and asymmetry parameter were set to fixed constants of 0.08, 0.85 and 0.65, respectively (Irie et al., 2008). The retrieved vertical profiles were excluded based on the condition that the degree of freedom (DOF) and relative error were less than 1.0 and 100 %, respectively.
2.2.3 Error analysis
The error sources can be divided into four different types: smoothing error, noise error, forward model error and model parameter error (Rodgers, 2000). However, in terms of this classification, some errors are difficult to calculate or estimate. For example, the forward model error, which is caused by an imperfect representation of the physics of the system, is hard to quantify due to the difficulty of acquiring an improved forward model. Given calculation convenience and contributing ratios of different errors in the total error budget, we mainly took into account the following error sources: smoothing and noise errors, an algorithm error, a cross-section error, and uncertainty related to the aerosol retrieval (only for trace gas). In this study, we estimated the contribution of different error sources to the AOD and VCDs of trace gases and near-surface (0–200 m) trace gases' concentrations and aerosol extinction coefficients (AECs), respectively. Detailed demonstrations and estimation methods are described below.
Smoothing errors arise from the limited vertical resolution of the profile retrieval. Noise errors denote the noise in the spectra (i.e., the error in DOAS fits). Considering that the error in the retrieved state vector equals the sum of these two independent errors, we calculated the sums of smoothing and noise errors for near-surface concentrations and column densities, which were 13 % and 5 % for aerosols, 13 % and 36 % for H2O, 12 % and 14 % for NO2, 18 % and 21 % for HONO, and 12 % and 32 % for O3, respectively.
The algorithm error is denoted by the differences between the measured and simulated DSCDs. This error contains a forward model error from an imperfect approximation of a forward function, a parameter error of the forward model and other errors such as detector noise (Rodgers, 2000). The algorithm error is a function of the viewing angle, and it is difficult to assign this error to each altitude. Thus, this error in the near-surface values and column densities is estimated by calculating the average relative differences between the measured and simulated DSCDs at the minimum and maximum elevation angles (except 90°), respectively (Wagner et al., 2004). In this study, we estimated the errors in the near-surface values and the column densities to be 4 % and 8 % for aerosols, 3 % and 11 % for NO2, 20 % and 20 % for HONO (referring to Y. Wang et al., 2017, 2020), 1 % and 8 % for H2O (referring to Lin et al., 2020), and 6 % and 10 % for O3 (referring to Ji et al., 2023), respectively.
The cross-section error arises from the uncertainty in the cross section. We adopted 4 %, 3 %, 3 %, 5 % and 2 % for O4 (aerosols), H2O, NO2, HONO and O3 according to Thalman and Volkamer (2013), Lin et al. (2020), Vandaele et al. (1998), Stutz et al. (2000), and Serdyuchenko et al. (2014), respectively.
The profile retrieval error for trace gases is sourced from the uncertainty in the aerosol extinction profile retrieval and propagated to the trace gas profile. This error could be roughly estimated based on a linear propagation of the total error budgets of the aerosol retrievals. The errors in the four trace gases studied were roughly estimated to be 14 % for VCDs and 10 % for near-surface concentrations.
Table 2Error budget estimation (in %) of the retrieved near-surface (0–200 m) concentrations of trace gases and AECs as well as AOD and VCDs.
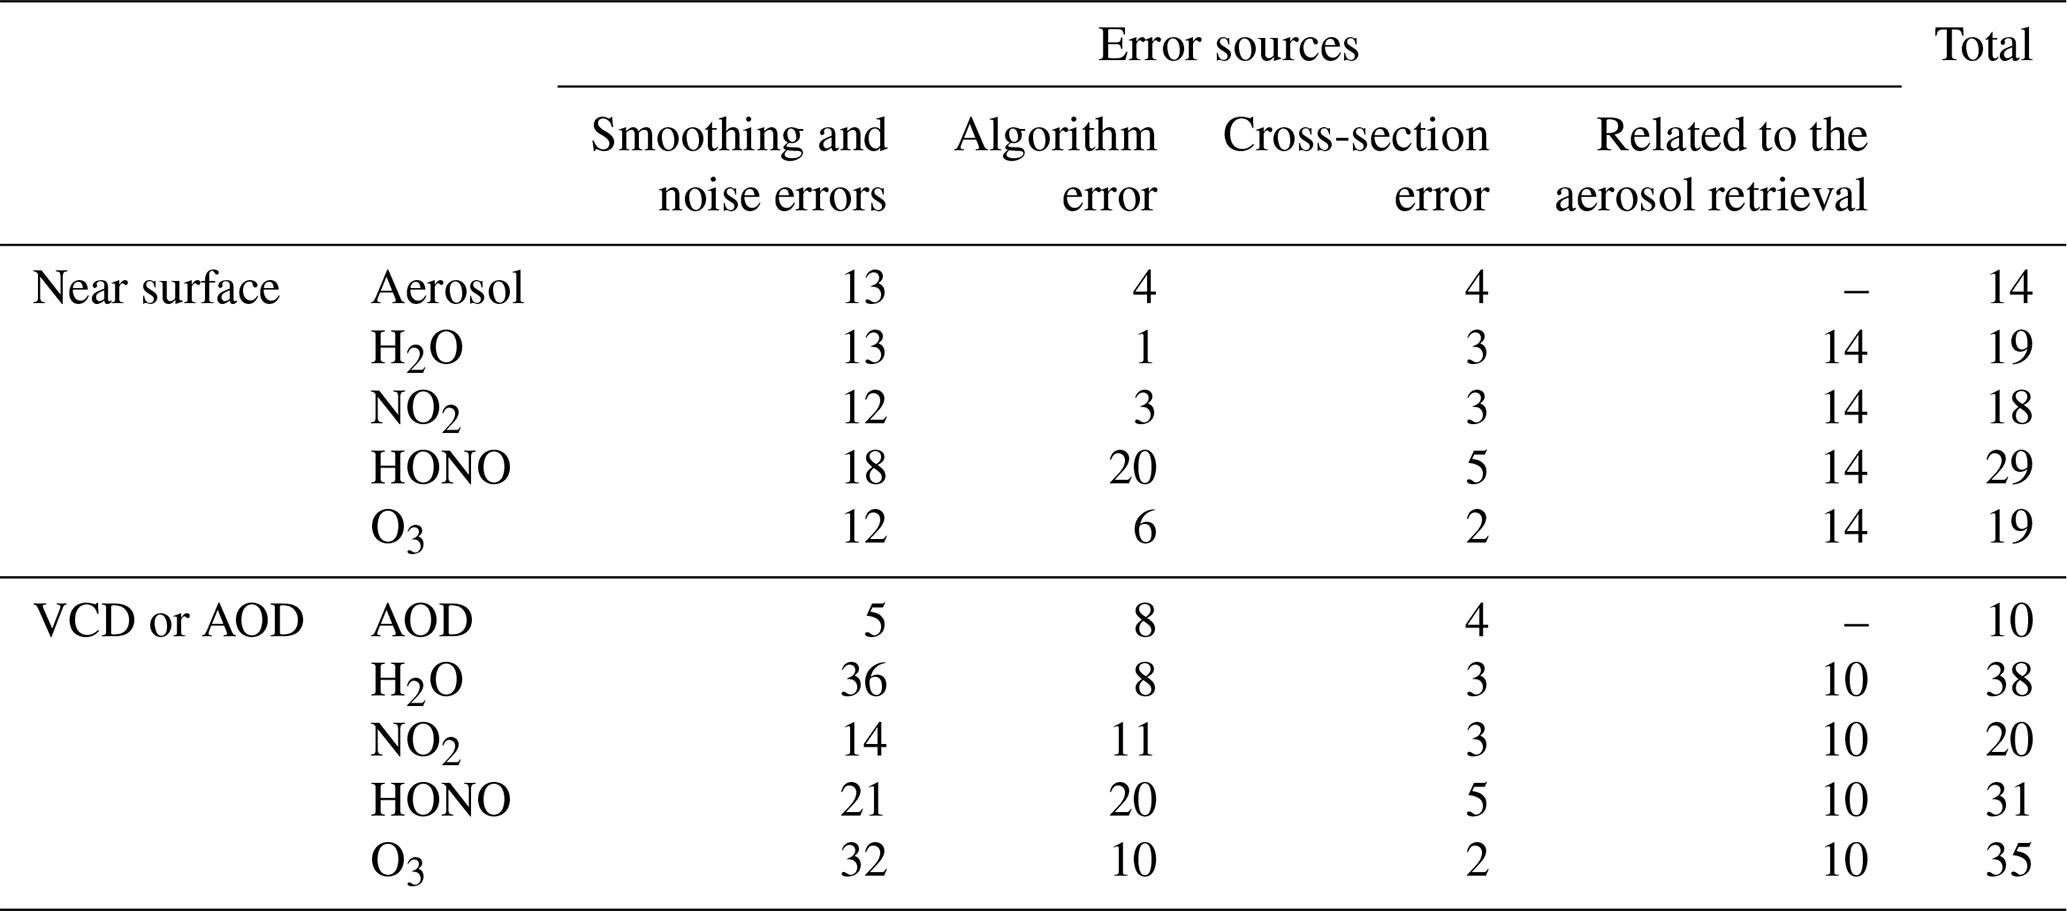
The total uncertainty is the sum of all abovementioned errors in the Gaussian error propagation, and the error results are listed in Table 2. We found that the smoothing and noise errors played a dominant role in the total uncertainties in aerosol and trace gases. Moreover, improving the accuracy and temperature gradient of the absorption cross section is another important way to reduce the uncertainty in the vertical profiles in the future, especially for O3.
2.3 TUV model
The calculation of photolysis rates of HONO and O3 was done using the TUV radiation model (https://www2.acom.ucar.edu/modeling/tropospheric, 3 September 2024) based on a full FORTRAN code. In order to ensure the accuracy of the model run, we only selected data on sunny and cloudless days. Moreover, we developed a cloud classification method based on the diurnal variations in the color index (CI = ) in Fig. S2. The initial input parameters were as follows: the AOD at 361 nm was derived from aerosol extinction profiles measured by MAX-DOAS; the daily total ozone column density was measured by TROPOMI with a value range of 260–280 DU; the single-scattering albedo (SSA) was calculated based on the regression analysis of multi-wavelength (361 and 477 nm) O4 absorptions measured by MAX-DOAS (Xing et al., 2019); and fixed Ångström exponents of 0.508, 0.581 and 0.713 were used in May, June and July, respectively, referring to Xia et al. (2011).
2.4 Backward trajectory, PSCF and CWT analysis
The 48 h backward trajectories at five heights of 200, 600, 1000, 1400 and 1800 m were calculated using the Hybrid Single-particle Lagrangian Integrated Trajectory (HYSPLIT) model based on the Global Data Assimilation System (GDAS) to identify the major transport pathways of O3 (Draxler and Hess, 1998). Moreover, the calculated backward trajectories were clustered into three groups using Ward's variance method and the angle distance algorithm (Ward, 1963; Wang et al., 2006).
In order to determine the potential source locations of O3 over CAS (NAMORS), the Potential Source Contribution Function (PSCF) model and Concentration-Weighted Trajectory (CWT) model were used (Hong et al., 2019; Ou et al., 2021). The PSCF was calculated by dividing the number of air trajectory endpoints by the number of air trajectory endpoints. Moreover, a weighting function was introduced to reduce the increased uncertainties in the PSCF with the increase in the distance between the grid and sampling point. In this study, the set of this weighting function was used in accordance with Yin et al. (2017). CWT can be used to calculate the weight concentration through averaging the concentrations associated with trajectories crossing the grid cell. The above weighting function was also introduced to calculate the Weight Concentration-Weighted Trajectory (WCWT) (Hsu et al., 2003). A detailed description of these two models can be found in Wang et al. (2006).
2.5 Ancillary data
The surface NO2, HONO and O3 concentrations used to validate the corresponding MAX-DOAS measurements were monitored by a broadband cavity-enhanced spectrometer (BBCES) (Fang et al., 2017), long-path absorption photometer (LOPAP) (Kleffmann and Wiesen, 2008) and Thermo Electron 49i (Shi et al., 2009), respectively. The PBL height was simulated using WRF with spatiotemporal resolutions of 20 × 20 km2 and 1.0 h (detailed configurations in Sect. S2 of the Supplement). Moreover, the large-scaled spatial distributions of AOD, O3 and NO2 over CAS (NAMORS) were monitored by Himawari-8 (Bessho et al., 2016), OMI (Veefkind et al., 2004) and TROPOMI (Griffin et al., 2018; Su et al., 2020), respectively.
3.1 Overview of the measurements
Figure 3 shows the averaged diurnal variation in AOD from 1 May to 9 July 2019, with an average value of 0.076 km−1 during 08:00–19:00 LT. The AOD was 0.071 km−1 at 08:00 and then gradually decreased to a minimum value of 0.052 km−1 at 12:00. Subsequently, the AOD increased significantly, reaching maximum values during 15:00–17:00 (average of 0.107 km−1), which were about 1.408 times the diurnal average value. Considering the diurnal variation in wind speed (Fig. S3), such an enhancement of AOD may be related to the long-range transport of aerosol from southern Asia (Yang et al., 2020; Bi et al., 2023). Moreover, 15:00–17:00 was the busiest time for tourists and local residents (e.g., cooking), and these kinds of anthropogenic sources contributed to the atmospheric AOD at NAMORS through short-distance transport (Yin et al., 2017; Zhang et al., 2017). After 17:00, the AODs decreased rapidly to 0.071 km−1 at 18:00 and 0.081 km−1 at 19:00.
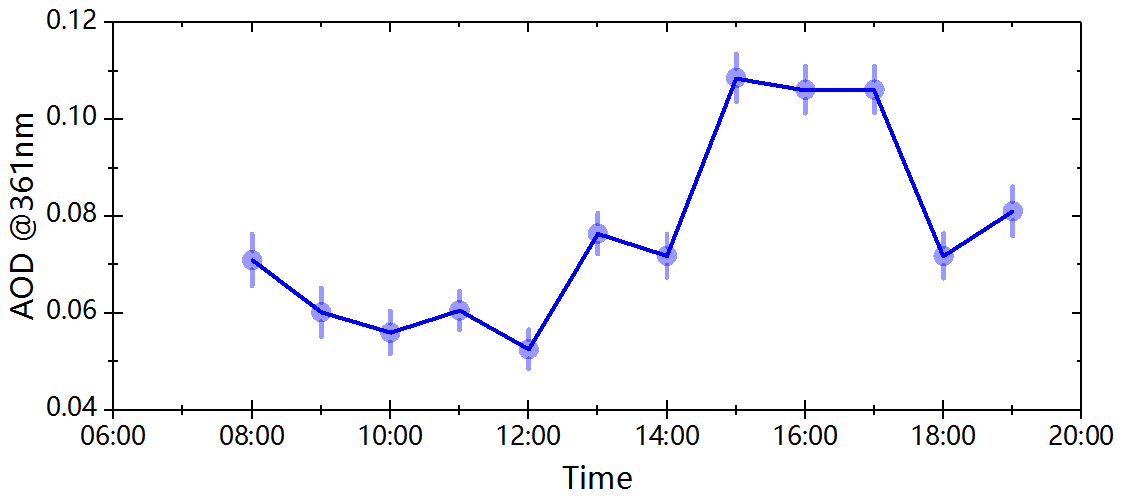
Figure 3Averaged diurnal variation in AOD at CAS (NAMORS). The error bars represent the mean retrieved errors in AOD.
As shown in Fig. S4, the diurnal variation in PBL in Nam Co from May to July 2019 was lower in the early morning and late afternoon but higher between 11:00 and 17:00, a relatively long period, with the maximum PBL being larger than 2.0 km. Zhang et al. (2017) and Yang et al. (2017) also reported that the PBL in Nam Co was usually larger than 1.0 km during daytime in spring and summer. In order to investigate the height-dependent variations in aerosol, H2O, NO2, HONO and O3 within the PBL during the measurements, five height layers under the PBL (0.0–0.2, 0.4–0.6, 0.8–1.0, 1.2–1.4 and 1.6–1.8 km) were thus selected.
Figure 4 shows the time series of the daily averaged aerosol, H2O, NO2, HONO and O3 above the five layers from 1 May to 9 July 2019. Aerosol mainly distributed at 0.0–0.2 km with an average extinction coefficient of 0.138 km−1, and the ratios of aerosol extinction at 0.4–0.6, 0.8–1.0, 1.2–1.4 and 1.6–1.8 km to those at 0.0–0.2 km were 39.34 %, 18.77 %, 7.29 % and 2.62 %, respectively. That indicated that the aerosol was usually locally emitted at the surface, and the occasional appearance of strong aerosol extinction at 0.4–0.6 km, such as on 13 and 30 June, was associated with long-range transport from southern Asia (Fig. S5; Wan et al., 2015; Li et al., 2016b). The average concentration of H2O at 0.0–0.2 km was 2.35 × 10¹⁷ molec. cm−3, and the ratios of H2O at 0.4–0.6, 0.8–1.0, 1.2–1.4 and 1.6–1.8 km to those at 0.0–0.2 km were 83.40 %, 68.08 %, 50.64 % and 35.74 %, respectively, which could be attributed to the transport of H2O from southern Asia driven by the Indian Ocean monsoon and the elevated evaporation from the Nam Co lake, leading to its unobvious vertical gradient (Fig. S6; Lei et al., 2014; G. Zhu et al., 2019). The average concentration of NO2 at 0.0–0.2 km was 0.193 ppb, and its high concentration mainly distributed at 0.4–0.6 km after 15 May. The ratios of NO2 at 0.4–0.6, 0.8–1.0, 1.2–1.4 and 1.6–1.8 km to those at the bottom layer were 104.03 %, 59.05 %, 24.62 % and 12.84 %, respectively. The elevation of the distribution height of high-concentration NO2 could be attributed to the transport process from the NOx produced by ice and snow on the top of Mt. Tanggula under strong ultraviolet radiation conditions (Boxe, 2005; Fisher, 2005; Lin et al., 2021). As depicted in Fig. S7, the Weight Potential Source Concentration Function (WPSCF) passing through Mt. Tanggula showed high values at the 300–400 m layer, especially at 400 m (> 0.3). It also indirectly indicated the important contribution to NOx from ice and snow on the top of the mountains under strong ultraviolet radiation conditions on the TP. HONO mainly distributed at 0.0–0.2 km, with an average value of 0.087 ppb, and the ratios of HONO at 0.4–0.6, 0.8–1.0, 1.2–1.4 and 1.6–1.8 km to those at 0.0–0.2 km were 58.49 %, 44.64 %, 31.30 % and 21.67 %, respectively. That indicated that the primary and secondary sources of HONO were mainly at the surface (Sect. 4.2). The vertical gradient of daily averaged O3 concentration was also not obvious, which was associated with its vertical mixing and photochemical production (Yin et al., 2017). As shown in Fig. S8, the corresponding TROPOMI O3 profiles in Nam Co and O3 profiles measured by lidar and ozonesonde around Nam Co reported in several previous studies also exhibited an exponential shape (Fang et al., 2019; J. Zhang et al., 2020; Yu et al., 2022). The O3 average concentration at 0.0–0.2 km was 63.030 ppb, and the ratios of O3 at 0.4–0.6, 0.8–1.0, 1.2–1.4 and 1.6–1.8 km to those at the surface were 89.25 %, 82.44 %, 80.16 % and 79.13 %, respectively.
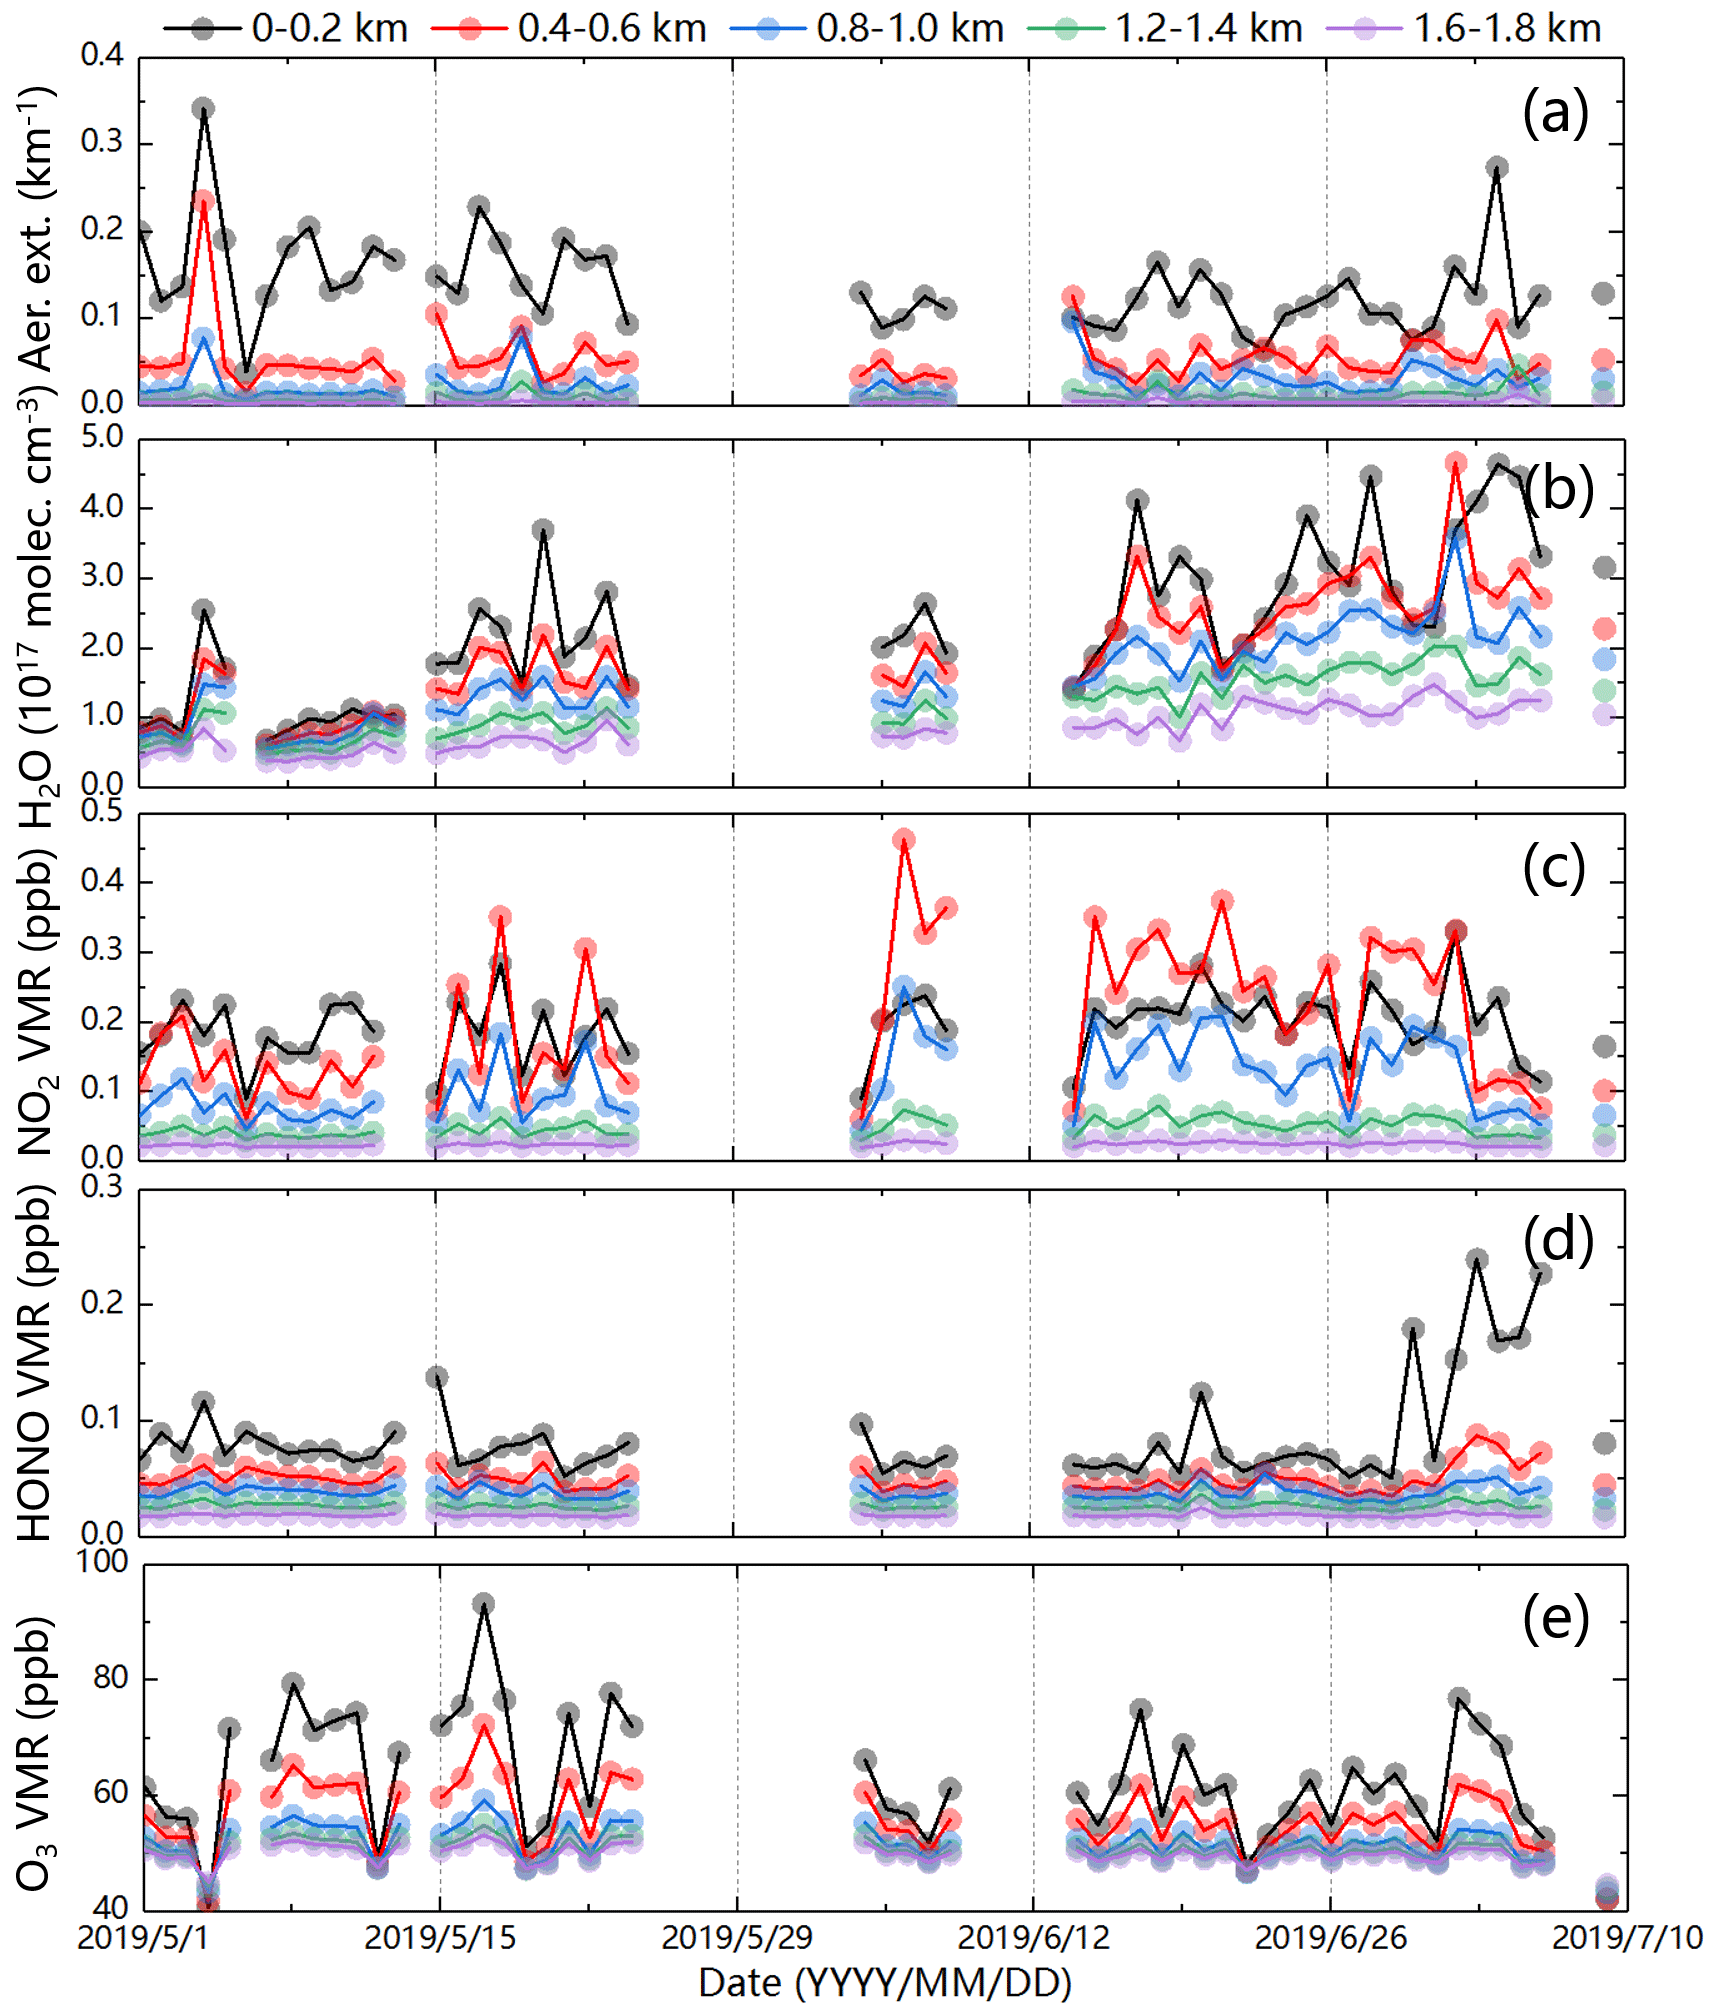
Figure 4Time series of daily averaged (a) aerosol extinction, (b) H2O, (c) NO2, (d) HONO and (e) O3 monitored by MAX-DOAS at the five height layers of 0–0.2, 0.4–0.6, 0.8–1.0, 1.2–1.4 and 1.6–1.8 km from 1 May to 9 July 2019.
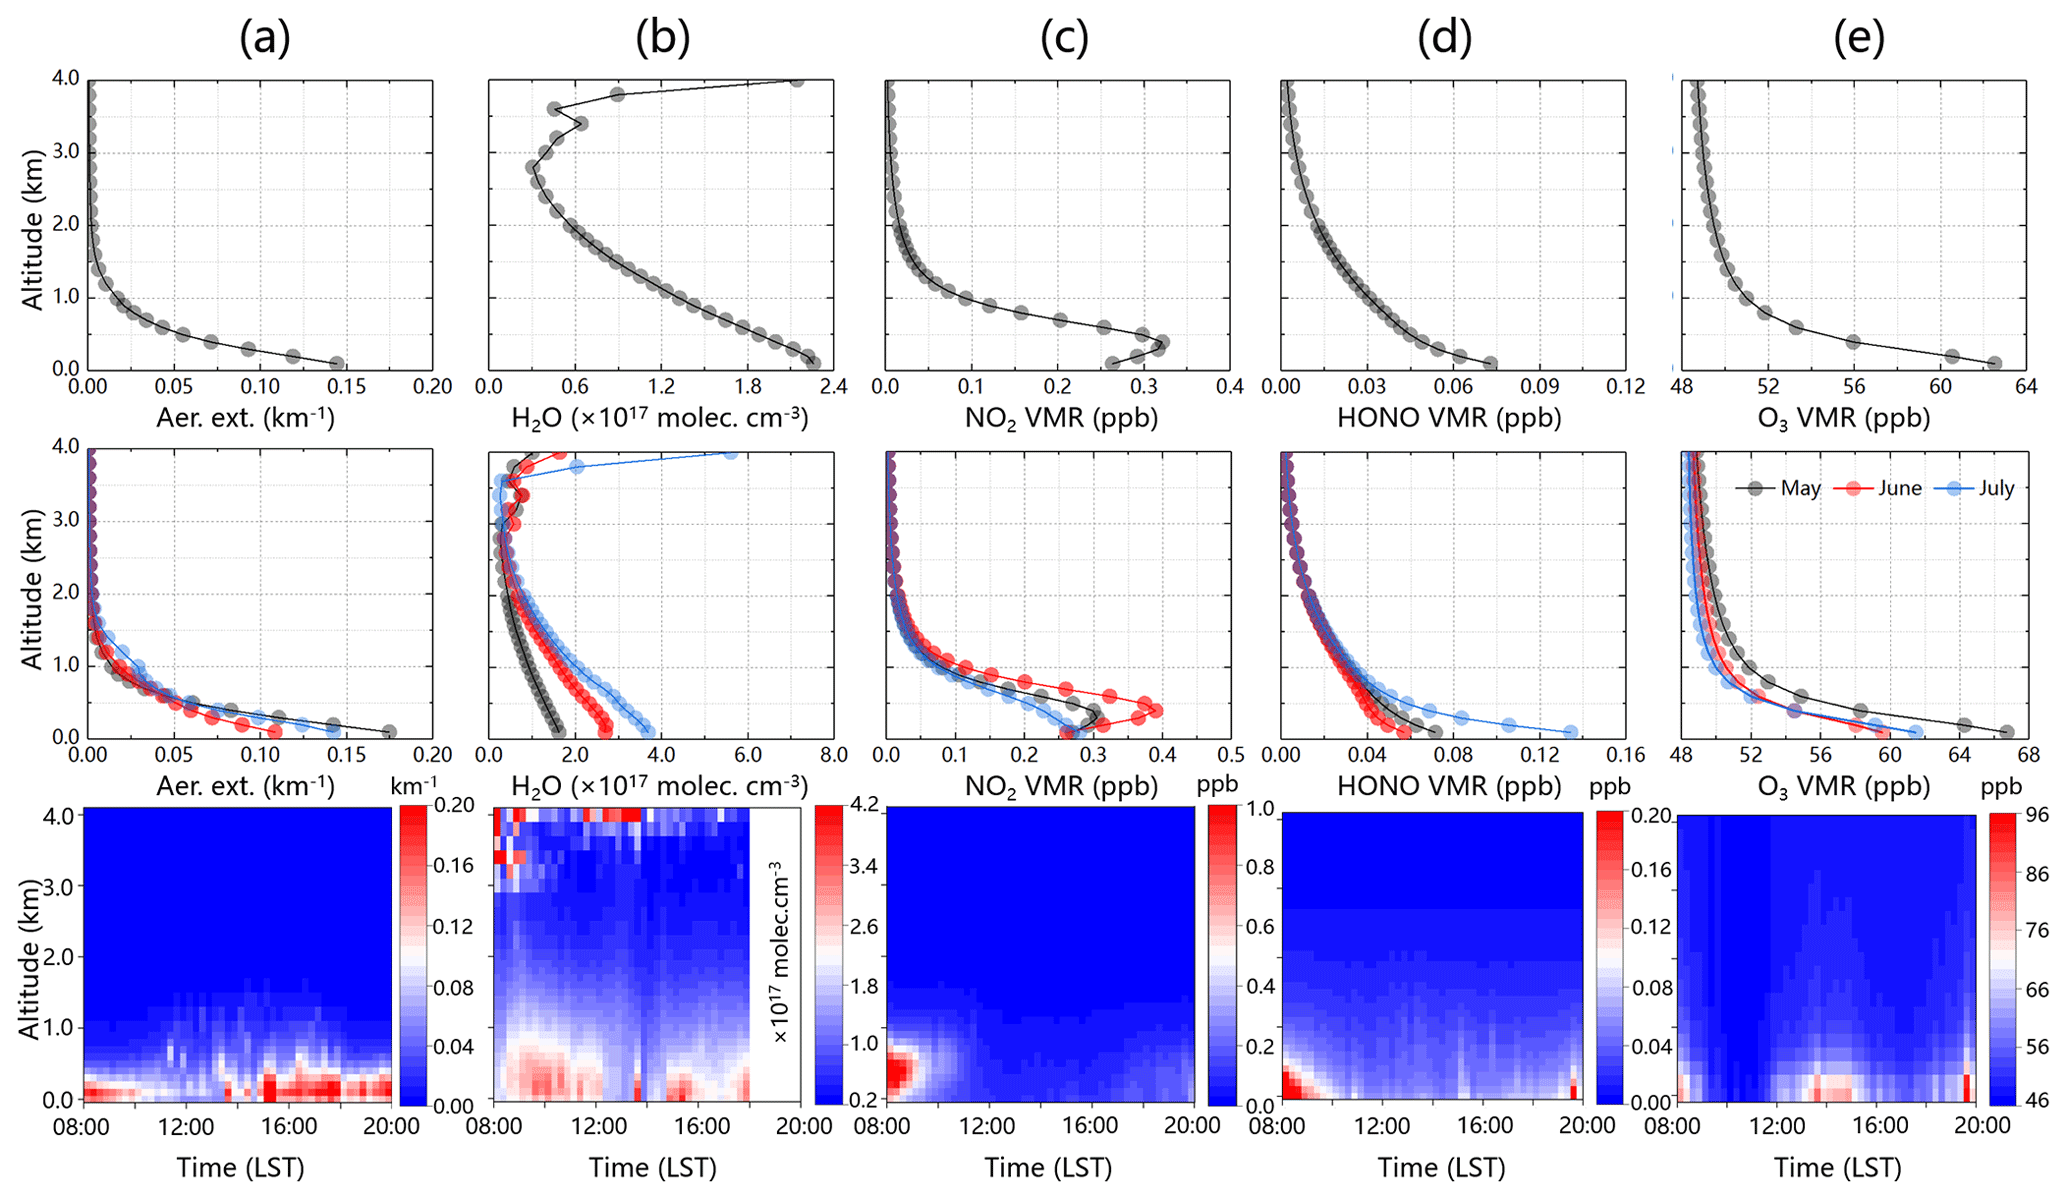
Figure 5Vertical profiles of (a) aerosol extinction, (b) H2O, (c) NO2, (d) HONO and (e) O3. The top row shows the averaged vertical profiles from 1 May to 9 July 2019. The middle row shows the monthly averaged vertical profiles. The bottom row shows the averaged diurnal vertical profiles from 1 May to 9 July 2019.
3.2 Vertical distributions of aerosol, H2O, NO2, HONO and O3
The first row in Fig. 5 provides the averaged vertical profiles of aerosol, H2O, NO2, HONO and O3 from May to July 2019. We found that the vertical profiles of aerosol, H2O, HONO and O3 all exhibited an exponential shape with maximum values near the surface, while NO2 exhibited a Gaussian shape with the maximum value of 0.321 ppb occurring at the 0.3–0.4 km layer. In addition to the effect of NOx transport, X. Xu et al. (2018) also revealed that the long-range high-altitude transport process from the northern South Asian subcontinent can significantly enhance Nam Co's peroxyacetyl nitrate (PAN) level, which is a reservoir of NOx. As shown in the second row of Fig. 5, the monthly averaged aerosol vertical profiles from May to July 2019 all exhibited an exponential shape and varied of the order of May (0.17 km−1) > July (0.14 km−1) > June (0.11 km−1). R. Xu et al. (2018) and Neupane et al. (2019) also reported a similar monthly variation in black carbon (BC) from May to July over the TP and revealed that it was mainly associated with anthropogenic emissions (e.g., biomass burning) and its transport from South Asia. The monthly averaged vertical profile of H2O in May and July exhibited an exponential shape, while its maximum concentration layer elevated slightly to 0.1–0.2 km in June, which was related to the strongest monsoon transport (Fig. S9). It varied of the order of July (3.68 × 10¹⁷ molec. cm−3) > June (2.71 × 10¹⁷ molec. cm−3) > May (2.26 × 10¹⁷ molec. cm−3), and its maximum concentration occurring in July was strongly associated with the enhanced evaporation from the Nam Co lake (Xu et al., 2011). The monthly averaged vertical profiles of NO2 all exhibited a Gaussian shape from May to July, and its maximum values mainly distributed at the 0.2–0.4 km layer, varying of the order of June (0.39 ppb) > May (0.31 ppb) > July (0.28 ppb). This indicated that the regional transport from the NOx produced from ice and snow under strong shortwave radiation conditions (Fig. S7), NO2 emitted from vehicles due to the increased tourism, and anthropogenic emissions from local residents (e.g., biomass burning and religious activities) played an important role in the vertical distribution characteristic of NO2 (Boxe, 2005; Chen et al., 2019). The monthly averaged vertical profiles of HONO from May to July all exhibited an exponential shape, with maximum values near the surface varying of the order of July (0.13 ppb) > May (0.07 ppb) > June (0.06 ppb). The local direct emissions from biomass burning, vehicles and soil are the main sources of the surface HONO (C. Xing et al., 2021a). Moreover, the heterogeneous reaction of NO2 on wet surfaces is another important source of HONO at different height layers (Sect. 4.2). For example, the aerosol extinction coefficient and the concentrations of H2O and NO2 were all relatively large at the bottom layer in July; correspondingly, we observed the highest concentration of HONO near the surface in this month. The monthly averaged O3 vertical profiles all showed an exponential shape from May to July, and their surface concentration varied of the order of May (66.71 ppb) > July (61.45 ppb) > June (59.55 ppb). This kind of monthly variation trend in O3 has also been reported by several previous studies (Yin et al., 2017; X. Xu et al., 2018). The O3 in Nam Co was mainly sourced from stratospheric intrusion, photochemical reactions, long-range transport and local vertical mixing (Yin et al., 2017; Chen et al., 2019).
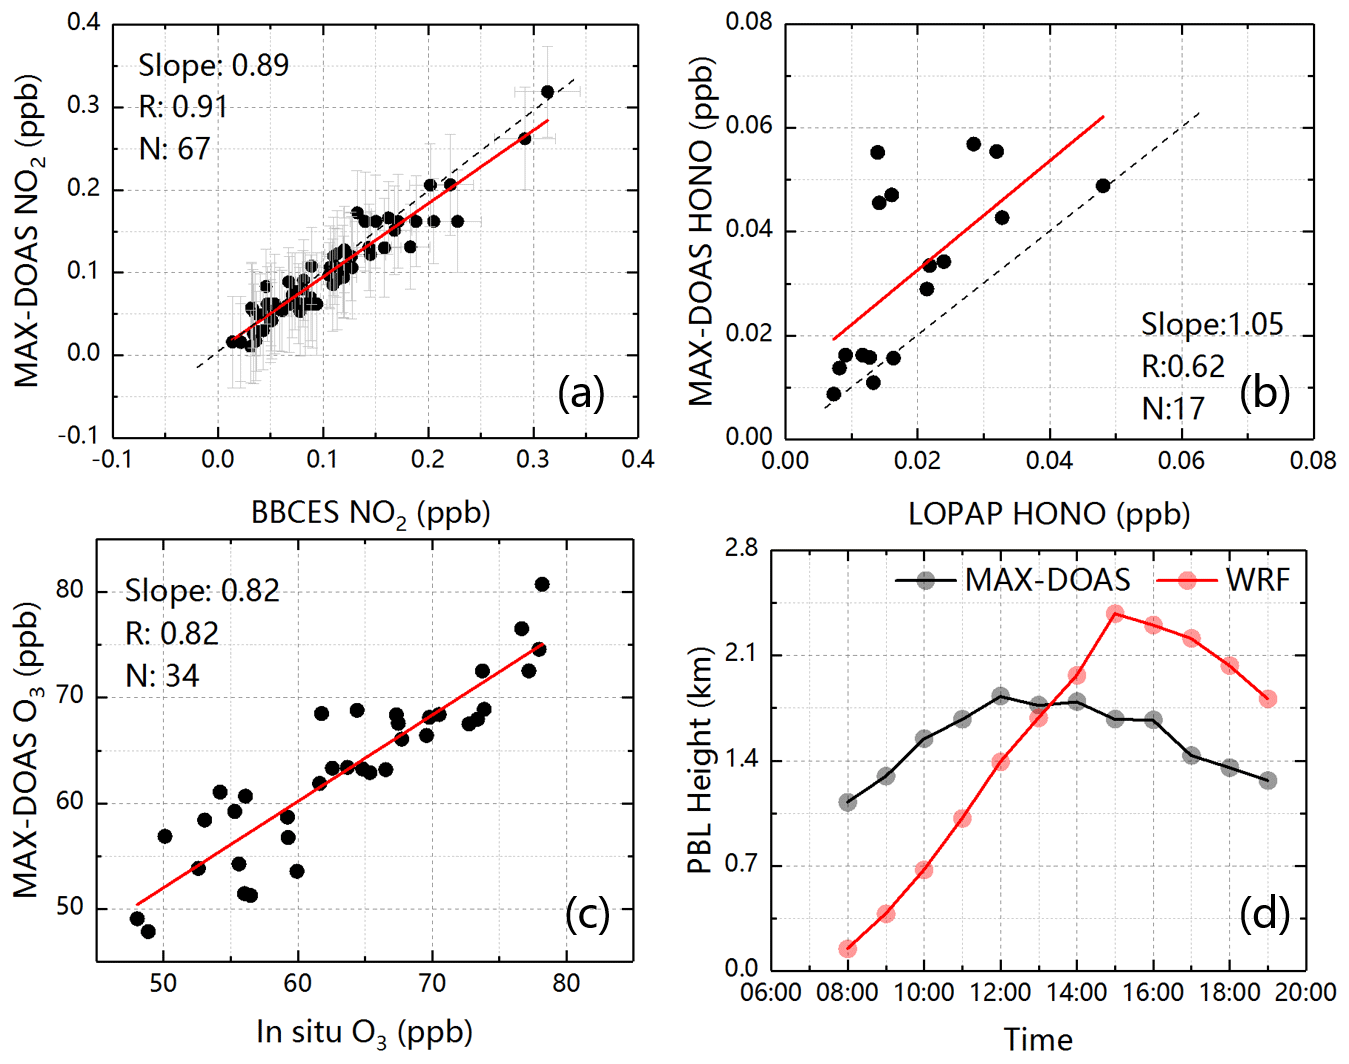
Figure 6Validations of (a) the MAX-DOAS NO2 vs. in situ NO2 (the error bars represent the retrieved errors of NO2 from MAX-DOAS and BBCES), (b) the MAX-DOAS HONO vs. LOPAP HONO, (c) the MAX-DOAS O3 vs. in situ O3 and (d) the MAX-DOAS PBL vs. WRF PBL.
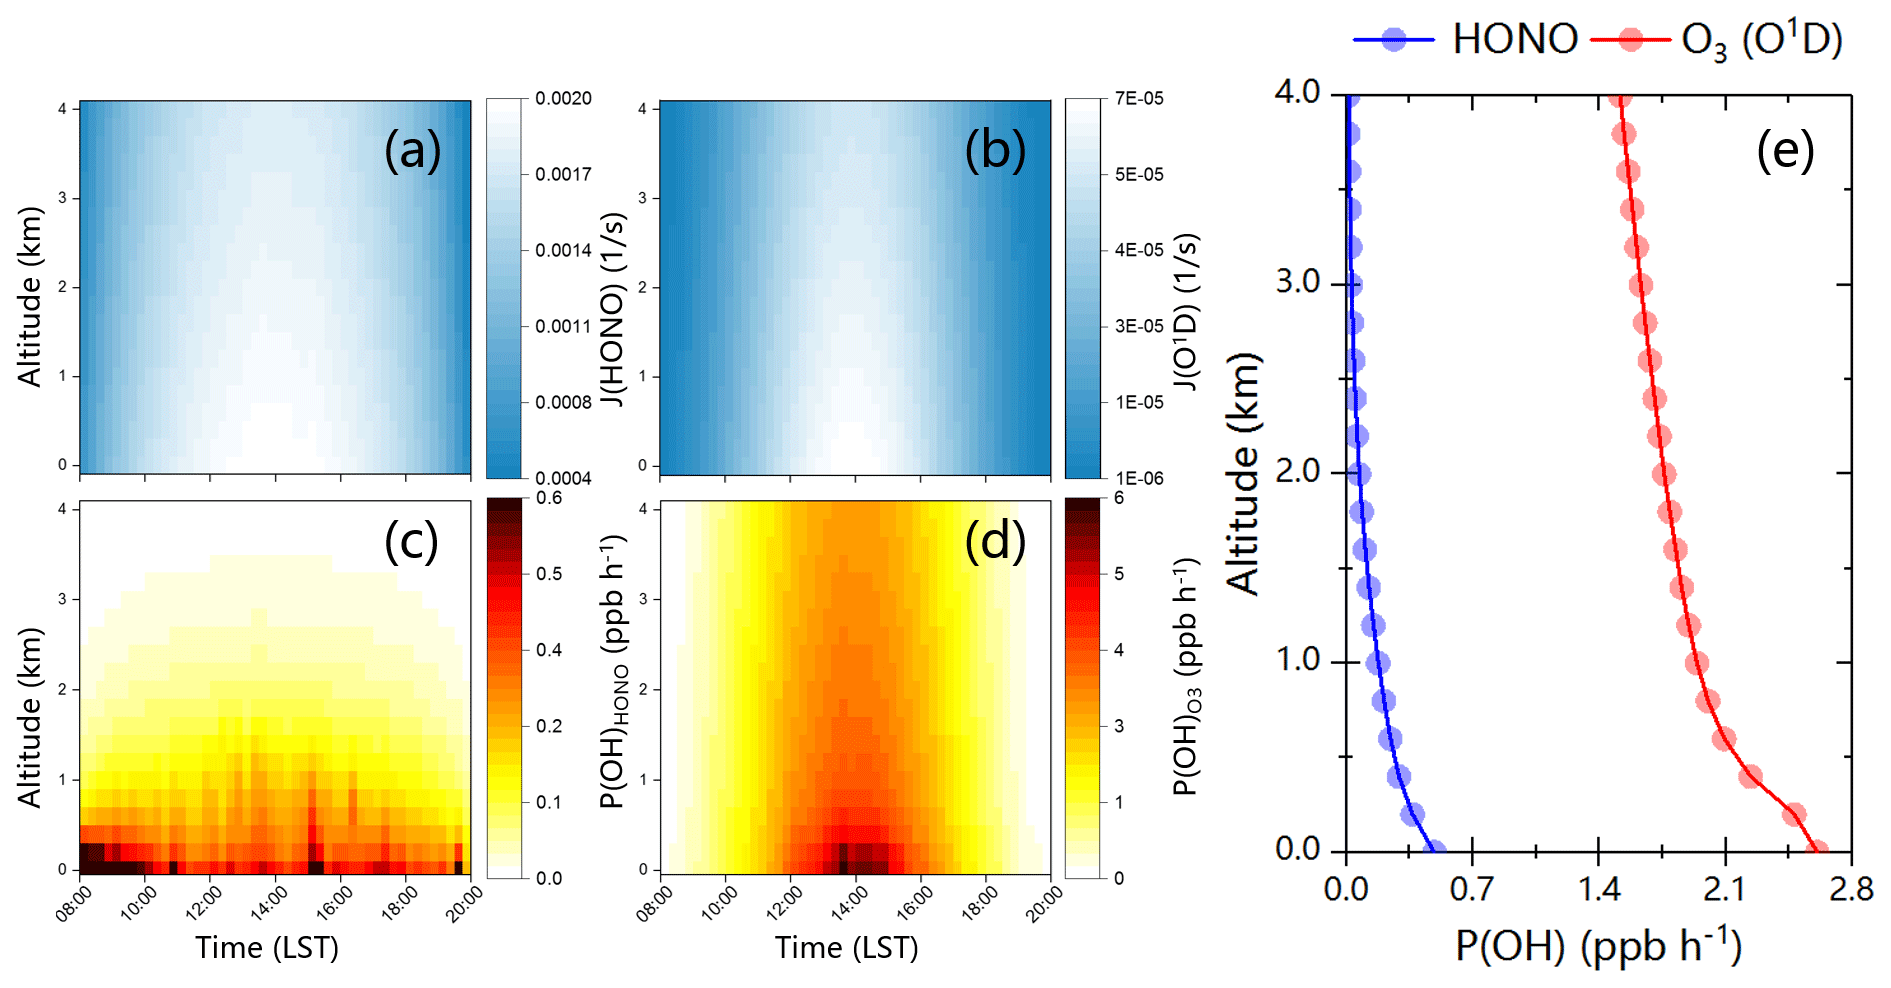
Figure 7Averaged diurnal vertical profiles of the (a) photolysis rate J(HONO), (b) photolysis rate J(O(1D)), (c) OH radical production rates from HONO photolysis and (d) OH radical production rates from O3 photolysis. Panel (e) shows the averaged vertical profiles of OH radical production rates from HONO and O3 photolysis from 1 May to 9 July 2019.
The third row in Fig. 5 illustrates the averaged diurnal variations in the vertical profiles of aerosol, H2O, NO2, HONO and O3 from May to July 2019. Aerosol mainly distributed under 1.0 km, especially at 0.6 km, and its mixing height gradually increased with the rise in the PBL height after 12:00. Moreover, the diurnal variation in aerosol showed a bi-peak pattern, which was in line with the investigation reported by Pokharel et al. (2019). The first peak occurred between 08:00–10:00, and another appeared after 15:00. The first peak could be attributed to the local emission of aerosol and the diurnal cycle of PBL (Zhang et al., 2017; Pokharel et al., 2019). The second peak was driven by regional transport and the interaction between the local sandy–silt–loam surface and local meteorology. The high wind speed (> 4.5 m s−1) at the surface appeared after 15:00, which coincided with the appearance of the second aerosol peak (Fig. S3). Moreover, the high extinction during the second peak was extended to 1.0 km and was associated with wind speeds higher than 8 m s−1 (Fig. S10), which created a favorable condition for high-altitude aerosol transport. H2O mainly distributed under 1.0 km and above 3.0 km, and its diurnal variation exhibited a multi-peak pattern. The first peak appeared between 08:00–12:00, which was mainly affected by the monsoon-driven long-range transport of H2O (Cong et al., 2009; K. Xu et al., 2020). The second and third peaks occurred at 15:00–16:00 and after 17:00, respectively. In addition to long-range transport, the enhanced evaporation from the Nam Co lake also significantly contributed to the appearance of these two peaks of H2O (Xu et al., 2011). NO2 mainly distributed at 0.2–0.4 km and peaked before 10:00 and after 18:00, which was dominated by the effects of local emissions and regional transport from the NOx formed through ice and snow on the top of Mt. Tanggula under strong ultraviolet radiation (Fig. S7) (Boxe, 2005; Fisher, 2005; Chen et al., 2019; Lin et al., 2021). Moreover, its diurnal mixing height was obviously correlated to the diurnal evolution of the PBL height. HONO mainly distributed under 1.0 km, especially at 0.4 km. Its diurnal variation showed a multi-peak pattern with three obvious peaks before 10:00, during 15:00–16:00 and after 19:00. In addition to local emissions (i.e., vehicle emission, biomass burning and soil emission), the heterogeneous reaction of NO2 on wet surfaces is also an important HONO source (C. Xing et al., 2021a). We found that there were larger aerosol extinction (> 0.12 km−1) and higher concentrations of NO2 (> 0.20 ppb) and H2O (> 2.27 × 10¹⁷ molec. cm−3) around three HONO peaks. O3 mainly distributed under 0.4 km, and its diurnal variation exhibited a multi-peak pattern with three peaks appearing before 09:00, during 13:00–15:00 and after 19:00. The appearance of O3 peaks was mainly associated with the influence of the complex topography of the TP, long-range transport, local vertical mixing and stratospheric intrusion (Yin et al., 2017; Chen et al., 2019; Qian et al., 2022). The active photochemical reaction is another important source of O3, especially for its second peak at 13:00–15:00.
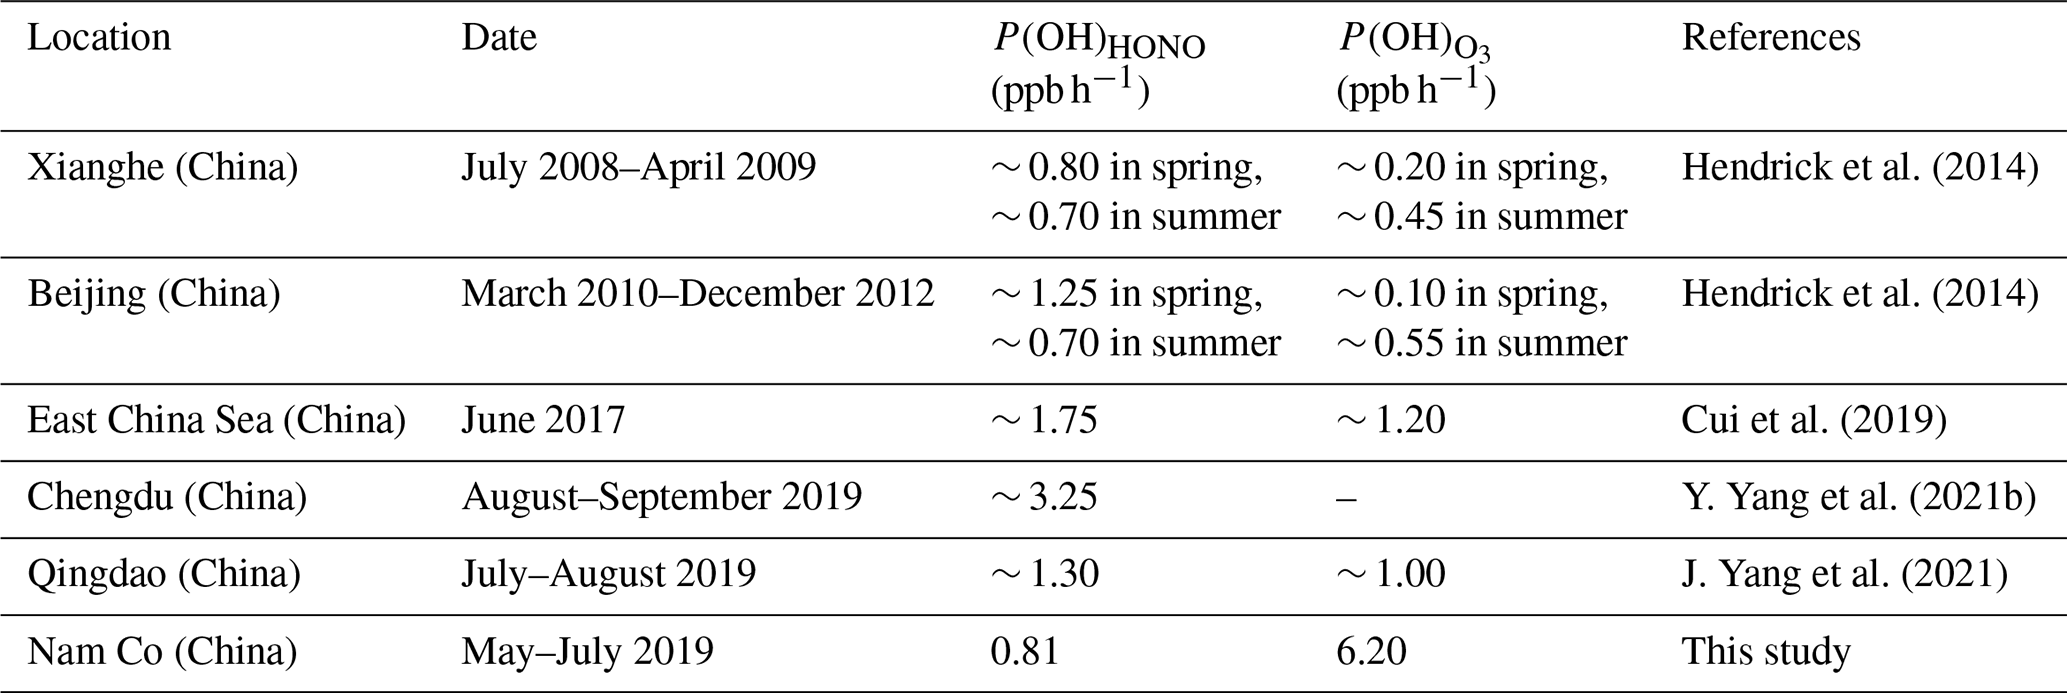
Table 3The maximum OH production rates contributed from HONO and O3 at different locations.
3.3 Validation with independent data
In order to validate the MAX-DOAS dataset, we extracted the concentrations of NO2, HONO and O3 at the bottom layer (0.0–0.1 km) from their corresponding vertical profiles to compare with in situ measurements. As shown in Fig. 6a–c, we found good agreement between MAX-DOAS and in situ observations with Pearson correlation coefficients (R) of 0.91, 0.62 and 0.82 (regression slopes of 0.89, 1.05 and 0.82) for NO2, HONO and O3, respectively. This indicated the good reliability of trace gases from MAX-DOAS retrievals. Moreover, we also compared the MAX-DOAS PBL and WRF PBL, and a similar variation trend was found. However, the WRF PBL showed a significant difference in height values compared with the MAX-DOAS PBL before 12:00. This could be due to the simulation uncertainties in the WRF model at the Tibetan Plateau with its complex topography and meteorology (Yang and Duan, 2016; Xu et al., 2019).
4.1 OH production
HONO and O3 are two important precursors of OH radicals contributing to the increase in AOC (Kleffmann et al., 2005; Ryan et al., 2018; C. Xing et al., 2021b). In order to evaluate the AOC on the TP, we tried to analyze the OH production from HONO and O3 at different height layers through vertical observations and TUV calculations. The OH production rates from HONO and O3 were calculated using the following two equations:
where J(HONO) and J(O(1D)) are the photolysis rates of HONO, and O(1D) is calculated using the TUV model. O(1D) is the product of the O3 photolysis by UV radiation, and f is the fraction of the O(1D) + H2O → 2OH process.
Figure 7a–b show the averaged diurnal vertical distributions of the photolysis rates J(HONO) and J(O(1D)) from May to July 2019. We found that the maximum J(HONO) and J(O(1D)) both appeared at the bottom layer between 12:30 and 15:30 with values of 2.0 × 10⁻³ and 6.75 × 10⁻⁵ s−1, respectively. The maximum values were usually larger than those in low-altitude areas due to the stronger solar UV radiation on the TP (Su et al., 2008; C. Xing et al., 2021a; Y. Yang et al., 2021a; T. Liu et al., 2022) but were consistent with the values on the TP reported by Lin et al. (2008). Moreover, it should be noted that the values of J(HONO) and J(O(1D)) all decreased with the increase in altitude, which is significantly different from previous studies in low-altitudes areas (Ryan et al., 2018; C. Xing et al., 2021b; Xu et al., 2021).
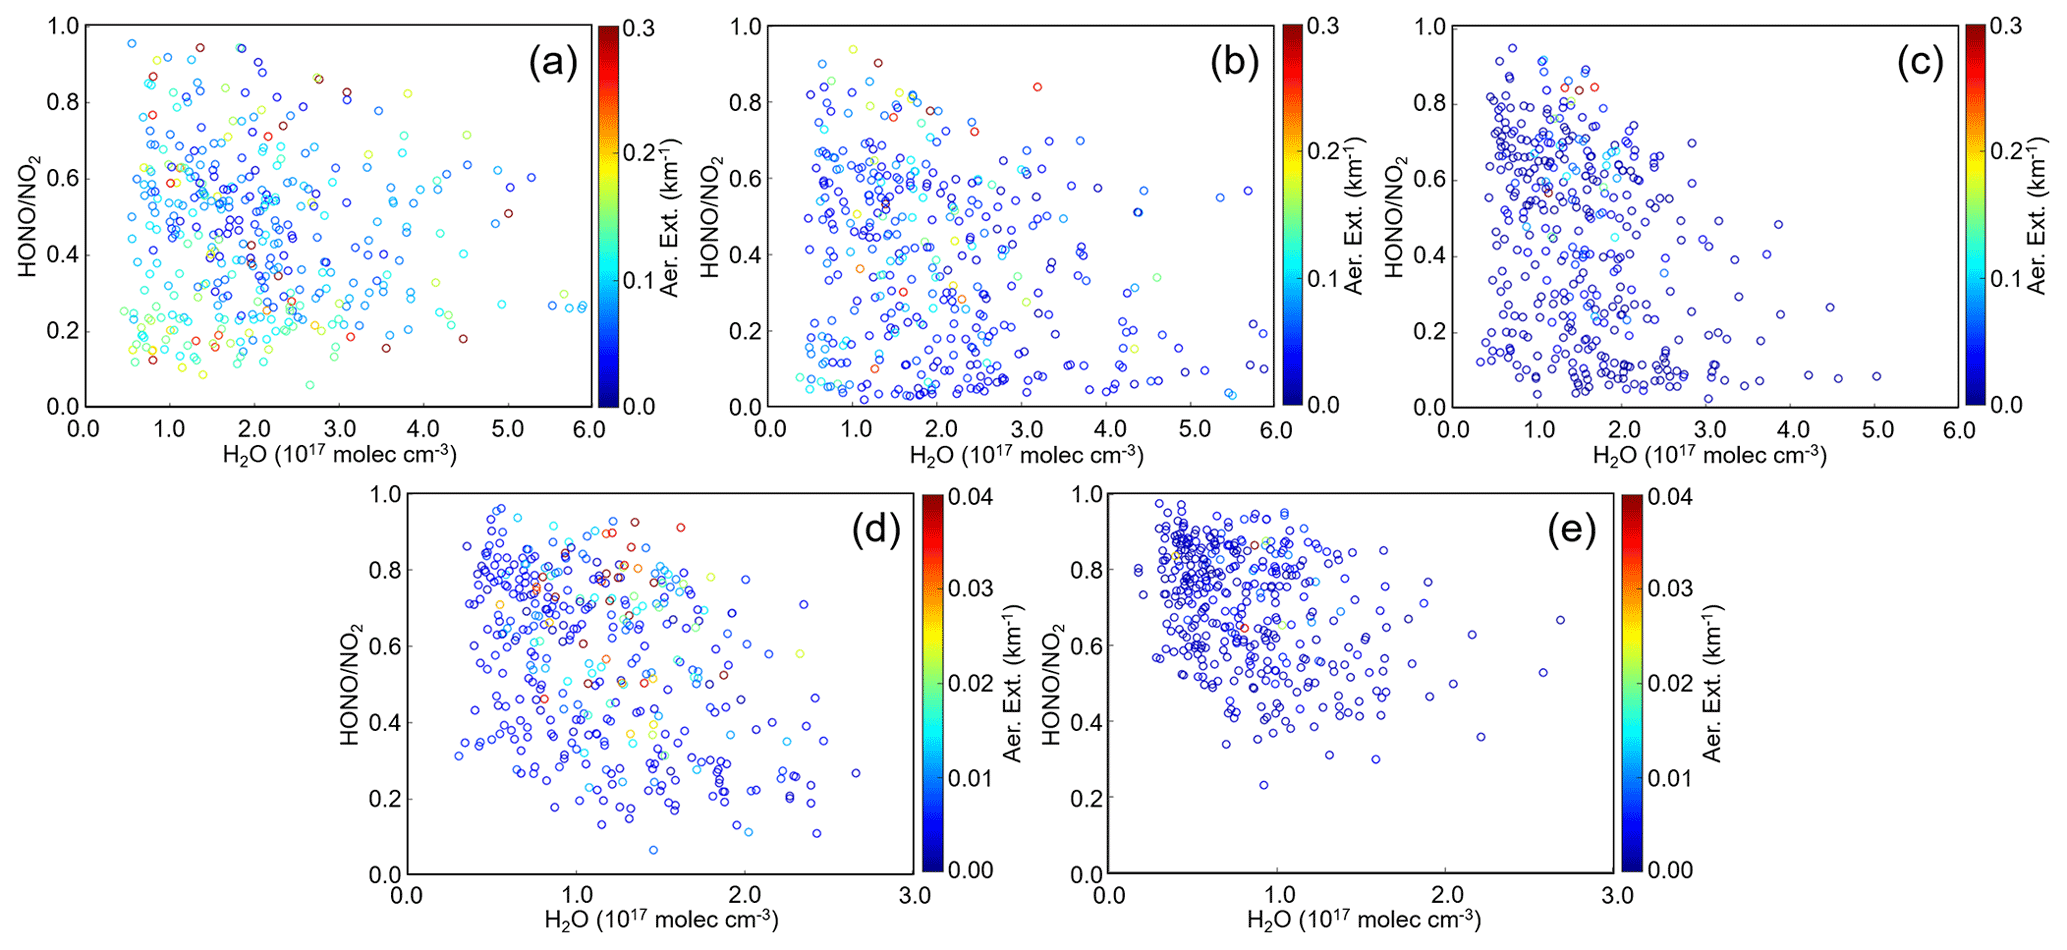
Figure 8Scatterplots between HONONO2 and H2O colored by aerosol extinction at (a) 0.0–0.2 km, (b) 0.4–0.6 km, (c) 0.8–1.0 km, (d) 1.2–1.4 km and (e) 1.6–1.8 km from 1 May to 9 July 2019.
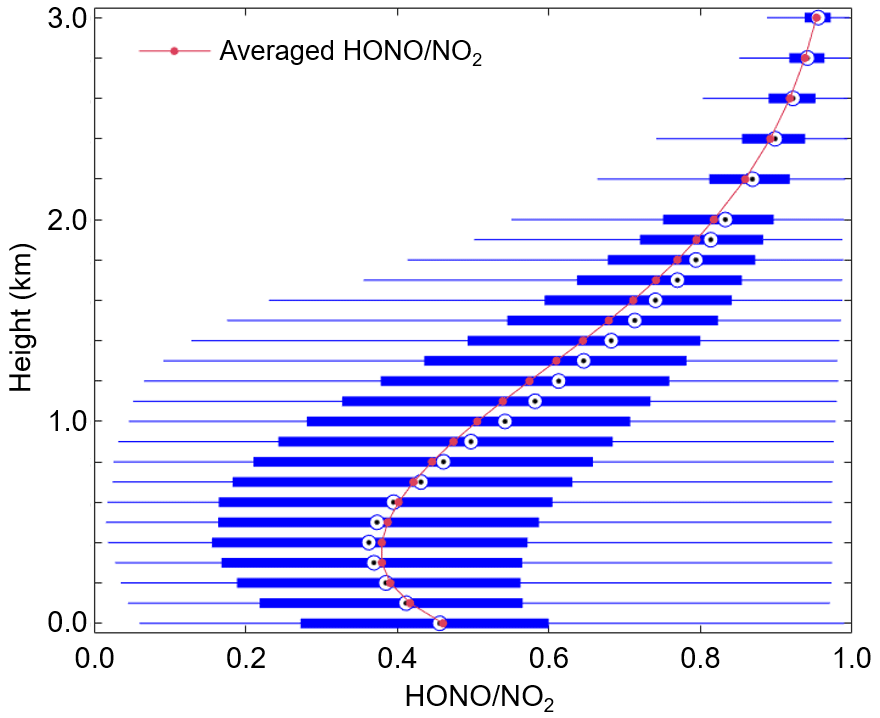
Figure 9Statistics for the vertical profile of HONONO2 from 1 May to 9 July 2019. The left and right sides of the blue box represent the 25th and 75th percentiles, respectively; the dot within the box represents the mean.
Figure 7c–d show the averaged diurnal vertical profiles of OH production rates from HONO and O3 photolysis from May to July 2019. P(OH)HONO exhibited a multi-peak pattern which mainly appeared before 10:00, during 15:00–16:00 and after 19:00 at 0–0.4 km with a maximum value of 0.81 ppb h−1, while P(OH)O3 showed a unimodal pattern occurring at 13:00–15:00 under 0.4 km with a maximum value of 6.20 ppb h−1. The averaged vertical profiles of P(OH)HONO and P(OH) during the observation are depicted in Fig. 7e. We found that the maximum values of P(OH)HONO (0.49 ppb h−1) and P(OH) (2.61 ppb h−1) all appeared at the bottom layer and decreased with height. This indicated O3 was an important contributor to OH production (> 80 %) on the TP, contributing about 5–6 times more than HONO. Moreover, the OH production rates from HONO and O3 in other cities of China are depicted in Table 3. The contribution percentage of O3 to P(OH) in Nam Co was significantly higher than that in other cities, which was due to the relatively high concentrations of O3 and H2O and the strong radiation in Nam Co. In addition, P(OH)HONO in Nam Co was close to that in relatively dry areas (i.e., Beijing and Xianghe) but slightly lower than that in areas with relatively high humidity, which can enhance the heterogeneous production of HONO (Ryan et al., 2018; Liu et al., 2019; C. Xing et al., 2021b).
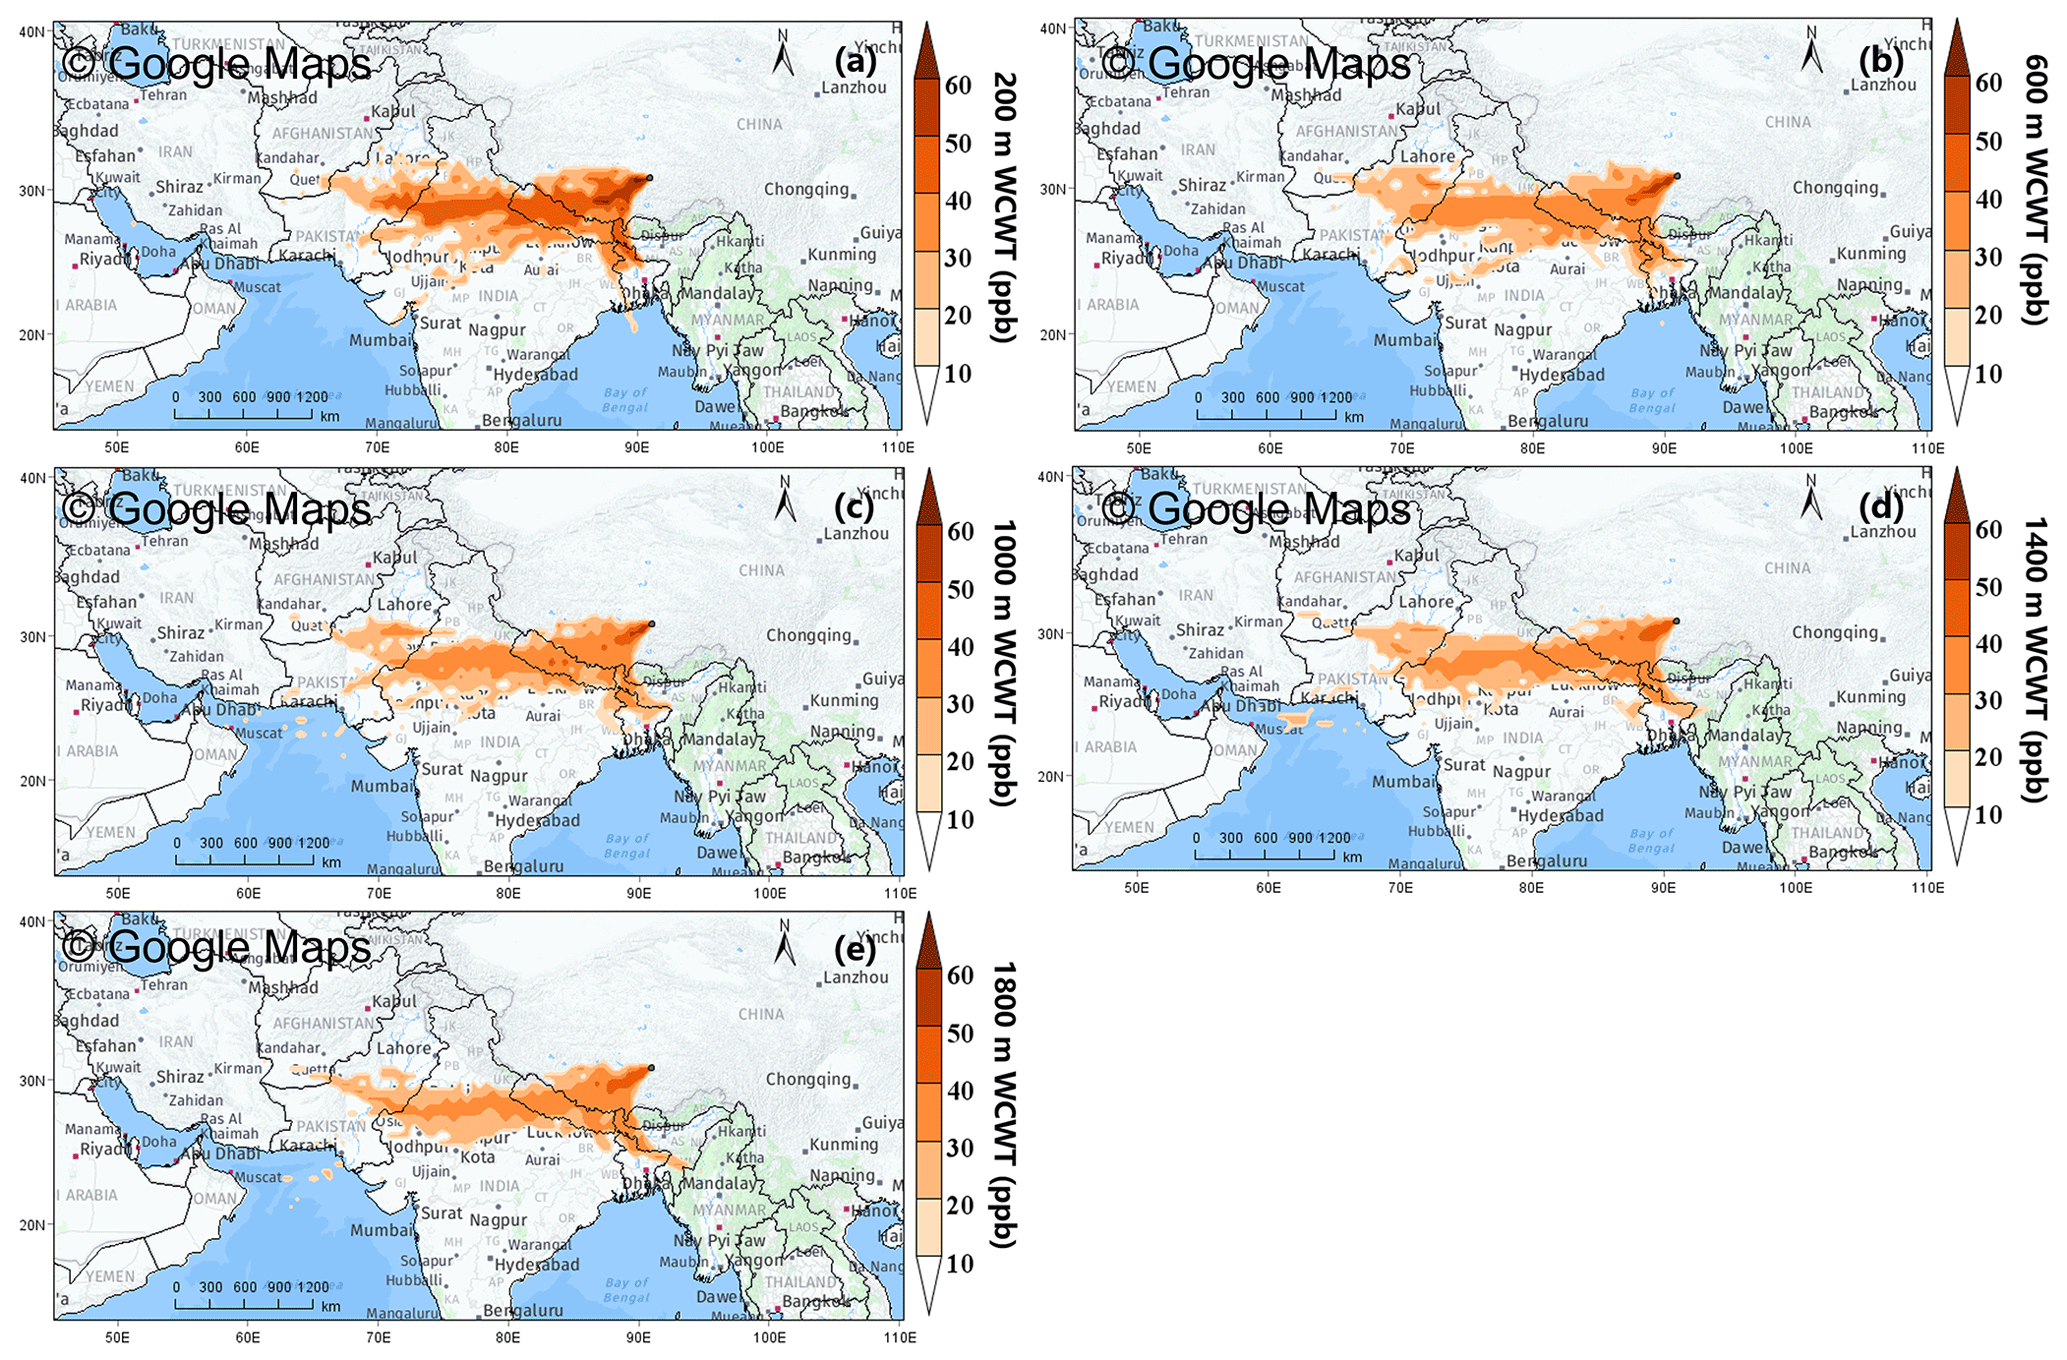
Figure 10Spatial distributions of WCWT values for O3 at the (a) 200 m, (b) 600 m, (c) 1000 m, (d) 1400 m and (e) 1800 m height layers from 1 May to 9 July 2019 over CAS (NAMORS).
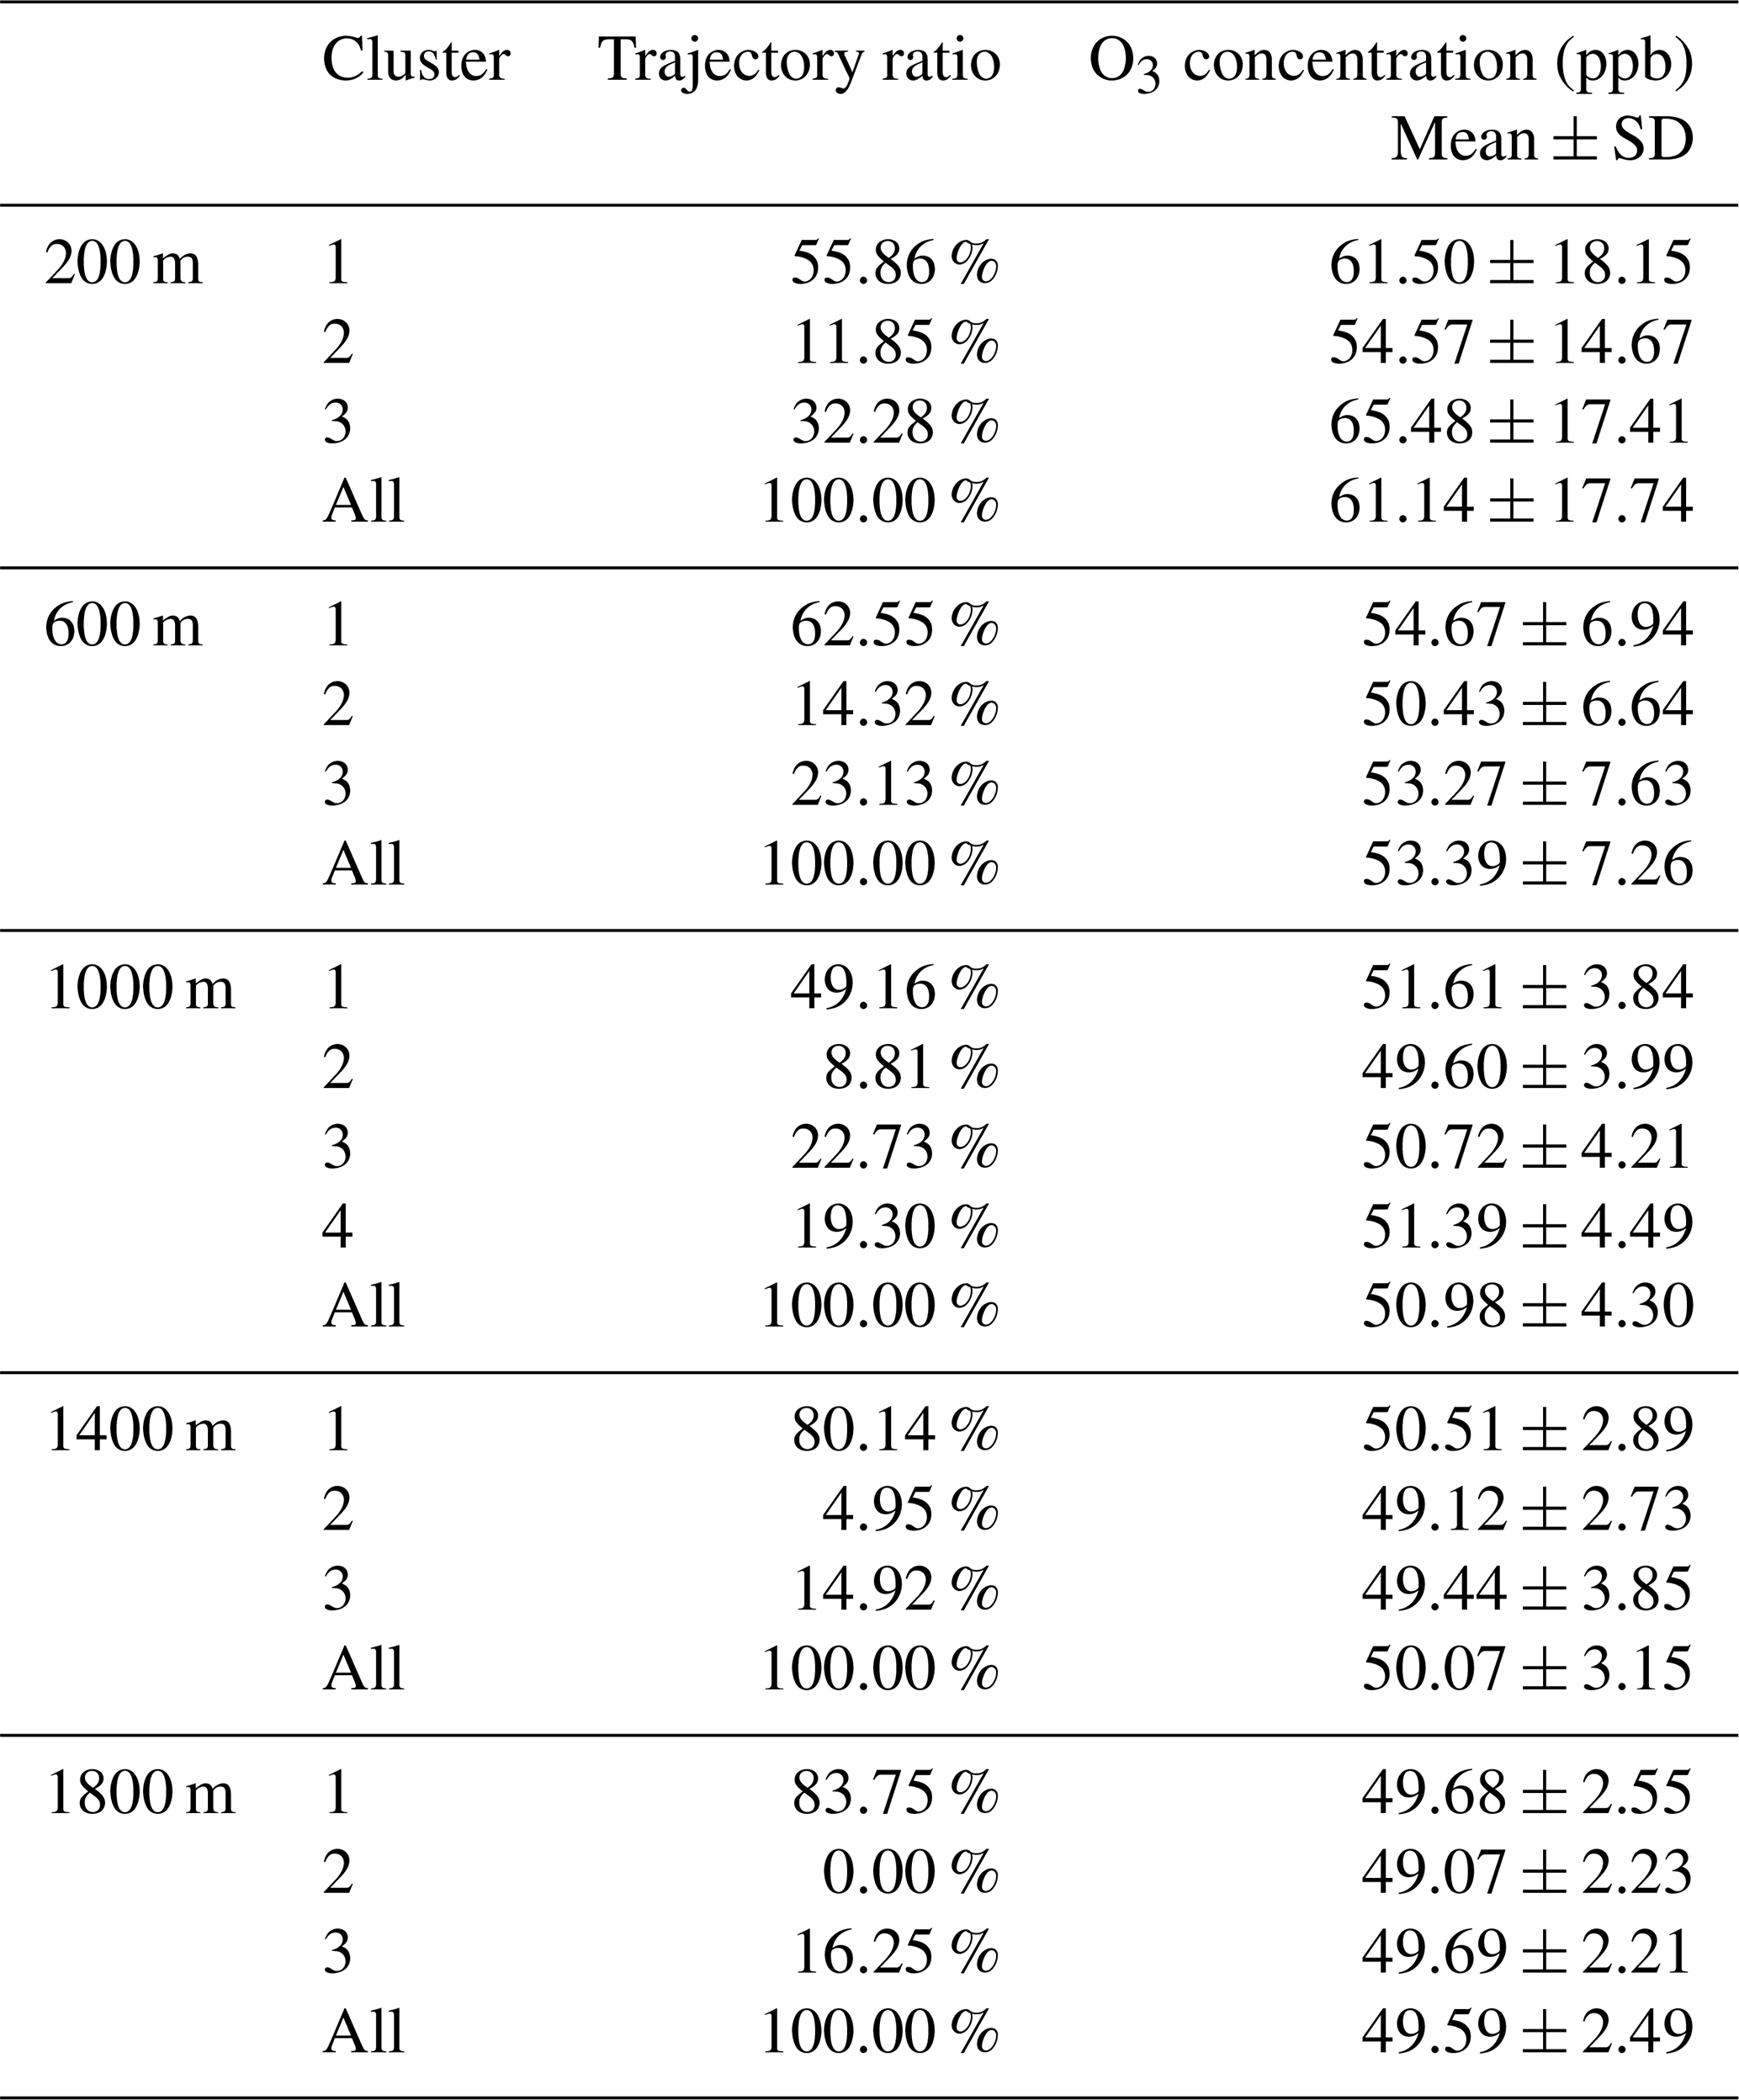
Table 4Trajectory ratios and averaged O3 concentration for all trajectory clusters arriving in Nam Co at 200, 600, 1000, 1400 and 1800 m from May to July 2019.
4.2 Possible daytime HONO sources
Atmospheric HONO is mainly sourced from direct emission, homogeneous reaction and heterogeneous reaction (Fu et al., 2019; Ren et al., 2020; Chai et al., 2021; Crilley et al., 2021; Li et al., 2021). There were less anthropogenic emissions of HONO around NAMORS; however, the open burning of crop residues and soil emissions could be important HONO sources considering the pasture environment and large amounts of animal manure (L. Cui et al., 2021). Moreover, the low levels of background NO on the TP meant that the homogeneous reaction was not the main source of HONO at NAMORS (Lin et al., 2019; C. Xing et al., 2021a; Li et al., 2022). The heterogeneous reaction of NO2 on wet surfaces became an important potential source of HONO at NAMORS, which was affected by the humidity, temperature, solar radiation, aerosol concentration and corresponding specific surface area. In order to remove the effect of diurnal PBL evolution, we used HONONO2 to indicate the extent of the heterogeneous reaction process. As shown in Fig. 8, scatterplots between HONONO2 and H2O are illustrated. We found that the maximum value of HONONO2 appeared when water vapor was around 1.0 × 10¹⁷ molec. cm−3 under 1.0 km and around 0.5–1.0 × 10¹⁷ molec. cm−3 at the 1.0–2.0 km height layer. This phenomenon of HONONO2 first increasing and then decreasing with the increase in H2O (or relative humidity) has usually been found in low-altitude areas in previous studies (Wang et al., 2013; Liu et al., 2019; C. Xing et al., 2021b; Xu et al., 2021). When H2O was greater than the abovementioned critical values at different heights, HONONO2 gradually decreased, which was related to the efficient uptake of HONO and the decrease in NO2 reactivity with the increase in H2O (Liu et al., 2019; Xu et al., 2021). This indicated H2O significantly enhances the conversion rate of NO2 to HONO. Moreover, we found that the high-value areas of HONONO2 above five height layers were all accompanied by high aerosol extinction (> 0.15 km−1 under 1.0 km and > 0.02 km−1 at 1.0–2.0 km). This indicated that the aerosol surface contributes to the heterogeneous reaction process of NO2. The scatterplots between HONO and NO2 above five layers (Fig. S11) also confirmed the possibility of the NO2 heterogeneous reaction to generate HONO on the TP and the contribution of atmospheric H2O and aerosol extinction to this process.
Figure 9 depicts the vertical profile of HONONO2 from May to July 2019. We found that HONONO2 first decreased and then increased with the increase in height, which was opposite to previous studies in low-altitude areas (Meng et al., 2020; W. Zhang et al., 2020; C. Xing et al., 2021b; Xu et al., 2021). The minimum average HONONO2 occurred at the 0.3–0.4 km height layer with a value of 0.37. The relatively high values of HONONO2 at the bottom layer could be related to the non-deducted HONO direct emissions.
4.3 Possible daytime O3 sources
In addition to the local photochemistry process, long-range transport was the main source of O3 on the TP (Yin et al., 2017; X. Xu et al., 2018). To further understand the transport pathway and potential source of O3, cluster analysis, WPSCF and WCWT models were used to assess the regional representativity of O3 at five typical heights (200, 600, 1000, 1400 and 1800 m). As shown in Fig. S12 and Table 4, the backward trajectories arriving at NAMORS during the observation were classified into three clusters at 200, 600, 1400 and 1800 m and four clusters at 1000 m. We found that cluster 3 was associated with the highest O3 concentration at 200 m (65.48 ± 17.41 ppb) and 1800 m (49.69 ± 2.21 ppb), and cluster 1 was related to the highest O3 concentration at 600 m (54.67 ± 6.94 ppb), 1000 m (51.61 ± 3.84 ppb) and 1400 m (50.51 ± 2.89 ppb). These two clusters both originated from the northwestern direction of the South Asian subcontinent and passed through the Himalayas, which was also reported by Yin et al. (2017) for the springtime period from 2011 to 2015. In Figs. S13 and 10, WPSCF and WCWT analysis revealed that the high O3 concentration at the above heights was potentially sourced from northern India, central Pakistan, Nepal, western Bhutan and northern Bangladesh through long-range transport. It should be noted that the potential contributions to O3 at NAMORS at 200 m from above potential source areas were all over 40 ppb. These contributions from the mentioned potential source areas at the four other heights were also over 20–30 ppb. The massive fire emissions during springtime were an important source of O3 in South Asia (Jena et al., 2015), and the obvious burning during the observation can be observed in Fig. S14. Moreover, the abundant precursors and high photochemical activity were other significant sources of O3 in South Asia (Kumar et al., 2012; Sharma et al., 2017).
In addition, Fig. 10 shows that the contribution of O3 transported from the Himalayas can reach up to 50 ppb, especially under 600 m. Several previous studies have revealed that the stratospheric O3 intrusion events were frequent in the Himalayas during spring and summer (Cristofanelli et al., 2010; Chen et al., 2011; Škerlak et al., 2014; Putero et al., 2016). Therefore, the O3 from stratospheric intrusions in the Himalayas can affect the O3 at NAMORS through long-range transport.
MAX-DOAS measurements were performed to clarify the vertical distributions of several atmospheric components (aerosol, H2O, NO2, HONO and O3) and to explore the AOC in vertical space in Nam Co from May to July 2019. The MAX-DOAS NO2, HONO and O3 agreed well with in situ measurements, with correlation coefficients of 0.91, 0.62 and 0.82, respectively. We found that the averaged vertical profiles of aerosol, H2O, HONO and O3 all exhibited an exponential shape, while NO2 showed a Gaussian shape with a maximum value of 0.32 ppb appearing at 300–400 m. The maximum concentrations of monthly averaged aerosol (0.17 km−1) and O3 (66.71 ppb) appeared in May, H2O (3.68 × 10¹⁷ molec. cm−3) and HONO (0.13 ppb) appeared in July, and NO2 (0.39 ppb) occurred in June. For the diurnal variation, the above five species all mainly distributed under 1.0 km, and they mostly exhibited a multi-peak pattern considering the effect of regional transport and local chemical reaction.
O3 and HONO were important sources of OH on the TP. The diurnal-averaged OH production rate from HONO during the observation exhibited a multi-peak pattern appearing before 10:00, during 15:00–16:00 and after 19:00 under 0.4 km with the maximum value of 0.81 ppb h−1. The OH production rate from O3 showed a unimodal pattern occurring at 13:00–15:00 under 0.4 km with the maximum value of 6.20 ppb h−1, which was obviously higher than that in low-altitude areas. In addition to direct emission, the heterogeneous reaction of NO2 on wet surfaces was also an important source of HONO in Nam Co. We found that HONONO2 first increased and then decreased with the increase in H2O. The maximum value of HONONO2 appeared when H2O was around 1.0 × 10¹⁷ molec. cm−3 under 1.0 km and around 1.0–2.0 × 10¹⁷ molec. cm−3 at the 1.0–2.0 km height layer. Moreover, high values of HONONO2 were usually accompanied by high aerosol extinction. O3 under 2.0 km was potentially sourced from the Himalayas, northern India, central Pakistan, Nepal, western Bhutan and northern Bangladesh through long-range transport. Our results enhance the understanding of the spatial and temporal variations in oxidation chemistry under the PBL and provide a new perspective for source analysis of major atmospheric components through vertical observation on the TP.
All measurement data used in this study can be made available for scientific purposes upon request to the authors (Cheng Liu, chliu81@ustc.edu.cn, and Chengzhi Xing, xingcz@aiofm.ac.cn).
The supplement related to this article is available online at: https://doi.org/10.5194/acp-24-10093-2024-supplement.
CX, CL and CY designed the research and organized the paper. CX wrote the paper, while CL and CY edited it. CX, JX, HW and XJ contributed to the retrieval of MAX-DOAS vertical profile data and satellite data. CX, CL, CY, JO and QH contributed to data analysis. All the abovementioned authors contributed to the revision of the paper.
The contact author has declared that none of the authors has any competing interests.
Publisher’s note: Copernicus Publications remains neutral with regard to jurisdictional claims made in the text, published maps, institutional affiliations, or any other geographical representation in this paper. While Copernicus Publications makes every effort to include appropriate place names, the final responsibility lies with the authors.
This article is part of the special issue “In-depth study of the atmospheric chemistry over the Tibetan Plateau: measurement, processing, and the impacts on climate and air quality (ACP/AMT inter-journal SI)”. It is not associated with a conference.
We would like to thank the @Tibet group for effectively organizing the Nam Co observation. We would also like to thank Peking University (Chunxiang Ye's group) and the Anhui Institute of Optics and Fine Mechanics (Weixiong Zhao's group) for providing the DOAS validation data of HONO, O3 and NO2. We thank the National Oceanic and Atmospheric Administration (NOAA) Air Resources Laboratory (ARL) for providing the open HYSPLIT transport and dispersion model.
This study was supported by the National Natural Science Foundation of China (grant nos. 42225504 and U21A2027), the Anhui Provincial Natural Science Foundation (grant no. 2108085QD180) and the Presidential Foundation of the Hefei Institutes of Physical Science under the Chinese Academy of Sciences (grant no. YZJJ2021QN06).
This paper was edited by Benjamin A. Nault and reviewed by Theodore Koenig and two anonymous referees.
Aliwell, S. R., Van Roozendael, M., Johnston, P. V., Richter, A., Wagner, T., Arlander, D. W., Burrows, J. P., Fish, D. J., Jones, R. L., Tørnkvist, K. K., Lambert, J. C., Pfeilsticker, K., and Pundt, I.: Analysis for BrO in zenith-sky spectra: an intercomparison exercise for analysis improvement, J. Geophys. Res., 107, ACH 10-1–ACH 10-20, https://doi.org/10.1029/2001JD000329, 2002.
Barnett, T. P., Adam, J. C., and Lettenmaier, D. P.: Potential impacts of a warming climate on water availability in snow-dominated regions, Nature, 438, 303–309, https://doi.org/10.1038/nature04141, 2005.
Bessho, K., Date, K., Hayashi, M., Ikeda, A., Imai, T., Inoue, H., Kumagai, Y., Miyakawa, T., Murata, H., Ohno, T., Okuyama, A., Oyama, R., Sasaki, Y., Shimazu, Y., Shimoji, K., Sumida, Y., Suzuki, M., Taniguchi, H., Tsuchiyama, H., Uesawa, D., Yokota, H., and Yoshida, R.: An Introduction to Himawari-8/9-Japan's New-Generation Geostationary Meteorological Satellites, J. Meteorol. Soc. Jan., 94, 151–183, https://doi.org/10.2151/jmsj.2016-009, 2016.
Bi, H., Chen, S., Zhao, D., Lu, F., Chen, Y., and Guan, Y.: Aerosol optical properties and its direct radiative forcing over Tibetan Plateau from 2006 to 2017, Particuology, 74, 64–73, https://doi.org/10.1016/j.partic.2022.05.007, 2023.
Bolch, T., Kulkarni, A., Kaab, A., Huggel, C., Paul, F., Cogley, J. G., Frey, H., Kargel, J. S., Fujita, K., Scheel, M., Bajracharya, S., and Stoffel, M.: The State and Fate of Himalayan Glaciers, Science, 336, 310–314, https://doi.org/10.1126/science.1215828, 2012.
Boos, W. R. and Kuang, Z.: Dominant control of the South Asian monsoon by orographic insulation versus plateau heating, Nature, 463, 218–222, https://doi.org/10.1038/nature08707, 2010.
Boxe, C.: Nitrate photochemistry and interrelated chemical phenomena in ice, California Institute of Technology, UMI 3204138, 2005.
Chai, J., Dibb, J. E., Anderson, B. E., Bekker, C., Blum, D. E., Heim, E., Jordan, C. E., Joyce, E. E., Kaspari, J. H., Munro, H., Walters, W. W., and Hastings, M. G.: Isotopic evidence for dominant secondary production of HONO in near-ground wildfire plumes, Atmos. Chem. Phys., 21, 13077–13098, https://doi.org/10.5194/acp-21-13077-2021, 2021.
Che, J. and Zhao, P.: Characteristics of the summer atmospheric boundary layer height over the Tibetan Plateau and influential factors, Atmos. Chem. Phys., 21, 5253–5268, https://doi.org/10.5194/acp-21-5253-2021, 2021.
Chen, P., Kang, S., Bai, J., Sillanpää, M., and Li, C.: Yak dung combustion aerosols in the Tibetan Plateau: Chemical characteristics and influence on the local atmospheric environment, Atmos. Res., 156, 58–66, https://doi.org/10.1016/j.atmosres.2015.01.001, 2015.
Chen, P., Kang, S., Yang, J., Pu, T., Li, C., Guo, J., and Tripathee, L.: Spatial and temporal variations of gaseous and particle pollutants in six sites in Tibet, China, during 2016-2017, Aerosol Air Qual. Res., 19, 516–527, https://doi.org/10.4209/aaqr.2018.10.0360, 2019.
Chen, X. L., Ma, Y. M., Kelder, H., Su, Z., and Yang, K.: On the behaviour of the tropopause folding events over the Tibetan Plateau, Atmos. Chem. Phys., 11, 5113–5122, https://doi.org/10.5194/acp-11-5113-2011, 2011.
Cheng, S., Ma, J., Zheng, A., Gu, M., Donner, S., Donner, S., Zhang, W., Du, J., Li, X., Liang, Z., Lv, J., and Wagner, T.: Retrieval of O3, NO2, BrO and OClO columns from ground-based zenith scattered light DOAS measurements in summer and autumn over the Northern Tibetan Plateau, Remote Sens., 13, 4242, https://doi.org/10.3390/rs13214242, 2021.
Cheng, S., Pu, G., Ma, J., Hong, H., Du, J., Yudron, T., and Wagner, T.: Retrieval of tropospheric NO2 vertical column densities from ground-based MAX-DOAS measurements in Lhasa, a city on the Tibetan Plateau, Remote Sens., 15, 4689, https://doi.org/10.3390/rs15194689, 2023a.
Cheng, S., Cheng, X., Ma, J., Xu, X., Zhang, W., Lv, J., Bai, G., Chen, B., Ma, S., Ziegler, S., Donner, S., and Wagner, T.: Mobile MAX-DOAS observations of tropospheric NO2 and HCHO during summer over the Three Rivers' Source region in China, Atmos. Chem. Phys., 23, 3655–3677, https://doi.org/10.5194/acp-23-3655-2023, 2023b.
Cong, Z., Kang, S., Smirnov, A., and Holben, B.: Aerosol optical properties at Nam Co, a remote site in central Tibetan Plateau, Atmos. Res, 92, 42–48, https://doi.org/10.1016/j.atmosres.2008.08.005, 2009.
Cong, Z., Kang, S., Kawamura, K., Liu, B., Wan, X., Wang, Z., Gao, S., and Fu, P.: Carbonaceous aerosols on the south edge of the Tibetan Plateau: concentrations, seasonality and sources, Atmos. Chem. Phys., 15, 1573–1584, https://doi.org/10.5194/acp-15-1573-2015, 2015.
Crilley, L. R., Kramer, L. J., Pope, F. D., Reed, C., Lee, J. D., Carpenter, L. J., Hollis, L. D. J., Ball, S. M., and Bloss, W. J.: Is the ocean surface a source of nitrous acid (HONO) in the marine boundary layer?, Atmos. Chem. Phys., 21, 18213–18225, https://doi.org/10.5194/acp-21-18213-2021, 2021.
Cristofanelli, P., Bracci, A., Sprenger, M., Marinoni, A., Bonafè, U., Calzolari, F., Duchi, R., Laj, P., Pichon, J. M., Roccato, F., Venzac, H., Vuillermoz, E., and Bonasoni, P.: Tropospheric ozone variations at the Nepal Climate Observatory-Pyramid (Himalayas, 5079 m a.s.l.) and influence of deep stratospheric intrusion events, Atmos. Chem. Phys., 10, 6537–6549, https://doi.org/10.5194/acp-10-6537-2010, 2010.
Cui, L., Li, R., Zhang, Y., Meng, Y., Fu, H., and Chen, J.: An observational study of nitrous acid (HONO) in Shanghai, China: The aerosol impact on HONO formation during the haze episodes, Sci. Total Environ., 630, 1057–1070, https://doi.org/10.1016/j.scitotenv.2018.02.063, 2018.
Cui, L., Li, R., Fu, H., Li, Q., Zhang, L., George, C., and Chen, J.: Formation features of nitrous acid in the offshore area of the East China Sea, Sci. Total Environ., 682, 138–150, https://doi.org/10.1016/j.scitotenv.2019.05.004, 2019.
Cui, L., Li, R., Fu, H., Meng, Y., Zhao, Y., Li, Q., and Chen, J.: Nitrous acid emission from open burning of major crop residues in mainland China, Atmos. Environ., 244, 117950, https://doi.org/10.1016/j.atmosenv.2020.117950, 2021.
Dong, Q., Huang, Z., Li, W., Li, Z., Song, X., Liu, W., Wang, T., Bi, J., and Shi, J.: Polarization lidar measurements of dust optical properties at the junction of the Taklimakan Desert-Tibetan Plateau, Remote Sens., 14, 558, https://doi.org/10.3390/rs14030558, 2022.
Draxler, R. R. and Hess, G.: An overview of the HYSPLIT_4 modelling system for trajectories, Aust. Meteorol. Mag., 47, 295–308, 1998.
Fang, B., Zhao, W., Xu, X., Zhou, J., Ma, X., Wang, S., Zhang, W., Venables, D. S., and Chen, W.: Portable broadband cavity-enhanced spectrometer utilizing Kalman filtering: application to real-time, in situ monitoring of glyoxal and nitrogen dioxide, Opt. Express, 25, 26910–26922, https://doi.org/10.1364/OE.25.026910, 2017.
Fang, X., Li, T., Ban, C., Wu, Z., Li, J., Li, F., Cen, Y., and Tian, B.: A mobile differential absorption lidar for simultaneous observations of tropospheric and stratospheric ozone over Tibet, Opt. Express, 27, 4126–4139, https://doi.org/10.1364/OE.27.004126, 2019.
Fisher, F. N.: Extinction of UV-visible radiation in wet midlatitude (maritime) snow: Implications for increased NOx emission, J. Geophys. Res., 110, D21301, https://doi.org/10.1029/2005JD005963, 2005.
Fleischmann, O. C., Hartmann, M., Burrows, J. P., and Orphal, J.: New ultraviolet absorption cross-sections of BrO at atmospheric temperatures measured by time-windowing Fourier transform spectroscopy, J. Photoch. Photobio. A, 168, 117–132, 2004.
Fu, X., Wang, T., Zhang, L., Li, Q., Wang, Z., Xia, M., Yun, H., Wang, W., Yu, C., Yue, D., Zhou, Y., Zheng, J., and Han, R.: The significant contribution of HONO to secondary pollutants during a severe winter pollution event in southern China, Atmos. Chem. Phys., 19, 1–14, https://doi.org/10.5194/acp-19-1-2019, 2019.
Gao, M., Gao, J., Zhu, B., Kumar, R., Lu, X., Song, S., Zhang, Y., Jia, B., Wang, P., Beig, G., Hu, J., Ying, Q., Zhang, H., Sherman, P., and McElroy, M. B.: Ozone pollution over China and India: seasonality and sources, Atmos. Chem. Phys., 20, 4399–4414, https://doi.org/10.5194/acp-20-4399-2020, 2020.
Griffin, D., Zhao, X., Mclinden, C. A., Boersma, F., Bourassa, A., Dammers, E., Degenstein, D., Eskes, H., Fehr, L., Fioletov, V., Hayden, K., Kharol, S. K., Li, S., Makar, P., Martin, R. V., Mihele, C., Mittermeier, R. L., Krotkov, N., Sneep, M., Lamsal, L. N., ter Linden, M., van Geffen, J., Veefkind, P., and Wolde, M.: High-Resolution Mapping of Nitrogen Dioxide With TROPOMI: First Results and Validation Over the Canadian Oil Sands, Geophys. Res, Lett., 46, 1049–1060, https://doi.org/10.1029/2018GL081095, 2018.
Hendrick, F., Müller, J.-F., Clémer, K., Wang, P., De Mazière, M., Fayt, C., Gielen, C., Hermans, C., Ma, J. Z., Pinardi, G., Stavrakou, T., Vlemmix, T., and Van Roozendael, M.: Four years of ground-based MAX-DOAS observations of HONO and NO2 in the Beijing area, Atmos. Chem. Phys., 14, 765–781, https://doi.org/10.5194/acp-14-765-2014, 2014.
Hong, Q., Liu, C., Hu, Q., Xing, C., Tan, W., Liu, H., Huang, Y., Zhu, Y., Zhang, J., Geng, T., and Liu, J.: Evolution of the vertical structure of air pollutants during winter heavy pollution episodes: The role of regional transport and potential sources, Atmos. Res., 228, 106–222, https://doi.org/10.1016/j.atmosres.2019.05.016, 2019.
Hsu, Y. K., Holsen, T. M., and Hopke, P. K.: Comparison of hybrid receptor models to locate PCB sources in Chicago, Atmos. Environ., 37, 545–562, https://doi.org/10.1016/S1352-2310(02)00886-5, 2003.
Huang, J., Minnis, P., Yi, Y., Tang, Q., Wang, X., Hu, Y., Liu, Z., Ayers, K., Trepte, C., and Winker, D.: Summer dust aerosols detected from CALIPSO over the Tibetan Plateau, Geophys. Res. Lett., 34, L18805, https://doi.org/10.1029/2007GL029938, 2007.
Jena, C., Ghude, S. D., Pfister, G. G., Chate, D. M., Kumar, R., Beig, G., Surendran, D. E., Fadnavis, S., and Lal, D. M.: Influence of springtime biomass burning in South Asia on regional ozone (O3): A model based case study, Atmos. Environ., 100, 37–47, https://doi.org/10.1016/j.atmosenv.2014.10.027, 2015.
Ji, X., Liu, C., Wang, Y., Hu, Q., Lin, H., Zhao, F., Xing, C., Tang, G., Zhang, J., and Wagner, T.: Ozone profiles without blind area retrieved from MAX-DOAS measurements and comprehensive validation with multi-platform observations. Remote Sens. Environ., 284, 113339, https://doi.org/10.1016/j.res.2022.113339, 2023.
Kang, S., Chen, P., Li, C., Liu, B., and Cong, Z.: Atmospheric Aerosol Elements over the Inland Tibetan Plateau: Concentration, Seasonality, and Transport, Aerosol Air Qual. Res., 16, 789–800, https://doi.org/10.4209/aaqr.2015.05.0307, 2016.
Kang, S., Zhang, Y., Chen, P., Guo, J., Zhang, Q., Cong, Z., Kaspari, S., Tripathee, L., Gao, T., Niu, H., Zhong, X., Chen, X., Hu, Z., Li, X., Li, Y., Neupane, B., Yan, F., Rupakheti, D., Gul, C., Zhang, W., Wu, G., Yang, L., Wang, Z., and Li, C.: Black carbon and organic carbon dataset over the Third Pole, Earth Syst. Sci. Data, 14, 683–707, https://doi.org/10.5194/essd-14-683-2022, 2022.
Kang, S. C., Huang, J., Wang, F. Y., Zhang, Q. G., Zhang, Y. L., Li, C. L., Wang, L., Chen, P. F., Sharma, C. M., Li, Q., Sillanpaa, M., Hou, J. Z., Xu, B. Q., and Guo, J. M.: Atmospheric Mercury Depositional Chronology Reconstructed from Lake Sediments and Ice Core in the Himalayas and Tibetan Plateau, Environ. Sci. Technol., 50, 2859–2869, https://doi.org/10.1021/acs.est.5b04172, 2016.
Kleffmann, J. and Wiesen, P.: Technical Note: Quantification of interferences of wet chemical HONO LOPAP measurements under simulated polar conditions, Atmos. Chem. Phys., 8, 6813–6822, https://doi.org/10.5194/acp-8-6813-2008, 2008.
Kleffmann, J., Gavriloaiei, T., Hofzumahaus, A., Holland, F., Koppmann, R., Rupp, L., Schlosser, E., Siese, M., and Wahner, A.: Daytime formation of nitrous acid: A major source of OH radicals in a forest, Geophys. Res. Lett., 32, L05818, https://doi.org/10.1029/2005GL022524, 2005.
Kumar, R., Naja, M., Pfister, G. G., Barth, M. C., Wiedinmyer, C., and Brasseur, G. P.: Simulations over South Asia using the Weather Research and Forecasting model with Chemistry (WRF-Chem): chemistry evaluation and initial results, Geosci. Model Dev., 5, 619–648, https://doi.org/10.5194/gmd-5-619-2012, 2012.
Lei, Y., Yang, K., Wang, B., Sheng, Y., Bird, B. W., Zhang, G., and Tian, L.: Response of inland lake dynamics over the Tibetan Plateau to climate change, Clim. Chang., 125, 281–290, https://doi.org/10.1007/s10584-014-1175-3, 2014.
Lei, Y., Zhu, Y., Wang, B., Yao, T., Yang, K., Zhang, X., Zhai, J., and Ma, N.: Extreme lake level changes in the Tibetan Plateau associated with the 2015/2016 El Niño, Geophys. Res. Lett., 46, 5889–5898, https://doi.org/10.1029/2019GL081946, 2019.
Li, C., Zou, Q., Xu, X., and Gao, S.: Water vapor transport around the Tibetan Plateau and its effect on summer rainfall over the Yangtze River valley, J. Meteorol. Res., 30, 472–482, https://doi.org/10.1007/s13351-016-5123-1, 2016a.
Li, C., Bosch, C., Kang, S., Andersson, A., Chen, P., Zhang, Q., Cong, Z., Chen, B., Qin, D., and Gustafsson, O.: Sources of black carbon to the Himalayan-Tibetan Plateau glaciers, Nat. Commun., 7, 12574, https://doi.org/10.1038/ncomms12574, 2016b.
Li, M., Mao, J., Chen, S., Bian, J., Bai, Z., Wang, X., Chen, W., and Yu, P.: Significant contribution of lightning NOx to summertime surface O3 on the Tibetan Plateau, Sci, Total, Environ., 829, 154639, https://doi.org/10.1016/j.scitotenv.2022.154639, 2022.
Li, R., Zhao, Y., Zhou, W., Meng, Y., Zhang, Z., and Fu, H.: Developing a novel hybrid model for the estimation of surface 8 h ozone (O3) across the remote Tibetan Plateau during 2005–2018, Atmos. Chem. Phys., 20, 6159–6175, https://doi.org/10.5194/acp-20-6159-2020, 2020.
Li, S., Song, W., Zhan, H., Zhang, Y., Zhang, X., Li, W., Tong, S., Pei, C., Wang, Y., Chen, Y., Huang, Z., Zhang, R., Zhu, M., Fang, H., Wu, Z., Wang, J., Luo, S., Fu, X., Xiao, S., Huang, X., Zeng, J., Zhang, H., Chen, D., Gligorovski, S., Ge, M., George, C., and Wang, X.: Contribution of vehicle emission and NO2 surface conversion to nitrous acid (HONO) in urban environments: Implications from tests in a tunnel, Environ. Sci. Technol., 55, 15616–15624, https://doi.org/10.1021/acs.est.1c00405, 2021.
Lin, F., Liu, C., Hu, X., Fu, Y., Zheng, X., Wang, R., Zhang, W., and Cao, G.: Characterizing nitric oxide emissions from two typical alpine ecosystems, J. Environ. Sci., 77, 312–322, https://doi.org/10.1016/j.jes.2018.08.011, 2019.
Lin, H., Liu, C., Xing, C., Hu, Q., Hong, Q., Liu, H., Li, Q., Tan, W., Ji, X., Wang, Z., and Liu, J.: Validation of water vapor vertical distributions retrieved from MAX-DOAS over Beijing, China. Remote Sens., 12, 3193, https://doi.org/10.3390/rs12193193, 2020.
Lin, W., Zhu, T., Song, Y., Zou, H., Tang, M., Tang, X., and Hu, J.: Photolysis of surface O3 and production potential of OH radicals in the atmosphere over the Tibetan Plateau, J. Geophys. Res.-Atmos., 113, D02309, https://doi.org/10.1029/2007JD008831, 2008.
Lin, W., Wang, F., Ye, C., and Zhu, T.: Observation of strong NOx release over Qiyi Glacier, China, The Cryosphere Discuss. [preprint], https://doi.org/10.5194/tc-2021-32, 2021.
Liu, J., Guan, X., Gao, Z., Huang, X., Ma, J., He, Y., and Xie, T.: Inter-decadal variability of the heat source over the Tibetan Plateau, Clim. Dynam., 58, 729–739, https://doi.org/10.1007/s00382-021-05929-z, 2022.
Liu, T., Hong, Y., Li, M., Xu, L., Chen, J., Bian, Y., Yang, C., Dan, Y., Zhang, Y., Xue, L., Zhao, M., Huang, Z., and Wang, H.: Atmospheric oxidation capacity and ozone pollution mechanism in a coastal city of southeastern China: analysis of a typical photochemical episode by an observation-based model, Atmos. Chem. Phys., 22, 2173–2190, https://doi.org/10.5194/acp-22-2173-2022, 2022.
Liu, Y., Nie, W., Xu, Z., Wang, T., Wang, R., Li, Y., Wang, L., Chi, X., and Ding, A.: Semi-quantitative understanding of source contribution to nitrous acid (HONO) based on 1 year of continuous observation at the SORPES station in eastern China, Atmos. Chem. Phys., 19, 13289–13308, https://doi.org/10.5194/acp-19-13289-2019, 2019.
Lou, S., Holland, F., Rohrer, F., Lu, K., Bohn, B., Brauers, T., Chang, C. C., Fuchs, H., Häseler, R., Kita, K., Kondo, Y., Li, X., Shao, M., Zeng, L., Wahner, A., Zhang, Y., Wang, W., and Hofzumahaus, A.: Atmospheric OH reactivities in the Pearl River Delta – China in summer 2006: measurement and model results, Atmos. Chem. Phys., 10, 11243–11260, https://doi.org/10.5194/acp-10-11243-2010, 2010.
Ma, J., Dörner, S., Donner, S., Jin, J., Cheng, S., Guo, J., Zhang, Z., Wang, J., Liu, P., Zhang, G., Pukite, J., Lampel, J., and Wagner, T.: MAX-DOAS measurements of NO2, SO2, HCHO, and BrO at the Mt. Waliguan WMO GAW global baseline station in the Tibetan Plateau, Atmos. Chem. Phys., 20, 6973–6990, https://doi.org/10.5194/acp-20-6973-2020, 2020.
Ma, Y., Hu, Z., Xie, Z., Ma, W., Wang, B., Chen, X., Li, M., Zhong, L., Sun, F., Gu, L., Han, C., Zhang, L., Liu, X., Ding, Z., Sun, G., Wang, S., Wang, Y., and Wang, Z.: A long-term (2005–2016) dataset of hourly integrated land–atmosphere interaction observations on the Tibetan Plateau, Earth Syst. Sci. Data, 12, 2937–2957, https://doi.org/10.5194/essd-12-2937-2020, 2020.
Ma, Y., Zhong, L., and Su, Z.: Energy and water cycles in the third pole, Water, 14, 1175, https://doi.org/10.3390/w14071175, 2022.
Meller, R. and Moortgat, G. K.: Temperature dependence of the absorption cross sections of formaldehyde between 223 and 323 K in the wavelength range 225–375 nm, J. Geophys. Res., 105, 7089–7101, https://doi.org/10.1029/1999JD901074, 2000.
Meng, F., Qin, M., Tang, K., Duan, J., Fang, W., Liang, S., Ye, K., Xie, P., Sun, Y., Xie, C., Ye, C., Fu, P., Liu, J., and Liu, W.: High-resolution vertical distribution and sources of HONO and NO2 in the nocturnal boundary layer in urban Beijing, China, Atmos. Chem. Phys., 20, 5071–5092, https://doi.org/10.5194/acp-20-5071-2020, 2020.
Michoud, V., Kukui, A., Camredon, M., Colomb, A., Borbon, A., Miet, K., Aumont, B., Beekmann, M., Durand-Jolibois, R., Perrier, S., Zapf, P., Siour, G., Ait-Helal, W., Locoge, N., Sauvage, S., Afif, C., Gros, V., Furger, M., Ancellet, G., and Doussin, J. F.: Radical budget analysis in a suburban European site during the MEGAPOLI summer field campaign, Atmos. Chem. Phys., 12, 11951–11974, https://doi.org/10.5194/acp-12-11951-2012, 2012.
Neupane, B., Kang, S., Chen, P., Zhang, Y., Ram, K., Rupakheti, D., Tripathee, L., Sharma, C. M., Cong, Z., Li, C., Hou, J., Xu, M., and Thapa, P.: Historical black carbon reconstruction from the lake sediments of the Himalayan-Tibetan Plateau, Environ. Sci. Technol., 53, 5641–5651, https://doi.org/10.1021/acs.est.8b07025, 2019.
Ou, J., Hu, Q., Liu, H., Hong, Q., Xing, C., Tan, W., Lin, H., Wang, X., Xu, H., Zhu, P., and Liu, W.: Vertical characterization and potential sources of aerosols in different seasons over the Yangtze River Delta using ground-based MAX-DOAS, Environ. Pollut., 279, 116898, https://doi.org/10.1016/j.envpol.2021.116898, 2021.
Pokharel, M., Guang, J., Liu, B., Kang, S., Ma, Y., Holben, B. N., Xia, X., Xin, J., Ram, K., Rupakheti, D., Wan, X., Wu, G., Bhattarai, H., Zhao, C., and Cong, Z.: Aerosol properties over Tibetan Plateau from a decade of AERONET measurements: Baseline, types, and influencing factors, J. Geophys. Res.-Atmos., 124, 13357–13374, https://doi.org/10.1029/2019JD031293, 2019.
Putero, D., Cristofanelli, P., Sprenger, M., Škerlak, B., Tositti, L., and Bonasoni, P.: STEFLUX, a tool for investigating stratospheric intrusions: application to two WMO/GAW global stations, Atmos. Chem. Phys., 16, 14203–14217, https://doi.org/10.5194/acp-16-14203-2016, 2016.
Qian, Y., Wang, H., Zhao, C., Zhao, C., Chen, S., Hu, X., and Kang, S.: Understanding third pole atmospheric dynamics and land surface processes and their associations with the cryosphere, air quality, and climate change, Adv. Atmos. Sci., 39, 1017–1020, https://doi.org/10.1007/s00376-022-2004-7, 2022.
Qu, B., Zhang, Y., Kang, S., and Sillanpää, M.: Water quality in the Tibetan Plateau: Major ions and trace elements in rivers of the “Water Tower of Asia”, Sci. Total Environ., 649, 571–581, https://doi.org/10.1016/j.scitotenv.2018.08.316, 2019.
Ran, L., Deng, Z., Wu, Y., Li, J., Bai, Z., Lu, Y., Zhuoga, D., and Bian, J.: Measurement report: Vertical profiling of particle size distributions over Lhasa, Tibet – tethered balloon-based in situ measurements and source apportionment, Atmos. Chem. Phys., 22, 6217–6229, https://doi.org/10.5194/acp-22-6217-2022, 2022.
Rawat, P. and Naja, M.: Remote sensing study of ozone, NO2, and CO: some contrary effects of SARS-CoV-2 lockdown over India, Environ. Sci. Pollut. Res., 29, 22515–22530, https://doi.org/10.1007/s11356-021-17441-2, 2022.
Ren, Y., Stieger, B., Spindler, G., Grosselin, B., Mellouki, A., Tuch, T., Wiedensohler, A., and Herrmann, H.: Role of the dew water on the ground surface in HONO distribution: a case measurement in Melpitz, Atmos. Chem. Phys., 20, 13069–13089, https://doi.org/10.5194/acp-20-13069-2020, 2020.
Rodgers, C. D.: Inverse methods for atmospheric sounding: theory and practice, World Scientific Publishing, Singapore-New Jersey-London-Hong Kong, ISBN 9789810227401, 2000.
Rothman, L. S., Gordon, I. E., Barbe, A., Benner, D. C., Bernath, P. E., Birk, M., Boudon, V., Brown, L. R., Campargue, A., Champion, J. P., Chance, K., Coudert, L. H., Dana, V., Devi, V. M., Fally, S., Flaud, J. M., Gamache, R. R., Goldman, A., Jacquemart, D., Kleiner, I., Lacome, N., Lafferty, W. J., Mandin, J. Y., Massie, S. T., Mikhailenko, S. N., Miller, C. E., Moazzen-Ahmadi, N., Naumenko, O. V., Nikitin, A. V., Orphal, J., Perevalov, V. I., Perrin, A., Predoi-Cross, A., Rinsland, C. P., Rotger, M., Simeckova, M., Smith, M. A. H., Sung, K., Tashkun, S. A., Tennyson, J., Toth, R. A., Vandaele, A. C., and Vander Auwera, J.: The HITRAN 2008 molecular spectroscopic database, J. Quant. Spectrosc. Ra., 110, 533–572, 2009.
Ryan, R. G., Rhodes, S., Tully, M., Wilson, S., Jones, N., Frieß, U., and Schofield, R.: Daytime HONO, NO2 and aerosol distributions from MAX-DOAS observations in Melbourne, Atmos. Chem. Phys., 18, 13969–13985, https://doi.org/10.5194/acp-18-13969-2018, 2018.
Seidel, D. J., Ao, C. O., and Li, K.: Estimating climatological planetary boundary layer heights from radiosonde observations: Comparison of methods and uncertainty analysis, J. Geophys. Res., 115, D16113, https://doi.org/10.1029/2009JD013680, 2010.
Serdyuchenko, A., Gorshelev, V., Weber, M., Chehade, W., and Burrows, J. P.: High spectral resolution ozone absorption cross-sections – Part 2: Temperature dependence, Atmos. Meas. Tech., 7, 625–636, https://doi.org/10.5194/amt-7-625-2014, 2014.
Sharma, A., Ojha, N., Pozzer, A., Mar, K. A., Beig, G., Lelieveld, J., and Gunthe, S. S.: WRF-Chem simulated surface ozone over south Asia during the pre-monsoon: effects of emission inventories and chemical mechanisms, Atmos. Chem. Phys., 17, 14393–14413, https://doi.org/10.5194/acp-17-14393-2017, 2017.
Shi, G., Yang, L., Wang, Y., Kobayashi, K., Zhu, J., Tang, H., Pan, S., Chen, T., Liu, G., and Wang, Y.: Impact of elevated ozone concentration on yield of four Chinese rice cultivars under fully open-air filed conditions, Agr. Ecosys. Environ., 131, 178–184, https://doi.org/10.1016/j.agee.2009.01.009, 2009.
Škerlak, B., Sprenger, M., and Wernli, H.: A global climatology of stratosphere–troposphere exchange using the ERA-Interim data set from 1979 to 2011, Atmos. Chem. Phys., 14, 913–937, https://doi.org/10.5194/acp-14-913-2014, 2014.
Stutz, J., Kim, E. S., Platt, U., Bruno, P., Perrino, C., and Febo, A.: UV-visible absorption cross sections of nitrous acid. J. Geophys. Res.-Atmos., 105, 14585–14592, https://doi.org/10.1029/2000JD900003, 2000.
Su, H., Cheng, Y., Shao, M., Gao, D., Yu, Z., Zeng, L., Slanina, J., Zhang, Y., and Wiedensohler, A.: Nitrous acid (HONO) and its daytime sources at a rural site during the 2004 PRIDE-PRD experiment in China, J. Geophys. Res., 113, D14312, https://doi.org/10.1029/2007JD009060, 2008.
Su, W., Liu, C., Chan, K. L., Hu, Q., Liu, H., Ji, X., Zhu, Y., Liu, T., Zhang, C., Chen, Y., and Liu, J.: An improved TROPOMI tropospheric HCHO retrieval over China, Atmos. Meas. Tech., 13, 6271–6292, https://doi.org/10.5194/amt-13-6271-2020, 2020.
Sun, Y., Yin, H., Cheng, Y., Zhang, Q., Zheng, B., Notholt, J., Lu, X., Liu, C., Tian, Y., and Liu, J.: Quantifying variability, source, and transport of CO in the urban areas over the Himalayas and Tibetan Plateau, Atmos. Chem. Phys., 21, 9201–9222, https://doi.org/10.5194/acp-21-9201-2021, 2021.
Thalman, R. and Volkamer, R.: Temperature dependent absorption cross-sections of O2-O2 collision pairs between 340 and 630 nm and at atmospherically relevant pressure, Phys. Chem. Chem. Phys., 15, 15371–15381, https://doi.org/10.1039/C3CP50968K, 2013.
Vandaele, A. C., Hermans, C., Simon, P. C., Carleer, M., Colin, R., Fally, S., Mérienne, M. F., Jenouvrier, A., and Coquart, B.: Measurements of the NO2 absorption cross section from 42 000 cm−1 to 10 000 cm−1 (238–1000 nm) at 220 K and 294 K, J. Quant. Spectrosc. Ra., 59, 171–184, https://doi.org/10/1016/S0022-4073(97)00168-4, 1998.
Veefkind, J. P., de Haan, J. F., Brinksma, E. J., Kroon, M., and Levelt, P. F.: Total Ozone From the Ozone Monitoring Instrument (OMI) Using the DOAS Technique, IEEE T. Geosci. Remote Sens., 44, 1239–1244, https://doi.org/10.1109/TGRS.2006.871204, 2004.
Volkamer, R., Spietz, P., Burrows, J., and Platt, U.: High-resolution absorption cross-section of glyoxal in the UV-vis and IR spectral ranges, J. Photochem. Photobiol. A Chem., 172, 35–46, https://doi.org/10.1016/j.jphotochem.2004.11.011, 2005.
Wagner, T., Dix, B., FriedeBurg, C. V., Frieß, U., Sanghavi, S., Sinreich, R., and Platt, U.: MAX-DOAS O4 measurements: A new technique to derive information on atmospheric aerosols-Principles and information content, J. Geophys. Res.-Atmos., 109, D22205, https://doi.org/10.1029/2004jd004904, 2004.
Wan, X., Kang, S., Wang, Y., Xin, J., Liu, B., Guo, Y., Wen, T., Zhang, G., and Cong, Z.: Size distribution of carbonaceous aerosols at a high-altitude site on the central Tibetan Plateau (Nam Co Station, 4730 m a.s.l.), Atmos. Res., 153, 155–164, https://doi.org/10.1016/j.atmosres.2014.08.008, 2015.
Wang, K., Hattori, S., Lin, M., Ishino, S., Alexander, B., Kamezaki, K., Yoshida, N., and Kang, S.: Isotopic constraints on atmospheric sulfate formation pathways in the Mt. Everest region, southern Tibetan Plateau, Atmos. Chem. Phys., 21, 8357–8376, https://doi.org/10.5194/acp-21-8357-2021, 2021.
Wang, S., Zhou, R., Zhao, H., Wang, Z., Chen, L., and Zhou, B.: Long-term observation of atmospheric nitrous acid (HONO) and its implication to local NO2 levels in Shanghai, China, Atmos. Environ., 77, 718–724, https://doi.org/10.1016/j.atmosenv.2013.05.071, 2013.
Wang, T., Xue, L., Brimblecombe, P., Lam, Y, Li, L. and Zhang, L.: Ozone pollution in China: A review of concentrations, meteorological influences, chemical precursors, and effects, Sci. Total Environ., 575, 1582–1596, https://doi.org/10.1016/j.scitotenv.2016.10.081, 2017.
Wang, Y., Zhang, X., and Arimoto, R.: The contribution from distant dust sources to the atmospheric particulate matter loading at XiAn, China during spring, Sci. Total Environ., 368, 875–883, 2006.
Wang, Y., Lampel, J., Xie, P., Beirle, S., Li, A., Wu, D., and Wagner, T.: Ground-based MAX-DOAS observations of tropospheric aerosols, NO2, SO2 and HCHO in Wuxi, China, from 2011 to 2014, Atmos. Chem. Phys., 17, 2189–2215, https://doi.org/10.5194/acp-17-2189-2017, 2017.
Wang, Y., Pukite, J., Wagner, T., Donner, S.; Beirle, S., Hilboll, A., Vrekoussis, M., Richter, A., Apituley, A., Piters, A., Allaart, M., Eskes, H., Frumau, A., van Roozendael, M., Lampel, J., Platt, U., Schmitt, S., Swart, D., and Vonk, J.: Vertical profles of tropospheric ozone from MAX-DOAS measurement during the CINDI-2 campaign: part 1 – Development of a new retrieval algorithm. J. Geophys. Res.-Atmos. 123, 10637–10670, https://doi.org/10.1029/2018JD028647, 2018.
Wang, Y., Apituley, A., Bais, A., Beirle, S., Benavent, N., Borovski, A., Bruchkouski, I., Chan, K. L., Donner, S., Drosoglou, T., Finkenzeller, H., Friedrich, M. M., Frieß, U., Garcia-Nieto, D., Gómez-Martín, L., Hendrick, F., Hilboll, A., Jin, J., Johnston, P., Koenig, T. K., Kreher, K., Kumar, V., Kyuberis, A., Lampel, J., Liu, C., Liu, H., Ma, J., Polyansky, O. L., Postylyakov, O., Querel, R., Saiz-Lopez, A., Schmitt, S., Tian, X., Tirpitz, J.-L., Van Roozendael, M., Volkamer, R., Wang, Z., Xie, P., Xing, C., Xu, J., Yela, M., Zhang, C., and Wagner, T.: Inter-comparison of MAX-DOAS measurements of tropospheric HONO slant column densities and vertical profiles during the CINDI-2 campaign, Atmos. Meas. Tech., 13, 5087–5116, https://doi.org/10.5194/amt-13-5087-2020, 2020.
Ward Jr., J. H.: Hierarchical grouping to optimize an objective function, J. Am. Stat. Assoc., 58, 236–244, 1963.
Xia, X., Zong, X., Cong, Z., Chen, H., Kang, S., and Wang, P.: Baseline continental aerosol over the central Tibetan plateau and a case study of aerosol transport from South Asia, Atmos. Environ., 45, 7370–7378, https://doi.org/10.1016/j.atmosenv.2011.07.067, 2011.
Xing, C., Liu, C., Wang, S., Chan, K. L., Gao, Y., Huang, X., Su, W., Zhang, C., Dong, Y., Fan, G., Zhang, T., Chen, Z., Hu, Q., Su, H., Xie, Z., and Liu, J.: Observations of the vertical distributions of summertime atmospheric pollutants and the corresponding ozone production in Shanghai, China, Atmos. Chem. Phys., 17, 14275–14289, https://doi.org/10.5194/acp-17-14275-2017, 2017.
Xing, C., Liu, C., Wang, S., Hu, Q., Liu, H., Tan, W., Zhang, W., Li, B., and Liu, J.: A new method to determine the aerosol optical properties from multiple-wavelength O4 absorptions by MAX-DOAS observation, Atmos. Meas. Tech., 12, 3289–3302, https://doi.org/10.5194/amt-12-3289-2019, 2019.
Xing, C., Liu, C., Hu, Q., Fu, Q., Lin, H., Wang, S., Su, W., Wang, W., Javed, Z., and Liu, J.: Identifying the wintertime sources of volatile organic compounds (VOCs) from MAX-DOAS measured formaldehyde and glyoxal in Chongqing, Southwest China, Sci. Total Environ., 715, 136258 https://doi.org/10.1016/j.scitotenv.2019.136258, 2020.
Xing, C., Liu, C., Wu, H., Lin, J., Wang, F., Wang, S., and Gao, M.: Ground-based vertical profile observations of atmospheric composition on the Tibetan Plateau (2017–2019), Earth Syst. Sci. Data, 13, 4897–4912, https://doi.org/10.5194/essd-13-4897-2021, 2021a.
Xing, C., Liu, C., Hu, Q., Fu, Q., Wang, S., Lin, H., Zhu, Y., Wang, S., Wang, W., Javed, Z., Ji, X., and Liu, J.: Vertical distributions of wintertime atmospheric nitrogenous compounds and the corresponding OH radicals production in Leshan, southwest China, J. Environ. Sci., 105, 44–55, https://doi.org/10.1016/j.jes.2020.11.019, 2021b.
Xing, L., Bei, N., Guo, J., Wang, Q., Liu, S., Han, Y., Pongpiachan, S., and Li, G.: Impacts of biomass burning in peninsular southeast Asia on PM2.5 concentration and ozone formation in southeastern China during springtime – A case study, J. Geophys. Res.-Atmos., 126, e2021JD034908, https://doi.org/10.1029/2021JD034908, 2021.
Xu, K., Zhong, L., Ma, Y., Zou, M., and Huang, Z.: A study on the water vapor transport trend and water vapor sources of the Tibetan Plateau, Theor. Appl. Climatol., 140, 1031–1042, https://doi.org/10.1007/s00704-020-03142-2, 2020.
Xu, L., Liu, H., Du, Q., and Xu, X.: The assessment of the planetary boundary layer schemes in WRF over the central Tibetan Plateau, Atmos. Res., 230, 104644, https://doi.org/10.1016/j.atmosres.2019.104644, 2019.
Xu, R., Tie, X., Li, G., Zhao, S., Cao, J., Feng, T., and Long, X.: Effect of biomass burning on black carbon (BC) in South Asia and Tibetan Plateau: The analysis of WRF-Chem modeling, Sci. Total Environ., 645, 901–912, https://doi.org/10.1016/j.scitotenv.2018.07.165, 2018.
Xu, S., Wang, S., Xia, M., Lin, H., Xing, C., Ji, X., Su, W., Tan, W., Liu, C., and Hu, Q.: Observations by ground-based MAX-DOAS of the vertical characters of winter pollution and the influencing factors of HONO generation in Shanghai, China, Remote Sens., 13, 3518, https://doi.org/10.3390/rs13173518, 2021.
Xu, X., Zhang, H., Lin, W., Wang, Y., Xu, W., and Jia, S.: First simultaneous measurements of peroxyacetyl nitrate (PAN) and ozone at Nam Co in the central Tibetan Plateau: impacts from the PBL evolution and transport processes, Atmos. Chem. Phys., 18, 5199–5217, https://doi.org/10.5194/acp-18-5199-2018, 2018.
Xu, X., Wu, H., Yang, X., and Xie, L.: Distribution and transport characteristics of dust aerosol over Tibetan Plateau and Taklimakan Desert in China using MERRA-2 and CALIPSO data, Atmos. Environ., 237, 117670, https://doi.org/10.1016/j.atmosenv.2020.117670, 2020.
Xu, X., Sun, C., Chen, D., Zhao, T., Xu, J., Zhang, S., Li, J., Chen, B., Zhao, Y., Xu, H., Dong, L., Sun, X., and Zhu, Y.: A vertical transport window of water vapor in the troposphere over the Tibetan Plateau with implications for global climate change, Atmos. Chem. Phys., 22, 1149–1157, https://doi.org/10.5194/acp-22-1149-2022, 2022.
Xu, Y., Kang, S., Zhang, Y., and Zhang, Y.: A method for estimating the contribution of evaporative vapor from Nam Co to local atmospheric vapor based on stable isotopes of water bodies, Chinese Sci. Bull., 56, 1511–1517, https://doi.org/10.1007/s11434-011-4467-2, 2011.
Xue, C., Zhang, C., Ye, C., Liu, P., Catoire, V., Krysztofiak, G., Chen, H., Ren, Y., Zhao, X., Wang, J., Zhang, F., Zhang, C., Zhang, J., An, J., Wang, T., Chen, J., Kleffmann, J., Mellouki, A., and Mu, Y.: HONO budget and its role in nitrate formation in rural North China Plain, Environ. Sci. Technol., 54, 18, 11048–11057, https://doi.org/10.1021/acs.est.0c01832, 2020.
Yanai, M., Li, C., and Song, Z.: Seasonal Heating of the Tibetan Plateau and Its Effects on the Evolution of the Asian Summer Monsoon, J. Meteorol. Soc. Jpn. Ser. II, 70, 319–351, https://doi.org/10.2151/jmsj1965.70.1B_319, 1992.
Yang, J. and Duan, K.: Effects of initial drivers and land use on WRF modeling for near-surface fields and atmospheric boundary layer over the northeastern Tibetan Plateau, Adv. Meteorol., 2016, 7849249, https://doi.org/10.1155/2016/7849249, 2016.
Yang, J., Duan, K., Kang, S., Shi, P., and Ji, Z.: Potential feedback between aerosols and meteorological conditions in a heavy pollution event over the Tibetan Plateau and Indo-Gangetic Plain, Clim. Dynam., 48, 2901–2917, https://doi.org/10.1007/s00382-016-3240-2, 2017.
Yang, J., Kang, S., and Ji, Z.: Critical contribution of south Asian residential emissions to atmospheric black carbon over the Tibetan plateau, Sci. Total Environ., 709, 135923, https://doi.org/10.1016/j.scitotenv.2019.135923, 2020.
Yang, J., Shen, H., Guo, M., Zhao, M., Jiang, Y., Chen, T., Liu, Y., Li, H., Zhu, Y., Meng, H., Wang, W., and Xue, L.: Strong marine-derived nitrous acid (HONO) production observed in the coastal atmosphere of northern China, Atmos. Environ., 244, 117948, https://doi.org/10.1016/j.atmosenv.2020.117948, 2021.
Yang, J., Kang, S., Hu, Y., Chen, X., and Rai, M.: Influence of South Asian biomass burning on ozone and aerosol concentrations over the Tibetan Plateau, Adv. Atmos. Sci., 39, 1184–1197, https://doi.org/10.1007/s00376-022-1197-0, 2022.
Yang, K., Koike, T., and Yang, D.: Surface flux parameterization in the Tibetan Plateau, Bound.-Lay. Meteorol., 106, 245–262, https://doi.org/10.1023/A:1021152407334, 2003.
Yang, Y., Wang, Y., Huang, W., Yao, D., Zhao, S., Wang, Y., Ji, D., Zhang, R., and Wang, Y.: Parameterized atmospheric oxidation capacity and speciated OH reactivity over a suburban site in the North China Plain: A comparative study between summer and winter, Sci. Total Environ., 773, 145264, https://doi.org/10.1016/j.scitotenv.2021.145264, 2021a.
Yang, Y., Li, X., Zu, K., Lian, C., Chen, S., Dong, H., Feng, M., Liu, H., Liu, J., Lu, K., Lu, S., Ma, X., Song, D., Wang, W., Yang, S., Yang, X., Yu, X., Zhu, Y., Zeng, L., Tan, Q., and Zhang, Y.: Elucidating the effect of HONO and O3 pollution by a case study in southwest China, Sci. Total Environ., 756, 144127, https://doi.org/10.1016/j.scitotenv.2020.144127, 2021b.
Ye, C.: The first constraint of atmospheric oxidative capacity in Namco, a background Tibetan Plateau research site, AGU Fall Meeting Abstracts, 2019, A51C-08, 2019.
Ye, D. Z. and Gao, Y. X.: The Meteorology of the Tibetan Plateau, Science Press, Beijing, 278 pp., 39–48, ISBN: 978-81-86627-92-1, 1979 (in Chinese).
Yin, X., Kang, S., de Foy, B., Cong, Z., Luo, J., Zhang, L., Ma, Y., Zhang, G., Rupakheti, D., and Zhang, Q.: Surface ozone at Nam Co in the inland Tibetan Plateau: variation, synthesis comparison and regional representativeness, Atmos. Chem. Phys., 17, 11293–11311, https://doi.org/10.5194/acp-17-11293-2017, 2017.
Yu, J., Meng, L., Chen, Y., Zhang, H., and Liu, J.: Ozone profiles, precursors, and vertical distribution in urban Lhasa, Tibetan Plateau, Remote Sens., 14, 2533, https://doi.org/10.3390/rs14112533, 2022.
Zhang, J., Xia, X., and Wu, X.: First in situ UV profile across the UTLS accompanied by ozone measurement over the Tibetan Plateau, J. Environ. Sci., 98, 71–76, https://doi.org/10.1016/j.jes.2020.05.020, 2020.
Zhang, L., Guo, X., Zhao, T., Gong, S., Xu, X., Li, Y., Luo, L., Gui, K., Wang, H., Zheng, Y., and Yin, X.: A modelling study of the terrain effects on the haze pollution in Sichuan Basin, Atmos. Environ., 196, 77–85, https://doi.org/10.1016/j.atmosenv.2018.10.007, 2019.
Zhang, W., Tong, S., Jia, C., Wang, L., Liu, B., Tang, G., Ji, D., Hu, B., Liu, Z., Li, W., Wang, Z., Liu, Y., Wang, Y., and Ge, M.: Different HONO sources for three layer at the urban area of Beijing, Environ. Sci. Technol., 54, 12870–12880, https://doi.org/10.1021/acs.est.0c02146, 2020.
Zhang, X., Ming, J., Li, Z., Wang, F., and Zhang, G.: The online measured black carbon aerosol and source orientations in the Nam Co region, Tibet, Environ. Sci. Pollut. Res., 24, 25021–25033, https://doi.org/10.1007/s11356-017-0165-1, 2017.
Zhao, F., Liu, C., Cai, Z., Liu, X., Bak, J., Kim, J., Hu, Q., Xia, C., Zhang, C., Sun, Y., Wang, W., and Liu, J.: Ozone profile retrievals from TROPOMI: Implication for the variation of tropospheric ozone during the outbreak of COVID-19 in China, Sci. Total Environ., 764, 142886, https://doi.org/10.1016/j.scitotenv.2020.142886, 2021.
Zhou, L., Zhang, X., and Zhang, J.: Temporal and spatial distributions of atmospheric hydroxyl radicals based on the observation with the aura microwave limb sounder, Science & Technology Review, 33, 69–77, 2015.
Zhou, S., Sun, F., Wang, M., Zhou, S., and Qing, Y.: Effects of atmospheric heat source on the Tibetan Plateau vortex in different stages: A case study in June 2016, Atmosphere, 13, 689, https://doi.org/10.3390/atmos13050689, 2022.
Zhu, G., Guo, H., Qin, D., Pan, H., Jia, W., and Ma, X.: Contribution of recycled moisture to precipitation in the monsoon marginal zone: Estimate based on stable isotope data, J. Hydrol., 569, 423–435, https://doi.org/10.1016/j.jhydrol.2018.12.014, 2019.
Zhu, J., Xia, X., Che, H., Wang, J., Cong, Z., Zhao, T., Kang, S., Zhang, X., Yu, X., and Zhang, Y.: Spatiotemporal variation of aerosol and potential long-range transport impact over the Tibetan Plateau, China, Atmos. Chem. Phys., 19, 14637–14656, https://doi.org/10.5194/acp-19-14637-2019, 2019.