the Creative Commons Attribution 4.0 License.
the Creative Commons Attribution 4.0 License.
 | 12 Sep 2024
Microphysical processes involving the vapour phase dominate in simulated low-level Arctic clouds
Davide Ori
Vera Schemann
Current general circulation models struggle to capture the phase-partitioning of clouds accurately, both overestimating and underestimating the supercooled liquid substantially. This impacts the radiative properties of clouds. Therefore, it is of interest to understand which processes determine the phase-partitioning. In this study, microphysical-process rates are analysed to study what role each phase-changing process plays in low-level Arctic clouds. Several months of cloud-resolving ICON simulations using a two-moment cloud microphysics scheme are evaluated. The microphysical-process rates are extracted using a diagnostic tool introduced here, which runs only the microphysical parameterization using previously simulated days. It was found that the processes impacting ice are more efficient during polar night than polar day. For the mixed-phase clouds (MPCs), it became clear that phase changes involving the vapour phase dominated in contrast to processes between liquid and ice. Computing the rate of the Wegener–Bergeron–Findeisen process further indicated that the MPCs frequently (42 % of the time) seemed to be glaciating. Additionally, the dependence of each process on the temperature, vertical wind, and saturation was evaluated. This showed that, in particular, the temperature influences the occurrence and interactions of different processes. This study helps to better understand how microphysical processes act in different regimes. It additionally shows which processes play an important role in contributing to the phase-partitioning in Arctic low-level mixed-phase clouds. Therefore, these processes could potentially be better targeted for improvements in the ICON model that aim to more accurately represent the phase-partitioning of Arctic low-level mixed-phase clouds.
- Article
(3535 KB) - Full-text XML
- BibTeX
- EndNote


Several studies (Ebell et al., 2020; Shupe and Intrieri, 2004; Curry and Ebert, 1992) showed the importance of clouds for the Arctic radiative budget. Clouds further play a role in different feedback mechanisms, for instance, the cloud-phase feedback (Mitchell et al., 1989), and either amplify (positive feedback) or dampen (negative feedback) the warming. As the Arctic is warming up to 4 times faster than the global average (Rantanen et al., 2022), it is of interest to know to what extent clouds play a role in this. Currently, though, the question still remains as to whether the total cloud feedback is positive or negative (Middlemas et al., 2020; Goosse et al., 2018). A specific challenge is the cloud-phase feedback as the changes in the cloud's phase-partitioning impact the cloud radiative effect (Mitchell et al., 1989; Storelvmo et al., 2015). The reason for these uncertainties regarding the cloud feedbacks stems from the difficulties of models on all scales in representing clouds, especially mixed-phase clouds (MPCs), accurately (Kay et al., 2016; Zelinka et al., 2020). These difficulties are connected to the complexity of microphysical processes in clouds and their parameterizations in models. One consequence is that many models are unable to capture the phase-partitioning in clouds correctly (Tan et al., 2016). As a result, it is hard to quantify cloud feedbacks causing uncertainties in the climate projections (Zelinka et al., 2020).
Some models struggle to represent supercooled liquid in MPCs and often underestimate it (Cesana and Chepfer, 2012; Kiszler et al., 2023a). Huang et al. (2021) link this underestimation of cloud liquid in the CESM1 model to the Wegener–Bergeron–Findeisen (WBF) process, where ice grows at the expense of liquid water due to the lower saturation required above frozen surfaces. While, sometimes, the limited spatial and temporal resolutions can cause the full glaciation of a cloud (Storelvmo and Tan, 2015), other studies showed the importance of the ice nucleation and WBF process in estimating the climate forcing of MPCs correctly (Shaw et al., 2022; McGraw et al., 2023). In contrast, Zhang et al. (2020) found an overestimation of liquid in the E3SM model after several changes, including a switch in the ice nucleation scheme and microphysical parameterization scheme. Again, this shows that the phase-partitioning and representation of cloud microphysical processes remain a challenge (Korolev et al., 2017; Morrison et al., 2020).
To understand where these uncertainties come from and to address them, many studies have used sensitivity tests by varying process parameters or aerosol concentrations, where the subsequent changes in the cloud macro- and microphysics and other model components are evaluated (e.g. Lasher-Trapp et al., 2018; Shaw et al., 2022). This can provide valuable insights but makes it hard to untangle the exact contribution of each process. Additionally, the number of feasible model runs cannot cover the full range of possible parameter changes and combinations. Another approach aims to evaluate the microphysical-process rates directly. This was done, for instance, by Gettelman et al. (2013) for a general circulation model (GCM) to look at the relative importance of microphysical processes in climate models using daily rates. In a recent paper, Barrett and Hoose (2023) used so-called microphysical pathways, which include different sets of microphysical processes, to study an idealized deep convective system. Kalesse et al. (2016) found a strong connection between the deposition rate of snow and the snow mass mixing ratio in a case study of an Arctic low-level cloud. Fan et al. (2017) studied the effect of changing the concentrations of ice-nucleating particles (INPs) and cloud condensation nuclei (CCN) on process rates, finding an increase in condensation, evaporation, deposition, sublimation, and riming with increasing aerosols. All such studies are limited by different factors, such as time and spatial resolution, idealization, or a low number of cases. So far, we are lacking detailed insights into cloud microphysical-process rates from atmospheric models which cover a large set of cases.
This study is motivated by the described uncertainties linked to cloud microphysics and by the lack of microphysical-process-rate data. To address these points, we introduce a diagnostic tool which can compute the microphysical-process rates of the commonly used two-moment microphysics scheme by Seifert and Beheng (2006) (Sect. 2.3). For the model, ICON-LEM (ICOsahedral Nonhydrostatic model in the large-eddy version; Dipankar et al., 2015) is chosen as this is a widely used model which enables cloud-resolving simulations. To reduce complexity, the focus is set on Arctic low-level clouds (LLCs) at Ny-Ålesund, Svalbard. There, LLCs frequently occur (Gierens et al., 2020; Nomokonova et al., 2019). Svalbard has an above-average occurrence of MPCs (45 %–60 %) in comparison to the rest of the Arctic (30 %–50 %; Mioche et al., 2015), making the location ideal for studying the phase-partitioning of clouds.
Several months of simulations are evaluated to provide a knowledge base that is representative for Ny-Ålesund. In the results, three different research questions are addressed:
-
Which microphysical processes determine the phase-partitioning in simulated MPCs and how frequently do they occur? This is addressed in Sect. 3.1.
-
What role does the WBF process play in the lack of supercooled liquid water? This is addressed in Sect. 3.2.
-
How do environmental conditions impact each microphysical process? This is addressed in Sect. 3.3.
These questions are aimed at understanding more about known shortcomings in the cloud representation using ICON-LEM (Kiszler et al., 2023a). Additionally, the results provide detailed insights into the way each microphysical process behaves under different temperature, vertical wind, and saturation regimes.
2.1 ICON simulations
The ICON-LEM (Dipankar et al., 2015; Heinze et al., 2017) simulations which we performed cover a circular domain with approximately 100 km diameter, centred in Ny-Ålesund (Svalbard; 78.9° N, 11.9° E), and run with approximately 600 m resolution. The general setup follows the papers by Kiszler et al. (2023a) and Schemann and Ebell (2020), and a thorough evaluation of the model performance is provided in those studies. While the general performance of the model was found to be very good, there were some shortcomings. In Kiszler et al. (2023a), it is shown that the cloud occurrence matches the observations well but that the occurrence of liquid containing clouds is underestimated by around 30 %.
The simulations are run for every day starting at 00:00 UTC and cover 24 h, although the first 3 h are excluded in the analysis to avoid the spin-up. The initial and boundary conditions for each ICON-LEM limited-area simulation are provided by an ICON-NWP simulation with 2.4 km resolution. This ICON-NWP simulation covers a larger domain and is forced by the operational German Weather Service global ICON-NWP runs. The turbulence is parameterized by a 3D Smagorinsky scheme (Dipankar et al., 2015). The two-moment scheme from Seifert and Beheng (2006), with an added hail class (Blahak, 2008), is used for the microphysics (referred to as SB). We use the Segal and Khain (2006) cloud condensation nuclei (CCN) activation with maritime aerosols, as well as the heterogeneous ice nucleation from Phillips et al. (2008), with the maritime aerosol concentrations. The output is given in the form of the vertical column above the grid cell containing Ny-Ålesund (meteogram) for every 9 s on 150 levels. This output includes the following hydrometeor mass mixing ratios and number concentrations: cloud droplets, rain, ice, snow, graupel, and hail.
2.2 Selected data
For the analysis, a subset of the data, which only includes low-level clouds, was created. This was done by first selecting all grid boxes which are cloudy using a threshold for the hydrometeor concentration of 10−8 kg kg−1 (same as in Kiszler et al., 2023a; Schemann and Ebell, 2020), above which a grid box is defined as cloudy. For a cloud to be classified as low-level, the cloud top height must be below 2.5 km (same as in Gierens et al., 2020; Chellini et al., 2022). Additionally, precipitating hydrometeors are not differentiated from non-precipitating ones. Therefore, a cloud with rain, graupel, hail, or snow that reaches the ground will have a cloud base height at the ground. Further, if there is a cloud with a cloud top height higher than 2.5 km above the low cloud, we only use these cases if the higher cloud's bottom height is at least 500 m higher than the low cloud's top height.
The frozen and liquid hydrometeors are grouped in the analysis to focus on phase transitions. The frozen mass mixing ratios (“frozen mass”, kg kg−1) are the sum of cloud ice, graupel, hail, and snow, and the liquid mass mixing ratios (“liquid mass”, kg kg−1) are the sum of cloud droplets and rain. Generally, the liquid and frozen mass mixing ratios lie between 10−8 and 10−3 kg kg−1. The occurrence of low-level clouds and their composition vary between seasons (Mioche et al., 2015). Therefore, two sets of data are used. One covers the polar night (PN, November 2021–February 2022), and one covers the polar day (PD, May–August 2021). In total, for the PN, there are around 26.3 d worth of low-level clouds, and for the PD, there are around 37.9 d. For the selection of the MPCs, only cloudy pixels where both the liquid and frozen mass are above 10−8 kg kg−1 are chosen. Of the total 23.8 d worth of MPCs, 14.1 d occur during PN, and 9.7 d occur during PD.
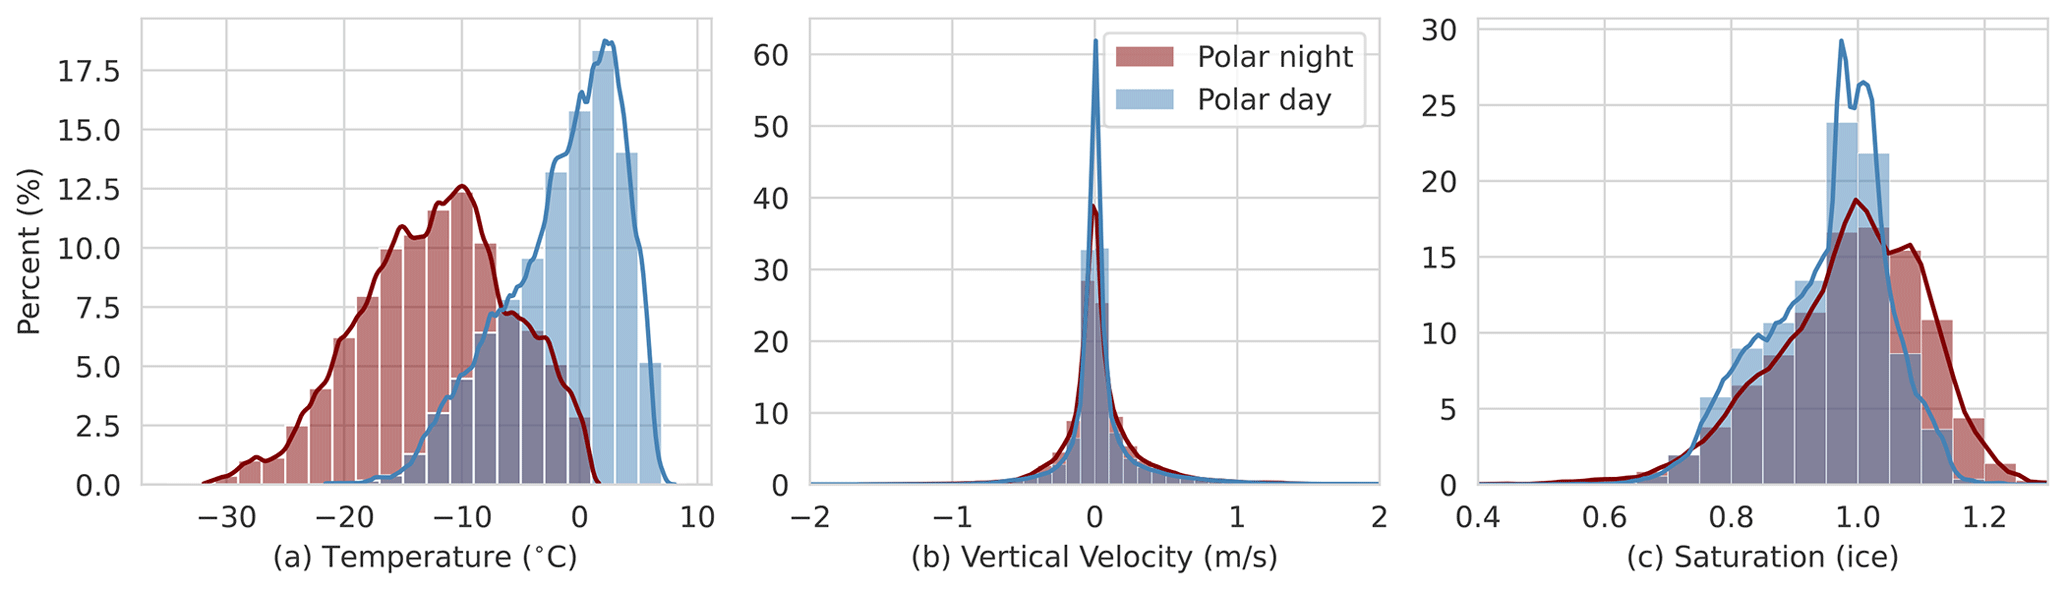
Figure 1Distribution of the temperature (a), vertical velocity (b), and ice saturation ratio (c) for the polar night (PN, red) and polar day (PD, blue).
In the analysis, the influence of the temperature, vertical velocity, and ice or water saturation on different microphysical processes is discussed. These variables were chosen as the microphysical processes are directly connected to them. As PN and PD differ strongly in parts, a short overview of the thermodynamic conditions for the selected cloudy grid points is provided here. Figure 1a–c show the distributions of the temperature, vertical velocity, and ice saturation for the PN and PD. The PN temperature ranges from −32 to 2 °C, with the mean at −14 °C. In contrast, the much warmer PD varies less (−22 to 8 °C) and has a mean value of −2 °C. The vertical velocity is narrowly arranged around 0 m s−1 for both PN and PD, and both the PD and PN show low variation (standard deviation: 0.35 m s−1 for PD, 0.29 m s−1 for PN). Extremes, which happen very rarely, are found more in the upwards motion, with the overall maximum at 6.43 m s−1. The saturation with respect to ice does not reach values as high during the PD compared to during the PN.
Of the total 26.3 d of low-level clouds during the PN, almost all of them contained periods with frozen hydrometeors (25.4 d), and slightly more than half contained liquid hydrometeors (15.5 d, 58 %). For the 37.9 d of low-level clouds during the PD, almost all of them contained liquid (96 %), while only 31 % contained ice. This is connected to the fact that liquid occurs at higher temperatures, which are more prevalent during the polar day (Fig. 1a). Another aspect to note is that, similarly to Shupe et al. (2008) and as theorized by Korolev (2008), we found that higher upward vertical velocities are connected to higher saturation and, with that, also to higher hydrometeor masses (not shown). This already hints at potential correlations between certain processes and the vertical wind and saturation which are presented in the results.
2.3 Microphysics parameterization wrapper
To extract the process rates, this study uses a “microphysical parameterization wrapper”. The goal is to provide a simple diagnostic tool with spatial and temporal flexibility. Therefore, we chose to run the two-moment SB scheme and the saturation adjustment (for condensation and evaporation) independently from the model. A meteogram (single column) or 3D output file from a previous simulation can be used as input for the wrapper. The model output is provided as input to the microphysical scheme at each time step and on the same vertical grid as used in the model. It computes a single time step, writes out the rates, and continues with the following time step. This approach allows the use of previous simulations from which the meteogram or 3D output of the required variables exists. A flowchart is shown in Fig. A1.
This approach has the clear advantage of being very fast compared to rerunning a full simulation, and one can focus on single processes. Further, outputting an entire domain of microphysical-process rates is extremely space-consuming in most cases and can be avoided by just using a spatial and/or temporal selection. Additionally, it is possible to explore potential sensitivities of microphysical processes by applying changes inside of the wrapper and using it as a test suite. As this tool is simplified and only captures a part of the model, the advantages come with some limitations. One must keep in mind that any transportation (advection and precipitation) of hydrometeors cannot be included as the model itself is not run. In this study, we are only interested in the microphysical processes. Therefore, this is not an issue.
The mass change due to a process is computed by taking the difference between the mass before and after the process and is called (ΔQproc). Here, a time step (Δt) of 3 s is used for the time integration. Therefore, the process rate is given as the hydrometeor mass mixing ratio change over 3 s and is denoted as the “tendency” (kg kg−1 3 s−1) in the following sections. A minimum threshold for the tendency of kg kg−1 3s−1 is set to avoid including numerical noise. This threshold is much lower than the threshold for the hydrometeor mass (10−8 kg kg−1) as the microphysical-process tendencies changing the mass can be very small. As mentioned before, the hydrometeors are summed up into a liquid and frozen mass. The same is done with the processes, meaning, for example, that deposition is the sum of deposition onto ice particles, snow, graupel, and hail. In this study, only processes that cause phase changes are included as we are interested in processes that contribute to the phase-partitioning. For example, frozen collisions are not evaluated as all frozen hydrometeors are summed up to a single class and compensate for each other. Many of the processes evaluated in this study have self-explanatory names. Nevertheless, a brief process summary is given here and in Table 1 to prevent misunderstandings.
Table 1Impact of each process on the hydrometeor masses for liquid (ΔQL) and frozen (ΔQF) water, as well as for the water vapour (ΔQv). The liquid class contains cloud droplets and raindrops, and the frozen class contains ice particles, snow, graupel, and hail. A plus indicates an increase in the hydrometeor mass, and a minus indicates a decrease.
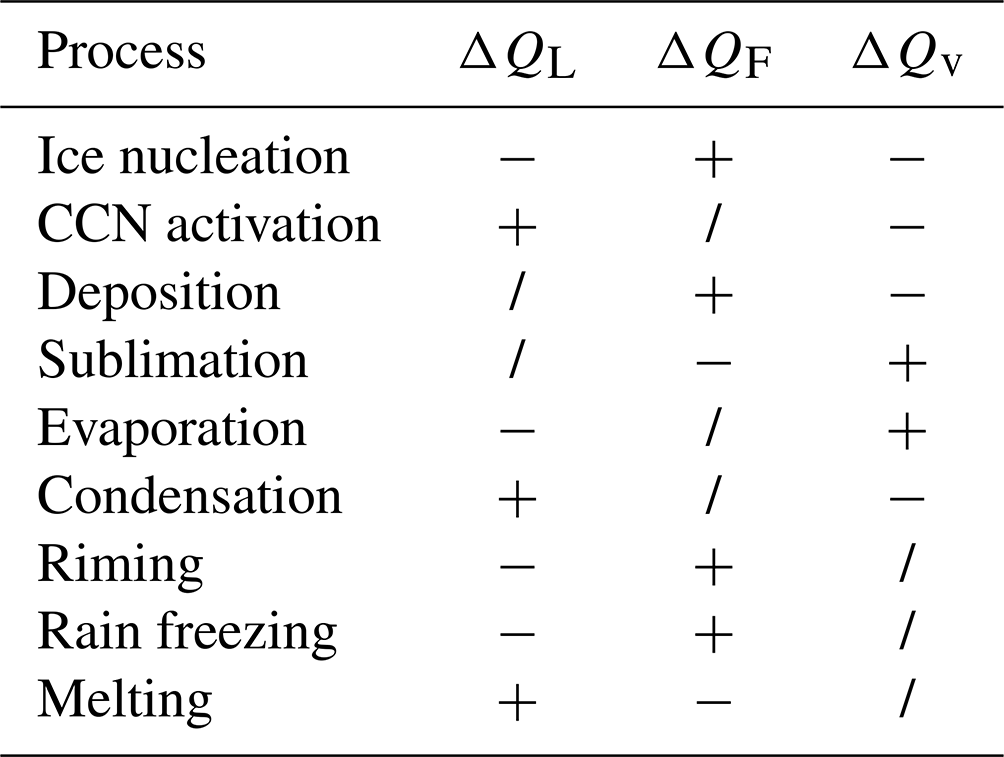
Deposition and sublimation. These two processes include either the decrease or increase in water vapour due to phase changes between frozen water and water vapour. They are computed using the same process and are split into negative (sublimation) and positive (deposition) contributions to the frozen mass.
Homogeneous and heterogeneous ice nucleation. These processes describe, as one part, the homogeneous nucleation of liquid aerosols, although it is rarely cold enough (T < 30 °C) in the clouds used in this study to happen. The heterogeneous nucleation describes nucleation via immersion freezing and deposition nucleation. The parameterization follows that of Phillips et al. (2008). As homogeneous cloud droplet freezing did not occur for the low-level clouds, it is neglected here.
CCN activation. This process describes the activation of cloud condensation nuclei following the parameterization of Segal and Khain (2006).
Frozen evaporation and melting. These processes refer to the melting of frozen hydrometeors, which can entail evaporation, but both are treated separately, leading to a process called evaporation for the frozen hydrometeors as well.
Riming. This process describes the accumulation of liquid mass on a frozen hydrometeor by decreasing the liquid mass and increasing the frozen mass. In SB in ICON, this also includes the Hallett–Mossop secondary ice production. If T > 0 °C, enhanced melting after riming will take place, making the frozen mass increase due to riming less as not all liquid will freeze onto the frozen hydrometeors.
Condensation and evaporation. These processes include either the decrease or increase in water vapour due to phase changes from cloud droplets and raindrops to vapour. They are the positive (condensation) and negative (evaporation) contributions of the saturation adjustment to the liquid mass. The saturation adjustment is run once before and once after the other microphysical processes (see Fig. A1).
Rain freezing. This process includes only the freezing of raindrops and not of cloud droplets. As both are summed up, though, this causes a decrease in the total liquid mass, while the total frozen mass increases.
An additional process which is not directly implemented in SB but that is analysed in this study is the WBF process. As evaporation and deposition are needed simultaneously for the WBF process, it is possible to use their rates to compute the WBF rate. The saturation adjustment, which provides the evaporation rate, is computed twice at each time step in contrast to all other microphysical processes. During WBF events, the second call to the saturation adjustment happens in an atmosphere that has been deprived of moisture due to deposition on ice and hence causes additional evaporation.
3.1 Dominating processes in low-level clouds
We used a simple but straightforward approach to understand which processes dominate the phase-partitioning in low-level clouds. For each process, the mean value over all cases was computed. The mean values can vary, for instance, with temperature, as shown in the next section; thus, the percentage of occurrence is used as a second metric. The outcome of this is shown for all processes in Fig. 2, split into polar night (Fig. 2a, c) and polar day (Fig. 2b, d), as well as into MPCs (Fig. 2a, b) and pure frozen or liquid clouds (Fig. 2c, d). The further a process is towards the upper-right corner, the more relevant it is considered to be. As mentioned earlier, only processes which contribute to phase changes are included here. Further, we used the minimum of deposition and evaporation to compute the WBF tendency for the MPC cases.
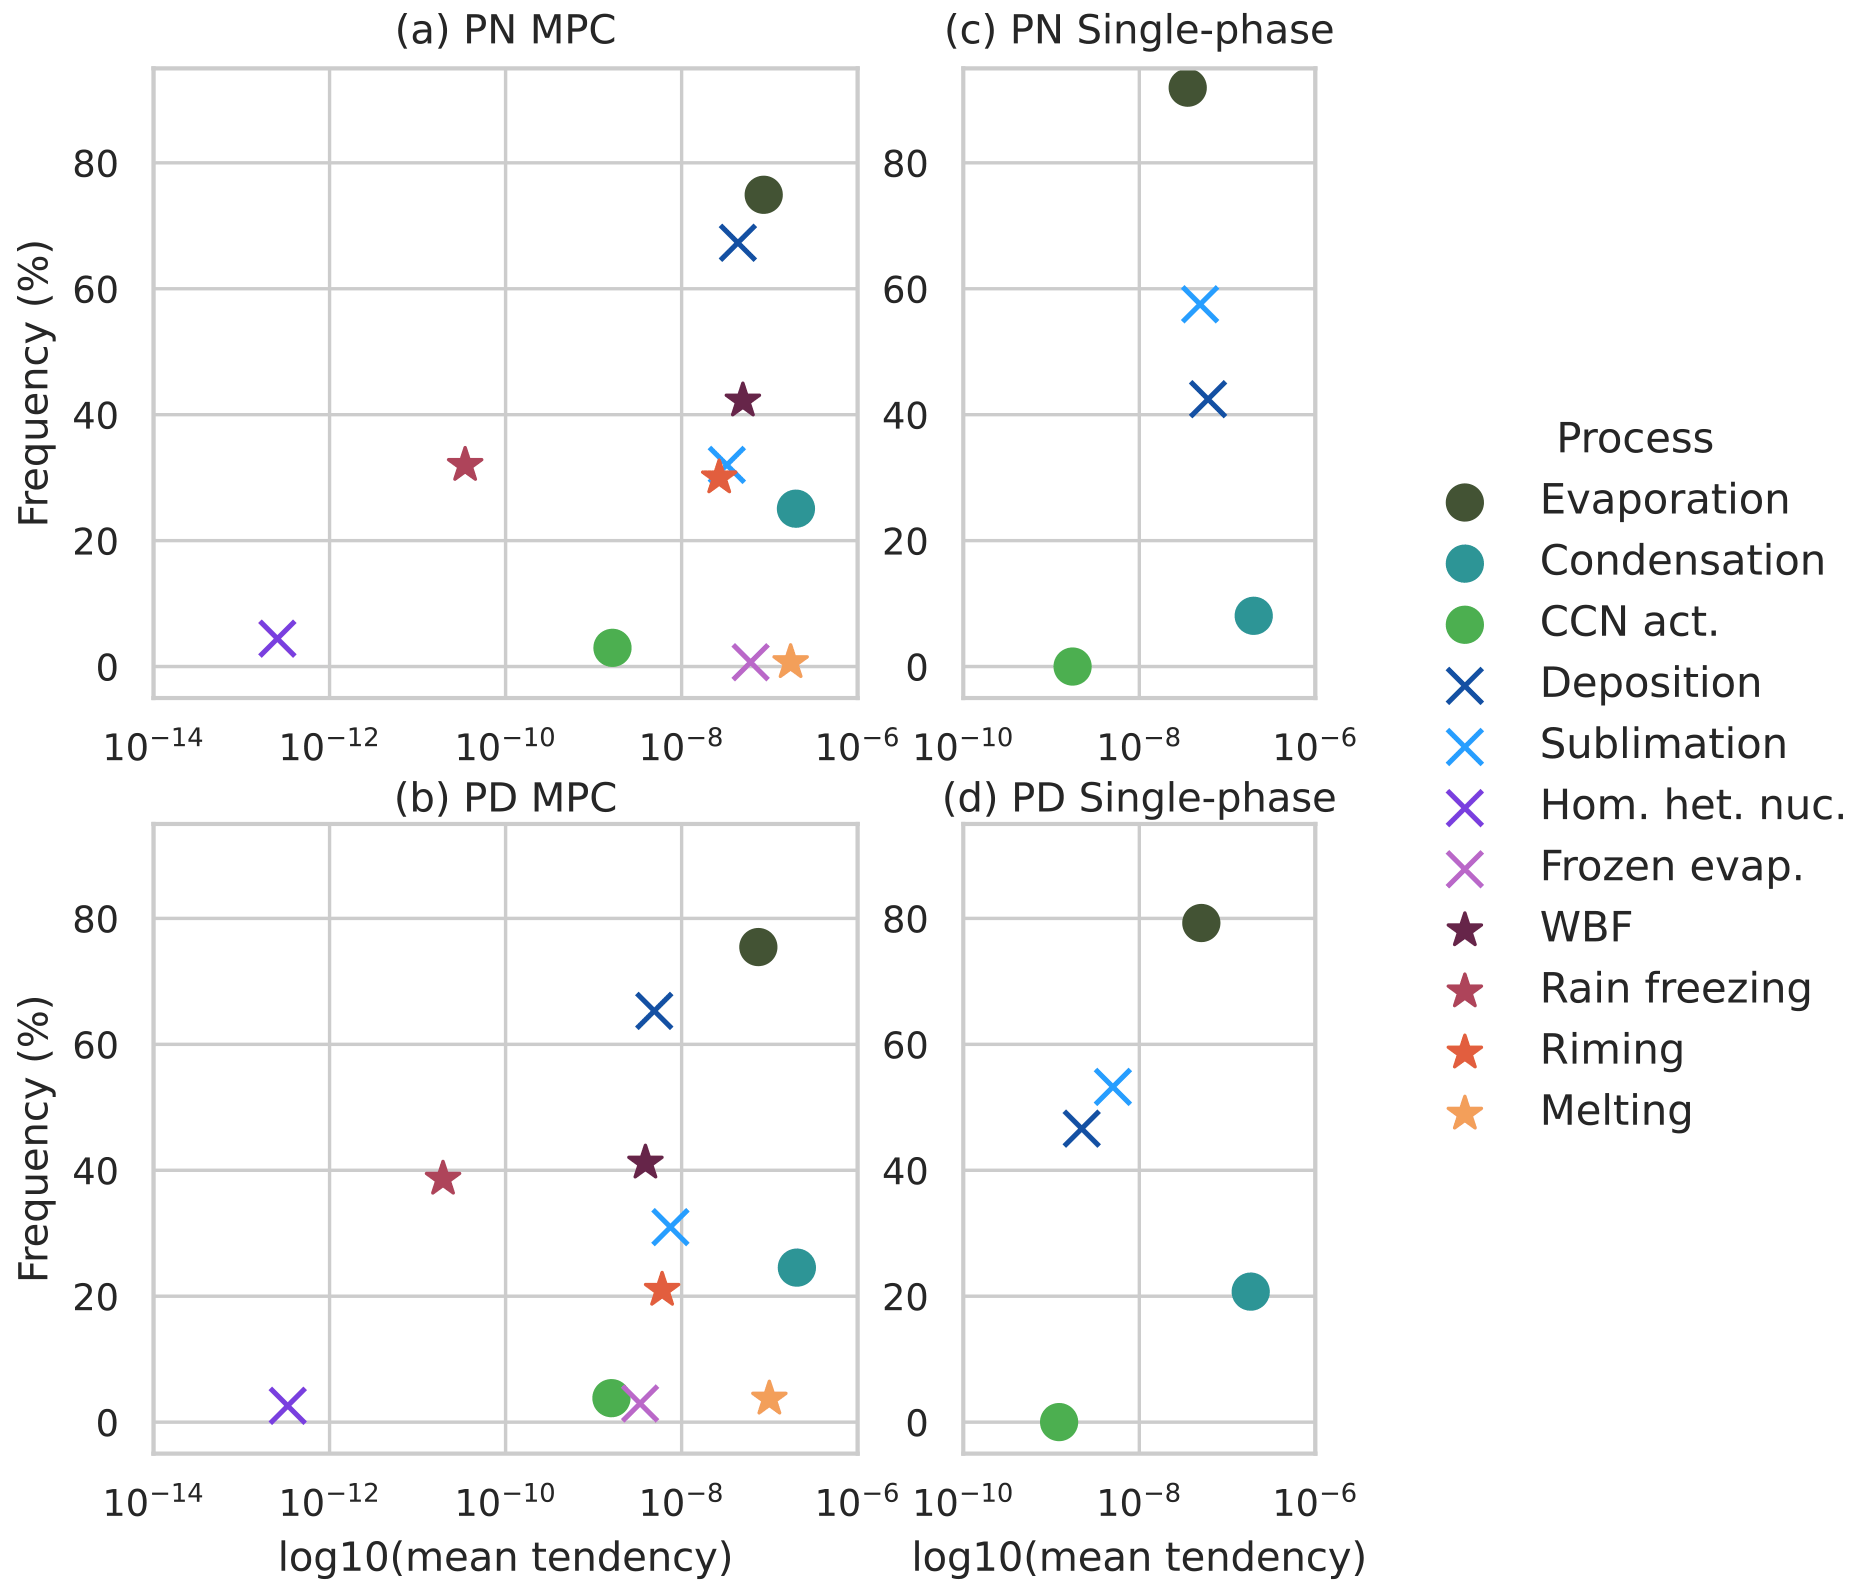
Figure 2Microphysical-process mean tendencies and occurrences during the polar night (PN, (a, c)) and polar day (PD, (b, d)), shown for mixed-phase clouds (MPCs, (a, b)) and for single-phase clouds (c, d). Dots indicate processes occurring between liquid water and vapour, crosses indicate processes occurring between ice and vapour, and stars indicate processes between liquid water and ice.
What becomes very clear from Fig. 2 is that there is a hierarchy in how relevant a process is. In all cases, evaporation seems to be strongest followed by deposition. Here, a striking difference between MPCs and single-phase clouds becomes visible. While, in liquid clouds, it seems like the majority of the clouds are in the decaying phase, shown by the frequent evaporation (above 79 %) in contrast to condensation (below 21 %), this is not necessarily true for the MPCs. As Fig. 2a and b show, deposition is stronger in MPCs in contrast to the pure ice clouds, indicating that the MPCs are generally transitioning from liquid to ice. The transition from liquid to ice via the vapour phase can be quantified using the WBF tendency, which shows a frequency of around 42 % and varies little between the PN and PD. At the same time, the pure-ice clouds seem to be in a more stable state, although the higher frequency of sublimation indicates a slight decay for the ice clouds as well. The finding that all cloud types seem to be in the process of decay, where processes acting as sinks are dominant, is potentially a local feature as only the single column of Ny-Ålesund is used here. This feature indicates that the microphysical processes may also have a strong location dependency. For instance, in Ny-Ålesund, the air over the fjord is more moist than over the land (Kiszler et al., 2023a), which may cause more evaporation over land if a cloud is advected there.
Another aspect to consider is that the microphysical process show different behaviours during the PN and PD. Processes involving the ice phase show a decreased mean tendency during the PD in contrast to during the PN. Additionally, one can see that riming seems to be more frequent during the PN (30 %) than during the PD (21 %), while rain freezing is less frequent during the PN (PN: 32.0 % and PD: 38.64 %). Such differences between the PN and PD are likely to be connected to the dependency of the processes on the temperature regime, as discussed later. Ice and liquid formation via nucleation and activation tend to occur quite seldom, as one can see from the CCN activation (CCN act. in Fig. 2) and the homogeneous and heterogeneous nucleation (Hom. het. nuc. in Fig. 2). Using the mass change as a metric for nucleation can be misleading as the number of hydrometeors produced can say more about the impact of the nucleation process than the mass change.
Evaluating this single column shows that microphysical processes vary strongly in terms of their importance and depend on the location studied. It is evident that the microphysical sinks found for liquid clouds are much weaker for mixed-phase and ice clouds. In particular, for the MPCs, it became clear that the WBF process acts strongly upon the liquid mass, and it is, therefore, worth further investigating its behaviour.
3.2 WBF in mixed-phase clouds
The Wegener–Bergeron–Findeisen process can be a reason why models have too little supercooled liquid, impacting the representation of MPCs. As shown in Kiszler et al. (2023a), it is also the case in ICON-LEM that the number of liquid-containing clouds is underestimated. In the previous section, we have shown that the WBF process occurs very frequently in MPCs and could be a reason for the glaciation of these clouds. Therefore, this section aims to quantify and further explore the WBF process. The first investigated aspect is whether the evaporation rate increases due to the WBF process. This does not necessarily have to be the case as evaporation could just occur more frequently but does not need to be stronger. To evaluate this aspect, the sub-selection of MPCs was evaluated where evaporation was occurring (75 % of MPC cases). This set was split into two sets. The WBF set consists of cases where deposition occurs simultaneously and where it is, therefore, sub-saturated with respect to water and saturated with respect to ice. This makes up 42 % of the MPC cases. The other set consists of cases where no deposition occurs (33 % of MPC cases). In Fig. 3a, the distribution of the evaporation tendency for both evaporation sets is shown, and one can clearly see that they differ strongly. For the WBF cases, the evaporation tendency is generally much larger than when no WBF is occurring. It should be kept in mind that this is a logarithmic scale, where 2 orders of magnitude make a large difference in the amount of liquid evaporating.
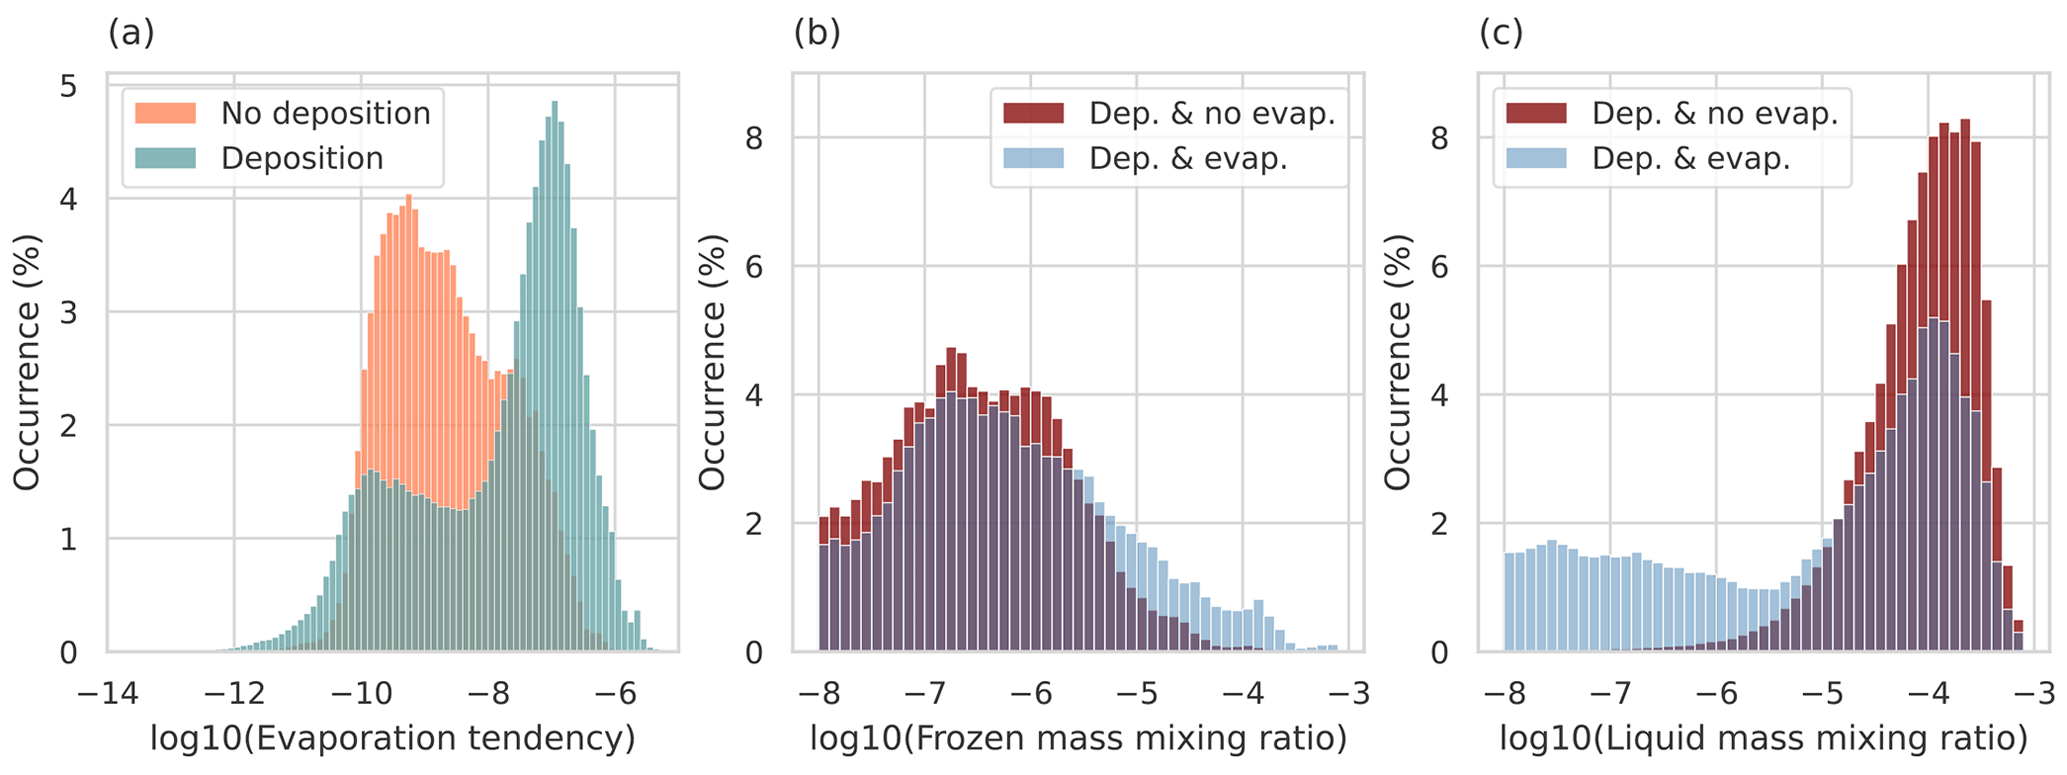
Figure 3Histograms of the logarithm of evaporation tendency (a), frozen mass (b), and liquid mass (c). (a) Liquid mass change due to evaporation at each time step (evaporation tendency) for MPCs where no deposition occurs (orange, 33 %) and where deposition occurs (green, 42 %). (b) Frozen mass for MPCs where deposition occurs but no evaporation occurs (red, 25 %) and where deposition and evaporation occur simultaneously (blue, 42 %). Panel (c) is analogous to (b) but shows the liquid mass.
Continuing with the impact on the total frozen and liquid mass, there, too, the question is whether the impact of the WBF process is significant or not. In Fig. 3b and c, one can see the distributions of frozen and liquid masses when deposition and no evaporation are occurring (no WBF, 25 % of MPC cases) and when deposition and evaporation are occurring simultaneously (WBF, 42 % of MPC cases). Here, too, there are clear differences between the distributions, showing a shift towards higher frozen masses when WBF occurs. At the same time, the liquid mass distribution shifts towards lower values when WBF occurs. In Fig. 3c, the tail of the liquid mass, which is visible for the cases where WBF occurs, is due to rain, which often occurs in subsaturated layers as it falls. Combined, this demonstrates the decrease in liquid mass, while there is an increase in frozen mass when the WBF process occurs. For both Fig. 3b and c, we found the difference in the distributions to be statistically significant (Kruskal–Wallis test). This is also visible in the difference in mean values for both processes. When both processes occur at the same time, the average deposition rate experiences a 4-fold increase ( to kg kg−1), while the average evaporation rate also increases by around 1 order of magnitude ( to kg kg−1). This shows that a significant amount of water transitions from liquid to vapour and then to the frozen phase via the WBF process.
The difference in rate change could be connected to the microphysics implementation, where the saturation adjustment is called twice in contrast to the deposition, which is called only once, and to the physics of the WBF process. Considering the typical thermodynamic situation characterizing WBF, the atmosphere is subsaturated with respect to water and supersaturated with respect to ice. This causes evaporation to occur during the first call of the saturation adjustment, providing more moisture to be deposited into ice as a result of the microphysics scheme. Then, during the second call of the saturation adjustment, the atmosphere tends to return to the state it was in before deposition happened. Because of this, intuitively, evaporation would be higher than deposition. Additionally, if deposition and evaporation tendencies were to be the same, there would be a net release of latent heat, causing the equilibrium to shift towards additional evaporation. Unfortunately, it is not possible at this stage to quantify this effect in the ICON model. However, the developed microphysical wrapper can be further used to evaluate the relative contributions of the various components of the evaporation and deposition processes and to assess the sensitivity of various process rates to the thermodynamic and microphysical conditions of the clouds in the model.
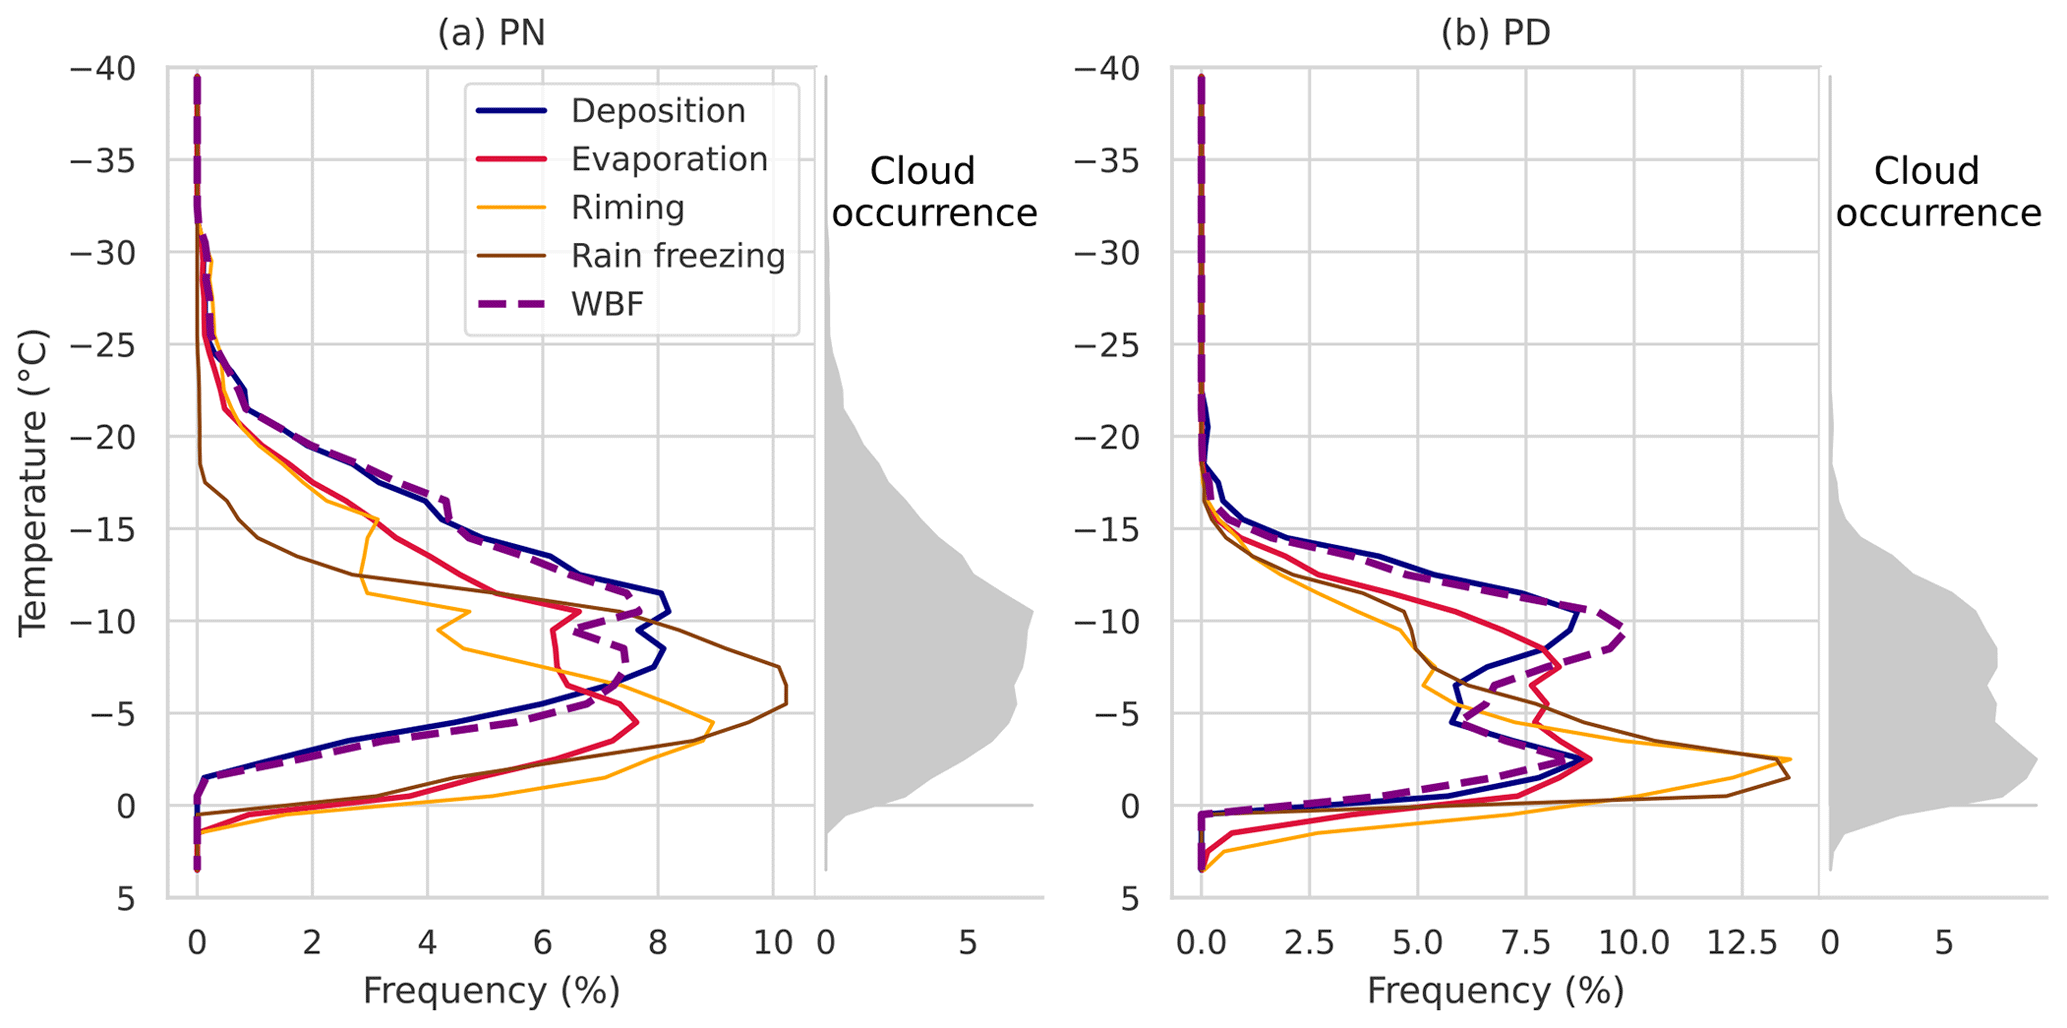
Figure 4Occurrence frequency of microphysical processes, with temperature shown for the polar night (PN, (a)) and the polar day (PD, (b)). Microphysical processes shown are deposition (blue), evaporation (red), WBF (dashed purple), riming (yellow), and rain freezing (brown). The distributions of the mixed-phase clouds are shown in grey for both the PN and PD. The process distributions are normalized with respect to temperature but not cloud occurrence.
Several other interesting findings appeared when we looked into the question of where and under what circumstances the WBF process occurs. There, we looked into the temperature distribution of the WBF process and found that the WBF process seems to correlate more strongly with deposition than with evaporation (Fig. 4). Additionally, one can see that the distributions look different between the PN and PD (Fig. 4a and b, respectively). While, during the PN, the WBF process most frequently occurs between −6 and −13 °C, during the PD, two maxima are visible: one around −3 °C and one around −10 °C. As deposition should decrease with increasing temperature (shown later), the peak at higher temperatures was not expected. The higher cloud occurrence between −5 and 0 °C could suggest that this cloud occurrence maximum causes the higher process occurrences in this range. When normalizing with respect to the cloud occurrence, we still found a slight increase in deposition and WBF around −3 °C (not shown). Therefore, we investigated whether other processes could be influencing the WBF and deposition frequency. Indeed, it seems like riming and rain freezing play a role in the deposition and WBF rate increase during the PD at higher temperatures (Fig. 4b). We hypothesize that the increase is due to the fact that both riming and rain freezing increase the ice mass, creating more frozen mass on which vapour may deposit. This would explain the increase in the deposition rate above −5 °C causing the WBF process to set in.
Another aspect which we evaluated was whether the deposition rate or the evaporation rate is the limiting factor for the WBF rate as the WBF rate is based on the minimum rate of both. To explore this, we used the supercooled liquid fraction (SLF; Komurcu et al., 2014) to categorize the clouds. An SLF of 1 indicates a pure-liquid cloud, and an SLF of 0 indicates a pure-ice cloud. A mixed-phase cloud would lie between 0 and 1. Using the SLF, we found that there seem to be two WBF regimes: one for clouds with a high liquid amount and one for clouds with a low liquid content. In cases where the liquid mass dominates, deposition is the limiting factor for the WBF process, while, for low liquid mass, evaporation limits the WBF rate. This is understandable if one considers that, if there is less ice available, the deposition rate will be lower, and if there is less liquid available, there will be less mass available to evaporate (see Fig. B1 for a visualization).
3.3 Dependence on environmental conditions
Looking at the WBF process and the difference in terms of processes between the PN and PD indicates that thermodynamic conditions influence the microphysical processes. To understand more about these dependencies, the microphysical-process behaviours with regard to temperature, vertical velocity, and saturation (ice, liquid water) were evaluated. It is worth mentioning here that sublimation and deposition cannot occur at the same time as they are calculated by the same process. The same is true for evaporation and condensation. Other processes can occur at the same time.
Starting with the temperature dependency, it can be seen that deposition occurs relatively consistently at all temperatures below 0 °C (Fig. 5f), while the mean mass change decreases (Fig. 5a). Sublimation shows a similar behaviour (Fig. C1a and f in the Appendix), although deposition shows a slight maximum between around −10 and −20 °C, where sublimation has a minimum. Another process showing a decreasing tendency with temperature is rain freezing, which occurs more often for higher temperatures, but the amount of frozen mass decreases with temperature (Fig. 5e and j). Rain freezing, as expected, is more efficient at lower temperatures but has less total impact the colder it is. Interestingly, a bi-modal distribution is visible in Fig. 5d and i for riming in terms of both the tendency and the occurrence. One maximum lies below approximately −20 °C, where there are altogether few cases, and one lies above −10 °C. This is possibly connected to the maximum saturation difference between ice and liquid water as the cloud droplet mean mass has a local minimum of around −18 °C. This hypothesis would be supported by the maximum in terms of deposition in regions where riming is lowest.
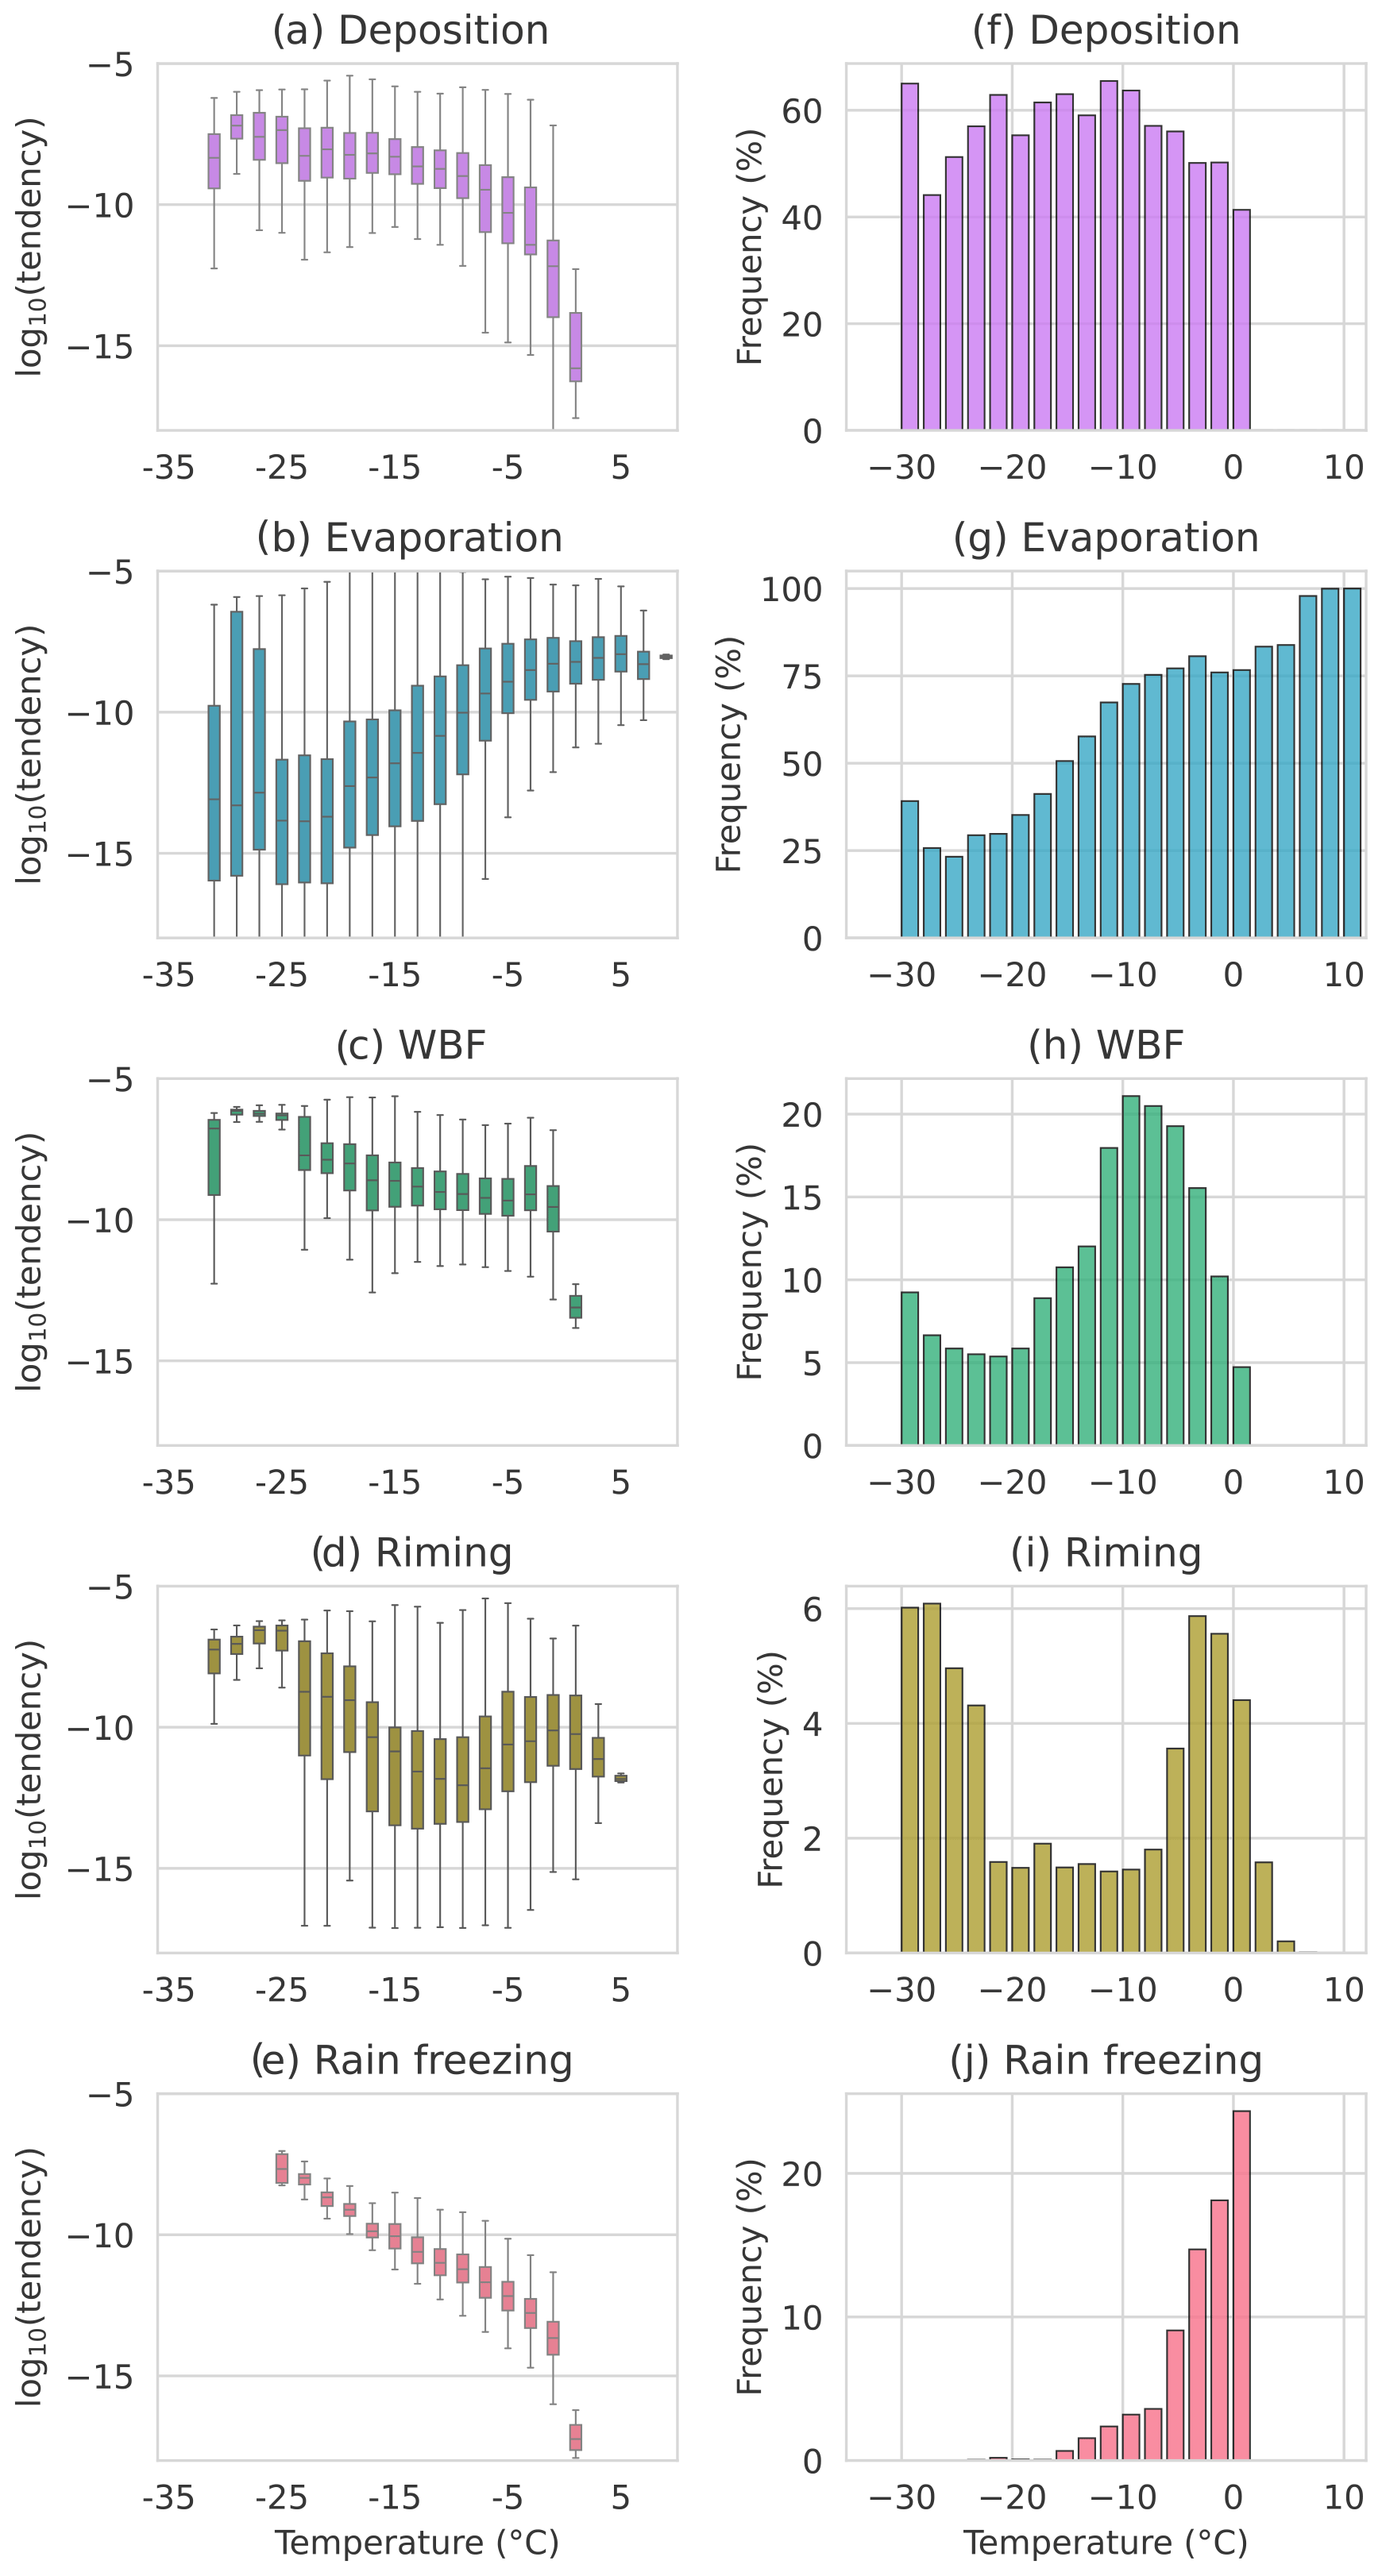
Figure 5Temperature dependence of microphysical processes. Left column: boxplots for temperature bins. Right column: occurrence for each temperature bin. The data include the polar night and polar day, and bins of 2 °C are used.
Of the processes affecting the liquid mass, evaporation dominates throughout all temperature ranges where liquid occurs. Both the occurrence and the tendency of evaporation increase with increasing temperatures (Fig. 5b and g). Of all processes, evaporation shows the largest tendency spread. This potentially indicates that evaporation may be more strongly influenced by other factors at negative temperatures in contrast to other processes which depend more clearly on the temperature. Combining evaporation and deposition, the WBF process occurrence has a clear maximum between −10 and −5 °C (Fig. 5h). At the same time, WBF seems to have the highest tendency for values below −20 °C, although, here again, caution is required due to the number of cases (Fig. 5c).
Further processes, shown in the Appendix, include condensation, which has a relatively constant tendency and increases in occurrence with temperature, and CCN activation, which occurs rarely and has an occurrence with temperature similar to that of condensation (Fig. C1). Melting and evaporation due to melting are only active above 0 °C and decrease accordingly with increasing temperatures as less and less frozen mass is available (Fig. C1). Homogeneous and heterogeneous ice nucleation occur very rarely, and more cases would be required to properly describe their thermodynamic dependencies (Fig. C1).
The next variable to look at is the vertical velocity. This section only focuses on processes where a signal can be seen. One process is riming, which increases in occurrence with upward velocity. This can mainly be seen during the PN as riming is much more frequent there (Fig. 6b). The riming tendency may suggest an increase with upwards velocity, as shown in Fig. 6a, although the fact that only 1 % of the cases are above 1.2 m s−1 makes this slightly speculative. If one discards the lowest and highest 1 % of the vertical wind speed then a decrease in sublimation with upward velocity and an increase towards higher downward velocity can be seen (Fig. 7a, white areas). For sublimation, no difference in the behaviour between polar night and day is found. For deposition, one would expect the opposite behaviour; however, as is visible in Fig. 7b), in combining the PD and PN, such behaviour is not completely obvious.
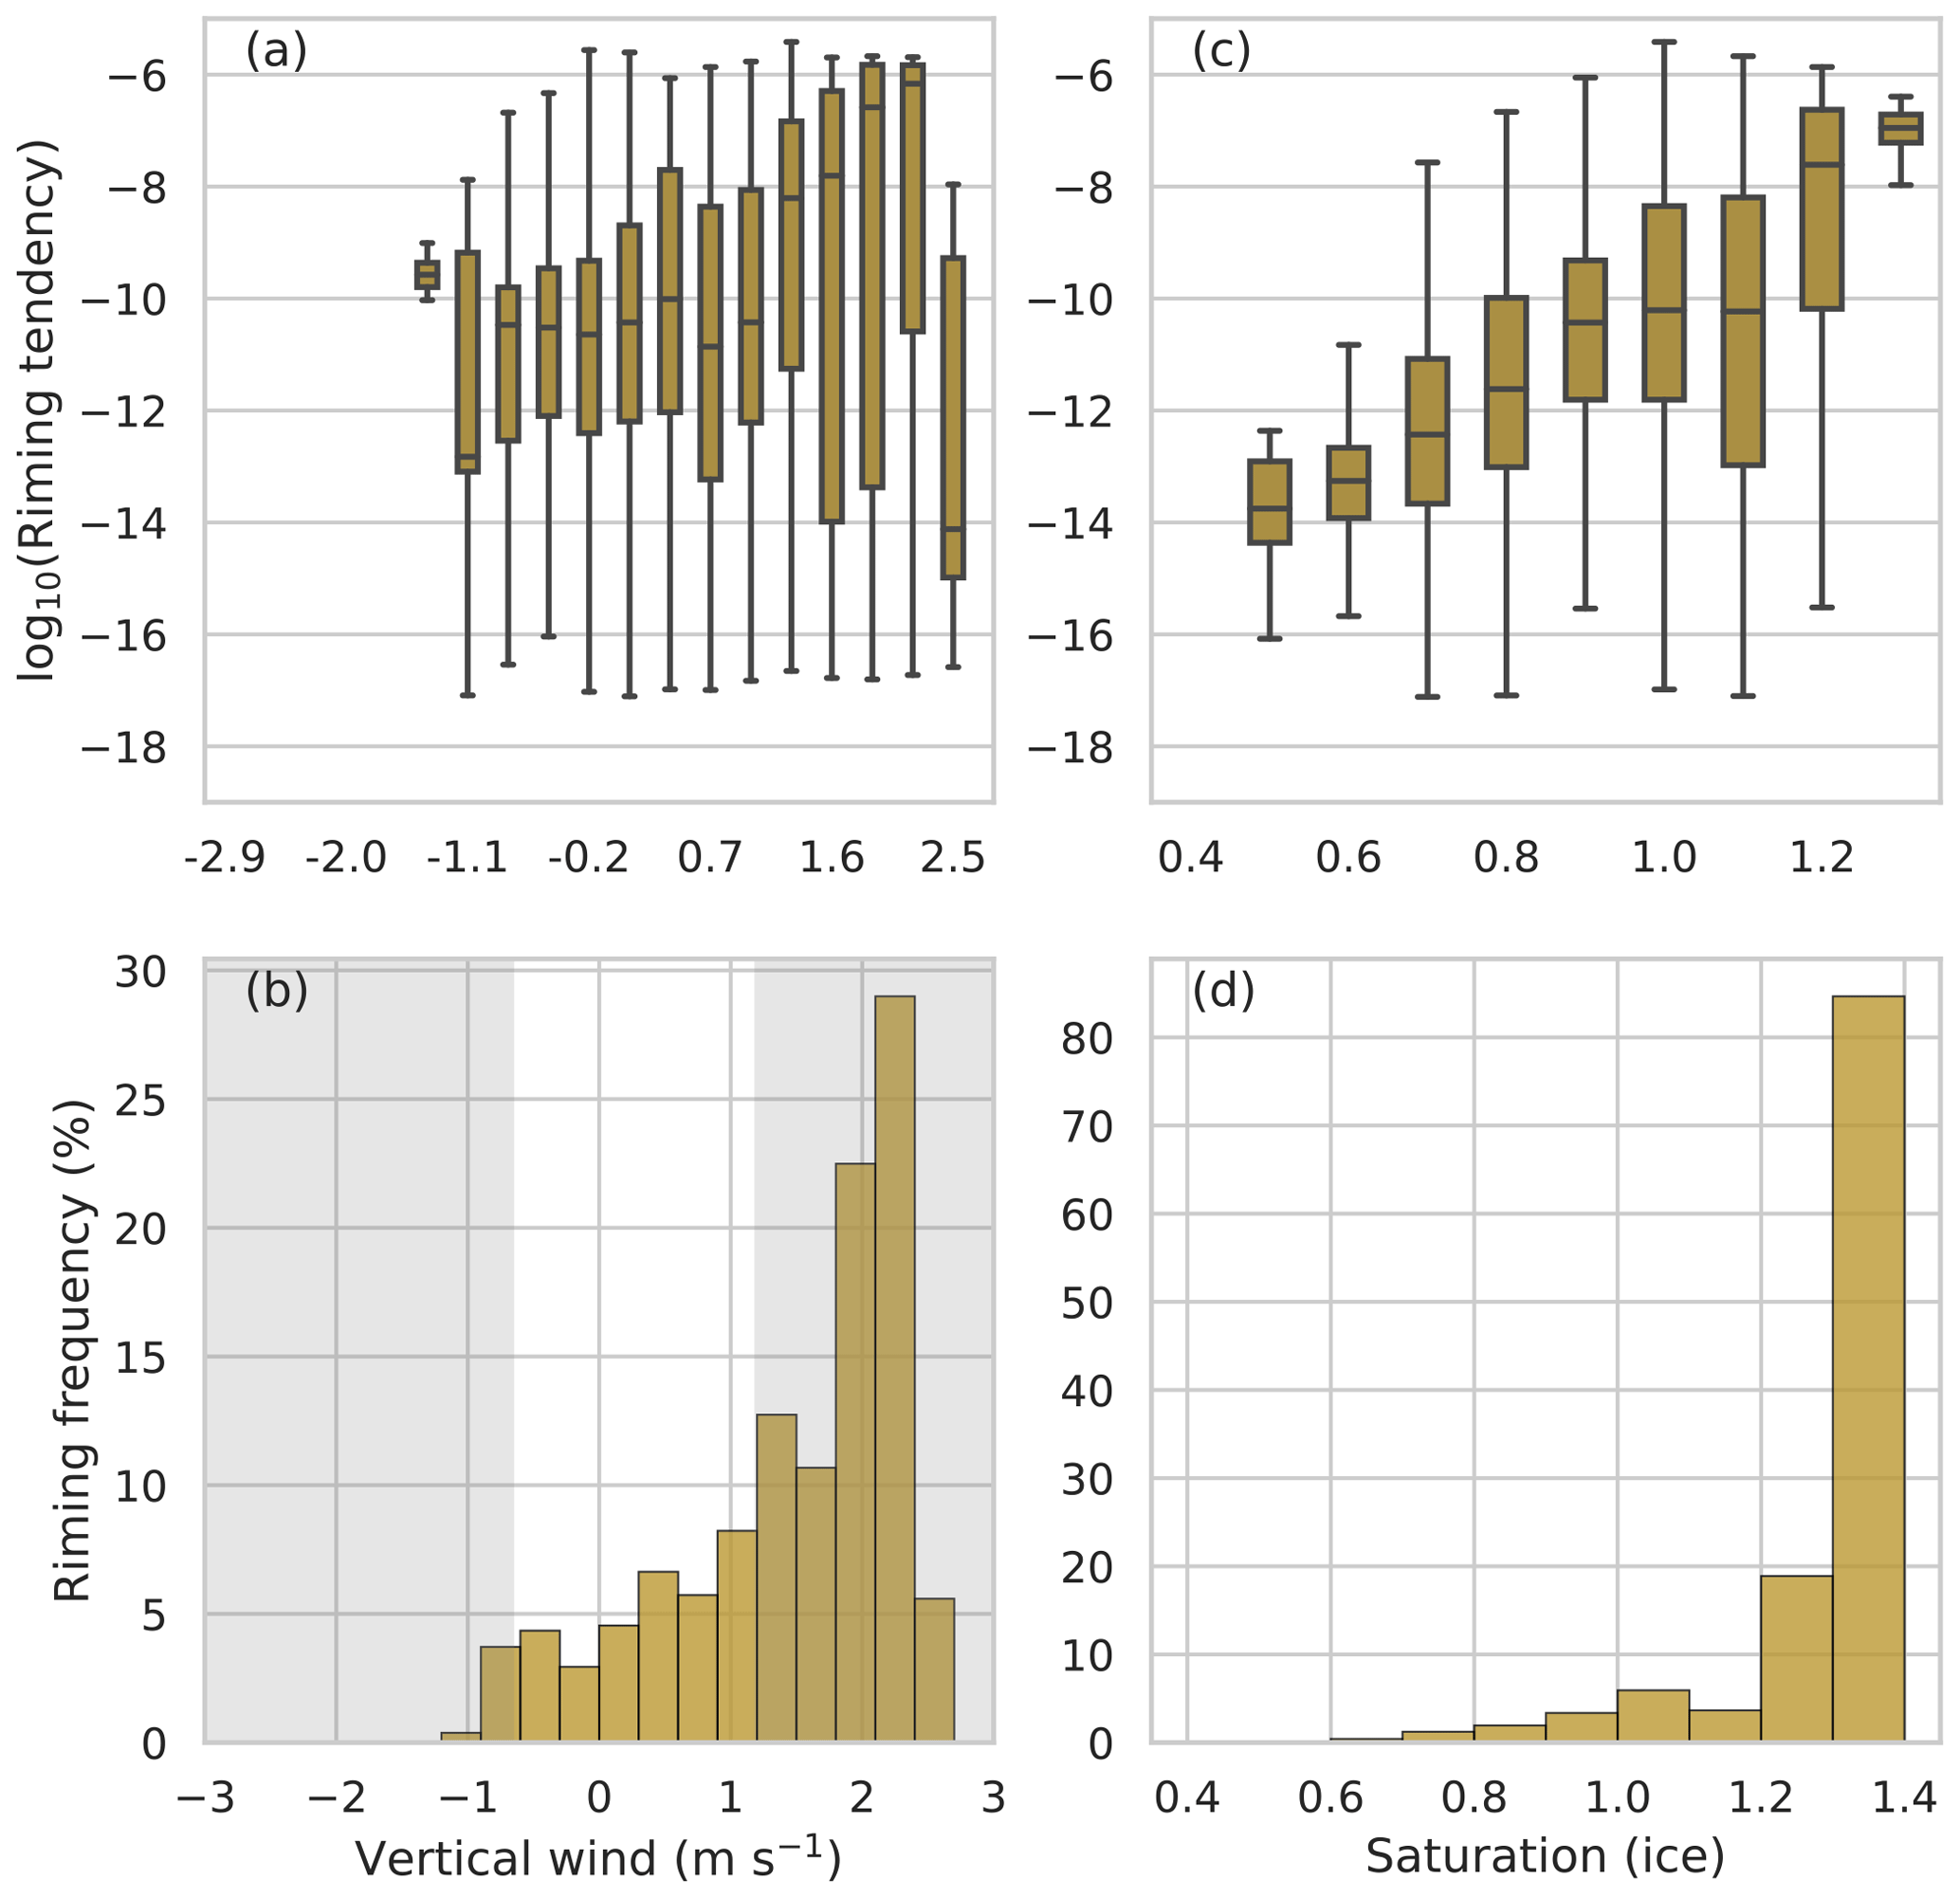
Figure 6Dependence of riming on the vertical wind speed (a, b) and the saturation with respect to ice (c, d) for the polar night. Panels (a) and (c) show the distribution of the riming tendency per bin as boxplots. Panels (b) and (d) show the frequency of occurrence per bin. Bins of 0.1 are used for the saturation, and bins of 0.3 m s−1 are for the vertical wind. The grey-shaded areas indicate the lowest and highest 1 % of the vertical wind speeds.
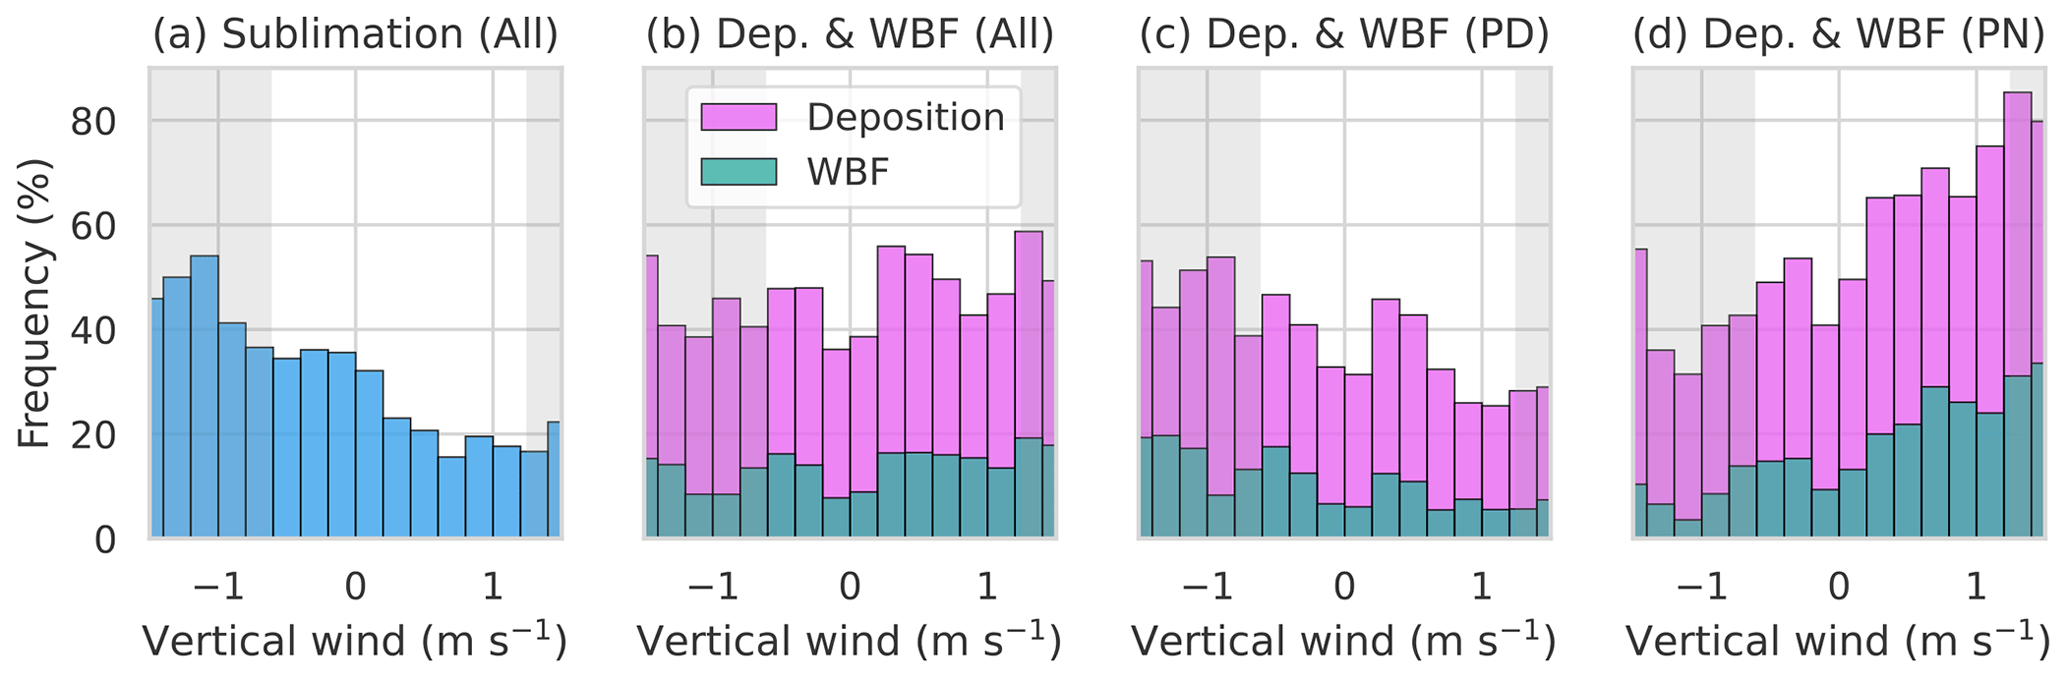
Figure 7Occurrence of sublimation (a) and deposition and WBF (b–d) with vertical velocity (bin width: 0.2 m s−1). Sublimation is shown for the PD and PN (a), while deposition and WBF are shown for the PD and PN (b), the PD (c), and PN (d). The grey boxes mark the lowest and highest 1 % of the vertical wind.
Interestingly, for deposition, a difference in behaviour with vertical velocity can be seen between the PN and PD. The deposition frequency clearly increases with upward velocity for the PN (Fig. 7d). This behaviour is not so clear for the PD (Fig. 7c), where deposition seems to be common for downward motions. Additionally, the deposition rate during the PD does not show a strong dependence on the vertical velocity (not shown), although previous observations show a decrease in ice mass with downward motion (Shupe et al., 2008), suggesting potentially less deposition. To add to the discussion, the WBF occurrence with vertical velocity shows a similar signal as the deposition for the PN and PD (Fig. 7b–d). Even though WBF is computed from the evaporation and deposition, the evaporation occurrence does not seem to vary strongly with the velocity (Fig. C2). In addition, we found that condensation consistently increases for the PN and PD towards upwards velocities, as one would expect (Fig. C2). As theorized by Korolev (2008), the WBF process is, to a certain extent, expected for downward velocities, which can explain some of the behaviour of the deposition tendency during the PD. At the same time, it is expected that, for upward velocities, saturation with respect to ice and water will set in, causing condensation to increase and therefore preventing the WBF process. Further, Omanovic et al. (2024) found a more prevalent WBF process in downdrafts in low continental stratus clouds using ICON-LEM with the SB microphysics scheme, albeit with different aerosol concentrations. Such a relationship between the vertical velocity and the WBF process, we only found partially.
Reasons for the behaviours of the WBF process and deposition could be the lower number of frozen cases during PD or the differences in temperature range. Another reason could be differences in the vertical structure of the boundary layer and potentially increased moisture in the lower layers due to the fjord by Ny-Ålesund. One must keep in mind that the vertical wind is very narrowly distributed around 0 m s−1, and only a few absolute high values exist. To study this further, other types of clouds that have stronger vertical velocities by nature are more suitable. For the liquid mass, similarities exist between evaporation and sublimation as both show a decrease with upward velocity (Fig. C2a and b). Condensation resembles the deposition more strongly and increases with upward motion (Fig. C2c and d). The CCN activation is, by definition, dependent on the vertical velocity. Therefore, the increase with higher upward velocity, which we found, is as expected.
The last thermodynamic variable is the saturation with respect to ice and water. Processes that change the frozen mass are evaluated against the saturation with respect to ice. Here, riming stood out again. It can be seen in Fig. 6c and d that riming increases with saturation in both occurrence and mean tendency. This fits the increase in riming found for higher upward velocities as the saturation of rising air can increase. Some processes depend, by definition, on the saturation, for instance, deposition or sublimation and condensation or evaporation. The signal found for these processes indicated evaporation and sublimation below saturation and condensation and deposition above saturation, which was, therefore, expected (not shown). What was noticeable, though, was that the tendency of condensation showed a higher mean in combination with a much smaller spread in comparison to evaporation. It was generally an interesting finding that some processes, such as condensation and rain freezing, showed much less spread in their tendency than other processes with respect to all thermodynamic variables evaluated here.
This study evaluates the microphysical processes of the two-moment microphysics scheme from Seifert and Beheng (2006) as it is implemented in ICON. The area of focus is Svalbard, and only low-level clouds are selected for the analysis. A further separation is made between single-phase and mixed-phase clouds. Using a wrapper to run the microphysics scheme offline as a diagnostic tool, the process rates per time step are written out. In total, 8 months, 4 during the polar night and 4 during the polar day, are simulated. This extensive dataset of microphysical-process rates (Kiszler et al., 2023b) presents a valuable and novel resource for further research, offering detailed insights into and potential for addressing current knowledge gaps. The goal of this study was to use the created dataset and to determine which processes play the largest role in the phase transitions in Arctic low-level clouds and in what way they depend on temperature, vertical velocity, and saturation.
It was found that the dominating processes in MPCs are phase transitions between liquid hydrometeors and vapour, as well as frozen hydrometeors and vapour. The results suggest that one possible approach to improving the representation of the phase-partitioning in low-level mixed-phase clouds in the Arctic could be to adjust the processes of evaporation or condensation and deposition or sublimation. Another approach could be to increase the activity of processes which are currently less active as these may not be active enough. Further, the differences between polar night and polar day showed the importance of evaluating a large dataset covering different thermodynamic conditions. For instance, rain freezing seemed to be more important during the polar day than during the polar night, while riming seemed to be more important during the polar night. It is worth mentioning that nucleation processes only minimally change the mass directly, but the numbers of activated CCN and INPs have an impact on other process rates. Fan et al. (2017) showed this in a case study for orographic clouds where evaporation became stronger than condensation for higher aerosol concentrations, whereas, for lower concentrations, the process rates were similar. Therefore, although changes in evaporation or condensation and deposition or sublimation will likely cause large hydrometeor mass changes, the interactions between processes also play an important role.
One such process interaction is the Wegener–Bergeron–Findeisen process, where liquid water evaporates and then deposits on ice due to the lower saturation of ice below 0 °C. To evaluate the WBF process, we selected cases where deposition and evaporation occurred simultaneously and used the minimum rate as an approximation for the WBF tendency. We found a very frequent occurrence (42 %) of the WBF process in MPCs. Further, it seems like the deposition tendency determines the rate of the WBF process. Additionally, the evaporation tendency was evaluated in combination with the frozen and liquid mass. This showed a 1-order-of-magnitude increase in the average evaporation, causing a significant decrease in the liquid mass. Combined, the results showed that a significant amount of mass follows the WBF pathway from liquid to vapour to the frozen phase, with an average WBF tendency that is similar to the average deposition tendency. Reducing the WBF rate by reducing the deposition tendency may be a way to reduce the underestimation of liquid-containing clouds found in a previous study (Kiszler et al., 2023a). The finding that evaporation increases substantially more than deposition was partially attributed to the microphysical-process implementation which favours excess evaporation when WBF is active. Also, the thermodynamics of WBF are expected to cause additional evaporation, but it is not possible at present to quantify this effect. Nonetheless, it is suggested that the tools and methods developed in this study can help in the quantitative analysis of such effects and in uncovering the intricate relationships among moisture, temperature, and cloud particle properties that affect the WBF process in numerical models.
We further explored how each process behaves under different thermodynamical regimes. Temperature is one important factor that determines the importance of a process. For instance, Fan et al. (2017) found that, for warm orographic MPCs, riming was similarly important for snow formation compared to deposition, but for cold orographic MPCs, deposition was clearly more important. In this study, differences are visible between the polar night and day. We found that melting and rain freezing play a larger role during the polar day, while riming decreases in importance during that time. This dependence on temperature was further evaluated, and it could be seen that processes that change the mass phase between liquid and frozen water show a stronger temperature dependence than those involving vapour-phase transitions. The strongest temperature dependence was visible for rain freezing, which showed an increasing occurrence with increasing temperatures, while the mean frozen rain mass decreased. Interestingly, the distribution of riming in terms of both the occurrence and the mean mass change under different temperature regimes was bi-modal, showing a minimum between −20 and −10 °C. The connections between the process rates and the vapour saturation and vertical wind were not as clear. This can partially be attributed to the narrow range of values for these thermodynamic variables given in low-level Arctic clouds. The clearest signal, in this respect, was the increase in riming with increasing upward velocities. This could be connected to the larger production of liquid in updrafts, where condensation is more active. Another finding was that the WBF process did not fully behave with vertical velocity as one may expect it to based on the theoretical understanding (Korolev, 2008) and based on another ICON-LEM case study (Omanovic et al., 2024). We found that, for upward velocities, the WBF process seems to increase its activity during the PN.
As stated above, there are limitations to our approach, which might make it less insightful for cases where advection dominates the cloud hydrometeor composition, for instance, in deep convective cases. Nevertheless, when focusing on low-level clouds in the Arctic, this approach provides valuable insights with regard to the processes inside the clouds, as demonstrated in this study. Additionally, the regimes of vertical velocity and temperature studied here are limited to those of low-level clouds in the Arctic, specifically over Ny-Ålesund, which, as we found, represents the decaying phase of clouds more than the formation phase. Therefore, to create a broader picture of the microphysical processes in other cloud types, further studies including stronger vertical velocities and larger temperature ranges are necessary. This could, for instance, substantiate our findings with regard to the increase in riming with higher upward vertical velocities.
There are further factors that impact the process rates, as mentioned in the introduction. These include aerosol concentrations, which can strongly impact the hydrometeor composition and cloud lifetime (Kalesse et al., 2016; Eirund et al., 2019). In this study, the CCN and INPs are treated as maritime, which is more accurate than the default continental setting in ICON but is still not completely correct. CCN and INPs are another large area of active research, which is why this study focuses on the processes independently of aerosol influences. However, an interesting study would be how tweaked CCN and IN settings impact the process rates using the approach presented here. Using the process rates and looking into the regimes where different processes occur have shown that this method is also valuable for studying individual processes in greater depth. Being able to quickly change a process setting and get an idea of what might change in the model has proven to be easy and reliable. This encourages continuing to use tools, such as this wrapper, which simplify the untangling of complex cloud microphysics schemes.
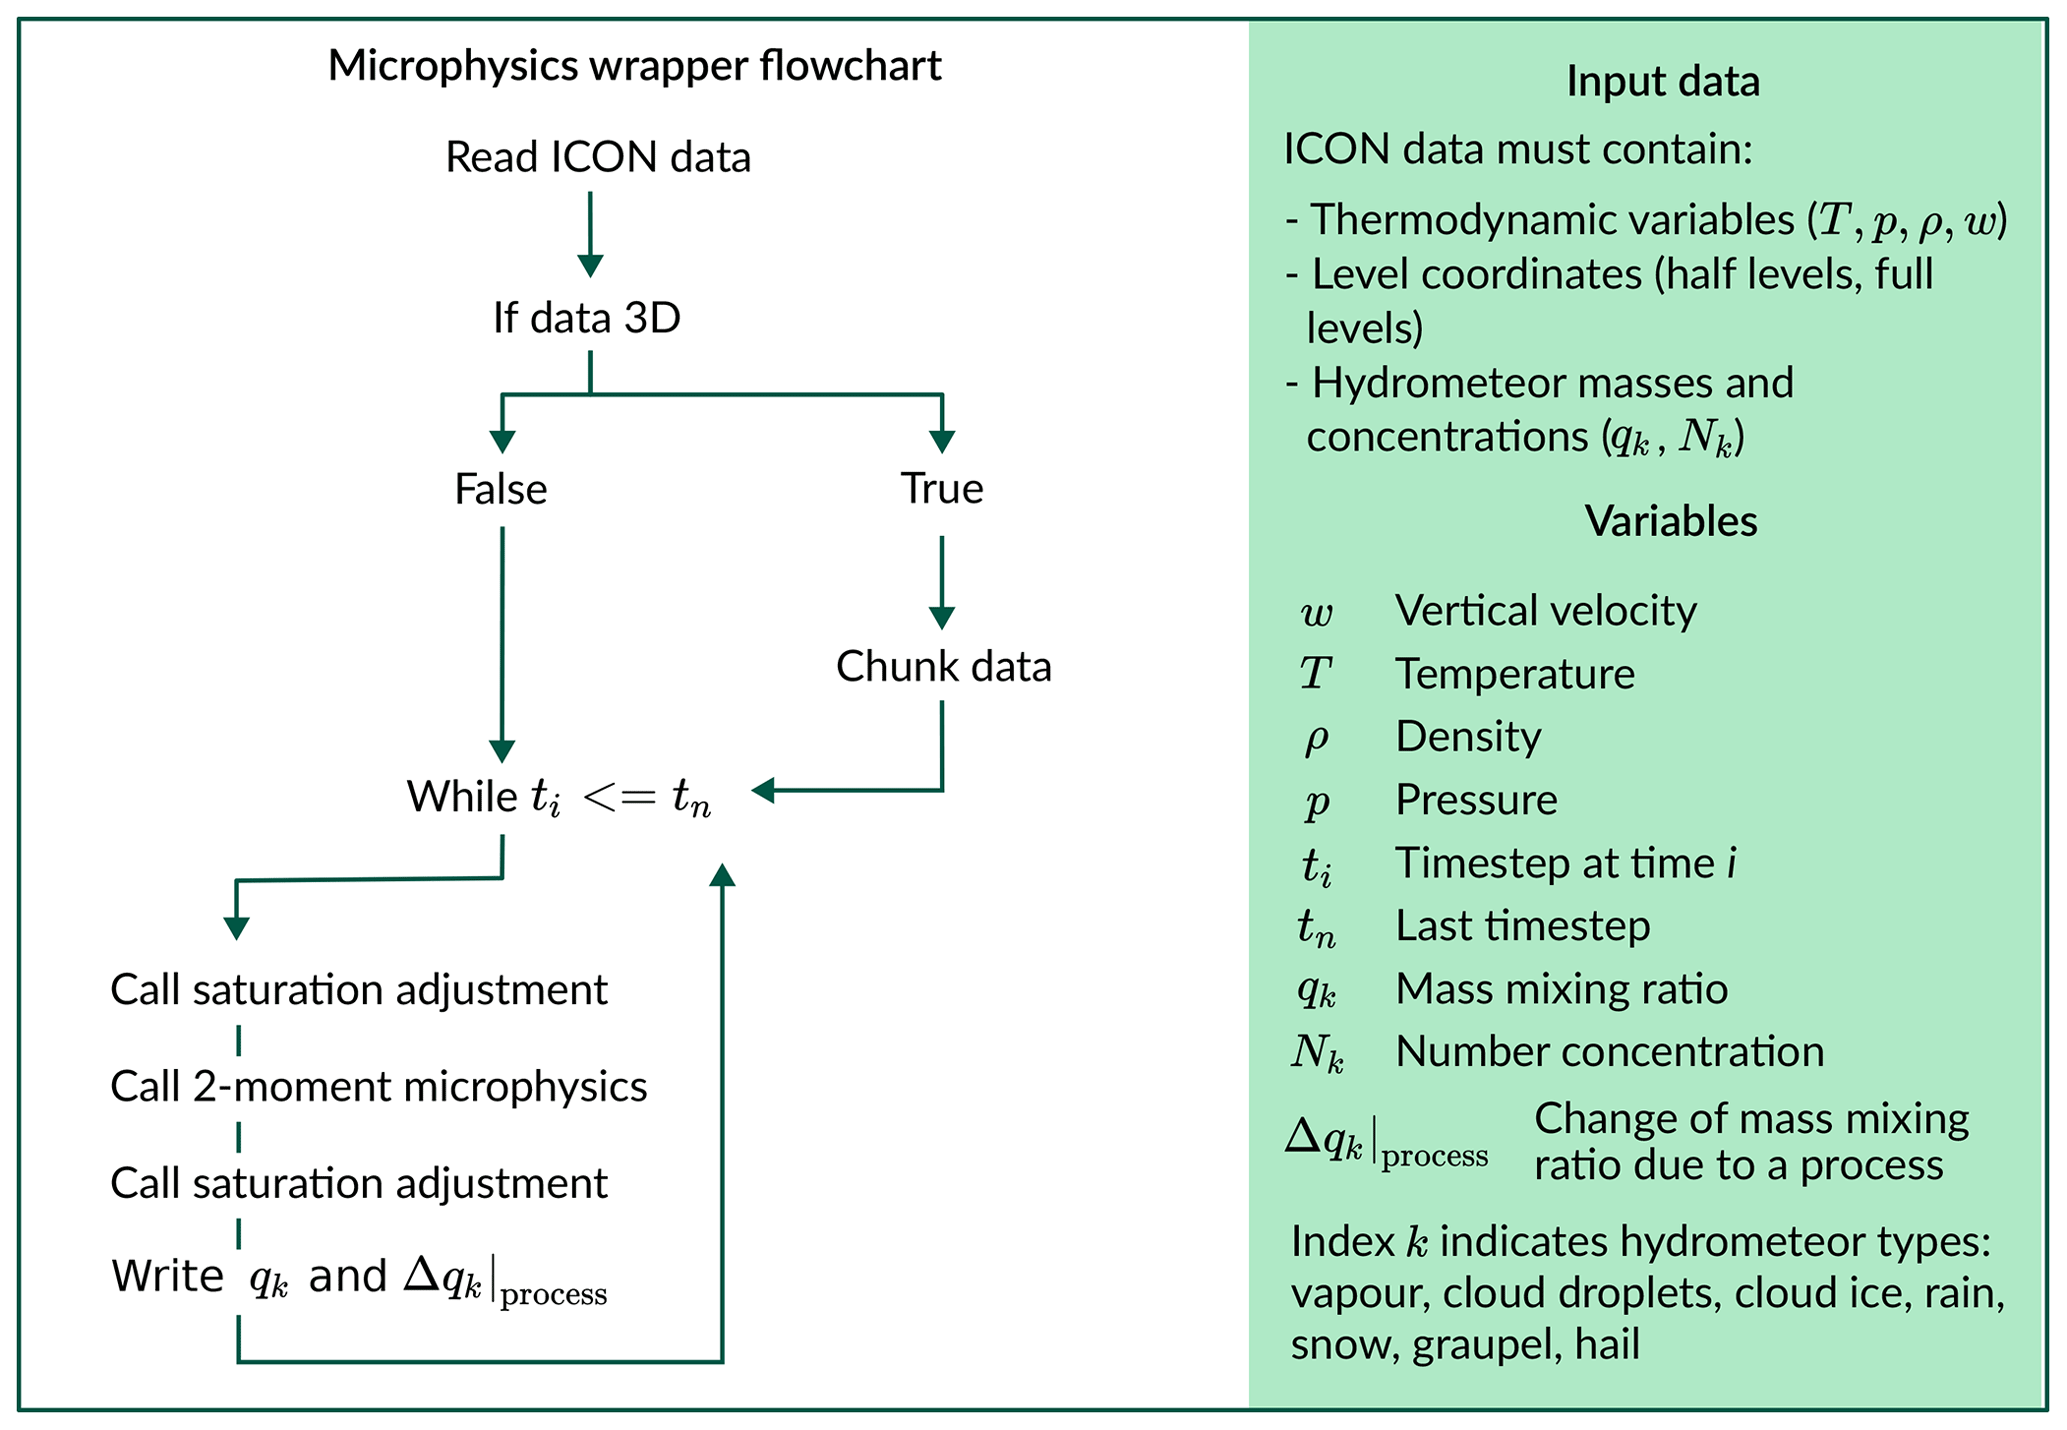
Figure A1Flowchart illustrating the microphysical parameterization wrapper. The variables and required input data are listed on the right. Any sub-selection of the data was done after running the wrapper. Each process has a separate tendency for each hydrometeor which it affects (Δqk|process).
The supercooled liquid fraction (SLF) is computed based on Komurcu et al. (2014).
In Fig. B1, three different microphysical processes are shown: deposition, evaporation, and WBF. The SLF generally has two maxima in occurrence towards 0 and 1. This figure demonstrates how the WBF process is limited by deposition under high-SLF regimes and by evaporation under low-SLF regimes.
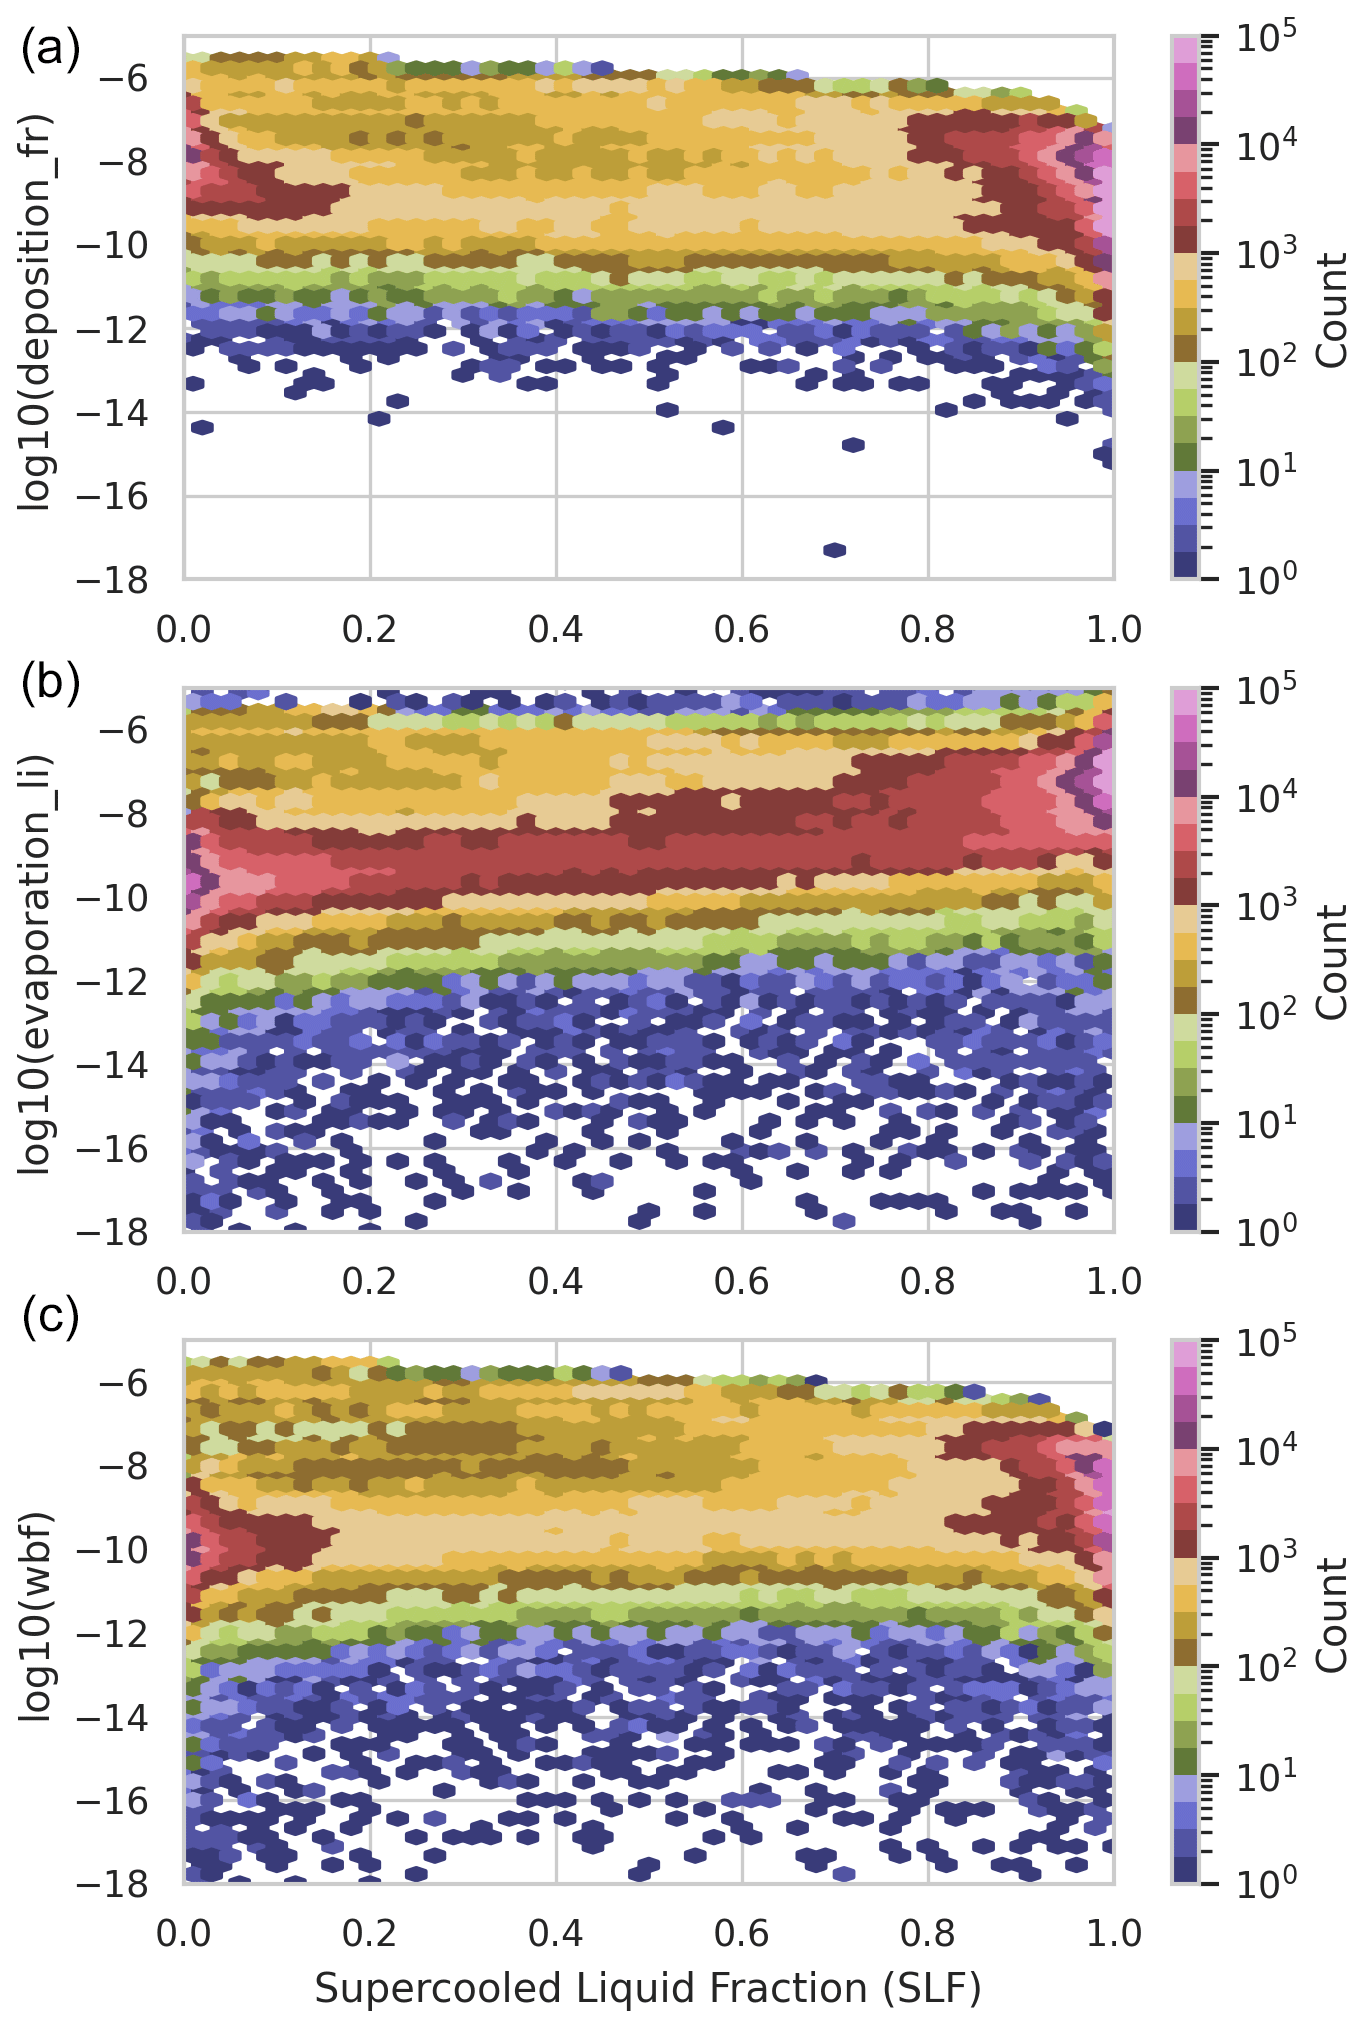
Figure B1Two-dimensional histograms demonstrating the connection between clouds with high SLF and low SLF and the following microphysical processes: (a) deposition, (b) evaporation, and (c) WBF. The colour bars indicate the count of the cases.
This section provides additional figures for the dependence of the microphysical processes on the temperature, vertical velocity, and saturation. They are complementary to the figures shown in Sect. 3.3 and just show additional processes mentioned in the results.
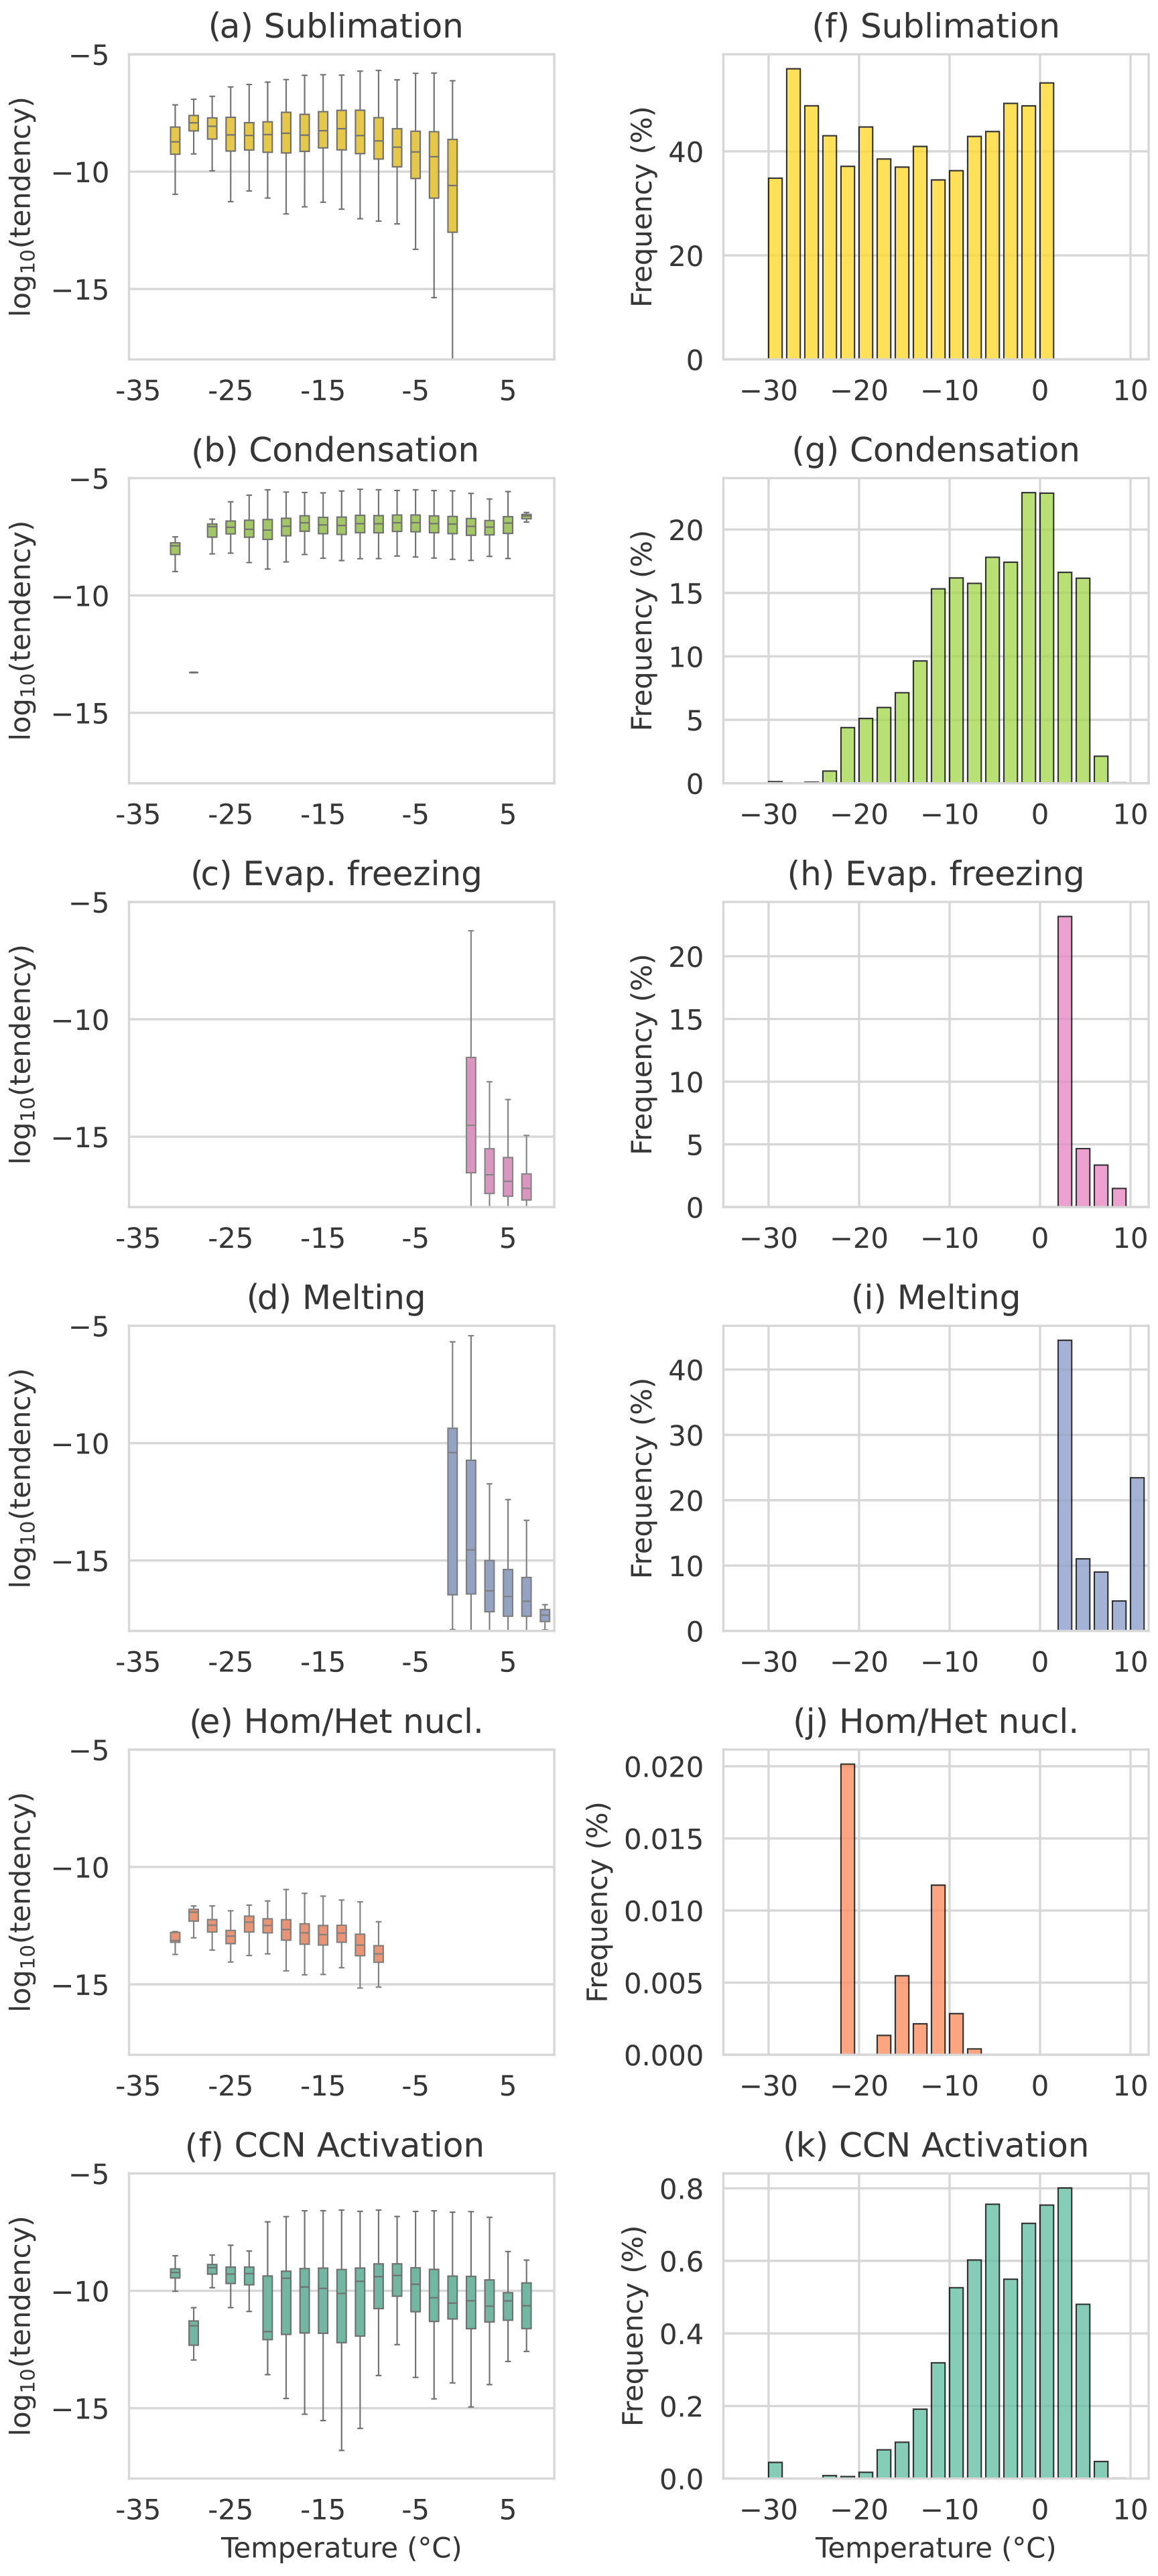
Figure C1Temperature dependence of microphysical processes. Left column: boxplots for temperature bins. Right column: occurrence for each temperature bin. The data include the polar night and polar day, and bins of 2 °C are used.
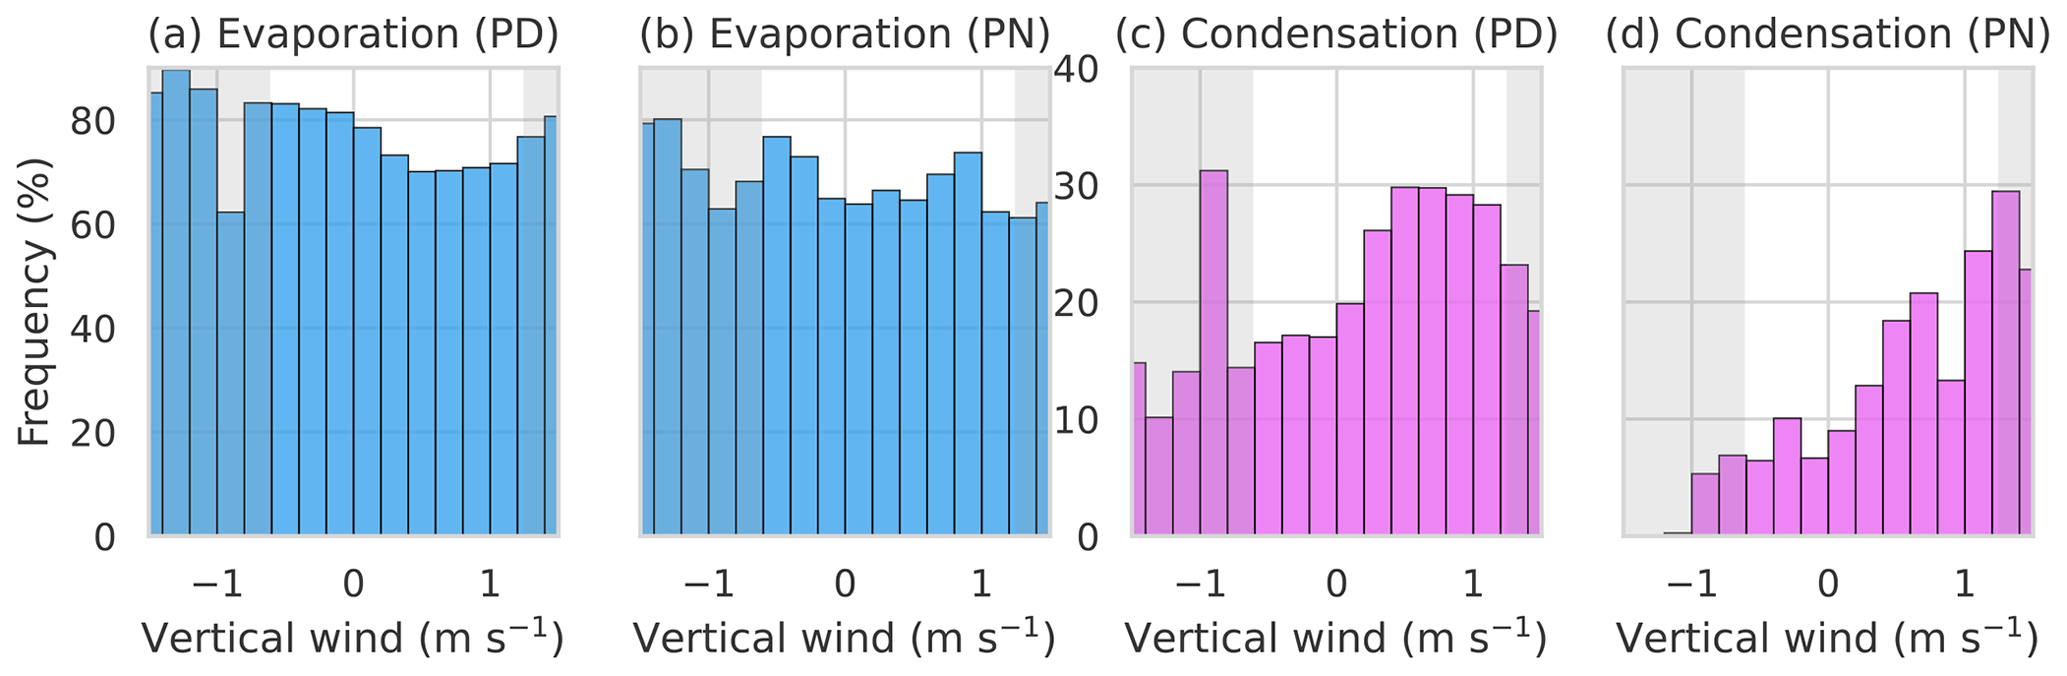
Figure C2Dependence of evaporation (a, b) and condensation (c, d) on the vertical velocity. Split into the PD (a, c) and PN (b, d) using 0.2 m s−1 bins.
The microphysical-wrapper code is stored on the DKRZ GitLab. In the form used here, the wrapper includes ICON code which is licensed, and the code is, therefore, only available on request. The ICON model code which we used is available for institutions or individuals under a licence, but a recently published open-source version is available here: https://icon-model.org/ (last access: 9 September 2024). The low-level process rates, cloud selection, and meteograms are available on Zenodo with the following DOI: https://doi.org/10.5281/zenodo.10117706 (Kiszler et al., 2023b). A Zenodo repository containing the code necessary to reproduce the results can be found here: https://doi.org/10.5281/zenodo.10945484 (Kiszler, 2024).
TK carried out the wrapper implementation, data processing, and method development; created the visualizations; and prepared the paper with contributions from all the co-authors. VS and DO contributed to the conceptualization, research supervision, and discussion of the results.
The contact author has declared that none of the authors has any competing interests.
Publisher's note: Copernicus Publications remains neutral with regard to jurisdictional claims made in the text, published maps, institutional affiliations, or any other geographical representation in this paper. While Copernicus Publications makes every effort to include appropriate place names, the final responsibility lies with the authors.
We gratefully acknowledge the funding by the Deutsche Forschungsgemeinschaft (DFG, German Research Foundation) – project no. 268020496 – TRR 172 within the Transregional Collaborative Research Center's “ArctiC Amplification: Climate Relevant Atmospheric and SurfaCe Processes, and Feedback Mechanisms (AC)3”. This work used resources of the Deutsches Klimarechenzentrum (DKRZ) granted by its Scientific Steering Committee (WLA) under project ID no. bb1086. We thank Axel Seifert for the support in implementing the microphysics wrapper. Further, the discussions with Rosa Gierens, Giovanni Chellini, and Matthew Shupe helped shape the analysis. Two anonymous reviewers additionally helped to improve this paper, which we are grateful for.
This research has been supported by the Deutsche Forschungsgemeinschaft (DFG, German Research Foundation) – project no. 268020496 – TRR 172 within the Transregional Collaborative Research Center's “ArctiC Amplification: Climate Relevant Atmospheric and SurfaCe Processes, and Feedback Mechanisms (AC)3”. This work used resources of the Deutsches Klimarechenzentrum (DKRZ) granted by its Scientific Steering Committee (WLA) under project ID no. bb1086.
This open-access publication was funded by Universität zu Köln.
This paper was edited by Philip Stier and reviewed by two anonymous referees.
Barrett, A. I. and Hoose, C.: Microphysical Pathways Active within Thunderstorms and Their Sensitivity to CCN Concentration and Wind Shear, J. Geophys. Res.-Atmos., 128, e2022JD036965, https://doi.org/10.1029/2022JD036965, 2023. a
Blahak, U.: Towards a Better Representation of High Density Ice Particles in a State-of-the-Art Two-Moment Bulk Microphysical Scheme, in: 15th International Conference on Clouds and Precipitation, 7–11 July 2008, Cancun, Mexico, Semantic Scholar, https://api.semanticscholar.org/CorpusID:201686126 (last access: 9 September 2024), 2008. a
Cesana, G. and Chepfer, H.: How well do climate models simulate cloud vertical structure? A comparison between CALIPSO-GOCCP satellite observations and CMIP5 models, Geophys. Res. Lett., 39, L20803, https://doi.org/10.1029/2012GL053153, 2012. a
Chellini, G., Gierens, R., and Kneifel, S.: Ice Aggregation in Low-Level Mixed-Phase Clouds at a High Arctic Site: Enhanced by Dendritic Growth and Absent Close to the Melting Level, J. Geophys. Res.-Atmos., 127, e2022JD036860, https://doi.org/10.1029/2022JD036860, 2022. a
Curry, J. A. and Ebert, E. E.: Annual Cycle of Radiation Fluxes over the Arctic Ocean: Sensitivity to Cloud Optical Properties, J. Climate, 5, 1267–1280, https://doi.org/10.1175/1520-0442(1992)005<1267:ACORFO>2.0.CO;2, 1992. a
Dipankar, A., Stevens, B., Heinze, R., Moseley, C., Zängl, G., Giorgetta, M., and Brdar, S.: Large eddy simulation using the general circulation model ICON, J. Adv. Model. Earth Syst., 7, 963–986, https://doi.org/10.1002/2015MS000431, 2015. a, b, c
Ebell, K., Nomokonova, T., Maturilli, M., and Ritter, C.: Radiative Effect of Clouds at Ny-Ålesund, Svalbard, as Inferred from Ground-Based Remote Sensing Observations, J. Appl. Meteorol. Clim., 59, 3–22, https://doi.org/10.1175/JAMC-D-19-0080.1, 2020. a
Eirund, G. K., Possner, A., and Lohmann, U.: Response of Arctic mixed-phase clouds to aerosol perturbations under different surface forcings, Atmos. Chem. Phys., 19, 9847–9864, https://doi.org/10.5194/acp-19-9847-2019, 2019. a
Fan, J., Leung, L. R., Rosenfeld, D., and DeMott, P. J.: Effects of cloud condensation nuclei and ice nucleating particles on precipitation processes and supercooled liquid in mixed-phase orographic clouds, Atmos. Chem. Phys., 17, 1017–1035, https://doi.org/10.5194/acp-17-1017-2017, 2017. a, b, c
Gettelman, A., Morrison, H., Terai, C. R., and Wood, R.: Microphysical process rates and global aerosol–cloud interactions, Atmos. Chem. Phys., 13, 9855–9867, https://doi.org/10.5194/acp-13-9855-2013, 2013. a
Gierens, R., Kneifel, S., Shupe, M. D., Ebell, K., Maturilli, M., and Löhnert, U.: Low-level mixed-phase clouds in a complex Arctic environment, Atmos. Chem. Phys., 20, 3459–3481, https://doi.org/10.5194/acp-20-3459-2020, 2020. a, b
Goosse, H., Kay, J. E., Armour, K. C., Bodas-Salcedo, A., Chepfer, H., Docquier, D., Jonko, A., Kushner, P. J., Lecomte, O., Massonnet, F., Park, H.-S., Pithan, F., Svensson, G., and Vancoppenolle, M.: Quantifying climate feedbacks in polar regions, Nat. Commun., 9, 1919, https://doi.org/10.1038/s41467-018-04173-0, 2018. a
Heinze, R., Dipankar, A., Henken, C. C., Moseley, C., Sourdeval, O., Trömel, S., Xie, X., Adamidis, P., Ament, F., Baars, H., Barthlott, C., Behrendt, A., Blahak, U., Bley, S., Brdar, S., Brueck, M., Crewell, S., Deneke, H., Girolamo, P. D., Evaristo, R., Fischer, J., Frank, C., Friederichs, P., Göcke, T., Gorges, K., Hande, L., Hanke, M., Hansen, A., Hege, H., Hoose, C., Jahns, T., Kalthoff, N., Klocke, D., Kneifel, S., Knippertz, P., Kuhn, A., Laar, T. v., Macke, A., Maurer, V., Mayer, B., Meyer, C. I., Muppa, S. K., Neggers, R. A. J., Orlandi, E., Pantillon, F., Pospichal, B., Röber, N., Scheck, L., Seifert, A., Seifert, P., Senf, F., Siligam, P., Simmer, C., Steinke, S., Stevens, B., Wapler, K., Weniger, M., Wulfmeyer, V., Zängl, G., Zhang, D., and Quaas, J.: Large‐eddy simulations over Germany using ICON: a comprehensive evaluation, Q. J. Roy. Meteor. Soc., 143, 69–100, https://doi.org/10.1002/qj.2947, 2017. a
Huang, Y., Dong, X., Kay, J. E., Xi, B., and McIlhattan, E. A.: The climate response to increased cloud liquid water over the Arctic in CESM1: a sensitivity study of Wegener-Bergeron-Findeisen process, Clim. Dynam., 56, 3373–3394, https://doi.org/10.1007/s00382-021-05648-5, 2021. a
Kalesse, H., de Boer, G., Solomon, A., Oue, M., Ahlgrimm, M., Zhang, D., Shupe, M. D., Luke, E., and Protat, A.: Understanding Rapid Changes in Phase Partitioning between Cloud Liquid and Ice in Stratiform Mixed-Phase Clouds: An Arctic Case Study, Mon. Weather Rev., 144, 4805–4826, https://doi.org/10.1175/MWR-D-16-0155.1, 2016. a, b
Kay, J. E., L'Ecuyer, T., Chepfer, H., Loeb, N., Morrison, A., and Cesana, G.: Recent Advances in Arctic Cloud and Climate Research, Current Climate Change Reports, 2, 159–169, https://doi.org/10.1007/s40641-016-0051-9, 2016. a
Kiszler, T.: TracyMcBean/Kiszler_et_al_2023_microphysics: First revision (v2.0.0-alpha), Zenodo [code], https://doi.org/10.5281/zenodo.10945484, 2024. a
Kiszler, T., Ebell, K., and Schemann, V.: A Performance Baseline for the Representation of Clouds and Humidity in Cloud-Resolving ICON-LEM Simulations in the Arctic, J. Adv. Model. Earth Syst., 15, e2022MS003299, https://doi.org/10.1029/2022MS003299, 2023a. a, b, c, d, e, f, g, h
Kiszler, T., Schemann, V., and Ori, D.: ICON-LEM Ny-Ålesund low-level clouds polar night and polar day 2021/2022, Zenodo [data set], https://doi.org/10.5281/zenodo.10117706, 2023b. a, b
Komurcu, M., Storelvmo, T., Tan, I., Lohmann, U., Yun, Y., Penner, J. E., Wang, Y., Liu, X., and Takemura, T.: Intercomparison of the cloud water phase among global climate models, J. Geophys. Res.-Atmos., 119, 3372–3400, https://doi.org/10.1002/2013JD021119, 2014. a, b
Korolev, A., McFarquhar, G., Field, P. R., Franklin, C., Lawson, P., Wang, Z., Williams, E., Abel, S. J., Axisa, D., Borrmann, S., Crosier, J., Fugal, J., Krämer, M., Lohmann, U., Schlenczek, O., Schnaiter, M., and Wendisch, M.: Mixed-Phase Clouds: Progress and Challenges, Meteor. Mon., 58, 5.1–5.50, https://doi.org/10.1175/AMSMONOGRAPHS-D-17-0001.1, 2017. a
Korolev, A. V.: Rates of phase transformations in mixed-phase clouds, Q. J. Roy. Meteor. Soc., 134, 595–608, https://doi.org/10.1002/qj.230, 2008. a, b, c
Lasher-Trapp, S., Kumar, S., Moser, D. H., Blyth, A. M., French, J. R., Jackson, R. C., Leon, D. C., and Plummer, D. M.: On Different Microphysical Pathways to Convective Rainfall, J. Appl. Meteorol. Clim., 57, 2399–2417, https://doi.org/10.1175/JAMC-D-18-0041.1, 2018. a
McGraw, Z., Storelvmo, T., Polvani, L. M., Hofer, S., Shaw, J. K., and Gettelman, A.: On the Links Between Ice Nucleation, Cloud Phase, and Climate Sensitivity in CESM2, Geophys. Res. Lett., 50, e2023GL105053, https://doi.org/10.1029/2023GL105053, 2023. a
Middlemas, E. A., Kay, J. E., Medeiros, B. M., and Maroon, E. A.: Quantifying the Influence of Cloud Radiative Feedbacks on Arctic Surface Warming Using Cloud Locking in an Earth System Model, Geophys. Res. Lett., 47, e2020GL089207, https://doi.org/10.1029/2020GL089207, 2020. a
Mioche, G., Jourdan, O., Ceccaldi, M., and Delanoë, J.: Variability of mixed-phase clouds in the Arctic with a focus on the Svalbard region: a study based on spaceborne active remote sensing, Atmos. Chem. Phys., 15, 2445–2461, https://doi.org/10.5194/acp-15-2445-2015, 2015. a, b
Mitchell, J. F. B., Senior, C. A., and Ingram, W. J.: C02 and climate: a missing feedback?, Nature, 341, 132–134, https://doi.org/10.1038/341132a0, 1989. a, b
Morrison, H., van Lier-Walqui, M., Fridlind, A. M., Grabowski, W. W., Harrington, J. Y., Hoose, C., Korolev, A., Kumjian, M. R., Milbrandt, J. A., Pawlowska, H., Posselt, D. J., Prat, O. P., Reimel, K. J., Shima, S.-I., van Diedenhoven, B., and Xue, L.: Confronting the Challenge of Modeling Cloud and Precipitation Microphysics, J. Adv. Model. Earth Syst., 12, e2019MS001689, https://doi.org/10.1029/2019MS001689, 2020. a
Nomokonova, T., Ebell, K., Löhnert, U., Maturilli, M., Ritter, C., and O'Connor, E.: Statistics on clouds and their relation to thermodynamic conditions at Ny-Ålesund using ground-based sensor synergy, Atmos. Chem. Phys., 19, 4105–4126, https://doi.org/10.5194/acp-19-4105-2019, 2019. a
Omanovic, N., Ferrachat, S., Fuchs, C., Henneberger, J., Miller, A. J., Ohneiser, K., Ramelli, F., Seifert, P., Spirig, R., Zhang, H., and Lohmann, U.: Evaluating the Wegener–Bergeron–Findeisen process in ICON in large-eddy mode with in situ observations from the CLOUDLAB project, Atmos. Chem. Phys., 24, 6825–6844, https://doi.org/10.5194/acp-24-6825-2024, 2024. a, b
Phillips, V. T. J., DeMott, P. J., and Andronache, C.: An Empirical Parameterization of Heterogeneous Ice Nucleation for Multiple Chemical Species of Aerosol, J. Atmos. Sci., 65, 2757–2783, https://doi.org/10.1175/2007JAS2546.1, 2008. a, b
Rantanen, M., Karpechko, A. Y., Lipponen, A., Nordling, K., Hyvärinen, O., Ruosteenoja, K., Vihma, T., and Laaksonen, A.: The Arctic has warmed nearly four times faster than the globe since 1979, Communications Earth & Environment, 3, 168, https://doi.org/10.1038/s43247-022-00498-3, 2022. a
Schemann, V. and Ebell, K.: Simulation of mixed-phase clouds with the ICON large-eddy model in the complex Arctic environment around Ny-Ålesund, Atmos. Chem. Phys., 20, 475–485, https://doi.org/10.5194/acp-20-475-2020, 2020. a, b
Segal, Y. and Khain, A.: Dependence of droplet concentration on aerosol conditions in different cloud types: Application to droplet concentration parameterization of aerosol conditions, J. Geophys. Res.-Atmos., 111, D15204, https://doi.org/10.1029/2005JD006561, 2006. a, b
Seifert, A. and Beheng, K. D.: A two-moment cloud microphysics parameterization for mixed-phase clouds. Part 1: Model description, Meteorol. Atmos. Phys., 92, 45–66, https://doi.org/10.1007/s00703-005-0112-4, 2006. a, b, c
Shaw, J., McGraw, Z., Bruno, O., Storelvmo, T., and Hofer, S.: Using Satellite Observations to Evaluate Model Microphysical Representation of Arctic Mixed-Phase Clouds, Geophys. Res. Lett., 49, e2021GL096191, https://doi.org/10.1029/2021GL096191, 2022. a, b
Shupe, M. D. and Intrieri, J. M.: Cloud Radiative Forcing of the Arctic Surface: The Influence of Cloud Properties, Surface Albedo, and Solar Zenith Angle, J. Climate, 17, 616–628, https://doi.org/10.1175/1520-0442(2004)017<0616:CRFOTA>2.0.CO;2, 2004. a
Shupe, M. D., Kollias, P., Persson, P. O. G., and McFarquhar, G. M.: Vertical Motions in Arctic Mixed-Phase Stratiform Clouds, J. Atmos. Sci., 65, 1304–1322, https://doi.org/10.1175/2007JAS2479.1, 2008. a, b
Storelvmo, T. and Tan, I.: The Wegener-Bergeron-Findeisen process? Its discovery and vital importance for weather and climate, Meteorol. Z., 24, 455–461, https://doi.org/10.1127/metz/2015/0626, 2015. a
Storelvmo, T., Tan, I., and Korolev, A. V.: Cloud Phase Changes Induced by CO2 Warming – a Powerful yet Poorly Constrained Cloud-Climate Feedback, Curr. Clim. Change Rep., 1, 288–296, https://doi.org/10.1007/s40641-015-0026-2, 2015. a
Tan, I., Storelvmo, T., and Zelinka, M. D.: Observational constraints on mixed-phase clouds imply higher climate sensitivity, Science, 352, 224–227, https://doi.org/10.1126/science.aad5300, 2016. a
Zelinka, M. D., Myers, T. A., McCoy, D. T., Po-Chedley, S., Caldwell, P. M., Ceppi, P., Klein, S. A., and Taylor, K. E.: Causes of Higher Climate Sensitivity in CMIP6 Models, Geophys. Res. Lett., 47, e2019GL085782, https://doi.org/10.1029/2019GL085782, 2020. a, b
Zhang, M., Xie, S., Liu, X., Lin, W., Zhang, K., Ma, H.-Y., Zheng, X., and Zhang, Y.: Toward Understanding the Simulated Phase Partitioning of Arctic Single-Layer Mixed-Phase Clouds in E3SM, Earth and Space Science, 7, e2020EA001125, https://doi.org/10.1029/2020EA001125, 2020. a
- Abstract
- Introduction
- Methods and data
- Results
- Discussion and conclusions
- Appendix A: Flowchart of microphysical wrapper
- Appendix B: WBF dependence on SLF
- Appendix C: Process dependence on environmental conditions
- Code and data availability
- Author contributions
- Competing interests
- Disclaimer
- Acknowledgements
- Financial support
- Review statement
- References