the Creative Commons Attribution 4.0 License.
the Creative Commons Attribution 4.0 License.
 | 07 Sep 2023
The export of African mineral dust across the Atlantic and its impact over the Amazon Basin
Xurong Wang
Qiaoqiao Wang
Maria Prass
Christopher Pöhlker
Daniel Moran-Zuloaga
Paulo Artaxo
Jianwei Gu
Ning Yang
Xiajie Yang
Jiangchuan Tao
Juan Hong
Nan Ma
Yafang Cheng
Meinrat O. Andreae
The Amazon Basin is frequently influenced by transatlantic transport of African dust plumes during its wet season (January–April), which not only interrupts the near-pristine atmospheric condition in that season, but also provides nutrient inputs to the Amazon rainforest upon deposition. In this study, we use the chemical transport model GEOS-Chem to investigate the impact of the export of African mineral dust to the Amazon Basin during the period of 2013–2017, constrained by multiple datasets obtained from the AErosol RObotic NETwork (AERONET), MODIS, as well as the Cayenne site and the Amazon Tall Tower Observatory (ATTO) site in the Amazon Basin. With an optimized particle mass size distribution (PMSD) of dust aerosols, the model captures observed aerosol optical depth (AOD) well in terms of both the mean value and the decline rate of the logarithm of AOD over the Atlantic Ocean along the transport path (AOaTP), implying consistency with the observed export efficiency of African dust along the transatlantic transport. With an annual emission of 0.73±0.12 Pg yr−1, African dust entering the Amazon Basin during the wet season accounts for 40±4.5 % (up to 70 %) of surface aerosol mass concentrations over the basin. Observed dust peaks over the Amazon Basin are generally associated with relatively higher African dust emissions (including the Sahara and the Sahel) and longer lifetimes of dust along the transatlantic transport, i.e., higher export efficiency of African dust across the Atlantic Ocean. The frequency of dust events during the wet season is around 18 % when averaged over the Amazon Basin, with maxima of over 60 % at the northeastern coast. During the dust events, AOD over most of the Amazon Basin is dominated by dust. Based on dust deposition, we further estimate annual inputs of 52±8.7, 0.97±0.16, and 21±3.6 mg m−2 yr−1 for iron, phosphorus, and magnesium, respectively, into the Amazon rainforest, which may to some extent compensate for the hydrologic losses of nutrients in the forest ecosystem.
- Article
(10849 KB) - Full-text XML
-
Supplement
(511 KB) - BibTeX
- EndNote


The desert in northern Africa, being the world's largest dust source, contributes over 50 % of global dust emissions (Kok et al., 2021; Wang et al., 2016). Dust particles are uplifted by strong surface winds and are then typically transported downwind for a long distance, reaching the Atlantic, the Caribbean, North and South America, and Europe (Prospero et al., 1981; Ben-Ami et al., 2012; Yu et al., 2019; Swap et al., 1992; Prospero et al., 2014; Wang et al., 2020). The emission varies on daily to seasonal and even decadal timescales and is largely affected by local wind speed, land surface cover, soil moisture, etc. (Ridley et al., 2014; Mahowald et al., 2006). Once present in the atmosphere, mineral dust can not only degrade air quality downwind, but can also affect the radiation balance of the Earth–atmosphere system directly by scattering or absorbing solar radiation (Ryder et al., 2013b) and indirectly by altering cloud properties via acting as cloud condensation nuclei or ice nuclei (Chen et al., 1998; Demott et al., 2003; Mahowald and Kiehl, 2003; Dusek et al., 2006). Additionally, mineral dust contains iron, phosphorous, and other nutrients and could affect ocean biogeochemistry and fertilize tropical forest upon downwind deposition (Niedermeier et al., 2014; Rizzolo et al., 2017).
There is increased concern about the impact of African dust exerted over the Amazon Basin, which, being the world's largest rainforest, represents a valuable but also vulnerable ecosystem and is sensitive to any disturbance from climate changes associated with human activities in the future (Andreae et al., 2015; Pöhlker et al., 2019). During the wet season (January–April), Amazonian aerosols are generally dominated by local biogenic aerosols, with remarkably low PM10 mass concentrations of a few micrograms per cubic meter (Andreae et al., 2015; Martin et al., 2010a; Prass et al., 2021). The near-pristine condition, however, is frequently interrupted by the transatlantic transport of African dust toward the Amazon Basin (Andreae et al., 2015; Martin et al., 2010a, b; Talbot et al., 1990). The dusty episodes could drastically increase aerosol optical depth (AOD, by a factor of 4), mass concentrations of coarse aerosols (with diameter >1 µm, up to 100 µg m−3), and crustal elements over the Amazon Basin (Ben-Ami et al., 2010; Pöhlker et al., 2019; Moran-Zuloaga et al., 2018; Baars et al., 2011; Formenti et al., 2001). Therefore, there is great interest in understanding factors controlling the export of African dust toward the Amazon Basin and the impact they might have on the environment, ecosystem, and climate.
Over the past decades, field measurements combined with satellite observation and forward- or back-trajectory analysis have been conducted to explore the long-range transport (LRT) of African dust toward the Amazon Basin (e.g., Ben-Ami et al., 2010; Pöhlker et al., 2018; Prospero et al., 2020). The transatlantic transport of African dust plumes is closely related to annual north–south oscillation of the intertropical convergence zone (ITCZ) (Moran-Zuloaga et al., 2018; Ben-Ami et al., 2012), favoring the path toward the Amazon Basin in the late boreal winter and spring (December–April) as the ITCZ moves southward. In addition to the annual oscillation of ITCZ, the export efficiency of African dust toward the Amazon Basin also greatly depends on the atmospheric lifetime of mineral dust, which is largely affected by meteorological conditions (e.g., precipitation). Dust particles are subject to wet removal when they are within or underneath precipitating clouds. For instance, Yu et al. (2020) argued that El Djouf, in the western Sahara, contributes more dust to the Amazon Basin than the Bodélé Depression as the transport paths of dust released from El Djouf are less affected by rainy clouds.
Besides meteorological conditions, the lifetime of dust particles and consequently the export efficiency of African dust toward the Amazon Basin could also be affected by the size distribution of dust particles. Previous studies have observed that volume or mass fractions of coarse-mode dust particles, giant particles in particular, tend to be reduced along the transport due to their higher gravitational settling velocities (Ryder et al., 2018, 2013a, b; Van Der Does et al., 2016). Moreover, the optical properties of mineral dust are also strongly size-dependent, especially for those in the submicron range (Liu et al., 2018; Di Biagio et al., 2019; Ysard et al., 2018). For instance, Ryder et al. (2013a) reported a loss of 60 %–90 % of particles with diameter >30 µm 12 h after uplift and consequently an increase in the single-scattering albedo from 0.92 to 0.95 associated with the change in the size distribution of dust aerosols. Therefore, the size distribution of dust particles is a key factor determining the efficiency of dust transport and consequently the environmental and climate effects of the mineral dust downwind (Mahowald et al., 2011a, b).
So far, a few studies have attempted to quantify the impact of the LRT of African dust over the Amazon Basin, but they have mainly focused on dust deposition only (e.g., Yu et al., 2015a; Ridley et al., 2012; Yu et al., 2019). The estimates of annual dust deposition and deposition rates into the Amazon Basin exhibit a wide range (7.7–50 Tg yr−1 and 0.8–19 g m−2 yr−1, respectively) attributed to the application of different methods and the intrinsic uncertainties associated with each method (Kok et al., 2021; Yu et al., 2015b; Kaufman, 2005; Swap et al., 1992). For example, the results based on Cloud-Aerosol Lidar and Infrared Pathfinder Satellite Observations (CALIPSO) are subject to the uncertainty associated with the Cloud-Aerosol Lidar with Orthogonal Polarization (CALIOP) extinction, vertical profile shape, dust discrimination, diurnal variations of dust transport, and below-cloud dust missed by CALIOP (Yu et al., 2015a).
While models could be considered a useful tool for comprehensively assessing the transatlantic transport of African dust toward the Amazon Basin and the consequent impact over the Amazon Basin, there exist considerable differences among model results that are attributed to the uncertainties associated with the dust parameterization in the model, including emission schemes, size distributions of dust particles, or dust deposition (Kim et al., 2014; Huneeus et al., 2011; Mahowald et al., 2014). Observational constraints on the modeling results along the transport from source regions to receptor regions are thus in urgent need of accomplishing a better evaluation of factors controlling the LRT of African dust and its overall impact over the Amazon Basin.
Here, we present a detailed multiyear simulation of the export of African dust across the Atlantic and its impact over the Amazon Basin (around 8.8×10⁶ km2; see Fig. 1 for the defined area) during 2013–2017 with the chemical transport model GEOS-Chem. The aims of this study are (1) to evaluate the model performance of dust simulation, including the particle mass size distribution (PMSD), optical properties, mass concentrations, and export efficiency of African dust toward the Amazon Basin; (2) to analyze factors controlling the export of African dust toward the Amazon Basin; and (3) to give a comprehensive examination of the impact of African dust over the Amazon Basin, including surface aerosol concentrations, AOD, and nutrient inputs upon deposition. The paper is organized as follows. Section 2 describes the model setup for dust simulation and the observational datasets applied to constrain the model results. Section 3 gives the model evaluation regarding the simulation of the export of African dust toward the Amazon Basin. Section 4 presents the model results, including simulated dust emissions in Africa, the transatlantic transport of African dust, and the influence of African dust over the Amazon Basin. Section 5 summarizes the main conclusions drawn from this study.
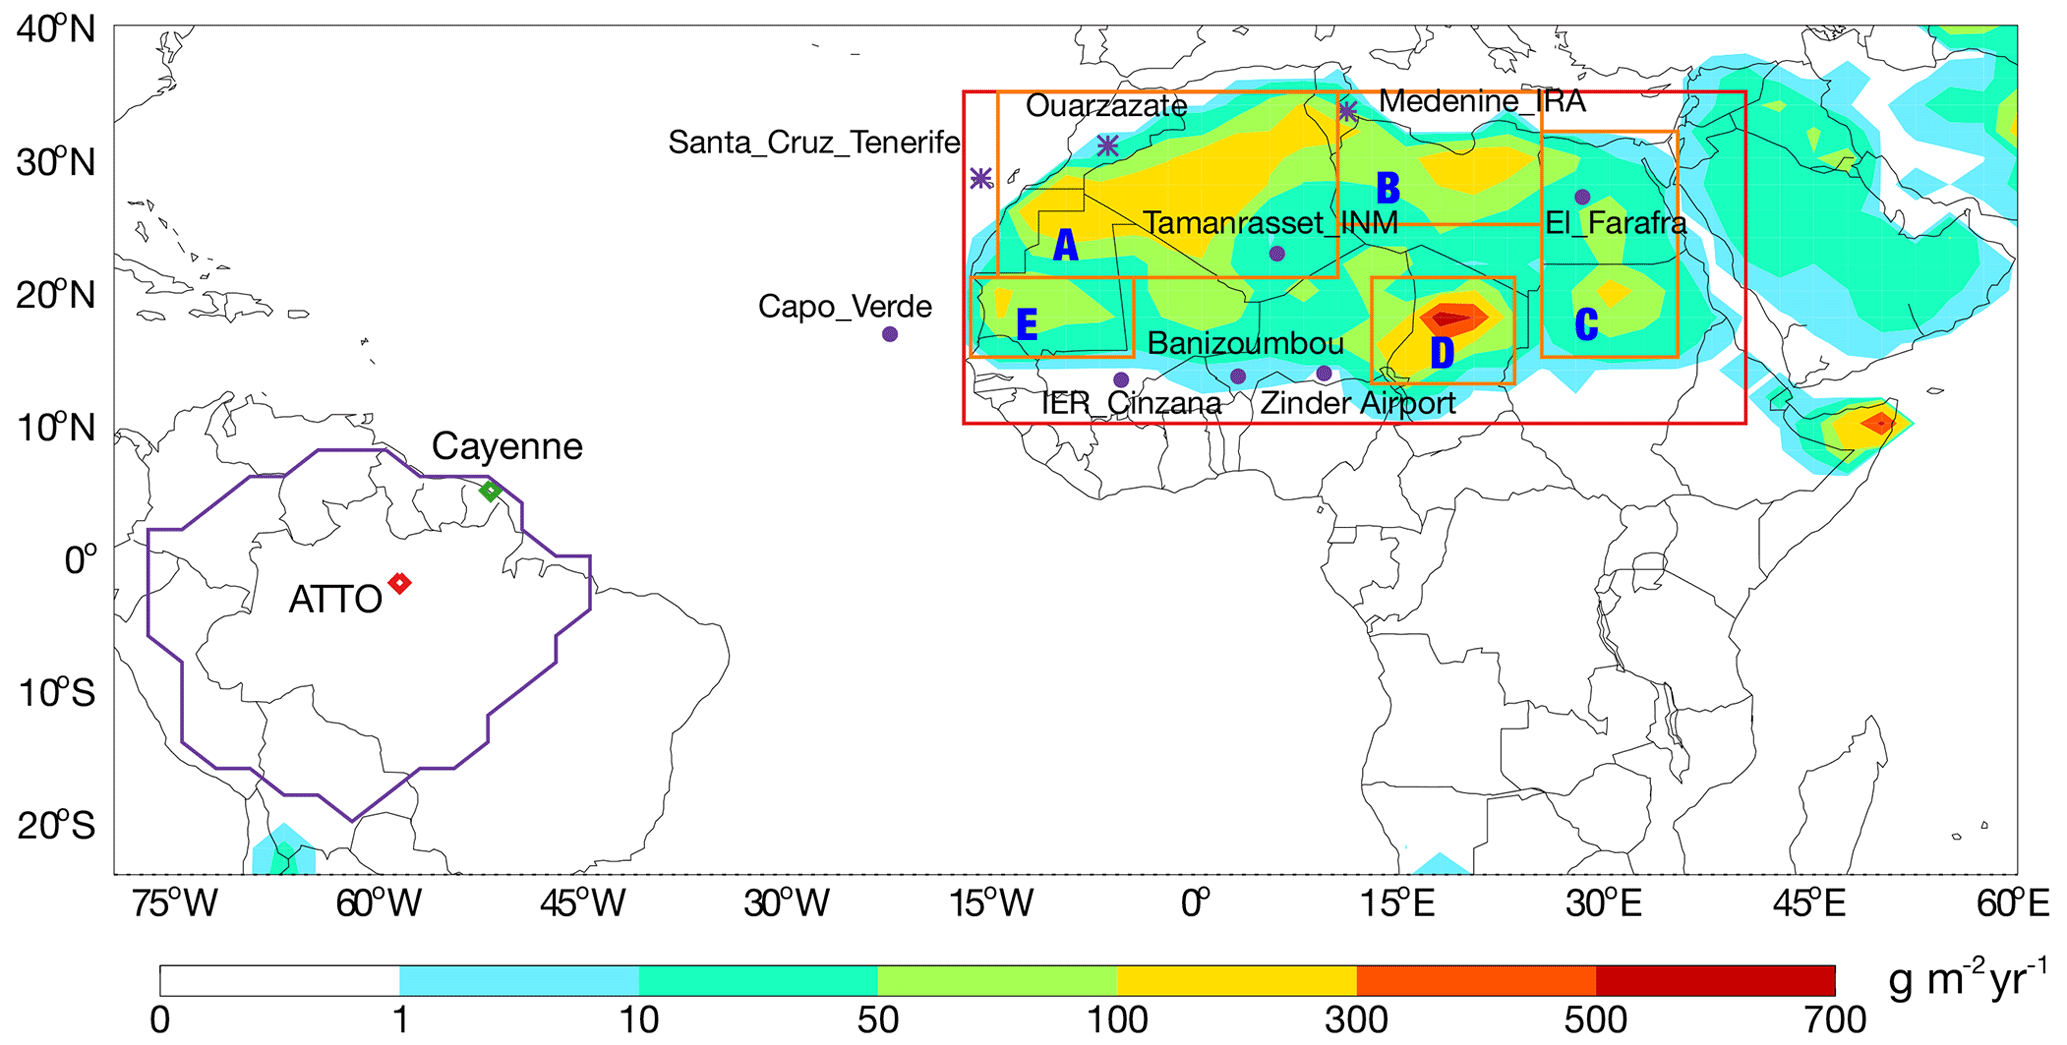
Figure 1Simulated annual dust emissions in GEOS-Chem, averaged from 2013 to 2017. The locations of the AERONET sites used in Fig. 2 are marked as purple symbols, of which circles represent the sites used in Fig. 3. The region of the Amazon Basin is defined by purple lines. The locations of the Cayenne site on the northeastern coast of South America and the ATTO site in the central Amazon Basin are marked as green and red diamonds, respectively. The red rectangle illustrates the area of northern Africa (10–35∘ N, 17.5∘ W–40∘ E), and the orange rectangles show the areas of the five major source regions described in the text (A: 21–35∘ N, 15∘ W–10∘ E; B: 25–35∘ N, 10–25∘ E; C: 15–32∘ N, 25–35∘ E; D: 13–21∘ N, 12.5–23∘ E; E: 15–21∘ N, 17–5∘ W).
2.1 GEOS-Chem model
2.1.1 Model overview
In this study we use the GEOS-Chem model version 12.0.0 (http://www.geos-chem.org, last access: 1 September 2023) to perform the global aerosol simulation with a horizontal resolution of . GEOS-Chem is driven by assimilated meteorological data GEOS-FP from the NASA Global Modeling and Assimilation Office (GMAO) (Lucchesi, 2013) with a native horizontal resolution of , which is then degraded to for the input to GEOS-Chem. We initialize the model with a 1-year spin-up followed by an aerosol simulation from 2013 to 2017.
The aerosol simulation is an offline simulation for aerosol tracers, including black carbon (BC), organic aerosols (OA), sulfate–nitrate–ammonium aerosols in fine mode (≤1 µm in diameter), sea salt in both fine and coarse (>1 µm in diameter) modes, and mineral dust in four size bins covering the size range of 0.2–12 µm in diameter. Aerosol optical properties used for AOD calculation are mainly based on the Global Aerosol Data Set (Koepke et al., 1997), with modifications in aerosol size distributions (Jaeglé et al., 2011; Drury et al., 2010; Wang et al., 2003a, b), hygroscopic growth factors of organic aerosols (Jimenez et al., 2009), and the refractive index of dust (Sinyuk et al., 2003). AOD in the model is then calculated online at selected wavelengths assuming lognormal size distributions of externally mixed aerosols and accounts for hygroscopic growth (Martin et al., 2003).
Wet deposition in GEOS-Chem, based on the scheme of Liu et al. (2001), accounts for scavenging in both convective updrafts and large-scale precipitation. Further updates by Wang et al. (2011) are also applied, accounting for ice or snow scavenging as well as the impaction scavenging in convective updrafts. Dry deposition in the model follows the standard resistance-in-series scheme by Wesely (2007), accounting for turbulent transfer and gravitational settling (Wang et al., 1998; Zhang et al., 2001).
2.1.2 Dust emission and PMSD schemes in the model
The emission of mineral dust is based on the dust entrainment and deposition (DEAD) mobilization scheme of Zender et al. (2003) in the GEOS-Chem model. The DEAD scheme calculates the total vertical dust flux based on the total horizontal saltation flux (Qs) using the theory of White (1979). The Qs depends mainly on the surface wind friction velocity and the threshold friction velocity, which are determined by soil type, soil moisture content, and surface roughness. For more details of the DEAD scheme, readers are referred to Duncan Fairlie et al. (2007).
Freshly emitted dust particles are divided into four size bins in GEOS-Chem: 0.1–1.0, 1.0–1.8, 1.8–3.0, and 3.0–6.0 µm in radius. The first size bin is further divided into four sub-bins (0.1–0.18, 0.18–0.3, 0.3–0.6, and 0.6–1.0 µm in radius) for the calculation of optical properties. While total dust emissions are not affected, optical properties, atmospheric lifetimes, and downwind concentrations of dust particles are sensitive to different PMSD schemes. Table 1 shows the three different PMSD schemes tested in this study: V12, V12_C, and V12_F. Scheme V12, which is derived based on scale-invariant fragmentation theory (Kok, 2011) with modification in tunable parameters (Zhang et al., 2013), is a default set in GEOS-Chem. However, this scheme has only been evaluated for US and Asian dust, not for Africa. On the other hand, V12_C was used in older versions of GEOS-Chem and was constrained from aircraft measurements during the Saharan Dust Experiment (Ridley et al., 2012; Highwood et al., 2003). In addition, we derived V12_F based on the Fennec airborne observations, which also focused on Saharan dust. Among all three PMSDs, V12_C has the largest mass fraction in the first bin (relatively small particles) and the lowest fraction in the last bin (large ones). In contrast, V12_F has the most dust distributed in the last bin (∼70 %) and only a little (around 5 %) in the first bin (0.1–1.0 µm). Simulated mass extinction efficiency (MEE, also shown in Table 1) at a wavelength of 550 nm for dust particles in the first sub-bin (0.1–0.18 µm) is 3.13 m2 g−1 and decreases to 0.16 m2 g−1 for those in the last bin (3.0–6.0 µm). The lifetimes of dust aerosols against deposition are 5.1, 2.2, 1.7, and 0.86 d, respectively, in the four bins (from small to large sizes). Therefore, while having the same emission, total dust AOD, lifetime, and downwind concentrations could vary greatly with PMSD upon emissions. In this study, we will evaluate these three PMSD schemes and the impact on AOD, dust concentrations, as well as the export efficiency along the transatlantic transport from Africa to the Amazon Basin.
Table 1Mass fractions (%) of dust emitted in each bin for different particle mass size distribution (PMSD) schemes tested in GEOS-Chem.
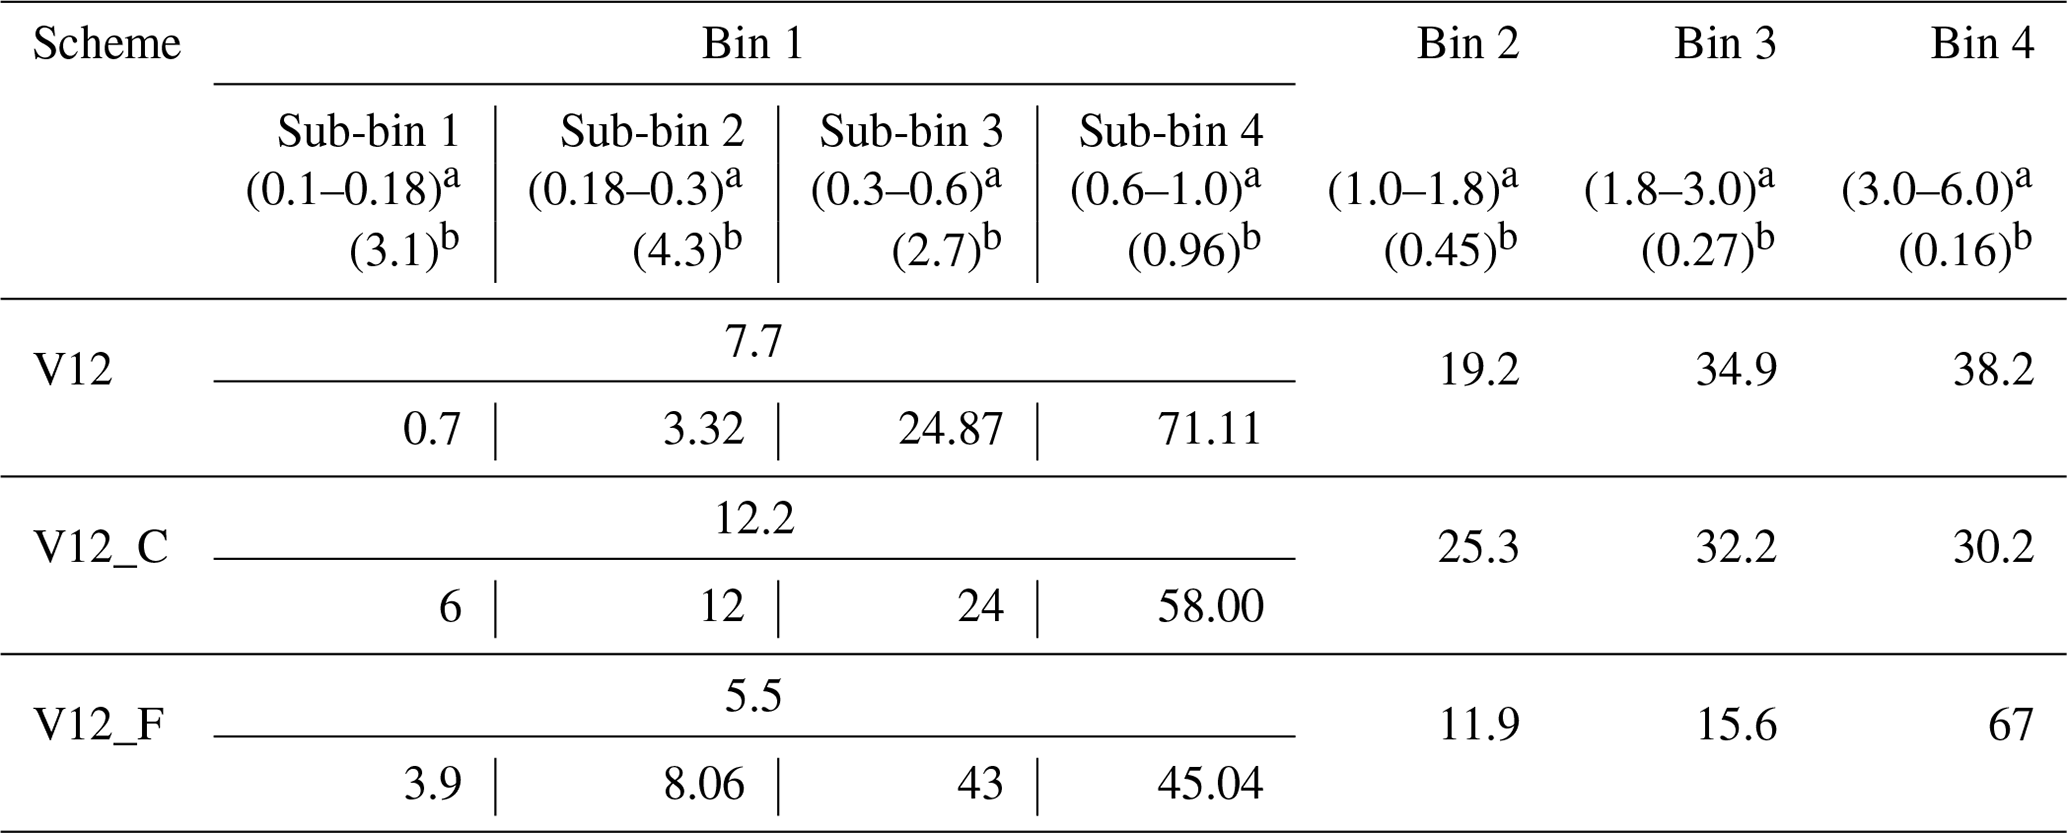
a Size range in the radius (µm) for each bin. b Mass extinction efficiency (MEE) at a wavelength of 550 nm (m2 g−1) for dust particles in each bin in the GEOS-Chem model.
2.2 Observations
The study uses observations from multiple datasets obtained from the AErosol RObotic NETwork (AERONET), MODIS, as well as the Cayenne site and the Amazon Tall Tower Observatory (ATTO) site to constrain model results regarding the simulation of the dust export from Africa to the Amazon Basin. Table 2 summarizes these observations, including the parameters, the spatiotemporal coverage, and the corresponding application in the model. The daily data of AOD (at a wavelength of 675 nm) and the particle volume size distribution (PVSD) from AERONET level 2.0 (https://aeronet.gsfc.nasa.gov/new_web/download_all_v3_aod.html, last access: 22 June 2021; Dubovik et al., 2002) during the years 2013–2017 are used in the study to evaluate dust emissions and its PMSD over the source regions in Africa in the model. The PVSD data provided by AERONET are a column-integrated aerosol volume size distribution with a size range of 0.05–15.0 µm. This is then converted to PMSD using the same densities as in the model. Only sites with valid data accounting for more than 30 % of the total are considered in this study. In addition, to minimize the influence of aerosols other than dust, only data dominated by dust (simulated dust contribution to column-integrated aerosol mass concentrations >95 %) are used for the comparison of PMSD. There are a few sites not far from the coast that could be influenced by sea salt. With the above data screening, the sea salt contribution to total aerosol mass is less than 0.5 %. For the comparison of AOD, the criterion is less stringent to have more data points available and uses data dominated by coarse aerosols (the contribution of fine aerosol to total aerosol volume <3 %). This criterion does not exclude sea salt, and the contribution of sea salt to AOD could be up to 30 % at the Capo_Verde site (16.7∘ N, 22.9∘ W in the eastern–central Atlantic Ocean).
Table 2Summary of the observations used in this study, including the parameters, the spatiotemporal coverage, and the corresponding application in the model.
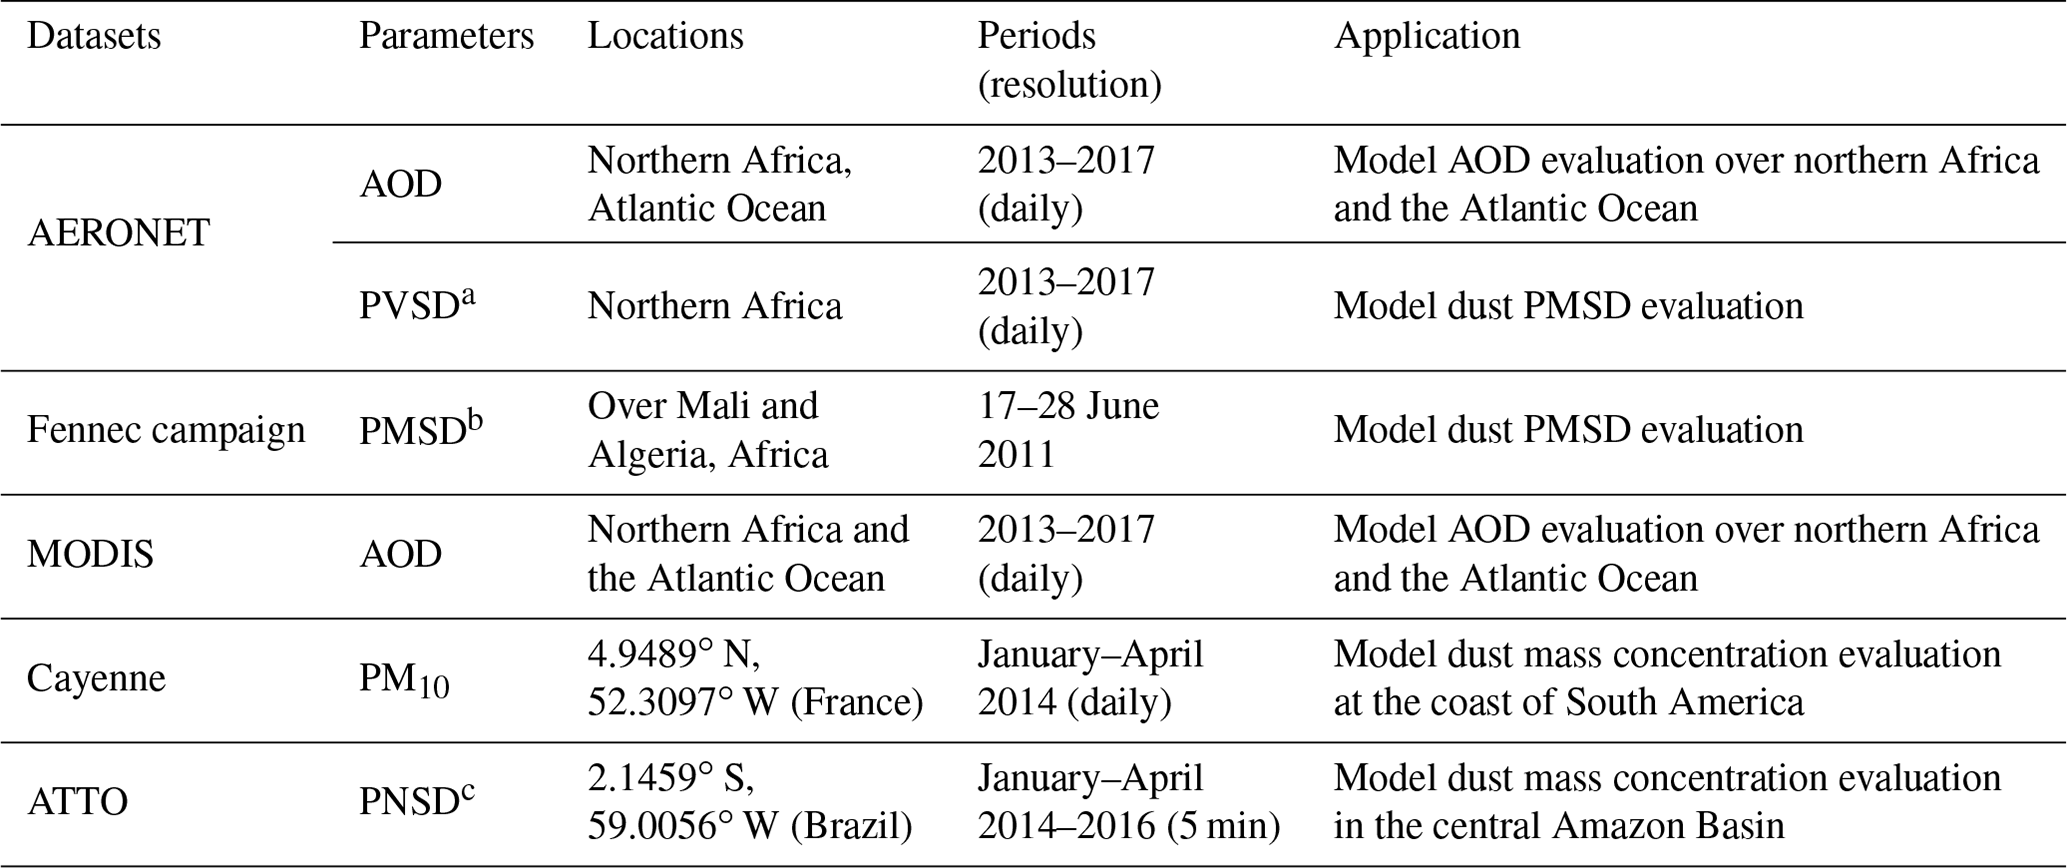
a Particle volume size distribution; b particle mass size distribution; c particle number size distribution.
The study also uses the observed PMSD over the central Sahara during the Fennec campaign (https://africanclimateoxford.net/projects/fennec/, last access: 22 June 2021) for the comparison with AERONET and our model results. Aiming to investigate dust microphysical and optical properties, 42 profiles of particle size distribution (0.1–300 µm in diameter) over both the Sahara and the Atlantic Ocean were sampled from in situ aircraft measurements during the Fennec campaign. For a more detailed description of the aircraft measurements, readers are referred to Ryder et al. (2013a).
In addition to AERONET AOD data, level-3 daily AOD (at a wavelength of 550 nm) data from MODIS installed on the Terra and Aqua platforms (https://ladsweb.modaps.eosdis.nasa.gov/archive/allData/61/, last access: 22 June 2021) are applied in the study to evaluate the transatlantic transport of dust plumes from Africa toward the Amazon Basin. For comparison, we degraded the original horizontal resolution of MODIS data () to , consistent with the model outputs.
Finally, daily PM10 mass concentrations during the wet season (from January to April) in 2014 measured at Cayenne, French Guiana (4.9489∘ N, 52.3097∘ W, located on the northeastern coast of the Amazon Basin, https://doi.org/10.17604/vrsh-w974, marked in Fig. 1) and long-term aerosol measurements at the ATTO site, Brazil (2.1459∘ S, 59.0056∘ W, located in the central Amazon Basin, also marked in Fig. 1) are used in this study to further evaluate the model performance regarding the influence of the LRT of African dust over the Amazon Basin. The measurement at the Cayenne site is carried out on a cooperative basis by personnel of ATMO-Guyane, a nonprofit organization. The PM10 samples are measured by a Taper Element Oscillating Microbalance (TEOM, model 1400 series, ThermoFisher Scientific) and are then returned to Miami for analysis (Prospero et al., 2020). Readers are referred to Prospero et al. (2020) for a detailed description of the site and the data. The ATTO site was established in 2012 for long-term monitoring of climatic, biogeochemical, and atmospheric conditions in the Amazon rainforest. A detailed description of the site and the measurements there can be found in Andreae et al. (2015). In this study, we only use the particle number size distribution from an Optical Particle Sizer (OPS, TSI model 3330; size range of 0.3–10 µm in diameter, divided into 16 size bins) and a Scanning Mobility Particle Sizer (SMPS, TSI model 3080, St. Paul, MN, USA; size range of 10–430 nm in diameter, divided into 104 size bins) over the period from 2014 to 2016. The number size distribution is converted to mass concentrations assuming spherical particles with a constant density of 1.5 g cm−3 (Pöschl et al., 2010).
Here we evaluate three different PMSD schemes regarding the model performance of dust simulation through the comparison with the observed mass size distribution of column-integrated aerosol over Africa, AOD over both Africa and the Atlantic Ocean, as well as PM10 and dust concentrations in the Amazon Basin. Figure 2 shows the mass fractions of column-integrated aerosols retrieved from AERONET sites compared with model results based on different PMSD schemes. The locations of the selected AERONET sites with valid data are marked in Fig. 1 as purple symbols (including asterisks and circles). The mean mass fractions for each bin from AERONET data are 17 %, 27 %, 38 %, and 17 %, respectively. The comparison indicates that the model results based on V12_C agree better with the observations, with a much smaller mean absolute deviation (MAD) of 2.8, followed by 4.2 for V12 and 18 for V12_F. In other words, the model results with other PMSD schemes (V12_F in particular) greatly underestimate the mass fractions in the first bin and overestimate the mass fractions in the last bin. During the Fennec campaign, the aircraft sampled two strong Saharan dust outbreaks with an AOD of up to 1.1, which may be associated with strong winds favoring the uplift of large particles.
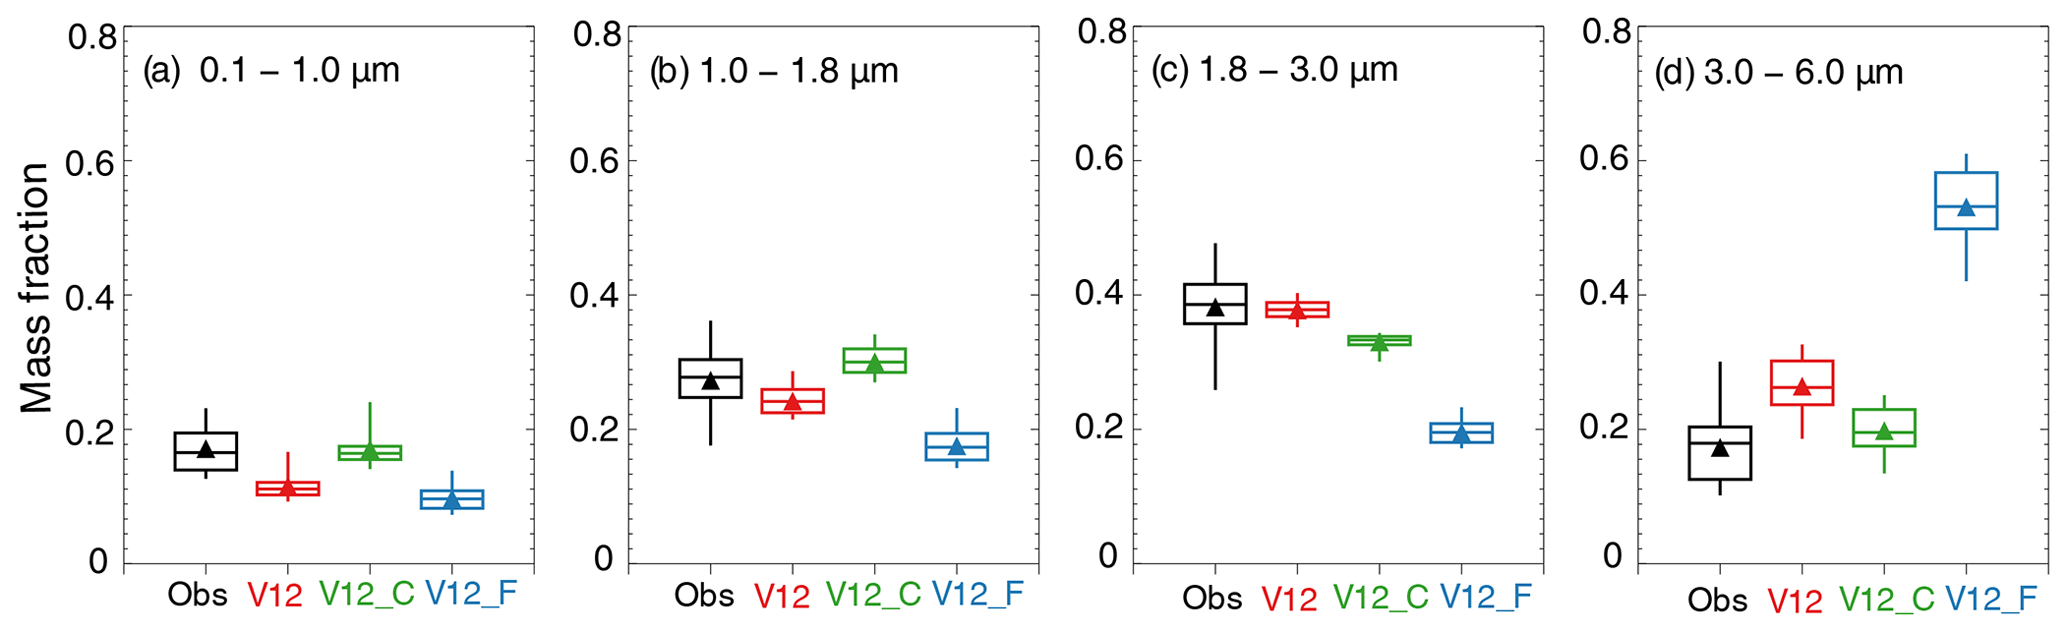
Figure 2Boxplots of the mass fractions of column-integrated aerosols in the four size bins (radius) retrieved from AERONET sites over Africa compared with model results based on different PMSD schemes. The triangles represent the mean values.
Figure 3 shows the times series of daily AOD at a wavelength of 675 nm during the years of 2013–2017 from both AERONET and model results. The locations of the selected AERONET sites with valid data over northern Africa are shown in Fig. 1 as purple circles. The Capo_Verde site is also included to show the model performance over the ocean in addition to the land. Although different PSD schemes have little influence on the correlation between AERONET and model results, with most r around 0.6–0.7, the normalized mean bias (NMB) has been significantly improved in V12_C, with a range of −12 % to 11 % (vs. −33 % to −11 % and −42 % to −19 % for V12 and V12_F, respectively). The severe underestimation in AOD from V12 and V12_F could be attributed to their relatively higher dust fractions distributed in larger size bins with a relatively lower MEE.
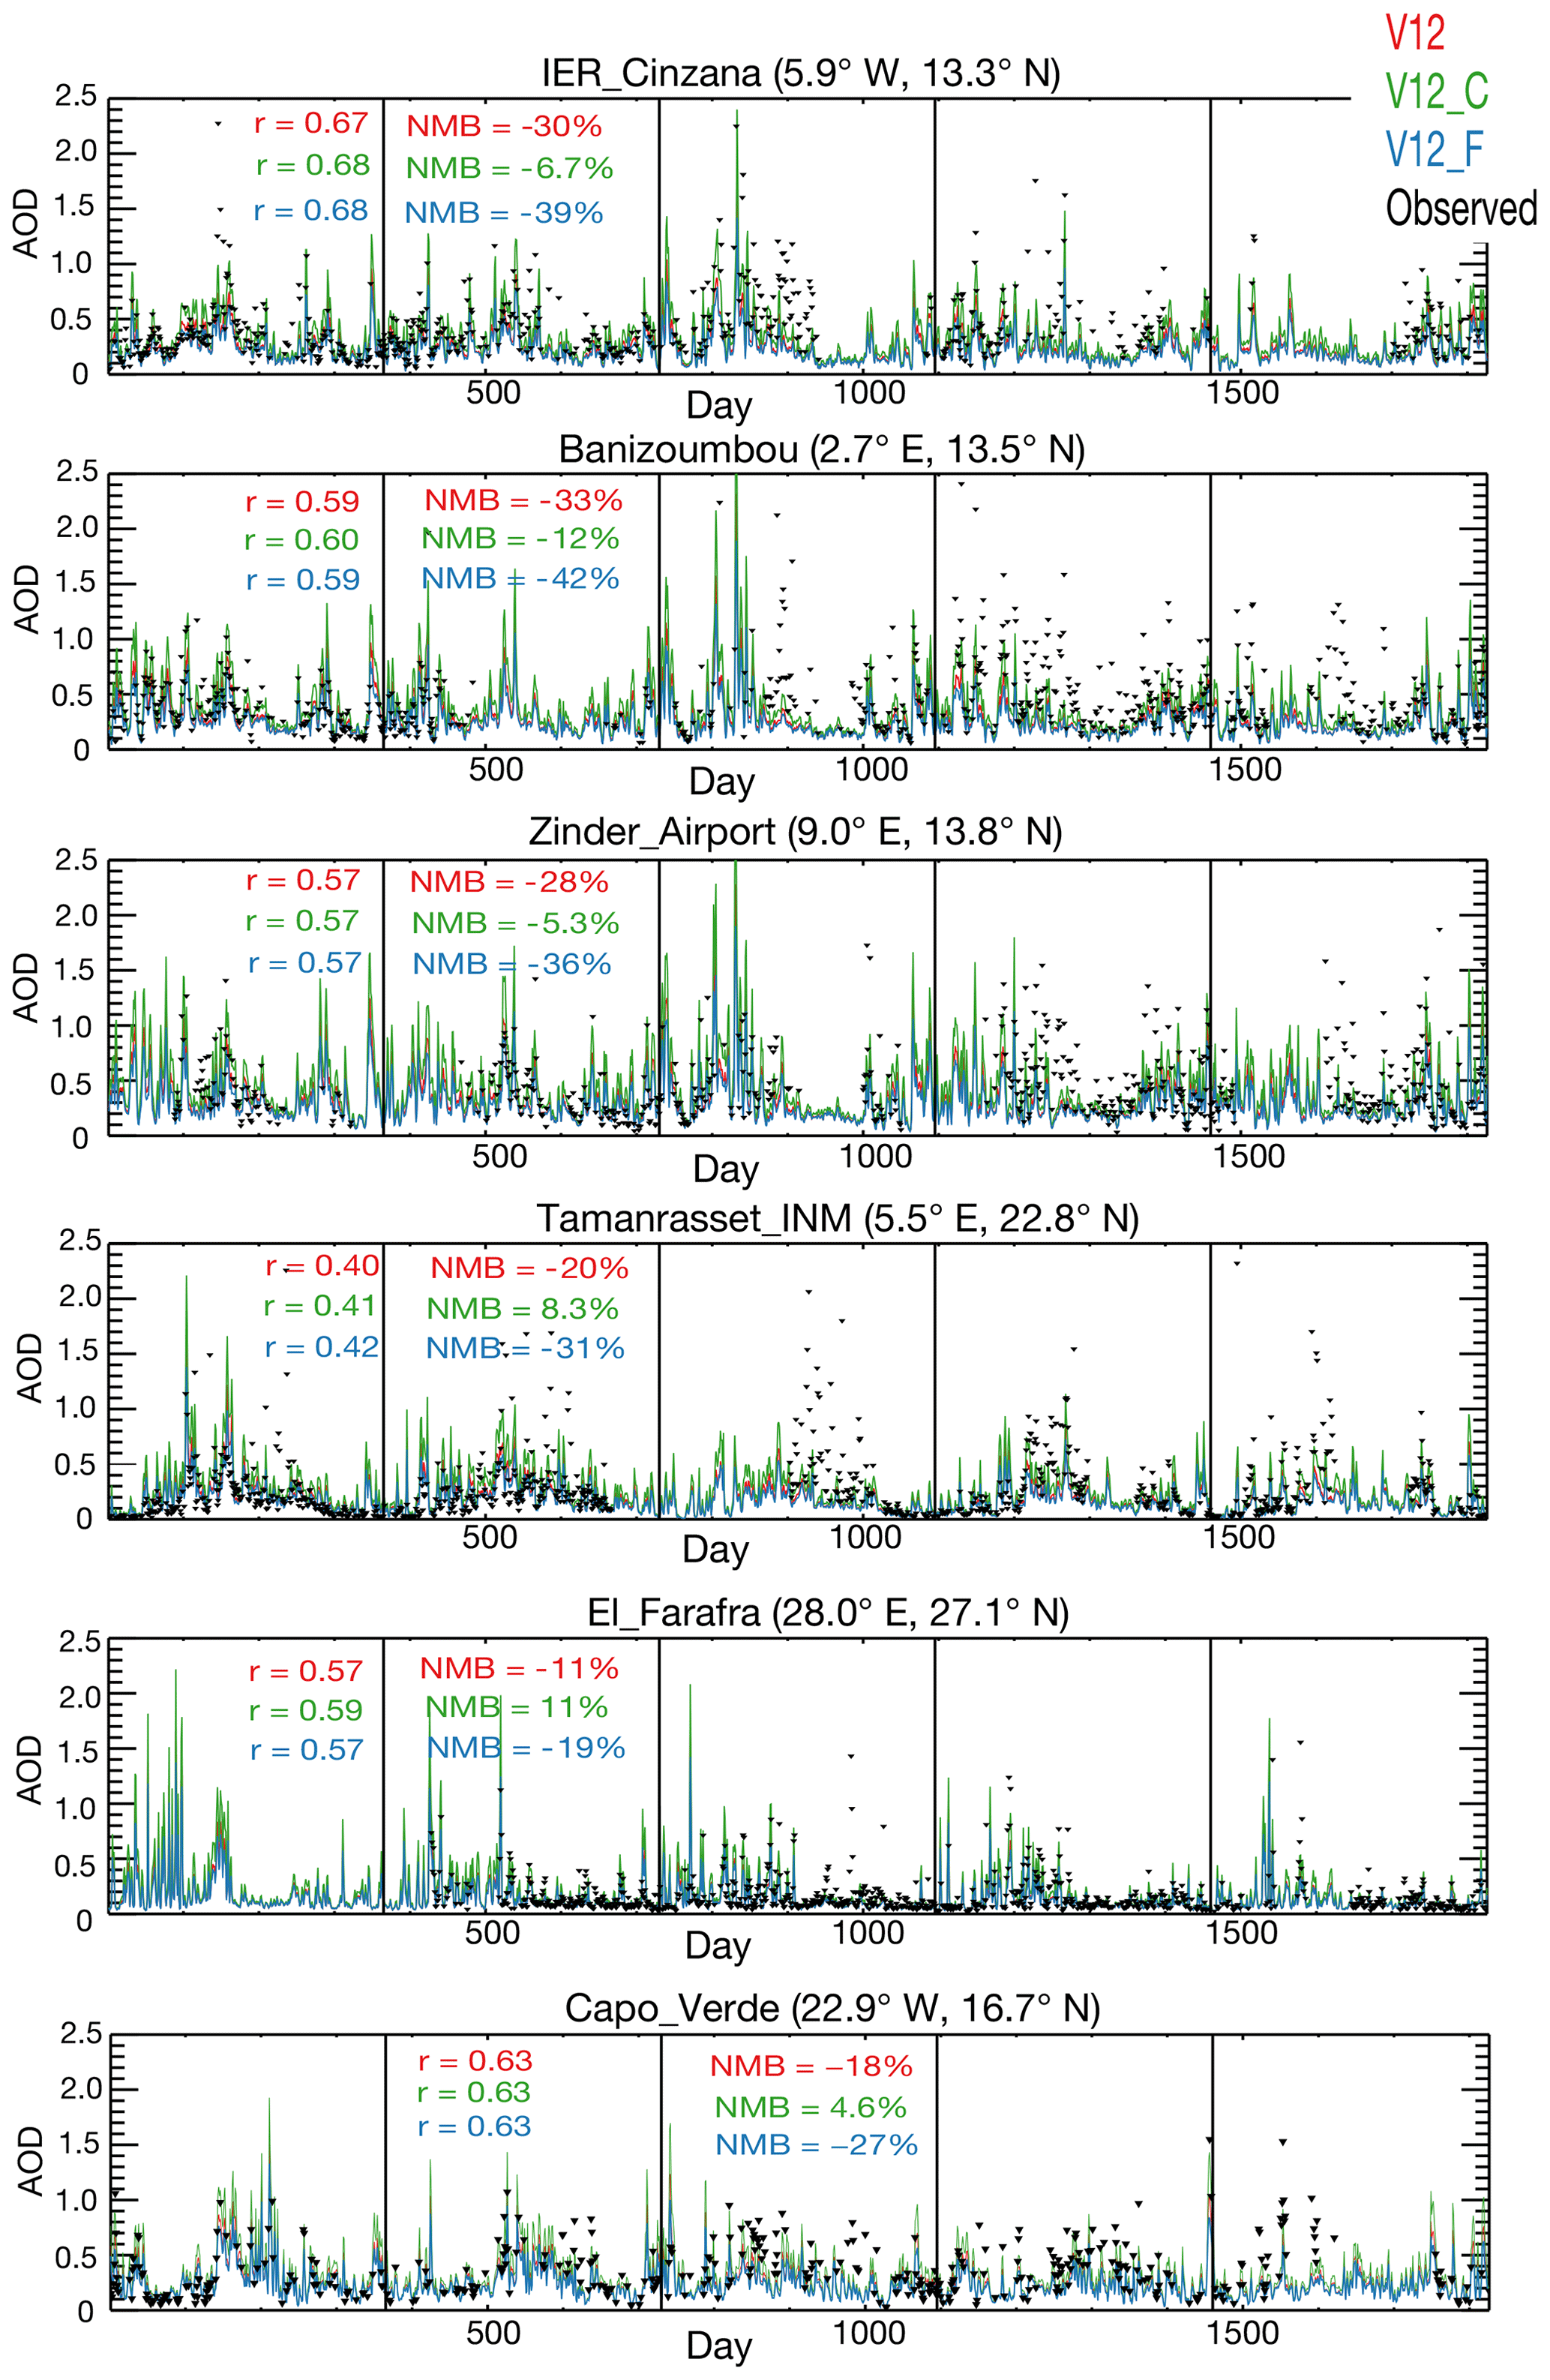
Figure 3Time series of AERONET (black lines) and simulated daily AOD (at a wavelength of 675 nm) during 2013–2017. Normalized mean bias (NMB) and correlation (r) statistics between the AERONET and simulated data are shown as the inset.
In addition, we also compare the spatial distributions of simulated AOD over the Atlantic Ocean with MODIS AOD (at 550 nm) averaged over 2013–2017 in Fig. 4a–d. There is a clear decreasing trend in MODIS AOD along the transatlantic transport from Africa toward South America. Although all the simulations show similar spatial distributions with declining trends of AOD along the transport, the results from V12_C are the most consistent, with MODIS data having the highest r of 0.89 and the smallest NMB of 6.5 % among the three schemes (vs. r of 0.85 and 0.81 and NMBs of −13 % and −19 % for V12 and V12_F, respectively). Note that the model results based on V12_C tend to overestimate MODIS AOD over Africa, while no significant systematic bias is found between V12_C and AERONET AOD. Wang et al. (2016) sampled MODIS data at AERONET sites over Africa and found that MODIS retrieval underestimated AERONET AOD at most sites, with an NMB of −12 % to −36 %, which partly explains the overestimates in MODIS AOD by V12_C here.
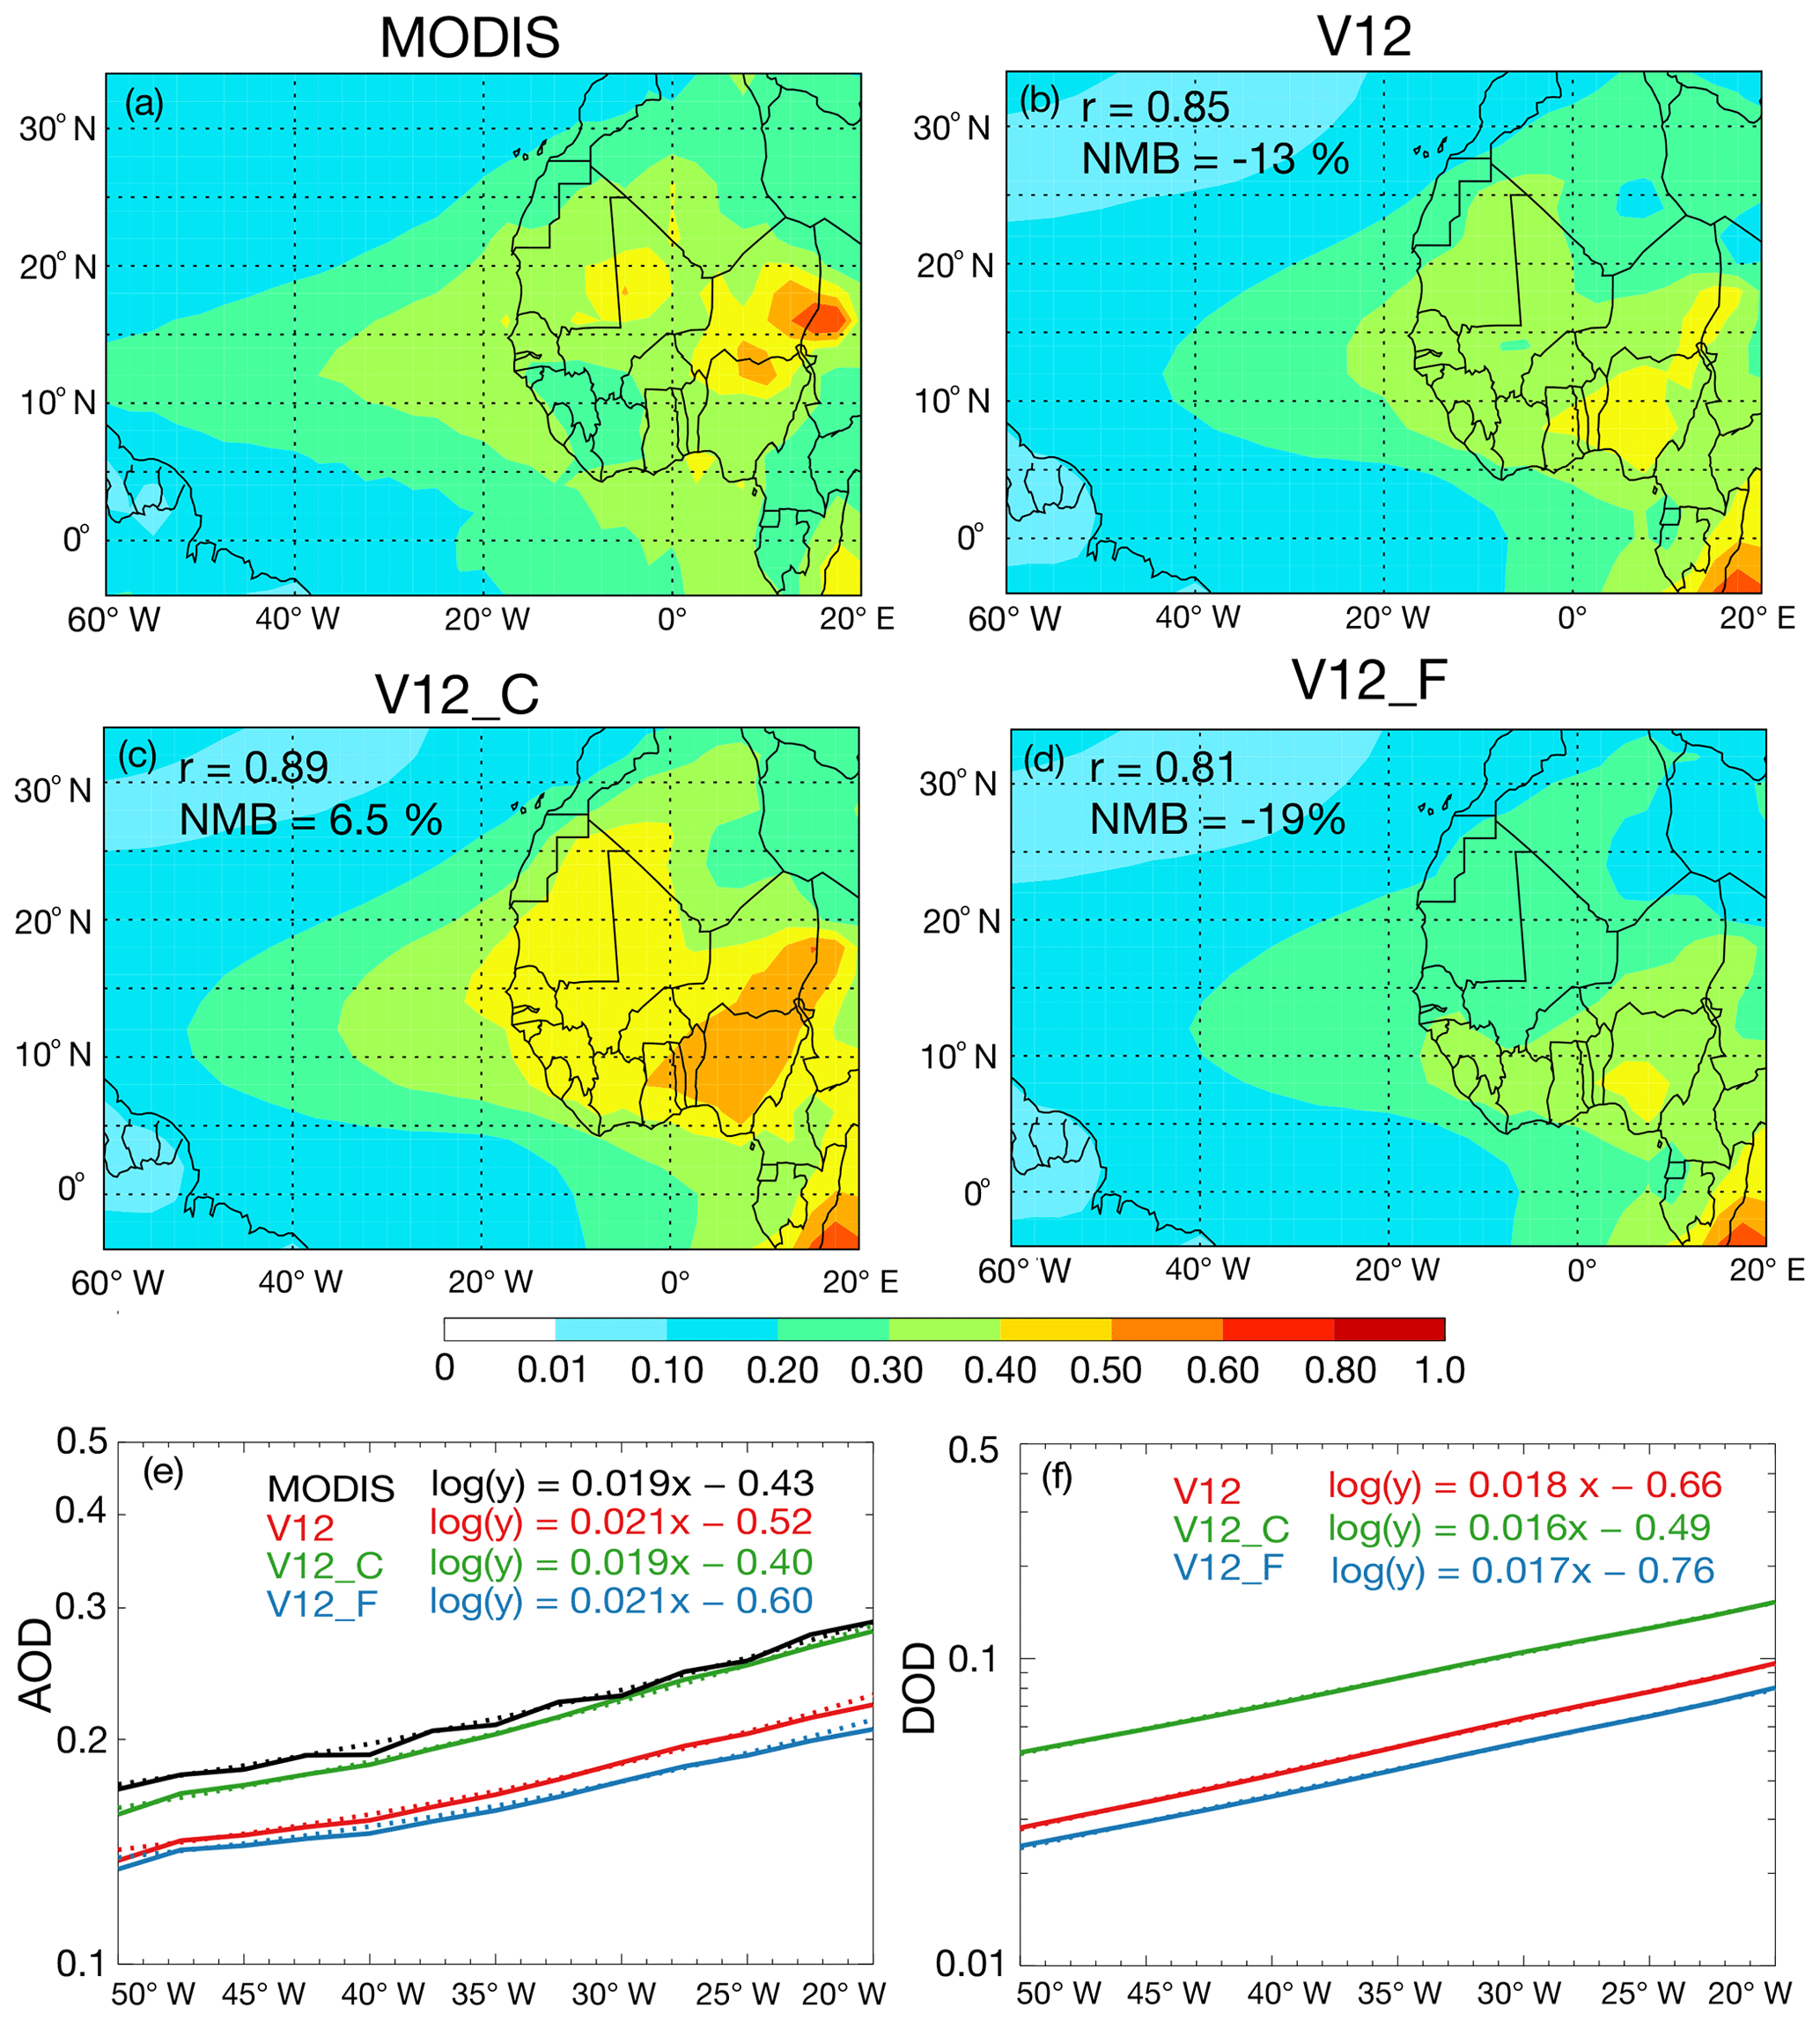
Figure 4(a–d) Spatial distributions of observed and simulated AOD (at 550 nm) over the region of 10–35∘ N and 60∘ W–20∘ E averaged over 2013–2017. NMB and r between the simulations and MODIS AOD are shown as the inset. (e) MODIS (black) and simulated (color) AOD as well as (f) simulated dust optical depth (DOD) at 550 nm along the transect from 20 to 50∘ W, averaged over 5∘ S–25∘ N for the period 2013–2017. The solid lines represent averaged data, and the dashed lines are the logarithmic trend lines.
Assuming first-order removal of aerosol along the transport, we could derive the removal rates of aerosols, estimated as the gradient of the logarithm of AOD – log(AOD) – against the distance over the Atlantic Ocean along the transport path (AOaTP, 5∘ S–25∘ N, 20–50∘ W; Fig. 4e). The decline rate of MODIS log(AOD) is 0.019±0.0025 per degree. A similar decline rate of 0.019±0.0029 per degree is found for the simulated log(AOD) based on V12_C. In contrast, simulations with V12 and V12_F exhibit relatively steeper slopes of 0.021±0.0040 and 0.021±0.0041, respectively, implying too much aerosol removal and thus lower export efficiency along the transport. To specify the impact of different PMSDs on the export efficiency of dust aerosols toward the Amazon Basin, Fig. 4f also shows simulated dust AOD (DOD) along the transect from 20 to 50∘ W. The DOD from V12_C decreases from 0.15±0.018 to 0.049±0.088 along the transport, with a decreasing rate of 0.016±0.0014 per degree. In contrast, DOD decreases from 0.097±0.012 to 0.028±0.085 with a slope of 0.018±0.0016 for V12 and decreases from 0.080±0.090 to 0.025±0.084 with a slope of 0.017±0.0014 for V12_F.
Lying in the trade-wind belt, Cayenne has been taken to be the gateway of African dust. Hence, the comparison between simulated and observed dust concentrations at the Cayenne site could help model evaluation in reproducing the arrival of African dust in the Amazon Basin. As shown in Fig. 5a, the simulation from V12_C shows excellent agreement between simulated dust and observed PM10 concentrations during the wet season, with an r value of around 0.85 and an NMB of −39 %. The correlation from the other two simulations is similar (r=0.86), but the corresponding NMB is much larger (−57 % for V12 and −80 % for V12_F). Based on the regression line between observed concentrations of PM10 and dust at the same site, Prospero et al. (2020) obtained a regional background value of PM10 ranging from 17 to 22 µg m−3, largely attributed to sea salt aerosols, and a value of 0.9 for the slope, suggesting PM10 values above this range as a proxy for advected dust. Consistent with their results, the regression line between simulated dust and PM10 from V12_C in this study shows a background value of PM10 around 23 µg m−3, with a value of the slope around 1.0, and the dust contribution to PM10 is around 53±20 %. In contrast, the regression lines from V12 and V12_F are much steeper, with slopes of 1.4 and 2.1, respectively, and the dust contributions are relatively smaller: 44 % in V12 and 34 % in V12_F.
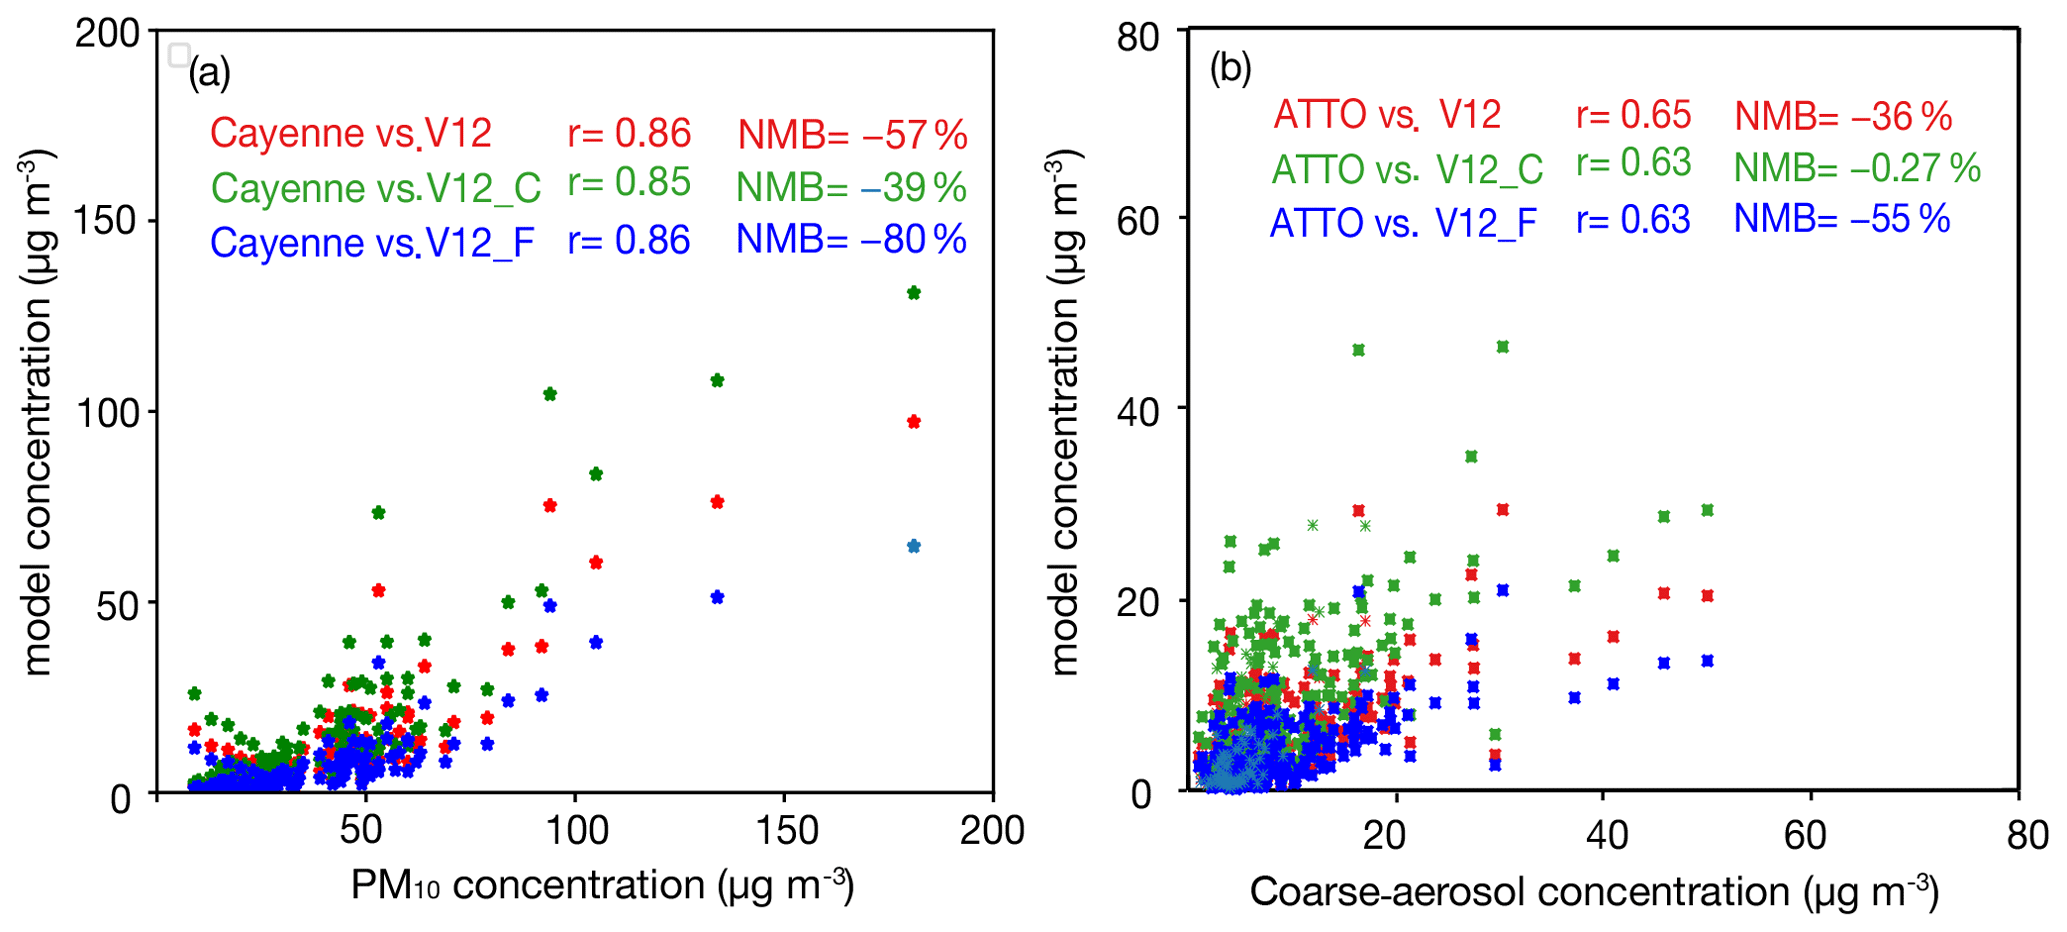
Figure 5Scatterplots of (a) observed PM10 and simulated dust concentrations at the Cayenne site during the wet season of 2014 and (b) observed coarse-aerosol (PM1−10) and simulated dust concentrations at the ATTO site during the wet season of 2014–2016. NMB and r statistics between the observation and simulation are shown as the inset.
We also compare simulated dust concentrations with observed coarse particles at the ATTO site in the central Amazon in the wet season during 2014–2016 in Fig. 5b. The correlations between observed and simulated data are similar for different PMSD schemes, with an r of 0.63–0.65. However, the bias of V12_C is negligible (NMB %), while both V12 and V12_F tend to underestimate the coarse aerosol concentrations, with NMB values of −36 % and −55 %, respectively. The dust contribution to coarse aerosols is above 80 % in V12_C but is less than 70 % in V12_F. This again implies a relatively higher export efficiency of African dust aerosols toward the Amazon Basin, with V12_C associated with their relatively higher dust fractions distributed in smaller-sized bins.
Overall, compared with the V12 and V12_F schemes, model results based on V12_C are more consistent with the multiple observational datasets, including column-integrated particle size distribution, AOD, and surface coarse aerosol concentrations obtained either over sources or downwind of the sources. Therefore, we use the model results from V12_C (hereinafter referred to as model results unless noted otherwise) to investigate the transatlantic transport of African dust and its impact over the Amazon Basin in the following sections.
4.1 Dust emissions
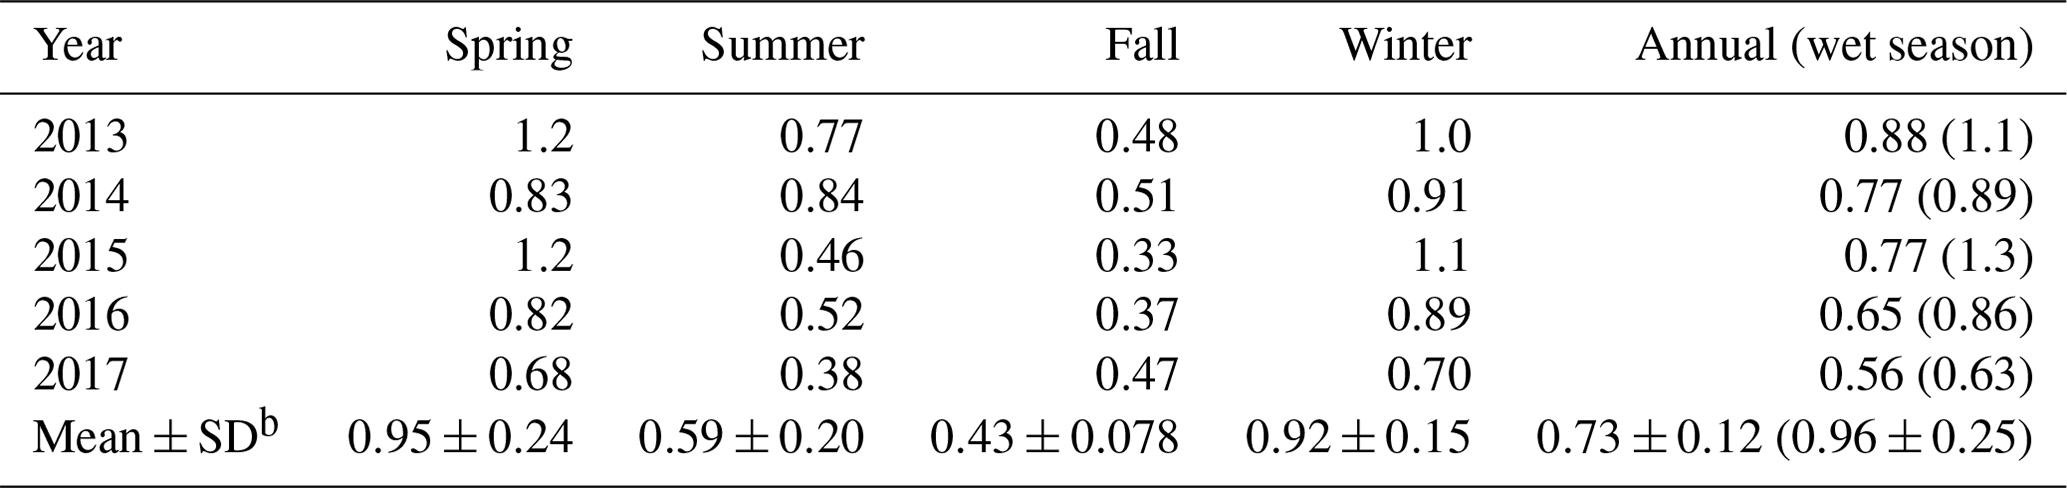
Figure 1 shows the spatial distribution of simulated dust emissions, and Table 3 lists seasonal and annual dust emissions in northern Africa (10∘–35∘ N, 17.5∘ W–40∘ E) for the period of 2013–2017. Simulated annual dust emission from northern Africa is 0.73±0.12 Pg yr−1, contributing more than 70 % of the global dust emission (0.99±0.20 Pg yr−1). The result is in the range of 0.42–2.05 Pg yr−1 reported by Kim et al. (2014), who evaluated five AeroCom II global models regarding dust simulation over similar regions.
Table 3Annual and seasonal dust emissions (Pg yr−1) in northern Africa (10–35∘ N, 17.5∘ W–40∘ E)a simulated in GEOS-Chem.
a Spring: March–May; summer: June–August; fall: September–November; winter: December–February. Wet season: January–April. b Standard deviation.
There exists a strong seasonality in the dust emission from northern Africa, peaking in spring and winter (up to 1.2 Pg yr−1) and reaching a minimum in fall (around 0.33 Pg yr−1) in general. Previous studies have also pointed out that dust emissions over different African regions show distinct variations (Bakker et al., 2019; Shao et al., 2010) attributed to differences in geographical properties (Knippertz et al., 2007), vegetation cover (Mahowald et al., 2006; Kim et al., 2017), and meteorological mechanisms on a local scale (Alizadeh-Choobari et al., 2014; Wang et al., 2017; Roberts and Knippertz, 2012). Consequently, there exists substantial seasonal change in different dust source regions. For instance, during boreal winter, the Bodélé Depression in northern Chad is found to be the most active one triggered by the harmattan winds, while the northwestern African dust sources become less active, in contrast to the condition in boreal summer (Ben-Ami et al., 2012; Prospero et al., 2014). Therefore, we further analyze the emission variability over five different source regions in northern Africa (Fig. 1 and Table S1 in the Supplement). On an annual basis, the contribution to total northern African dust emission is largest from Region A (western Sahara, 36±4.0 %), followed by Region D (central Sahel including the Bodélé Depression, 21±4.7 %), Region B (central Sahara, 13±2.6 %), Region C (eastern Sahara, 12±1.0 %), and Region E (western Sahel, 6.5±0.64 %). The emission fluxes, however, are most intensive in Region D, up to 11±2.1 g per month per square meter, and are generally below 5 g per month per square meter over the other regions.
Concerning the seasonality, higher dust emission tends to occur in boreal spring and winter, with the largest emission flux of 19±4.7 g per month per square meter from Region D. As shown in Figs. 6 and S1 in the Supplement, the emissions peak in boreal spring for Regions A, B, and C and in winter for Regions D and E. There is also a secondary peak in summer emissions for Region E. Correlation analysis between dust emissions and meteorological variables suggests that the seasonality is mainly driven by high surface wind speeds (with r values of 0.79–0.96 and 0.68–0.97 for the 75th and 95th percentiles, respectively, of 10 m wind speeds). Apparent negative correlation is also found between precipitation (soil moisture, Fig. S1) and dust emission in Region D, with an r value of −0.69 (−0.67).
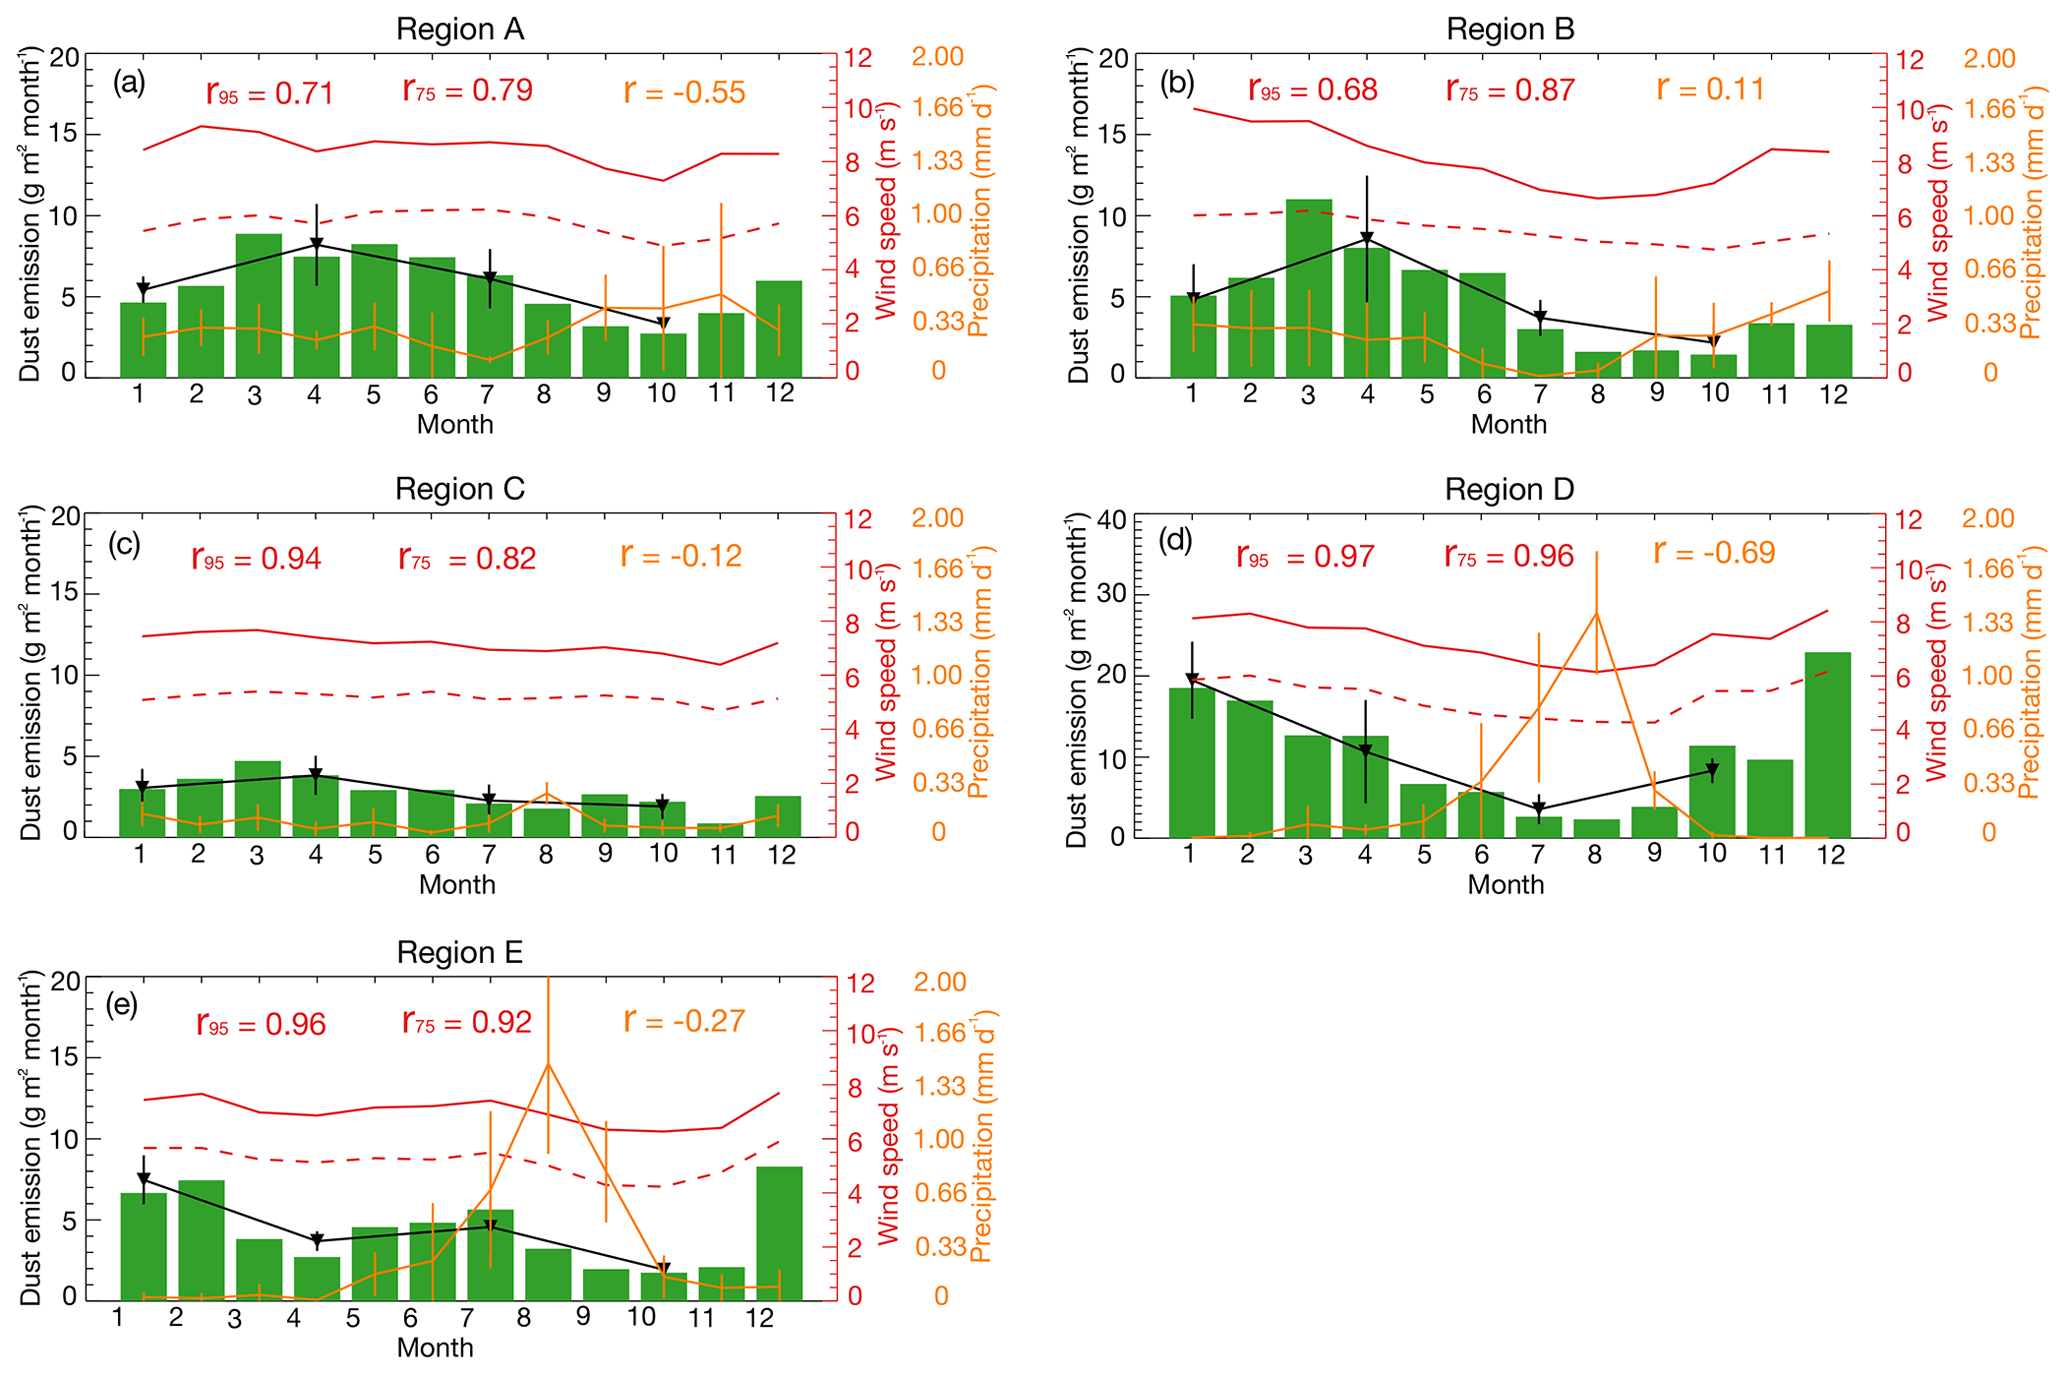
Figure 6Monthly dust emission fluxes together with the 95th percentile hourly 10 m wind speeds (red solid lines), the 75th percentile hourly 10 m wind speeds (red dotted lines) and precipitation (yellow lines) over the five major source regions averaged from 2013 to 2017. Seasonal emission fluxes of dust are also shown as black lines. The correlation coefficients (r) between the dust emission fluxes and different meteorological variables are also shown in each panel.
Similar seasonality is also reported by Cowie et al. (2014), who suggested that the strongest dust season in winter in the central Sahel is driven by strong harmattan winds and frequent low-level-jet breakdown, and the second peak in summer in the western Sahel could be explained by the summer monsoon combined with the Sahara heat low. The study also suggested the dominance of strong wind frequency in the seasonal variation of the emission frequencies. Fiedler et al. (2013) also found a maximum of emission flux over the Bodélé Depression in winter and the highest emission flux in spring in the western Sahara. The study suggested that near-surface peak winds associated with nocturnal low-level jets serve as a driver of mineral dust emissions. Negative correlation between dust emissions and soil moisture has also been revealed by Yu et al. (2017) and Pierre et al. (2012), as the decreased vegetation growth in response to dry soil would result in enhanced dust emissions.
It is also worth noting that the interannual variation in dust emissions is much larger during the wet season (0.96±0.25 Pg yr−1, Table 3) than on an annual basis (0.73±0.12 Pg yr−1). Moreover, while the annual emissions gradually decrease from 2013 to 2017, the emissions during the wet season peak in 2015. The obviously different behavior between the annual emissions and emissions during the wet season suggests that predictions of the future impact of African dust emissions over the Amazon Basin in response to climate change should focus on the wet season rather than on the annual average, as the former is more related to the export of African dust toward the Amazon Basin.
4.2 Transatlantic transport of African dust
The amount of African dust reaching the Amazon Basin depends not only on the dust emission fluxes, but also on the transport paths. Associated with the annual oscillation of the ITCZ, the outflow of African dust moves slightly southwest toward South America in boreal winter and spring and moves west toward the Caribbean in boreal summer and fall (Moran-Zuloaga et al., 2018; Ben-Ami et al., 2012). GEOS-Chem results in this study are consistent with this seasonal oscillation: although higher dust load over the coastal region of northern Africa is found in boreal summer (>500 mg m−2), dust reaching the Amazon Basin is less than 10 mg m−2; in contrast, dust load over the Amazon Basin could reach up to 50 mg m−2 in boreal spring and winter.
In addition to the transport paths, the amount of African dust arrival at the Amazon Basin is also sensitive to its removal rate, i.e., the lifetime against deposition over the Atlantic. Assuming first-order removal of dust aerosols, we further derived the seasonal e-folding lifetime (hereinafter referred to as lifetime, τ) of simulated dust during 2013–2017 based on the logarithm of the dust column burden against the travel time over the AOaTP (Fig. 7) using Eq. (1):
where L is the distance of 1∘ longitude averaged over 5∘ S–25∘ N in unit meter per degree, v is the wind speed in unit meter per square second, and slope is the gradient of the linear trend line based on the logarithm of the dust burden against the distance in degrees between 20 and 50∘ W.
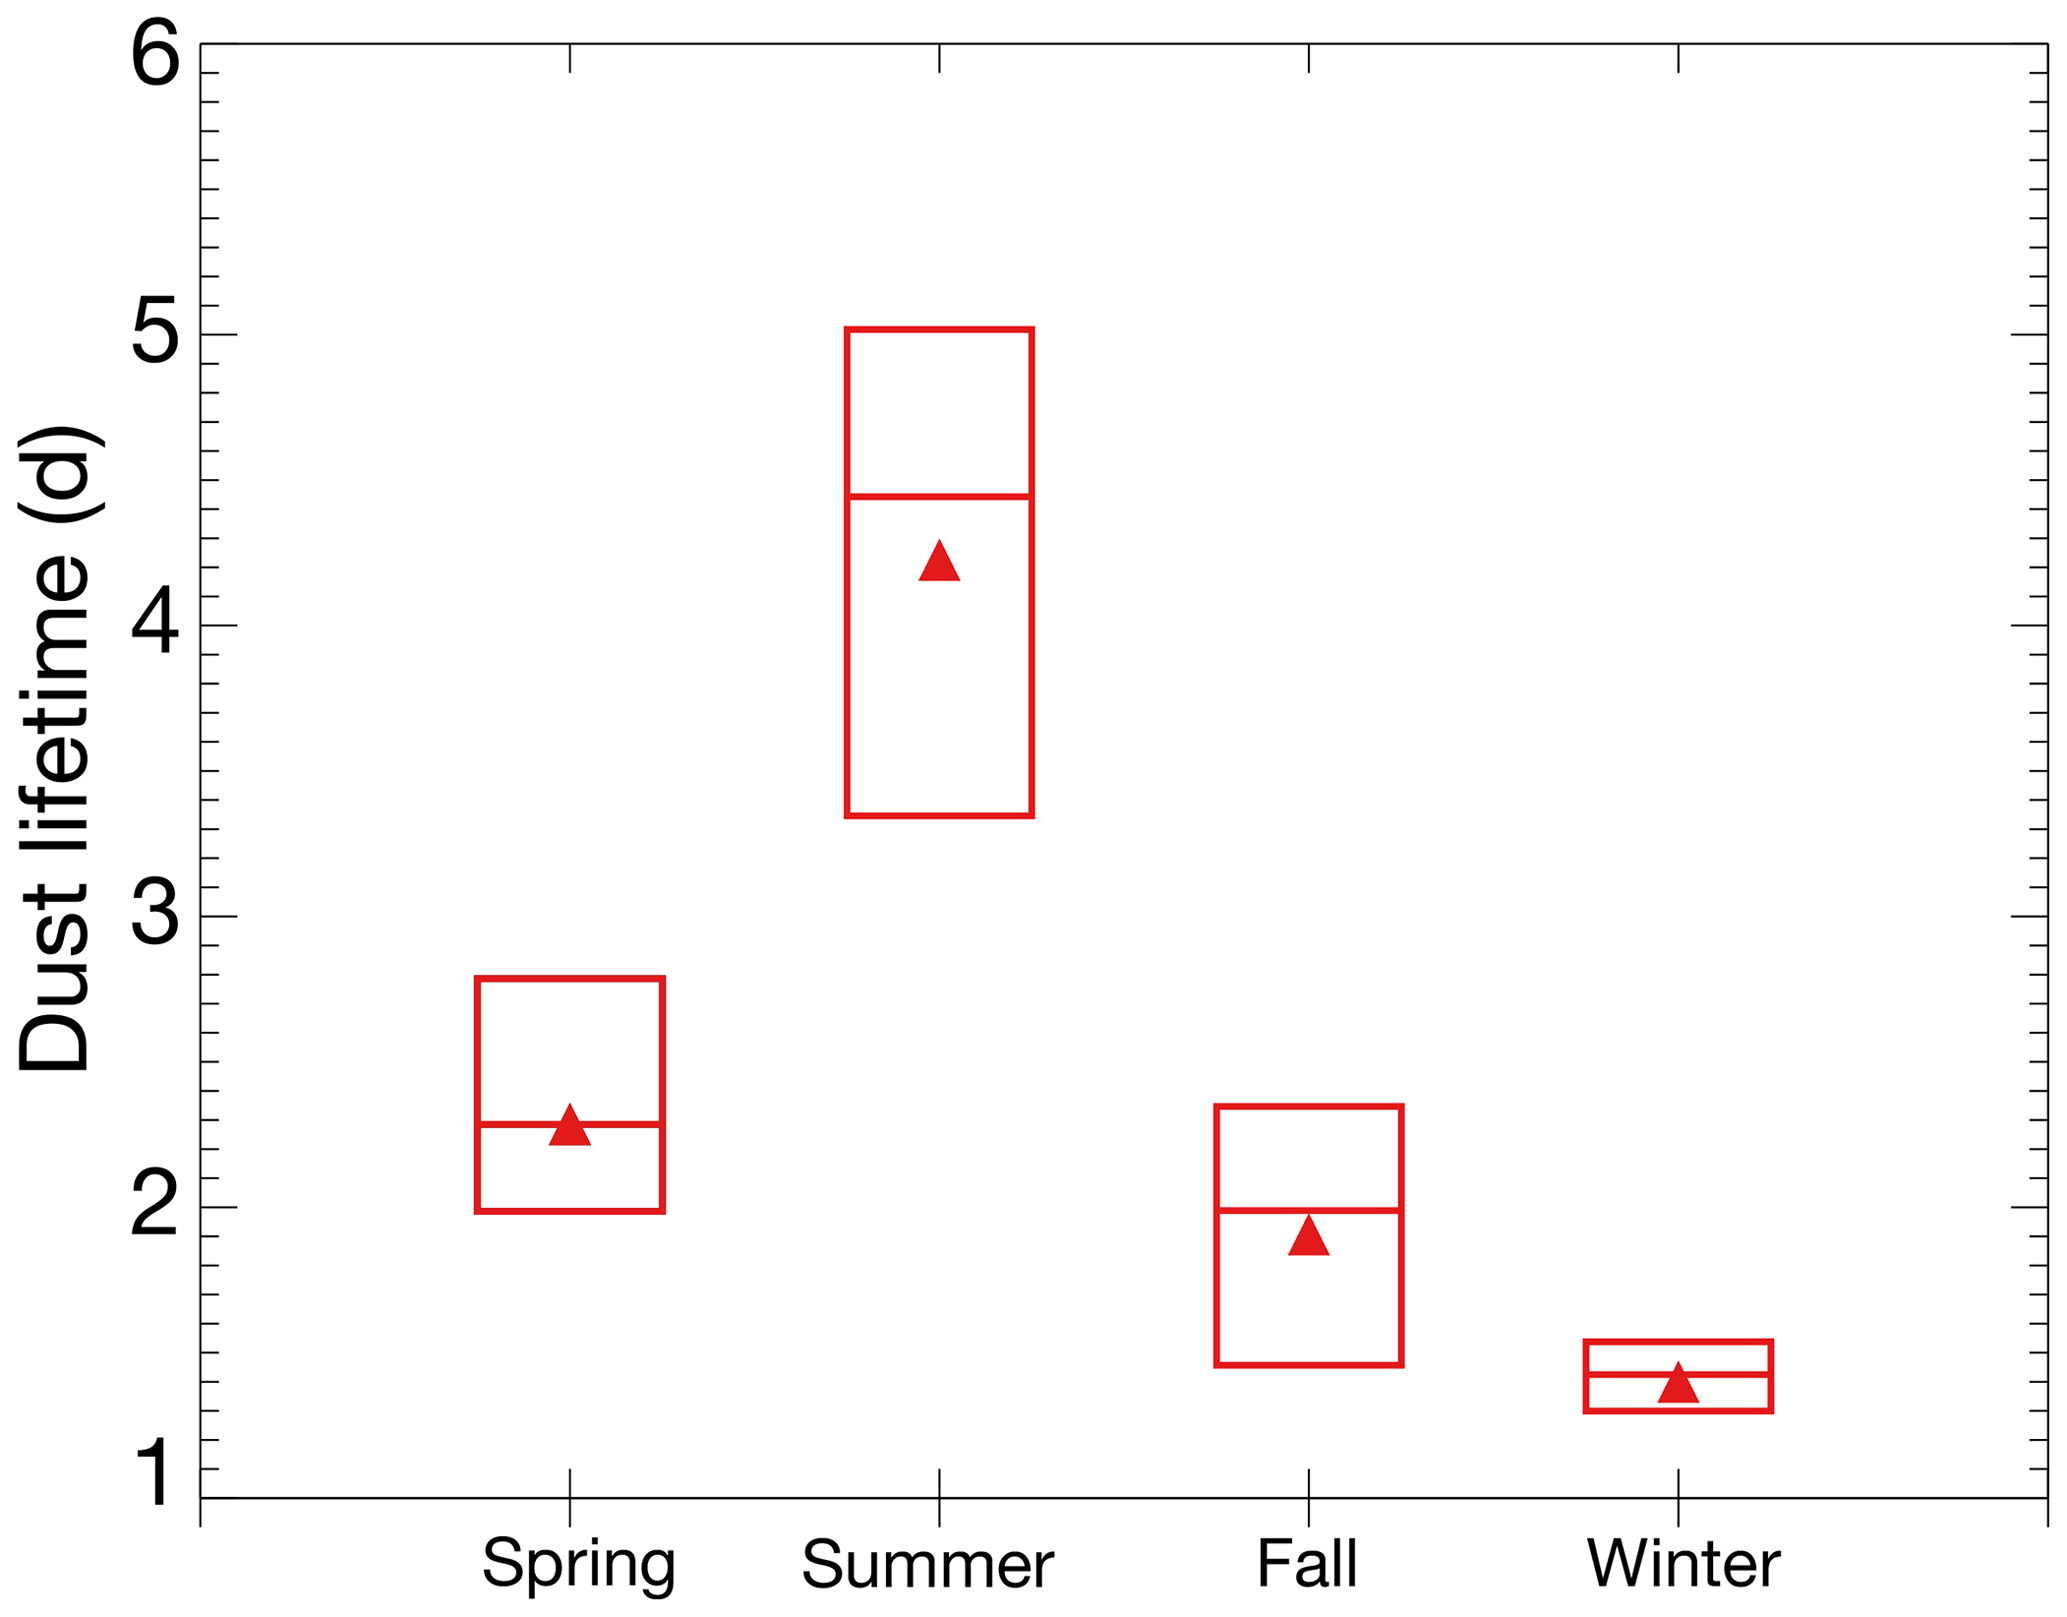
Figure 7Seasonal e-folding lifetime derived from the logarithm of simulated dust column burden against travel time along the transect from 20 to 50∘ W averaged over 5∘ S–25∘ N during the period of 2013–2017. The triangles represent the mean values, and the bottom and top sides of the boxes represent the minima and maxima.
Estimated dust lifetime is shortest (1.4±0.098 d) in winter, followed by fall and spring (1.9±0.33 and 2.3±0.31 d, respectively), while the lifetime in summer is the longest (4.2±0.68 d). The interannual variability of the lifetime is small in winter, with a relative standard deviation (RSD) of 7.0 %, but it is relatively large in fall, with an RSD of 17 %. The short lifetime in winter is generally associated with high deposition flux (including both dry and wet deposition). As shown in Fig. 8, the largest dust deposition flux (>1000 ng m−2 s−1) is found over the source regions in northern Africa, especially in spring and winter, and is mainly due to dry deposition (accounting for more than 80 %). As a result, 48 %–64 % of total emission in northern Africa is deposited within the source region (Table S2). The deposition flux over the AOaTP also shows strong seasonality, with a maximum of ∼530 ng m−2 s−1 in winter and a minimum of ∼180 ng m−2 s−1 in fall, and is mainly driven by wet deposition (accounting for 76 % on average). The deposition over the AOaTP accounts for 20 % of total emission in northern Africa in winter, in contrast to 7.7 % in spring, consistent with the relatively shorter lifetime in winter discussed above.
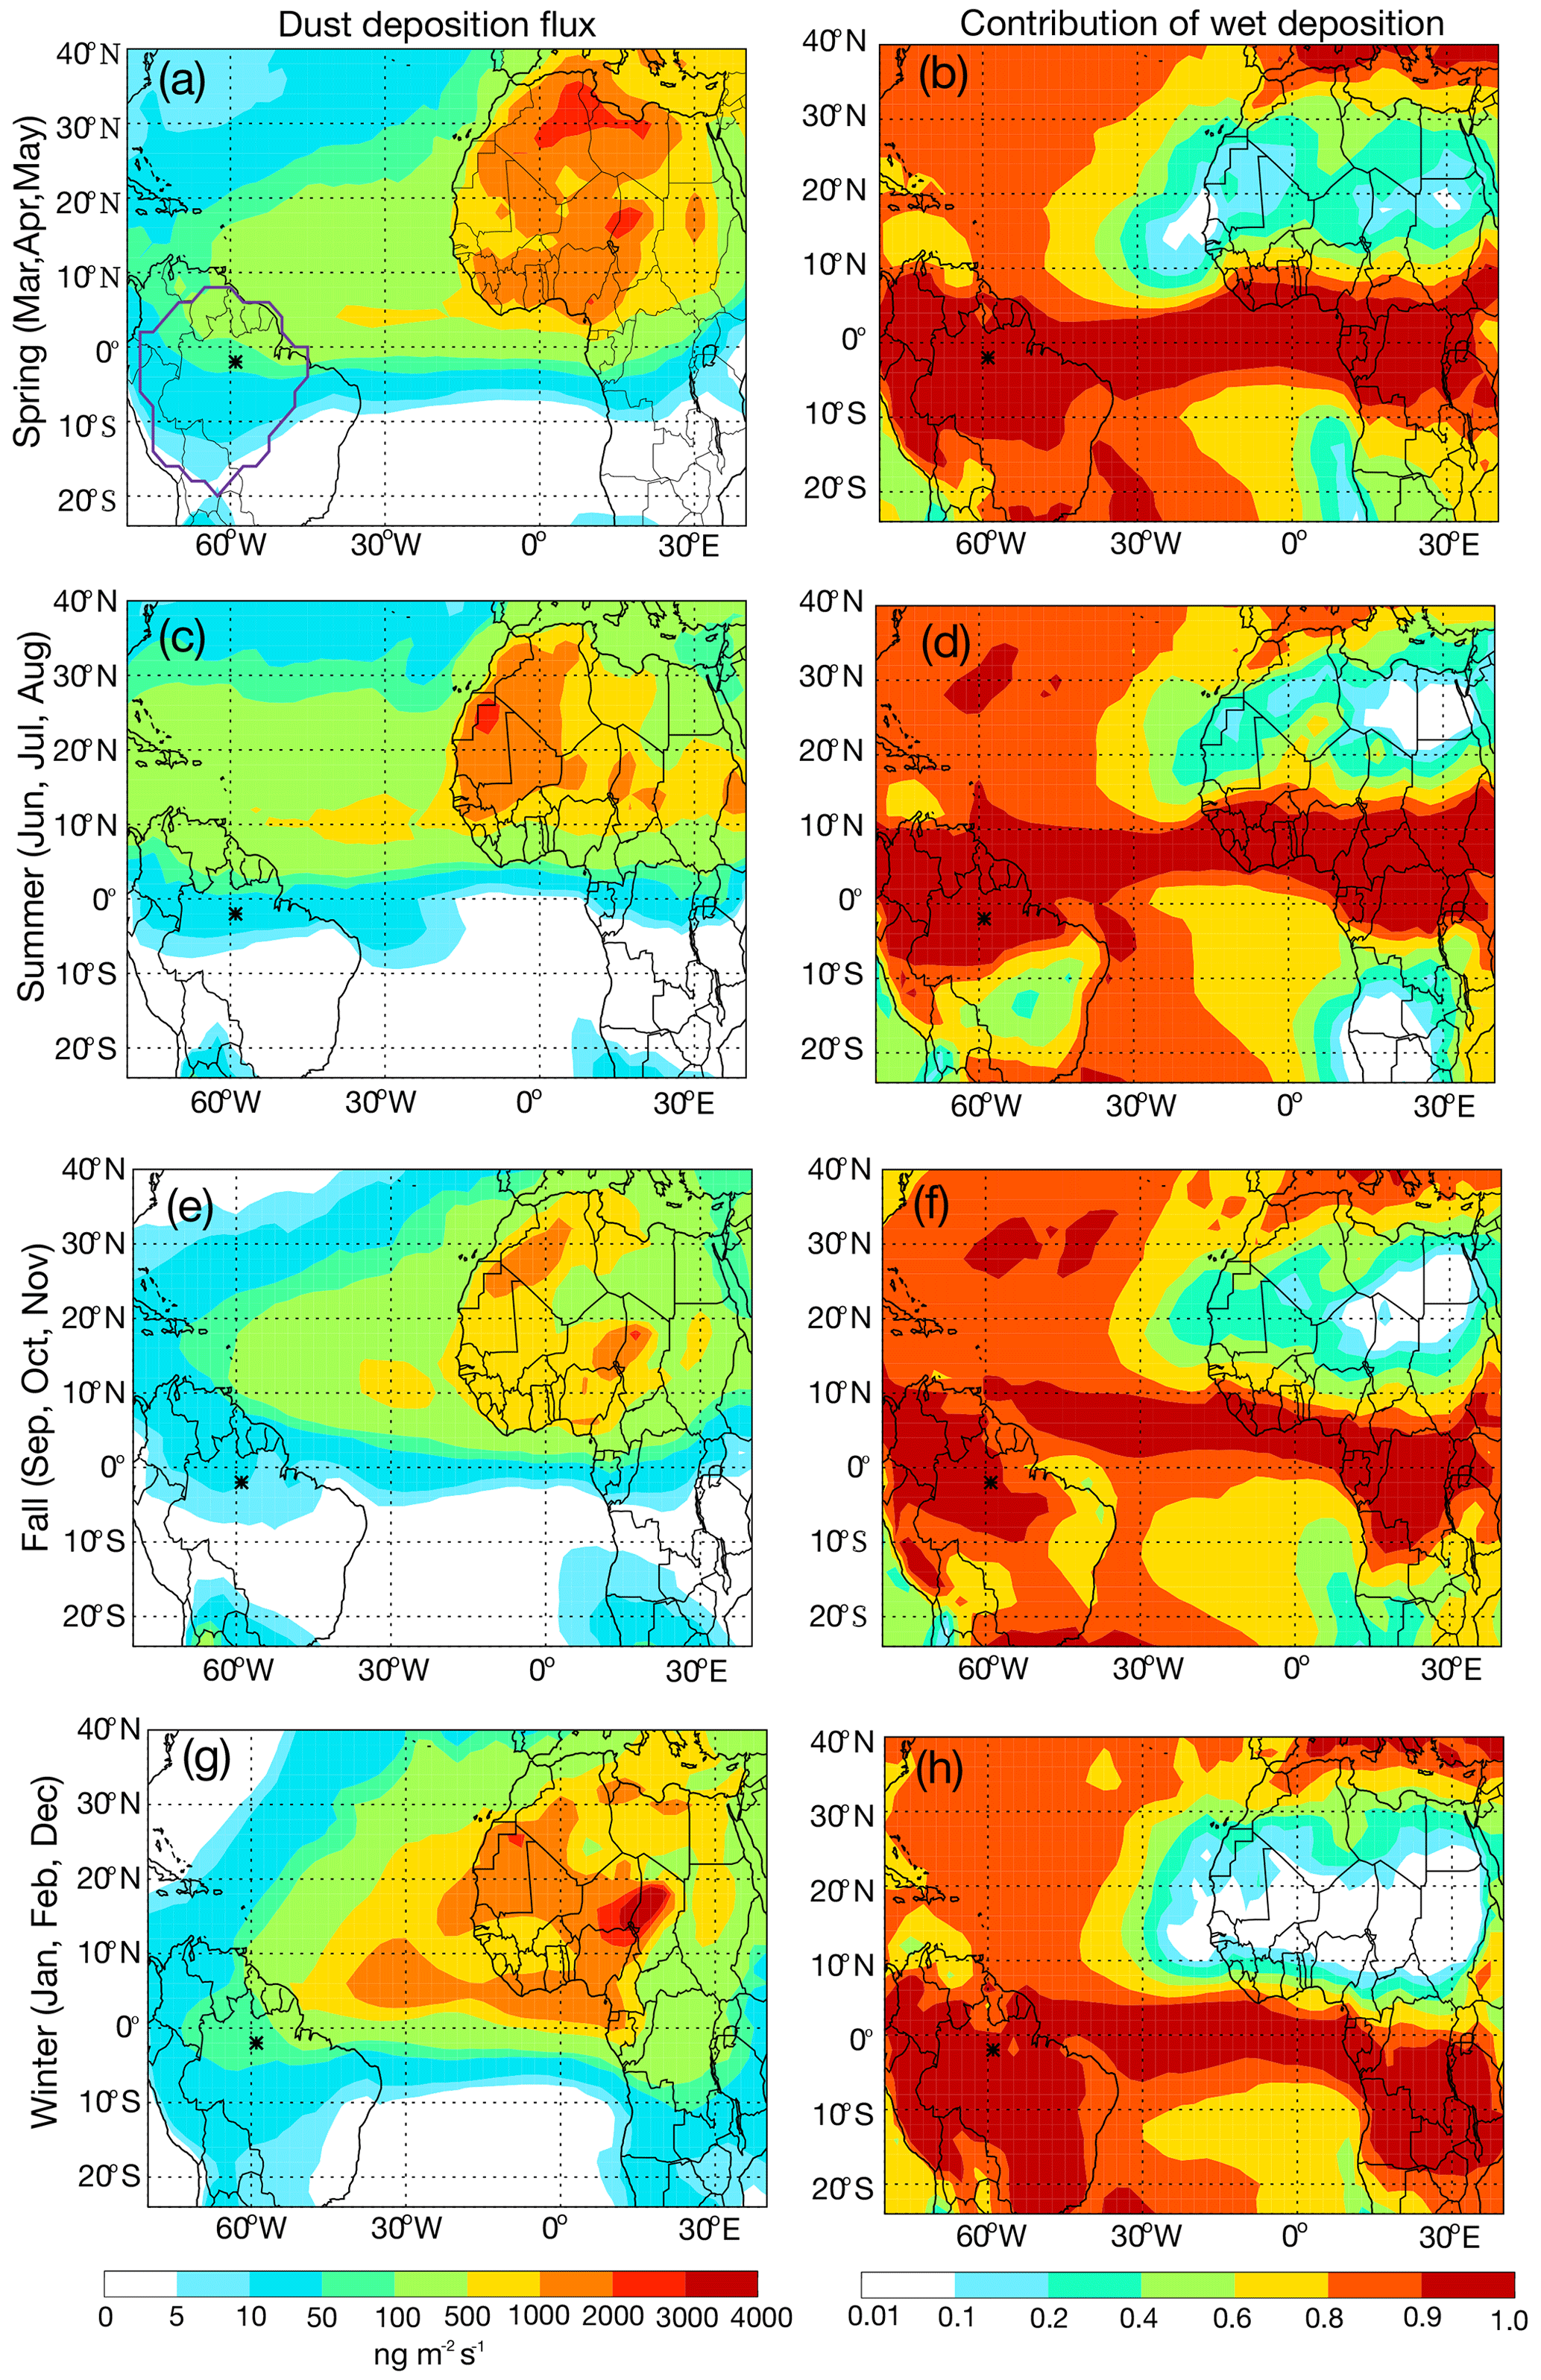
Figure 8Simulated seasonal (a, c, e, g) dust deposition fluxes and (b, d, f, h) contributions of wet deposition during 2013–2017. The ATTO site is marked with an asterisk. The region of the Amazon Basin is defined by purple lines in Fig. 8a.
The seasonality in the deposition fluxes and the consequent dust lifetime depend not only on precipitation, but also on the vertical pathways of dust transport across the Atlantic. Dust aerosols aloft at higher altitude reach further west and have relatively longer lifetimes. Significant differences in dust vertical distributions along the transport pathways have been revealed from the CALIOP measurements, which show that more dust is transported above 2 km in summer, while the dust layer is shallowest in winter (Liu et al., 2012).
4.3 The influence of African dust over the Amazon Basin
4.3.1 Surface aerosol concentrations
Figure 9 shows the time series of observed and simulated aerosol mass concentrations at ATTO in January–June for the period of 2014–2016. Observed mean concentration in the wet season is 9.3±7.6 µg m−3, of which 83 % is from coarse aerosol (7.7 µg m−3), while simulated concentration is 11±6.7 µg m−3, with a dust contribution of 65 % (7.2 µg m−3). The slight model bias could be to some extent explained by the difference in background concentrations (1.9 and 5.1 µg m−3 for the observation and model data, respectively). Most of the observed peaks are found in February–March of 2014 and 2016 and in February–April of 2015. The high correlation (r of 0.52–0.71) between observed coarse aerosols and simulated dust concentrations suggests that the observed strong variation in coarse aerosols is mainly driven by the influence of dust. Rizzolo et al. (2017) conducted aerosol measurements at ATTO from 19 March to 24 April 2015. The study showed the arrival of African dust between 3 and 6 April, when the highest concentrations of PM10, soluble Fe (III), and Fe (II) were recorded at ATTO. The peak value of 23 µg m−3 for PM10 was observed on 5 April. This dust event is well reproduced in this study, with a peak value of 28 µg m−3 for PM10 on the same day and the dust contribution to PM10 reaching above 70 %. Co-occurrence of elevated sea salt concentrations (reaching 2.5 µg m−3) during this event is also found in this study, consistent with previous studies which show mixed transport of African dust and marine aerosols to the basin (Wang et al., 2016; Ben-Ami et al., 2010; Rizzolo et al., 2017; Adachi et al., 2020).
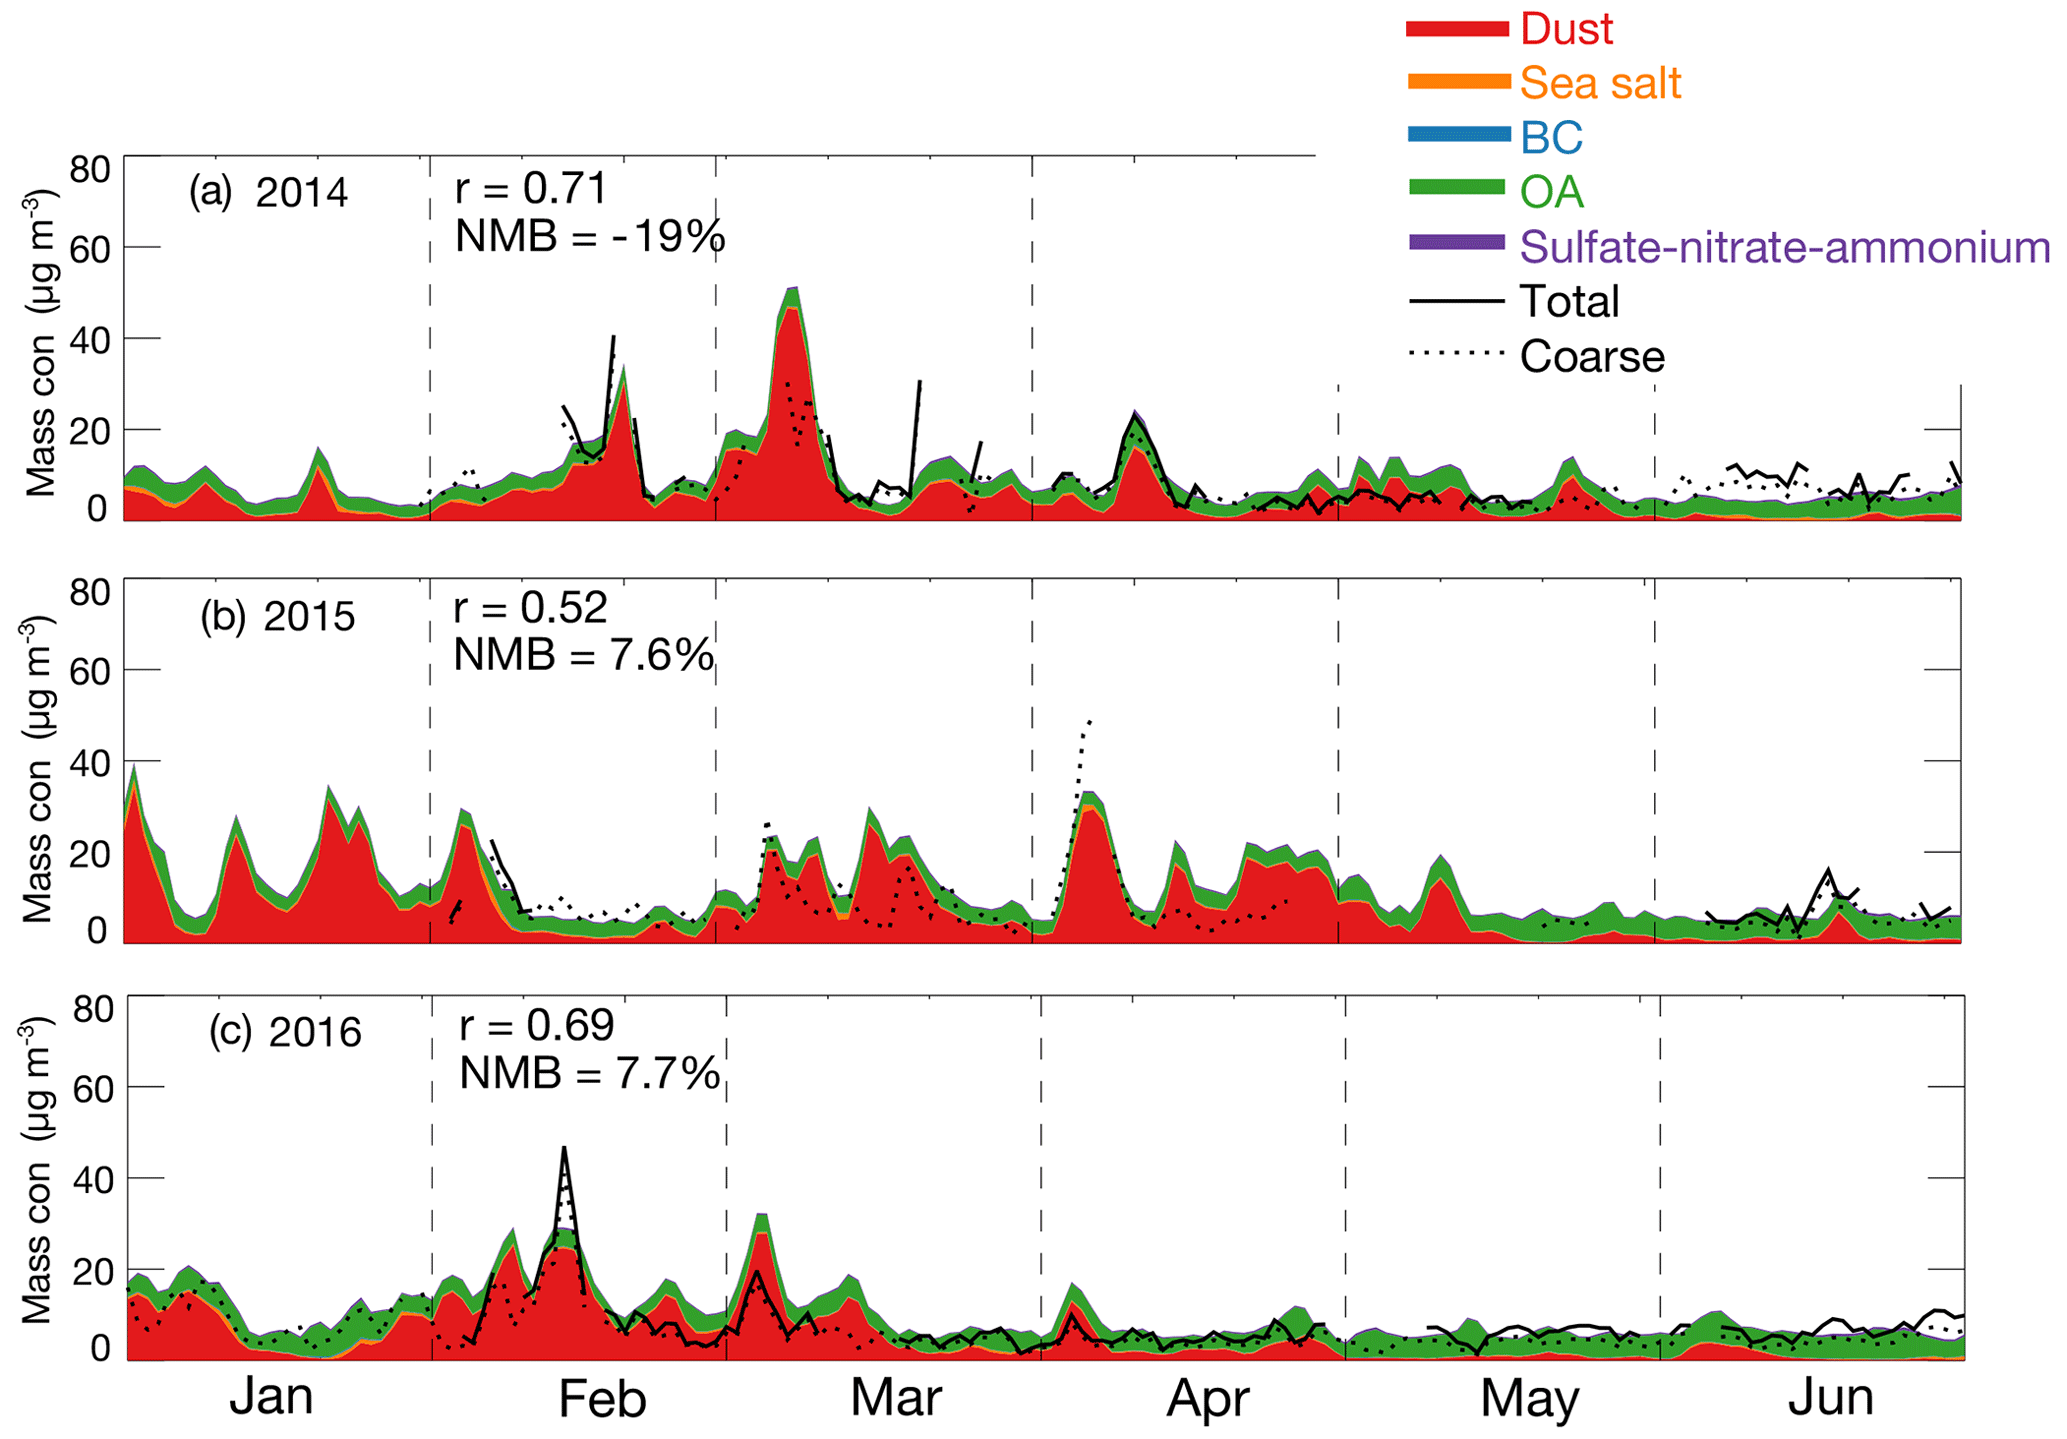
Figure 9Time series of observed coarse and total aerosol mass concentrations and simulated aerosol species concentrations at the ATTO site from January to June in (a) 2014, (b) 2015 and (c) 2016. Model results are separated into different species shown as stacked areas. NMB and r between the observed coarse aerosols and simulated dust concentrations are shown as the inset.
The dust peaks are generally associated with large dust emission and/or efficient transatlantic transport (e.g., a relatively longer lifetime). For example, the relatively higher dust concentrations in the wet season of 2015 (except for February) are generally associated with higher emissions (1.2–1.5 Pg yr−1) compared with the years of 2014 and 2016 (0.68–1.0 Pg yr−1; see Table S3). On the other hand, although emissions in February 2016 (0.95 Pg yr−1) are slightly lower than those in February 2014 (1.2 Pg yr−1), the relatively longer lifetimes (1.7 d vs. 1.5 d) may help explain the relatively higher dust concentrations during that period. It should be noted that the lifetime estimated here represents the export efficiency averaged over a relatively large domain and a long timescale (e.g., 1 month). Besides, the influence of African dust on the ATTO site is also subject to the variations of transport paths and precipitation fields.
Over the whole Amazon Basin, simulated mean surface dust concentrations in the wet season of 2013–2017 are 5.7±1.3 µg m−3, with a maximum of 7.9 µg m−3 in 2015 driven mainly by the relatively higher dust emission flux. The maxima of surface dust concentrations are found in the northeastern corner of the rainforest (over 15 µg m−3), with a clearly decreasing trend in the southwesterly direction (Fig. 10). The dust contribution to surface aerosol concentrations averaged over the whole basin is 40±4.5 %, again with the maximum of 48 % found in 2015. The location with the largest dust contributions (up to 70 % in the northern corner) slightly shifted inland compared to the spatial distribution of dust concentrations. This could be explained by the relatively higher influence of sea salt aerosols along the coast (around 30 %–50 % near the coast of South America). Although the emission fluxes of both sea salt and dust are largely determined by surface winds, the interannual variability of dust concentrations is larger than sea salt over the Amazon Basin (20 % vs. 10 %), as the former is also sensitive to the export efficiency across the Atlantic Ocean as discussed above.
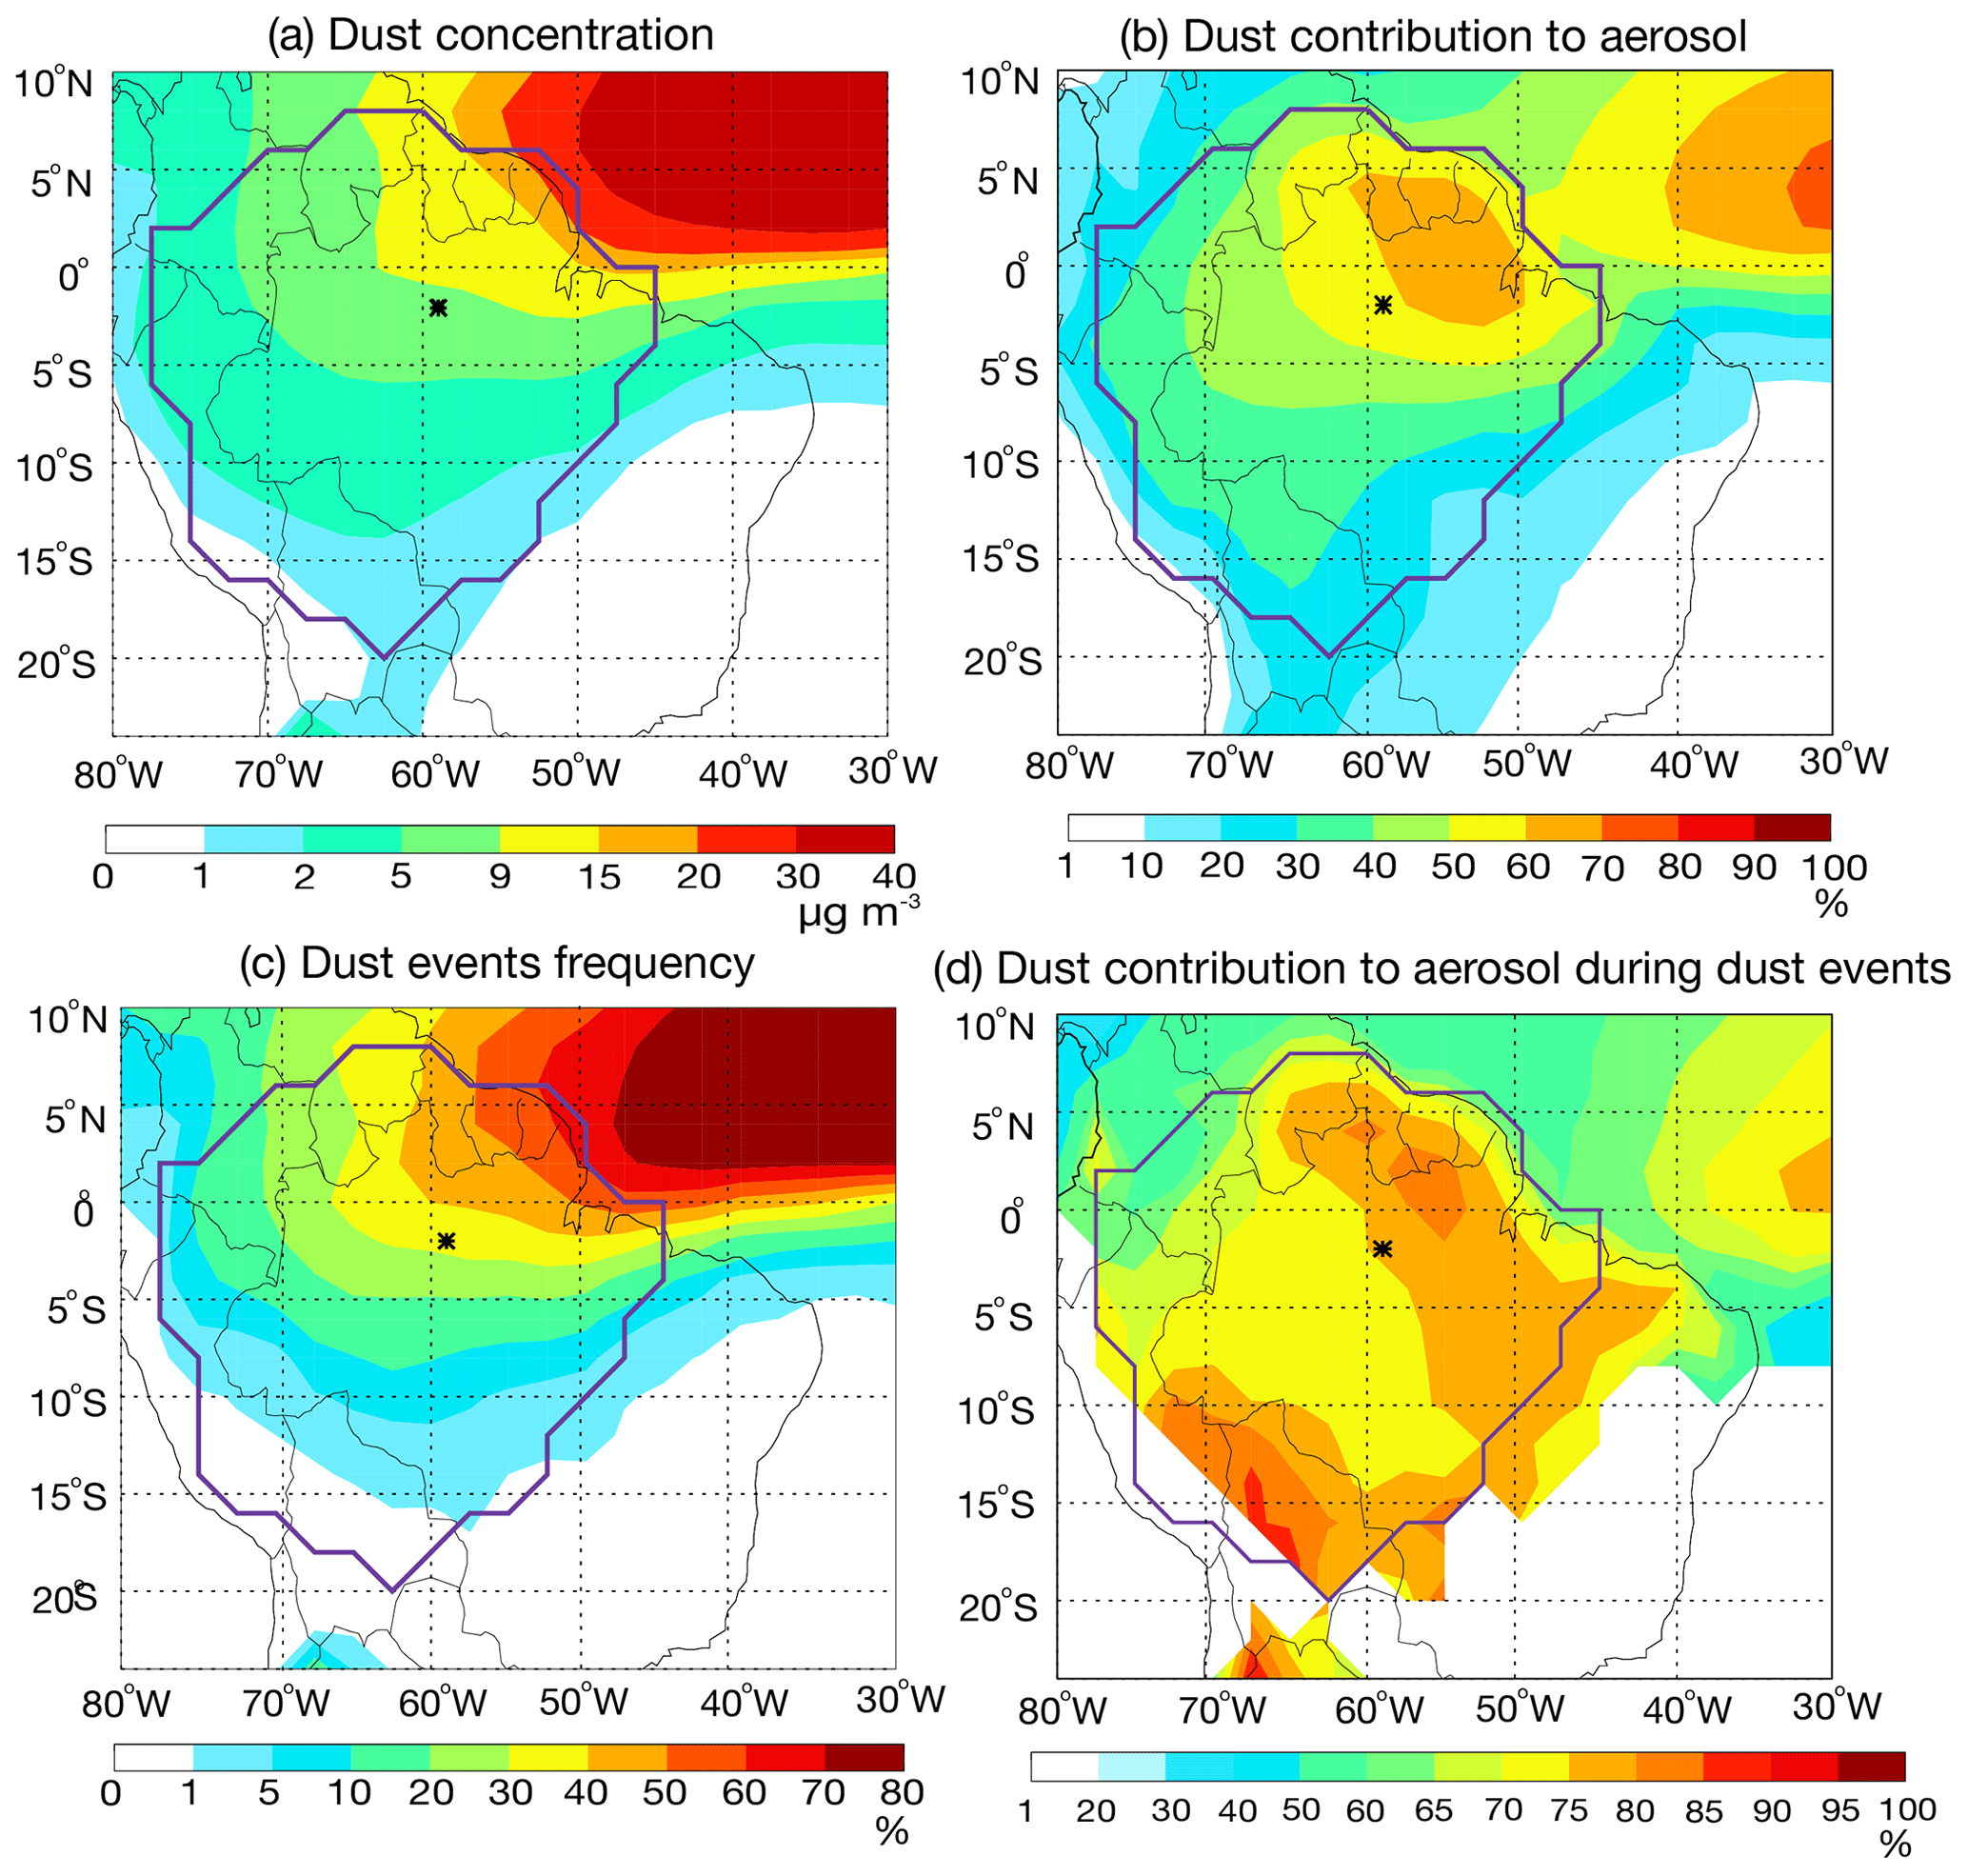
Figure 10Dust impact over the Amazon Basin in the wet season of 2013–2017: (a) simulated surface dust concentrations, (b) dust contribution to surface aerosol concentrations, (c) frequency of dust events, and (d) dust contribution to surface aerosol concentrations during dust events. The location of the ATTO site is marked with asterisks. The region of the Amazon Basin is marked with purple lines.
Figure 10c also shows the frequency of dust events over the Amazon Basin, estimated as the number of days when daily surface dust concentrations reach the threshold of 9 µg m−3 (Moran-Zuloaga et al., 2018) divided by the total number of days in the wet seasons of 2013–2017. Dust frequency averaged over the whole region is around 18±4.6 % and decreases from 50 % to 60 % at the northeastern coast to <1 % in the southern interior. The frequency of dust events at the ATTO site is around 32 %, close to the median of the range. The interannual variation of the frequency (represented by RSD), however, has an opposite trend, gradually increasing from 10 % at the northeastern coast to over 100 % in the southern interior (36 % at ATTO). During dust events, the dust mass concentration at ATTO reaches 16±2.9 µg m−3 (3 times as high as that over the whole wet season), accounting for around 75±5.3 % of the total aerosol (Fig. 10d). Similarly, under the influence of the LRT of Saharan dust plumes, Moran-Zuloaga et al. (2018) observed mass concentrations of 14±12 µg m−3 for coarse aerosol at the same site, accounting for 93 % of the total observed aerosol.
4.3.2 AOD
The contribution of DOD to AOD at 550 nm over most areas of the Amazon Basin (Fig. 11) is in the range of 10 %–50 % (23±4.4 % on average) during the wet season of 2013–2017, with maxima in the northern Amazon Basin. The dust contribution to total AOD is relatively smaller than that to surface aerosol concentrations, mainly because of the relatively lower MEE of dust aerosols compared to other aerosols. There also exists a large difference in DOD between the whole wet season and dust events: 0.021±0.0055 vs. 0.055±0.0076 averaged over the Amazon Basin. A maximum of 0.31 on a daily basis is found on 1 March 2016 in the northeastern corner (4∘ N, 55∘ W) of the Amazon Basin during the study period. During dust events, dust aerosols dominate AOD (40 %–60 %) over most of the Amazon Basin. At the ATTO site, DOD is 0.034±0.0088 and 0.063±0.0087, accounting for 37 % and 53 % of AOD during the whole wet season and dust events, respectively. The largest dust contribution (up to 81 %) with a DOD of 0.18 at the ATTO site is found on 24 January 2015. Consistent with our results, previous studies by Baars et al. (2011, 2012) reported an average AOD (532 nm) of ∼0.14 when affected by the influence of Saharan dust at a similar Amazon site (2∘35.9′ S, 60∘2.3′ W), during which the DOD (532 nm) could be up to 0.18.
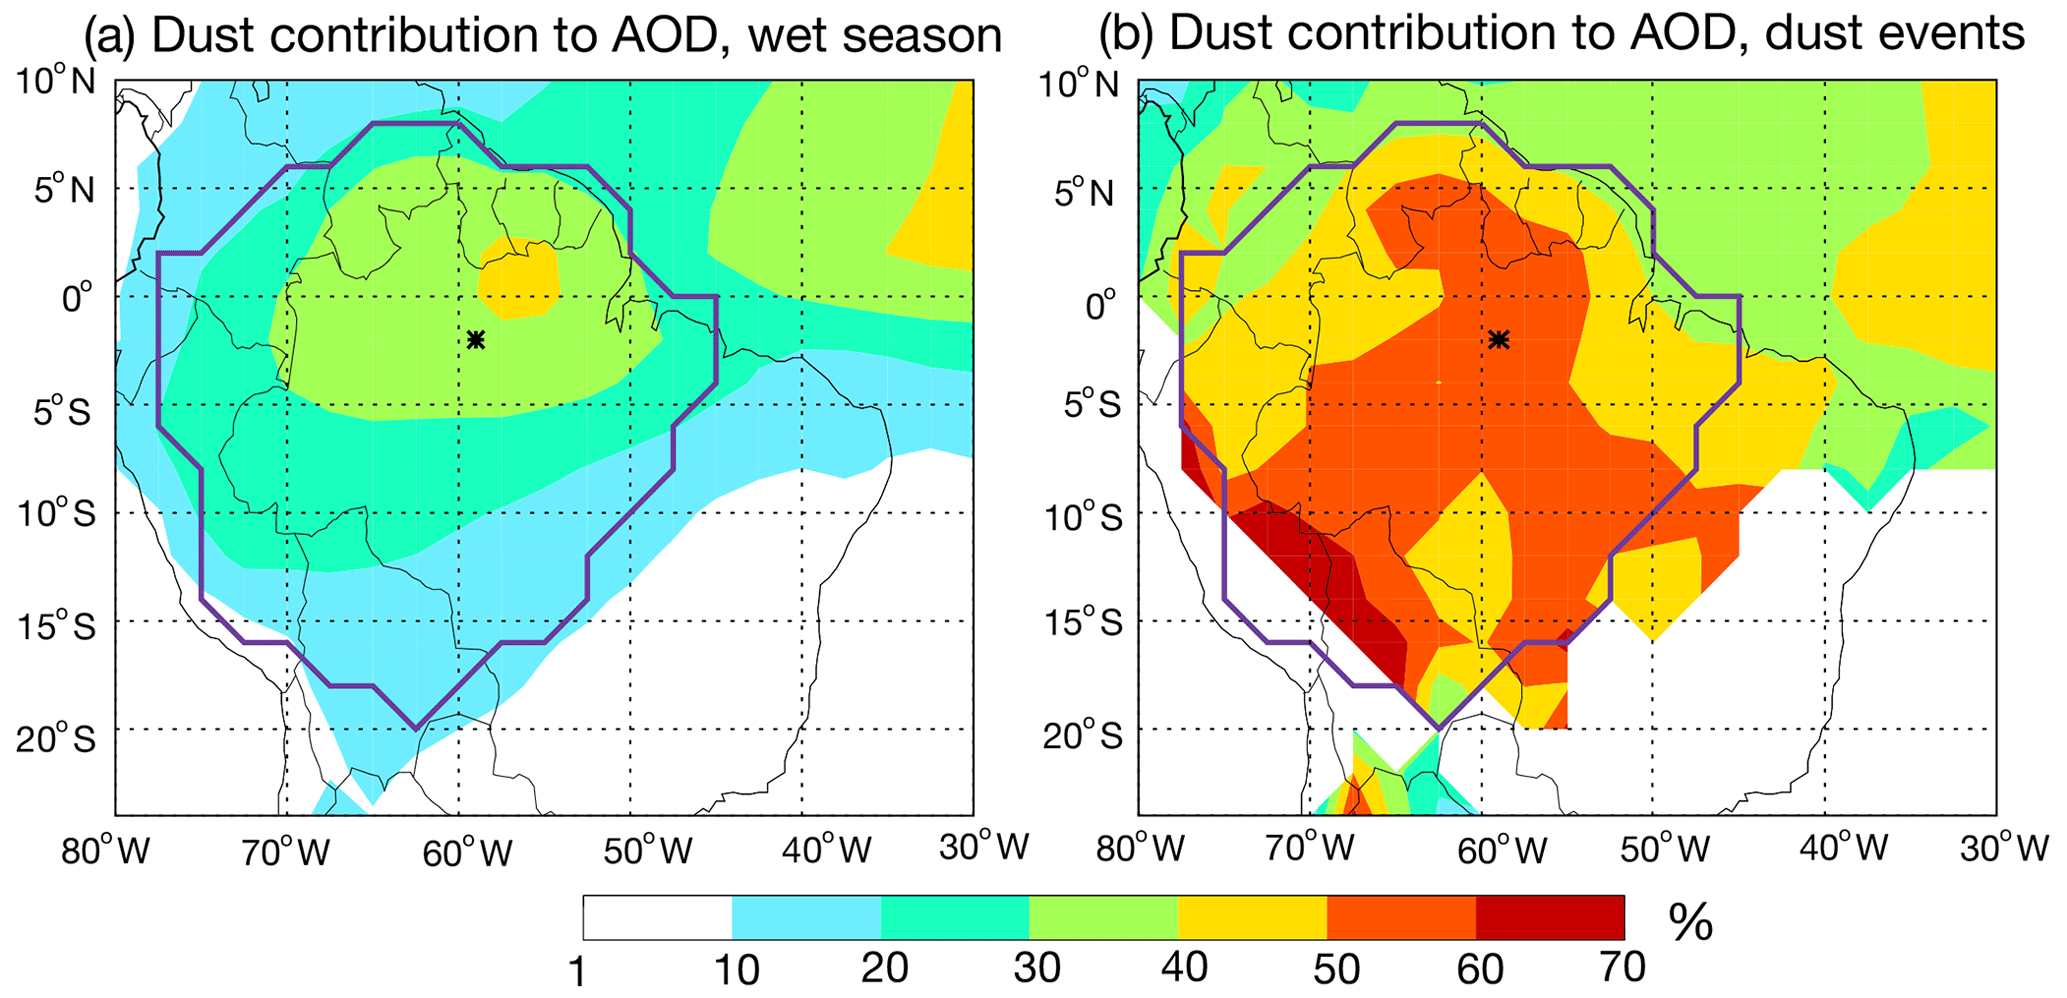
Figure 11Dust contribution to total AOD at 550 nm over the Amazon Basin averaged over the (a) wet season and (b) dust events during 2013–2017. The region of the Amazon Basin is marked with purple lines.
4.3.3 Dust deposition and related nutrient input
The spatial distribution of dust deposition over the Amazon Basin is also shown in Fig. 8. The mean dust deposition flux in the wet season is 2.0±0.35 g m−2 yr−1, much higher than in the dry season (August to November, 0.35±0.16 g m−2 yr−1). The maximum (2.6 g m−2 yr−1) is found in the year 2015 due to relatively large dust emission and efficient transatlantic transport. With emission of 0.96±0.25 Pg yr−1 in the wet season (0.73±0.12 Pg yr−1 on annual average), only 1.9 % (1.4 %) of African dust is deposited into the Amazon Basin (dominated by wet deposition), while a relatively large part is deposited over the AOaTP (13 % in the wet season and 14 % on annual average) and northern Africa (49 % in the wet season).
Assuming mass fractions of 4.4 %, 0.082 %, and 1.8 % for iron, phosphorus, and magnesium, respectively, in African dust (Bristow et al., 2010; Chiemeka et al., 2007), we derive deposition fluxes of 88±15, 1.6±0.29, and 36±6.3 mg m−2 yr−1 for iron, phosphorus, and magnesium, respectively, into the Amazon rainforest during the wet season and 52±8.7, 0.97±0.16, and 21±3.6 mg m−2 yr−1 on annual average (Fig. 12). It should be noted that there exists a large spatial variation of nutrient input into the Amazon Basin associated with the patterns of dust deposition flux. The deposition flux of iron during the wet season decreases from over 500 mg m−2 yr−1 at the northeastern coast to less than 15 mg m−2 yr−1 in the southwest and is above 50 mg m−2 yr−1 in most of the Amazon Basin. Similarly, the deposition flux decreases from over 70 mg m−2 yr−1 (>9 mg m−2 yr−1) at the northeastern coast to less than 7 mg m−2 yr−1 (<1 mg m−2 yr−1) in the interior for magnesium (phosphorus) during the wet season. It seems that the nutrient input from African dust may play a significant role in the northeastern part of the Amazon Basin, not in the southwest.
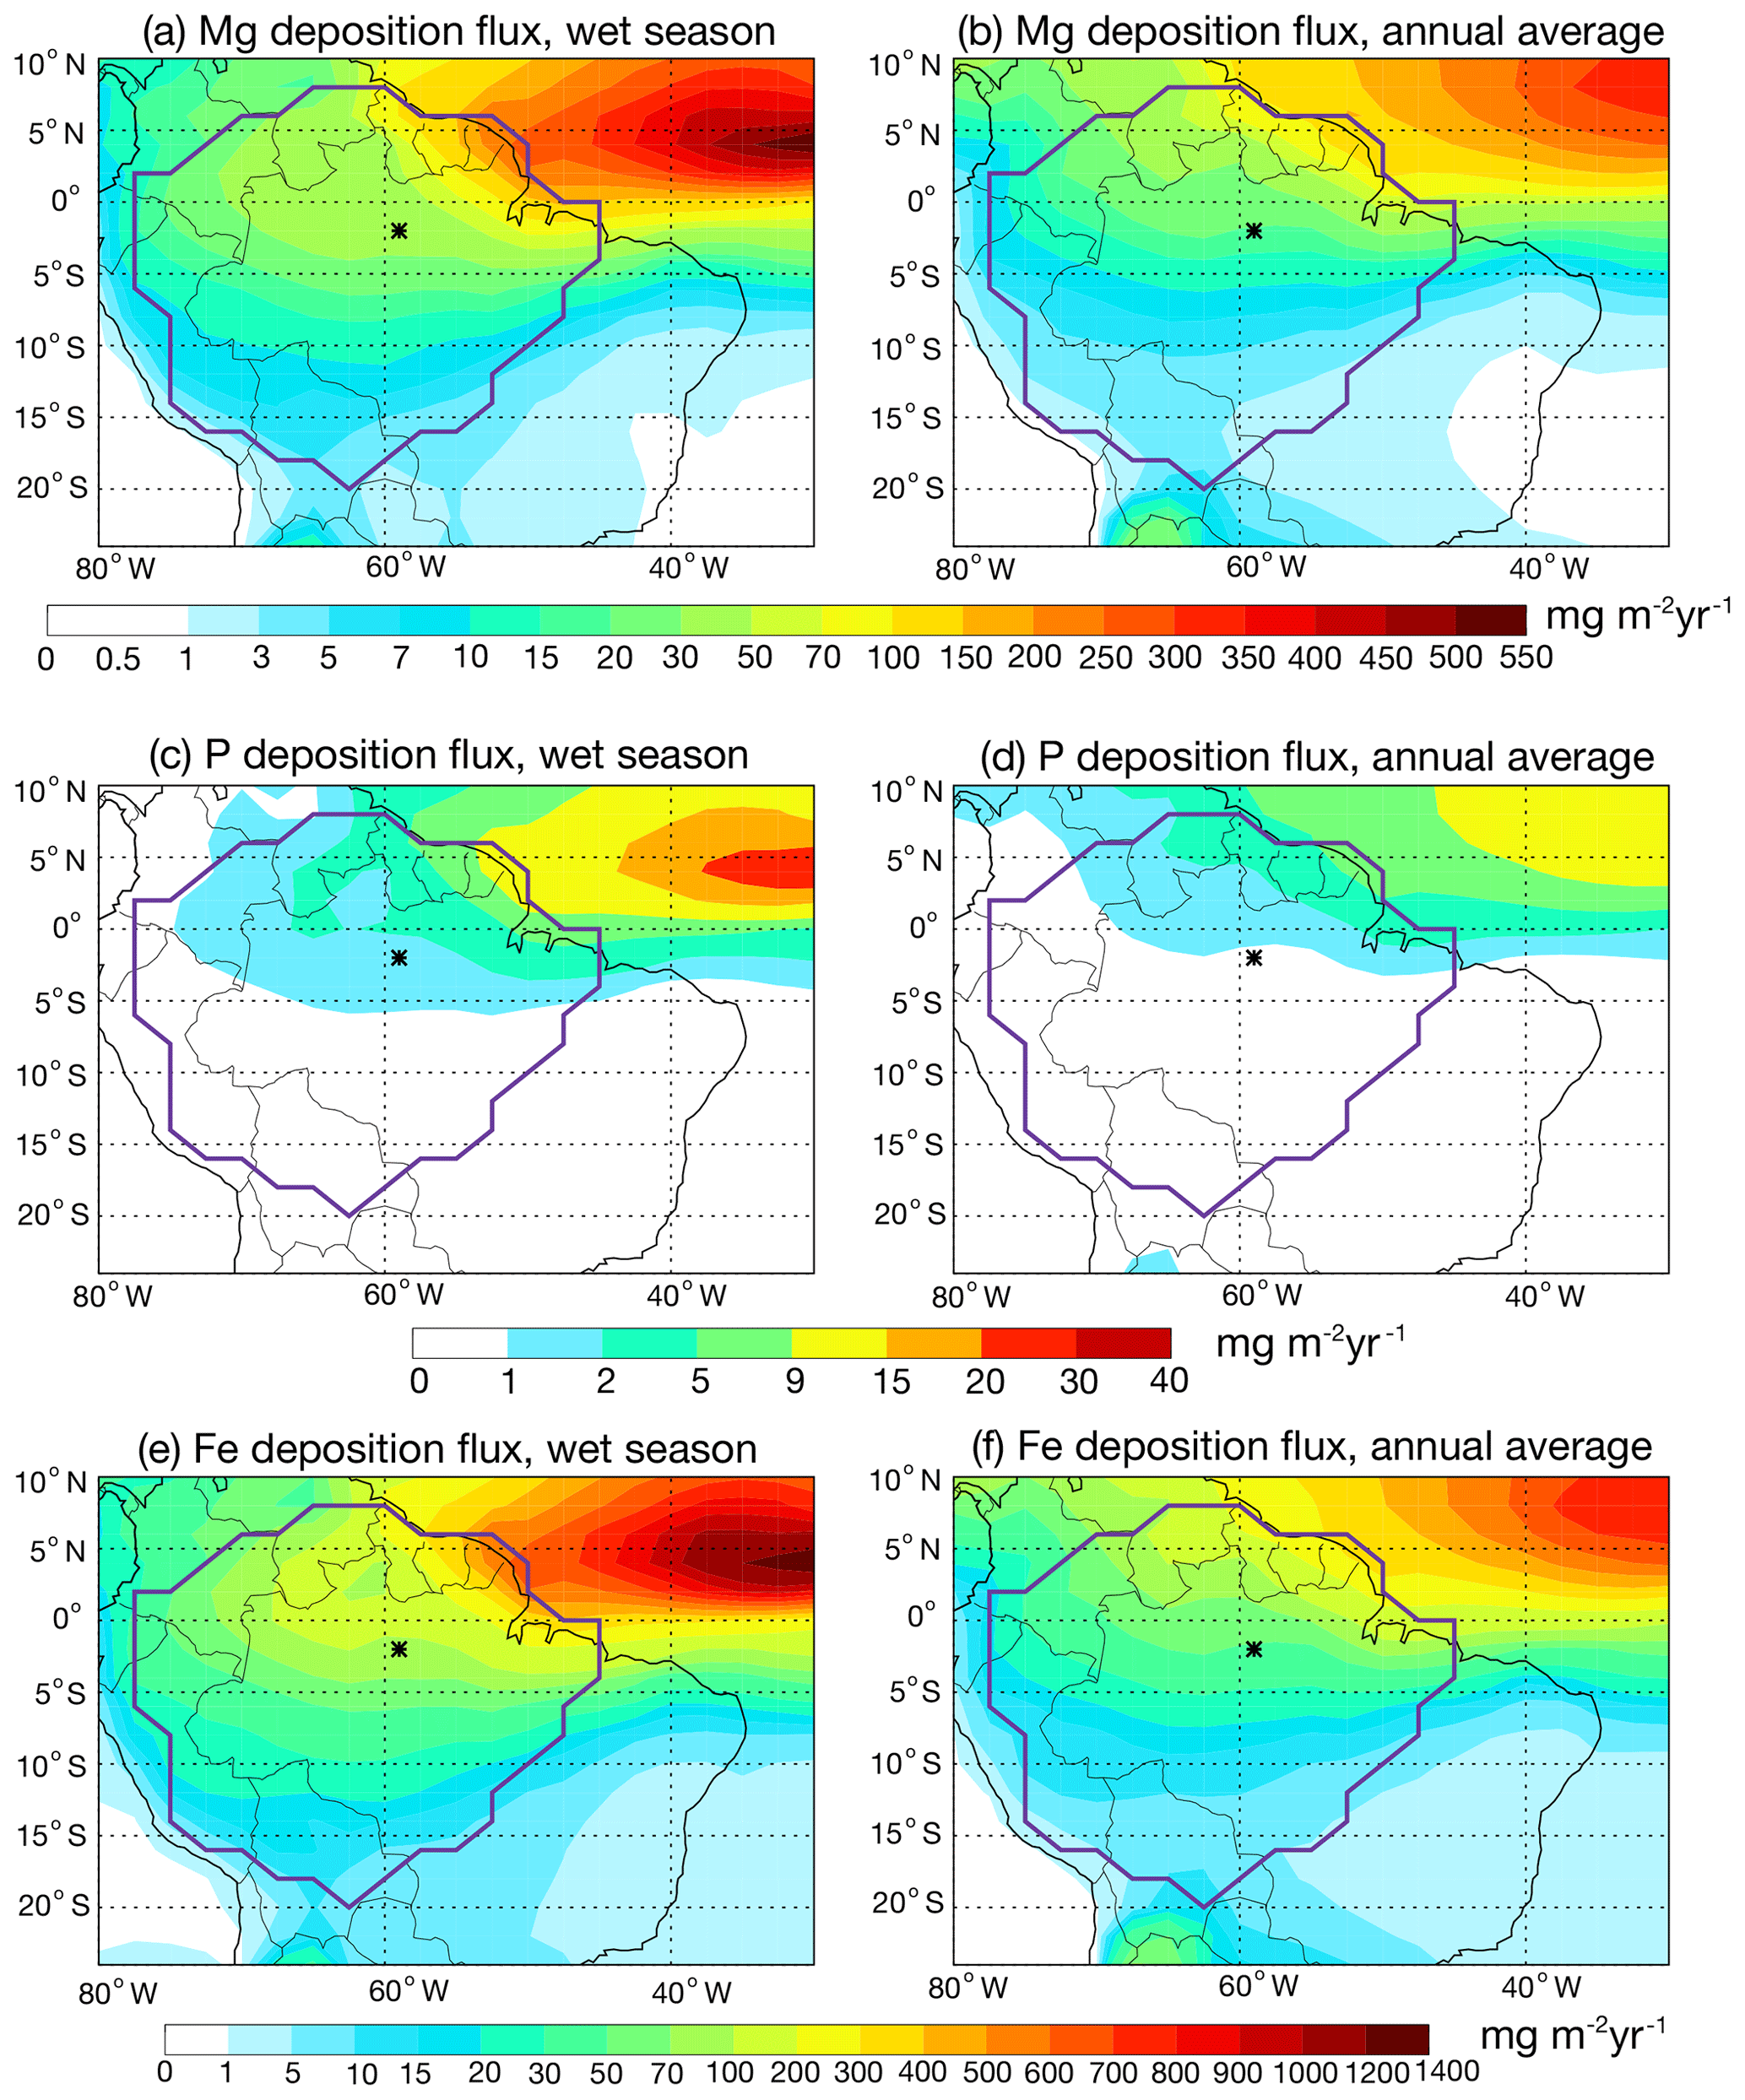
Figure 12Magnesium deposition flux (a) in the wet season and (b) annually averaged from 2013 to 2017. Phosphorus deposition flux (c) in the wet season and (d) annually averaged from 2013 to 2017. Iron deposition flux (e) in the wet season and (f) annually averaged from 2013 to 2017. The location of the ATTO site is marked with asterisks. The region of the Amazon Basin is marked with purple lines.
Table 4 summarizes the estimates of dust and the associated phosphorus deposition into the Amazon Basin from previous studies. The estimated fluxes of dust and the associated phosphorus deposition are in the ranges of 0.81–19 g m−2 yr−1 and 0.48–16 mg m−2 yr−1. The large range is mainly driven by the high values (19 g m−2 yr−1 and 16 mg m−2 yr−1 for dust and the associated phosphorus, respectively) from the study of Swap et al. (1992), which estimated dust importation into the northeastern basin, where it is most subject to the intrusion of African dust. Besides the discrepancy in defined regions, the wide range could also partly be explained by the application of different methods and the associated intrinsic uncertainties as mentioned in the Introduction section. For instance, the estimates from Swap et al. (1992) are mainly based on 1-month field measurements at three sites located in the northeastern basin. Assumptions about the air exchange rate across the coast to the basin, the duration of dust storms, and the dust concentrations contained in the dust plumes had to be made to extrapolate the dust deposition to the Amazon Basin. Similarly, bias could also arise from insufficient observations available to constrain models or satellite retrievals. Additional uncertainty may also stem from the assumption about the P mass fraction that ranges from 0.07 % to 0.108 %. Our results are similar to the finding of Prospero et al. (2020), which has also been constrained by the observation at the Cayenne site.
Table 4Estimates of annual dust and associated phosphorus deposition into the Amazon Basin.
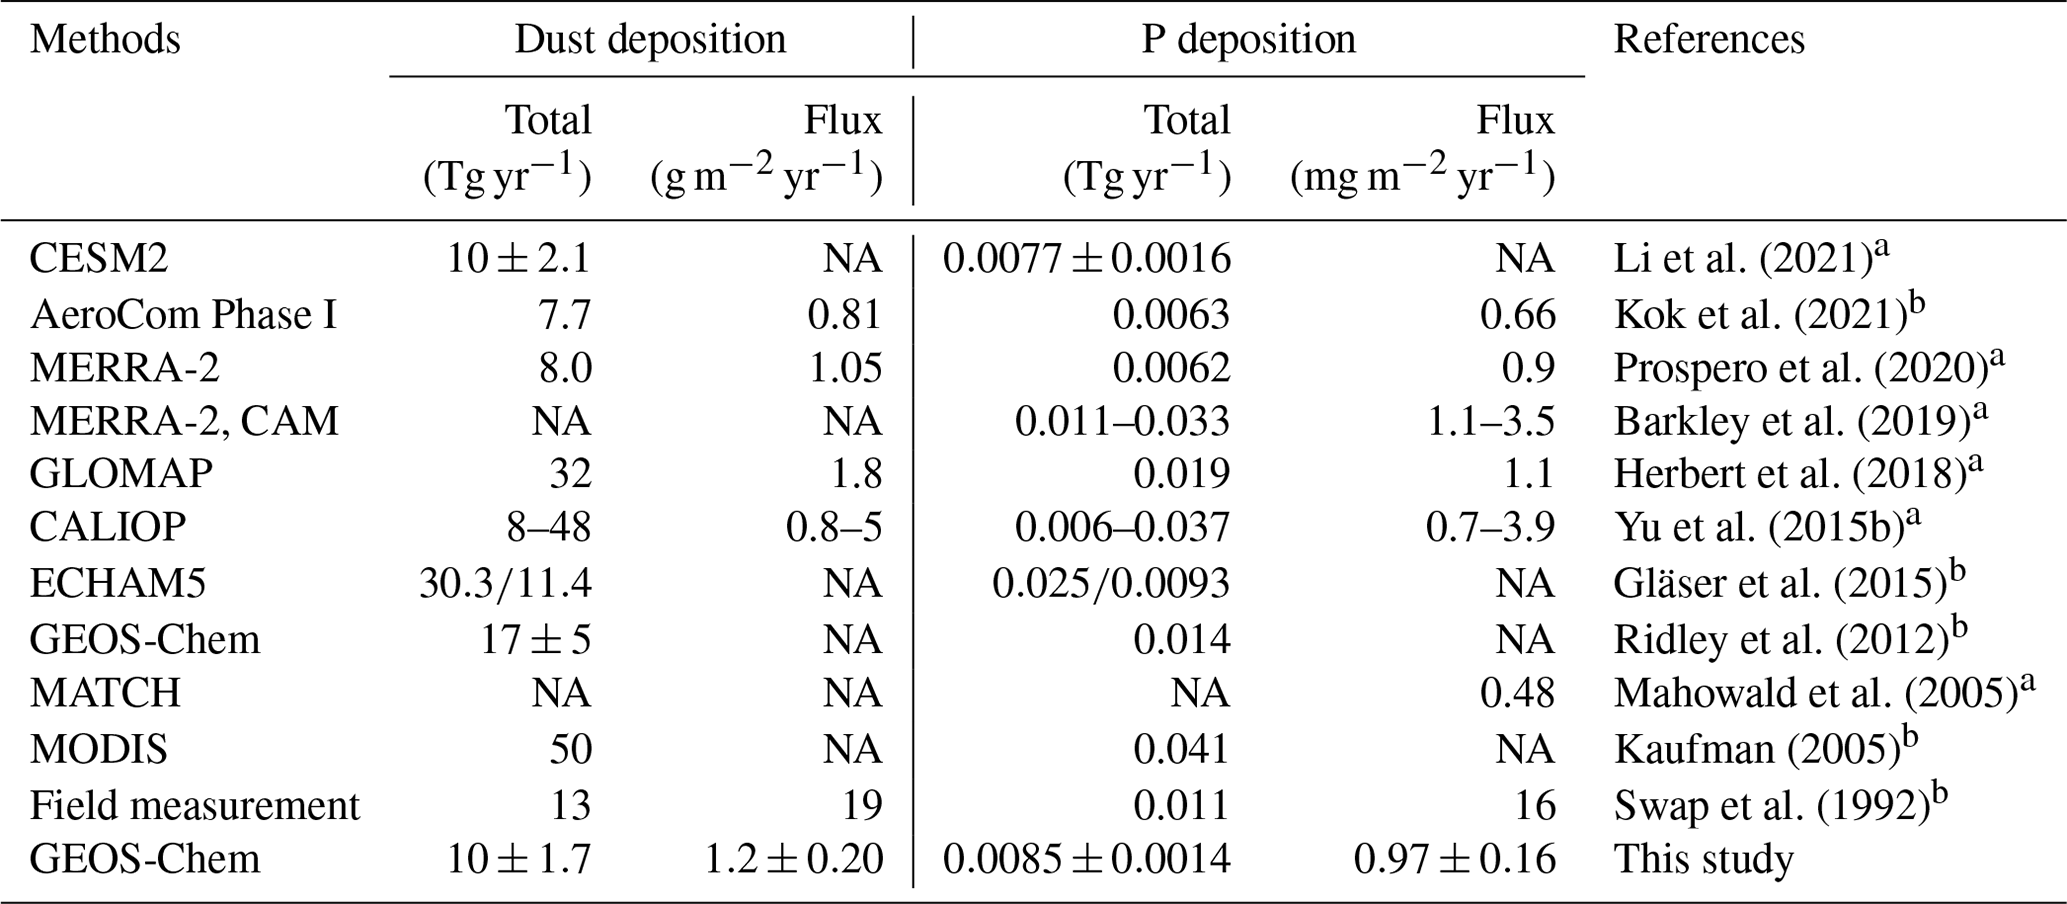
Note: table extracted in part from Prospero et al. (2020). a The P mass fraction is 0.077 % for Li et al. (2021) and Prospero et al. (2020), 0.108 % for Barkley et al. (2019), 0.088 % for Herbert et al. (2018), 0.078 % for Yu et al. (2015b), and 0.07 % for Mahowald et al. (2005). b Assuming a P mass fraction of 0.082 % in dust, the same value as used in this study. NA: not available.
According to Salati and Vose (1984), the total amount of phosphorous and magnesium is 21.6 and 29.8 g m−2, respectively, in the ecosystem of the Amazon Basin (14.7 and 2.3 g m−2, respectively, in the soil). Estimated nutrient input from African dust in our study accounts for 0.011 % and 1.6 % of the total phosphorous and magnesium in the soil over the Amazon Basin during the wet season (0.0066 % and 0.91 % on annual average). On the other hand, Vitousek and Sanford (1986) reported losses of 0.8–4 mg m−2 yr−1 for phosphorus and 810 mg m−2 yr−1 for magnesium in the Brazilian ecosystem to surface waters. An estimated annual phosphorous deposition flux of 0.97±0.16 mg m−2 yr−1 into the Amazon Basin on average in our study is at the bottom end of the range of its hydrologic losses, implying that the nutrient input from African dust could to a large extent compensate for the hydrologic losses of phosphorous in the Brazilian forest ecosystem, although the deposition input of magnesium is much less than its hydrologic losses. Similarly, Abouchami et al. (2013) pointed out that most of the Amazonian rainforest is a system with an internal recycling of nutrients. However, the extra influx of nutrients from African dust might account for a significant portion of the net outflux, i.e., dissolved discharge of nutrients into rivers. Keep in mind that the estimates of nutrient influx are subject to uncertainties in the estimates of dust flux as well as the mass fractions of nutrients contained in the dust. In addition, marine aerosols and biomass burning aerosols mixed with the LRT of African dust may also play a role for certain essential nutrients (Prospero et al., 2020; Abouchami et al., 2013). More observations including the nutrient mass fractions in African dust aerosols and the deposition fluxes of those elements into the Amazon Basin are necessarily required in future work to better evaluate the nutrient input associated with the African dust intrusion.
In this study, we use the GEOS-Chem model with an optimized particle mass size distribution (PMSD) of dust aerosols to investigate the influence of the export of African dust toward the Amazon Basin during 2013–2017. The model performance is constrained by multiple datasets obtained from AERONET, MODIS, as well as the Cayenne and ATTO sites in the Amazon Basin. The optimized PMSD in this study captures observed AOD well in terms of both the mean value as well as the decline rate of the logarithm of AOD over the Atlantic Ocean along the transport path (AOaTP), while the other two PMSD schemes tend to overestimate the decline rate by 11 % and underestimate the mean value by up to ∼40 %.
The simulated dust emission from northern Africa is 0.73±0.12 Pg yr−1, accounting for more than 70 % of global dust emission. There exists a strong seasonality in dust emission with peaks in spring or winter, which varies with source regions. The correlation analysis suggests high surface wind speeds and low soil moisture as major drivers of dust emissions. In addition to the transport paths associated with the oscillation of the ITCZ, the export efficiency of African dust toward the Amazon Basin is sensitive to the removal of dust aerosol along the transatlantic transport, which depends on both the assumed PMSD of dust aerosols in the model and meteorological fields (i.e., precipitation and the vertical transport path). The study further estimates the e-folding lifetime of dust aerosols along the transatlantic transport based on the logarithm of the dust column burden against travel time over the AOaTP. The shortest lifetime (1.4 d) is found for winter, associated with high deposition flux, while the highest dust burden over the AOaTP is found in summer, mainly associated with its longer lifetime (4.2 d).
The simulated surface dust concentration averaged over the whole Amazon Basin is 5.7±1.3 µg m−3 during the wet season of 2013–2017, contributing 40±4.5 % to the total surface aerosols. Observed dust peaks at the ATTO site are generally associated with large dust emissions and/or efficient transatlantic transport. The frequency of dust events is 18±4.6 %, averaged over the Amazon Basin, and up to 50 %–60 % at the northeastern coast. During the dust events, DOD is around 0.055±0.0076 and dominates the total AOD over most of the Amazon Basin. Associated with the deposition of African dust, the study estimated annual inputs of 52±8.7, 0.97±0.16, and 21±3.6 mg m−2 yr−1 for iron, phosphorus, and magnesium, respectively, into the Amazon rainforest, which may to some extent compensate for the hydrologic losses of nutrients in the forest ecosystem.
OPS data used in this study can be found at https://www.attodata.org/ddm/data/Showdata/126 (Praß and Pöhlker, 2020). Other datasets are available upon request.
The supplement related to this article is available online at: https://doi.org/10.5194/acp-23-9993-2023-supplement.
XRW conducted the data analysis and wrote the manuscript. QQW planned the study, collected the resources, performed the model simulation and data analysis, and finalized the manuscript. MP, CP, DM, and PA provided the observational data in the Amazon Basin. JWG, NY, XJY, JCT, JH, NM, YFC, and HS discussed the results. MA provided the observational data in the Amazon Basin and reviewed the manuscript.
At least one of the (co-)authors is a member of the editorial board of Atmospheric Chemistry and Physics. The peer-review process was guided by an independent editor, and the authors also have no other competing interests to declare.
Publisher’s note: Copernicus Publications remains neutral with regard to jurisdictional claims in published maps and institutional affiliations.
This article is part of the special issue “Dust aerosol measurements, modeling and multidisciplinary effects (AMT/ACP inter-journal SI)”. It is not associated with a conference.
We acknowledge the support by the Instituto Nacional de Pesquisas da Amazônia (INPA). We would like to thank all the people involved in the technical, logistical, and scientific support within the ATTO project.
This research has been supported by the National Natural Science Foundation of China (grant nos. 41907182, 41877303, and 91644218), the National Key R&D Program of China (grant no. 2018YFC0213901), the Fundamental Research Funds for the Central Universities (grant no. 21621105), the Guangdong Innovative and Entrepreneurial Research Team Program (research team on atmospheric environmental roles and effects of carbonaceous species: grant no. 2016ZT06N263), and the Special Fund Project for Science and Technology Innovation Strategy of Guangdong Province (grant no. 2019B121205004). The operation of the ATTO site has been supported by the Max Planck Society (MPG), the German Federal Ministry of Education and Research (BMBF contract nos. 01LB1001A, 01LK1602B, and 01LK2101B), the Brazilian Ministério da Ciência, Tecnologia e Inovação (MCTI/FINEP contract no. 01.11.01248.00), Amazon State University (UEA), FAPEAM, LBA/INPA, FAPESP (Fundação de Amparo à Pesquisa do Estado de São Paulo, grant no. 2017/17047-0), and SDS/CEUC/RDS-Uatumã. Xurong Wang has been supported by the China Scholarship Council (CSC). Maria Prass has received financial support from the Max Planck Graduate Center with Johannes Gutenberg University, Mainz.
This paper was edited by N'Datchoh Evelyne Touré and reviewed by two anonymous referees.
Abouchami, W., Näthe, K., Kumar, A., Galer, S. J. G., Jochum, K. P., Williams, E., Horbe, A. M. C., Rosa, J. W. C., Balsam, W., Adams, D., Mezger, K., and Andreae, M. O.: Geochemical and isotopic characterization of the Bodélé Depression dust source and implications for transatlantic dust transport to the Amazon Basin, Earth Planet. Sc. Lett., 380, 112–123, https://doi.org/10.1016/j.epsl.2013.08.028, 2013.
Adachi, K., Oshima, N., Gong, Z., de Sá, S., Bateman, A. P., Martin, S. T., de Brito, J. F., Artaxo, P., Cirino, G. G., Sedlacek III, A. J., and Buseck, P. R.: Mixing states of Amazon basin aerosol particles transported over long distances using transmission electron microscopy, Atmos. Chem. Phys., 20, 11923–11939, https://doi.org/10.5194/acp-20-11923-2020, 2020.
Alizadeh-Choobari, O., Sturman, A., and Zawar-Reza, P.: A global satellite view of the seasonal distribution of mineral dust and its correlation with atmospheric circulation, Dynam. Atmos. Oceans, 68, 20–34, https://doi.org/10.1016/j.dynatmoce.2014.07.002, 2014.
Andreae, M. O., Acevedo, O. C., Araùjo, A., Artaxo, P., Barbosa, C. G. G., Barbosa, H. M. J., Brito, J., Carbone, S., Chi, X., Cintra, B. B. L., da Silva, N. F., Dias, N. L., Dias-Júnior, C. Q., Ditas, F., Ditz, R., Godoi, A. F. L., Godoi, R. H. M., Heimann, M., Hoffmann, T., Kesselmeier, J., Könemann, T., Krüger, M. L., Lavric, J. V., Manzi, A. O., Lopes, A. P., Martins, D. L., Mikhailov, E. F., Moran-Zuloaga, D., Nelson, B. W., Nölscher, A. C., Santos Nogueira, D., Piedade, M. T. F., Pöhlker, C., Pöschl, U., Quesada, C. A., Rizzo, L. V., Ro, C.-U., Ruckteschler, N., Sá, L. D. A., de Oliveira Sá, M., Sales, C. B., dos Santos, R. M. N., Saturno, J., Schöngart, J., Sörgel, M., de Souza, C. M., de Souza, R. A. F., Su, H., Targhetta, N., Tóta, J., Trebs, I., Trumbore, S., van Eijck, A., Walter, D., Wang, Z., Weber, B., Williams, J., Winderlich, J., Wittmann, F., Wolff, S., and Yáñez-Serrano, A. M.: The Amazon Tall Tower Observatory (ATTO): overview of pilot measurements on ecosystem ecology, meteorology, trace gases, and aerosols, Atmos. Chem. Phys., 15, 10723–10776, https://doi.org/10.5194/acp-15-10723-2015, 2015.
Baars, H., Ansmann, A., Althausen, D., Engelmann, R., Artaxo, P., Pauliquevis, T., and Souza, R.: Further evidence for significant smoke transport from Africa to Amazonia, Geophys. Res. Lett., 38, L20802, https://doi.org/10.1029/2011GL049200, 2011.
Baars, H., Ansmann, A., Althausen, D., Engelmann, R., Heese, B., Müller, D., Artaxo, P., Paixao, M., Pauliquevis, T., and Souza, R.: Aerosol profiling with lidar in the Amazon Basin during the wet and dry season, J. Geophys. Res., 117, D21201, https://doi.org/10.1029/2012JD018338, 2012.
Bakker, N. L., Drake, N. A., and Bristow, C. S.: Evaluating the relative importance of northern African mineral dust sources using remote sensing, Atmos. Chem. Phys., 19, 10525–10535, https://doi.org/10.5194/acp-19-10525-2019, 2019.
Barkley, A. E., Prospero, J. M., Mahowald, N., Hamilton, D. S., Popendorf, K. J., Oehlert, A. M., Pourmand, A., Gatineau, A., Panechou-Pulcherie, K., Blackwelder, P., and Gaston, C. J.: African biomass burning is a substantial source of phosphorus deposition to the Amazon, Tropical Atlantic Ocean, and Southern Ocean, P. Natl. Acad. Sci. USA, 116, 16216–16221, https://doi.org/10.1073/pnas.1906091116, 2019.
Ben-Ami, Y., Koren, I., Rudich, Y., Artaxo, P., Martin, S. T., and Andreae, M. O.: Transport of North African dust from the Bodélé depression to the Amazon Basin: a case study, Atmos. Chem. Phys., 10, 7533–7544, https://doi.org/10.5194/acp-10-7533-2010, 2010.
Ben-Ami, Y., Koren, I., Altaratz, O., Kostinski, A., and Lehahn, Y.: Discernible rhythm in the spatio/temporal distributions of transatlantic dust, Atmos. Chem. Phys., 12, 2253–2262, https://doi.org/10.5194/acp-12-2253-2012, 2012.
Bristow, C. S., Hudson-Edwards, K. A., and Chappell, A.: Fertilizing the Amazon and equatorial Atlantic with West African dust, Geophys. Res. Lett., 37, L14807, https://doi.org/10.1029/2010GL043486, 2010.
Chen, Y., Kreidenweis, S. M., McInnes, L. M., Rogers, D. C., and DeMott, P. J.: Single particle analyses of ice nucleating aerosols in the upper troposphere and lower stratosphere, Geophys. Res. Lett., 25, 1391–1394, https://doi.org/10.1029/97gl03261, 1998.
Chiemeka, I. U., Oleka, M. O., and Chineke, T.: Determination of aerosol metal composition and concentration during the 2001/2002 Harmattan season at Uturu, Nigeria, Global Journal of Pure and Applied Sciences, 13, 449–453, https://doi.org/10.4314/gjpas.v13i3.16734, 2007.
Cowie, S. M., Knippertz, P., and Marsham, J. H.: A climatology of dust emission events from northern Africa using long-term surface observations, Atmos. Chem. Phys., 14, 8579–8597, https://doi.org/10.5194/acp-14-8579-2014, 2014.
Demott, P. J., Sassen, K., Poellot, M. R., Baumgardner, D., Rogers, D. C., Brooks, S. D., Prenni, A. J., and Kreidenweis, S. M.: African dust aerosols as atmospheric ice nuclei, Geophys. Res. Lett., 30, 1732, https://doi.org/10.1029/2003GL017410, 2003.
Di Biagio, C., Formenti, P., Balkanski, Y., Caponi, L., Cazaunau, M., Pangui, E., Journet, E., Nowak, S., Andreae, M. O., Kandler, K., Saeed, T., Piketh, S., Seibert, D., Williams, E., and Doussin, J.-F.: Complex refractive indices and single-scattering albedo of global dust aerosols in the shortwave spectrum and relationship to size and iron content, Atmos. Chem. Phys., 19, 15503–15531, https://doi.org/10.5194/acp-19-15503-2019, 2019.
Drury, E., Jacob, D. J., Spurr, R. J. D., Wang, J., Shinozuka, Y., Anderson, B. E., Clarke, A. D., Dibb, J., McNaughton, C., and Weber, R.: Synthesis of satellite (MODIS), aircraft (ICARTT), and surface (IMPROVE, EPA-AQS, AERONET) aerosol observations over eastern North America to improve MODIS aerosol retrievals and constrain surface aerosol concentrations and sources, J. Geophys. Res., 115, D14204, https://doi.org/10.1029/2009JD012629, 2010.
Dubovik, O., Holben, B., Eck, T. F., Smirnov, A., Kaufman, Y. J., King, M. D., Tanré, D., and Slutsker, I.: Variability of Absorption and Optical Properties of Key Aerosol Types Observed in Worldwide Locations, J. Atmos. Sci., 59, 590–608, https://doi.org/10.1175/1520-0469(2002)059<0590:VOAAOP>2.0.CO;2, 2002.
Duncan Fairlie, T., Jacob, D. J., and Park, R. J.: The impact of transpacific transport of mineral dust in the United States, Atmos. Environ., 41, 1251–1266, https://doi.org/10.1016/j.atmosenv.2006.09.048, 2007.
Dusek, U., Frank, G. P., Hildebrandt, L., Curtius, J., Schneider, J., Walter, S., Chand, D., Drewnick, F., Hings, S., Jung, D., Borrmann, S., and Andreae, M. O.: Size Matters More Than Chemistry for Cloud-Nucleating Ability of Aerosol Particles, Science, 312, 1375–1378, https://doi.org/10.1126/science.1125261, 2006.
Fiedler, S., Schepanski, K., Heinold, B., Knippertz, P., and Tegen, I.: Climatology of nocturnal low-level jets over North Africa and implications for modeling mineral dust emission, J. Geophys. Res.-Atmos., 118, 6100–6121, https://doi.org/10.1002/jgrd.50394, 2013.
Formenti, P., Andreae, M. O., Lange, L., Roberts, G., Cafmeyer, J., Rajta, I., Maenhaut, W., Holben, B. N., Artaxo, P., and Lelieveld, J.: Saharan dust in Brazil and Suriname during the Large-Scale Biosphere-Atmosphere Experiment in Amazonia (LBA) – Cooperative LBA Regional Experiment (CLAIRE) in March 1998, J. Geophys. Res., 106, 14919–14934, https://doi.org/10.1029/2000JD900827, 2001.
Gläser, G., Wernli, H., Kerkweg, A., and Teubler, F.: The transatlantic dust transport from North Africa to the Americas – Its characteristics and source regions, J. Geophys. Res.-Atmos., 120, 11231–11252, https://doi.org/10.1002/2015JD023792, 2015.
Herbert, R. J., Krom, M. D., Carslaw, K. S., Stockdale, A., Mortimer, R. J. G., Benning, L. G., Pringle, K., and Browse, J.: The Effect of Atmospheric Acid Processing on the Global Deposition of Bioavailable Phosphorus From Dust, Global Biogeochem. Cy., 32, 1367–1385, https://doi.org/10.1029/2018GB005880, 2018.
Highwood, E. J., Haywood, J. M., Silverstone, M. D., Newman, S. M., and Taylor, J. P.: Radiative properties and direct effect of Saharan dust measured by the C-130 aircraft during Saharan Dust Experiment (SHADE): 2. Terrestrial spectrum, J. Geophys. Res., 108, 8578, https://doi.org/10.1029/2002JD002552, 2003.
Huneeus, N., Schulz, M., Balkanski, Y., Griesfeller, J., Prospero, J., Kinne, S., Bauer, S., Boucher, O., Chin, M., Dentener, F., Diehl, T., Easter, R., Fillmore, D., Ghan, S., Ginoux, P., Grini, A., Horowitz, L., Koch, D., Krol, M. C., Landing, W., Liu, X., Mahowald, N., Miller, R., Morcrette, J.-J., Myhre, G., Penner, J., Perlwitz, J., Stier, P., Takemura, T., and Zender, C. S.: Global dust model intercomparison in AeroCom phase I, Atmos. Chem. Phys., 11, 7781–7816, https://doi.org/10.5194/acp-11-7781-2011, 2011.
Jaeglé, L., Quinn, P. K., Bates, T. S., Alexander, B., and Lin, J.-T.: Global distribution of sea salt aerosols: new constraints from in situ and remote sensing observations, Atmos. Chem. Phys., 11, 3137–3157, https://doi.org/10.5194/acp-11-3137-2011, 2011.
Jimenez, J. L., Canagaratna, M. R., Donahue, N. M., Prevot, A. S. H., Zhang, Q., Kroll, J. H., DeCarlo, P. F., Allan, J. D., Coe, H., Ng, N. L., Aiken, A. C., Docherty, K. S., Ulbrich, I. M., Grieshop, A. P., Robinson, A. L., Duplissy, J., Smith, J. D., Wilson, K. R., Lanz, V. A., Hueglin, C., Sun, Y. L., Tian, J., Laaksonen, A., Raatikainen, T., Rautiainen, J., Vaattovaara, P., Ehn, M., Kulmala, M., Tomlinson, J. M., Collins, D. R., Cubison, M. J., Dunlea, J., Huffman, J. A., Onasch, T. B., Alfarra, M. R., Williams, P. I., Bower, K., Kondo, Y., Schneider, J., Drewnick, F., Borrmann, S., Weimer, S., Demerjian, K., Salcedo, D., Cottrell, L., Griffin, R., Takami, A., Miyoshi, T., Hatakeyama, S., Shimono, A., Sun, J. Y., Zhang, Y. M., Dzepina, K., Kimmel, J. R., Sueper, D., Jayne, J. T., Herndon, S. C., Trimborn, A. M., Williams, L. R., Wood, E. C., Middlebrook, A. M., Kolb, C. E., Baltensperger, U., and Worsnop, D. R.: Evolution of Organic Aerosols in the Atmosphere, Science, 326, 5959, 1525–1529, https://doi.org/10.1126/science.1180353, 2009.
Kaufman, Y. J.: Dust transport and deposition observed from the Terra-Moderate Resolution Imaging Spectroradiometer (MODIS) spacecraft over the Atlantic Ocean, J. Geophys. Res., 110, D10S12, https://doi.org/10.1029/2003jd004436, 2005
Kim, D., Chin, M., Yu, H., Diehl, T., Tan, Q., Kahn, R. A., Tsigaridis, K., Bauer, S. E., Takemura, T., Pozzoli, L., Bellouin, N., Schulz, M., Peyridieu, S., Chédin, A., and Koffi, B.: Sources, sinks, and transatlantic transport of North African dust aerosol: A multimodel analysis and comparison with remote sensing data, J. Geophys. Res., 119, 6259–6277, https://doi.org/10.1002/2013JD021099, 2014.
Kim, D., Chin, M., Remer, L. A., Diehl, T., Bian, H., Yu, H., Brown, M. E., and Stockwell, W. R.: Role of surface wind and vegetation cover in multi-decadal variations of dust emission in the Sahara and Sahel, Atmos. Environ., 148, 282–296, https://doi.org/10.1016/j.atmosenv.2016.10.051, 2017.
Knippertz, P., Deutscher, C., Kandler, K., Müller, T., Schulz, O., and Schütz, L.: Dust mobilization due to density currents in the Atlas region: Observations from the Saharan Mineral Dust Experiment 2006 field campaign, J. Geophys. Res., 112, D21109, https://doi.org/10.1029/2007JD008774, 2007.
Koepke, P., Hess, M., Schult, I., and Shettle, E. P.: Global aerosol data set, Report No. 243, Max-Planck Institute for Meteorology, Hamburg, ISSN 0937-1060, 1997.
Kok, J. F.: A scaling theory for the size distribution of emitted dust aerosols suggests climate models underestimate the size of the global dust cycle, P. Natl. Acad. Sci. USA, 108, 1016–1021, https://doi.org/10.1073/pnas.1014798108, 2011.
Kok, J. F., Adebiyi, A. A., Albani, S., Balkanski, Y., Checa-Garcia, R., Chin, M., Colarco, P. R., Hamilton, D. S., Huang, Y., Ito, A., Klose, M., Li, L., Mahowald, N. M., Miller, R. L., Obiso, V., Pérez García-Pando, C., Rocha-Lima, A., and Wan, J. S.: Contribution of the world's main dust source regions to the global cycle of desert dust, Atmos. Chem. Phys., 21, 8169–8193, https://doi.org/10.5194/acp-21-8169-2021, 2021.
Li, Y., Randerson, J. T., Mahowald, N. M., and Lawrence, P. J.: Deforestation Strengthens Atmospheric Transport of Mineral Dust and Phosphorus from North Africa to the Amazon, J. Climate, 34, 6087–6096, https://doi.org/10.1175/jcli-d-20-0786.1, 2021.
Liu, D., Wang, Y., Wang, Z., and Zhou, J.: The Three-Dimensional Structure of Transatlantic African Dust Transport: A New Perspective from CALIPSO LIDAR Measurements, Adv. Meteorol., 2012, 850704, https://doi.org/10.1155/2012/850704, 2012.
Liu, D., Taylor, J. W., Crosier, J., Marsden, N., Bower, K. N., Lloyd, G., Ryder, C. L., Brooke, J. K., Cotton, R., Marenco, F., Blyth, A., Cui, Z., Estelles, V., Gallagher, M., Coe, H., and Choularton, T. W.: Aircraft and ground measurements of dust aerosols over the west African coast in summer 2015 during ICE-D and AER-D, Atmos. Chem. Phys., 18, 3817–3838, https://doi.org/10.5194/acp-18-3817-2018, 2018.
Liu, H., Jacob, D. J., Bey, I., and Yantosca, R. M.: Constraints from 210Pb and 7Be on wet deposition and transport in a global three-dimensional chemical tracer model driven by assimilated meteorological fields, J. Geophys. Res., 106, 12109-12128, https://doi.org/10.1029/2000JD900839, 2001.
Lucchesi, R.: File Specification for GEOS-5 FP, GMAO Office Note No. 4, Version 1.0, 63 pp., http://gmao.gsfc.nasa.gov/pubs/office_notes (last access: 1 September 2023), 2013.
Mahowald, N., Albani, S., Engelstaedter, S., Winckler, G., and Goman, M.: Model insight into glacial–interglacial paleodust records, Quaternary Sci. Rev., 30, 832–854, https://doi.org/10.1016/j.quascirev.2010.09.007, 2011a.
Mahowald, N., Ward, D. S., Kloster, S., Flanner, M. G., Heald, C. L., Heavens, N. G., Hess, P. G., Lamarque, J.-F., and Chuang, P. Y.: Aerosol Impacts on Climate and Biogeochemistry, Annu. Rev. Env. Resour., 36, 45–74, https://doi.org/10.1146/annurev-environ-042009-094507, 2011b.
Mahowald, N., Albani, S., Kok, J. F., Engelstaeder, S., Scanza, R., Ward, D. S., and Flanner, M. G.: The size distribution of desert dust aerosols and its impact on the Earth system, Aeolian Res., 15, 53–71, https://doi.org/10.1016/j.aeolia.2013.09.002, 2014.
Mahowald, N. M. and Kiehl, L. M.: Mineral aerosol and cloud interactions, Geophys. Res. Lett., 30, 1475, https://doi.org/10.1029/2002GL016762, 2003.
Mahowald, N. M., Muhs, D. R., Levis, S., Rasch, P. J., Yoshioka, M., Zender, C. S., and Luo, C.: Change in atmospheric mineral aerosols in response to climate: Last glacial period, preindustrial, modern, and doubled carbon dioxide climates, J. Geophys. Res., 111, D10202, https://doi.org/10.1029/2005JD006653, 2006.
Mahowald, N. M., Artaxo, P., Baker, A. R., Jickells, T. D., Okin, G. S., Randerson, J. T., and Townsend, A. R.: Impacts of biomass burning emissions and land use change on Amazonian atmospheric phosphorus cycling and deposition, Global Biogeochem. Cy., 19, GB4030, https://doi.org/10.1029/2005GB002541, 2005.
Martin, R. V., Jacob, D. J., Yantosca, R. M., Chin, M., and Ginoux, P.: Global and regional decreases in tropospheric oxidants from photochemical effects of aerosols, J. Geophys. Res., 108, 4097, https://doi.org/10.1029/2002JD002622, 2003.
Martin, S. T., Andreae, M. O., Artaxo, P., Baumgardner, D., Chen, Q., Goldstein, A. H., Guenther, A., Heald, C. L., Mayol-Bracero, O. L., McMurry, P. H., Pauliquevis, T., Pöschl, U., Prather, K. A., Roberts, G. C., Saleska, S. R., Silva Dias, M. A., Spracklen, D. V., Swietlicki, E., and Trebs, I.: Sources and properties of Amazonian aerosol particles, Rev. Geophys., 48, RG2002, https://doi.org/10.1029/2008RG000280, 2010a.
Martin, S. T., Andreae, M. O., Althausen, D., Artaxo, P., Baars, H., Borrmann, S., Chen, Q., Farmer, D. K., Guenther, A., Gunthe, S. S., Jimenez, J. L., Karl, T., Longo, K., Manzi, A., Müller, T., Pauliquevis, T., Petters, M. D., Prenni, A. J., Pöschl, U., Rizzo, L. V., Schneider, J., Smith, J. N., Swietlicki, E., Tota, J., Wang, J., Wiedensohler, A., and Zorn, S. R.: An overview of the Amazonian Aerosol Characterization Experiment 2008 (AMAZE-08), Atmos. Chem. Phys., 10, 11415–11438, https://doi.org/10.5194/acp-10-11415-2010, 2010b.
Moran-Zuloaga, D., Ditas, F., Walter, D., Saturno, J., Brito, J., Carbone, S., Chi, X., Hrabě de Angelis, I., Baars, H., Godoi, R. H. M., Heese, B., Holanda, B. A., Lavrič, J. V., Martin, S. T., Ming, J., Pöhlker, M. L., Ruckteschler, N., Su, H., Wang, Y., Wang, Q., Wang, Z., Weber, B., Wolff, S., Artaxo, P., Pöschl, U., Andreae, M. O., and Pöhlker, C.: Long-term study on coarse mode aerosols in the Amazon rain forest with the frequent intrusion of Saharan dust plumes, Atmos. Chem. Phys., 18, 10055–10088, https://doi.org/10.5194/acp-18-10055-2018, 2018.
Niedermeier, N., Held, A., Müller, T., Heinold, B., Schepanski, K., Tegen, I., Kandler, K., Ebert, M., Weinbruch, S., Read, K., Lee, J., Fomba, K. W., Müller, K., Herrmann, H., and Wiedensohler, A.: Mass deposition fluxes of Saharan mineral dust to the tropical northeast Atlantic Ocean: an intercomparison of methods, Atmos. Chem. Phys., 14, 2245–2266, https://doi.org/10.5194/acp-14-2245-2014, 2014.
Pierre, C., Bergametti, G., Marticorena, B., Mougin, E., Bouet, C., and Schmechtig, C.: Impact of vegetation and soil moisture seasonal dynamics on dust emissions over the Sahel, J. Geophys. Res.-Atmos., 117, D06114, https://doi.org/10.1029/2011JD016950, 2012.
Pöhlker, C., Walter, D., Paulsen, H., Könemann, T., Rodríguez-Caballero, E., Moran-Zuloaga, D., Brito, J., Carbone, S., Degrendele, C., Després, V. R., Ditas, F., Holanda, B. A., Kaiser, J. W., Lammel, G., Lavrič, J. V., Ming, J., Pickersgill, D., Pöhlker, M. L., Praß, M., Löbs, N., Saturno, J., Sörgel, M., Wang, Q., Weber, B., Wolff, S., Artaxo, P., Pöschl, U., and Andreae, M. O.: Land cover and its transformation in the backward trajectory footprint region of the Amazon Tall Tower Observatory, Atmos. Chem. Phys., 19, 8425–8470, https://doi.org/10.5194/acp-19-8425-2019, 2019.
Pöhlker, M. L., Ditas, F., Saturno, J., Klimach, T., Hrabě de Angelis, I., Araùjo, A. C., Brito, J., Carbone, S., Cheng, Y., Chi, X., Ditz, R., Gunthe, S. S., Holanda, B. A., Kandler, K., Kesselmeier, J., Könemann, T., Krüger, O. O., Lavrič, J. V., Martin, S. T., Mikhailov, E., Moran-Zuloaga, D., Rizzo, L. V., Rose, D., Su, H., Thalman, R., Walter, D., Wang, J., Wolff, S., Barbosa, H. M. J., Artaxo, P., Andreae, M. O., Pöschl, U., and Pöhlker, C.: Long-term observations of cloud condensation nuclei over the Amazon rain forest – Part 2: Variability and characteristics of biomass burning, long-range transport, and pristine rain forest aerosols, Atmos. Chem. Phys., 18, 10289–10331, https://doi.org/10.5194/acp-18-10289-2018, 2018.
Pöschl, U., Martin, S. T., Sinha, B., Chen, Q., Gunthe, S. S., Huffman, J. A., Borrmann, S., Farmer, D. K., Garland, R. M., Helas, G., Jimenez, J. L., King, S. M., Manzi, A., Mikhailov, E., Pauliquevis, T., Petters, M. D., Prenni, A. J., Roldin, P., Rose, D., Schneider, J., Su, H., Zorn, S. R., Artaxo, P., and Andreae, M. O.: Rainforest Aerosols as Biogenic Nuclei of Clouds and Precipitation in the Amazon, Science, 329, 1513–1516, https://doi.org/10.1126/science.1191056, 2010.
Praß, M. and Pöhlker, C.: Coarse mode aerosol concentration, Version 10, ATTO [data set], https://www.attodata.org/ddm/data/Showdata/126 (last access: 1 September 2023), 2020.
Prass, M., Andreae, M. O., de Araùjo, A. C., Artaxo, P., Ditas, F., Elbert, W., Förster, J.-D., Franco, M. A., Hrabe de Angelis, I., Kesselmeier, J., Klimach, T., Kremper, L. A., Thines, E., Walter, D., Weber, J., Weber, B., Fuchs, B. M., Pöschl, U., and Pöhlker, C.: Bioaerosols in the Amazon rain forest: temporal variations and vertical profiles of Eukarya, Bacteria, and Archaea, Biogeosciences, 18, 4873–4887, https://doi.org/10.5194/bg-18-4873-2021, 2021.
Prospero, J. M., Glaccum, R. A., and Nees, R. T.: Atmospheric transport of soil dust from Africa to South America, Nature, 289, 570–572, https://doi.org/10.1038/289570a0, 1981.
Prospero, J. M., Collard, F.-X., Molinié, J., and Jeannot, A.: Characterizing the annual cycle of African dust transport to the Caribbean Basin and South America and its impact on the environment and air quality, Global Biogeochem. Cy., 28, 757–773, https://doi.org/10.1002/2013GB004802, 2014.
Prospero, J. M., Barkley, A. E., Gaston, C. J., Gatineau, A., Campos y Sansano, A., and Panechou, K.: Characterizing and Quantifying African Dust Transport and Deposition to South America: Implications for the Phosphorus Budget in the Amazon Basin, Global Biogeochem. Cy., 34, e2020GB006536, https://doi.org/10.1029/2020GB006536, 2020.
Ridley, D. A., Heald, C. L., and Ford, B.: North African dust export and deposition: A satellite and model perspective, J. Geophys. Res., 117, D02202, https://doi.org/10.1029/2011JD016794, 2012.
Ridley, D. A., Heald, C. L., and Prospero, J. M.: What controls the recent changes in African mineral dust aerosol across the Atlantic?, Atmos. Chem. Phys., 14, 5735–5747, https://doi.org/10.5194/acp-14-5735-2014, 2014.
Rizzolo, J. A., Barbosa, C. G. G., Borillo, G. C., Godoi, A. F. L., Souza, R. A. F., Andreoli, R. V., Manzi, A. O., Sá, M. O., Alves, E. G., Pöhlker, C., Angelis, I. H., Ditas, F., Saturno, J., Moran-Zuloaga, D., Rizzo, L. V., Rosário, N. E., Pauliquevis, T., Santos, R. M. N., Yamamoto, C. I., Andreae, M. O., Artaxo, P., Taylor, P. E., and Godoi, R. H. M.: Soluble iron nutrients in Saharan dust over the central Amazon rainforest, Atmos. Chem. Phys., 17, 2673–2687, https://doi.org/10.5194/acp-17-2673-2017, 2017.
Roberts, A. and Knippertz, P.: Haboobs: Convectively generated dust storms in West Africa, Weather, 67, 311–316, 2012.
Ryder, C. L., Highwood, E. J., Lai, T. M., Sodemann, H., and Marsham, J. H.: Impact of atmospheric transport on the evolution of microphysical and optical properties of Saharan dust, Geophys. Res. Lett., 40, 2433–2438, https://doi.org/10.1002/grl.50482, 2013a.
Ryder, C. L., Highwood, E. J., Rosenberg, P. D., Trembath, J., Brooke, J. K., Bart, M., Dean, A., Crosier, J., Dorsey, J., Brindley, H., Banks, J., Marsham, J. H., McQuaid, J. B., Sodemann, H., and Washington, R.: Optical properties of Saharan dust aerosol and contribution from the coarse mode as measured during the Fennec 2011 aircraft campaign, Atmos. Chem. Phys., 13, 303–325, https://doi.org/10.5194/acp-13-303-2013, 2013b.
Ryder, C. L., Highwood, E. J., Rosenberg, P. D., Trembath, J., Brooke, J. K., Bart, M., Dean, A., Crosier, J., Dorsey, J., Brindley, H., Banks, J., Marsham, J. H., McQuaid, J. B., Sodemann, H., and Washington, R.: Optical properties of Saharan dust aerosol and contribution from the coarse mode as measured during the Fennec 2011 aircraft campaign, Atmos. Chem. Phys., 13, 303–325, https://doi.org/10.5194/acp-13-303-2013, 2018.
Salati, E. and Vose, P. B.: Amazon Basin: A System in Equilibrium, Science, 225, 129–138, https://doi.org/10.1126/science.225.4658.129, 1984.
Shao, Y., Fink, A. H., and Klose, M.: Numerical simulation of a continental-scale Saharan dust event, J. Geophys. Res., 115, D13205, https://doi.org/10.1029/2009JD012678, 2010.
Sinyuk, A., Torres, O., and Dubovik, O.: Combined use of satellite and surface observations to infer the imaginary part of refractive index of Saharan dust, Geophys. Res. Lett., 30, 1081, https://doi.org/10.1029/2002GL016189, 2003.
Swap, R., Garstang, M., Greco, S., Talbot, R., and Kållberg, P.: Saharan dust in the Amazon Basin, Tellus B, 44, 133–149, https://doi.org/10.1034/j.1600-0889.1992.t01-1-00005.x, 1992.
Talbot, R. W., Andreae, M. O., Berresheim, H., Artaxo, P., Garstang, M., Harriss, R. C., Beecher, K. M., and Li, S. M.: Aerosol chemistry during the wet season in central Amazonia: The influence of long-range transport, J. Geophys. Res., 95, 16955–16969, https://doi.org/10.1029/JD095iD10p16955, 1990.
van der Does, M., Korte, L. F., Munday, C. I., Brummer, G.-J. A., and Stuut, J.-B. W.: Particle size traces modern Saharan dust transport and deposition across the equatorial North Atlantic, Atmos. Chem. Phys., 16, 13697–13710, https://doi.org/10.5194/acp-16-13697-2016, 2016.
Vitousek, P. M. and Sanford, R. L.: Nutrient Cycling in Moist Tropical Forest, Annu. Rev. Ecol. Syst., 17, 137–167, http://www.jstor.org/stable/2096992 (last access: 1 September 2023), 1986.
Wang, J., Christopher, S. A., Brechtel, F., Kim, J., Schmid, B., Redemann, J., Russell, P. B., Quinn, P., and Holben, B. N.: Geostationary satellite retrievals of aerosol optical thickness during ACE-Asia, J. Geophys. Res., 108, 8657, https://doi.org/10.1029/2003JD003580, 2003a.
Wang, J., Christopher, S. A., Reid, J. S., Maring, H., Savoie, D., Holben, B. N., Livingston, J. M., Russell, P. B., and Yang, S.-K.: GOES 8 retrieval of dust aerosol optical thickness over the Atlantic Ocean during PRIDE, J. Geophys. Res., 108, 8595, https://doi.org/10.1029/2002JD002494, 2003b.
Wang, Q., Gu, J., and Wang, X.: The impact of Sahara dust on air quality and public health in European countries, Atmos. Environ., 241, 117771, https://doi.org/10.1016/j.atmosenv.2020.117771, 2020.
Wang, Q., Jacob, D. J., Fisher, J. A., Mao, J., Leibensperger, E. M., Carouge, C. C., Le Sager, P., Kondo, Y., Jimenez, J. L., Cubison, M. J., and Doherty, S. J.: Sources of carbonaceous aerosols and deposited black carbon in the Arctic in winter-spring: implications for radiative forcing, Atmos. Chem. Phys., 11, 12453–12473, https://doi.org/10.5194/acp-11-12453-2011, 2011.
Wang, Q., Saturno, J., Chi, X., Walter, D., Lavric, J. V., Moran-Zuloaga, D., Ditas, F., Pöhlker, C., Brito, J., Carbone, S., Artaxo, P., and Andreae, M. O.: Modeling investigation of light-absorbing aerosols in the Amazon Basin during the wet season, Atmos. Chem. Phys., 16, 14775–14794, https://doi.org/10.5194/acp-16-14775-2016, 2016.
Wang, W., Evan, A. T., Lavaysse, C., and Flamant, C.: The role the Saharan Heat Low plays in dust emission and transport during summertime in North Africa, Aeolian Res., 28, 1–12, https://doi.org/10.1016/j.aeolia.2017.07.001, 2017.
Wang, Y., Jacob, D. J., and Logan, J. A.: Global simulation of tropospheric O3-NOx-hydrocarbon chemistry: 1. Model formulation, J. Geophys. Res., 103, 10713–10725, https://doi.org/10.1029/98JD00158, 1998.
Wesely, M. L.: Parameterization of surface resistances to gaseous dry deposition in regional-scale numerical models, Atmos. Environ., 41, 52–63, https://doi.org/10.1016/j.atmosenv.2007.10.058, 2007.
White, B. R.: soil transport by winds on Mars, J. Geophys. Res.-Sol. Ea., 84, 4643–4651, https://doi.org/10.1029/JB084iB09p04643, 1979.
Ysard, N., Jones, A. P., Demyk, K., Boutéraon, T., and Koehler, M.: The optical properties of dust: the effects of composition, size, and structure, Astron. Astrophys., 617, A124, https://doi.org/10.1051/0004-6361/201833386, 2018.
Yu, H., Chin, M., Bian, H., Yuan, T., Prospero, J. M., Omar, A. H., Remer, L. A., Winker, D. M., Yang, Y., Zhang, Y., and Zhang, Z.: Quantification of trans-Atlantic dust transport from seven-year (2007–2013) record of CALIPSO lidar measurements, Remote Sens. Environ., 159, 232–249, https://doi.org/10.1016/j.rse.2014.12.010, 2015a.
Yu, H., Chin, M., Yuan, T., Bian, H., Remer, L. A., Prospero, J. M., Omar, A., Winker, D., Yang, Y., Zhang, Y., Zhang, Z., and Zhao, C.: The fertilizing role of African dust in the Amazon rainforest: A first multiyear assessment based on data from Cloud-Aerosol Lidar and Infrared Pathfinder Satellite Observations, Geophys. Res. Lett., 42, 1984–1991, https://doi.org/10.1002/2015GL063040, 2015b.
Yu, H., Tan, Q., Chin, M., Remer, L. A., Kahn, R. A., Bian, H., Kim, D., Zhang, Z., Yuan, T., Omar, A. H., Winker, D. M., Levy, R. C., Kalashnikova, O., Crepeau, L., Capelle, V., and Chédin, A.: Estimates of African Dust Deposition Along the Trans-Atlantic Transit Using the Decadelong Record of Aerosol Measurements from CALIOP, MODIS, MISR, and IASI, J. Geophys. Res., 124, 7975–7996, https://doi.org/10.1029/2019JD030574, 2019.
Yu, Y., Notaro, M., Wang, F., Mao, J., Shi, X., and Wei, Y.: Observed positive vegetation-rainfall feedbacks in the Sahel dominated by a moisture recycling mechanism, Nat. Commun., 8, 1873, https://doi.org/10.1038/s41467-017-02021-1, 2017.
Yu, Y., Kalashnikova, O. V., Garay, M. J., Lee, H., Notaro, M., Campbell, J. R., Marquis, J., Ginoux, P., and Okin, G. S.: Disproving the Bodélé Depression as the Primary Source of Dust Fertilizing the Amazon Rainforest, Geophys. Res. Lett., 47, e2020GL088020, https://doi.org/10.1029/2020GL088020, 2020.
Zender, C. S., Bian, H., and Newman, D.: Mineral Dust Entrainment and Deposition (DEAD) model: Description and 1990s dust climatology, J. Geophys. Res., 108, 4416, https://doi.org/10.1029/2002JD002775, 2003.
Zhang, L., Gong, S., Padro, J., and Barrie, L.: A size-segregated particle dry deposition scheme for an atmospheric aerosol module, Atmos. Environ., 35, 549–560, https://doi.org/10.1016/S1352-2310(00)00326-5, 2001.
Zhang, L., Kok, J. F., Henze, D. K., Li, Q., and Zhao, C.: Improving simulations of fine dust surface concentrations over the western United States by optimizing the particle size distribution, Geophys. Res. Lett., 40, 3270–3275, https://doi.org/10.1002/grl.50591, 2013.