the Creative Commons Attribution 4.0 License.
the Creative Commons Attribution 4.0 License.
 | 01 Sep 2023
Rapid O3 assimilations – Part 2: Tropospheric O3 changes accompanied by declining NOx emissions in the USA and Europe in 2005–2020
Rui Zhu
Zhaojun Tang
Xiaokang Chen
Xiong Liu
Tropospheric nitrogen dioxide (NO2) concentrations have declined dramatically over the United States (USA) and Europe in recent decades. Here we investigate the changes in surface and free-tropospheric O3 accompanied by NO2 changes over the USA and Europe in 2005–2020 by assimilating the Ozone Monitoring Instrument (OMI) and U.S. Air Quality System (AQS) and European AirBase network O3 observations. The assimilated O3 concentrations demonstrate good agreement with O3 observations. Surface O3 concentrations are 41.4, 39.5, and 39.5 ppb (parts per billion; USA) and 35.3, 32.0, and 31.6 ppb (Europe) and tropospheric O3 columns are 35.5, 37.0, and 36.8 DU (USA) and 32.8, 35.3, and 36.4 DU (Europe) in the simulations, assimilations, and observations, respectively. We find overestimated summertime surface O3 concentrations over the USA and Europe, which resulted in a surface O3 maximum in July–August in the simulations, which is in contrast to April in the observations. Furthermore, our analysis exhibits limited changes in surface O3 concentrations; i.e., they decreased by −6 % over the USA and increased by 1.5 % over Europe in 2005–2020. The surface observation-based assimilations suggest insignificant changes in tropospheric O3 columns, namely −3.0 % (USA) and 1.5 % (Europe) in 2005–2020. While the OMI-based assimilations exhibit larger decreases in tropospheric O3 columns, with −12.0 % (USA) and −15.0 % (Europe) in 2005–2020, the decreases mainly occurred in 2010–2014, corresponding to the reported slower decline in free-tropospheric NO2 since 2010. Our analysis thus suggests that there are limited impacts of the decline in local emissions on tropospheric O3 over the USA and Europe and advises more efforts to evaluate the possible contributions of natural sources and transport. The discrepancy in assimilated tropospheric O3 columns further indicates the possible uncertainties in the derived tropospheric O3 changes.
- Article
(16223 KB) - Full-text XML
- Companion paper
-
Supplement
(3393 KB) - BibTeX
- EndNote


The successful emission regulations employed in the United States (USA) and Europe (Crippa et al., 2016; US EPA, 2023a) have led to dramatic decreases in anthropogenic NOx emissions (Di et al., 2020; Macdonald et al., 2021; Jiang et al., 2022). As an important air pollutant, tropospheric ozone (O3) is produced when volatile organic compounds (VOCs) are photochemically oxidized in the presence of nitrogen oxides (NOx). As a major precursor of tropospheric O3, decreases in surface nitrogen dioxide (NO2) concentrations, driven by declining NOx emissions, have led to marked decreases in surface O3 concentrations over the USA and Europe in recent decades. For example, Chen et al. (2021) found a decrease in surface O3 concentrations from approximately 60 to 45 ppb (parts per billion) over the USA in 1990–2019, Seltzer et al. (2020) showed a decreasing trend of surface O3 by approximately 0.8 ppb yr−1 over the USA in 2000–2015, and Yan et al. (2018) found a decreasing trend of surface O3 concentrations by approximately 0.32 over Europe in 1995–2014.
While NOx emissions are declining, the shift in the NOx sources from power generation to industrial and transportation sectors has led to diminishing effects on NOx emission controls (Jiang et al., 2022). Furthermore, recent studies have demonstrated a slowdown in the tropospheric NO2 column decline with respect to surface NO2 concentrations over the USA since approximately 2010 (Jiang et al., 2018; Laughner and Cohen, 2019; Qu et al., 2021). Jiang et al. (2022) further indicated a slowdown of the decline in tropospheric NO2 columns with respect to surface NO2 concentrations over both the USA and Europe. Unlike surface O3, which is strongly affected by local emissions, free-tropospheric O3 is more susceptible to the influences of free-tropospheric sources and sinks, long-range transport, and stratospheric intrusion (Jiang et al., 2015; Xue et al., 2021; Trickl et al., 2020). The different trends in surface and free-tropospheric NO2 may thus result in different changes in surface and free-tropospheric O3 over the USA and Europe.
A single O3 tracer mode (tagged O3) of the Goddard Earth Observing System with Chemistry (GEOS-Chem) model was developed in Part 1 (Zhu et al., 2023) and was combined with Ozone Monitoring Instrument (OMI) and surface O3 observations in China in 2015–2020 via a sequential Kalman filter (KF) assimilation system (Tang et al., 2022; Han et al., 2022). The rapid O3 assimilation capability, with approximately 91 %–94 % reduction in the computational cost (Zhu et al., 2023), provides a new opportunity to extend atmospheric O3 observations and mitigate the influence of uncertainties in physical and chemical processes (Li et al., 2019; Chen et al., 2022) and emission inventories (Zheng et al., 2017; Jiang et al., 2022). As Part 2 of this work, we assimilate the OMI and U.S. Air Quality System (AQS) and the European AirBase network O3 observations in this paper to constrain tropospheric O3 in the USA and Europe in 2005–2020 with a 0.5∘ × 0.625∘ horizontal resolution. A comparative analysis by assimilating satellite and surface O3 observations is useful for a better characterization of O3 changes in the surface and free troposphere. Furthermore, this analysis helps evaluate the long-term performance of the GEOS-Chem model in simulating tropospheric O3 and can provide new insights into tropospheric O3 changes accompanied by the reported changes in tropospheric NO2.
This paper is organized as follows: in Sect. 2, we provide descriptions for the AQS, AirBase, and OMI O3 observations and the single O3 tracer simulation and assimilation system used in this work. We refer the reader to Part 1 (Zhu et al., 2023) for more details about the atmospheric O3 observations and the development and performance of the single O3 tracer assimilation system. Tropospheric O3 changes in the USA and Europe in 2005–2020 are demonstrated in Sect. 3 by assimilating atmospheric O3 observations. As shown in Fig. 1, five regions (i.e., the Great Lakes (no. 1), northeastern USA (no. 2), West Coast (no. 3), middle USA (no. 4), and southeastern USA (no. 5)) are defined within the USA domain, and five regions (i.e., Britain (no. 1), central Europe (no. 2), western Europe (no. 3), the Iberian Peninsula (no. 4), and the Apennine Peninsula (no. 5)) are defined within the European domain, based on anthropogenic NOx emissions in 2015. Region nos. 1–3 (USA) and region nos. 1–2 (Europe) are defined as highly polluted (HP) regions by excluding grids with low and medium anthropogenic NOx emissions. Tropospheric O3 changes over these regions will be discussed to investigate the possible regional discrepancies in surface and free-tropospheric O3 changes associated with different local pollution levels. Our conclusions follow in Sect. 4.
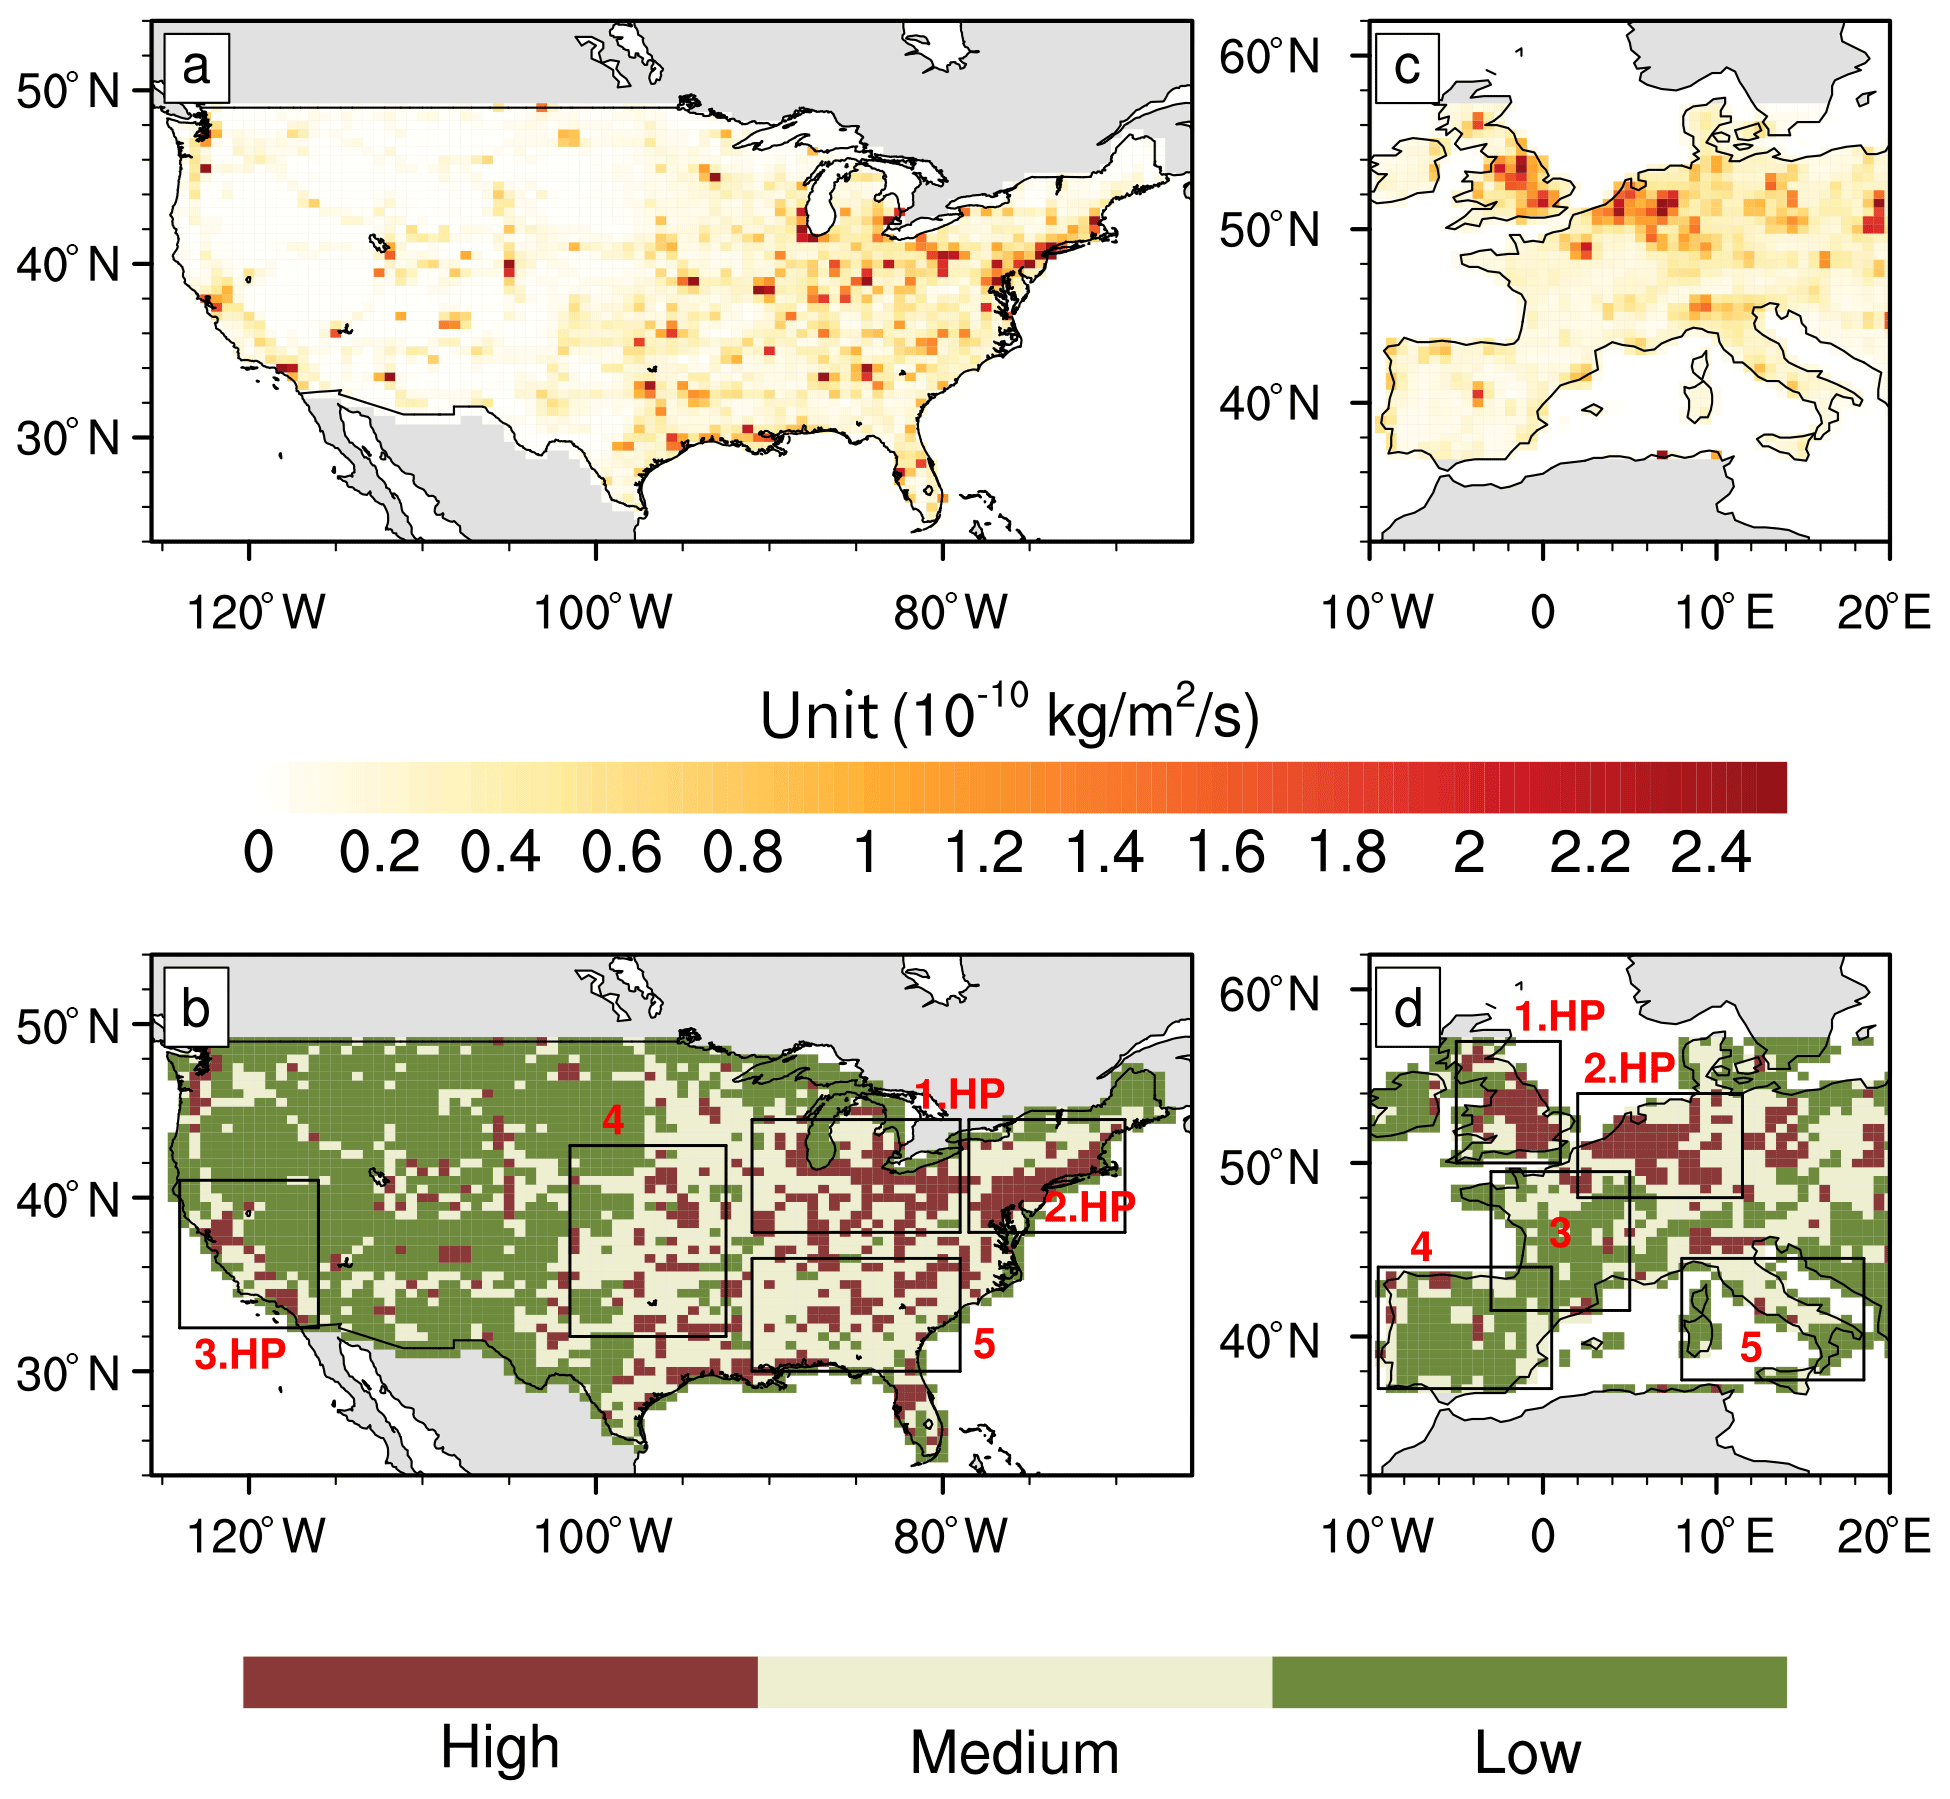
Figure 1(a) Anthropogenic NOx emissions over the USA in 2015. (b) Region definitions for the Great Lakes (no. 1), northeastern USA (no. 2), West Coast (no. 3), middle USA (no. 4), and southeastern USA (no. 5). Region nos. 1–3 are defined as highly polluted (HP) regions by excluding grids with low and medium anthropogenic NOx emissions. (c) Anthropogenic NOx emissions over Europe in 2015. (d) Region definitions for Britain (no. 1), central Europe (no. 2), western Europe (no. 3), the Iberian Peninsula (no. 4) and the Apennine Peninsula (no. 5). Region nos. 1 and 2 are defined as highly polluted (HP) regions by excluding grids with low and medium anthropogenic NOx emissions. The different colors (red, gray, and green) represent grids with high (highest 15 %), medium (15 %–50 %), and low (lowest 50 %) anthropogenic NOx emissions.
2.1 OMI and surface O3 measurements
The OMI O3 profile retrieval product (PROFOZ v0.9.3, level 2; Liu et al., 2010; Huang et al., 2017) from the Smithsonian Astrophysical Observatory (SAO) was assimilated in this work. The OMI instrument provides measurements with global coverage, with backscattered sunlight in the ultraviolet visible range from 270 to 500 nm (UV1 270–310 nm; UV2 310–365 nm; visible 350–500 nm), with a spatial resolution of 13 × 24 km (nadir view). Following Huang et al. (2017), the following filters are applied: (1) nearly clear-sky scenes with an effective cloud fraction <0.3; (2) solar zenith angles (SZAs) <75∘; and (3) fitting root mean square (rms; ratio of fitting residuals to assumed measurement error) <2.0. Starting in 2009, anomalies were found in OMI data and diagnosed as having attenuated measured radiances in certain cross-track positions. This instrument degradation has been referred to as the “row anomaly”. To enhance the quality and stability of data, only across-track positions between 4 and 11 (within 30 positions in the UV1 channels) are used in our analysis. This treatment is similar to the production of row-isolated data by using across-track positions between 3 and 18 (within 60 positions in the UV2 channels) in the OMI–Microwave Limb Sounder (MLS) O3 data (Ziemke et al., 2019; Wang et al., 2022).
We use in situ hourly surface O3 measurements from the U.S. AQS and European Environment Agency AirBase networks. The AQS and AirBase networks collect ambient air pollution data from monitoring stations located in urban, suburban, and rural areas. To ensure the long-term stability of the observation record, we only considered stations with at least 14 years of observation records in 2005–2020. Observations provided by the AQS and AirBase stations have been widely used in previous studies to investigate the sources and variabilities in the surface O3 pollution (Shen et al., 2015; Boleti et al., 2020; He et al., 2022).
2.2 Single O3 tracer simulation and assimilation system
The GEOS-Chem chemical transport model (http://www.geos-chem.org, last access: 22 August 2023, version 12.8.1) is driven by the assimilated meteorological data of the Modern-Era Retrospective Analysis for Research and Applications, Version 2 (MERRA-2). The GEOS-Chem full chemistry simulation includes fully coupled O3–NOx–VOC–halogen–aerosol chemistry. Our analysis is conducted on a nested horizontal resolution of 0.5∘ × 0.625∘ over the USA and Europe, with chemical boundary conditions archived every 3 h from global simulations with 4∘ × 5∘ resolution. Emissions are computed by the Harmonized Emissions Component (HEMCO) software. Global default anthropogenic emissions are from the CEDS (Community Emissions Data System; Hoesly et al., 2018). Regional emissions are replaced by MEIC (Multi-resolution Emission Inventory for China) in China, MIX in other regions of Asia (Li et al., 2017) and National Emissions Inventory (NEI) 2011 in the USA. Open-fire emissions are from the Global Fire Emissions Database, Version 4 (GFED4; van der Werf et al., 2010).
Following Jiang et al. (2022), the total anthropogenic NOx and VOC emissions in the GEOS-Chem model are scaled with the corresponding bottom-up inventories (MEIC for China, NEI2014 for the USA, and ECLIPSE for Europe) so that the modeled surface nitrogen dioxide (NO2) and VOC concentrations in the a priori simulations are identical to those found in Jiang et al. (2022) in 2005–2018. The total anthropogenic NOx and VOC emissions in 2019–2020 in China, the USA, and Europe are further scaled based on linear projections. The total anthropogenic NOx emissions in the a priori simulations declined by 53 % (USA) and 50 % (Europe) in 2005–2020. The total anthropogenic VOC emissions in the a priori simulations declined by 19 % (USA) and 33 % (Europe) in 2005–2020. We refer the reader to Jiang et al. (2022) for the details of the model configuration and performance, particularly the modeled trends of surface and tropospheric column NO2 in 2005–2018.
A new single O3 tracer mode (tagged O3) was developed in Part 1 (Zhu et al., 2023) by reading the archived production (PO3) and loss (LO3) of O3 provided by the full chemistry simulation. The major advantage of the single O3 tracer mode is a dramatic reduction in the computational cost by approximately 91 %–94 % (Zhu et al., 2023). Figures S1 and S2 in the Supplement show the surface maximum daily 8 h average (MDA8) O3 (annual and seasonal averages) over the USA and Europe in 2005–2020 from the full chemistry and single O3 tracer simulations (i.e., the a priori simulations in this work), respectively. We find good spatial (Figs. S1 and S2) and temporal (Fig. S3) consistencies in surface MDA8 O3 between the full chemistry and single O3 tracer simulations over the USA and Europe in 2005–2020. The computational costs (hours of wall time for a 1-year simulation) are 160.7 and 9.4 h within the nested USA domain (0.5∘ × 0.625∘) and 103.4 and 6 h within the nested European domain (0.5∘ × 0.625∘) in the full chemistry and single O3 tracer mode, respectively.
The low computational costs of the single O3 tracer mode allow us to perform O3 assimilations more efficiently. The sequential KF was conducted to assimilate AQS, AirBase, and OMI O3 observations to produce the a posteriori O3 concentrations. As a brief description of the assimilation algorithm, the forward model (M) predicts the O3 concentration (xat) at time t as follows:
The optimized O3 concentrations can be expressed as follows:
where yt is the observation (i.e., OMI or surface O3 observations), and Kt represents the operation operator that projects the O3 concentrations from the model space to the observation space. Gt is the KF gain matrix, which can be described as follows:
where Sat and Sϵ are the model and observation covariances, respectively. The modeled tropospheric O3 profiles in the OMI-based assimilation processes are convolved by using the OMI retrieval averaging kernels. The mixing of O3 precursors in the planetary boundary layer is considered with a simplified planetary boundary layer parameterization in surface observation-based assimilations. We refer the reader to Part 1 (Zhu et al., 2023) for more details about the development and performance of the single O3 tracer assimilation system by assimilating satellite and surface O3 observations.
3.1 Surface O3 by assimilating surface O3 observations
Figures 2a–e and 3a–e show the annual and seasonal averages of surface MDA8 O3 observations from U.S. AQS and European AirBase stations in 2005–2020. Figures 2k–o and 3k–o further show the annual and seasonal averages of the a posteriori O3 concentrations by assimilating AQS or AirBase O3 observations. As shown in Figs. 4 and 5, the assimilated O3 concentrations (blue lines) show good agreements with surface O3 observations (red lines). The mean surface MDA8 O3 values in 2005–2020 are 41.4, 39.5, and 39.5 ppb (USA); 40.0, 37.7, and 38.2 ppb (Great Lakes); 38.1, 36.4, and 37.4 ppb (northeastern USA); 41.6, 41.2, and 41.0 ppb (West Coast); 42.2, 40.4, and 39.7 ppb (middle USA); and 44.4, 40.3, and 39.9 ppb (southeastern USA) in the a priori simulations, a posteriori simulations, and AQS observations, respectively. The mean surface MDA8 O3 values in 2005–2020 are 35.3, 32.0, and 31.6 ppb (Europe); 29.9, 26.0, and 24.4 ppb (Britain); 30.5, 28.2, and 28.0 ppb (central Europe); 35.9, 32.5, and 32.3 ppb (western Europe); 40.3, 35.2, and 34.2 ppb (Iberian Peninsula); and 41.8, 35.3, and 34.0 ppb (Apennine Peninsula) in the a priori simulations, a posteriori simulations, and AirBase observations, respectively.
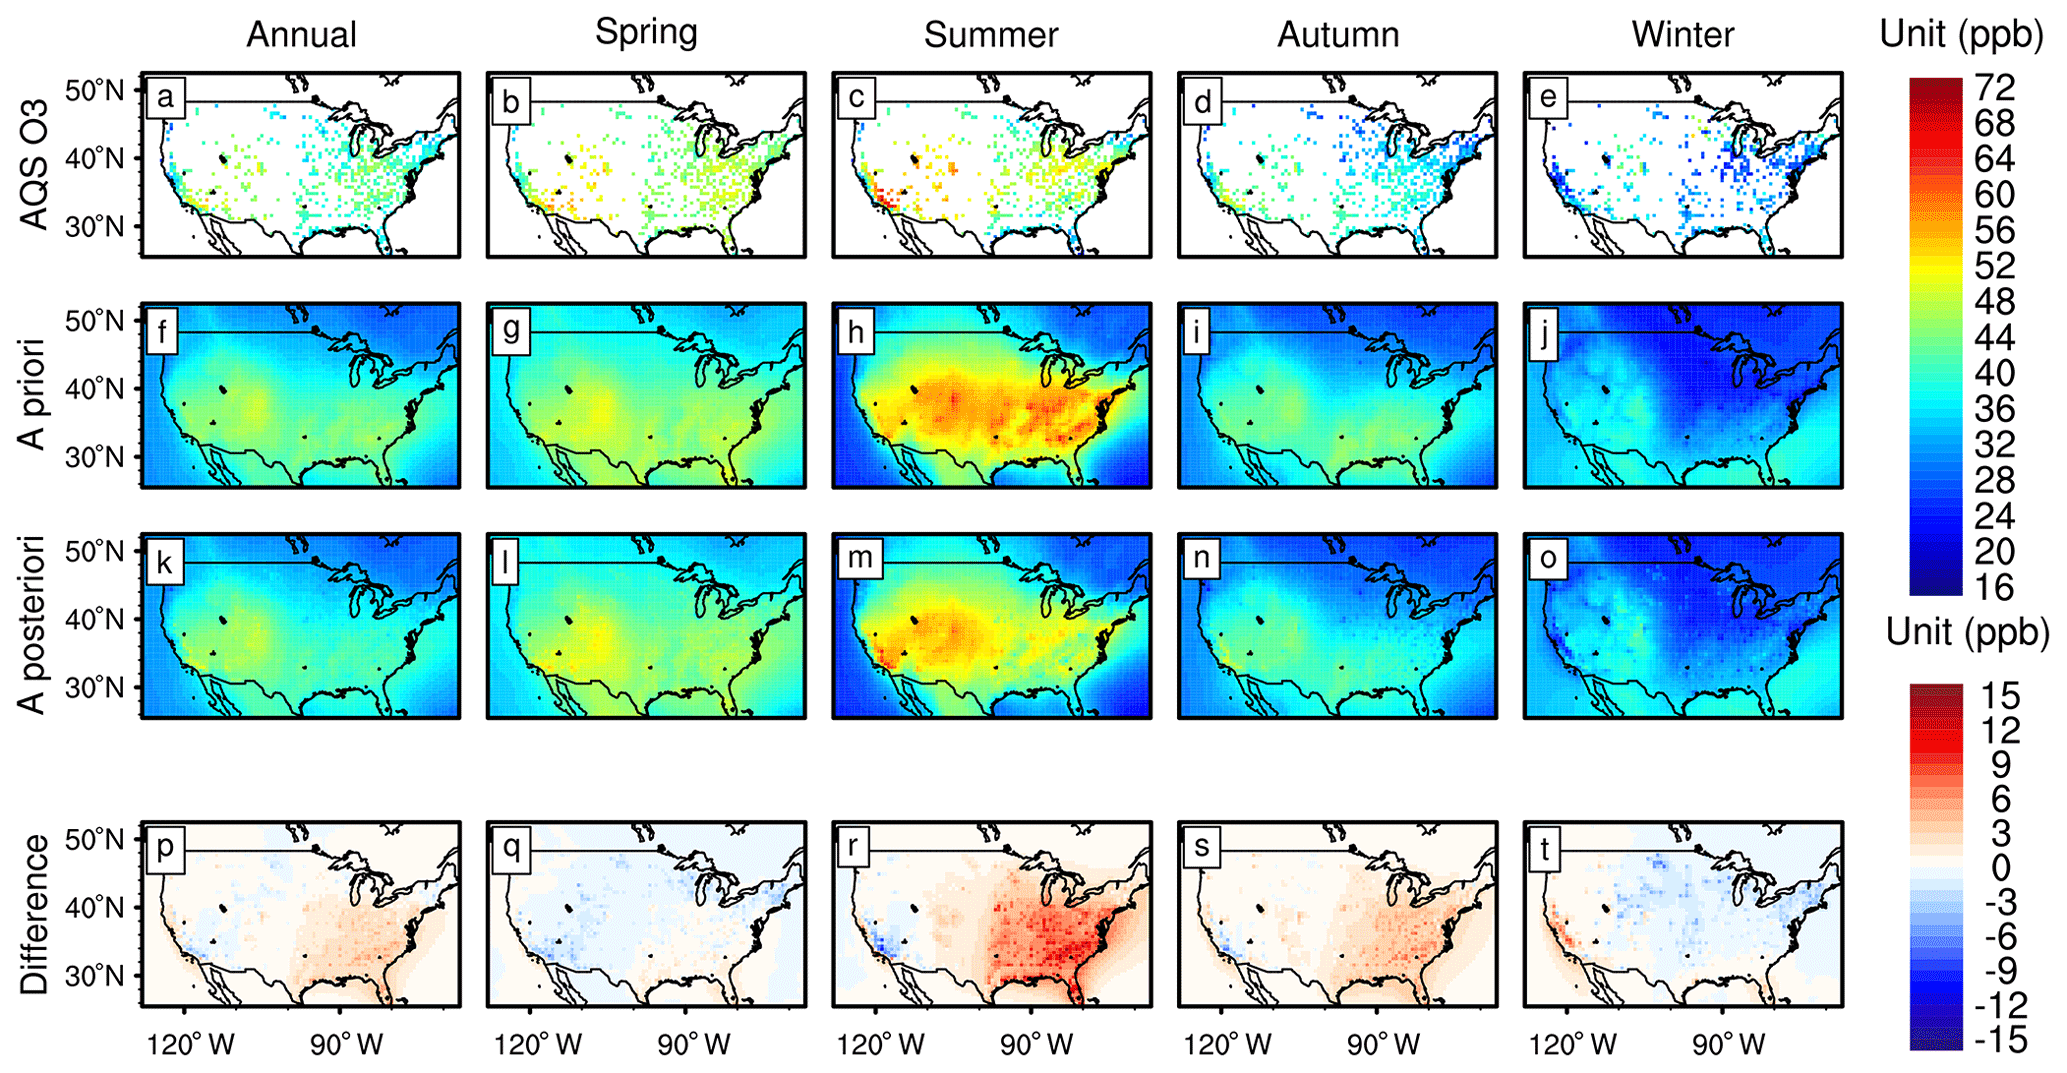
Figure 2Surface MDA8 O3 values over the USA in 2005–2020 (annual and seasonal averages) from the (a–e) AQS stations, (f–j) GEOS-Chem a priori simulation, and (k–o) GEOS-Chem a posteriori simulation by assimilating AQS O3 observations. (p–t) Bias in the a priori simulations calculated by a priori minus a posteriori O3 concentrations.
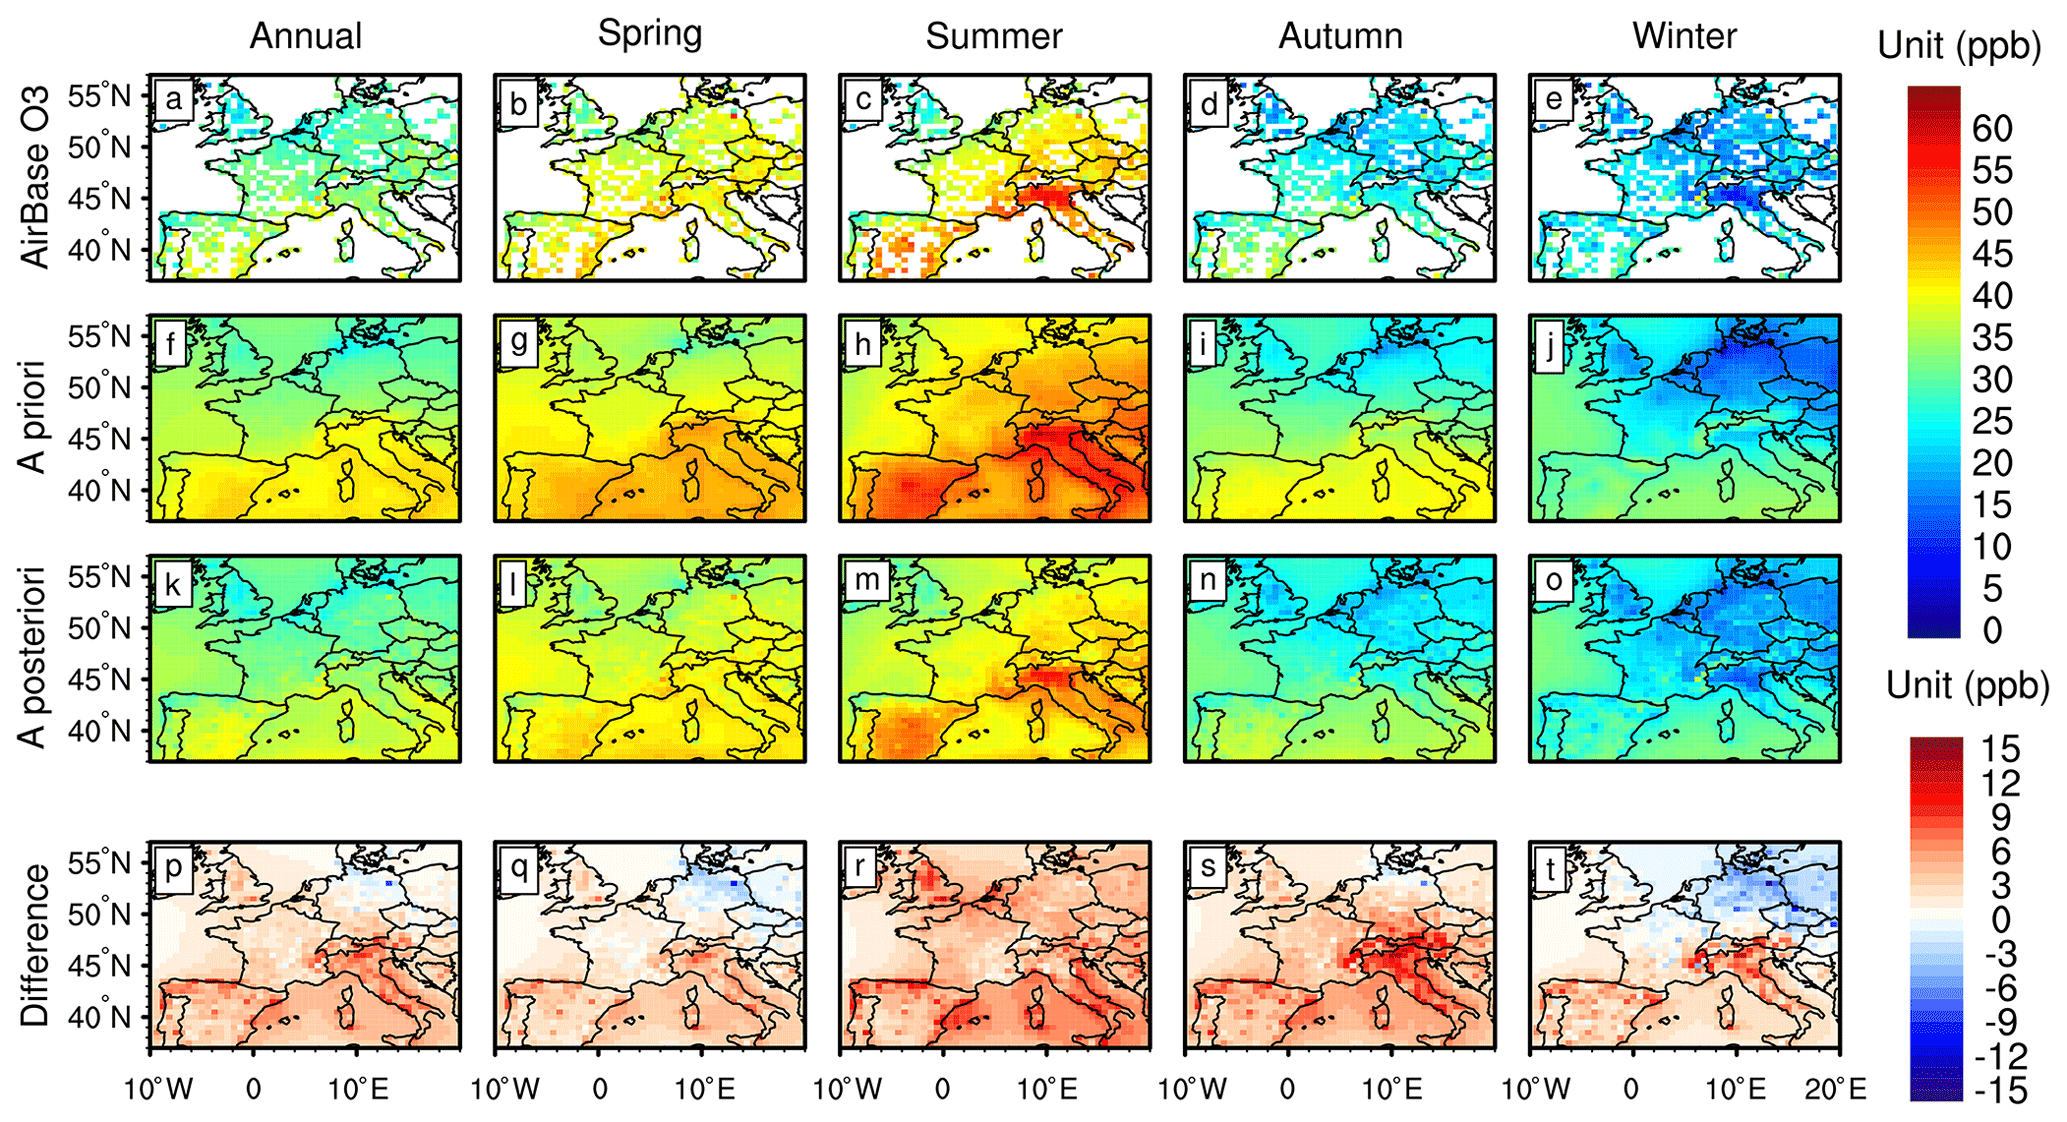
Figure 3Surface MDA8 O3 values over Europe in 2005–2020 (annual and seasonal averages) from the (a–e) AirBase stations, (f–j) GEOS-Chem a priori simulation, and (k–o) GEOS-Chem a posteriori simulation by assimilating AirBase O3 observations. (p–t) Bias in the a priori simulations calculated by a priori minus a posteriori O3 concentrations.
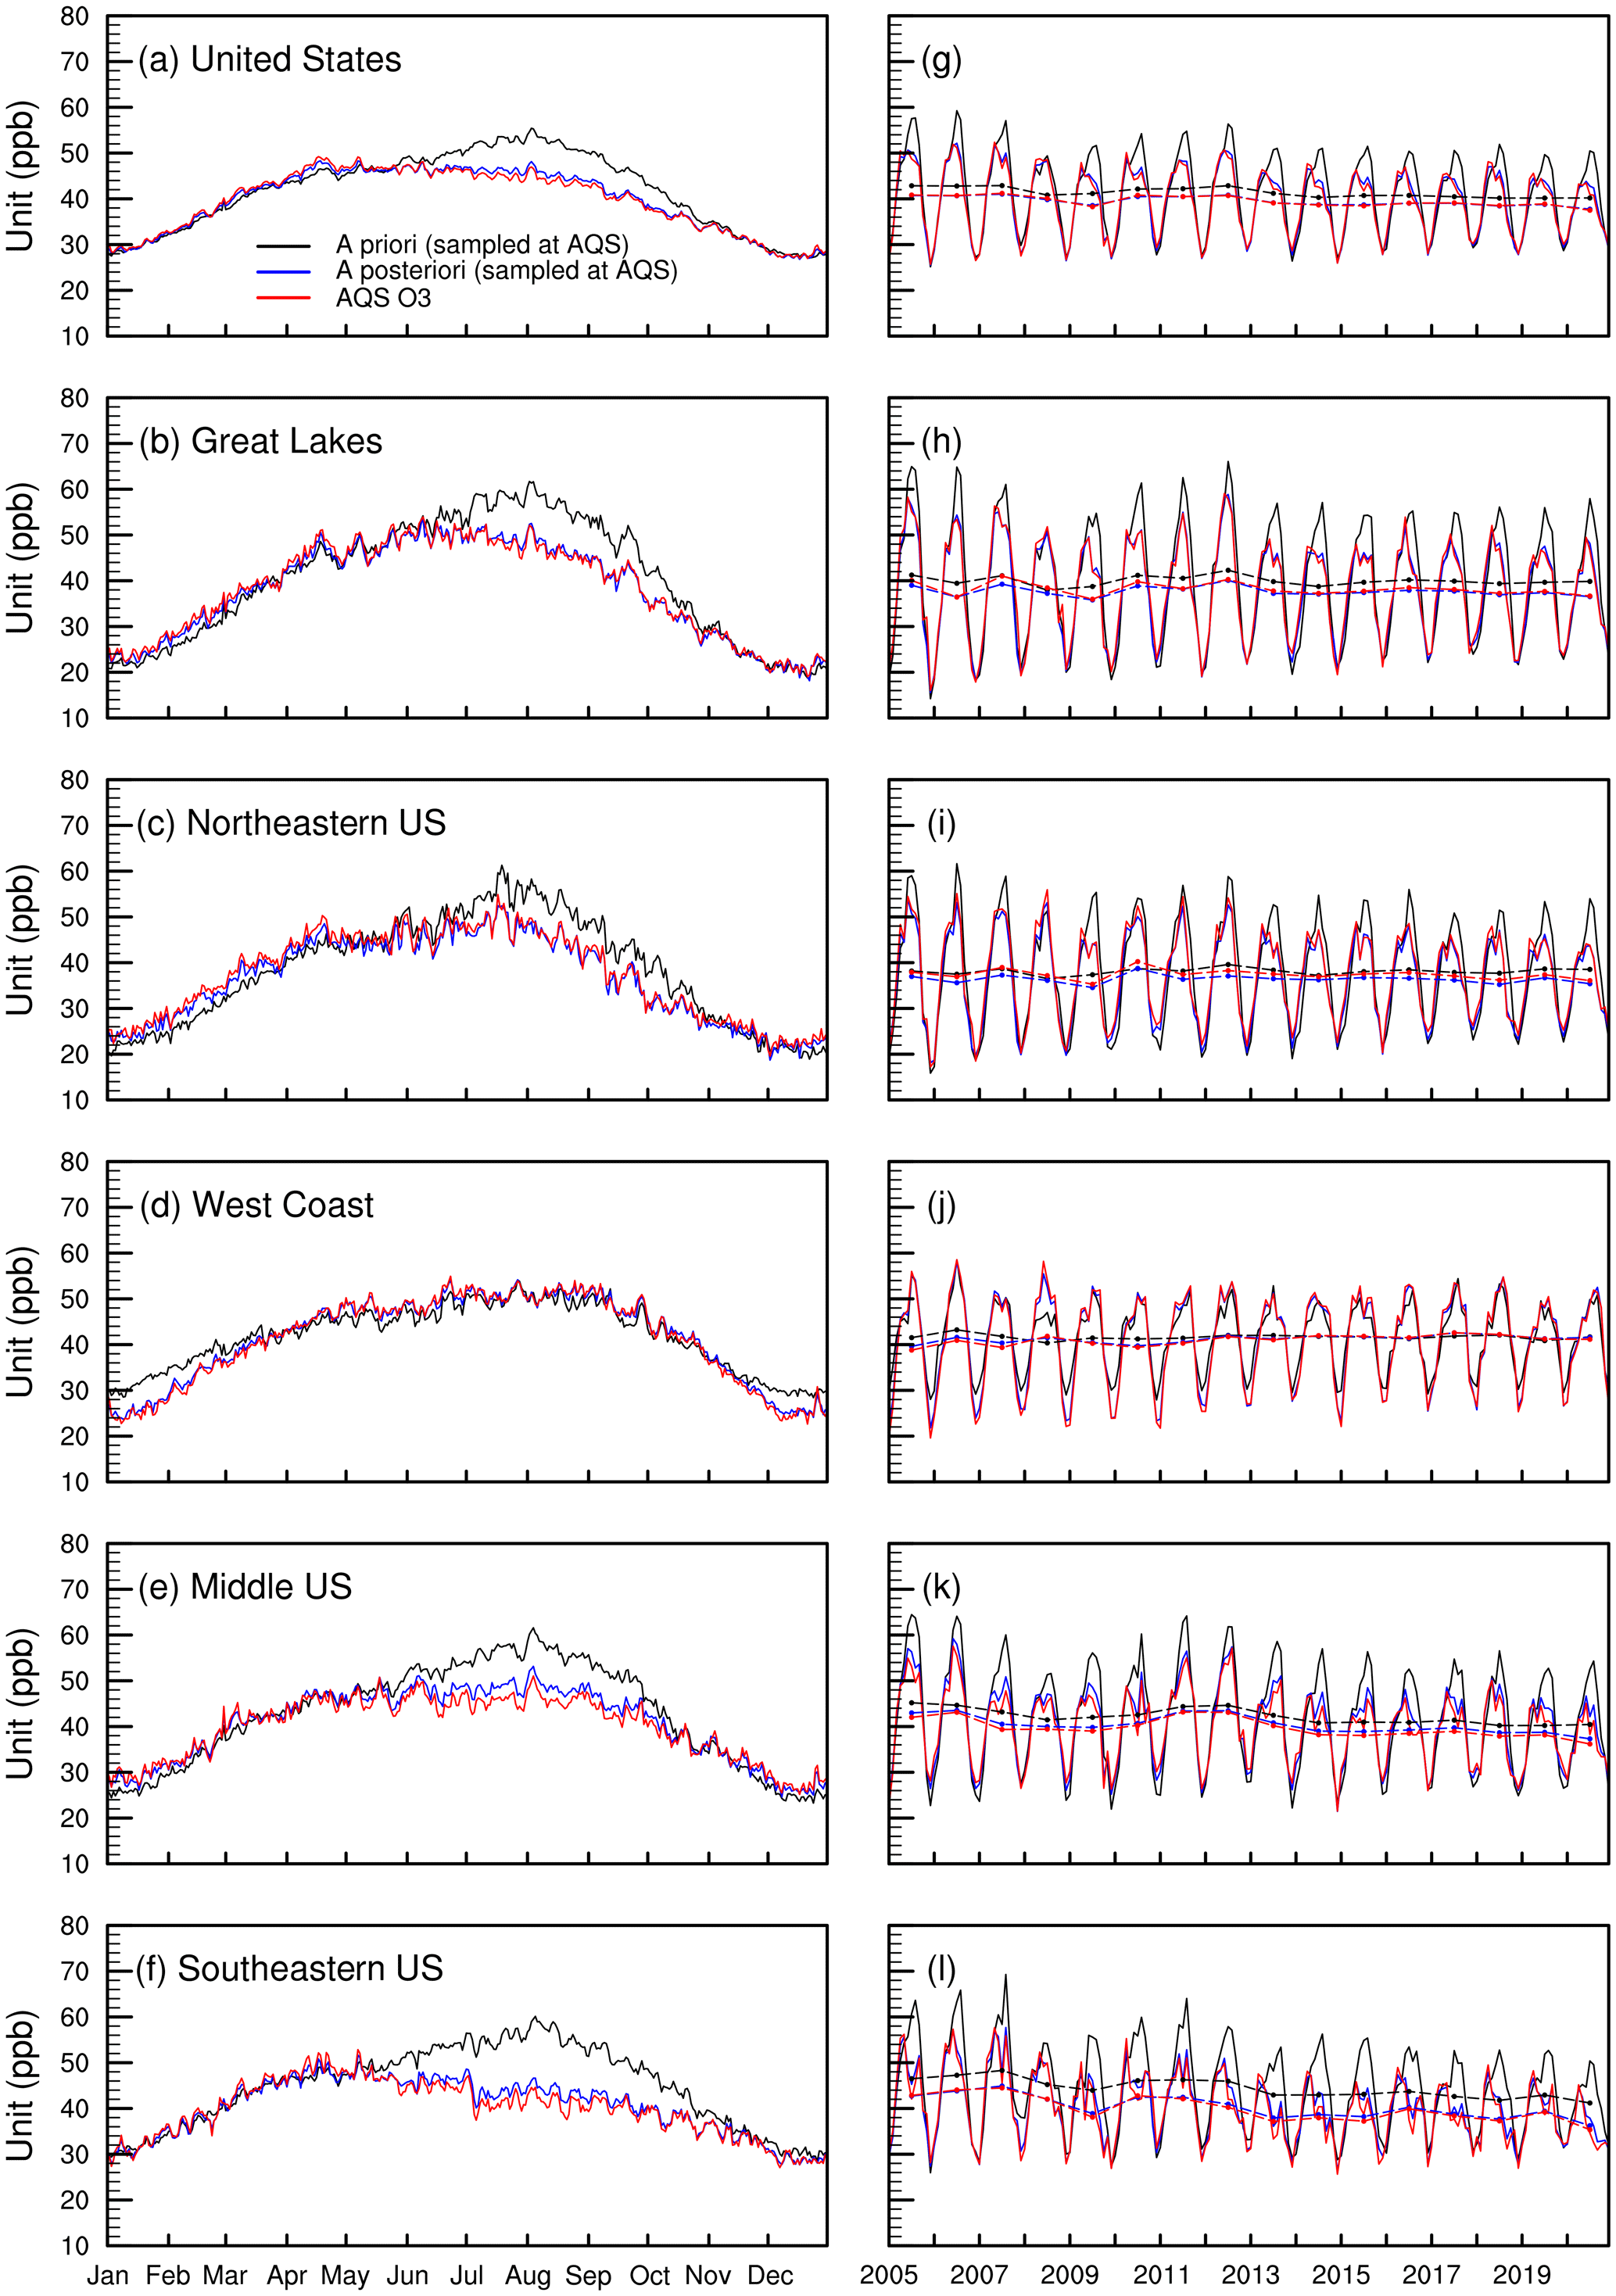
Figure 4(a–f) Daily averages of surface MDA8 O3 values over the USA in 2005–2020 from the AQS stations (red) and GEOS-Chem a priori (black) and a posteriori (blue) simulations by assimilating AQS O3 observations. (g–l) Monthly averages of MDA8 O3 values. The dashed lines in panels (g)–(l) are annual averages.
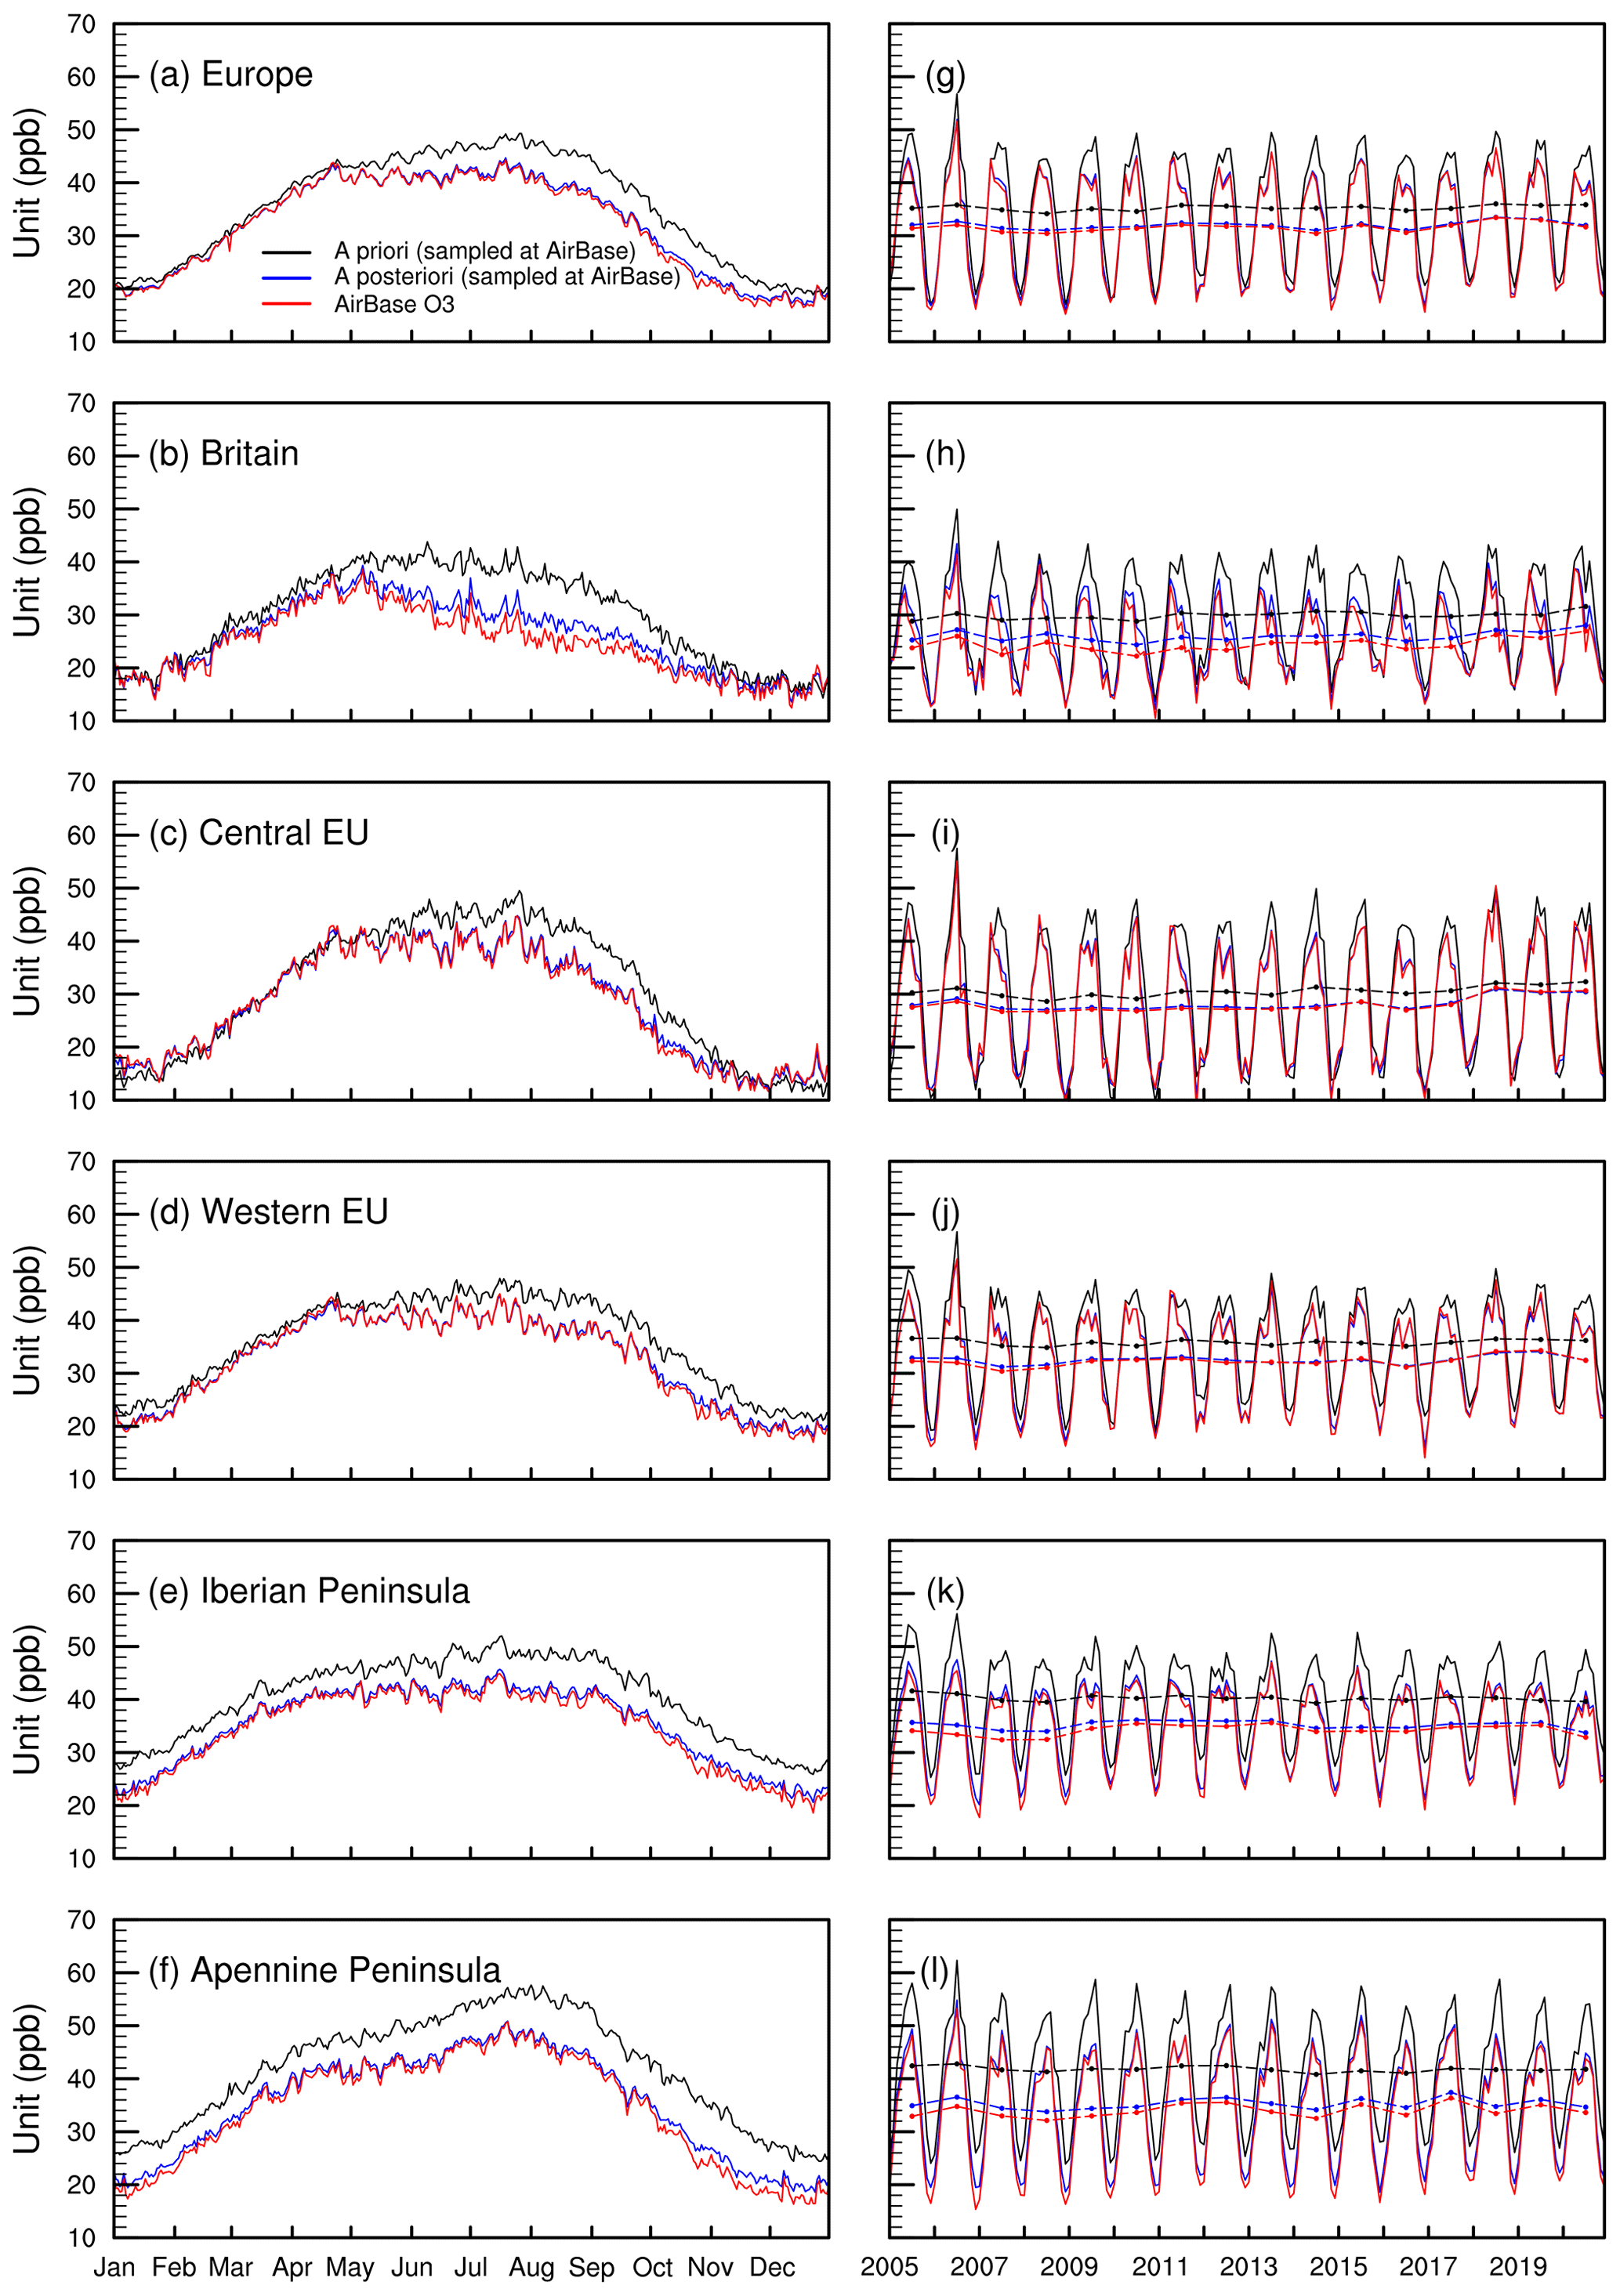
Figure 5(a–f) Daily averages of surface MDA8 O3 values over Europe in 2005–2020 from the AirBase stations (red) and GEOS-Chem a priori (black) and a posteriori (blue) simulations by assimilating AirBase O3 observations. (g–l) Monthly averages of MDA8 O3. The dashed lines in panels (g)–(l) are annual averages.
Similar to China, we find overestimated summertime surface O3 concentrations in the a priori simulations over the USA and Europe (Figs. 4 and 5). However, in contrast to the underestimated O3 decline in June–July in China (Zhu et al., 2023), the overestimated summertime O3 values over the USA and Europe are caused by overestimated increases in surface O3 values in July–August, which have led to a surface MDA8 O3 maximum in July–August in the simulations. In contrast, assimilations suggest that surface O3 is broadly at a maximum level in April over the USA and Europe (Figs. 4 and 5), although the O3 seasonality varies over different regions. We find good agreements in the surface O3 concentrations between a priori and a posteriori simulations over the USA in seasons outside of summer (Fig. 2p–t), which is in contrast to the large differences between a priori and a posteriori simulations over Europe (Fig. 3p–t in this work) and China (Zhu et al., 2023). The inaccurate surface O3 concentrations over three continents reveal possible uncertainties in model simulations, particularly with respect to the contributions from natural and anthropogenic processes; for example, the higher temperature and solar radiation can lead to high O3 concentrations in August, whereas the transport of O3 and its precursors can lead to high O3 concentrations in April (Parrish et al., 2013).
Furthermore, our analysis exhibits high surface MDA8 O3 concentrations over the West Coast (41.2 ppb) in the USA. Except for the West Coast, the assimilated surface MDA8 O3 concentrations are lower over areas with higher anthropogenic NOx emissions over the USA and Europe. For example, we found 37.7 and 36.4 ppb in the Great Lakes and northeastern USA, respectively, in contrast to 40.4 and 40.3 ppb in the middle USA and southeastern USA, respectively. Moreover, we found 26.0 and 28.2 ppb in Britain and central Europe, respectively, which is in contrast to 32.5, 35.2, and 35.3 ppb in western Europe, the Iberian Peninsula, and the Apennine Peninsula, respectively. The inverse relationships between surface O3 concentrations and local anthropogenic NOx emissions indicate the important impacts of natural sources and meteorological conditions on surface O3 pollution over the USA and Europe because of a continuous decline in anthropogenic emissions in the past few decades. This is the opposite of the higher O3 concentrations in areas with higher local anthropogenic NOx emissions in China (Zhu et al., 2023), where surface O3 pollution is strongly affected by anthropogenic emissions.
3.2 Limited changes in surface O3 concentrations
Following Jiang et al. (2022), the anthropogenic NOx and VOC emissions over the USA in 2005–2020 declined by 53 % (−5.1 % yr−1) and 19 % (−1.4 % yr−1) in our a priori simulations, which is accompanied by slightly decreasing trends in surface MDA8 O3 in the a priori simulations (Table 1a) of −0.29 (spring), −0.45 (summer), −0.07 (autumn), and 0.05 (winter) ppb yr−1, and the relative trends are −0.7 (spring) % yr−1, −0.9 (summer) % yr−1, −0.2 (autumn) % yr−1, and 0.2 (winter) % yr−1. Similarly, the anthropogenic NOx and VOC emissions over Europe in 2005–2020 declined by 50 % (−4.4 % yr−1) and 33 % (−2.7 % yr−1) in our a priori simulations, which is accompanied by a slightly increasing trend for surface MDA8 O3 in the a priori simulations (Table 2a) of −0.07 (spring), −0.07 (summer), 0.07 (autumn), and 0.24 (winter) ppb yr−1, and the relative trends are −0.2 (spring) % yr−1, −0.2 (summer) % yr−1, 0.2 (autumn) % yr−1, and 1.0 (winter) % yr−1. It is surprising to see the limited changes in surface O3 concentrations in the simulations accompanied by a dramatic decline in anthropogenic emissions.
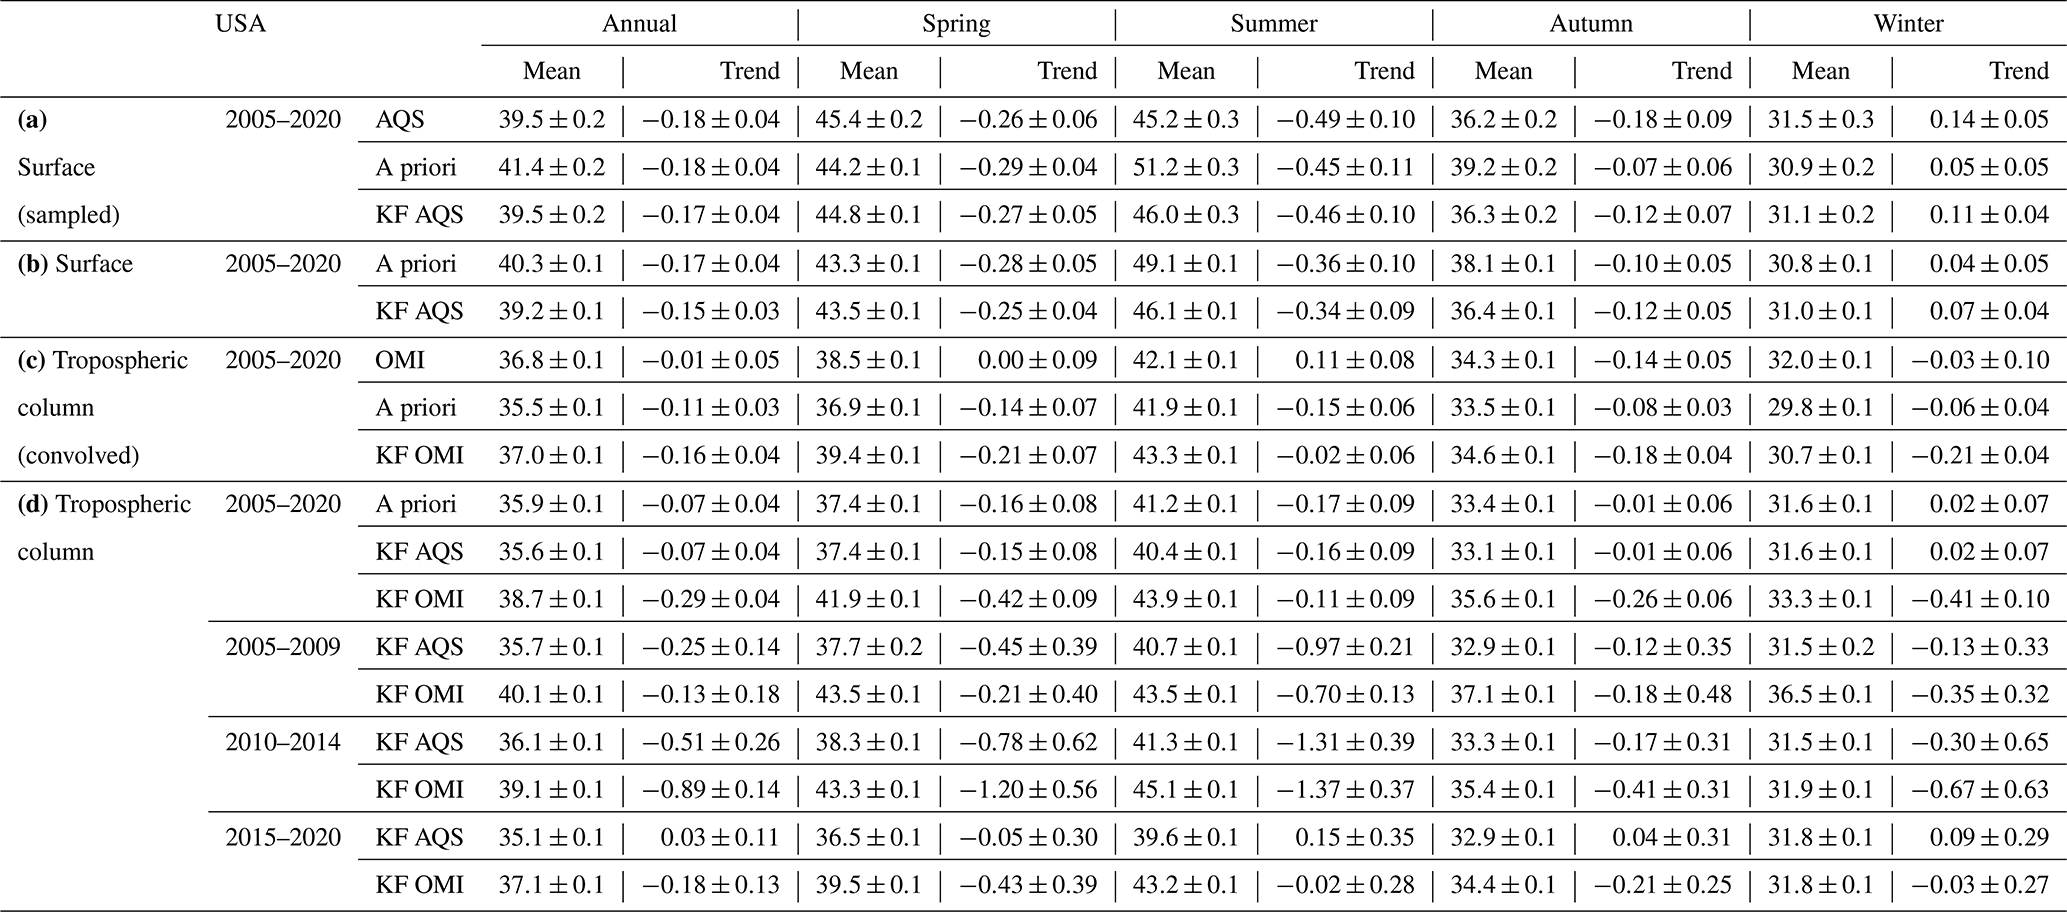
Table 1Averages (with units in ppb or DU) and trends (with units in ppb yr−1 or DU yr−1) of surface and tropospheric column O3 concentrations in 2005–2020 over the USA from observations (AQS and OMI) and a priori and a posteriori (KF) simulations. (a) The modeled surface O3 is sampled at the locations and times of AQS surface O3 observations. (b) The modeled surface O3 is averaged over the USA (land only). (c) The output O3 profiles from the a priori and a posteriori simulations are convolved with OMI O3 averaging kernels. (d) The output O3 profiles are not convolved with OMI O3 averaging kernels. The uncertainties in the averages are calculated using the bootstrapping method. The trends and uncertainties in the trends are calculated using the linear fitting of averages by using the least squares method (see details in the Supplement).
We thus further investigate the changes in surface O3 by assimilating surface O3 observations. As shown in Table 1a and Fig. 6k–o, our assimilations suggest −0.27 (spring), −0.46 (summer), −0.12 (autumn), and 0.11 (winter) ppb yr−1 changes in surface MDA8 O3 over the USA in 2005–2020, and the relative changes are −0.6 (spring) % yr−1, −1.0 (summer) % yr−1, −0.3 (autumn) % yr−1, and 0.4 (winter) % yr−1. Similarly, as shown in Table 2a and Fig. 7k–o, our assimilations suggest −0.04 (spring), −0.03 (summer), 0.09 (autumn), and 0.19 (winter) ppb yr−1 changes in surface MDA8 O3 over Europe in 2005–2020, and the relative changes are −0.1 (spring) % yr−1, −0.1 (summer) % yr−1, 0.3 (autumn) % yr−1, and 0.9 (winter) % yr−1. In contrast to the underestimated increasing trends in surface O3 concentrations in the a priori simulations in China (Zhu et al., 2023), we find broadly consistent trends between simulations and assimilations over the USA and Europe, which confirms the limited changes in surface O3 concentrations over the USA and Europe.
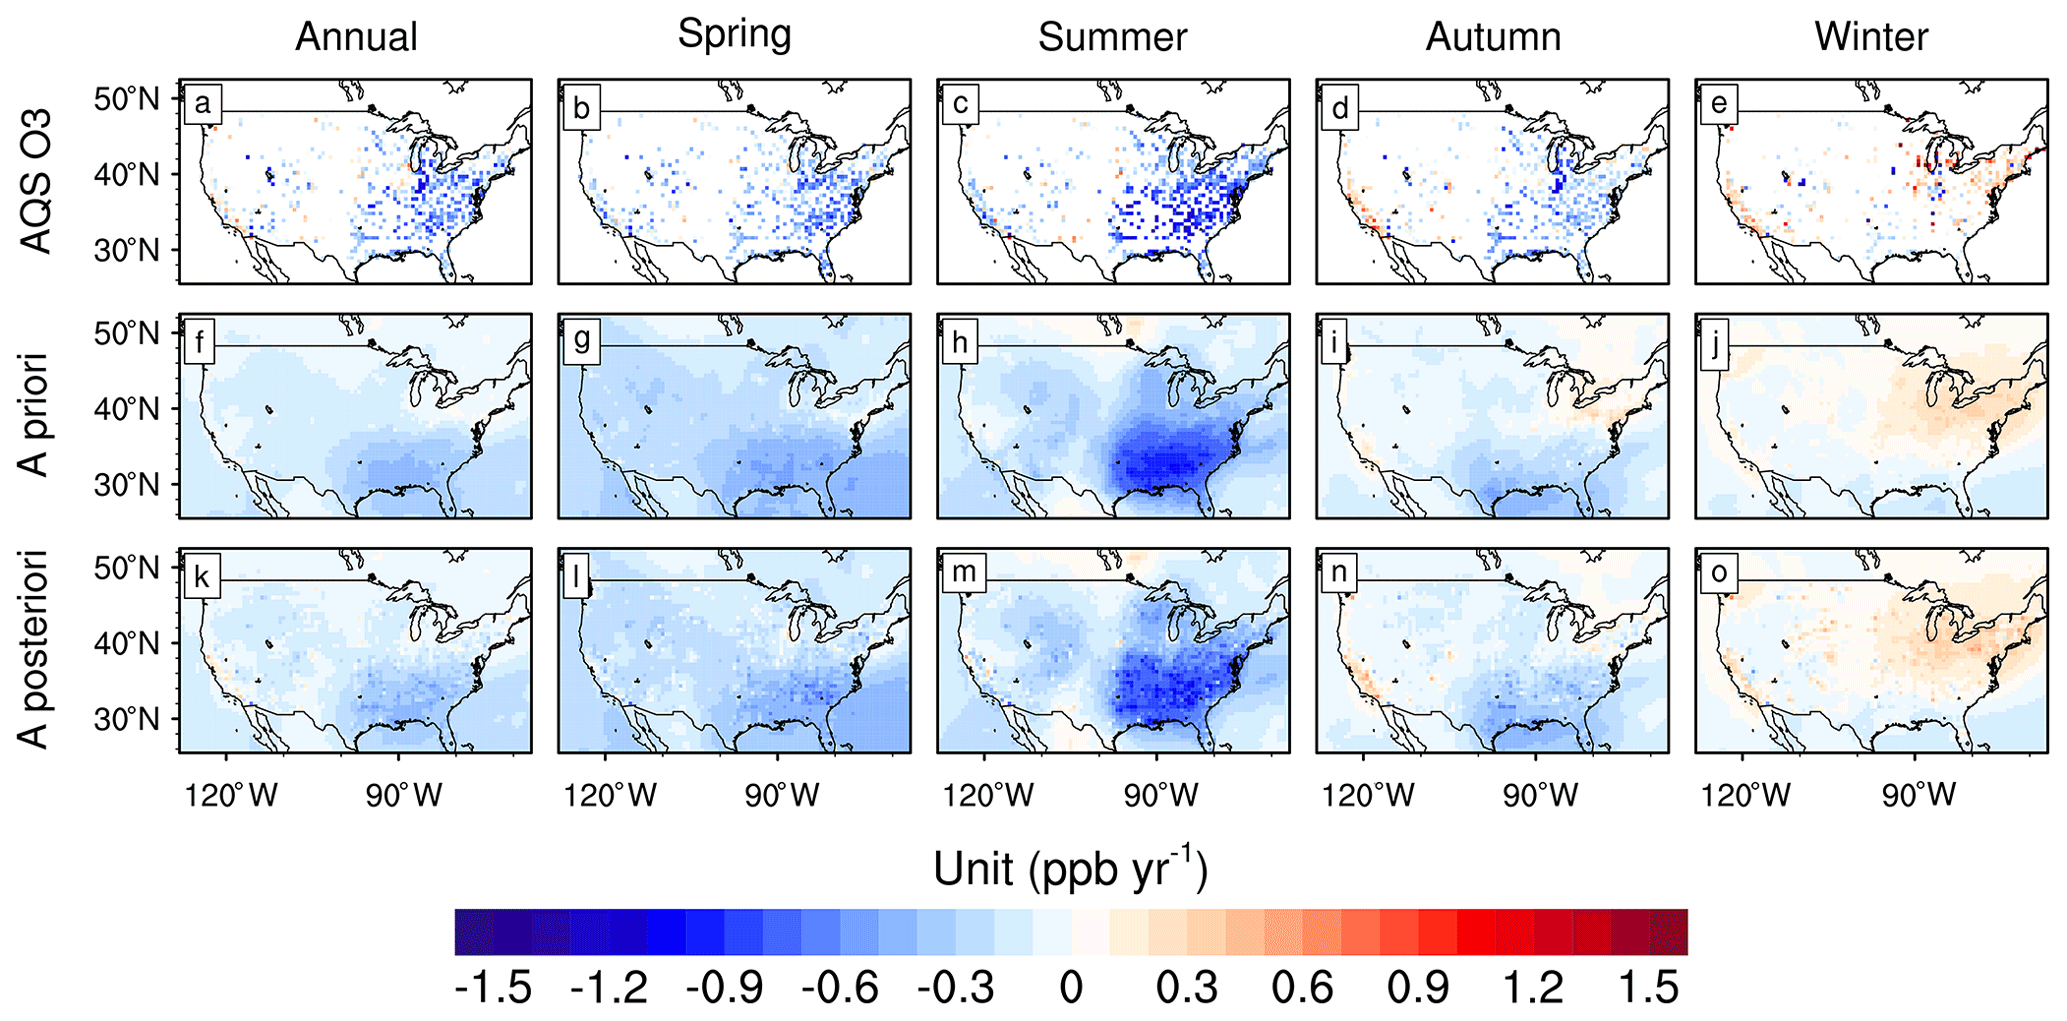
Figure 6Trends of surface MDA8 O3 over the USA in 2005–2020 (annual and seasonal averages) from the (a–e) AQS stations, (f–j) GEOS-Chem a priori simulation, and (k–o) GEOS-Chem a posteriori simulation by assimilating AQS O3 observations.
Table 2Averages (with units in ppb or DU) and trends (with units in ppb yr−1 or DU yr−1) of surface and tropospheric column O3 concentrations in 2005–2020 over Europe from observations (AirBase and OMI) and a priori and a posteriori (KF) simulations. (a) The modeled surface O3 are sampled at the locations and times of AirBase surface O3 observations. (b) The modeled surface O3 are averaged over Europe (land only). (c) The output O3 profiles from the a priori and a posteriori simulations are convolved with OMI O3 averaging kernels. (d) The output O3 profiles are not convolved with OMI O3 averaging kernels.
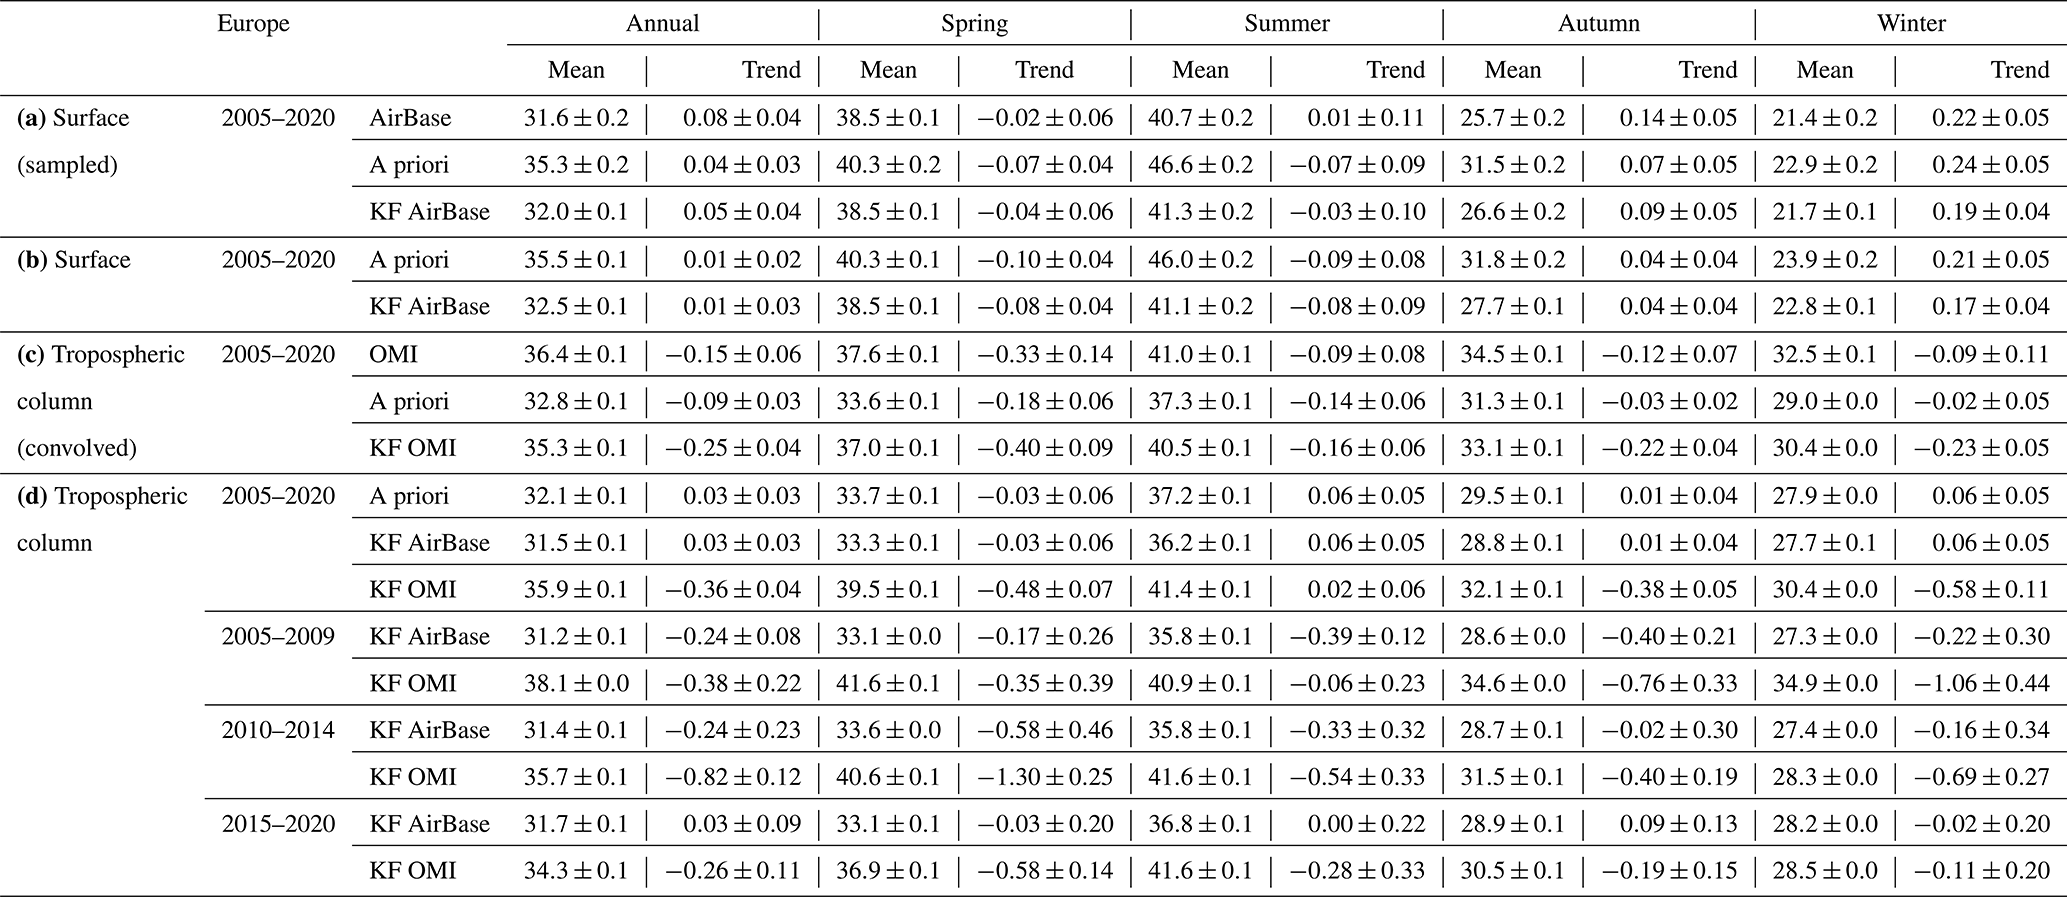
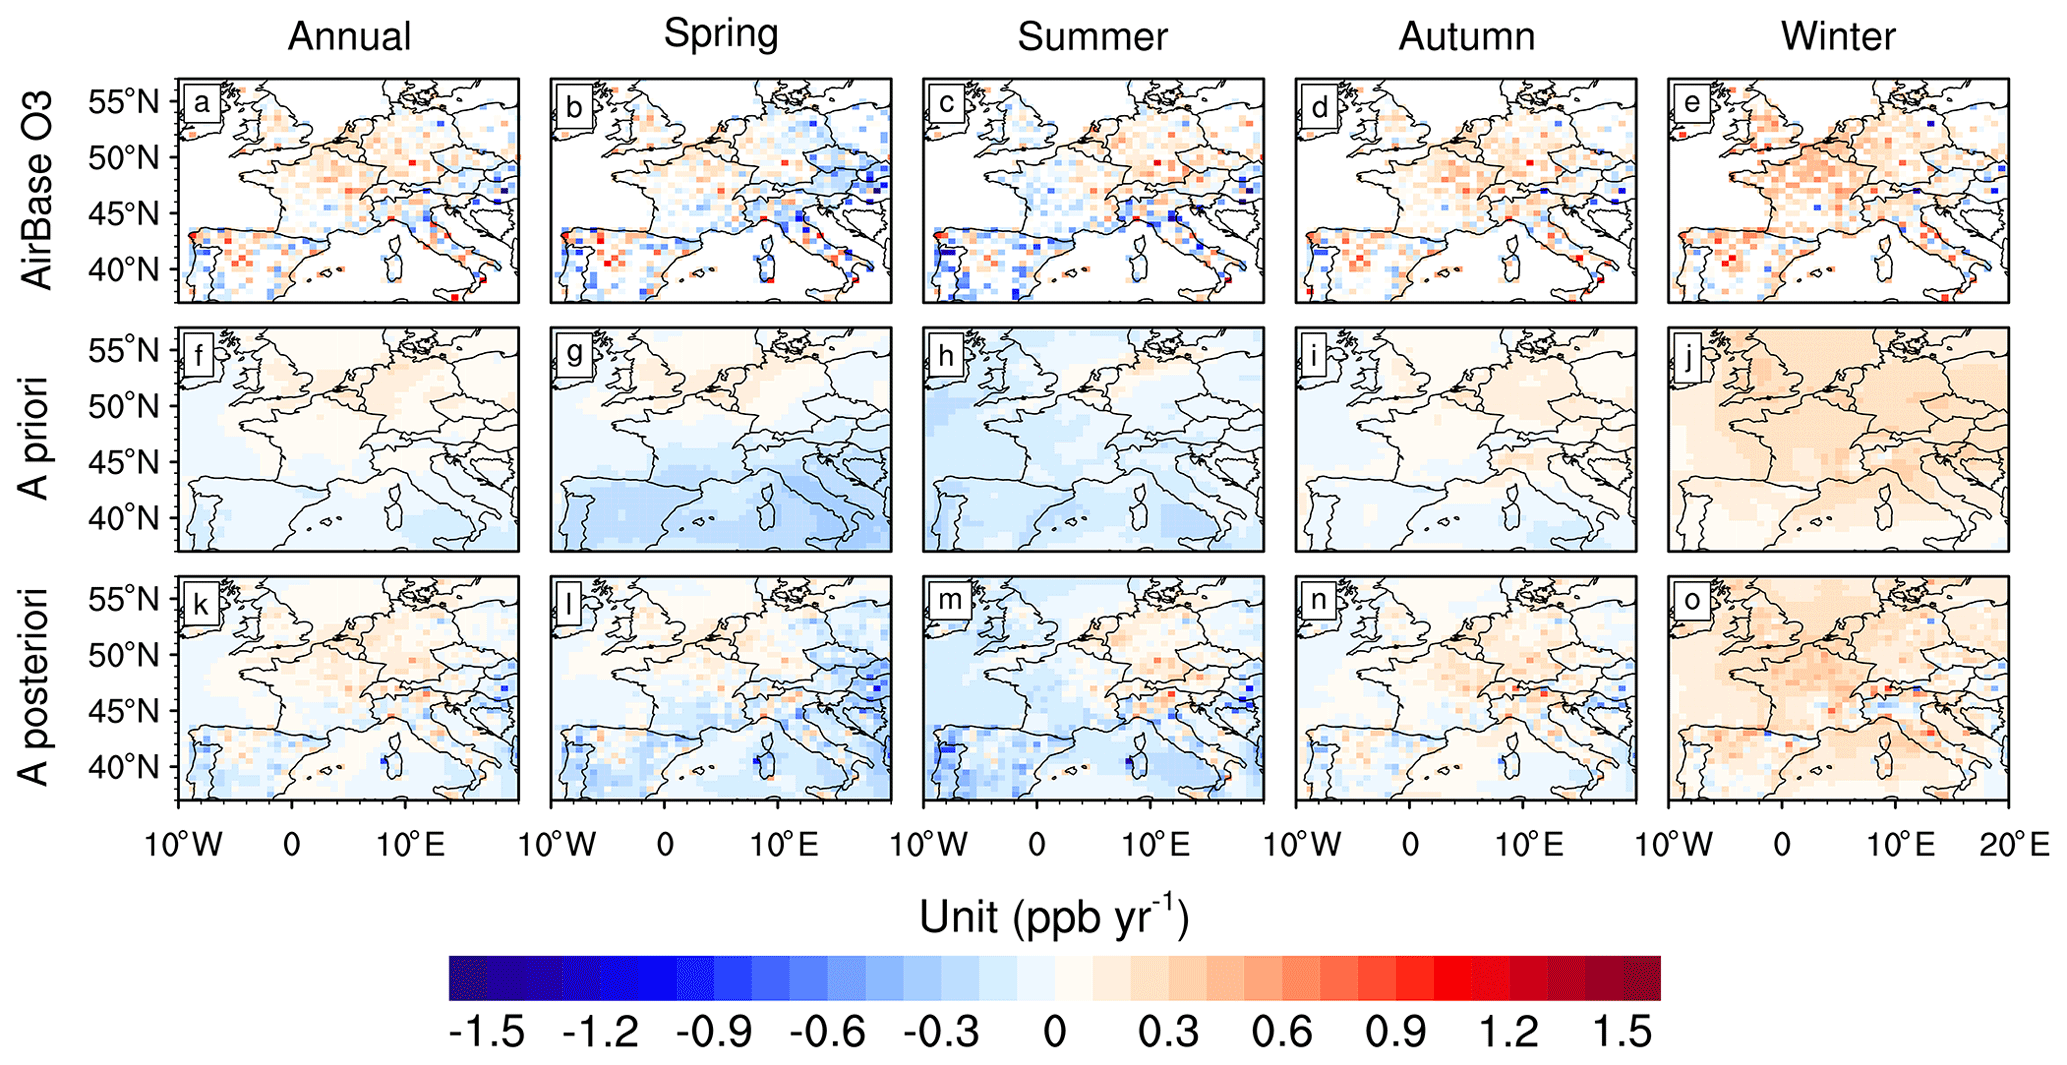
Figure 7Trends of surface MDA8 O3 over Europe in 2005–2020 (annual and seasonal averages) from the (a–e) AirBase stations, (f–j) GEOS-Chem a priori simulation, and (k–o) GEOS-Chem a posteriori simulation by assimilating AirBase O3 observations.
The changes in surface O3 concentrations have marked regional and seasonal discrepancies. As shown in Tables S1–S5 in the Supplement, our assimilations demonstrate stronger increasing trends in surface O3 concentrations in 2005–2020 in the winter (0.39 ppb yr−1 or 1.5 % yr−1) over the Great Lakes; in the winter (0.36 ppb yr−1 or 1.4 % yr−1) over the northeastern USA; and in the autumn (0.34 ppb yr−1 or 0.8 % yr−1) and winter (0.29 ppb yr−1 or 1.0 % yr−1) over the West Coast. We also find decreasing trends in surface O3 concentrations in 2005–2020 in the summer over the Great Lakes (−0.51 ppb yr−1 or −1.0 % yr−1); northeastern USA (−0.52 ppb yr−1 or −1.1 % yr−1); middle USA (−0.61 ppb yr−1 or −1.3 % yr−1); and southeastern USA (−0.87 ppb yr−1 or −1.9 % yr−1). The areas with higher anthropogenic NOx emissions such as the Great Lakes and northeastern USA demonstrate lower surface O3 concentrations and are accompanied by stronger increasing trends in the winter and weaker decreasing trends in the summer.
Tables S6–S10 further show the details of tropospheric O3 changes in Europe. Our assimilations demonstrate stronger increasing trends in surface O3 concentrations in 2005–2020 in the winter over Britain (0.28 ppb yr−1 or 1.5 % yr−1); central Europe (0.26 ppb yr−1 or 1.5 % yr−1); western Europe (0.25 ppb yr−1 or 1.1 % yr−1); the Iberian Peninsula (0.17 ppb yr−1 or 0.6 % yr−1); and the Apennine Peninsula (0.18 ppb yr−1 or 0.8 % yr−1). We also find decreasing trends in surface O3 concentrations in 2005–2020 in the summer (−0.07 ppb yr−1 or −0.2 % yr−1) over Britain; in the summer (−0.10 ppb yr−1 or −0.2 % yr−1) over the western Europe; in the summer (−0.20 ppb yr−1 or −0.5 % yr−1) over the Iberian Peninsula; and in the spring (−0.09 ppb yr−1 or −0.2 % yr−1) over the Apennine Peninsula. Similar to the USA, areas with higher anthropogenic NOx emissions such as Britain and central Europe demonstrate lower surface O3 concentrations and are accompanied by stronger increasing trends in the winter and weaker decreasing trends in the summer.
Furthermore, Zhu et al. (2023) demonstrated a large discrepancy in the trends of assimilated surface O3 between urban (i.e., areas with air quality stations) and regional backgrounds in China in 2015–2020, with 3.0 % yr−1 (sampled at air quality stations) and 1.3 % yr−1 (land average). In contrast, we did not find a comparable discrepancy over the USA and Europe because the trends of assimilated surface O3 are −0.4 % yr−1 (Table 1a; sampled at AQS O3 observations) and −0.4 % yr−1 (Table 1b; land average) over the USA; and −0.2 % yr−1 (Table 2a; sampled at AirBase O3 observations) and 0.0 % yr−1 (Table 2b; land average) over Europe. The difference between China and the USA and Europe suggests more consistent changes in surface O3 between urban and regional background areas in the USA and Europe. This implies possible larger relative contributions of regional background O3 to surface O3 observations in the USA and Europe, which could be associated with the limited changes in surface O3 concentrations in 2005–2020 because the regional background O3 is less sensitive to changes in anthropogenic NOx and VOC emissions.
3.3 Tropospheric O3 columns by assimilating OMI O3 observations
Figures S4a–e and S5a–e show the annual and seasonal averages of tropospheric OMI O3 columns in 2005–2020 over the USA and Europe, respectively. Figures S4k–o and S5k–o further show the annual and seasonal averages of the a posteriori tropospheric O3 columns by assimilating OMI O3 observations. The assimilated tropospheric O3 columns show good agreement with OMI O3 observations because the mean tropospheric O3 columns over the USA in 2005–2020 (Table 1c) are 35.5 DU in the a priori simulations and 37.0 and 36.8 DU in the a posteriori simulations and OMI observations, respectively. The mean tropospheric O3 columns over Europe in 2005–2020 (Table 2c) are 32.8 DU in the a priori simulations and 35.3 and 36.4 DU in the a posteriori simulations and OMI observations, respectively. However, there are small deviations in the trends between assimilations and OMI observations. As shown in Figs. S6–S7, the trends in the tropospheric O3 columns over the USA in 2005–2020 (Table 1c) are −0.11 DU yr−1 in the a priori simulations and −0.16 and −0.01 DU yr−1 in the a posteriori simulations and OMI observations, respectively. The trends in the tropospheric O3 columns over Europe in 2005–2020 (Table 2c) are −0.09 DU yr−1 in the a priori simulations and −0.25 and −0.15 DU yr−1 in the a posteriori simulations and OMI observations, respectively. These deviations are associated with the adjustments to regional O3 boundary conditions in the nested assimilations by assimilating global OMI O3 observations, thus reflecting the different changes in OMI O3 between the continents of North America and Europe and global backgrounds. For example, the mean tropospheric O3 columns over the USA in 2005 are 36.5 DU in OMI observations and 35.9 and 37.5 DU in the assimilations by reading a priori and adjusted O3 boundary conditions, respectively. The mean tropospheric O3 columns over Europe in 2005 are 37.5 DU in OMI observations and 34.6 and 36.9 DU in the assimilations by reading a priori and adjusted O3 boundary conditions, respectively.
The annual averages of surface MDA8 O3 in the a priori simulation and assimilations are 35.3 and 32.0 ppb, with a relative difference of 10 % over Europe (Table 2a); 41.4 and 39.5 ppb, with a relative difference of 5 % over the USA (Table 1a); and 42.9 and 41.8 ppb, with a relative difference of 3 % over China (Zhu et al., 2023). In addition, the annual averages of tropospheric O3 columns in the a priori simulation and assimilations are 32.8 and 35.3 DU, with a relative difference of −7 % over Europe (Table 2c); 35.5 and 37.0 DU, with a relative difference of −4 % over the USA (Table 1c); and 37.1 and 37.9 DU, with a relative difference of −2 % over China (Zhu et al., 2023). It seems that the GEOS-Chem model has a better performance in regional averages of surface and free-tropospheric O3 concentrations in China and the USA than in Europe.
The output O3 profiles from a priori and a posteriori simulations are convolved with OMI averaging kernels in Figs. S4–S7. However, the convolution of OMI O3 averaging kernels on the output O3 profiles can affect the weights of the derived tropospheric columns to O3 at different vertical levels and thus may not accurately represent the actual tropospheric O3 columns. Figures 8 and 9 further show tropospheric O3 columns from a priori and a posteriori simulations in which the output O3 profiles are not convolved with OMI averaging kernels. The assimilated tropospheric O3 columns are 35.6 and 38.7 DU (USA); 36.8 and 40.2 DU (Great Lakes); 36.8 and 40.3 DU (northeastern USA); 38.1 and 41.9 DU (West Coast); 38.9 and 41.5 DU (middle USA); and 43.5 and 45.8 DU (southeastern USA) in 2005–2020 by assimilating AQS and OMI O3 observations, respectively. The assimilated tropospheric O3 columns are 31.5 and 35.9 DU (Europe); 29.7 and 34.7 DU (Britain); 30.4 and 34.9 DU (central Europe); 31.8 and 36.4 DU (western Europe); 33.6 and 38.1 DU (Iberian Peninsula); and 34.0 and 38.2 DU (Apennine Peninsula) in 2005–2020 by assimilating AirBase and OMI O3 observations, respectively. We find that tropospheric O3 columns obtained by assimilating surface O3 observations are lower than those obtained by assimilating OMI O3 observations. Similar to surface O3 concentrations, tropospheric O3 columns are lower over areas with higher anthropogenic NOx emissions over the USA and Europe, such as the Great Lakes, northeastern USA, Britain, and central Europe. This is opposite to the higher tropospheric O3 columns over areas with higher local anthropogenic NOx emissions in China (Zhu et al., 2023).
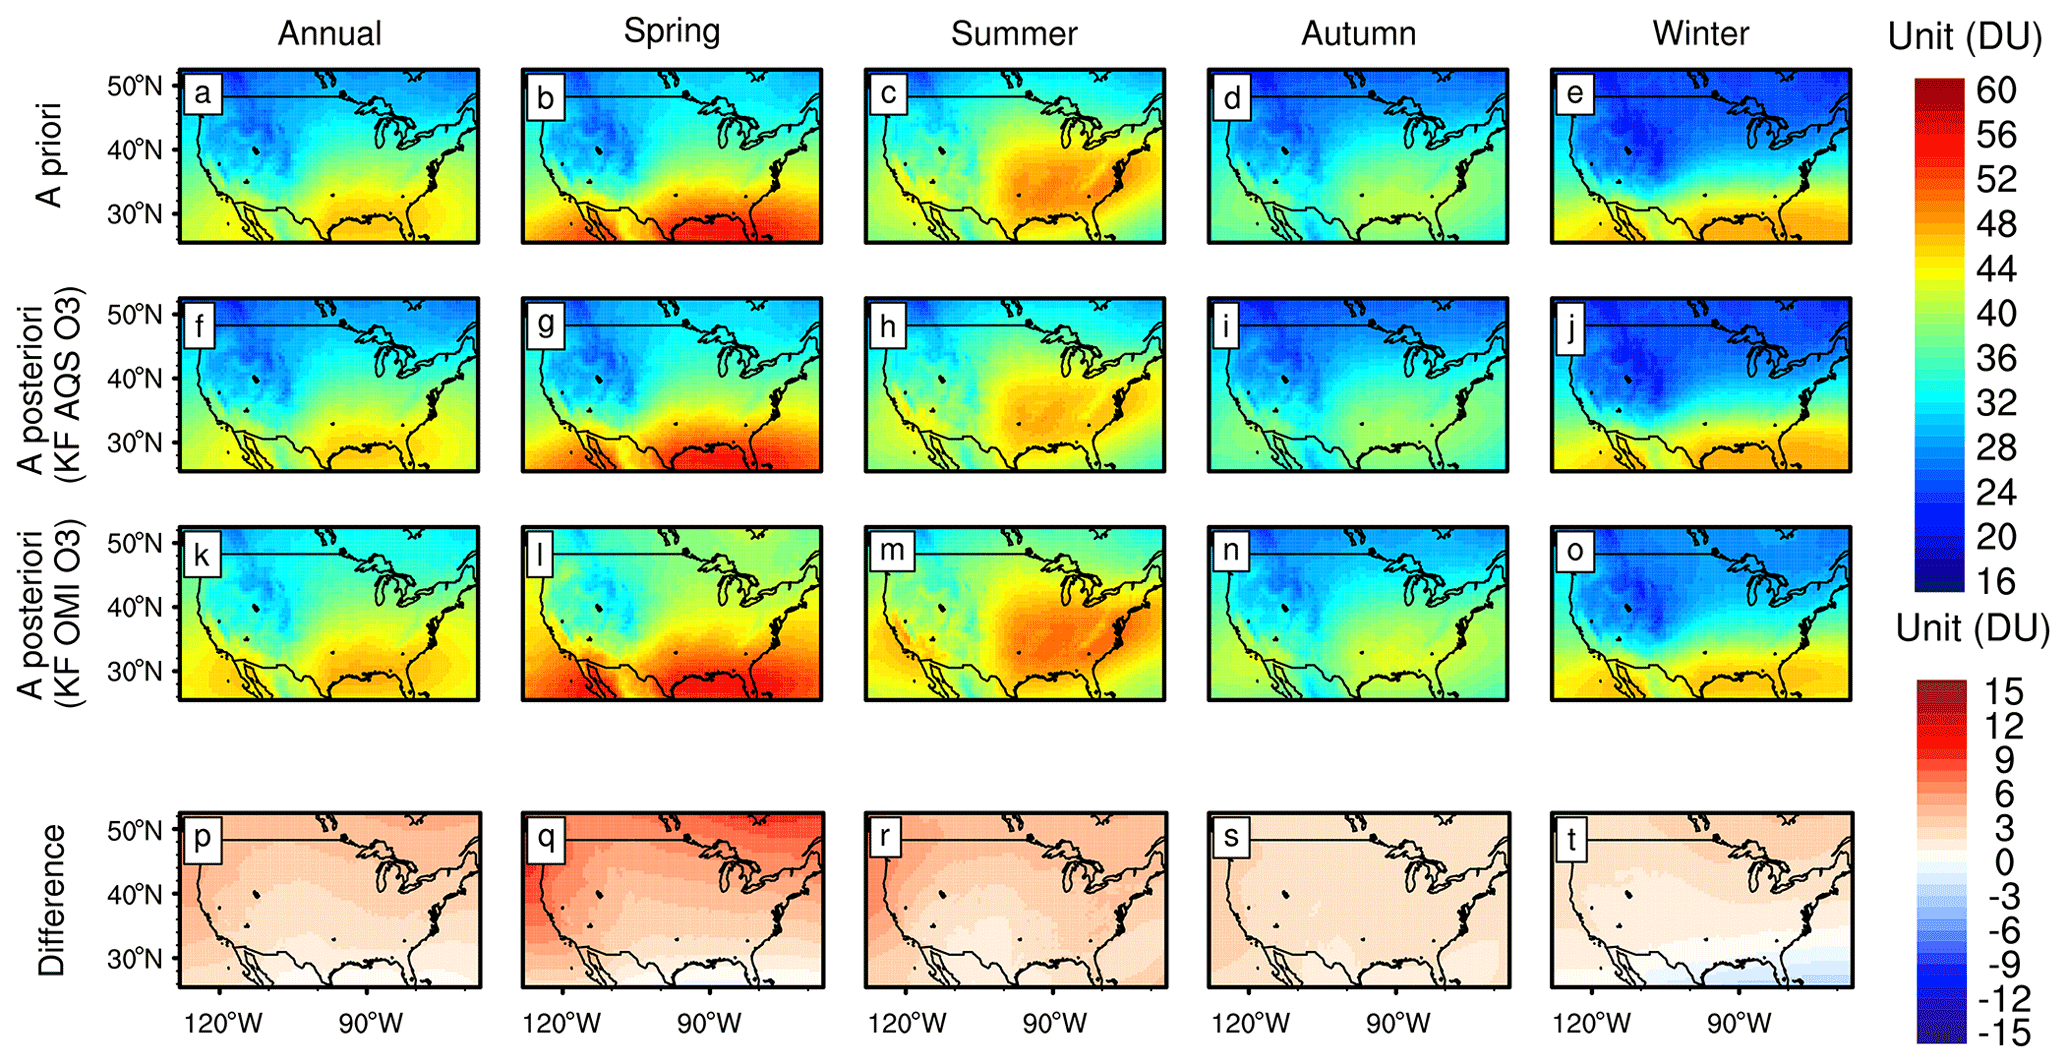
Figure 8Tropospheric O3 columns over the USA in 2005–2020 (annual and seasonal averages) from the (a–e) GEOS-Chem a priori simulation, (f–j) assimilations of AQS surface O3 observations, and (k–o) assimilations of OMI O3 observations. (p–t) Difference in tropospheric O3 columns calculated by OMI-based assimilations minus surface observation-based assimilations.
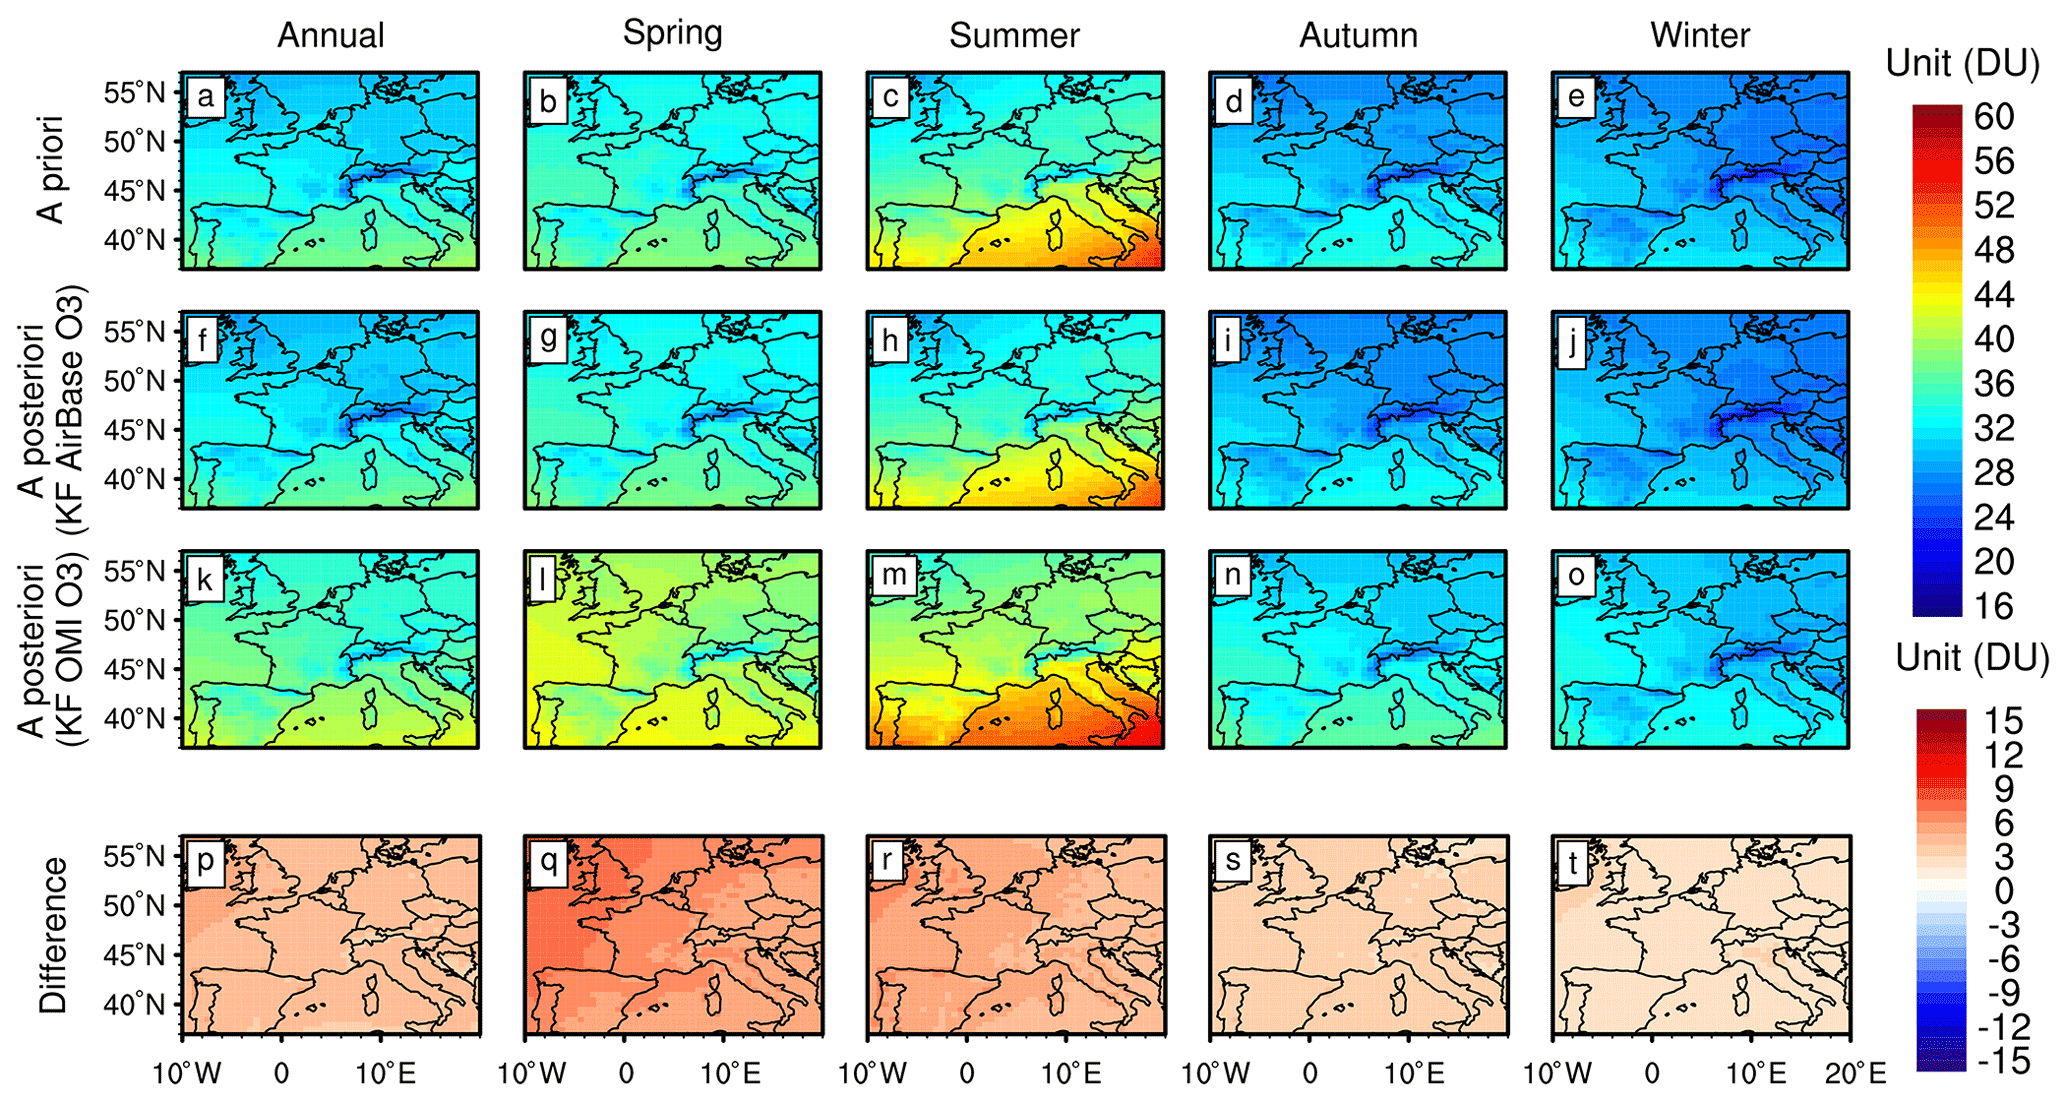
Figure 9Tropospheric O3 columns over Europe in 2005–2020 (annual and seasonal averages) from the (a–e) GEOS-Chem a priori simulation, (f–j) assimilations of AirBase surface O3 observations, and (k–o) assimilations of OMI O3 observations. (p–t) Difference in tropospheric O3 columns calculated by OMI-based assimilations minus surface observation-based assimilations.
In contrast to the surface MDA8 O3 maximum level in April in the observations (Figs. 4 and 5), the assimilated tropospheric O3 columns are broadly at maximum level in July–August over the USA and Europe (Figs. 10 and 11). The free-tropospheric O3 maximum in the summer has been reported in previous studies. For example, Wespes et al. (2018) demonstrated a free-tropospheric O3 maximum in summer over Europe by using Infrared Atmospheric Sounding Interferometer (IASI) observations; Petetin et al. (2016) exhibited a free-tropospheric O3 maximum in summer over Europe by using the values of the Measurement of Ozone and Water Vapor by Airbus In-Service Aircraft (MOZAIC). We find good agreement in the seasonality of free-tropospheric O3 between simulations and assimilations, which is in contrast to the inaccurate simulation of the seasonality of surface O3 concentrations in the simulations. More studies are needed in the future to explore the sources of this difference in model performance.
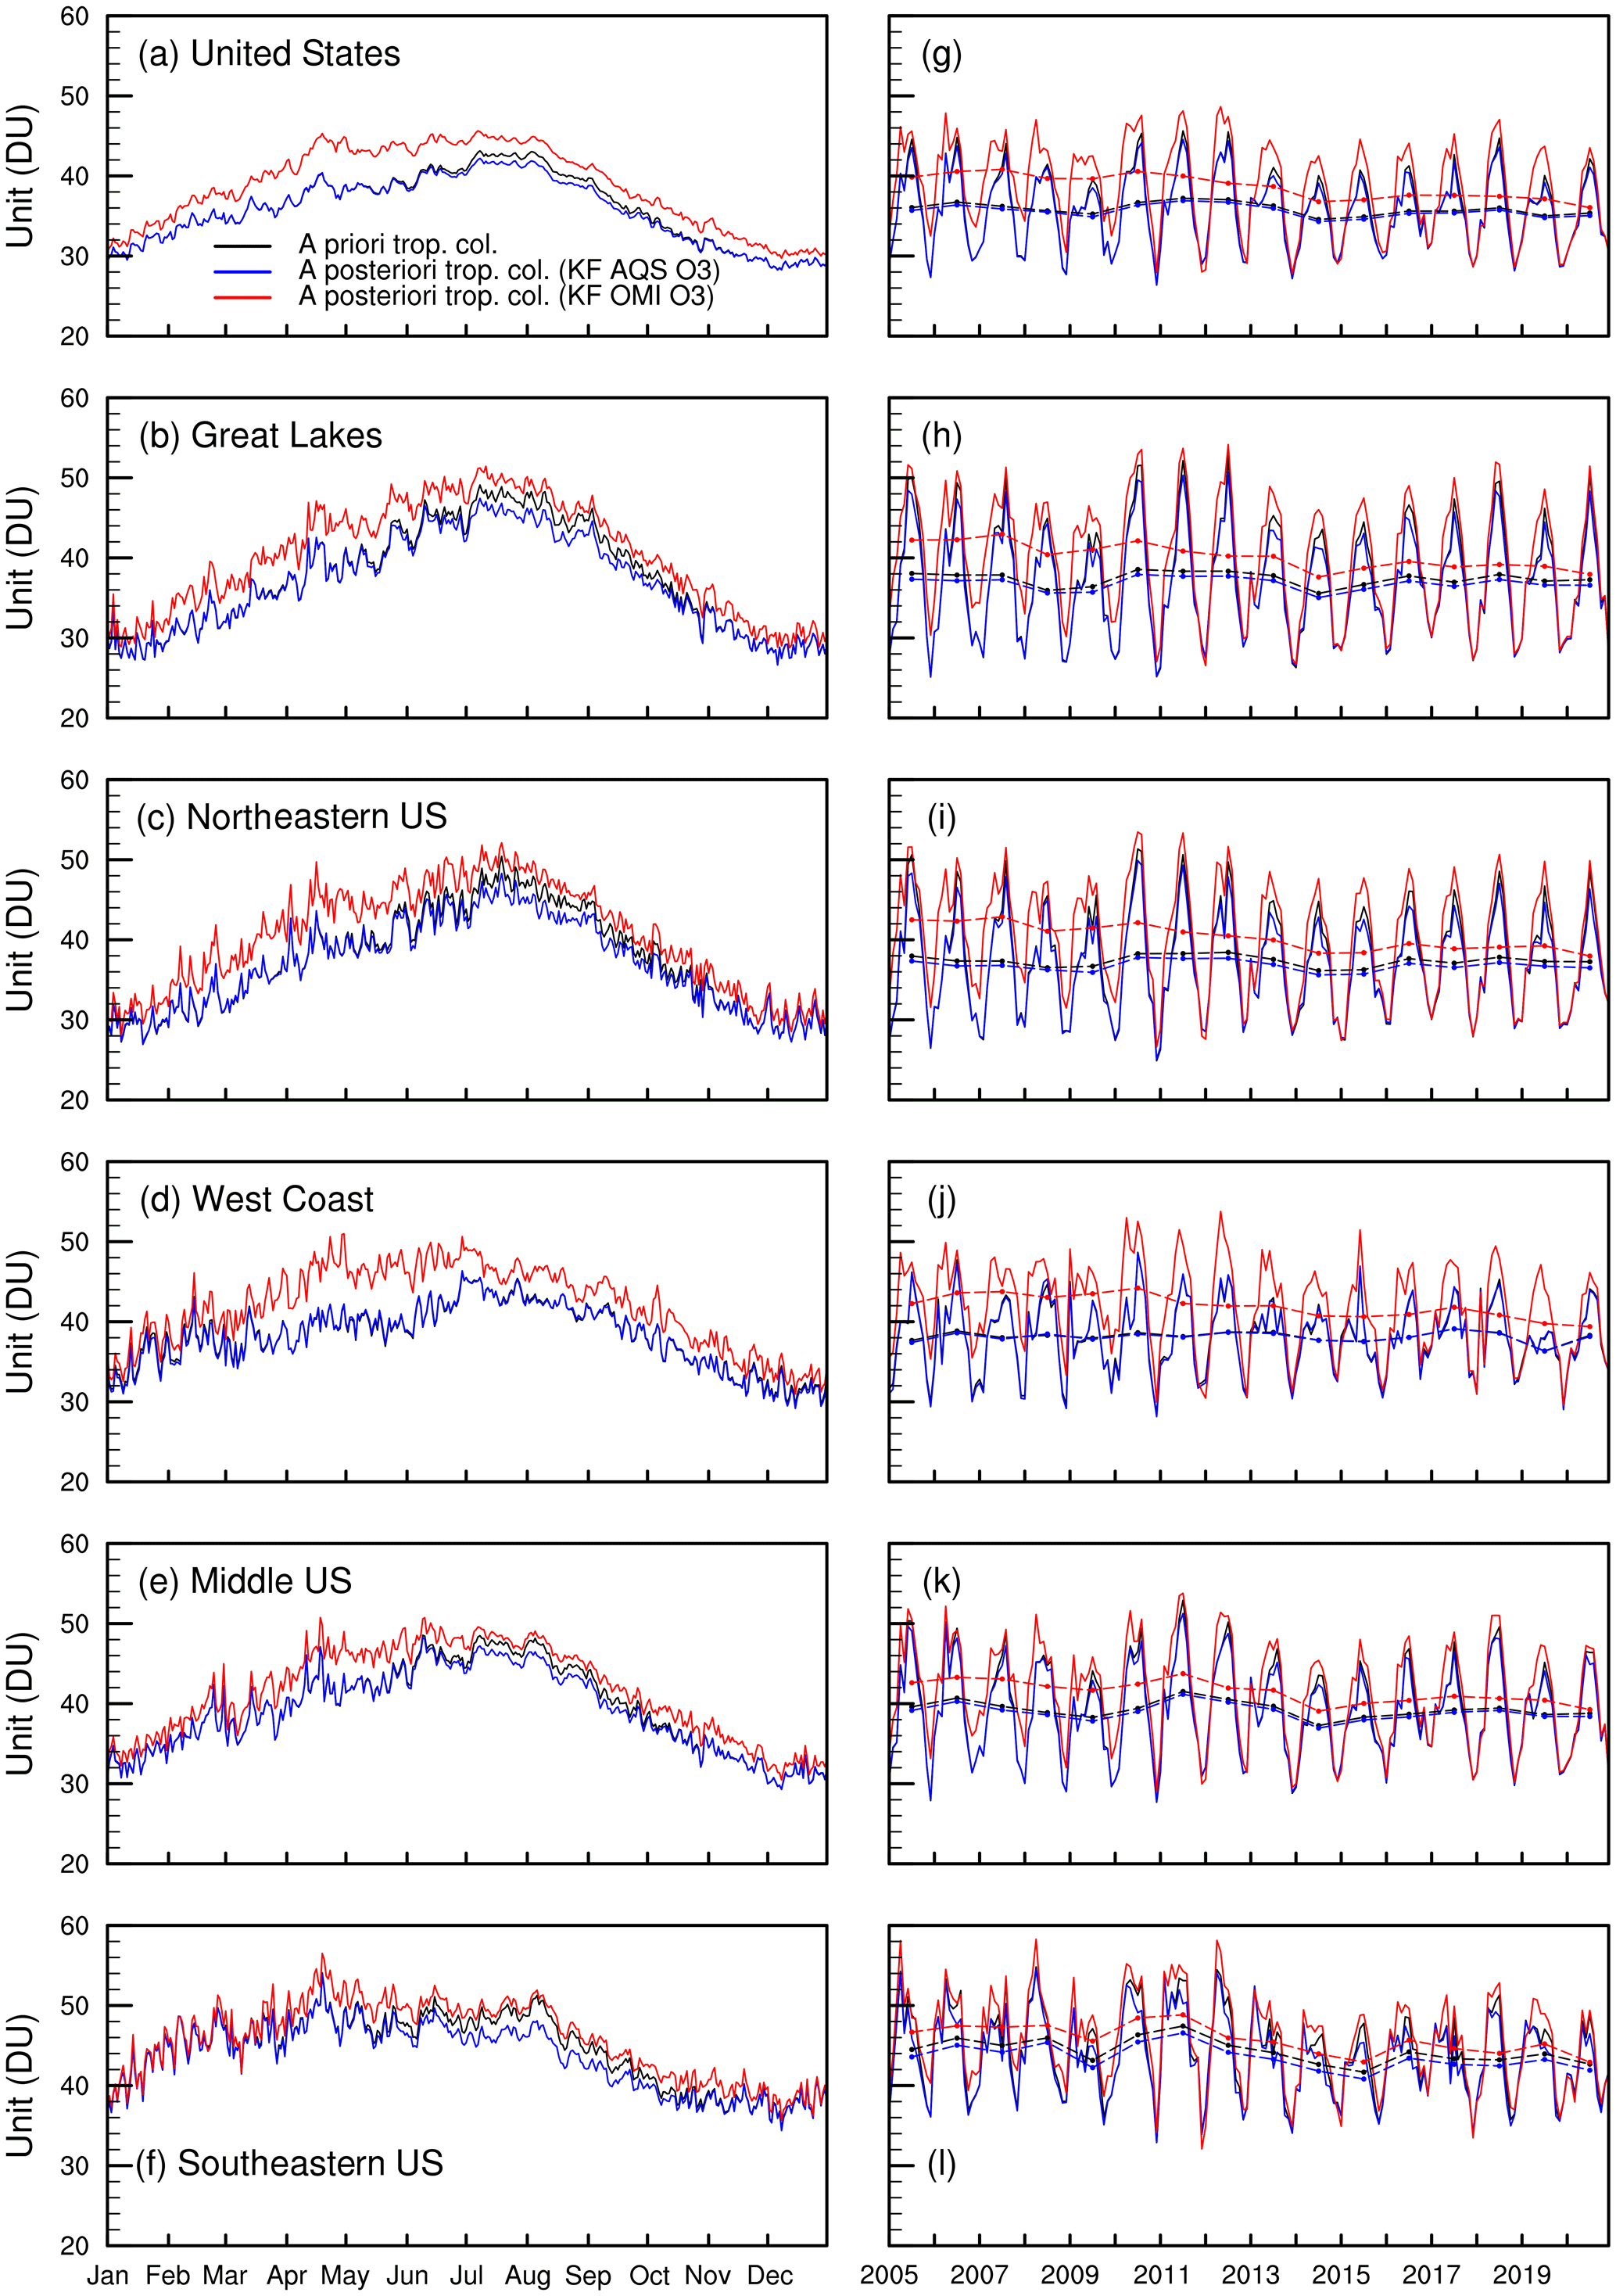
Figure 10(a–f) Daily averages of tropospheric O3 columns over the USA in 2005–2020 from the GEOS-Chem a priori simulation (black) and a posteriori simulations by assimilating AQS (blue) and OMI (red) O3 observations. (g–l) Monthly averages of tropospheric O3 columns. The dashed lines in panels (g)–(l) are the annual averages.
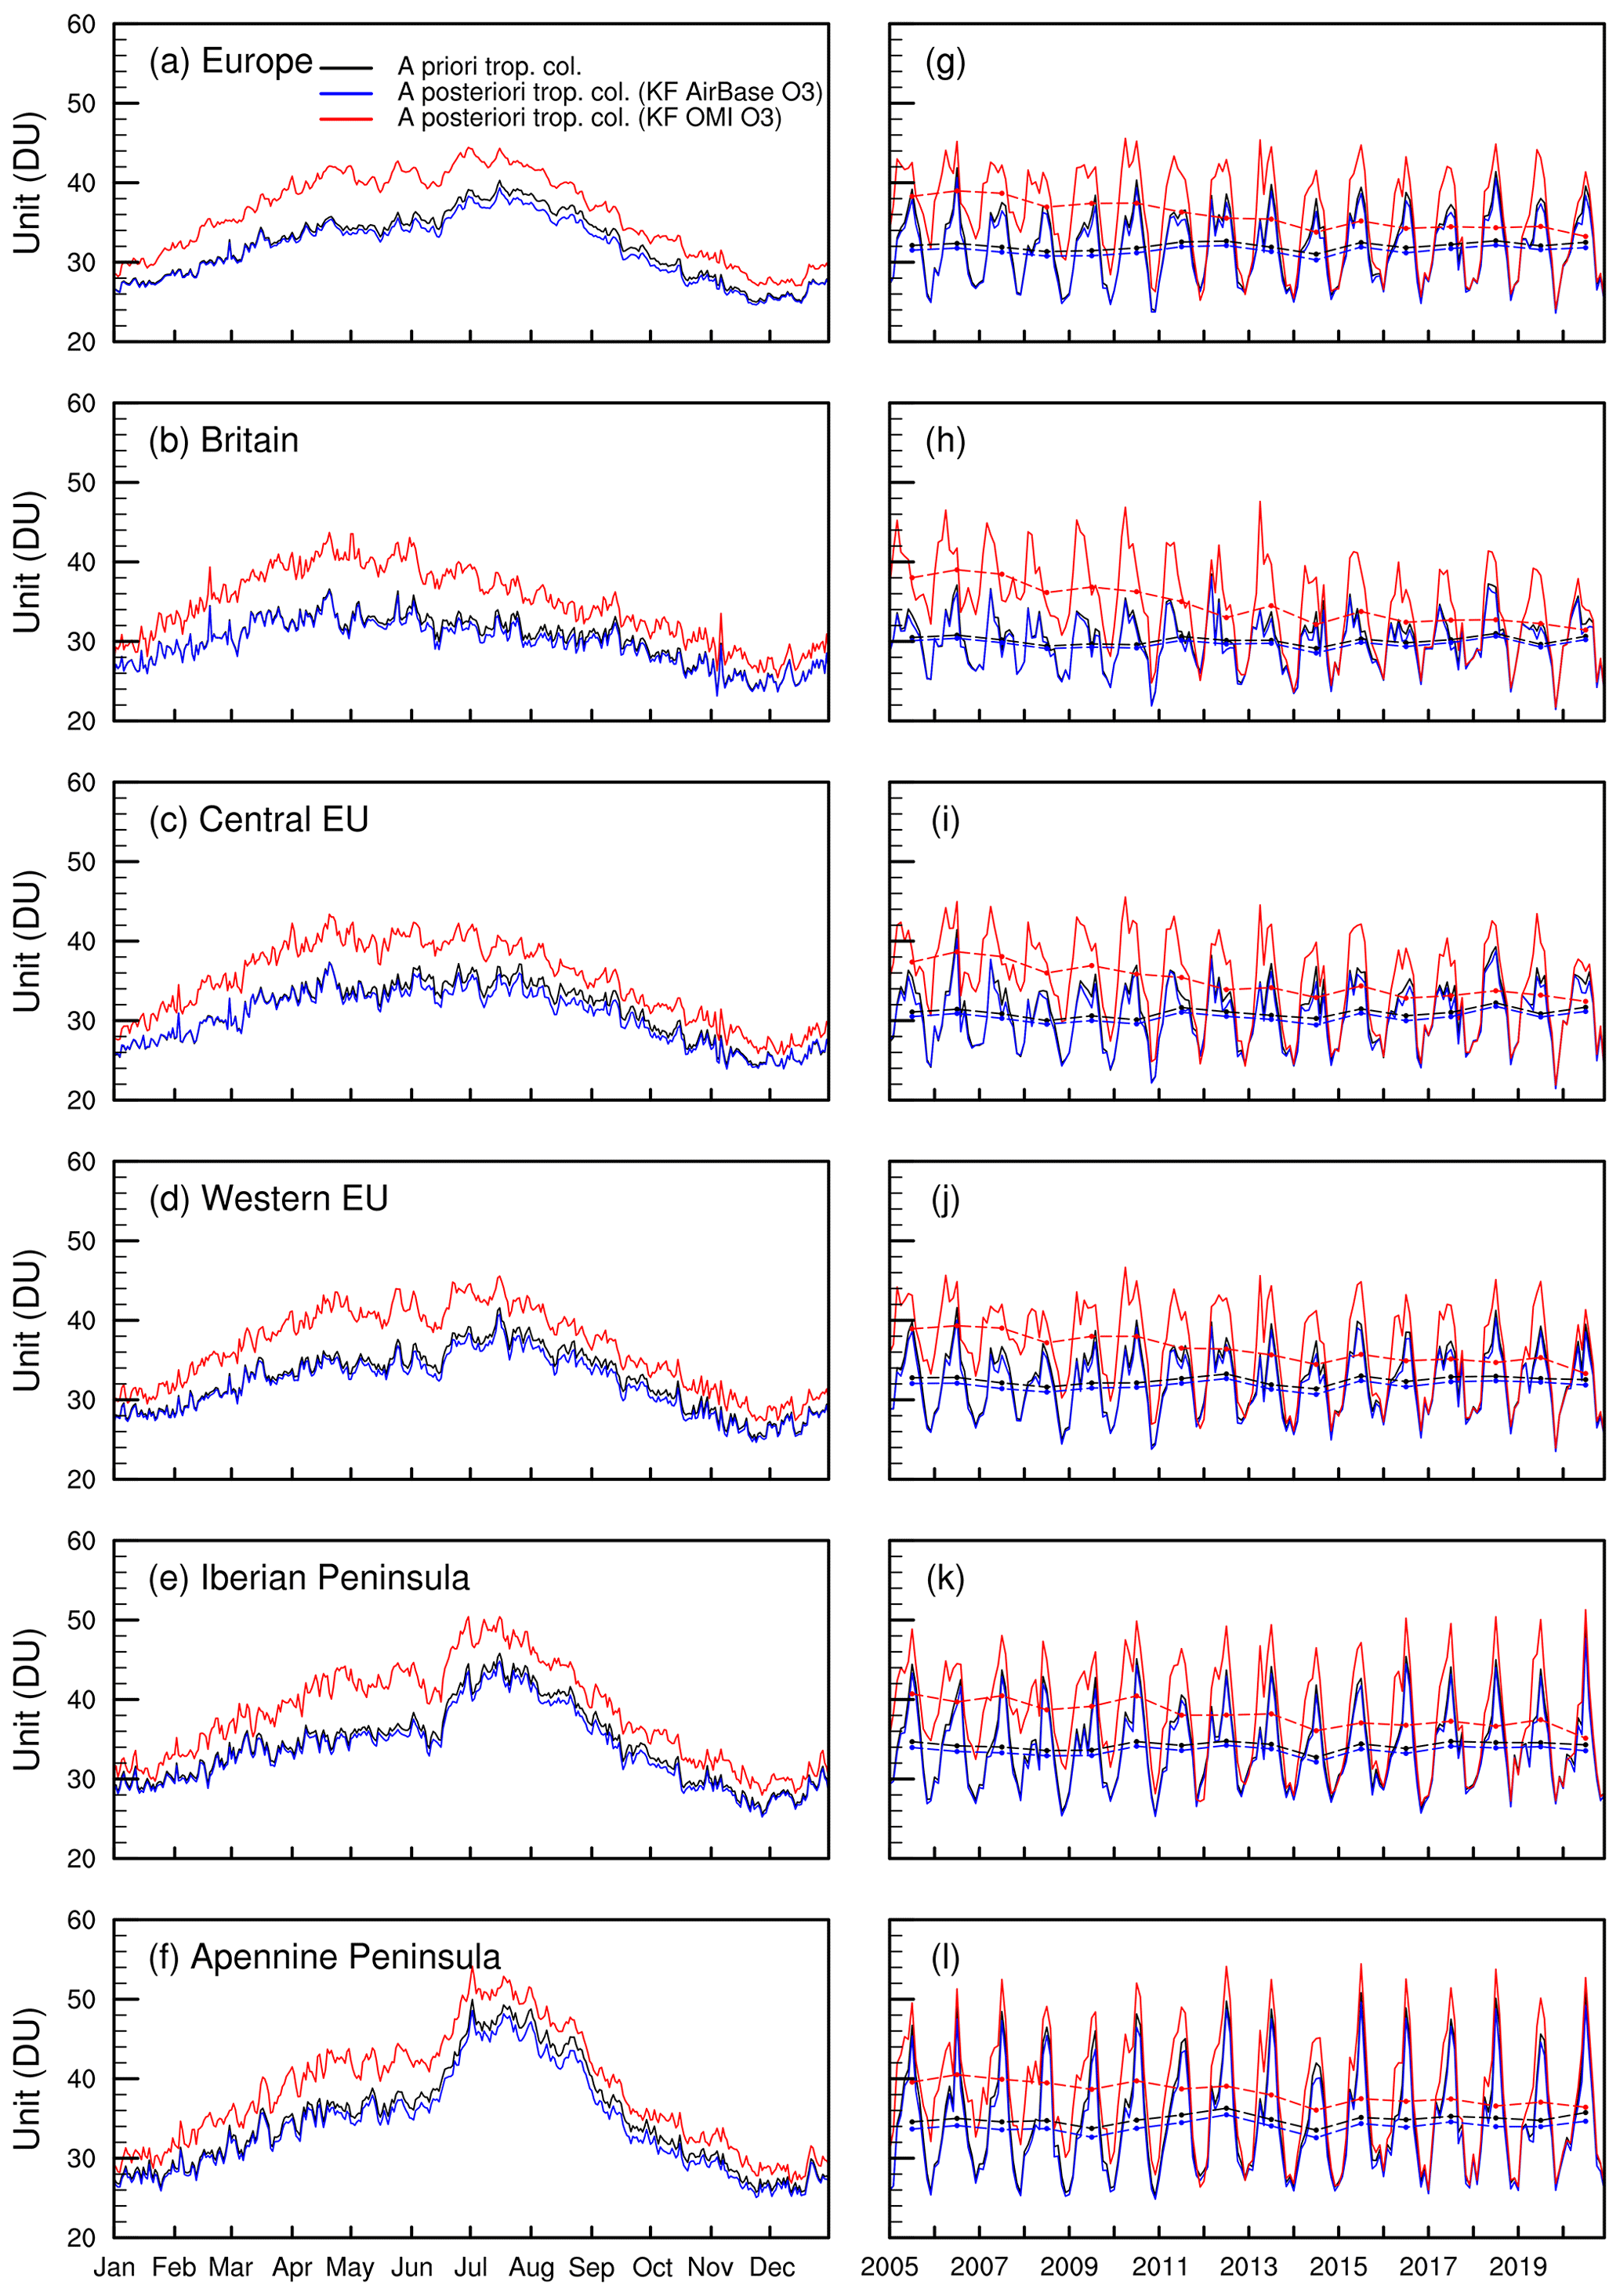
Figure 11(a–f) Daily averages of tropospheric O3 columns over Europe in 2005–2020 from the GEOS-Chem a priori simulation (black) and a posteriori simulations by assimilating AirBase (blue) and OMI (red) O3 observations. (g–l) Monthly averages of tropospheric O3 columns. The dashed lines in panels (g)–(l) are the annual averages.
Furthermore, Figs. S8–S9 demonstrate the O3 vertical profiles in 2005-2009, 2010–2014, and 2015–2020, respectively. The assimilation of surface O3 observations leads to decreases in O3 concentrations in the lower troposphere but has small impacts on free-tropospheric O3. In contrast, the assimilation of OMI O3 observations leads to dramatic enhancements in O3 concentrations in the middle and upper troposphere, without noticeable differences between areas with high and low local anthropogenic NOx emissions. The enhancement in free-tropospheric O3 by assimilating OMI O3 observations declined gradually from 2005–2009 to 2015–2020. The adjustment in free-tropospheric O3 by assimilating OMI O3 observations in 2015–2020 is larger but comparable to the adjustment in 2015–2020 in China (Zhu et al., 2023).
3.4 Large decreases in tropospheric O3 columns
Figures 12 and 13 show the trends in tropospheric O3 columns in 2005–2020 from a priori simulations and a posteriori simulations by assimilating surface and OMI O3 observations. The trends of tropospheric O3 columns in 2005–2020 are −0.07, −0.07, and −0.29 DU yr−1 (USA); −0.03, −0.03, and −0.29 DU yr−1 (Great Lakes); −0.02, −0.02, and −0.31 DU yr−1 (northeastern USA); −0.02, −0.01, and −0.26 DU yr−1 (West Coast), −0.08, −0.07, and −0.24 DU yr−1 (middle USA); and −0.19, −0.18, and −0.28 DU yr−1 (southeastern USA) in the a priori simulations and a posteriori simulations by assimilating AQS and OMI O3 observations, respectively. Moreover, the trends are 0.03, 0.03, and −0.36 DU yr−1 (Europe); 0.00, 0.00, and −0.49 DU yr−1 (Britain); 0.04, 0.04, and −0.38 DU yr−1 (central Europe); 0.02, 0.03, and −0.36 DU yr−1 (western Europe); 0.02, 0.02, and −0.30 DU yr−1 (Iberian Peninsula); and −0.04, 0.04, and −0.26 DU yr−1 (Apennine Peninsula) in the a priori simulations and a posteriori simulations by assimilating AirBase and OMI O3 observations, respectively. Our analysis thus exhibits dramatically lower decreasing trends in tropospheric O3 columns in the a priori simulations and assimilations by assimilating surface O3 observations with respect to OMI-based assimilations.
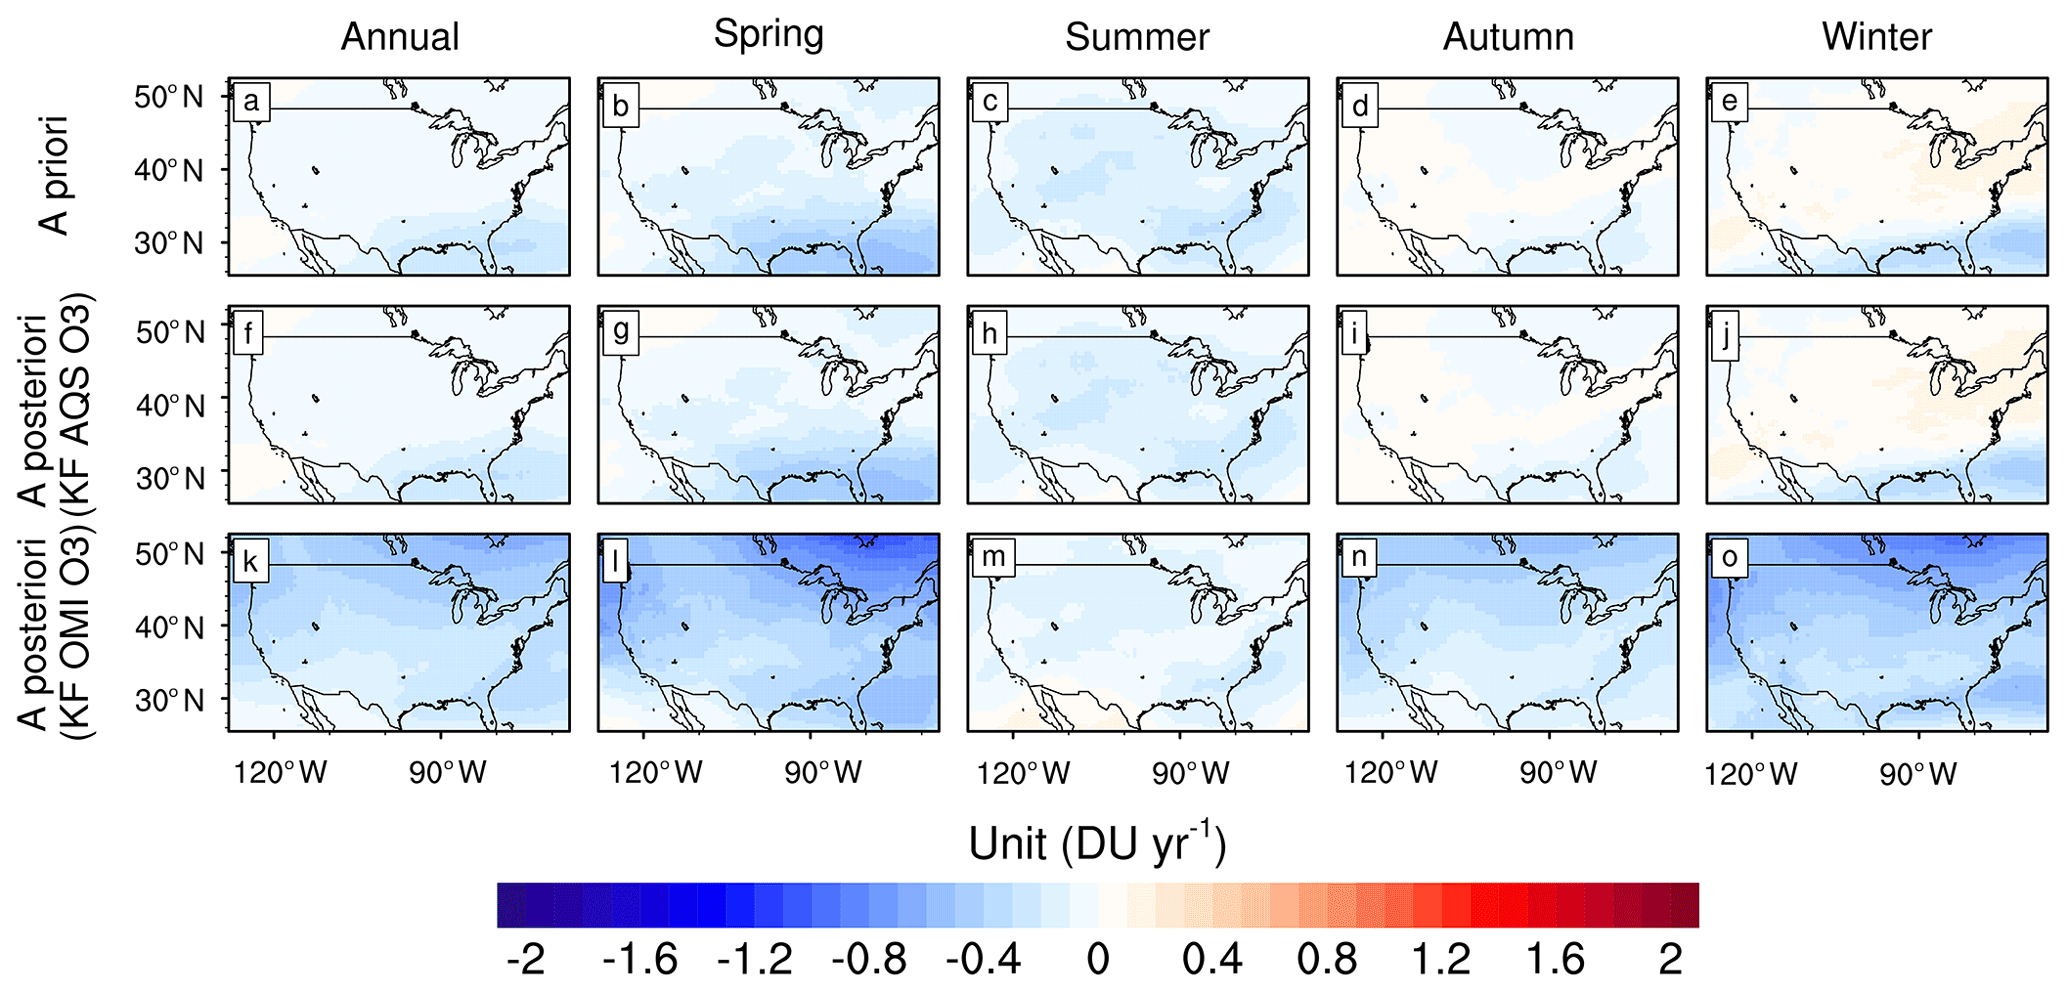
Figure 12Trends of tropospheric O3 columns over the USA in 2005–2020 (annual and seasonal averages) from the (a–e) GEOS-Chem a priori simulation, (f–j) assimilations of AQS surface O3 observations, and (k–o) assimilations of OMI O3 observations.
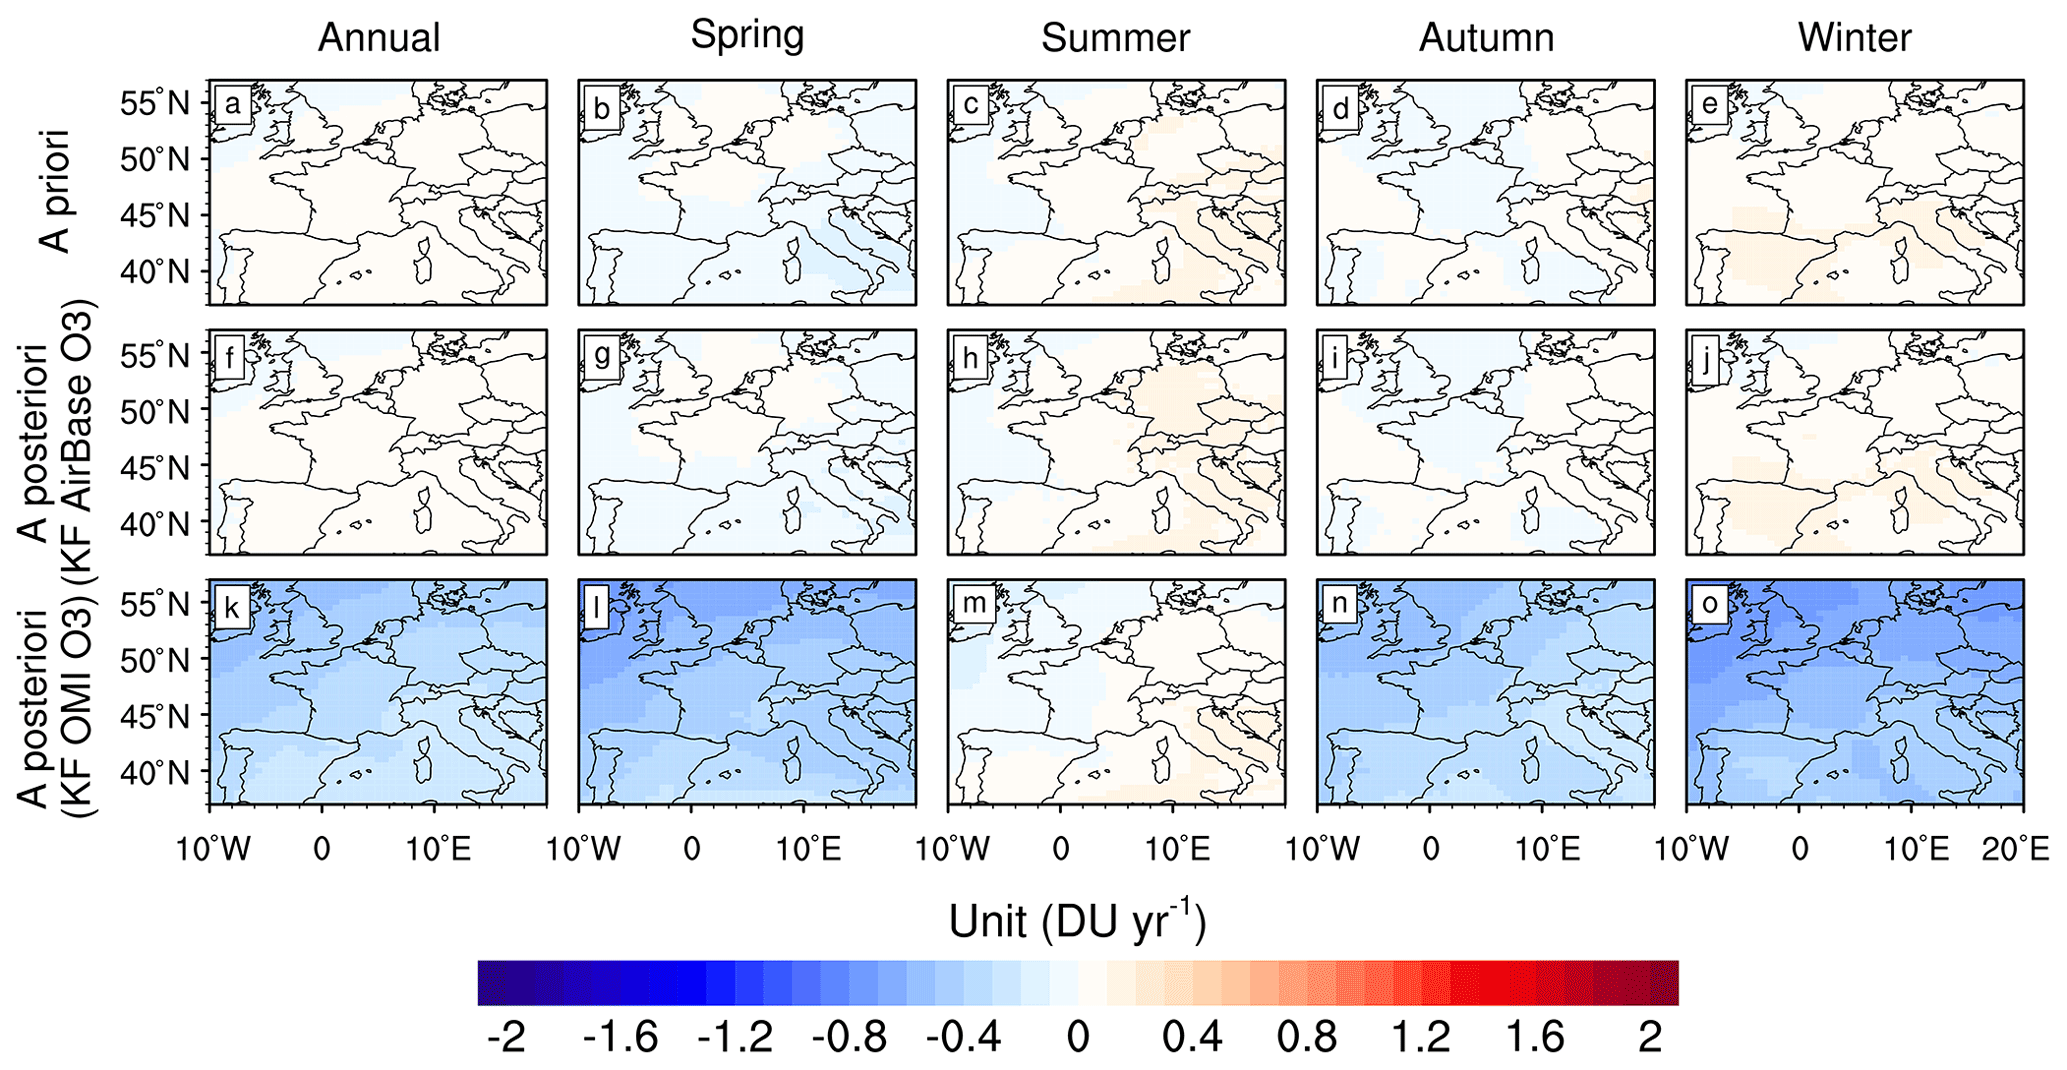
Figure 13Trends of tropospheric O3 columns over Europe in 2005–2020 (annual and seasonal averages) from the (a–e) GEOS-Chem a priori simulation, (f–j) assimilations of AirBase surface O3 observations, and (k–o) assimilations of OMI O3 observations.
The limited changes in surface O3 concentrations in the a priori simulations and assimilations by assimilating surface O3 observations indicate the limited influence of the decline in local anthropogenic emissions on surface O3 concentrations in the USA and Europe in 2005–2020. We can thus expect insignificant influences of the vertical transport of surface O3 on the changes in free-tropospheric O3 over the USA and Europe in 2005–2020, as illustrated by the flat trends in tropospheric O3 columns in the a priori simulations and assimilations by assimilating surface O3 observations (Figs. 10 and 11), as well as the small impacts of assimilation of surface O3 observations on free-tropospheric O3 (Figs. S8–S9). However, as indicated by Jiang et al. (2022), tropospheric OMI NO2 columns declined by 36 % and 23 % in 2005–2018 over the USA and Europe, respectively. Are the large decreases in tropospheric O3 columns by assimilating OMI O3 observations, i.e., 12.0 % (USA) and 15.0 % (Europe) in 2005–2020, caused by the decline in free-tropospheric NO2?
As indicated by Jiang et al. (2022), tropospheric OMI NO2 columns declined by −7.0 % yr−1 (USA) and −4.2 % yr−1 (Europe) in 2005–2010, which was followed by a dramatic slowdown in the decreasing trends, i.e., −1.7 % yr−1 (USA) and −1.2 % yr−1 (Europe) in 2010–2018. However, as shown in Table 1d, tropospheric O3 columns obtained by assimilating OMI O3 observations declined by −0.3 % yr−1, −2.3 % yr−1, and −0.5 % yr−1 over the USA in 2005–2009, 2010–2014, and 2015–2020, respectively. Similarly, tropospheric O3 columns obtained by assimilating OMI O3 observations declined by −1.0 % yr−1, −2.3 % yr−1, and −0.8 % yr−1 over Europe (Table 2d) in 2005–2009, 2010–2014, and 2015–2020, respectively. The OMI-based decline in tropospheric O3 columns over the USA and Europe mainly occurred in the period with slowing decreases in free-tropospheric NO2 after 2010; in contrast, the dramatic decline in tropospheric NO2 columns before 2010 was accompanied by limited changes in free-tropospheric O3. It is thus difficult to conclude that the large decreases in tropospheric O3 columns over the USA and Europe in 2010–2014 are dominated by the decline in local anthropogenic NOx emissions.
We note that our OMI-based analysis could be affected by the row anomaly issue, although the usage of “row-isolated” data by using across-track positions between 4 and 11 in this work is expected to reduce the impacts of the row anomaly. As shown by Huang et al. (2017), the row anomaly can lead to discontinuity in the trends in OMI O3 observations in 2009. However, the large decreases in tropospheric O3 columns over the USA and Europe mainly occurred after 2010. Consequently, we assume a limited influence of the row anomaly on our conclusion. Furthermore, OMI is sensitive to O3 concentrations in the free troposphere; OMI-based assimilations are driven by adjusted regional O3 boundary conditions provided by global OMI O3 assimilations and can reflect optimized adjustments in both local and global background O3 concentrations. In contrast, surface observations are sensitive to local O3 concentrations. Surface observation-based assimilations are driven by the a priori O3 boundary conditions, which thus reflects the optimized adjustments in local contributions and is also affected by lacking optimization on the impacts of O3 precursors due to the single O3 tracer simulations. These factors contributed to the difference in the trends of tropospheric O3 columns by assimilating surface and satellite observations. Assimilations of both surface and satellite observations, as shown in this work, are expected to provide more information for a better characterization of the changes and uncertainties in free-tropospheric O3.
As Part 2 of Zhu et al. (2023), which focuses on tropospheric O3 change in China in 2015–2020, this paper investigates the changes in surface and free-tropospheric O3 over the USA and Europe in 2005–2020 by assimilating OMI, AQS, and AirBase O3 observations. The assimilated O3 concentrations demonstrate good agreement with O3 observations because surface O3 concentrations are 41.4, 39.5, and 39.5 ppb (USA) and 35.3, 32.0, and 31.6 ppb (Europe) in the a priori and a posteriori simulations and AQS and AirBase O3 observations, respectively. Moreover, the tropospheric O3 columns are 35.5, 37.0, and 36.8 DU (USA) and 32.8, 35.3, and 36.4 DU (Europe) in the a priori and a posteriori simulations (convolved with OMI retrieval averaging kernels) and OMI O3 observations, respectively. The modeled surface O3 by GEOS-Chem is overestimated in the summer, which results in a surface O3 maximum in July–August in the simulations, which is in contrast to the month of April in the observations. Conversely, GEOS-Chem demonstrates a good performance in the simulation of seasonality in free-tropospheric O3, which is at a maximum in July–August. In addition, we find lower surface O3 concentrations over areas with higher anthropogenic NOx emissions in the USA and Europe. This is the opposite of the higher O3 concentrations in areas with higher local anthropogenic NOx emissions in China (Zhu et al., 2023).
Our analysis exhibits a noticeable decrease in surface O3 concentrations over the USA in the summer by 15 % in 2005–2020. However, when accompanied by an approximately 50 % reduction in NOx emissions, the changes in surface O3 concentrations are limited in Europe and other seasons in the USA. The annual surface MDA8 O3 decreased by −6 % over the USA and increased by 1.5 % over Europe in 2005–2020, and the decreases in surface O3 concentrations are weaker over areas with higher local anthropogenic NOx emissions. Furthermore, the surface observation-based assimilations suggest insignificant changes in tropospheric O3 columns, with −3.0 % (USA) and 1.5 % (Europe) in 2005–2020. While the OMI-based assimilations exhibit large decreases in tropospheric O3 columns, i.e., −12.0 % (USA) and −15.0 % (Europe) in 2005–2020, the decreases in tropospheric O3 columns mainly occurred in 2010–2014, corresponding to the reported slowing decline in free-tropospheric NO2 that has been seen since 2010 (Jiang et al., 2022). Despite the dramatic decline in tropospheric NO2, particularly the declining tropospheric NO2 columns in 2005–2010, our analysis suggests limited impacts of the decline in local emissions on changes in tropospheric O3 over the USA and Europe because the rapid decline in tropospheric NO2 columns in 2005–2010 corresponds to relatively flat trends in tropospheric O3. More efforts are suggested for an evaluation of the contributions of natural sources and transport to tropospheric O3 changes, which is critical for making more effective policies to reduce O3 pollution.
The AQS and AirBase surface O3 data can be downloaded from https://discomap.eea.europa.eu/map/fme/AirQualityExport.htm (EEA, 2023) and https://aqs.epa.gov/aqsweb/airdata/download_files.html#Raw (US EPA, 2023b). The OMI PROFOZ product can be acquired at https://avdc.gsfc.nasa.gov/pub/data/satellite/Aura/OMI/V03/L2/OMPROFOZ/ (Yang et al., 2023). The GEOS-Chem model (version 12.8.1) can be downloaded from https://doi.org/10.5281/zenodo.3837666 (The International GEOS-Chem User Community, 2020). The KPP module for tagged O3 simulations can be downloaded from https://doi.org/10.5281/zenodo.7545944 (Jiang, 2023).
The supplement related to this article is available online at: https://doi.org/10.5194/acp-23-9745-2023-supplement.
ZJ designed the research. RZ developed the model code and performed the research. ZJ and RZ wrote the paper. XL provided instruction for the usage of OMI data. All authors contributed to discussions and editing of the paper.
The contact author has declared that none of the authors has any competing interests.
Publisher's note: Copernicus Publications remains neutral with regard to jurisdictional claims in published maps and institutional affiliations.
We thank the United States Environmental Protection Agency and the European Environmental Agency for providing the surface O3 measurements. The numerical calculations in this paper have been done on the supercomputing system in the SuperComputing Center of the University of Science and Technology of China.
This research has been supported by the Hundred Talents Program of the Chinese Academy of Sciences and the National Natural Science Foundation of China (grant nos. 42277082 and 41721002).
This paper was edited by Guangjie Zheng and reviewed by two anonymous referees.
Boleti, E., Hueglin, C., Grange, S. K., Prévôt, A. S. H., and Takahama, S.: Temporal and spatial analysis of ozone concentrations in Europe based on timescale decomposition and a multi-clustering approach, Atmos. Chem. Phys., 20, 9051–9066, https://doi.org/10.5194/acp-20-9051-2020, 2020.
Chen, J., Jiang, Z., Li, R., Liao, C., Miyazaki, K., and Jones, D. B. A.: Large discrepancy between observed and modeled wintertime tropospheric NO2 variabilities due to COVID-19 controls in China, Environ. Res. Lett., 17, 035007, https://doi.org/10.1088/1748-9326/ac4ec0, 2022.
Chen, X., Jiang, Z., Shen, Y., Li, R., Fu, Y., Liu, J., Han, H., Liao, H., Cheng, X., Jones, D. B. A., Worden, H., and Abad, G. G.: Chinese Regulations Are Working—Why Is Surface Ozone Over Industrialized Areas Still High? Applying Lessons From Northeast US Air Quality Evolution, Geophys. Res. Lett., 48, e2021GL092816, https://doi.org/10.1029/2021gl092816, 2021.
Crippa, M., Janssens-Maenhout, G., Dentener, F., Guizzardi, D., Sindelarova, K., Muntean, M., Van Dingenen, R., and Granier, C.: Forty years of improvements in European air quality: regional policy-industry interactions with global impacts, Atmos. Chem. Phys., 16, 3825–3841, https://doi.org/10.5194/acp-16-3825-2016, 2016.
Di, Q., Amini, H., Shi, L., Kloog, I., Silvern, R., Kelly, J., Sabath, M. B., Choirat, C., Koutrakis, P., Lyapustin, A., Wang, Y., Mickley, L. J., and Schwartz, J.: Assessing NO2 Concentration and Model Uncertainty with High Spatiotemporal Resolution across the Contiguous United States Using Ensemble Model Averaging, Environ. Sci. Technol., 54, 1372–1384, https://doi.org/10.1021/acs.est.9b03358, 2020.
EEA (European Environment Agency): Surface O3 measurements, AirBase [data set], https://discomap.eea.europa.eu/map/fme/AirQualityExport.htm (last access: 22 August 2023), 2023.
Han, W., He, T.-L., Tang, Z., Wang, M., Jones, D., and Jiang, Z.: A comparative analysis for a deep learning model (hyDL-CO v1.0) and Kalman filter to predict CO concentrations in China, Geosci. Model Dev., 15, 4225–4237, https://doi.org/10.5194/gmd-15-4225-2022, 2022.
He, T.-L., Jones, D. B. A., Miyazaki, K., Huang, B., Liu, Y., Jiang, Z., White, E. C., Worden, H. M., and Worden, J. R.: Deep learning to evaluate US NOx emissions using surface ozone predictions, J. Geophys. Res.-Atmos., 127, e2021JD035597, https://doi.org/10.1029/2021jd035597, 2022.
Hoesly, R. M., Smith, S. J., Feng, L., Klimont, Z., Janssens-Maenhout, G., Pitkanen, T., Seibert, J. J., Vu, L., Andres, R. J., Bolt, R. M., Bond, T. C., Dawidowski, L., Kholod, N., Kurokawa, J.-I., Li, M., Liu, L., Lu, Z., Moura, M. C. P., O'Rourke, P. R., and Zhang, Q.: Historical (1750–2014) anthropogenic emissions of reactive gases and aerosols from the Community Emissions Data System (CEDS), Geosci. Model Dev., 11, 369–408, https://doi.org/10.5194/gmd-11-369-2018, 2018.
Huang, G., Liu, X., Chance, K., Yang, K., Bhartia, P. K., Cai, Z., Allaart, M., Ancellet, G., Calpini, B., Coetzee, G. J. R., Cuevas-Agulló, E., Cupeiro, M., De Backer, H., Dubey, M. K., Fuelberg, H. E., Fujiwara, M., Godin-Beekmann, S., Hall, T. J., Johnson, B., Joseph, E., Kivi, R., Kois, B., Komala, N., König-Langlo, G., Laneve, G., Leblanc, T., Marchand, M., Minschwaner, K. R., Morris, G., Newchurch, M. J., Ogino, S.-Y., Ohkawara, N., Piters, A. J. M., Posny, F., Querel, R., Scheele, R., Schmidlin, F. J., Schnell, R. C., Schrems, O., Selkirk, H., Shiotani, M., Skrivánková, P., Stübi, R., Taha, G., Tarasick, D. W., Thompson, A. M., Thouret, V., Tully, M. B., Van Malderen, R., Vömel, H., von der Gathen, P., Witte, J. C., and Yela, M.: Validation of 10-year SAO OMI Ozone Profile (PROFOZ) product using ozonesonde observations, Atmos. Meas. Tech., 10, 2455–2475, https://doi.org/10.5194/amt-10-2455-2017, 2017.
Jiang, Z.: KPP module for tagged-O3 simulation, Version 1, Zenodo [code], https://doi.org/10.5281/zenodo.7545944, 2023.
Jiang, Z., Worden, J. R., Jones, D. B. A., Lin, J.-T., Verstraeten, W. W., and Henze, D. K.: Constraints on Asian ozone using Aura TES, OMI and Terra MOPITT, Atmos. Chem. Phys., 15, 99–112, https://doi.org/10.5194/acp-15-99-2015, 2015.
Jiang, Z., McDonald, B. C., Worden, H., Worden, J. R., Miyazaki, K., Qu, Z., Henze, D. K., Jones, D. B. A., Arellano, A. F., Fischer, E. V., Zhu, L., and Boersma, K. F.: Unexpected slowdown of US pollutant emission reduction in the past decade, P. Natl. Acad. Sci. USA, 115, 5099–5104, https://doi.org/10.1073/pnas.1801191115, 2018.
Jiang, Z., Zhu, R., Miyazaki, K., McDonald, B. C., Klimont, Z., Zheng, B., Boersma, K. F., Zhang, Q., Worden, H., Worden, J. R., Henze, D. K., Jones, D. B. A., Denier van der Gon, H. A. C., and Eskes, H.: Decadal Variabilities in Tropospheric Nitrogen Oxides Over United States, Europe, and China, J. Geophys. Res.-Atmos., 127, e2021JD035872, https://doi.org/10.1029/2021jd035872, 2022.
Laughner, J. L. and Cohen, R. C.: Direct observation of changing NOx lifetime in North American cities, Science, 366, 723–727, https://doi.org/10.1126/science.aax6832, 2019.
Li, K., Jacob, D. J., Liao, H., Zhu, J., Shah, V., Shen, L., Bates, K. H., Zhang, Q., and Zhai, S.: A two-pollutant strategy for improving ozone and particulate air quality in China, Nat. Geosci., 12, 906–910, https://doi.org/10.1038/s41561-019-0464-x, 2019.
Li, M., Zhang, Q., Kurokawa, J.-I., Woo, J.-H., He, K., Lu, Z., Ohara, T., Song, Y., Streets, D. G., Carmichael, G. R., Cheng, Y., Hong, C., Huo, H., Jiang, X., Kang, S., Liu, F., Su, H., and Zheng, B.: MIX: a mosaic Asian anthropogenic emission inventory under the international collaboration framework of the MICS-Asia and HTAP, Atmos. Chem. Phys., 17, 935–963, https://doi.org/10.5194/acp-17-935-2017, 2017.
Liu, X., Bhartia, P. K., Chance, K., Spurr, R. J. D., and Kurosu, T. P.: Ozone profile retrievals from the Ozone Monitoring Instrument, Atmos. Chem. Phys., 10, 2521–2537, https://doi.org/10.5194/acp-10-2521-2010, 2010.
Macdonald, E., Otero, N., and Butler, T.: A comparison of long-term trends in observations and emission inventories of NOx, Atmos. Chem. Phys., 21, 4007–4023, https://doi.org/10.5194/acp-21-4007-2021, 2021.
Parrish, D. D., Law, K. S., Staehelin, J., Derwent, R., Cooper, O. R., Tanimoto, H., Volz-Thomas, A., Gilge, S., Scheel, H. E., Steinbacher, M., and Chan, E.: Lower tropospheric ozone at northern midlatitudes: Changing seasonal cycle, Geophys. Res. Lett., 40, 1631–1636, https://doi.org/10.1002/grl.50303, 2013.
Petetin, H., Thouret, V., Fontaine, A., Sauvage, B., Athier, G., Blot, R., Boulanger, D., Cousin, J.-M., and Nédélec, P.: Characterising tropospheric O3 and CO around Frankfurt over the period 1994–2012 based on MOZAIC–IAGOS aircraft measurements, Atmos. Chem. Phys., 16, 15147–15163, https://doi.org/10.5194/acp-16-15147-2016, 2016.
Qu, Z., Jacob, D. J., Silvern, R. F., Shah, V., Campbell, P. C., Valin, L. C., and Murray, L. T.: US COVID-19 Shutdown Demonstrates Importance of Background NO2 in Inferring NOx Emissions From Satellite NO2 Observations, Geophys. Res. Lett., 48, e2021GL092783, https://doi.org/10.1029/2021GL092783, 2021.
Seltzer, K. M., Shindell, D. T., Kasibhatla, P., and Malley, C. S.: Magnitude, trends, and impacts of ambient long-term ozone exposure in the United States from 2000 to 2015, Atmos. Chem. Phys., 20, 1757–1775, https://doi.org/10.5194/acp-20-1757-2020, 2020.
Shen, L., Mickley, L. J., and Tai, A. P. K.: Influence of synoptic patterns on surface ozone variability over the eastern United States from 1980 to 2012, Atmos. Chem. Phys., 15, 10925–10938, https://doi.org/10.5194/acp-15-10925-2015, 2015.
Tang, Z., Chen, J., and Jiang, Z.: Discrepancy in assimilated atmospheric CO over East Asia in 2015–2020 by assimilating satellite and surface CO measurements, Atmos. Chem. Phys., 22, 7815–7826, https://doi.org/10.5194/acp-22-7815-2022, 2022.
The International GEOS-Chem User Community: GEOS-Chem, Version 12.8.1, Zenodo [code], https://doi.org/10.5281/zenodo.3837666, 2020.
Trickl, T., Vogelmann, H., Ries, L., and Sprenger, M.: Very high stratospheric influence observed in the free troposphere over the northern Alps – just a local phenomenon?, Atmos. Chem. Phys., 20, 243–266, https://doi.org/10.5194/acp-20-243-2020, 2020.
US EPA (Environmental Protection Agency): Overview of the Clean Air Act and Air Pollution, https://www.epa.gov/clean-air-act-overview (last access: 22 August 2023), 2023a.
US EPA (Environmental Protection Agency): Surface O3 measurements, AQS [data set], https://aqs.epa.gov/aqsweb/airdata/download_files.html#Raw (last access: 22 August 2023), 2023b.
van der Werf, G. R., Randerson, J. T., Giglio, L., Collatz, G. J., Mu, M., Kasibhatla, P. S., Morton, D. C., DeFries, R. S., Jin, Y., and van Leeuwen, T. T.: Global fire emissions and the contribution of deforestation, savanna, forest, agricultural, and peat fires (1997–2009), Atmos. Chem. Phys., 10, 11707–11735, https://doi.org/10.5194/acp-10-11707-2010, 2010.
Wang, X., Fu, T. M., Zhang, L., Lu, X., Liu, X., Amnuaylojaroen, T., Latif, M. T., Ma, Y., Zhang, L., Feng, X., Zhu, L., Shen, H., and Yang, X.: Rapidly Changing Emissions Drove Substantial Surface and Tropospheric Ozone Increases Over Southeast Asia, Geophys. Res. Lett., 49, e2022GL100223, https://doi.org/10.1029/2022gl100223, 2022.
Wespes, C., Hurtmans, D., Clerbaux, C., Boynard, A., and Coheur, P.-F.: Decrease in tropospheric O3 levels in the Northern Hemisphere observed by IASI, Atmos. Chem. Phys., 18, 6867–6885, https://doi.org/10.5194/acp-18-6867-2018, 2018.
Xue, L., Ding, A., Cooper, O., Huang, X., Wang, W., Zhou, D., Wu, Z., McClure-Begley, A., Petropavlovskikh, I., Andreae, M. O., and Fu, C.: ENSO and Southeast Asian biomass burning modulate subtropical trans-Pacific ozone transport, Natl. Sci. Rev., 8, nwaa132, https://doi.org/10.1093/nsr/nwaa132, 2021.
Yan, Y., Pozzer, A., Ojha, N., Lin, J., and Lelieveld, J.: Analysis of European ozone trends in the period 1995–2014, Atmos. Chem. Phys., 18, 5589–5605, https://doi.org/10.5194/acp-18-5589-2018, 2018.
Yang, K., Liu, X., and Bhartia, P.: OMI/Aura Vertical Ozone (O3) Profile (PROFOZ), Aura Validation Data Center (AVDC) [data set], NASA GSFC, https://avdc.gsfc.nasa.gov/pub/data/satellite/Aura/OMI/V03/L2/OMPROFOZ/ (last access: 22 August 2023), 2023.
Zheng, B., Zhang, Q., Tong, D., Chen, C., Hong, C., Li, M., Geng, G., Lei, Y., Huo, H., and He, K.: Resolution dependence of uncertainties in gridded emission inventories: a case study in Hebei, China, Atmos. Chem. Phys., 17, 921–933, https://doi.org/10.5194/acp-17-921-2017, 2017.
Zhu, R., Tang, Z., Chen, X., Liu, X. and Jiang, Z.: Zhu, R., Tang, Z., Chen, X., Jiang, Z., and Liu, X.: Rapid assimilations of O3 observations – Part 1: methodology and tropospheric O3 changes in China in 2015–2020, Geosci. Model Dev. Discuss. [preprint], https://doi.org/10.5194/gmd-2023-35, in review, 2023.
Ziemke, J. R., Oman, L. D., Strode, S. A., Douglass, A. R., Olsen, M. A., McPeters, R. D., Bhartia, P. K., Froidevaux, L., Labow, G. J., Witte, J. C., Thompson, A. M., Haffner, D. P., Kramarova, N. A., Frith, S. M., Huang, L.-K., Jaross, G. R., Seftor, C. J., Deland, M. T., and Taylor, S. L.: Trends in global tropospheric ozone inferred from a composite record of TOMS/OMI/MLS/OMPS satellite measurements and the MERRA-2 GMI simulation, Atmos. Chem. Phys., 19, 3257–3269, https://doi.org/10.5194/acp-19-3257-2019, 2019.