the Creative Commons Attribution 4.0 License.
the Creative Commons Attribution 4.0 License.
 | 17 Aug 2023
Nighttime NO emissions strongly suppress chlorine and nitrate radical formation during the winter in Delhi
Sophie L. Haslett
David M. Bell
Varun Kumar
Jay G. Slowik
Dongyu S. Wang
Suneeti Mishra
Neeraj Rastogi
Atinderpal Singh
Dilip Ganguly
Joel Thornton
Feixue Zheng
Yuanyuan Li
Yongchun Liu
Wei Ma
Markku Kulmala
Kaspar R. Daellenbach
David Hadden
Urs Baltensperger
Andre S. H. Prevot
Atmospheric pollution in urban regions is highly influenced by oxidants due to their important role in the formation of secondary organic aerosol (SOA) and smog. These include the nitrate radical (NO3), which is typically considered a nighttime oxidant, and the chlorine radical (Cl), an extremely potent oxidant that can be released in the morning in chloride-rich environments as a result of nocturnal build-up of nitryl chloride (ClNO2). Chloride makes up a higher percentage of particulate matter in Delhi than has been observed anywhere else in the world, which results in Cl having an unusually strong influence in this city. Here, we present observations and model results revealing that atmospheric chemistry in Delhi exhibits an unusual diel cycle that is controlled by high concentrations of NO during the night. As a result of this, the formation of both NO3 and dinitrogen pentoxide (N2O5), a precursor of ClNO2 and thus Cl, are suppressed at night and increase to unusually high levels during the day. Our results indicate that a substantial reduction in nighttime NO has the potential to increase both nocturnal oxidation via NO3 and the production of Cl during the day.
- Article
(1487 KB) - Full-text XML
-
Supplement
(1003 KB) - BibTeX
- EndNote


Delhi is one of the world's most polluted cities and experiences its most severe pollution episodes during winter due to stagnant meteorology and a compressed boundary layer (Guttikunda and Gurjar, 2012). Industry, agricultural burning, brick kilns, and traffic contribute substantially towards urban haze, in addition to widespread small-scale sources such as cooking emissions and waste and fuel burning (Rai et al., 2020; Guttikunda and Calori, 2013; Lalchandani et al., 2021; Pant et al., 2015). Many of these are known to emit large quantities of chlorine (Rai et al., 2020; Gunthe et al., 2021; Zhang et al., 2022).
Consequently, particulate chloride concentrations in Delhi are higher than anywhere else in the world where measurements have been made. Chloride makes up around 10 % of the submicron particulate matter by mass (Pant et al., 2015; Gunthe et al., 2021; Gani et al., 2019; Tobler et al., 2020) and, from our observations, as much as 38 % in some cases, compared with 4 % during the winter in Beijing (Zhang et al., 2020). The ramifications of this are only now beginning to be understood. For example, new research has shown that chloride significantly impacts haze and fog formation in Delhi as a result of enhanced water uptake (Gunthe et al., 2021). The severe consequences for human health are made all the more critical by the city's extremely high population density (11 000 people per square kilometre in 2011; Joshi, 2011).
High levels of particulate chloride can result in production of the chlorine radical (Cl), a highly reactive oxidant. Many volatile organic compounds (VOCs) are oxidised by Cl at rates far exceeding that of the hydroxyl radical (OH; Spicer et al., 1998; Osthoff et al., 2008), the main atmospheric oxidant, meaning that even low Cl concentrations substantially increase atmospheric reactivity. This can in turn increase secondary organic aerosol (SOA; Dhulipala et al., 2019; Wang and Hildebrandt Ruiz, 2018) and therefore urban haze formation.
In the urban environment, Cl is extracted from particle-phase chloride when both nitrogen dioxide (NO2) and ozone (O3) are present. Reactions between NO2 and O3 produce the nitrate radical (NO3), another prominent atmospheric oxidant, which forms an equilibrium with dinitrogen pentoxide (N2O5). Heterogeneous reactions between gaseous N2O5 and particulate chloride produce nitryl chloride (ClNO2). Due to both the instability of NO3 in daylight and the fast reaction between NO3 and NO (Table S1 in the Supplement), N2O5 and NO3 are commonly depleted during the day and increase at night (Wang et al., 2017). This pattern promotes the accumulation of nighttime ClNO2. After sunrise, ClNO2 is photolysed and Cl liberated.
Here, we present evidence that this diel cycle is inverted in Delhi, with NO3 and N2O5 primarily being present during the day. Observations of N2O5 and ClNO2 were carried out using an iodide chemical ionisation mass spectrometer fitted with a filter inlet for gases and aerosols (FIGAERO-CIMS) in January and February 2019, as part of a larger-scale effort to characterise the physical and chemical properties of Delhi's urban haze (Lalchandani et al., 2021; Rai et al., 2020; A. Singh et al., 2021; Kumar et al., 2022). During the campaign, we observed particulate chloride loadings in excess of 100 µg m−3 on several occasions. Almost no N2O5 was observed at night, and daytime concentrations were in large excess when compared with the few other places where sustained daytime N2O5 has been observed (Houston, Texas, in Geyer et al., 2003; the Gulf of Maine in Osthoff et al., 2006). Consequently, the concentrations of ClNO2 formed were much lower than might have been expected, considering the high chloride loadings.
2.1 Field campaign and sampling site
The field study was carried out at the Centre for Atmospheric Sciences at the Indian Institute of Technology in New Delhi (IITD; 28.54∘ N, 77.19∘ E) during January and February 2019. Measurements were taken from 11 January–5 February. Instruments were installed in a temperature-controlled fourth-floor laboratory.
The site is surrounded by a mixture of residential, commercial, and educational buildings. It is situated in the IITD campus, which also contains a number of green spaces. Delhi's outer ring road is located around 80 m to the north of the site, and a larger arterial road can be found around 1 km ESE of the site. The site is a representative background urban site. Measurements took place during the winter season, with temperatures ranging from around 10 ∘C during the coolest night to 30 ∘C on the warmest day. Relative humidity ranged from 30 % to 100 %. More detail on the campaign site itself and the aerosol- and gas-phase instrumentation can be found in other publications from this campaign (Lalchandani et al., 2021; Rai et al., 2020; N. Singh et al., 2021; Wang et al., 2020; Kumar et al., 2022).
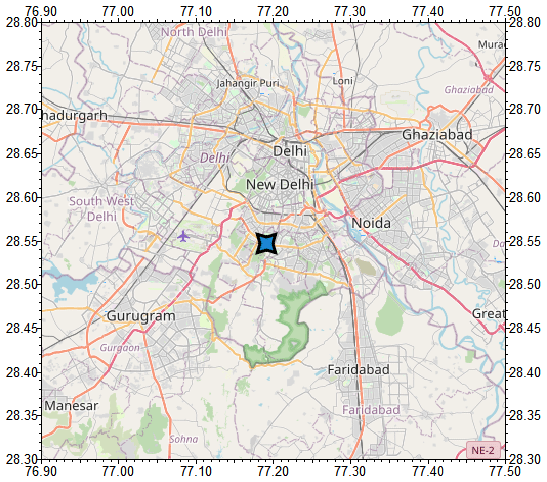
Figure 1Map of the field site location at the Indian Institute of Technology in Delhi. (Map data © OpenStreetMap 2023. Distributed under the Open Data Commons Open Database License (OdbL) v1.0.)
2.2 The FIGAERO-CIMS
A high-resolution iodide adduct chemical ionisation mass spectrometer with a filter inlet for particles and gases (FIGAERO-CIMS; Lopez-Hilfiker et al., 2014; Aerodyne Research Inc., Billerica, MA, USA) was used to measure N2O5, ClNO2, and oxygenated organic compounds. This method uses the negative iodide ion (I−) as a reagent, which is produced by passing a dry nitrogen flow (1.5 L min−1) over a methyl iodide permeation tube, followed by an X-ray ioniser. This ionised ion flow interacts with incoming sample air in the ion molecular region (IMR), which is kept at 250 mbar, creating charged products that are identified as clusters containing I− in the time-of-flight mass spectrometer. The FIGAERO inlet allows the gas phase to be sampled, while simultaneously collecting particles on a Teflon filter (Pall Corporation, Zefluor; 2 µm pore size and 25 mm diameter). This filter was exposed to a sample airflow of 2 L min−1 for approximately 3 min, before being moved into the desorption position at the instrument inlet. In this position, it was heated gradually from room temperature to 200 ∘C, using a dry nitrogen flow at 2 L min−1, before being held at 200 ∘C for 20 min and then cooled back down to room temperature over the course of 15 min. During the heating process, compounds that vaporise at temperatures below 200 ∘C desorb from the filter, with the quantity of each compound growing as the temperature increases. The signal then peaks at the temperature Tmax, which differs for each compound i. The temperature at which the maximum amount of a compound desorbs from the filter is related to the compound's volatility (Lopez-Hilfiker et al., 2014; Thornton et al., 2020). The total signal for each compound from each heating event was found by integrating the signal from the beginning of the heating period to the beginning of the cooling period.
Between particle-phase desorption periods, the gas phase was sampled directly by the FIGAERO-CIMS for approximately 20 min. For this study, these 20 min periods have been averaged, providing averaged data points at a frequency of one every 60–90 min while the instrument was running. Air samples were drawn at 3.5 L min−1 through the inlet, approximately 2 L min−1 of which entered the IMR, with the rest being included only to reduce residence time and thus pumped away. The N2O5 and ClNO2 ions were observed clustered, with I− at 235 amu ( 235) and 208, respectively (Slusher et al., 2004; Kercher et al., 2009).
Background measurements were carried out 26 times for the particle phase and 6 times for the gas phase throughout the campaign. For the particle phase, a clean, pre-heated Teflon filter (Pall Corporation, Zefluor; 2 µm pore size and 25 mm diameter) was inserted into the nitrogen flow, and the standard heating procedure described above was carried out. The results from these gave an indication of the instrument background, and the integrated signal for each compound was subtracted from the integrated signal for each particle-phase measurement. In the gas phase, zero-air gas was passed directly into the inlet and the background was measured.
Particle-phase sampling for the FIGAERO-CIMS was conducted via a in. (1.27 cm) outer diameter (0.35 in. (0.889 cm) inner diameter) stainless steel tube of 1.5 m length (2 L min−1; 2.8 s residence time), and gas-phase sampling was done via a in. (0.635 cm) outer diameter (0.2 in. (0.508 cm) inner diameter) perfluoroalkoxy (PFA) Teflon tube of around 2 m length (2 L min−1; 1.2 s residence time).
Direct calibrations for N2O5 and ClNO2 were not carried out in the field. The method used to quantify the FIGAERO-CIMS signal for these compounds is detailed in Sect. S1 and Figs. S1 and S2 in the Supplement.
2.3 Other instrumentation
An aerosol mass spectrometer (AMS; Aerodyne Research Inc., Billerica, MA, USA) was used to quantify aerosol chloride, nitrate, ammonium, sulfate, and organic concentrations. The instrument set-up for this campaign has been described in detail elsewhere (Kumar et al., 2022). In brief, ambient air was sampled through an aerodynamic lens that limits sampling to particulate matter with a diameter smaller than 1 µm (PM1). Aerosol particles within the beam are flash vaporised at 600 ∘C, and the resulting vapours are ionised using electron impact ionisation. Ionised fragments pass into the time-of-flight mass spectrometer chamber and are detected using a multi-channel plate (MCP) detector. This method can provide a quantitative measure of each species' concentration (in µg m−3). Ionisation efficiency calibrations were carried out before and after the campaign, using 300 nm ammonium nitrate particles. More information on this instrument's operation during this campaign has been reported by Kumar et al. (2022).
NOx measurements were carried out using a Serinus 40 Oxides of Nitrogen (NOx) analyser (ECOTECH Pty Ltd, Australia). This instrument was calibrated at multiple concentration levels, using the calibrator and standard gas cylinder before and after the campaign. The limit of detection was around 0.4 ppbv. A scanning mobility particle sizer (SMPS; GRIMM Aerosol Technik) provided size-binned measurements of the dry fine aerosol number concentration between 19 nm and 1 µm. A proton transfer reaction time-of-flight mass spectrometer (PTR-ToF-MS; Ionicon Analytik GmbH, Innsbruck, Austria) was used to measure the larger VOCs, and smaller VOCs were observed using an airmoVOC C2C6 analyser, model A22022 (CHROMATOTEC®, France).
Sampling for the NOx analyser, O3 analyser (Model 202 Ozone Monitor™; 2B Technologies), and SMPS was conducted via a 6 mm inner diameter stainless steel inlet of 3 m length, with an ambient particulate matter (APM2.5) cyclone (BGI, Mesa Labs, Inc., Lakewood, CO, USA) installed to remove larger particles (Kumar et al., 2022). The inlets extended around 1.5 m horizontally from the building's NNW side, around 12 m above the ground. Global radiation was measured on the roof of the building, and other meteorological parameters including temperature, relative humidity, wind speed, and wind direction were supplied by the Indian Meteorological Department (IMD). The measurement location for these was Indira Gandhi International Airport, which is situated approximately 8 km to the west of our field site.
2.4 Zero-dimensional chemical box model
A simple 0-dimensional (0-D) chemical box model was constructed in order to investigate the relative influence of N2O5 sources and sinks. The model was used to calculate concentrations of N2O5 and NO3, based on values in the previous step, with a time step of 0.04 s and a spin-up period of 24 h. The reactions included in the model are outlined in Table S1 (Brown et al., 2003; Yan et al., 2019).
Here, kVOC,icorresponds to the reaction rate constant of each individual volatile organic compound (VOC; in s−1) and [VOC]i to the concentration of the VOC, as measured by the PTR. The heterogeneous reaction rates for N2O5 and NO3 at particle surfaces (R6 and R7 in the Supplement) rely on and , the average molecular speed of an N2O5 or NO3 molecule (), the uptake coefficients for N2O5 or NO3 ( and , respectively), and the available aerosol surface area (SA). These last two aspects are outlined in more detail in the Supplement. The molecular speeds were calculated for each species X using Eq. (1) (Morgan et al., 2015), where k is Boltzmann's constant ( m2 kg s−2 K−1), T represents the temperature in Kelvin, and MW is the molecular weight.
Box model results were compared with results from a simple steady-state approach. Using the steady-state approximation, it was possible to calculate NO3 concentrations using Eq. (2) and N2O5 concentrations using Eq. (3) (Osthoff et al., 2006; Brown et al., 2005).
Here, square brackets denote the concentration of the respective compound (in molec. cm−3). Calculated concentrations of both species were found to agree closely with results from the box model, indicating that the steady-state approximation is reasonable in this case. Therefore, the simpler steady-state approach was used for the results presented here.
Time series data of NO, NO3, O3, VOCs, global radiation, temperature, and wet particle surface area are used as direct inputs for Reactions (R1)–(R7) (see the Supplement). The chemical compositions of VOCs included in the model were C2H6, C2H4, C3H8, C4H10, C6H14, C6H6, C7H8, C8H10, C9H12, C5H8, and C10H16, which are all common urban VOCs that were observed in Delhi by the PTR. Measurements were not available for some of the more abundant VOCs in Delhi, such as methanol and acetone (Tripathi et al., 2022), and as such, the magnitude of the VOC sink is likely an underestimate. Nevertheless, this sink was minimal compared with the NO3 loss via interaction with NO and photolysis. This underestimate is therefore unlikely to result in a substantial impact on the estimated N2O5 concentration. This model does not account for effects due to dilution, mixing, or other atmospheric dynamics. However, much of this will already be accounted for due to changes in the input parameters (NO, NO3, O3, and VOCs). More details about the calculation of various input parameters can be found in the Supplement. The planetary boundary layer height (PBLH) displayed in Fig. 2 and the friction velocity (U*) were obtained from the Real-time Environmental Applications and Display sYstem (READY; Rolph et al., 2017) website and was available at 3 h resolution.
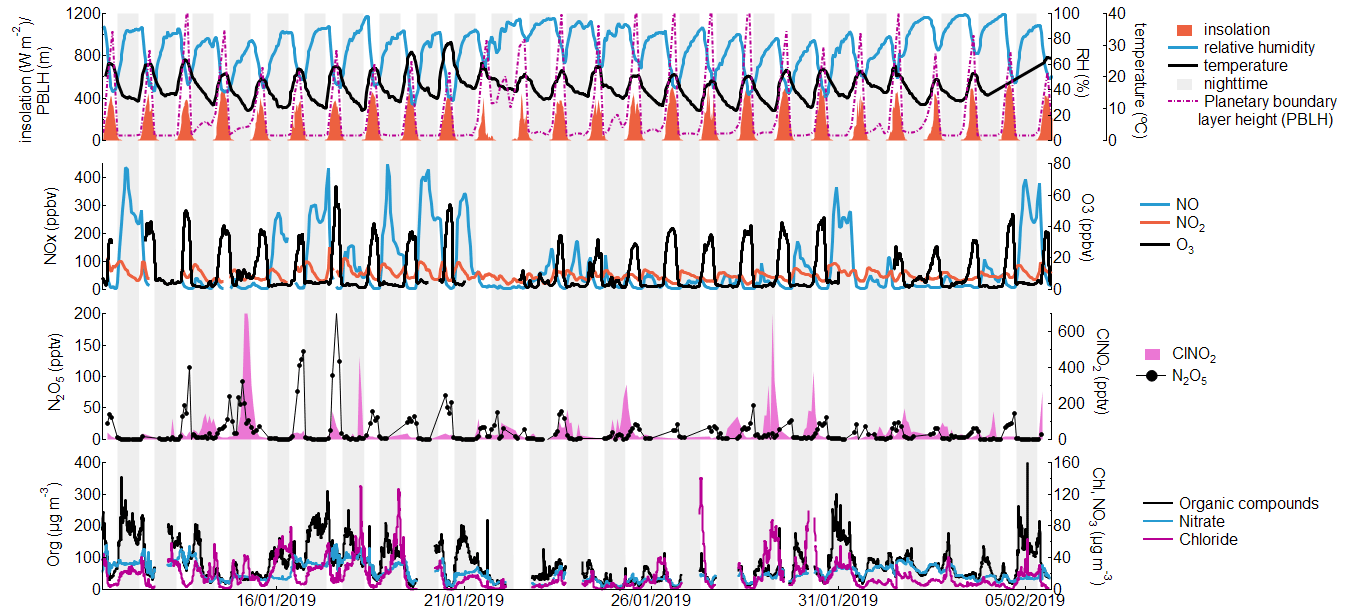
Figure 2Full campaign time series of key species and meteorological parameters. Grey and white backgrounds represent nighttime and daytime, respectively.
The campaign-averaged diel cycles were used for each input parameter. These diel averages for each compound were constructed by binning all measurements according to the time at which they were taken and calculating the mean for each hour of the day across the whole campaign.
2.5 The Framework for 0-D Atmospheric Modeling (F0AM)
The F0AM model (Wolfe et al., 2016) is a 0-dimensional box model that can be used to simulate atmospheric chemistry systems. Here, we used the Master Chemical Mechanism (MCM) 3.3.1 chemistry, which was extended to include reactions for chlorine chemistry (Riedel et al., 2014). The latter included reactions of Cl with a series of VOCs and further reactions of their oxidation products.
Observed values of NOx, CO, HONO, HNO3, ClNO2, ClONO2, HOCl, Cl2, and a series of VOCs (Fig. S4; Table S2) were used as model inputs. A 24 h diel cycle was modelled from 00:00 LT, with a 48 h spin-up period. The model produced one data point per hour. We used the MCM radiation model, which represents typical tropospheric conditions but does not reflect variability in the ozone column, surface albedo, aerosol optical depth, and clouds (Wolfe et al., 2016). The modelled diel cycle of O3 was used to scale the model's photolysis parameter by comparing the calculated O3 with observed values, which resulted in a photolysis scaling factor of 0.25.
The model was used to estimate the concentrations of the oxidants OH, NO3, and O3 and to explore the relative importance of different oxidation compounds for oxidation of different VOCs, with varying contributions from Cl.
3.1 Campaign overview
Figure 2 shows a time series of meteorological conditions and pollutant concentrations including NOx, O3, ClNO2, N2O5 and particulate organics, nitrate, and chloride during the field campaign in January and February 2019. During this period, the average daily maximum temperature was 22.7 ∘C, with a range from 19.0 to 31.1 ∘C, and the average nighttime minimum temperature was 12.0 ∘C, ranging from 9.3 to 16.2 ∘C. Temperatures were reasonably stable throughout the campaign, with a slight peak around 20 January. Relative humidities were higher at night, with an average low of 46.8 % during the day and high of 89.1 % at night. For these calculations, an average campaign sunrise time of 07:12 LT and sunset time of 17:53 LT was used to split the data into daytime and nighttime values.
Ozone concentrations reached an average of 43 ppbv during the day but were very low at night, with usually just 2 or 3 ppbv. Concentrations of NO, in contrast, were highest during the night, with a mean of 84 ppbv in comparison with 22 ppbv during the day. This is an unusual feature and is likely a consequence of more heavy-duty vehicles using the roads at night due to daytime restrictions (Tobler et al., 2020), combined with the low nighttime boundary layer height (Raj et al., 2021) and low nocturnal O3 levels limiting the conversion of NO to NO2. Less diurnal difference was shown by NO2, which averaged around 36 ppbv throughout the campaign, with small peaks in the morning and the evening. Particulate organic concentrations were very high during nighttime periods, regularly exceeding 200 µg m−3, and reducing to an average of 61 µg m−2 during the day, primarily as a result of dilution caused by the change in the boundary layer height. Particulate chloride was enhanced in the early mornings, sometimes exceeding concentrations of 100 µg m−3. These values are consistent with previous studies carried out in Delhi, which have shown the city to have among the highest levels of particulate chloride measured anywhere in the world (Gani et al., 2019; Gunthe et al., 2021).
Similarly high concentrations of NO and low concentrations of O3 at night have been observed in previous wintertime studies in Delhi. For example, Nelson et al. (2021, 2023) observed a very similar diel NO and O3 pattern to that displayed here in October–November 2018. In a year-long study, Sharma et al. (2021) demonstrated that these high nighttime NOx concentrations last from September until May, while nighttime O3 was found to reach a minimum during November and December. Previous observations of aerosol concentrations are similarly consistent with our observations; during October and November 2018, Gunthe et al. (2021) observed aerosol concentrations with a strong nocturnal increase. Gani et al. (2019), in a long-term study, showed that this pattern holds throughout the winter (December–mid-February) and, more weakly, during the spring (February–March). The same study indicates that particulate chloride concentrations are highest during the winter and extremely low during the summer. We therefore anticipate that conclusions from our own study are likely to be most relevant in Delhi from October until March.
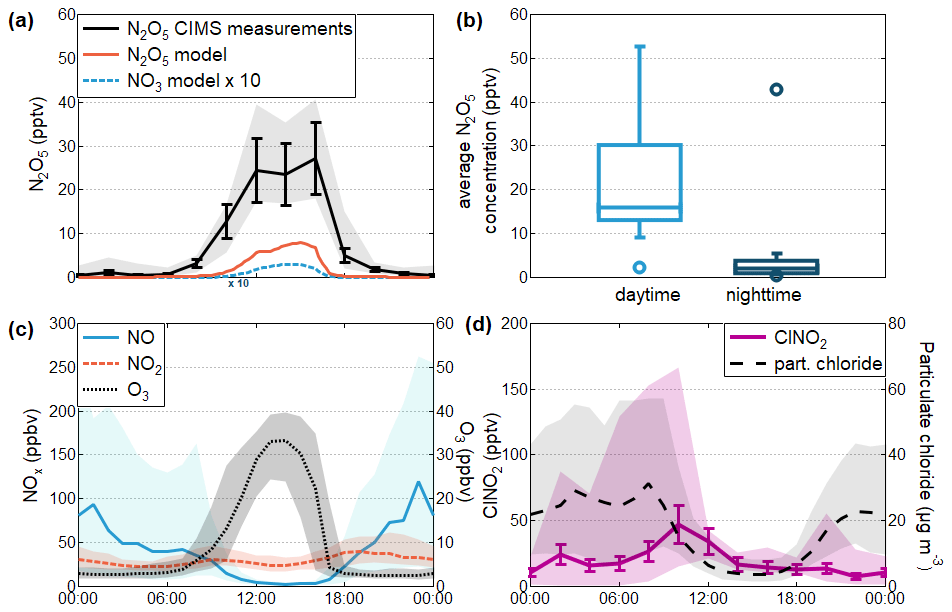
Figure 3Median diel patterns during the period from 11 January–5 February 2019 for the key compounds explored in this study. (a) The median diel cycle of N2O5 measured by the FIGAERO-CIMS, with the interquartile range shaded, alongside the N2O5 and NO3 simulations from the 0-D box model. Error bars indicate a potential 30 % error in the estimated calibration constant. (b) Box plots showing the average N2O5 concentrations throughout the campaign during the day and the night, as measured by the FIGAERO-CIMS, indicating that there is a distinct and consistent decrease in N2O5 concentrations at night. (c) The observed median diel patterns of the precursor species NO, NO2, and O3 are shown, with the interquartile ranges shaded. (d) The observed diel pattern of ClNO2 and particulate chloride throughout the campaign. The error bars here, as in panel (a), represent a 30 % potential calibration error.
3.2 Unusual diel patterns in Delhi
Figure 3a shows the average diel cycle of N2O5, as measured by the FIGAERO-CIMS from 11 January to 5 February 2019. The mean daytime concentration of N2O5 during the measurement period was 21.9 pptv (parts per trillion by volume; standard deviation 29.3 pptv; median 16.0 pptv), compared with a nighttime mean of 4.4 (standard deviation 11.3 pptv; median 2.0 pptv; Fig. 3b). A simple 0-dimensional chemical box model was designed to investigate the driving factors behind this inverted N2O5 pattern in more detail. This simple model successfully recreated the shape of the N2O5 diurnal pattern observed in the FIGAERO-CIMS dataset (Fig. 3a) and indicated that NO3 is likely to follow a similar diel cycle.
Model results demonstrate that the diurnal NO3 and N2O5 patterns were influenced most strongly by NO. Our observations show high nighttime concentrations of NO, which diminish considerably during the day (Fig. 3c). This pattern has been observed previously in Delhi and is generally attributed to the low, stable nocturnal boundary layer (Stewart et al., 2021) in combination with substantial NOx sources, such as heavy-duty traffic and biomass burning, which are strongly present at night (Mishra et al., 2023). These nighttime NO levels deplete O3 to extremely low concentrations, leaving an excess of NO. Together, these effects ensure that during the night, the destruction of NO3 by NO is at its highest and its production, which requires O3, is at its lowest. In contrast, the presence of O3 and NO2 during the day, coupled with little daytime NO (itself a result of both boundary layer dynamics and reactions with daytime O3 and peroxy radicals), results in higher daytime concentrations of NO3 and N2O5 being sustained than would typically be possible.
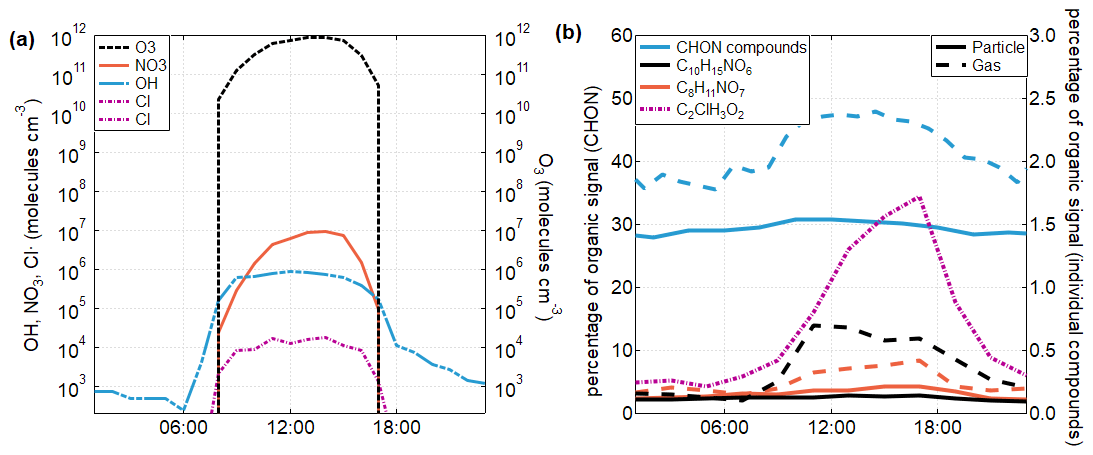
Figure 4The diel cycles of key oxidants and oxidation products in Delhi during the study period. (a) The diel cycle of four key oxidants, namely O3, Cl, NO3, and OH. The Cl concentration has been estimated from chlorine-containing species observed by the FIGAERO-CIMS (Sect. 2). Estimated concentrations of the other three oxidants are calculated using the Framework for 0-D Atmospheric Modeling (F0AM) chemical box model (Wolfe et al., 2016; see Sect. 2). (b) The diel cycles of total N-containing organics in the gas and particle phases (blue), with selected compounds of C8H11NO7 (orange) and C10H15NO6 (black) also displayed in both the gas and particle phases. These two compounds, both associated with NO3 oxidation, are most prevalent during the day when the NO3 concentration peaks, while compounds associated with biomass burning are more prevalent at night (Fig. S6). The diel cycle of C2H3O2Cl, a known tracer of Cl chemistry, is shown in pink. These compounds were not calibrated, so here the percentage contribution of each compound or group of compounds towards the total organic signal is displayed on the y axes.
Our modelled N2O5 concentrations are around a two-thirds lower than those observed. Combined with the observed mid-morning peak in ClNO2 (Fig. 1d), this is an indication that the nighttime production of both N2O5 and ClNO2 continues to some extent in the residual layer, which is decoupled from the urban canopy layer in which our measurements take place. After sunrise and the ensuing atmospheric instability, the N2O5 and ClNO2 from the nocturnal residual layer is likely incorporated into the daytime mixed layer and transported by turbulence downwards to the measurement system (Fig. S5). In this study, atmospheric mixing has been quantified using friction velocity (U*) as a scale of the vertical transport of momentum (turbulence). It is presented here as 1 h means to smooth the stochastic nature of high-frequency turbulence and enable the diurnal trend in atmospheric mixing (which occurs over a period of hours) to be viewed more clearly. It can be seen in Fig. S5 that nighttime concentrations of ClNO2 are highest with greater atmospheric mixing, supporting the hypothesis that during periods of poor atmospheric mixing the measurement system (which is relatively close to the ground level) is decoupled from air masses above the urban canopy layer that contain higher concentrations of ClNO2. Based on the discrepancy between the model and observations for N2O5 (Fig. 3a) and on the difference between average nocturnal concentrations and the morning peak for ClNO2 (Fig. 3d), we estimate that an average of approximately 18±3 pptv of N2O5 and 12±3 pptv of ClNO2 is mixed from the residual layer into the surface layer from above in the mornings, increasing the overall influence of both species during the day.
In addition to model results, oxidation products observed by the FIGAERO-CIMS provide evidence that Cl is an important oxidant in Delhi and that oxidation with NO3 takes place during the day. Chloroacetic acid (C2H3O2Cl) has previously been designated a tracer compound to indicate the presence of Cl oxidation (Le Breton et al., 2018; Priestley et al., 2018) and was observed here, exhibiting a strong diurnal pattern (Fig. 4b). Similarly, a number of individual compounds that have previously been observed in conjunction with the nighttime NO3 oxidation of monoterpenes were observed primarily as daytime species during this campaign, with the examples of C8H11NO7 (Ye et al., 2021; Lee et al., 2016) and C10H15NO6 (Ye et al., 2021; Boyd et al., 2015) displayed here (Fig. 4b). While it is also possible for these CHON compounds to originate from RO2+NO reactions during OH-initiated oxidation, the difference in the diurnal cycle here from that observed in other locations indicates a contribution from daytime NO3. The nitrogen-containing organic compounds (e.g. CHON) that increased most strongly during the night were all found to be associated with primary biomass burning emissions (Mishra et al., 2023) and not oxidation products (Fig. S6). The overall contribution of CHON as a fraction of total organics increased slightly during daylight hours (Fig. 4b), particularly in the gas phase, while results from other parts of the world have typically found the contribution of CHON to increase slightly at night as a result of NO3 oxidation (Ye et al., 2021; Huang et al., 2019). In addition, it is possible for CHON compounds present during the night to have originated from RO2+NO reactions during OH-initiated oxidation. Daytime peaks in NO3 oxidation products will likely result from both daytime oxidation by NO3 within the surface layer and the mixing down of products from nocturnal oxidation taking place within the elevated residual layer. Given that the other important urban oxidants, OH and O3, in addition to Cl, also display daytime maxima, all four key oxidants can be considered daytime species in this environment. As a corollary, there are no significant nocturnal oxidants in the surface layer.
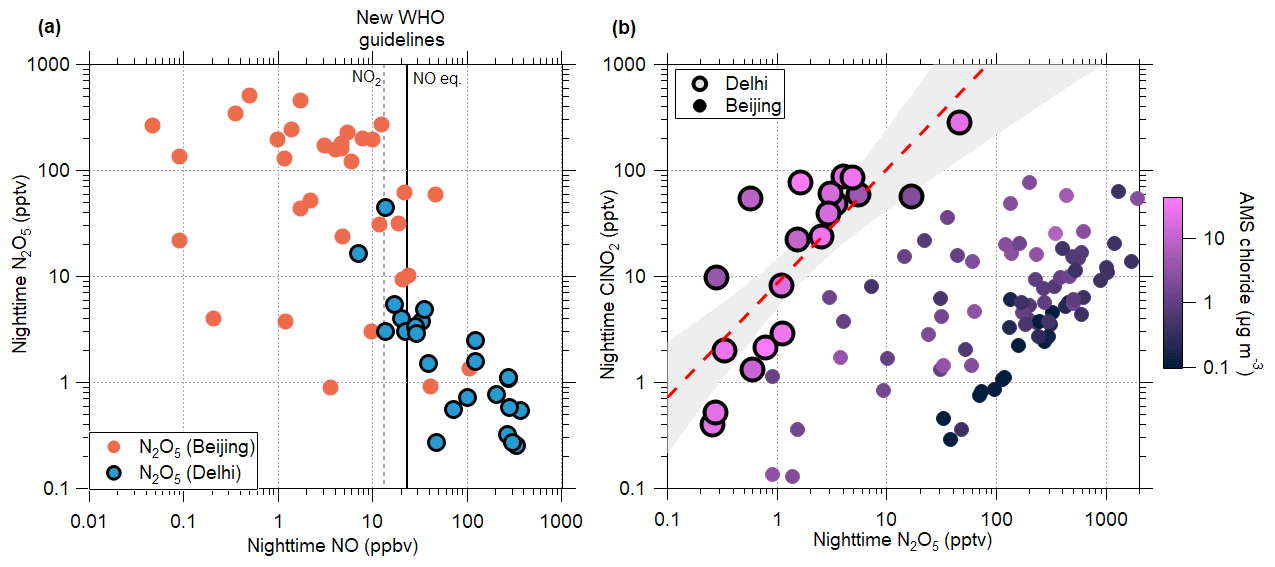
Figure 5Relationships between nighttime ClNO2, N2O5, and NO during the study period. (a) Average nocturnal concentrations of N2O5 plotted against average nocturnal concentrations of NO for our campaign results from Delhi and from measurements in Beijing from 2020. The new 24 h WHO guideline for NO2 concentrations is displayed by the dashed grey line, with the calculated NO equivalent shown by the solid black line. (b) Relationship between nocturnal ClNO2 and N2O5. Colouring shows the average particulate chloride concentration, as measured by the AMS. The dashed red line shows the least squares regression line for the Delhi dataset, with 95 % confidence intervals shown in grey. The equation for the line is given by the equation . Data points from between 20:00 and 05:00 LT on the following morning are included.
One of the consequences of this shift away from nighttime NO3 within the urban canopy layer is that very little oxidation from any oxidant takes place at the time when submicron particulate matter (PM1) is at its most concentrated; our observations show that PM1 more than doubles from day to night (Fig. S7a). A previous investigation of the organic aerosol chemical speciation during this campaign, using positive matrix factorisation on the aerosol mass spectrometer (AMS) and extractive electrospray ionisation mass spectrometer (EESI) data, shows that factors associated with oxidation reactions are enhanced during the day in Delhi, while the particulate matter present during the night is the least oxidised (Kumar et al., 2022). The average oxygen to carbon (O:C) ratio of particulate matter during this campaign has been found to be unusually low, compared with a global dataset of FIGAERO-CIMS observations in different environments (Huang et al., 2023); the O:C ratio of particulate matter observed by the CIMS during this campaign was 0.7, compared with values between 0.75 and 0.95 observed elsewhere. If the distribution of oxidants were to change, then this would likely increase the SOA mass in the region. Such a change could come about if nocturnal NO were to decrease, thereby increasing nocturnal concentrations of NO3 and N2O5 and allowing larger quantities of ClNO2, and therefore Cl radicals, to be produced.
3.3 The potential influence of changes to the diel pattern
Figure 5a shows the relationship between nighttime average NO and N2O5 concentrations in Delhi. It can be seen here that as NO concentrations during the night decrease, the N2O5 produced increases substantially. Data from this campaign are displayed alongside observations from Beijing, which were carried out during January 2020. The sampling site for the campaign in Beijing was in the west campus of the Beijing University of Chemical Technology (BUCT). Measurements were taken from the top floor of a five-storey building at a height of approximately 20 m. The location is comparable to that of the site in Delhi; it is influenced by local pollution sources including traffic, residential heating, and cooking emissions (Cai et al., 2022), and it can similarly be considered to be an urban background site. Similar to Delhi, Beijing is a polluted urban centre with a notable contribution from chloride in the particle phase, albeit around 17 times lower than Delhi, on average, based on observations presented here.
The concentrations of N2O5 in Beijing display a more typical diel pattern, with higher values at night. Nighttime N2O5 regularly exceeds 100 pptv in Beijing, while Delhi's value generally remains below 10 pptv. (In this analysis, nighttime averages are taken between 20:00 and 05:00 LT on the following morning in order to prevent residual influence from daytime processes.) The comparison between the two cities allows us to understand more about the impact of Delhi's unusual NOx cycle on atmospheric chemistry. When the two cities have some overlap in nighttime NO concentrations, the quantity of N2O5 produced at night is roughly comparable. However, the majority of nights in Beijing have much lower NO concentrations than any observed in Delhi; at these lower concentrations, much more N2O5 can be produced, in some cases reaching close to 1 ppbv. There is a larger spread in N2O5 concentrations during nights with low NO because other factors such as the amount of available NO2 and O3 also have an impact on N2O5 formation. It is important to note that the lower temperatures in Beijing (where the mean campaign temperature was around 3.4 ∘C, compared with 16.8 ∘C in Delhi) will contribute towards the higher N2O5 concentrations.
There are two key reasons for the substantial difference in the nocturnal NO concentrations between the two cities. First, emissions inventories indicate that vehicular emissions of NOx decrease by around 90 % during the night in Beijing (Jing et al., 2016), compared with a decrease of only around 40 % in Delhi (Biswal et al., 2023). Due to traffic regulations restricting the movement of heavy-duty vehicles during the day, there is increased movement of these vehicles at night in Delhi (Tiwari et al., 2015), leading to greater nocturnal NOx emissions than can be found in other comparable cities. Second, the median boundary layer height during the night in winter in Beijing has been reported to be around 100 m (Yang et al., 2020), while data from READY during this campaign (Fig. 2) indicate a nocturnal boundary layer height of 50 m or even lower. As a result, comparable NOx emissions would result in double the concentration, or even more, in Delhi, compared with Beijing. Together, these factors result in the high nocturnal NO concentrations in Delhi when compared with Beijing.
The World Health Organization (WHO) published new air quality guidelines in 2021 (World Health Organization, 2021), which include a 24 h guideline and annual thresholds of 25 and 10 µg m−3 (∼13.4 and 5.3 ppbv), respectively, for NO2. Our observations show that during the night in Delhi, NO makes up on average 64 % of NOx (NO+NO2; Fig. S7b). Approximate nighttime NO equivalent thresholds of around 23.8 ppbv in 24 h or 9.4 ppbv annually can therefore be established. This NO equivalent threshold is displayed in Fig. 5a and can be used to separate the data into two regimes, with nights above the threshold being considered to be “high NO” and those below to be “low NO”. The majority of nights in Delhi fall within the high NO regime, while the majority of those in Beijing fall into the low NO regime. Within the high NO regime, the average N2O5 concentration across both datasets is 4.1 pptv, while in the low NO regime, the average N2O5 concentration per night is 220 pptv. The overlap between NO concentrations in the two cities suggests that it is possible for changes in environmental conditions to shift the atmosphere from one regime to the other; there were some nights during which high NO concentrations in Beijing suppressed the formation of N2O5, and there were some nights in Delhi during which low NO concentrations allowed more production of N2O5. These results suggest that if nighttime NO concentrations were to be reduced in line with WHO guidance, then there would likely be a substantial increase in the nighttime production of N2O5.
The relationship between nighttime N2O5 and ClNO2 observations for both Delhi and Beijing can be seen in Fig. 5b. For a given concentration of particulate chloride, larger nighttime concentrations of N2O5 result in the production of more ClNO2, as it increases the number of interactions at the surface of chloride-containing particles. These two datasets together show that, as the ambient concentration of particle-phase chloride increases, this reaction is able to take place more readily, and the ratio of ClNO2 to N2O5 also increases. This results in much higher quantities of ClNO2 being produced in Delhi, with its higher particulate chloride, for a given concentration of N2O5, compared to Beijing. A linear regression line was fitted to the log of the Delhi dataset to demonstrate this relationship, which has an r2 of 0.58. This pattern indicates that if nighttime N2O5 concentrations in Delhi were to increase to values as high as those found in Beijing, the high availability of particle-phase chloride could result in ClNO2 production being exponentially higher than it is at present. Following the current trend line, an increase in nighttime N2O5 to 115 pptv – the log-weighted average from the Beijing dataset – would increase the ClNO2 concentrations in Delhi to an average of 1450 pptv, 2 orders of magnitude higher than the current log-weighted average of 14 pptv.
We used the F0AM box model (Wolfe et al., 2016; Riedel et al., 2014) to investigate the relative contributions of Cl and NO3 radicals as oxidants for two common VOCs, α-pinene and toluene, under three simulated scenarios. In scenario 1, we used the average diel NOx concentrations displayed in Fig. 3a as input parameters for the F0AM model. This represents the baseline case. Scenario 2 uses NOx and O3 data from a case study day on 15 January 2019. This date was chosen as it includes the night that exhibited the lowest nighttime NO and highest O3 during the campaign, leading to the production of a comparatively large amount of ClNO2, which peaked at 715 pptv. Data were extracted between 18:00 LT on 14 January and 18:00 LT on 15 January 2019, replicated, and concatenated to form a full diel cycle. This case study represents the most extreme example of the low NO regime observed during our measurement period. Finally, scenario 3 features NOx and O3 input parameters that have been taken from the Beijing dataset displayed in Fig. 5 as a stand-in for a more conventional diel cycle in a similarly polluted city. Average sunrise and sunset times differed by only 11 and 13 min, respectively, between the two campaigns, which indicates that the timing of concentration changes is likely to be appropriate for the model. The NO and NO2 maxima and diel patterns are comparable to those observed in Punjab, north of Delhi (Meidan et al., 2022), indicating that they are conceivable for the region. The Beijing dataset was used here because the maximum O3 concentrations and sunrise and sunset times are more closely comparable with those in Delhi at this time of year. The concentration of ClNO2 was fixed at the beginning of the model run to the highest nighttime value in scenario 2 and to 1.45 ppbv in scenario 3, which has been calculated from the fit line in Fig. 5, based on measured N2O5 concentrations in Beijing. The ClNO2 was then depleted throughout the model run by photolysis to create oxidising Cl radicals. Scenario 3 is not intended to be a prediction of future atmospheric chemistry in Delhi. Rather, it represents a highly idealised scenario that can be used to explore the potential ramifications of substantial changes to the NOx and O3 cycle in the context of Delhi's polluted and chlorine-rich environment.
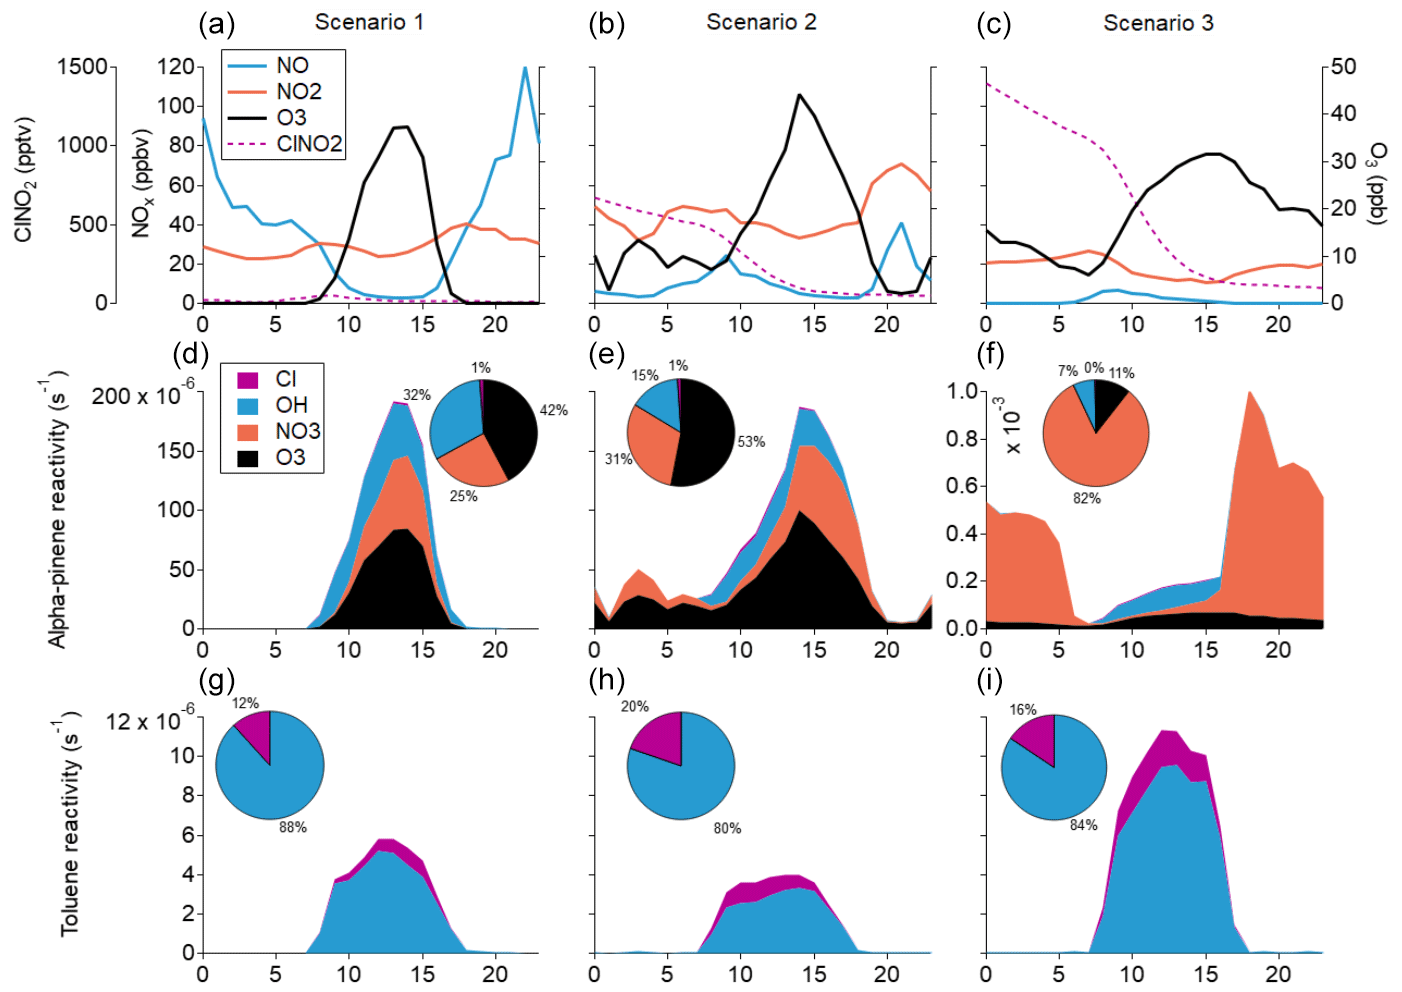
Figure 6The reactivity of toluene and α-pinene under three simulated scenarios. Panels (a)–(c) show the NO, NO2, O3, and ClNO2 concentrations for scenarios 1, 2, and 3, respectively. In all three cases, NO and NO2 values in the model are held to the measurements, as is O3 in scenarios 2 and 3. For ClNO2, the initial value is fixed and evolves throughout the model run for scenarios 2 and 3. Panels (d)–(f) indicate the reactivity of α-pinene in scenarios 1, 2, and 3, respectively, and panels (g)–(i) show the reactivity of toluene.
The results of these model runs are shown in Fig. 6. In scenario 1, which represents the current situation in Delhi, Cl is responsible for 12 % of the toluene oxidation, indicating that it is already a major oxidant in the city. No NO3 is produced during the night in this scenario, but as a result of its presence during the day, 25 % of the α-pinene oxidation is initiated by NO3. During scenario 2, the higher ClNO2 concentration results in almost a doubling of the proportion of toluene oxidised by Cl to 20 %. In addition, the slight increase in nighttime NO3 and O3 results in some nighttime oxidation of α-pinene taking place. This indicates that nighttime oxidation is taking place in Delhi, although it is largely restricted to nights that fall within the low NO regime. In this case, NO3 is responsible for 31 % of the α-pinene oxidation.
Scenario 3 shows a substantial increase in nighttime oxidation from NO3 and daytime oxidation from Cl, due to the large nocturnal concentration of O3 that is sustained alongside the lack of NO. Here, the large increase in nighttime NO3 production, coupled with the increase in VOC concentrations during the night, leads to NO3 becoming the key oxidant for α-pinene, accounting for 82 % of its reactivity. Concerning the toluene reactivity, only 16 % is initiated by Cl in this case, which is largely due to the associated increase in OH oxidation. In fact, the Cl-initiated toluene reactivity in scenario 3 is almost double that of scenario 2.
The analysis presented here demonstrates that the diel cycles of the typically nocturnal species NO3 and N2O5 are inverted during the winter in Delhi's surface layer. This is due to the presence of large concentrations of NO during the night; which is the result of the nighttime compression of the boundary layer, coupled with large nighttime emissions of NOx. This nocturnal NO depletes NO3 during the night and therefore results in both NO3 and N2O5 consistently peaking during the day. This unique diel chemical pattern limits the formation of nighttime ClNO2. Despite this constraint on ClNO2 formation, the extremely high particulate chloride loadings available in Delhi still result in enough Cl production for it to be an important atmospheric oxidant. Model simulations carried out here using the F0AM model demonstrate that the role of Cl as an oxidant of toluene could be more than 10 times higher if the diel cycle of NOx were more representative of that observed in comparable urban atmospheres such as Beijing. Similarly, the role of NO3 as an oxidant of α-pinene was shown to be around 30 times lower in Delhi than it would be if the NOx pattern were more typical. This is a particularly significant difference from the majority of urban centres, as NO3 would otherwise be the only oxidant that is most prominent during the night, when the concentration of particulate matter is at its highest.
A number of clean-air policies, including the latest update to the WHO guidelines on ambient air pollution (World Health Organization, 2021), emphasise the control of NOx pollution in urban environments. This study highlights the complexity of atmospheric chemistry in a highly polluted urban environment and indicates that it is important to monitor the impacts of changes to specific species. Given the delicate chemical balance in Delhi's winter atmosphere, there is potential for significant changes in nighttime NO pollution to result in increased production of NO3 and N2O5 in the surface layer. Such a change could be initiated by, for example, a reduction in nocturnal vehicle emissions. Our results indicate that both NO3- and Cl-initiated oxidation could be substantially increased if the diurnal cycle for NOx in Delhi were more representative of that seen in other major cities; this would increase the formation of SOA and therefore worsen urban haze. We strongly recommend careful monitoring of NOx, O3, and particulate chloride levels in Delhi, as there is potential for disruption to the NOx cycle. It is important for more research to be undertaken into this problem in order to understand the potential ramifications in more depth. Given the importance of boundary layer dynamics for pollutant concentrations, and the potential influence of N2O5 and ClNO2 formation in the residual layer, we would recommend that future projects in Delhi incorporate a vertical component. This could include measurements being made at different heights or vertical box modelling, which would contribute substantially towards a more complete understanding of the processes explored here.
Data referenced in this study are available in the Bolin Centre Database (http://bolin.su.se/data/, Bolin Centre Database, 2023).
The supplement related to this article is available online at: https://doi.org/10.5194/acp-23-9023-2023-supplement.
The concept for this paper was established by SLH and CM, with input from DMB, JT, UB, ASHP, and SNT. The investigation and measurements were carried out by SLH, VK, DSW, SM, NR, AS, DG, FZ, YL, WN, YL, WM, CY, KRD, and CM. MK, UB, ASHP, SNT, and CM acquired funding for this project. The writing was carried out by SLH. Reviewing and editing was undertaken with input from all co-authors.
At least one of the (co-)authors is a member of the editorial board of Atmospheric Chemistry and Physics. The peer-review process was guided by an independent editor, and the authors also have no other competing interests to declare.
Publisher's note: Copernicus Publications remains neutral with regard to jurisdictional claims in published maps and institutional affiliations.
This research has been supported by the Knut och Alice Wallenbergs Stiftelse (grant no. 2017.0165), the Central Pollution Control Board (CPCB), Government of India (grant no. AQM/Source apportionment_EPC Project/2017), the SDC Clean Air Project in India (grant no. 7F-10093.01.04), and the Schweizerischer Nationalfonds zur Förderung der Wissenschaftlichen Forschung (grant nos. 2000021_169787, P2EZP2_181599, and PZPGP2_201992).
This paper was edited by Lea Hildebrandt Ruiz and reviewed by two anonymous referees.
Biswal, A., Singh, V., Malik, L., Tiwari, G., Ravindra, K., and Mor, S.: Spatially resolved hourly traffic emission over megacity Delhi using advanced traffic flow data, Earth Syst. Sci. Data, 15, 661–680, https://doi.org/10.5194/essd-15-661-2023, 2023.
Bolin Centre Database: Open access to Climate and Earth System Data, http://bolin.su.se/data/ (last access: 4 August 2023), 2023.
Boyd, C. M., Sanchez, J., Xu, L., Eugene, A. J., Nah, T., Tuet, W. Y., Guzman, M. I., and Ng, N. L.: Secondary organic aerosol formation from the β-pinene+NO3 system: effect of humidity and peroxy radical fate, Atmos. Chem. Phys., 15, 7497–7522, https://doi.org/10.5194/acp-15-7497-2015, 2015.
Brown, S. S., Stark, H., and Ravishankara, A. R.: Applicability of the steady state approximation to the interpretation of atmospheric observations of NO3 and N2O5, J. Geophys. Res.-Atmos., 108, 4539, https://doi.org/10.1029/2003JD003407, 2003.
Brown, S. S., Osthoff, H. D., Stark, H., Dubé, W. P., Ryerson, T. B., Warneke, C., de Gouw, J. A., Wollny, A. G., Parrish, D. D., Fehsenfeld, F. C., and Ravishankara, A. R.: Aircraft observations of daytime NO3 and N2O5 and their implications for tropospheric chemistry, J. Photochem. Photobiol. A, 176, 270–278, https://doi.org/10.1016/j.jphotochem.2005.10.004, 2005.
Cai, J., Wu, C., Wang, J., Du, W., Zheng, F., Hakala, S., Fan, X., Chu, B., Yao, L., Feng, Z., Liu, Y., Sun, Y., Zheng, J., Yan, C., Bianchi, F., Kulmala, M., Mohr, C., and Daellenbach, K. R.: Influence of organic aerosol molecular composition on particle absorptive properties in autumn Beijing, Atmos. Chem. Phys., 22, 1251–1269, https://doi.org/10.5194/acp-22-1251-2022, 2022.
Dhulipala, S. V., Bhandari, S., and Hildebrandt Ruiz, L.: Formation of oxidized organic compounds from Cl-initiated oxidation of toluene, Atmos. Environ., 199, 265–273, https://doi.org/10.1016/j.atmosenv.2018.11.002, 2019.
Gani, S., Bhandari, S., Seraj, S., Wang, D. S., Patel, K., Soni, P., Arub, Z., Habib, G., Hildebrandt Ruiz, L., and Apte, J. S.: Submicron aerosol composition in the world's most polluted megacity: the Delhi Aerosol Supersite study, Atmos. Chem. Phys., 19, 6843–6859, https://doi.org/10.5194/acp-19-6843-2019, 2019.
Geyer, A., Alicke, B., Ackermann, R., Martinez, M., Harder, H., Brune, W., Carlo, P. di, Williams, E., Jobson, T., Hall, S., Shetter, R., and Stutz, J.: Direct observations of daytime NO3: Implications for urban boundary layer chemistry, J. Geophys. Res.-Atmos., 108, 4368, https://doi.org/10.1029/2002JD002967, 2003.
Gunthe, S. S., Liu, P., Panda, U., Raj, S. S., Sharma, A., Darbyshire, E., Reyes-Villegas, E., Allan, J., Chen, Y., Wang, X., Song, S., Pöhlker, M. L., Shi, L., Wang, Y., Kommula, S. M., Liu, T., Ravikrishna, R., McFiggans, G., Mickley, L. J., Martin, S. T., Pöschl, U., Andreae, M. O., and Coe, H.: Enhanced aerosol particle growth sustained by high continental chlorine emission in India, Nat. Geosci., 14, 77–84, https://doi.org/10.1038/s41561-020-00677-x, 2021.
Guttikunda, S. K. and Calori, G.: A GIS based emissions inventory at 1 km × 1 km spatial resolution for air pollution analysis in Delhi, India, Atmos. Environ., 67, 101–111, https://doi.org/10.1016/j.atmosenv.2012.10.040, 2013.
Guttikunda, S. K. and Gurjar, B. R.: Role of meteorology in seasonality of air pollution in megacity Delhi, India, Environ. Monit. Assess., 184, 3199–3211, https://doi.org/10.1007/s10661-011-2182-8, 2012.
Huang, W., Saathoff, H., Shen, X., Ramisetty, R., Leisner, T., and Mohr, C.: Chemical Characterization of Highly Functionalized Organonitrates Contributing to Night-Time Organic Aerosol Mass Loadings and Particle Growth, Environ. Sci. Technol., 53, 1165–1174, https://doi.org/10.1021/acs.est.8b05826, 2019.
Huang, W., Wu, C., Gao, L., Gramlich, Y., Haslett, S. L., Thornton, J., Lopez-Hilfiker, F. D., Lee, B. H., Song, J., Saathoff, H., Shen, X., Ramisetty, R., Jiang, F., Vallon, M., and Mohr, C.: Variation in chemical composition and volatility of oxygenated organic aerosol in different rural, urban, and remote environments, in preparation, 2023.
Jing, B., Wu, L., Mao, H., Gong, S., He, J., Zou, C., Song, G., Li, X., and Wu, Z.: Development of a vehicle emission inventory with high temporal–spatial resolution based on NRT traffic data and its impact on air pollution in Beijing – Part 1: Development and evaluation of vehicle emission inventory, Atmos. Chem. Phys., 16, 3161–3170, https://doi.org/10.5194/acp-16-3161-2016, 2016.
Joshi, V.: Census of India: Provisional population totals for census 2011, Directorate of Census Operations, Delhi, https://censusindia.gov.in/census.website/ (last access: 20 February 2023), 2011.
Kercher, J. P., Riedel, T. P., and Thornton, J. A.: Chlorine activation by N2O5: simultaneous, in situ detection of ClNO2 and N2O5 by chemical ionization mass spectrometry, Atmos. Meas. Tech., 2, 193–204, https://doi.org/10.5194/amt-2-193-2009, 2009.
Kumar, V., Giannoukos, S., Haslett, S. L., Tong, Y., Singh, A., Bertrand, A., Lee, C. P., Wang, D. S., Bhattu, D., Stefenelli, G., Dave, J. S., Puthussery, J. V., Qi, L., Vats, P., Rai, P., Casotto, R., Satish, R., Mishra, S., Pospisilova, V., Mohr, C., Bell, D. M., Ganguly, D., Verma, V., Rastogi, N., Baltensperger, U., Tripathi, S. N., Prévôt, A. S. H., and Slowik, J. G.: Highly time-resolved chemical speciation and source apportionment of organic aerosol components in Delhi, India, using extractive electrospray ionization mass spectrometry, Atmos. Chem. Phys., 22, 7739–7761, https://doi.org/10.5194/acp-22-7739-2022, 2022.
Lalchandani, V., Kumar, V., Tobler, A., M. Thamban, N., Mishra, S., Slowik, J. G., Bhattu, D., Rai, P., Satish, R., Ganguly, D., Tiwari, S., Rastogi, N., Tiwari, S., Močnik, G., Prévôt, A. S. H., and Tripathi, S. N.: Real-time characterization and source apportionment of fine particulate matter in the Delhi megacity area during late winter, Sci. Total Environ., 770, 145324, https://doi.org/10.1016/j.scitotenv.2021.145324, 2021.
Le Breton, M., Hallquist, Å. M., Pathak, R. K., Simpson, D., Wang, Y., Johansson, J., Zheng, J., Yang, Y., Shang, D., Wang, H., Liu, Q., Chan, C., Wang, T., Bannan, T. J., Priestley, M., Percival, C. J., Shallcross, D. E., Lu, K., Guo, S., Hu, M., and Hallquist, M.: Chlorine oxidation of VOCs at a semi-rural site in Beijing: significant chlorine liberation from ClNO2 and subsequent gas- and particle-phase Cl–VOC production, Atmos. Chem. Phys., 18, 13013–13030, https://doi.org/10.5194/acp-18-13013-2018, 2018.
Lee, B. H., Mohr, C., Lopez-Hilfiker, F. D., Lutz, A., Hallquist, M., Lee, L., Romer, P., Cohen, R. C., Iyer, S., Kurtén, T., Hu, W., Day, D. A., Campuzano-Jost, P., Jimenez, J. L., Xu, L., Ng, N. L., Guo, H., Weber, R. J., Wild, R. J., Brown, S. S., Koss, A., Gouw, J. de, Olson, K., Goldstein, A. H., Seco, R., Kim, S., McAvey, K., Shepson, P. B., Starn, T., Baumann, K., Edgerton, E. S., Liu, J., Shilling, J. E., Miller, D. O., Brune, W., Schobesberger, S., D'Ambro, E. L., and Thornton, J. A.: Highly functionalized organic nitrates in the southeast United States: Contribution to secondary organic aerosol and reactive nitrogen budgets, P. Natl. Acad. Sci. USA, 113, 1516–1521, https://doi.org/10.1073/pnas.1508108113, 2016.
Lopez-Hilfiker, F. D., Mohr, C., Ehn, M., Rubach, F., Kleist, E., Wildt, J., Mentel, T. F., Lutz, A., Hallquist, M., Worsnop, D., and Thornton, J. A.: A novel method for online analysis of gas and particle composition: description and evaluation of a Filter Inlet for Gases and AEROsols (FIGAERO), Atmos. Meas. Tech. 7, 983–1001, https://doi.org/10.5194/amt-7-983-2014, 2014.
Meidan, D., Brown, S. S., Sinha, V., and Rudich, Y.: Nocturnal Atmospheric Oxidative Processes in the Indo-Gangetic Plain and Their Variation During the COVID-19 Lockdowns, Geophys. Res. Lett., 49, e2021GL097472, https://doi.org/10.1029/2021GL097472, 2022.
Mishra, S., Tripathi, S. N., Kanawade, V. P., Haslett, S. L., Dada, L., Ciarelli, G., Kumar, V., Singh, A., Bhattu, D., Rastogi, N., Daellenbach, K. R., Ganguly, D., Gargava, P., Slowik, J. G., Kulmala, M., Mohr, C., El-Haddad, I., and Prevot, A. S. H.: Rapid night-time nanoparticle growth in Delhi driven by biomass-burning emissions, Nat. Geosci., 16, 224–230, https://doi.org/10.1038/s41561-023-01138-x, 2023.
Morgan, W. T., Ouyang, B., Allan, J. D., Aruffo, E., Di Carlo, P., Kennedy, O. J., Lowe, D., Flynn, M. J., Rosenberg, P. D., Williams, P. I., Jones, R., McFiggans, G. B., and Coe, H.: Influence of aerosol chemical composition on N2O5 uptake: airborne regional measurements in northwestern Europe, Atmos. Chem. Phys., 15, 973–990, https://doi.org/10.5194/acp-15-973-2015, 2015.
Nelson, B. S., Stewart, G. J., Drysdale, W. S., Newland, M. J., Vaughan, A. R., Dunmore, R. E., Edwards, P. M., Lewis, A. C., Hamilton, J. F., Acton, W. J., Hewitt, C. N., Crilley, L. R., Alam, M. S., Şahin, Ü. A., Beddows, D. C. S., Bloss, W. J., Slater, E., Whalley, L. K., Heard, D. E., Cash, J. M., Langford, B., Nemitz, E., Sommariva, R., Cox, S., Shivani, Gadi, R., Gurjar, B. R., Hopkins, J. R., Rickard, A. R., and Lee, J. D.: In situ ozone production is highly sensitive to volatile organic compounds in Delhi, India, Atmos. Chem. Phys., 21, 13609–13630, https://doi.org/10.5194/acp-21-13609-2021, 2021.
Nelson, B. S., Bryant, D. J., Alam, M. S., Sommariva, R., Bloss, W. J., Newland, M. J., Drysdale, W. S., Vaughan, A. R., Acton, W. J. F., Hewitt, C. N., Crilley, L. R., Swift, S. J., Edwards, P. M., Lewis, A. C., Langford, B., Nemitz, E., Shivani, Gadi, R., Gurjar, B. R., Heard, D. E., Whalley, L. K., Şahin, Ü. A., Beddows, D. C. S., Hopkins, J. R., Lee, J. D., Rickard, A. R., and Hamilton, J. F.: Extreme Concentrations of Nitric Oxide Control Daytime Oxidation and Quench Nocturnal Oxidation Chemistry in Delhi during Highly Polluted Episodes, Environ. Sci. Technol. Lett., 10, 520–527, https://doi.org/10.1021/acs.estlett.3c00171, 2023.
Osthoff, H. D., Sommariva, R., Baynard, T., Pettersson, A., Williams, E. J., Lerner, B. M., Roberts, J. M., Stark, H., Goldan, P. D., Kuster, W. C., Bates, T. S., Coffman, D., Ravishankara, A. R., and Brown, S. S.: Observation of daytime N2O5 in the marine boundary layer during New England Air Quality Study–Intercontinental Transport and Chemical Transformation 2004, J. Geophys. Res.-Atmos., 111, D23S14, https://doi.org/10.1029/2006JD007593, 2006.
Osthoff, H. D., Roberts, J. M., Ravishankara, A. R., Williams, E. J., Lerner, B. M., Sommariva, R., Bates, T. S., Coffman, D., Quinn, P. K., Dibb, J. E., Stark, H., Burkholder, J. B., Talukdar, R. K., Meagher, J., Fehsenfeld, F. C., and Brown, S. S.: High levels of nitryl chloride in the polluted subtropical marine boundary layer, Nat. Geosci., 1, 324–328, https://doi.org/10.1038/ngeo177, 2008.
Pant, P., Shukla, A., Kohl, S. D., Chow, J. C., Watson, J. G., and Harrison, R. M.: Characterization of ambient PM2.5 at a pollution hotspot in New Delhi, India and inference of sources, Atmos. Environ., 109, 178–189, https://doi.org/10.1016/j.atmosenv.2015.02.074, 2015.
Priestley, M., le Breton, M., Bannan, T. J., Worrall, S. D., Bacak, A., Smedley, A. R. D., Reyes-Villegas, E., Mehra, A., Allan, J., Webb, A. R., Shallcross, D. E., Coe, H., and Percival, C. J.: Observations of organic and inorganic chlorinated compounds and their contribution to chlorine radical concentrations in an urban environment in northern Europe during the wintertime, Atmos. Chem. Phys., 18, 13481–13493, https://doi.org/10.5194/acp-18-13481-2018, 2018.
Rai, P., Furger, M., El Haddad, I., Kumar, V., Wang, L., Singh, A., Dixit, K., Bhattu, D., Petit, J.-E., Ganguly, D., Rastogi, N., Baltensperger, U., Tripathi, S. N., Slowik, J. G., and Prévôt, A. S. H.: Real-time measurement and source apportionment of elements in Delhi's atmosphere, Sci. Total Environ., 742, 140332, https://doi.org/10.1016/j.scitotenv.2020.140332, 2020.
Raj, S., Krüger, O. O., Sharma, A., Panda, U., Pöhlker, C., Walter, D., Förster, J.-D., Singh, R. P., S., S., Klimach, T., Darbyshire, E., Martin, S. T., McFiggans, G., Coe, H., Allan, J., R., R., Soni, V. K., Su, H., Andreae, M. O., Pöschl, U., Pöhlker, M. L., and Gunthe, S. S.: Planetary Boundary Layer Height Modulates Aerosol–Water Vapor Interactions During Winter in the Megacity of Delhi, J. Geophys. Res.-Atmos., 126, e2021JD035681, https://doi.org/10.1029/2021JD035681, 2021.
Riedel, T. P., Wolfe, G. M., Danas, K. T., Gilman, J. B., Kuster, W. C., Bon, D. M., Vlasenko, A., Li, S.-M., Williams, E. J., Lerner, B. M., Veres, P. R., Roberts, J. M., Holloway, J. S., Lefer, B., Brown, S. S., and Thornton, J. A.: An MCM modeling study of nitryl chloride (ClNO2) impacts on oxidation, ozone production and nitrogen oxide partitioning in polluted continental outflow, Atmos. Chem. Phys., 14, 3789–3800, https://doi.org/10.5194/acp-14-3789-2014, 2014.
Rolph, G., Stein, A., and Stunder, B.: Real-time Environmental Applications and Display sYstem: READY, Environ. Model. Softw., 95, 210–228, https://doi.org/10.1016/j.envsoft.2017.06.025, 2017.
Sharma, A., Sharma, S. K., and Mandal, T. K.: Ozone sensitivity factor: NOX or NMHCs?: A case study over an urban site in Delhi, India, Urban Clim., 39, 100980, https://doi.org/10.1016/j.uclim.2021.100980, 2021.
Singh, A., Rastogi, N., Kumar, V., Slowik, J. G., Satish, R., Lalchandani, V., Thamban, N. M., Rai, P., Bhattu, D., Vats, P., Ganguly, D., Tripathi, S. N., and Prévôt, A. S. H.: Sources and characteristics of light-absorbing fine particulates over Delhi through the synergy of real-time optical and chemical measurements, Atmos. Environ., 252, 118338, https://doi.org/10.1016/j.atmosenv.2021.118338, 2021.
Singh, N., Mhawish, A., Banerjee, T., Ghosh, S., Singh, R. S., and Mall, R. K.: Association of aerosols, trace gases and black carbon with mortality in an urban pollution hotspot over central Indo-Gangetic Plain, Atmos. Environ., 246, 118088, https://doi.org/10.1016/j.atmosenv.2020.118088, 2021.
Slusher, D. L., Huey, L. G., Tanner, D. J., Flocke, F. M., and Roberts, J. M.: A thermal dissociation–chemical ionization mass spectrometry (TD-CIMS) technique for the simultaneous measurement of peroxyacyl nitrates and dinitrogen pentoxide, J. Geophys. Res.-Atmos., 109, D19315, https://doi.org/10.1029/2004JD004670, 2004.
Spicer, C. W., Chapman, E. G., Finlayson-Pitts, B. J., Plastridge, R. A., Hubbe, J. M., Fast, J. D., and Berkowitz, C. M.: Unexpectedly high concentrations of molecular chlorine in coastal air, Nature, 394, 353–356, https://doi.org/10.1038/28584, 1998.
Stewart, G. J., Nelson, B. S., Drysdale, W. S., Acton, W. J. F., Vaughan, A. R., Hopkins, J. R., Dunmore, R. E., Hewitt, C. N., Nemitz, E., Mullinger, N., Langford, B., Shivani, Reyes-Villegas, E., Gadi, R., Rickard, A. R., Lee, J. D., and Hamilton, J. F.: Sources of non-methane hydrocarbons in surface air in Delhi, India, Faraday Discuss., 226, 409–431, https://doi.org/10.1039/D0FD00087F, 2021.
Thornton, J. A., Mohr, C., Schobesberger, S., D'Ambro, E. L., Lee, B. H., and Lopez-Hilfiker, F. D.: Evaluating Organic Aerosol Sources and Evolution with a Combined Molecular Composition and Volatility Framework Using the Filter Inlet for Gases and Aerosols (FIGAERO), Acc. Chem. Res., 53, 1415–1426, https://doi.org/10.1021/acs.accounts.0c00259, 2020.
Tiwari, S., Dahiya, A., and Kumar, N.: Investigation into relationships among NO, NO2, NOx, O3, and CO at an urban background site in Delhi, India, Atmos. Res., 157, 119–126, https://doi.org/10.1016/j.atmosres.2015.01.008, 2015.
Tobler, A., Bhattu, D., Canonaco, F., Lalchandani, V., Shukla, A., Thamban, N. M., Mishra, S., Srivastava, A. K., Bisht, D. S., Tiwari, S., Singh, S., Močnik, G., Baltensperger, U., Tripathi, S. N., Slowik, J. G., and Prévôt, A. S. H.: Chemical characterization of PM2.5 and source apportionment of organic aerosol in New Delhi, India, Sci. Total Environ., 745, 140924, https://doi.org/10.1016/j.scitotenv.2020.140924, 2020.
Tripathi, N., Sahu, L. K., Wang, L., Vats, P., Soni, M., Kumar, P., Satish, R. V., Bhattu, D., Sahu, R., Patel, K., Rai, P., Kumar, V., Rastogi, N., Ojha, N., Tiwari, S., Ganguly, D., Slowik, J., Prévôt, A. S. H., and Tripathi, S. N.: Characteristics of VOC Composition at Urban and Suburban Sites of New Delhi, India in Winter, J. Geophys. Res.-Atmos., 127, e2021JD035342, https://doi.org/10.1029/2021JD035342, 2022.
Wang, D. S. and Hildebrandt Ruiz, L.: Chlorine-initiated oxidation of n-alkanes under high-NOx conditions: insights into secondary organic aerosol composition and volatility using a FIGAERO–CIMS, Atmos. Chem. and Phys., 18, 15535–15553, https://doi.org/10.5194/acp-18-15535-2018, 2018.
Wang, H., Lu, K., Tan, Z., Sun, K., Li, X., Hu, M., Shao, M., Zeng, L., Zhu, T., and Zhang, Y.: Model simulation of NO3, N2O5 and ClNO2 at a rural site in Beijing during CAREBeijing-2006, Atmos. Res., 196, 97–107, https://doi.org/10.1016/j.atmosres.2017.06.013, 2017.
Wang, L., Slowik, J. G., Tripathi, N., Bhattu, D., Rai, P., Kumar, V., Vats, P., Satish, R., Baltensperger, U., Ganguly, D., Rastogi, N., Sahu, L. K., Tripathi, S. N., and Prévôt, A. S. H.: Source characterization of volatile organic compounds measured by proton-transfer-reaction time-of-flight mass spectrometers in Delhi, India, Atmos. Chem. Phys., 20, 9753–9770, https://doi.org/10.5194/acp-20-9753-2020, 2020.
Wolfe, G. M., Marvin, M. R., Roberts, S. J., Travis, K. R., and Liao, J.: The Framework for 0-D Atmospheric Modeling (F0AM) v3.1, Geosci. Model Dev., 9, 3309–3319, https://doi.org/10.5194/gmd-9-3309-2016, 2016.
World Health Organization: WHO global air quality guidelines: Particulate matter (PM2.5 and PM10), ozone, nitrogen dioxide, sulfur dioxide and carbon monoxide, PMID 34662007, World Health Organization, Geneva, 2021.
Yan, C., Tham, Y. J., Zha, Q., Wang, X., Xue, L., Dai, J., Wang, Z., and Wang, T.: Fast heterogeneous loss of N2O5 leads to significant nighttime NOx removal and nitrate aerosol formation at a coastal background environment of southern China, Sci. Total Environ., 677, 637–647, https://doi.org/10.1016/j.scitotenv.2019.04.389, 2019.
Yang, Y., Fan, S., Wang, L., Gao, Z., Zhang, Y., Zou, H., Miao, S., Li, Y., Huang, M., Yim, S. H. L., and Lolli, S.: Diurnal Evolution of the Wintertime Boundary Layer in Urban Beijing, China: Insights from Doppler Lidar and a 325-m Meteorological Tower, Remote Sens., 12, 3935, https://doi.org/10.3390/rs12233935, 2020.
Ye, C., Yuan, B., Lin, Y., Wang, Z., Hu, W., Li, T., Chen, W., Wu, C., Wang, C., Huang, S., Qi, J., Wang, B., Wang, C., Song, W., Wang, X., Zheng, E., Krechmer, J. E., Ye, P., Zhang, Z., Wang, X., Worsnop, D. R., and Shao, M.: Chemical characterization of oxygenated organic compounds in the gas phase and particle phase using iodide CIMS with FIGAERO in urban air, Atmos. Chem. Phys., 21, 8455–8478, https://doi.org/10.5194/acp-21-8455-2021, 2021.
Zhang, B., Shen, H., Yun, X., Zhong, Q., Henderson, B. H., Wang, X., Shi, L., Gunthe, S. S., Huey, L. G., Tao, S., Russell, A. G., and Liu, P.: Global Emissions of Hydrogen Chloride and Particulate Chloride from Continental Sources, Environ. Sci. Technol., 56, 3894–3904, https://doi.org/10.1021/acs.est.1c05634, 2022.
Zhang, Y., Vu, T. V., Sun, J., He, J., Shen, X., Lin, W., Zhang, X., Zhong, J., Gao, W., Wang, Y., Fu, T. M., Ma, Y., Li, W., and Shi, Z.: Significant Changes in Chemistry of Fine Particles in Wintertime Beijing from 2007 to 2017: Impact of Clean Air Actions, Environ. Sci. Technol., 54, 1344–1352, https://doi.org/10.1021/acs.est.9b04678, 2020.